Article

Predictive Models for Environmental Perception in Multi-Type Parks and Their Generalization Ability: Integrating Pre-Training and Reinforcement Learning

1
Faculty of Innovation and Design, City University of Macau, Macau 999078, China
2
Zhuhai Dechuang Construction Engineering Consulting Co., Ltd., Zhuhai 519000, China
3
Leeds University Business School, University of Leeds, Leeds LS2 9JT, UK
4
Land Development and Reclamation Center of Guangdong Province, Guangzhou 510635, China
5
School of Urban Architecture, Guangzhou Huali College, Guangzhou 511325, China
6
Institute of County Spatial Planning, Fuyang Normal University, Fuyang 236037, China
*
Authors to whom correspondence should be addressed.
Buildings 2025, 15(13), 2364; https://doi.org/10.3390/buildings15132364
Submission received: 12 June 2025 / Revised: 1 July 2025 / Accepted: 3 July 2025 / Published: 5 July 2025
(This article belongs to the Section Construction Management, and Computers & Digitization)

Abstract

Evaluating the environmental perception of urban parks is highly significant for optimizing urban planning. To address the limitations of traditional evaluation methods, a multimodal deep learning framework that integrates pre-training and reinforcement learning strategies for the comprehensive assessment of various park types (seaside, urban, mountain, and wetland) across three dimensions—accessibility, usability, and aesthetics—is proposed herein. By combining image data and user review texts, a unified architecture is constructed, including a text encoder, image visual encoder, and multimodal fusion module. During the pre-training phase, the model captured latent features in images and texts through a self-supervised learning strategy. In the subsequent training phase, a reinforcement learning strategy was introduced to optimize the sample selection and modal fusion paths to enhance the model’s generalization capability. To validate the cross-type prediction ability of the model, the experimental design uses data from three types of parks for training, with the remaining type as a test set. Results demonstrate that the proposed method outperforms LSTM and CNN architectures across accuracy, precision, recall, and F1 Score metrics. Compared with CNN, the proposed method improves accuracy by 5.1% and F1 Score by 6.6%. Further analysis shows that pre-training enhances the robust fusion of visual and textual features, while reinforcement learning optimizes the sample selection and feature fusion strategies during training.

1. Introduction

Parks serve as spaces for residents to engage in recreation and daily social interaction [1,2,3,4,5] and are an essential part of the urban environment. People’s perceptions and experiences of urban parks influence their well-being and satisfaction with these spaces [6,7]. How to effectively conduct perceptual evaluation of park environments has become a key topic in urban planning. Common dimensions in studies on park perception include accessibility, usability, and aesthetics [8,9,10,11]. This perception-based evaluation method directly reflects the user experience rather than relying solely on the technical evaluation of physical indicators. This method is important for optimizing park design and enhancing user satisfaction [12,13].
Despite growing recognition of the importance of the environmental perception evaluation of parks, traditional methods still largely rely on manual field observations, questionnaires, and interviews [14,15,16,17,18,19]. Although traditional methods can provide direct feedback, they are costly, inefficient, and susceptible to individual bias [20,21], making it challenging to capture the true perceptions of diverse users on a large scale. To address this problem, the rise of big data and artificial intelligence technology in recent years has resulted in the emergence of deep learning-based environmental perception evaluation methods. In current research on environmental perception evaluation, analysis is mainly conducted using unimodal data from text or images. Text modal-based research focuses on the semantic mining of unstructured text data such as social media posting and user comments [22,23,24,25,26]. In studies based on image data, researchers primarily extract and analyze computer vision features from images of the environmental scene [27,28,29]. However, unimodal data can analyze environmental perception only from a particular perspective, and it is difficult to utilize the synergistic advantages of multimodal data to complete an accurate description of the public’s complex perceptual experience.
Simultaneously, the diversity of urban parks complicates the evaluation of environmental perceptions. A city contains several types of parks, each differing significantly in functional positioning, user perception, and service approach. For example, mountain parks, with their rich vegetation and green spaces, are well suited for hiking [30,31]. Seaside parks emphasize scenic vistas and water-friendly interactions [32,33]. Urban parks, on the other hand, prioritize multifunctionality to serve the neighborhood [34,35]. Similarly, wetland parks can provide ecosystem services and offer environmental education functions [36,37]. Public perception varies across different types of parks, highlighting the need for deep learning-based urban park perception evaluation. This approach requires a generalized evaluation model that can capture the user perception characteristics across different types of parks and maintain accurate predictive capabilities on previously unseen park types.
Current research on the environmental perception evaluation of parks faces the following challenges: (1) most methods rely on single-modal data and fail to leverage the synergistic benefits of multimodal data; (2) the existing models lack the ability to model the differentiation of different types of parks; and (3) the models are weakly generalizable, making it difficult to predict users’ perceptual evaluations of previously unseen types of parks.
To fully address these challenges, an integrated solution incorporating multiple advanced technologies is required. Multimodal learning methods, which are a cutting-edge approach of the deep learning field, can synergistically leverage multiple sources and varying forms of modal data to provide researchers with more accurate analysis results [38,39,40,41]. In park environment perception research, multimodal deep learning remains in the exploratory stage. Some existing models perform well in various visual–verbal tasks. For example, ViLBERT extends the BERT architecture for joint visual–linguistic modeling, achieving cross-modal semantic alignment through a co-attention mechanism [42]. UNITER, on the other hand, learns universal image–text representation through large-scale image–text pre-training [43]. Furthermore, recent advancements in machine learning strategies have demonstrated the effectiveness of multivariable modeling methods. For example, Alrbai et al. employed multi-output support vector regression (M-SVR) techniques to capture the complex nonlinear relationships between multiple system parameters, achieving excellent prediction performance by integrating advanced optimization algorithms [44]. These advanced methods provide important scientific references for the application of multimodal technologies in environmental perception assessment.
Pre-training techniques, as a key component of deep learning, play a crucial role in tackling multimodal tasks [45]. For example, He et al. significantly improved the performance of a sentiment analysis task based on BERT by fusing multimodal information using a pre-training technique and fine-tuning it with a dual optimizer strategy [46]. In addition, the VL-Meta model utilizes pre-trained image encoders (e.g., CLIP’s ViT/B-32) and language encoders (e.g., GPT-2) to map visual features to linguistic feature space through a lightweight visual–language mapper and multimodal fusion mapper, which enables the fusion and understanding of multimodal data [47]. Pre-training techniques use self-supervised learning to capture the intrinsic laws of perceptual data. This approach is particularly suitable for handling the diversity and uncertainty of subjective expressions in environmental perception evaluation, providing a solution to the problem of limited labeling of perceptual data.
To further enhance the model’s adaptability and generalization performance in complex tasks, reinforcement learning and zero-shot learning are gradually introduced into the multimodal learning frameworks. In reinforcement learning, an agent interacts with the environment through trial and error to maximize cumulative rewards [48]. The DeepSeekMath project employed reinforcement learning to enhance the mathematical reasoning capabilities of the language model, while DeepSeek-R1 improved the reasoning process using the Group Relative Policy Optimization (GRPO) algorithm [49]. GRPO can compare its relative strengths through within-group responses and avoids relying on absolute reward values, thus improving the stability and efficiency of training [49]. The method is well suited for handling subjective perceptual differences in environmental perception evaluation and can dynamically adjust the weights of different types of park perception samples to enhance the model’s attention on key perceptual features. In addition, zero-shot learning provides an effective path to solve the problem of the insufficient generalization ability of current park environment perception models. In zero-shot learning, the classes of the training data (called “seen classes”) and the classes of the test data (called “unseen classes”) are different [50]. The model needs to classify instances of unseen categories without direct labeling. A comprehensive evaluation of zero-shot learning methods, highlighting their challenges and potential solutions, was presented by Xian et al. [51]. For studies on perception evaluation of parks, the zero-shot learning capability is especially critical because it allows the model to transfer knowledge learned from known types of parks to unseen types, addressing the dual challenges of data scarcity and type diversity.
In this study, a deep learning framework is developed that integrates multimodal data with advanced learning strategies, aiming at the automated and multidimensional environmental perception evaluation of urban parks. This framework integrates image data with user comment text, combining pre-training mechanisms and reinforcement learning to improve model performance and enhance generalization in complex tasks. The model adopts ViT and BERT architectures to extract visual and textual features, respectively, and effectively fuses visual and textual information through a cross-attention mechanism. This study organically combines three state-of-the-art techniques to address the specific challenges of the environmental perception evaluation of parks: (1) Pre-training phase: self-supervised learning is conducted through MLM and MIM, enabling the model to acquire strong representational capabilities and capture common features across different types of parks, even in the absence of large-scale labeled data. (2) Reinforcement learning optimization: A reinforcement learning approach based on GRPO is introduced to dynamically select high-quality samples and optimize the multimodal fusion process. GRPO leverages a relative reward mechanism to guide the model’s focus toward feature combinations that contribute the most to generalization, making it particularly well suited for addressing the variability among park types. (3) Zero-shot generalization validation: the experimental design adopts the leave-one-out strategy, using three types of park data for training, where the model is trained on data from three types of parks and tested on the unseen type, directly validating its cross-type generalization capability.
The main contributions of this study are as follows:
  • A multimodal deep learning framework for environmental perception is developed, integrating image and text data. By employing a cross-attention mechanism, information from various models is effectively integrated, overcoming the limitations of existing studies that rely on single-modal data.
  • Pre-training is combined with GRPO-based reinforcement learning to capture common perceptual features of parks through self-supervised learning, while enhancing the model’s ability to represent differentiated perceptions across park types via a dynamic sample-selection strategy.
  • A zero-shot learning-based environmental perception evaluation method is designed to verify the model’s generalization performance in perceptual prediction on unseen park types. This approach provides an effective solution to the cross-type generalization challenge in urban park environmental perception evaluation.
In summary, this research aims to construct a multimodal deep learning framework integrating pre-training and reinforcement learning strategies to achieve accurate environmental perception prediction for multi-type urban parks and provide efficient, objective, and scalable park environmental perception evaluation solutions for urban planning through enhancing the model’s cross-type generalization capability.

2. Materials and Methods

2.1. Prediction Method for Comprehensive Evaluation of Multi-Types Based on Pre-Training and Reinforcement Learning

In modern urban environments, parks, as important green spaces, not only improve the ecological environment of the city but also provide residents with diverse spaces for leisure and socialization. To achieve a comprehensive assessment of park quality, this study proposes a deep learning model that fuses multimodal data. The model takes image information and user comment text as inputs for a variety of park types, including seaside, urban, mountain, and wetland, and scores them comprehensively on three key dimensions—accessibility, functionality, and aesthetics—to construct a novel data-driven park evaluation method. The model’s output provides a scientific basis for urban planners, helping them identify strengths and weaknesses of parks, such as optimizing traffic layouts or enhancing landscape design, to support informed decision making. Simultaneously, such evaluation information can also assist the public in choosing suitable public leisure spaces according to their needs.
Figure 1 presents the complete architecture and training pipeline of the proposed multi-type park environmental perception prediction model. The entire framework consists of three main components: the upper section shows the multimodal deep learning model architecture, while the lower sections illustrate the pre-training stage (Step 1: Pre-training) and reinforcement learning stage (Step 2: Reinforcement Learning), respectively. In the model architecture, textual inputs undergo feature extraction through a text encoder, image inputs are processed through a Vision Transformer (ViT), and features from both modalities are fused via a cross-attention mechanism, ultimately outputting prediction results across three dimensions: accessibility, usability, and aesthetics. Each dimension takes one of three discrete values: 0, 1, or 2.
The input text example illustrated in the figure represents authentic user reviews of parks, containing multi-dimensional descriptive information regarding the transportation accessibility, facility usability, and environmental aesthetics of the park. The input image example shows a park landscape photograph captured by users at sunset, which is associated with the corresponding textual review content. Specifically, the text feature extractor conducts in-depth analysis of users’ semantic feedback, such as identifying descriptions of “sunset” or “recreational facilities,” to extract effective information related to park experiences. The visual encoding component is designed to understand overall scene styles (e.g., natural ambiance or modern design). Through the cross-attention mechanism, the model achieves precise matching between keywords in textual descriptions and corresponding regions in images, for instance, associating the comment “beautiful lakeside scenery” with the lake area in the image, thereby enhancing overall prediction accuracy and generalization capability.
Given the diversity of park types and significant environmental variations, the model’s generalization ability when facing unknown types or new scenarios is crucial. To address this challenge, masked language modeling (MLM) and masked image modeling (MIM) strategies are introduced in the pre-training stage. As illustrated in the figure, these strategies mask portions of text and image regions to predict the masked text tokens and reconstruct masked image areas, respectively, thereby enhancing the model’s understanding of contextual semantics and visual structures. Additionally, the training process incorporates a reinforcement learning method based on Group Relative Policy Optimization (GRPO), which dynamically selects high-quality samples and optimizes the multimodal information fusion process through comparisons between reference models and reward models. This method guides policy updates through intra-group reward distribution characteristics, avoiding dependence on absolute numerical deviations and improving decision quality and training stability under complex tasks. To systematically validate the model’s adaptability across different park types, zero-shot learning experiments are designed to test performance on unseen types.
This study introduces Expert Assessment Vectors as a key source of supervisory information during the training process. These vectors are derived from subjective evaluations provided by three domain experts in urban planning, who independently rated each image–text sample across three dimensions: accessibility, usability, and aesthetics. After quantification, the scores were structured into three-dimensional label vectors. During training, the model leverages these expert assessment vectors not only as supervisory signals to guide the learning of prediction targets, but also, under specific experimental settings, as auxiliary inputs by concatenating them with original multimodal features. This integration of human knowledge effectively enhances the model’s ability to comprehend complex semantics and improves its learning stability and generalization performance, particularly in scenarios involving limited data, ambiguous samples, or redundant feature dimensions.
The Transformer model differs from traditional Recurrent Neural Networks (RNNs) and Convolutional Neural Networks (CNNs). It uses the self-attention mechanism to process sequential information, thereby enhancing its ability to model long-range dependencies and support parallel processing [52]. The self-attentive mechanism processes each input position, associating it with all other positions in the sequence. The input sequence is mapped into three sets of vectors for query, key, and value, respectively. By calculating the dot product of the query and key, then scaling and normalizing it, applying the Softmax function to obtain the attention distribution, and subsequently weighting and summing the value vectors, a new representation is formed:
A t t e n t i o n Q , K , V = S o f t m a x Q K T d k V
where Q, K, and V represent the query, key, and value matrices, respectively, and d k denotes the dimension of the key vector.
In Equation (1), T denotes the matrix transposition operation, and K T represents the transposed key vector K . Q ,     K , and V represent the query, key, and value vectors, respectively. Their dimensions are d k and d v , where d k is the dimension of the query and key vectors, and d v is the dimension of the value vector. The denominator d k in the equation is a scaling factor introduced to prevent excessively large values when computing the dot product between queries and keys, thereby stabilizing the output of the Softmax function.
To capture diverse feature information in different semantic subspaces in parallel, Transformer introduces the Multi-Head Attention mechanism. It achieves this by linearly transforming the input into multiple attention head inputs, computing each attention head independently, then concatenating the results and applying another linear transformation to obtain
H e a d i = A t t e n t i o n Q W i Q , K W i K , V W i V
where W i Q , W i K , and W i V represent the projection matrices of the query, key, and value of the ith attention header, respectively.
The feedforward neural network (FFN) in each transformer consists of two linear transformation layers and uses the ReLU activation function. This module is applied to the representation at each position separately, further strengthening its nonlinear modeling capability. Residual connection and layer normalization are added after each sublayer, serving, respectively, to enable direct information flow and normalize the output. Positional encoding is added to the input to supplement positional information.
The image encoder uses Vision Transformer (ViT), based on the Transformer architecture. ViT can efficiently process global relationships in images and has strong feature representation capabilities [53]. To accommodate cross-modal tasks, the last layer in ViT used to aggregate global semantic information (i.e., the [CLS] markup for contrast learning) is removed. In location embedding, visual tokens encapsulate the location information before inputting into the ViT. Consequently, all visual tokens share a single location ID, preventing the lengthy encoding problem associated with the traditional location-encoding method. Each attention head in a language model captures different aspects of semantic information, while the image encoder extracts feature representation from images and converts them into vector representations adapted to the text domain through a specific mechanism. This fusion of image–language features improves the model’s ability to understand and reason about cross-modal semantics.
As shown in Figure 2, to enhance the information interaction between image and text modalities, the system introduces the cross-attention module. The core idea of the module is to use text modalities as queries (Q) and image modalities as keys (K) and values (V) to achieve cross-modal alignment and fusion of information. The calculation process can be expressed as follows:
C r o s s A t t e n t i o n ( Q = T , K = V , V = V
With this cross-attention module, the model enables the text modality to focus on the most relevant regions in the image, achieving deeper semantic fusion between text and image and thereby improving performance on multimodal tasks.
Figure 2 illustrates the architecture of the multimodal deep learning model, which primarily consists of the processing pipelines for text and image features. In the figure, the bottom input section represents the stage where text and image features, after multimodal fusion, are fed into the final prediction module. This module generates prediction outputs for three dimensions—accessibility, usability, and aesthetics—based on the fused input features. The prediction result for each dimension is a categorical label with a value of “0”, “1”, or “2”, corresponding to negative evaluation, positive evaluation, and irrelevant, respectively. In the model implementation, the multimodal interaction component is built upon the Transformer architecture, where the Q-K-V mechanism is employed for feature fusion: text features serve as the query, while image features serve as the key and value. Through the multi-head attention mechanism, cross-modal alignment and information exchange are effectively achieved.

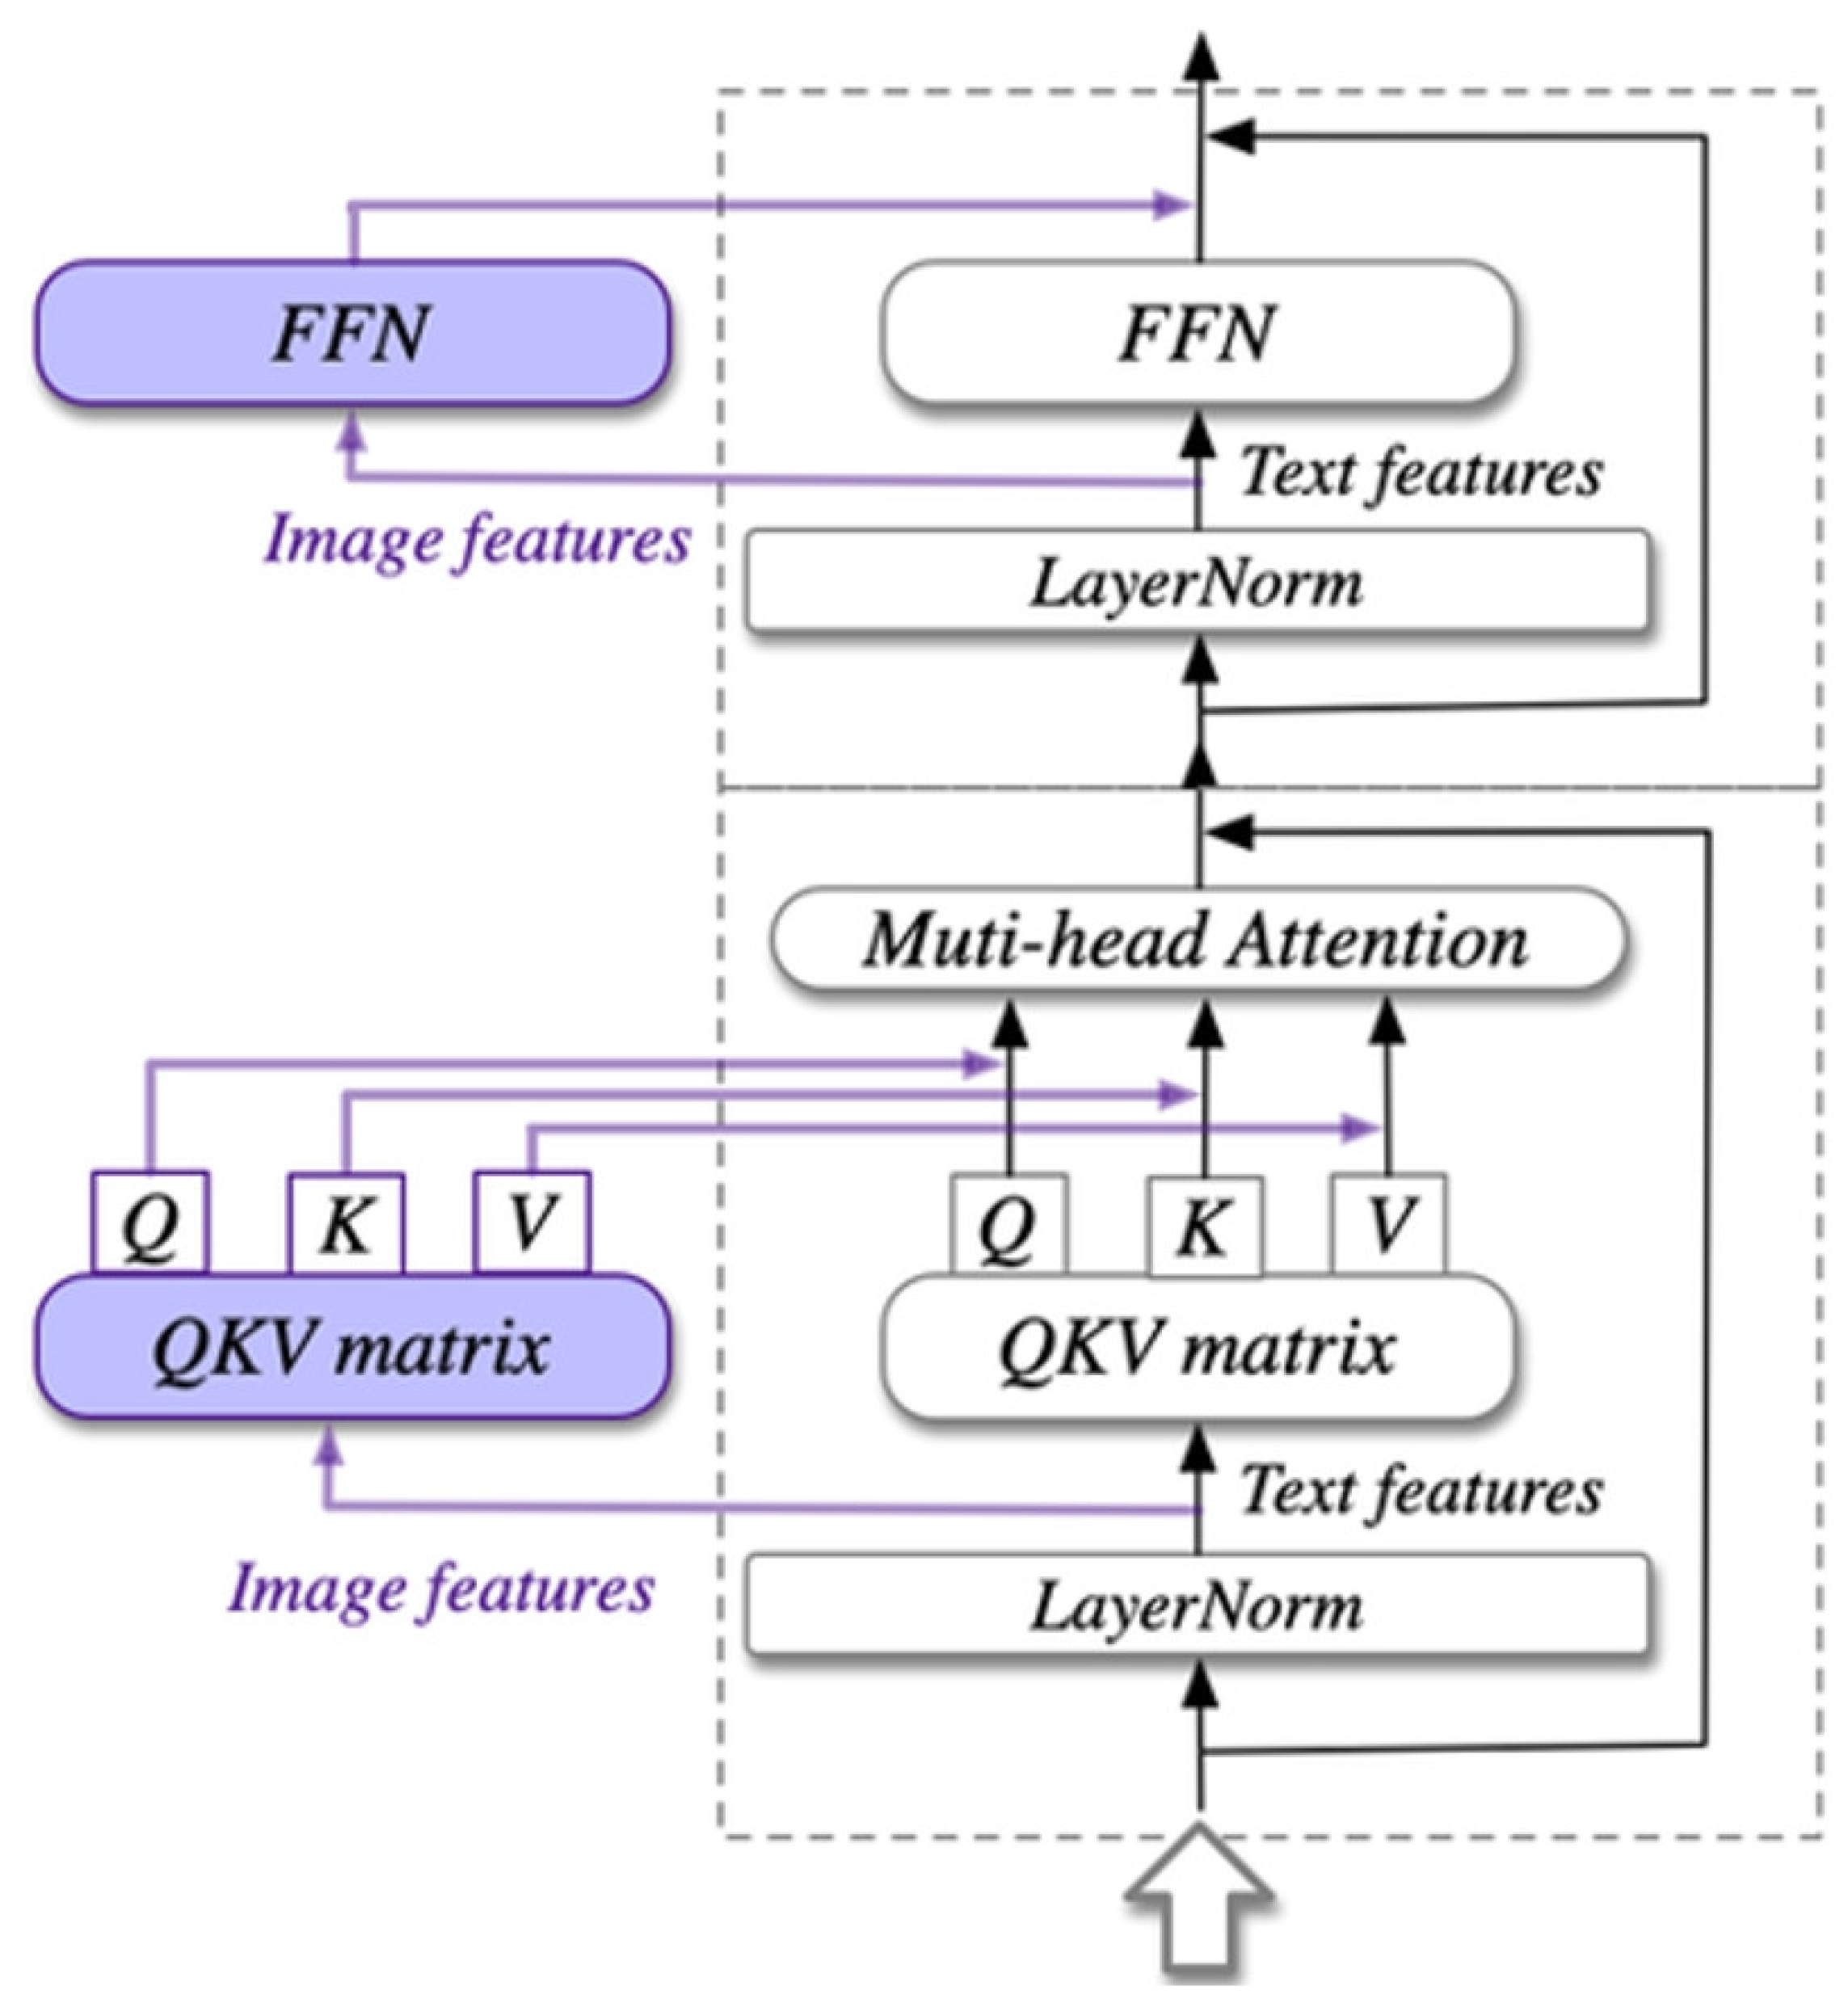
2.2. Multimodal Pre-Training Modeling

MLM is a typical self-supervised learning method widely used in natural language processing, especially in pre-trained language models. Its core principle is to achieve deep understanding of contextual semantics by language models by predicting randomly masked text tokens without the need of manual annotation [54].
Given a sequence of inputs,
x = x 1 , x 2 , , x n
In this sequence, the model randomly selects a subset M { 1 , , n } of corresponding tokens to be masked. For each selected token, 80% probability replaces it with a special token [MASK], which enhances the ability of the model to learn context-based prediction; 10% of the tokens are replaced with random tokens to prevent the model from over-relying on the semantics of the [MASK] token; another 10% are kept unchanged to enhance robustness. The training objective is to minimize the following cross-entropy loss:
L M L M = i M   l o g   P x i x i ; θ
Here, x i denotes the input sequence after removing the ith position token; θ denotes the model parameter; P x i x i ; θ denotes the probability distribution.
MIM is a self-supervised learning framework in vision that learns generic image representations by masking parts of an image and reconstructing the content of those regions [55]. Given an image I R H × W × C , divide it into fixed-size patch blocks, randomly select a subset M 1 , , N for masking, and keep only the remaining patches to pass to the encoder for modeling.
In the multimodal architecture, the text encoder and image encoder collaborate through cross-attention for joint learning. Instead of predicting tokens in isolation, MLM incorporates image features as auxiliary input.

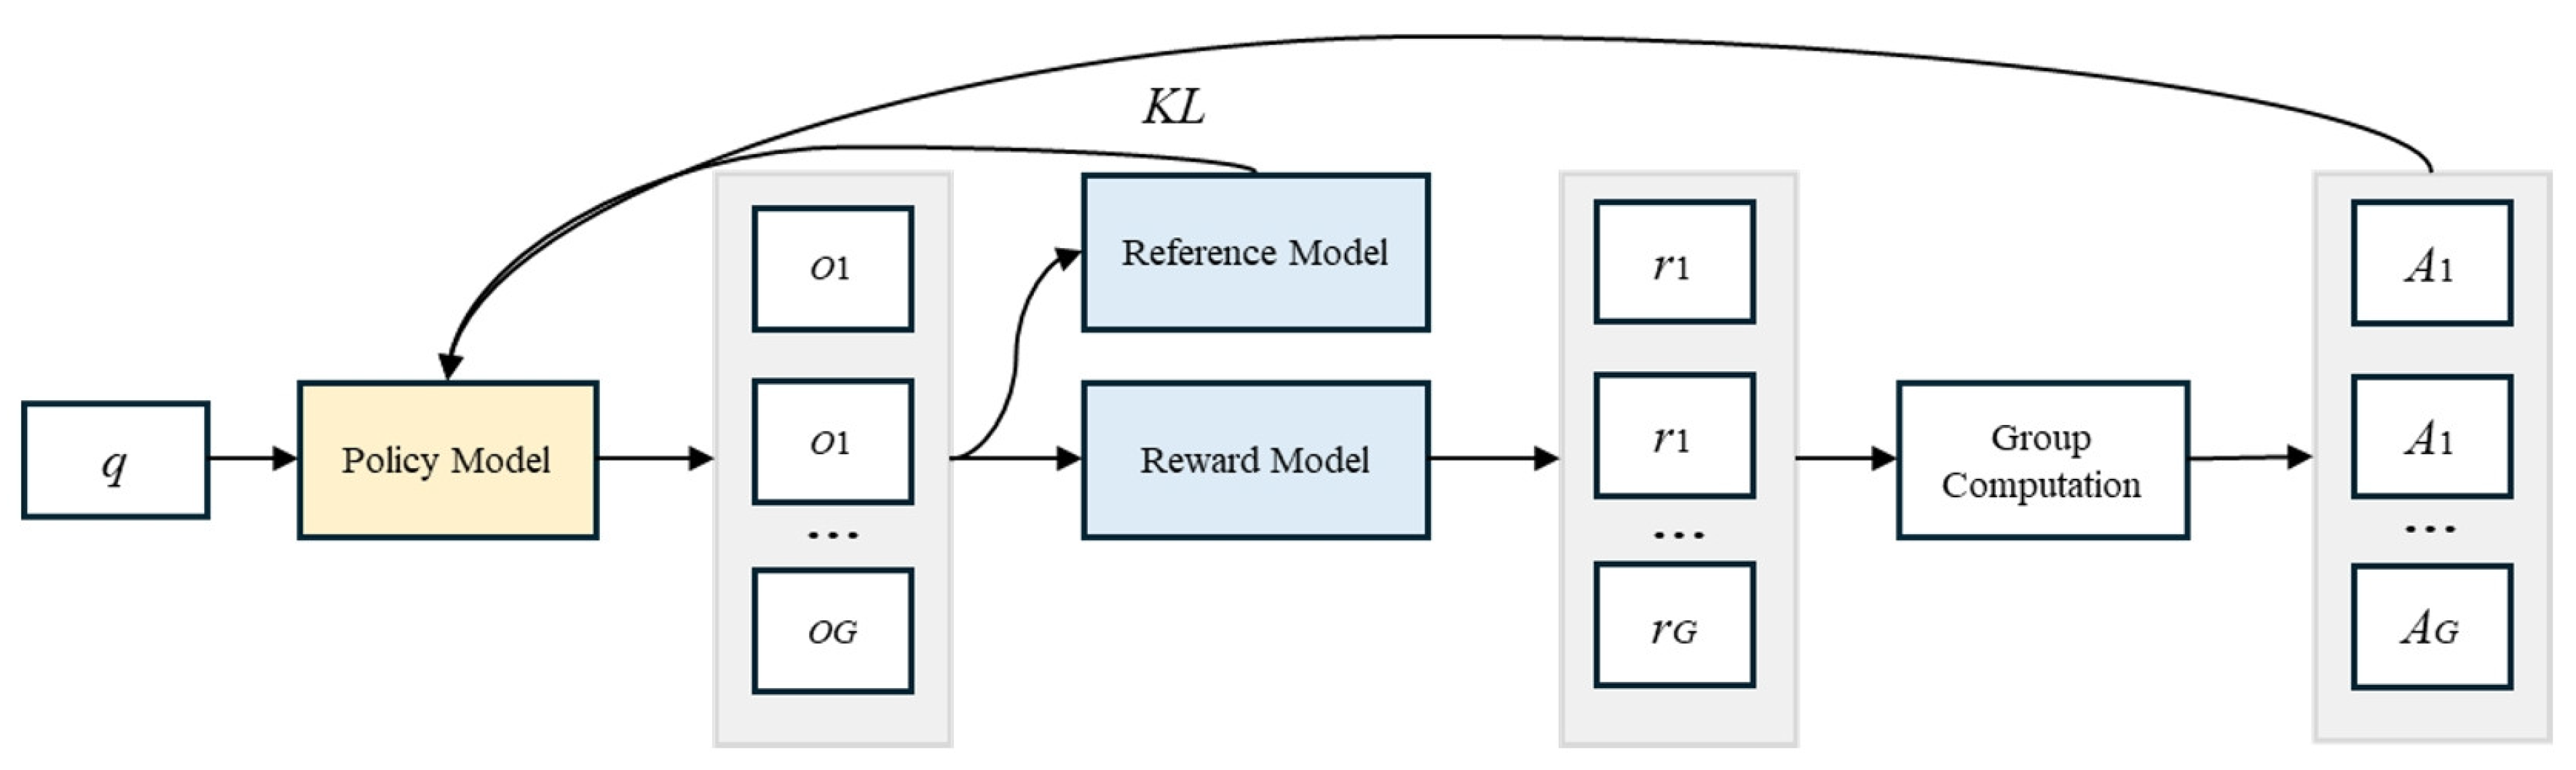
2.3. GRPO-Based Reinforcement Learning Approach

Reinforcement learning (RL) learns strategies to maximize long-term cumulative rewards through the interaction of an intelligent body with its environment [48]. RL is widely used in multimodal learning and the optimization of large-scale language models (LLMs) for dynamic decision-making tasks such as sample selection, inference enhancement, and policy optimization for complex tasks [56]. The RL model consists of states, actions, strategies, rewards, and state transfer functions aiming to maximize cumulative discount returns.
Policy gradient-based algorithms (e.g., PPO, DPO) have made significant progress in the field of RL. However, their reliance on the value network (Critic) for advantage estimation poses challenges, such as high computational cost and poor training stability, especially when handling high-dimensional action spaces or complex tasks.
As shown in Figure 3, GRPO achieves efficient RL without the need for a value network by employing group-wise comparison and policy gradient optimization. GRPO exploits the distributional properties of within-group rewards to directly guide strategy updates in a more optimal direction, demonstrating significant advantages in mathematical reasoning, multimodal tasks, and dialog systems. For the input problem q, the model generates G candidate outputs o 1 , o 2 , , o G and computes a reward for each output r i , which is standardized to eliminate absolute numerical bias to obtain within-group relative advantage A ^ i , t :
A ^ i , t = r i μ r σ r + ϵ
μ r = 1 G i = 1 G   r i
σ r = 1 G i = 1 G   r i μ r 2
Here, ϵ is a very small constant to prevent a divide-by-zero operation.
GRPO enables the model to focus on the relative advantages and disadvantages of the output within the group rather than relying on absolute reward values, thus improving the robustness of the strategy optimization and guiding the strategy to converge toward higher-quality decisions.

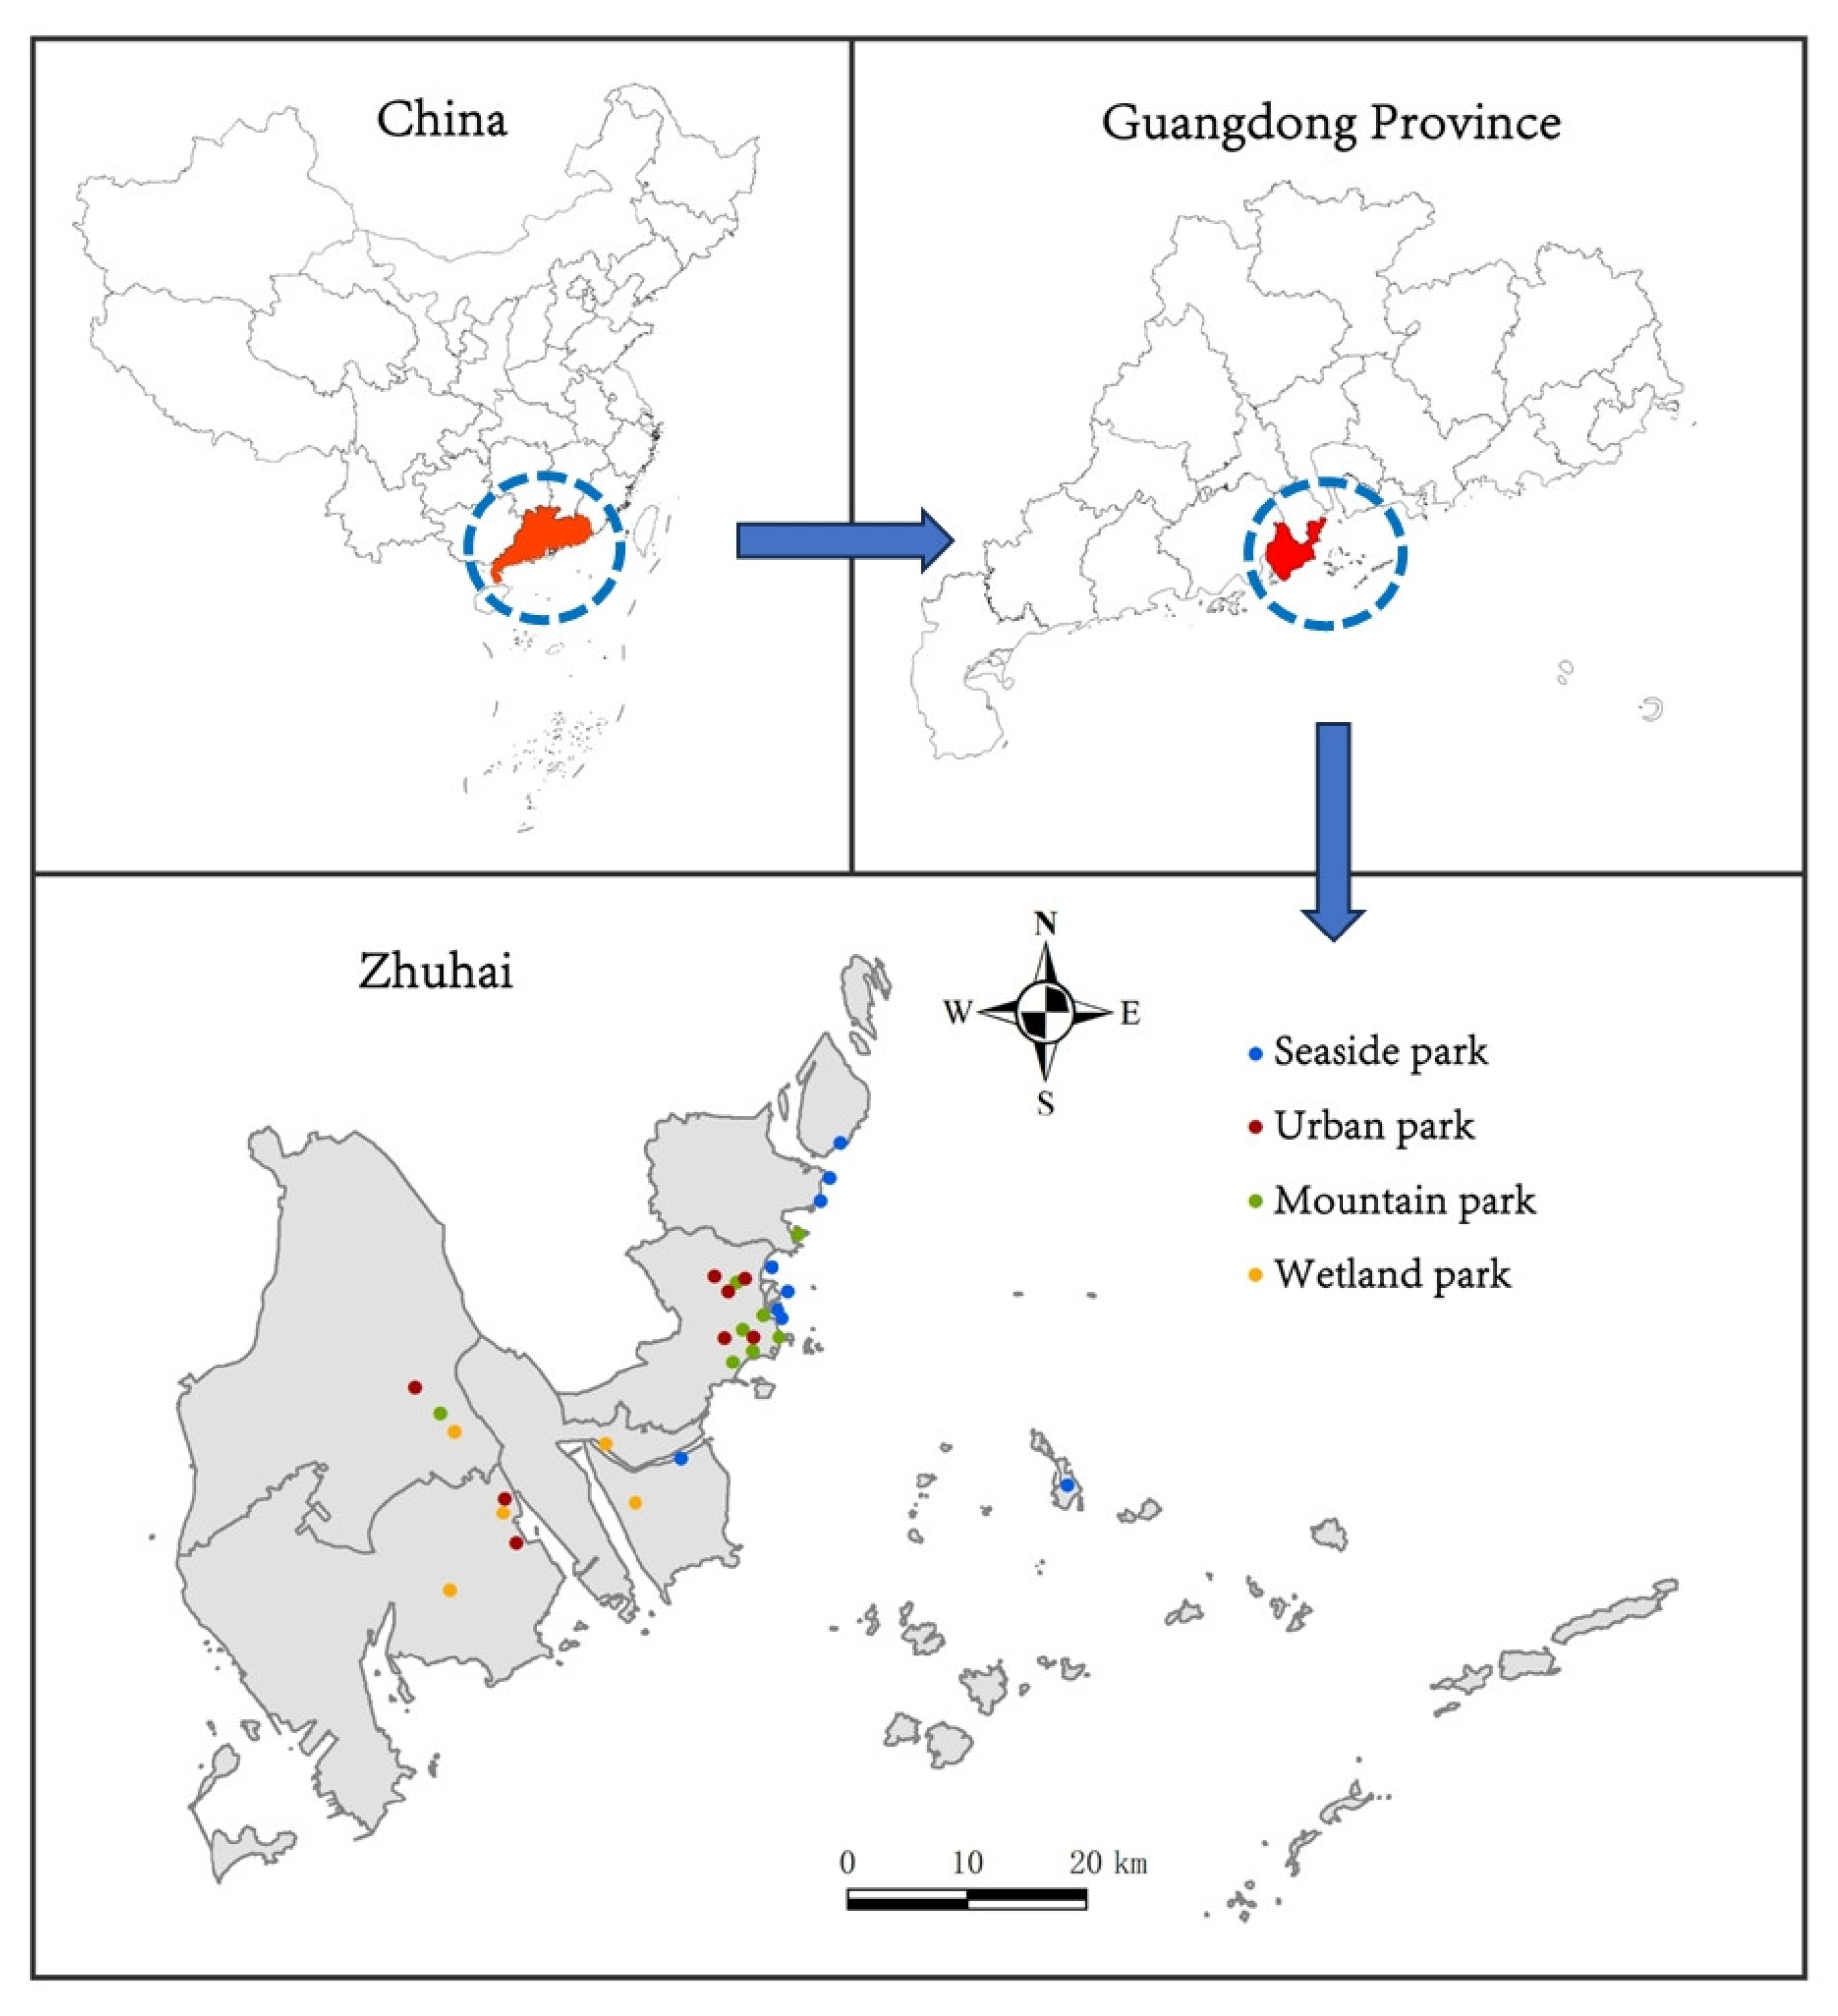
2.4. Park Data Collection and Evaluation Metrics

Zhuhai is known for its beautiful living environment and rich natural resources. The city has a land area of 17,250.07 km2 with a resident population of 2,494,100 at the end of 2024 (Source: Zhuhai 2024 Statistical Yearbook). The city has launched the “Beautiful Zhuhai” series of actions since 2017, with the core theme of “City of Parks.” At present, Zhuhai has built more than 800 parks of various types. According to the published Zhuhai Green Space System Special Plan, Zhuhai will achieve the goal of City of Beautiful Parks by 2035. These planning and construction measures have made Zhuhai a model for research related to urban parks.
The park perception analysis data for this study was obtained from the graphic ratings of Zhuhai city parks by users of the popular review website https://www.dianping.com/ (accessed on 18 February 2025). Users can freely share their textual reviews and relevant images of urban parks on this social platform, which has also been recognized by numerous scholars in previous park studies [24,26]. The researchers used Python 3.10 to collect image and text reviews on Zhuhai parks from https://www.dianping.com/ (accessed on 18 February 2025), and for this study, only parks with more than 30 text-based reviews on the platform were selected. A total of 31 Zhuhai parks met the requirements. The locations of these parks are shown in Figure 4. The reviews were collected up to 31 January 2025.
After systematic screening and preprocessing, a multimodal dataset containing park user reviews and corresponding images was developed. Based on significant differences in geographical environment, spatial layout, and functional orientation, parks in Zhuhai can be broadly categorized into four types: seaside, urban, mountain, and wetland parks. These four categories serve as the research objects in this study, fully representing the diversity of urban green space types. In total, over 24,000 multimodal samples were used for subsequent modeling and experimental analysis. Each sample consists of a user’s textual evaluation of the park and its associated images. The sample size for each type of park is shown in Table 1.
The data covers both textual and image information, and the samples were evaluated in terms of accessibility (ease of transportation), usability (facility functionality and comfort), and aesthetics (landscape aesthetics and artistic features) based on the actual use of the parks. To ensure the objectivity and reliability of annotation results, three urban planning experts were invited to label each image–text-associated comment across three dimensions: accessibility, usability, and aesthetics. The scoring for each comment was based on the experts’ comprehensive evaluation of both the park images and their corresponding descriptive content. The specific process was as follows: Experts compared the specific content of comments with the actual conditions of the parks and assigned scores for each sample across the three dimensions of accessibility, usability, and aesthetics. The scoring criteria were defined as follows: “0” indicates poor performance of the review in the given dimension (e.g., inconvenient transportation or poor scenery), “1” indicates good performance of the review in the given dimension (e.g., convenient transportation or beautiful scenery), and “2” indicates that the review does not involve the given dimension. For example, a comment associated with a particular image mentions that although the park has a good view, it is inconvenient to access, without mentioning the park’s functionality or facilities. In this case, an expert might label the “aesthetics” dimension as “1,” the “accessibility” dimension as “0,” and the “usability” dimension as “2.” To ensure objectivity and consistency of the annotation results, a majority voting mechanism was employed to determine the final labels, thereby reducing individual judgment bias and enhancing the scientific rigor of the data quality.
Figure 5 presents representative samples from different park types, incorporating images with their associated textual comment summaries along with expert scoring evaluations of these samples. These samples demonstrate the variations in landscape characteristics and spatial configurations across the park categories, thereby enriching the model’s training dataset and enhancing its generalization capability for cross-type classification tasks. Expert assessments were conducted on park images and their corresponding textual comments across three dimensions: accessibility, usability, and aesthetics.
The evaluation system employs four key metrics to measure the fit between the model predictions and the actual values, namely accuracy, precision, recall, and F1 Score. Accuracy represents the proportion of correctly predicted cases, precision measures the proportion of samples classified as positive that belong to that category, and recall measures the rate at which positively categorized samples in the original data are successfully identified by the model. The F1 Score represents a comprehensive evaluation criterion that balances precision and recall, providing a harmonic average between the two. The specific formulas for the calculation of these metrics are as follows:
Accuracy   = T P + T N T P + T N + F P + F N
Precision   = T P T P + T N
Recall   = T P T P + F N
F 1 = 2 ×   Precision   ×   Recall     Precision   +   Recall  
Here, True Positive (TP) represents the number of samples that are in the positive category and correctly predicted as positive by the model. True Negative (TN) represents the number of samples that are in the negative category and accurately identified as negative. False Positive (FP) refers to the case where the category is negative but incorrectly predicted by the model as positive. False Negative (FN) represents the number of samples that are positive classes but are incorrectly predicted as negative by the model.

3. Results

3.1. Comparison of Model Prediction Results

As shown in Figure 6, the predicted confusion matrix of the model in the dimensions of accessibility, usability, and aesthetics is demonstrated. The accuracy and recall are generally higher on category 1, and there is a difference between category 0 and category 2, where categories 0 and 2 have more misclassifications in prediction, resulting in low precision and recall. Despite the category imbalance, high overall accuracy is maintained in all three dimensions by the proposed method, demonstrating its robustness.
To verify the validity of the model, the proposed model is compared with the deep learning models previously used in urban environmental perception studies. CNNs, widely applied in computer vision, were used to assess spatial and landscape preferences in urban parks [57]. Meanwhile, LSTM excels in natural language processing and was used to evaluate urban parks satisfaction [58]. Table 2 demonstrates the comparison of the average values of the metrics for different methods on the dimensions of accessibility, usability, and aesthetics. The results show that our method outperforms traditional LSTM and CNN architectures in all four metrics. Compared with CNN, accuracy improves by approximately 5.1% and F1 improves by approximately 6.6%, indicating that the improvements not only increase accuracy but also better balance precision and recall. Precision and recall have similar mean values of 0.82 and 0.84, respectively, indicating that the model is not overfitted and the predictions are balanced.

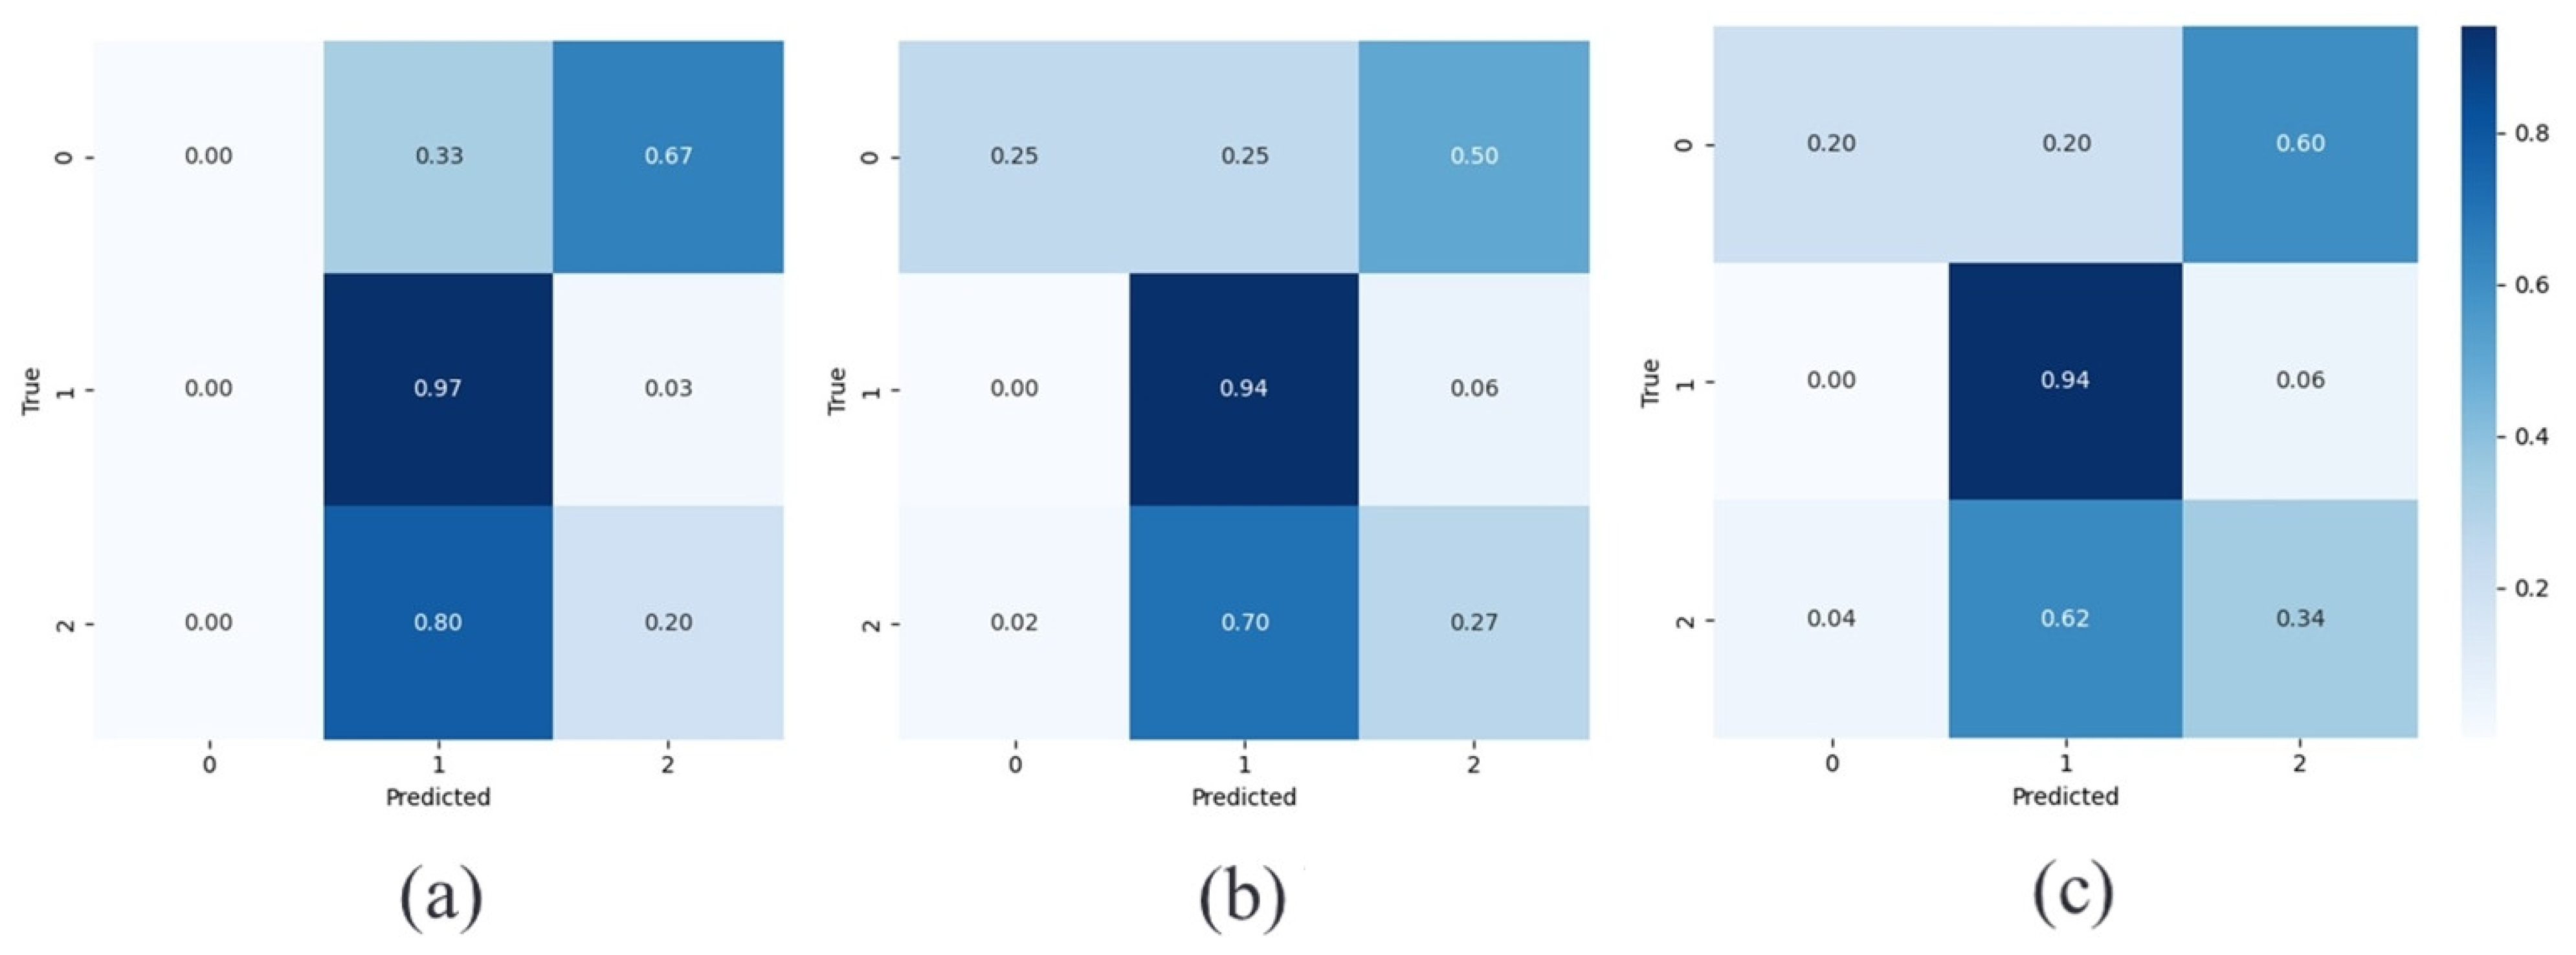
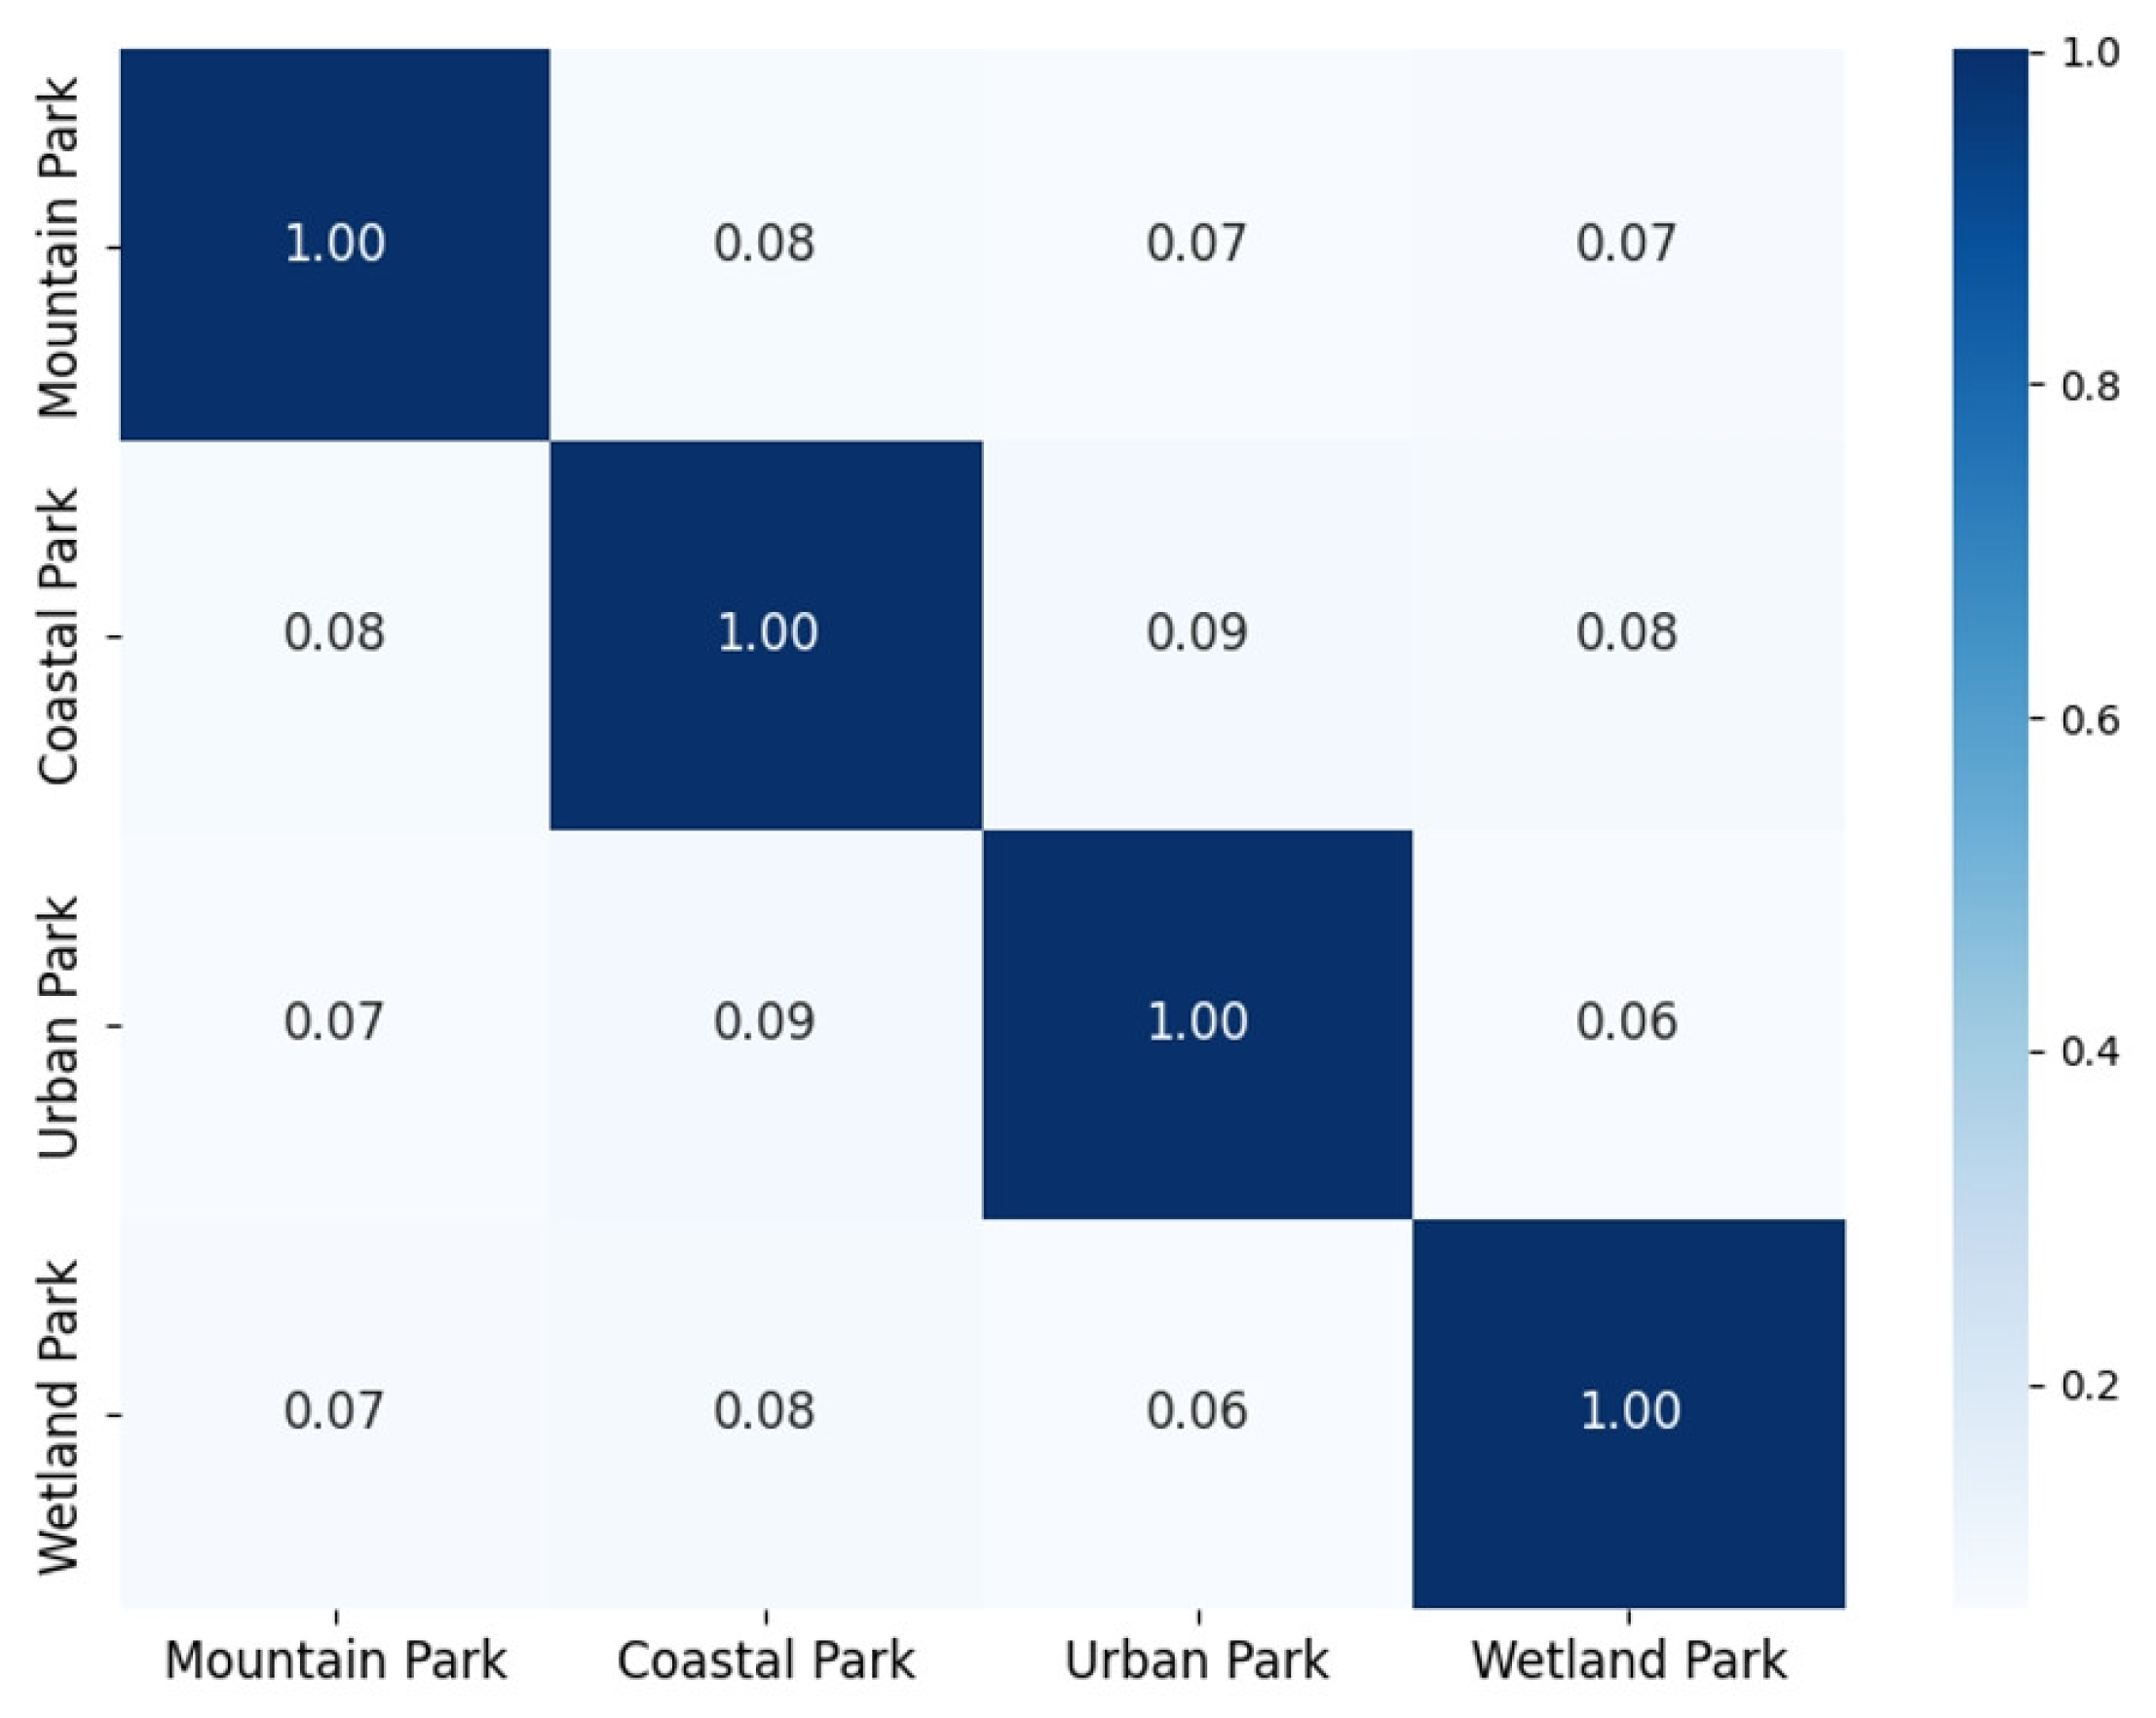
3.2. Experimental Analysis of Generalizability in Different Park Types

Figure 7 shows the heat map matrix of similarity between the various types of parks. To explore the variability among park types at the level of textual features, the Term Frequency–Inverse Document Frequency (TF-IDF) method was used to compute the word frequency distribution of each park sample. Based on this, the similarity matrix between various types of parks can be constructed, and the results can be visualized in the form of heat maps. The similarity between different types of parks is generally low, with all similarity values not exceeding 0.1. This reflects the significant variability in text representation across park type. Among them, the highest similarity happens between seaside parks and urban parks, which is 0.09, indicating that these two types of parks may have some degree of overlap in some descriptive features or semantic expressions. The lowest similarity occurs between urban parks and wetland parks, which is 0.06. This indicates a clear distinction between these two types of parks in terms of text semantics. Thus, the semantic features of different types of parks are highly heterogeneous. This not only increases the difficulty of achieving accurate classification and prediction based on textual features but also imposes greater demands on the model’s ability to generalize across categories.
As shown in Table 3, Table 4 and Table 5, the predictions of the different methods are compared in the three dimensions of the metrics, where A, B, C, and D represent mountain parks, wetland parks, urban parks, and seaside parks, respectively. The generalization ability of “unseen semantic types” is simulated by eliminating a certain type of park from the training set and examining the model’s prediction performance on that type. Cross-sectional comparison of the four combinations (i.e., the four types of parks serving as the test set sequentially) further validates this phenomenon: there is a strong correlation between generalization performance and semantic similarity. For example, wetland parks perform the worst when used as a test set (A, C, D → B), which corresponds to their generally low similarity to other types (e.g., only 0.06 with urban parks), suggesting that the further away the semantics, the weaker the generalization. In contrast, urban parks maintain a high level of model generalization performance due to moderate similarity to multiple categories of parks. Models often rely on high-frequency semantic features of major park categories for learning and migration, but their ability to represent information from marginal classes degrades sharply when encountering unseen or semantically distinct park categories.

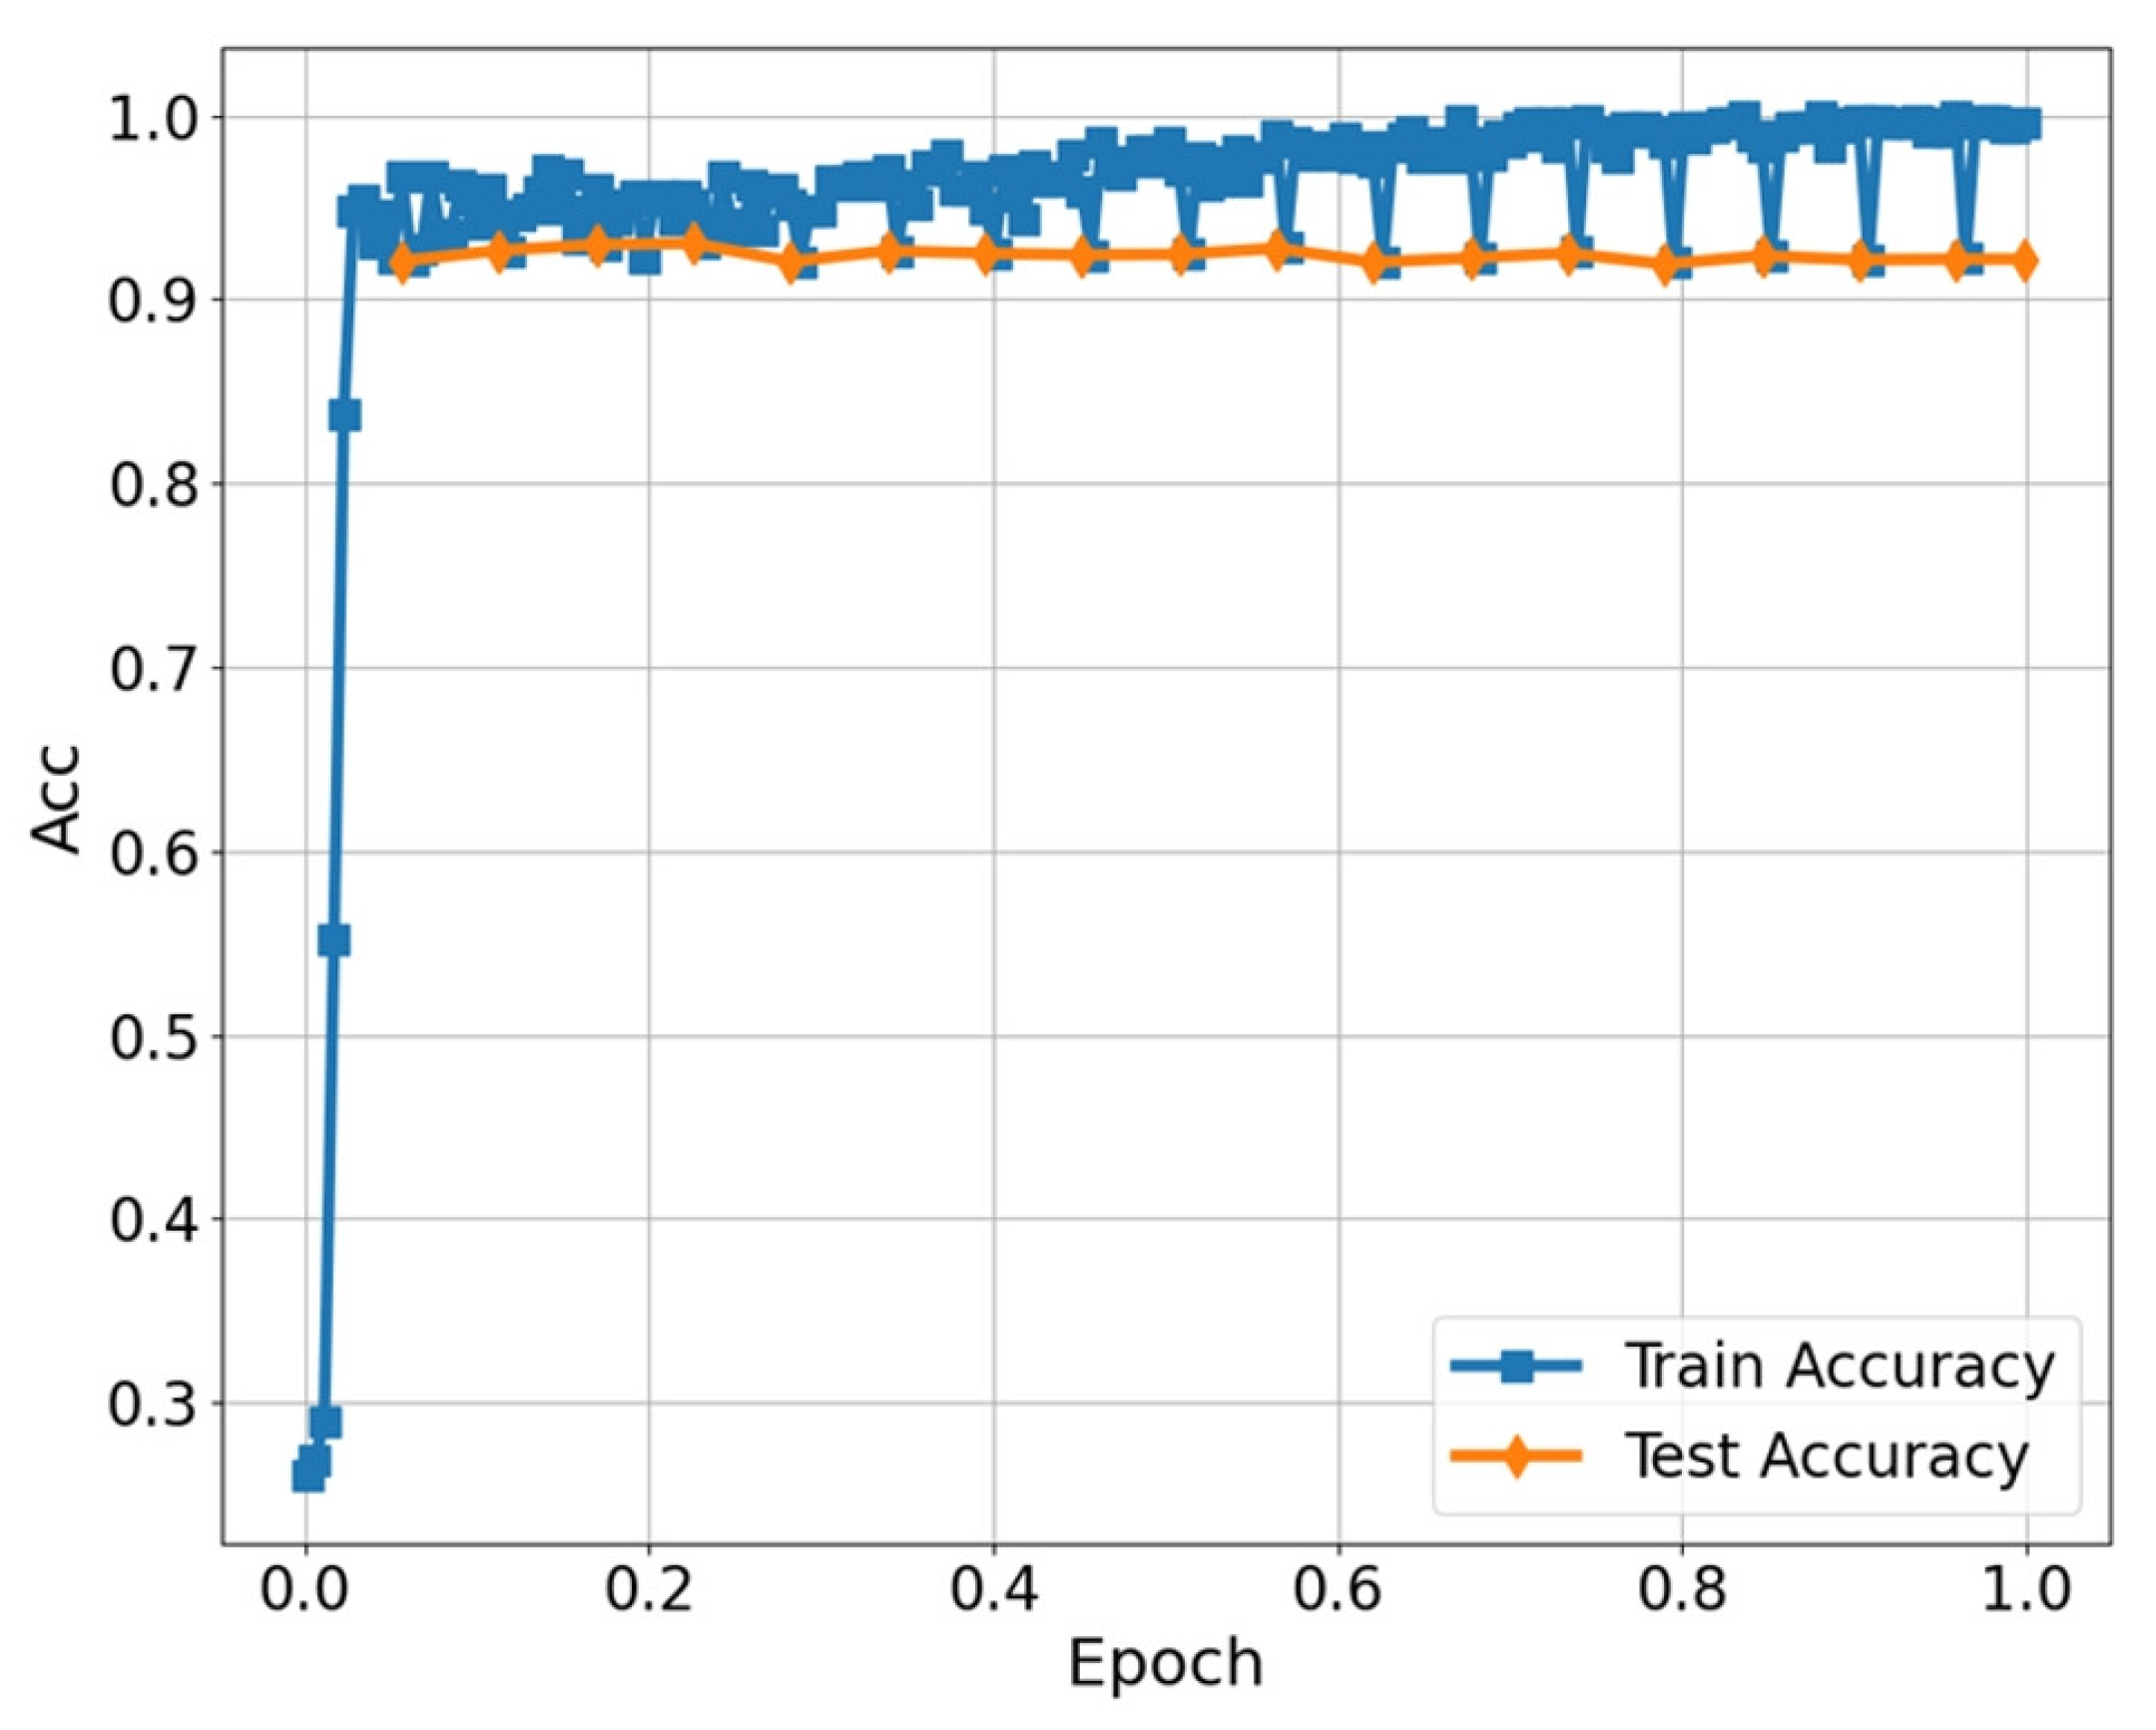
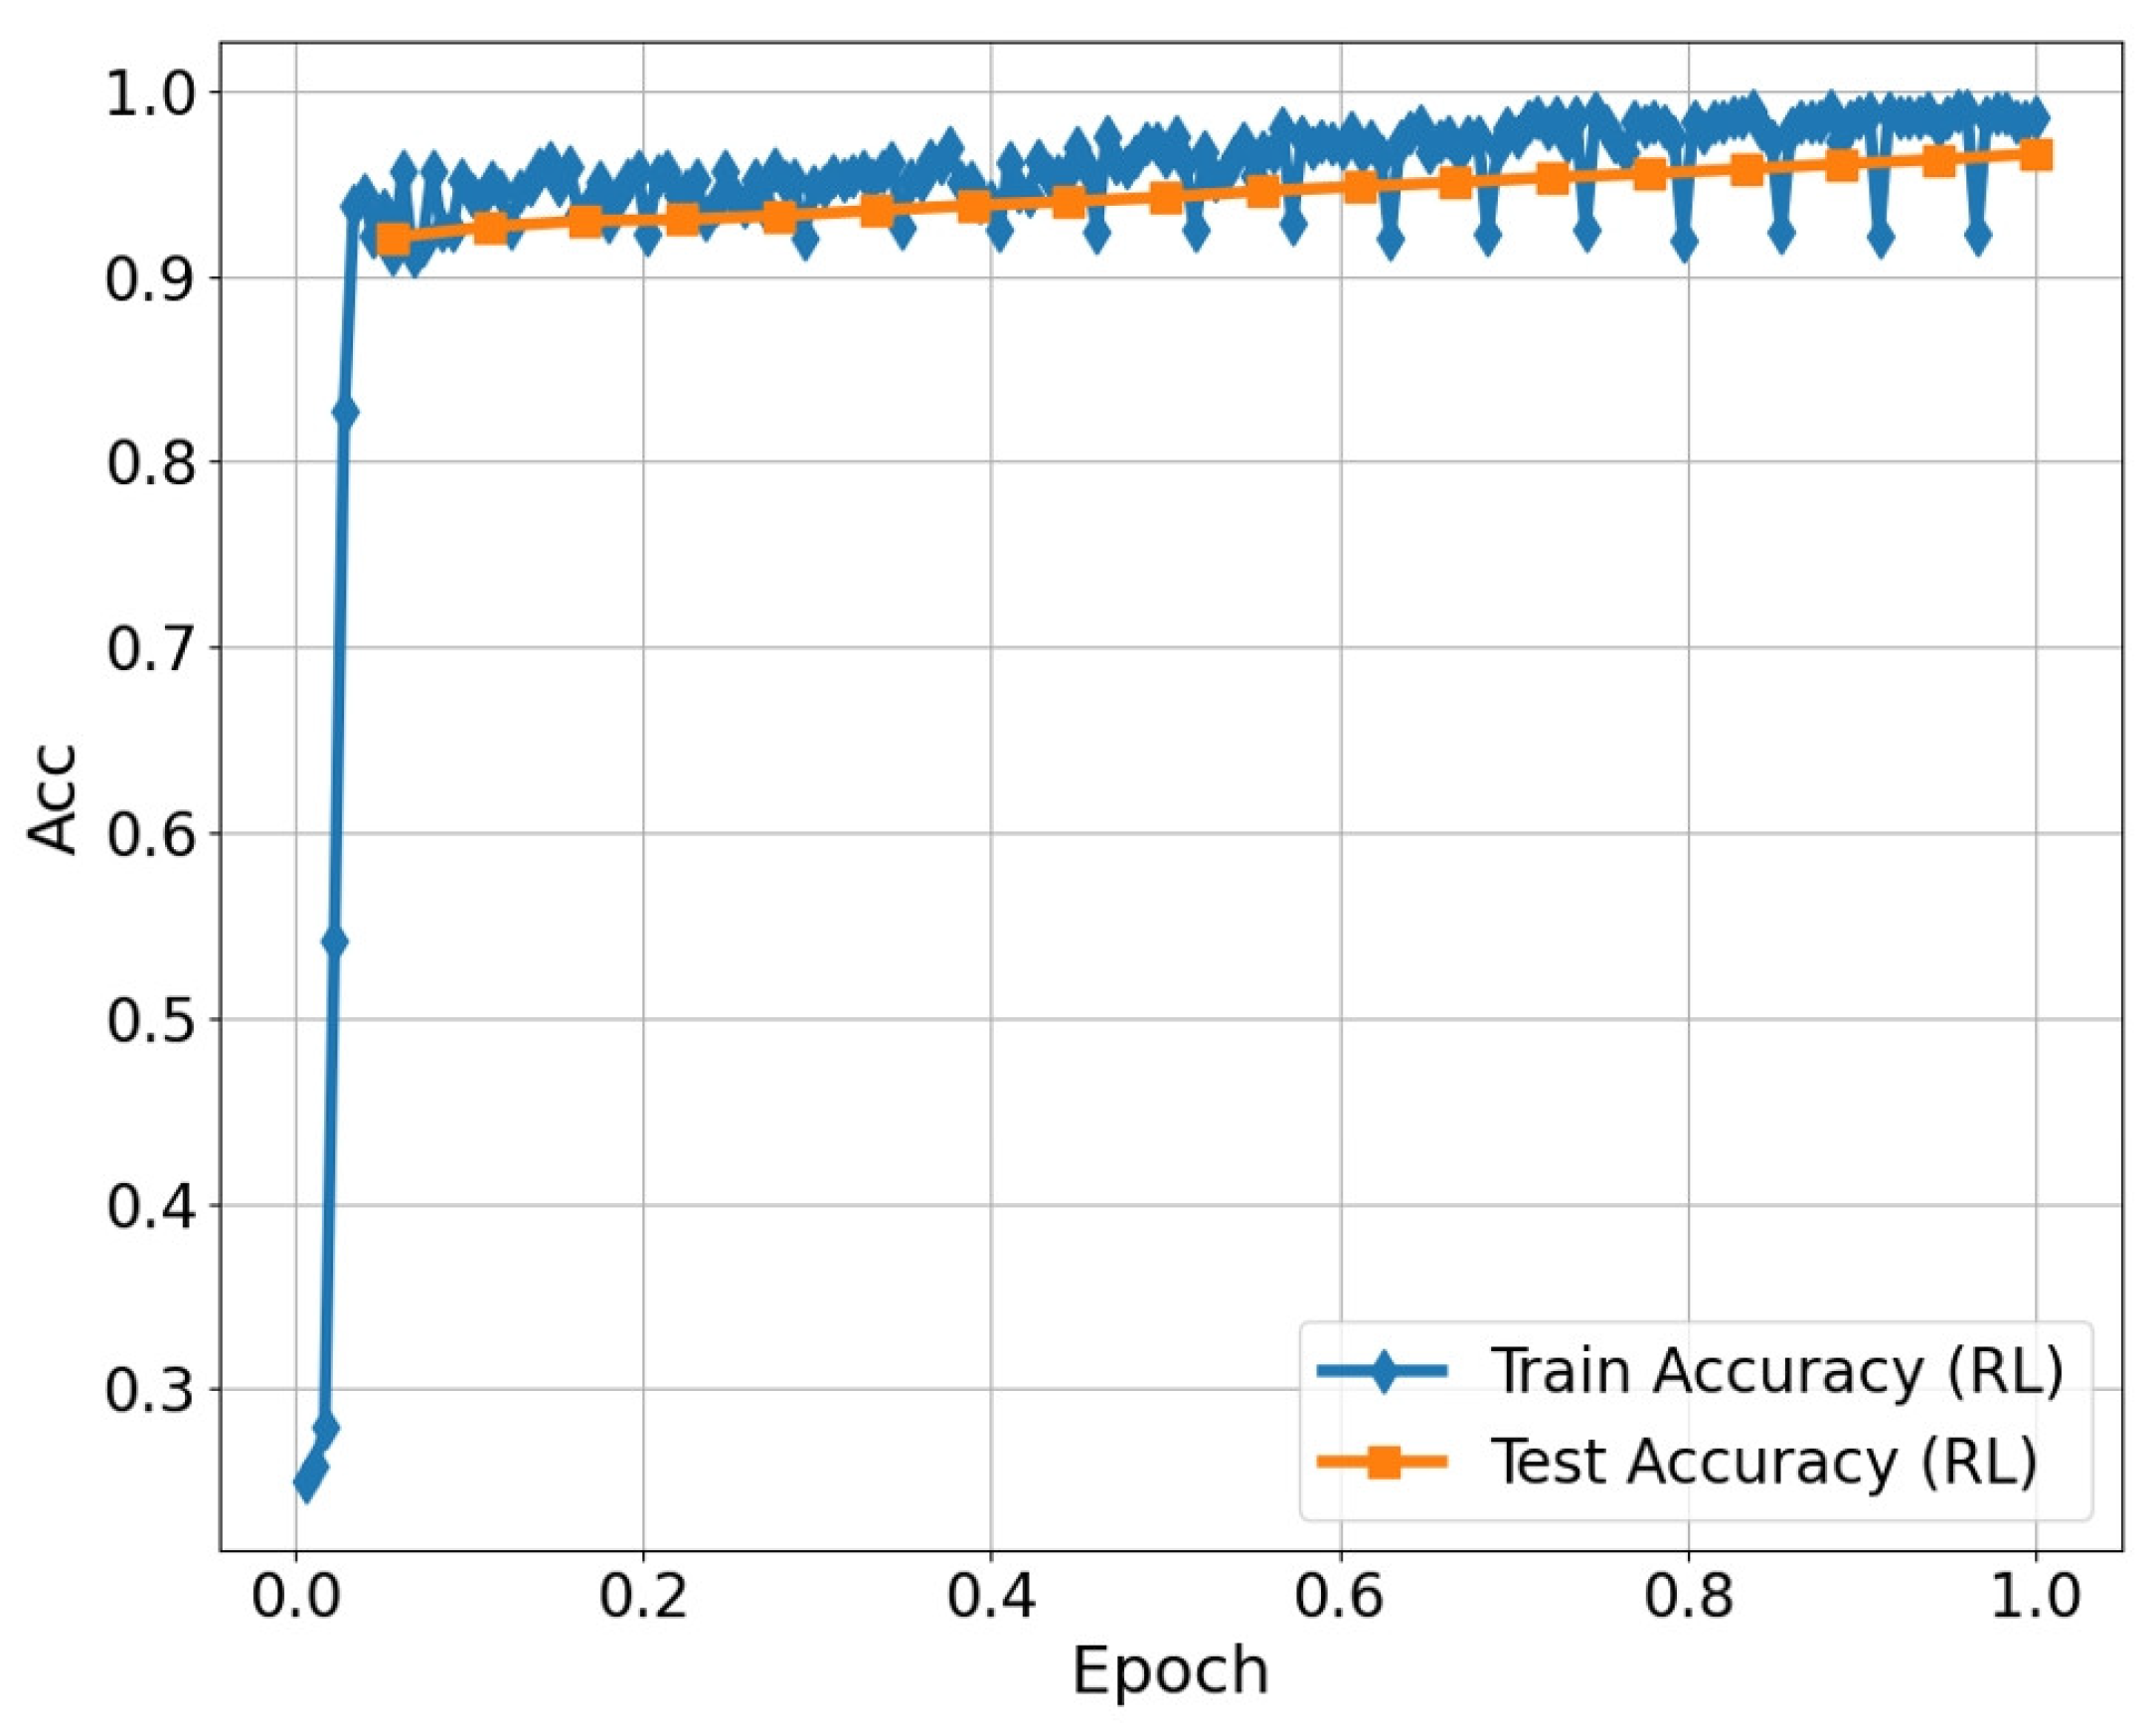
3.3. Analysis of Ablation Experiment on RL

To verify the effectiveness of the proposed GRPO-based RL strategy in improving the generalization ability of the model, ablation experiments were designed and model performance was compared under two training paradigms: end-to-end supervised training based on labeled data, that is, Supervised Fine-Tuning (SFT), and RL. The experiments use the same initial pre-trained model and are trained under the same dataset partitioning conditions. The training set uses wetland, mountain, and urban parks, while the test set uses seaside parks to evaluate the model’s performance and generalization learning ability on unseen types of parks. During the training process, the accuracy and loss values of the model on the training and test sets are recorded at every interval of a certain number of iterations, and the accuracy and loss curves are plotted to observe the learning trend of the model. The accuracy is the average accuracy of the predicted token.
As shown in Figure 8, the change curve of training and testing accuracy show that the SFT model exhibits good learning ability in the early stage of training, and the accuracy rate increases rapidly. However, as the number of training steps increases, while the training set accuracy continues to improve, the test set accuracy saturates or even slightly decreases, indicating that the model is overfitted. From the change in loss between the training set and test set, the SFT model’s training loss decreases during the training process, while the test loss starts to rise after a steady phase, further validating its limited generalization ability. This suggests that the SFT model overfitted the characteristics of specific types of parks in the training set (wetland, mountain, and urban parks) and cannot effectively adapt to the unseen seaside park types. In contrast, the RL model with the reinforcement learning is more stable in overall performance. As shown in Figure 9, its test accuracy remains at a high level throughout the training process, and there are no significant performance fluctuations. In addition, the RL model consistently presents a lower loss than the SFT model on the test set, and the gap is especially more pronounced in the later stages of training, showing stronger resistance to overfitting and cross-type generalization.

4. Discussion

4.1. Methodological Implications of Multimodal Modeling

The proposed multimodal framework for integrating pre-training and RL carries significant methodological implications. First, the model demonstrates that integrating image and text information enables multimodal data to provide complementary and synergistic benefits in evaluating parks. Compared with the single-modal approach, experimental results show that the multimodal fusion method can capture both the visual aesthetic features of the park and user experience feedback, thereby providing more comprehensive and objective evaluation outcomes. This finding is not only applicable to park evaluation but also serves as a methodological reference for other assessment tasks in urban planning.
Second, the synergistic integration of pre-training and RL represents a new learning paradigm. During the pre-training phase, a generic feature representation is built through MLM with MIM self-supervised tasks, while GRPO RL further optimizes the model’s adaptability to different types of parks. The generalized features obtained from pre-training provide a solid foundation for reinforcement learning, which significantly improves the model’s generalization ability and decision-making efficiency in complex environments [59]. This two-stage learning strategy of “generic pre-training + task-specific optimization” effectively balances the representation capability of the model with the task specificity and provides a novel approach to tackle the challenges posed by data scarcity and the diversity of categories in urban planning evaluations.
In addition, zero-shot learning significantly improves the model’s ability to generalize across new types of parks, overcoming the challenges of traditional methods that struggle to evaluate new or renovated parks due to insufficient data. The model can perform reasonable and accurate evaluations based on existing knowledge of park types without requiring additional labeling, thereby significantly reducing the costs of data collection and retraining. In urban visual perception, Zhang et al. effectively modeled the semantic relationships among perceptual attributes by constructing a semantic correlation matrix and used zero-shot learning to infer perceptual labels (e.g., sense of safety, aesthetics, etc.) that had not previously appeared in cityscape images [60]. This knowledge migration at the semantic level not only improves the accuracy and interpretability of the evaluation but also offers a strong technical reference and potential for extension in the future work of this study on generalized cross-dimensional perception prediction of urban parks.
In Table 6, the main inputs and key parameters of the proposed model are summarized.

4.2. Application Scenarios of Multimodal Modeling

The proposed multimodal evaluation model can be applied to a variety of urban planning and management scenarios. First, the model can be used to assess the potential effects of different design options during the planning and design phase of a park. By inputting design renderings and expected functional descriptions, the model can predict the performance of different proposals across three dimensions, accessibility, usability, and aesthetics, providing decision makers with a quantitative basis to optimize resource allocation.
Second, in the operational management of established parks, the model can be used to regularly evaluate the quality of the park and identify areas needing improvement. For example, the model can be used to predict low scores in the usability dimension. By analyzing these low scores, managers may identify issues such as inadequate facility configurations or poor maintenance, enabling targeted improvements. This data-driven management approach can improve the efficiency of the use of public resources and better meet the needs of residents.
In addition, the model can be integrated into smart city platforms to offer residents personalized park recommendation services. Based on user preferences (such as a greater emphasis on accessibility or aesthetics) and their current location, the system can recommend the most suitable parks, thereby enhancing the user experience. Simultaneously, by collecting user feedback and new images, the model can continuously update to adapt to dynamic changes in the urban environment and residents’ needs.

4.3. Research Limitations and Future Directions

This study has made significant progress in evaluating multiple types of parks, but several limitations remain. Despite achieving good results in terms of model performance, the high computational cost of the multimodal structure continues to be a key factor limiting the scalability of the model. This issue is especially pronounced in large-scale urban data scenarios, where resource consumption during training and inference may become a bottleneck for deployment. Future research should focus on enhancing model expressiveness while systematically controlling computational complexity. Techniques such as weight pruning and low-rank matrix factorization could be explored to reduce redundant computations, or lightweight student models could be developed through knowledge distillation to inherit the perceptual capabilities of more complex models. Furthermore, modality selection mechanisms can be applied during the fusion stage to prioritize high-information modality paths, effectively reducing resource consumption. By integrating these strategies, the model’s practicality and scalability in diverse urban environments may be significantly improved.
Beyond scalability issues, the operational efficiency of models during actual deployment phases also warrants attention. Particularly in resource-constrained urban management platforms or mobile terminal application scenarios, achieving efficient inference is crucial for model implementation. Future research could prioritize exploring model quantization techniques to compress high-precision floating-point parameters into low-bit representations for accelerated inference and introduce knowledge distillation to compress the current multimodal large models into lightweight student networks while preserving their primary feature discrimination capabilities. Additionally, consideration could be given to utilizing lightweight neural network architectures (such as MobileNet, DistilBERT, etc.) to replace current backbone models while combining attention pruning and modal sparsity strategies to compress image–text fusion pathways further. These strategies would contribute to enhancing model operational efficiency in large-scale, real-time scenarios, providing a technical foundation for the practical deployment of urban intelligent systems.
The dataset employed in this study primarily derives from social media data, which, despite preprocessing and expert annotation ensuring scientific rigor and consistency, may still exhibit certain biases. For instance, samples may be limited to users of social media platforms while failing to encompass potential respondents who do not utilize social media platforms [61,62]. The behaviors and perceptions of active social media users may not fully represent the preferences and experiences of broader populations. Future research could expand data sources by incorporating diverse user data from offline field surveys, targeted questionnaire feedback, and other platforms (such as Weibo, Xiaohongshu, Amap reviews, etc.) to achieve structural diversification of user groups. This approach would contribute to more comprehensively reflecting the perceptual characteristics of users across different age groups, professional backgrounds, and park preferences, thereby enhancing the broad applicability of the research conclusions.
To further mitigate the impact of data bias on model fairness and robustness, future research could introduce more systematic data control and correction mechanisms. On the one hand, stratified sampling techniques may be employed to construct structured samples based on user attributes (such as age, gender, and activity regions) during the data collection and annotation phases, thereby reducing bias effects; on the other hand, modal weighting mechanisms could be designed to dynamically adjust the model’s dependence on different modalities according to semantic consistency between text and images and source credibility. Additionally, establishing cross-source data models through multi-platform data fusion would also contribute to enhancing sample diversity and model generalization performance. These strategies will provide critical support for achieving more equitable and robust urban spatial perception models.
Regarding the coverage of park types, this study focuses on four representative urban park categories in Zhuhai City (seaside, urban, mountainous, and wetland parks). Although these parks exhibit diversity in geographical morphology and functional positioning, they collectively fail to encompass the complete spectrum of urban green space systems. For instance, forest parks, desert parks, and riverfront parks remain unincorporated in this research, which may constrain the model’s applicability and interpretive capacity for broader park morphologies. Moreover, different regional and cultural backgrounds influence urban park environmental perception [63]. Future research could introduce more diverse type samples across larger regional scales, extending the model to additional park categories or cross-cultural contexts, thereby enhancing model adaptability to complex urban green space scenarios.
To achieve the objectives of extended validation, although this study has made preliminary explorations in model generalization capability, the research data remains confined to the local context of Zhuhai. Given the distinct regional and cultural differences in urban green space morphology, user preferences, and evaluative language across different regions, applying the model to other areas (such as northern Chinese cities or international cities) may cause performance fluctuations. Therefore, future research will conduct cross-city or cross-national generalization testing on datasets encompassing more park types or originating from different regions to comprehensively assess the model’s stability and transferability across diverse spatial and cultural scenarios.

5. Conclusions

This study proposes a multimodal deep learning framework that integrates a pre-training mechanism with a GRPO-based reinforcement learning strategy to comprehensively evaluate and predict the accessibility, usability, and aesthetics of different types of urban parks (e.g., seaside, urban, mountain, and wetland parks). The method takes image content and user review text as bimodal inputs and achieves a deep synergistic representation of semantic and visual features by constructing a unified text encoder, image encoder, and multimodal fusion module.
The experimental results show that this model significantly outperforms the traditional baseline method in accuracy, F1 Score, recall, and other metrics. Especially in the leave-one-out generalization experiment, it shows stronger cross-class migration ability. This suggests that the introduction of a pre-training mechanism enhances the model’s robustness to semantic space heterogeneity, while reinforcement learning–guided sample selection and policy updates can effectively improve the model’s generalization performance.
Despite significant progress made in the evaluation of multiple types of parks in this study, several limitations remain. Firstly, the computational cost of multimodal models is relatively high, which limits the scalability of the proposed method. Future efforts should focus on enhancing model efficiency through techniques such as quantization and knowledge distillation, enabling more suitable deployment at a large scale. Secondly, the reliance on social media data may introduce biases. Expanding data sources to include field surveys and multiple platforms, as well as adopting bias mitigation strategies like stratified sampling, is necessary to ensure the fairness and robustness of the model. Finally, the study focuses on only four types of parks within the Zhuhai region. Future work should expand to encompass a broader range of park types and datasets from different regions, with cross-city and cross-cultural validations, to improve the model’s generalization ability further and build a more universally applicable evaluation framework.
Overall, this study provides a new technical framework and ideas for intelligent evaluation of parks and other urban spaces. The proposed multimodal deep learning method provides a realistic decision support tool for urban planning and management. Future research can build upon the findings of this study to further explore the integration of additional data sources, optimize the efficiency of the model, and promote its application across broader and more complex scenarios, thereby contributing to the development and sustainability of smart cities.

Author Contributions

Conceptualization, data curation, methodology, software, validation, original draft, visualization, writing—review and editing, K.C.; conceptualization, methodology, software, validation, T.X.; data curation, methodology, visualization, editing, Z.C.; data curation, visualization, editing, Y.L.; conceptualization, methodology, visualization, writing—review and editing, X.L.; conceptualization, data curation, methodology, visualization, R.B. All authors have read and agreed to the published version of the manuscript.

Funding

This research was funded by the Guangdong Province Philosophy and Social Sciences 2023 Annual Discipline Co-construction Project (Grant No. GD23XSH15), Fuyang City Special Project on Humanities and Social Sciences Research: “Research on Strategies for High-Quality Green Development in Fuyang City” (Grant No. FYSK2022LH04), and Anhui Province New Era Education Quality Project (Graduate Education): Teaching Case Library for Discipline Teaching (Geography, Grant No. 2024zyxwjxalk171).

Data Availability Statement

The original contributions presented in this study are included in the article. Further inquiries can be directed to the corresponding authors.

Conflicts of Interest

Author Tao Xia was employed by the company Zhuhai Dechuang Construction Engineering Consulting Co., Ltd. The remaining authors declare that the research was conducted in the absence of any commercial or financial relationships that could be construed as a potential conflict of interest.

Abbreviations

The following abbreviations are used in this manuscript:
GRPOGroup Relative Policy Optimization
RNNs Recurrent Neural Networks
CNNsConvolutional Neural Networks
LLMsLarge-scale language models

References

  1. Wang, Y.; Chen, F. Research on Environmental Behavior of Urban Parks in the North of China during Cold Weather—Nankai Park as a Case Study. Buildings 2024, 14, 2742. [Google Scholar] [CrossRef]
  2. Wu, Y.; Zhou, W.; Zhang, H.; Liu, Q.; Yan, Z.; Lan, S. Relationships between Green Space Perceptions, Green Space Use, and the Multidimensional Health of Older People: A Case Study of Fuzhou, China. Buildings 2024, 14, 1544. [Google Scholar] [CrossRef]
  3. Fagerholm, N.; Eilola, S.; Arki, V. Outdoor Recreation and Nature’s Contribution to Well-Being in a Pandemic Situation-Case Turku, Finland. Urban For. Urban Green. 2021, 64, 127257. [Google Scholar] [CrossRef] [PubMed]
  4. Liu, S.; Wang, X. Reexamine the Value of Urban Pocket Parks under the Impact of the COVID-19. Urban For. Urban Green. 2021, 64, 127294. [Google Scholar] [CrossRef] [PubMed]
  5. Puhakka, R. University Students’ Participation in Outdoor Recreation and the Perceived Well-Being Effects of Nature. J. Outdoor Recreat. Tour. 2021, 36, 100425. [Google Scholar] [CrossRef]
  6. Cheng, Y.; Zhang, J.; Wei, W.; Zhao, B. Effects of Urban Parks on Residents’ Expressed Happiness before and during the COVID-19 Pandemic. Landsc. Urban Plan. 2021, 212, 104118. [Google Scholar] [CrossRef]
  7. Kong, L.; Liu, Z.; Pan, X.; Wang, Y.; Guo, X.; Wu, J. How Do Different Types and Landscape Attributes of Urban Parks Affect Visitors’ Positive Emotions? Landsc. Urban Plan. 2022, 226, 104482. [Google Scholar] [CrossRef]
  8. Creed, C.; Carvalho, J.S. Exploring the User Experience, Quality, and Provision of Urban Greenspace: A Mixed-Method Approach. Urban For. Urban Green. 2024, 100, 128470. [Google Scholar] [CrossRef]
  9. Wang, R.; Cao, M.; Yao, Y.; Wu, W. The Inequalities of Different Dimensions of Visible Street Urban Green Space Provision: A Machine Learning Approach. Land Use Policy 2022, 123, 106410. [Google Scholar] [CrossRef]
  10. Lau, K.K.-L.; Yung, C.C.-Y.; Tan, Z. Usage and Perception of Urban Green Space of Older Adults in the High-Density City of Hong Kong. Urban For. Urban Green. 2021, 64, 127251. [Google Scholar] [CrossRef]
  11. Huang, W.; Zhao, X.; Lin, G.; Wang, Z.; Chen, M. How to Quantify Multidimensional Perception of Urban Parks? Integrating Deep Learning-Based Social Media Data Analysis with Questionnaire Survey Methods. Urban For. Urban Green. 2025, 107, 128754. [Google Scholar] [CrossRef]
  12. Biernacka, M.; Łaszkiewicz, E.; Kronenberg, J. Park Availability, Accessibility, and Attractiveness in Relation to the Least and Most Vulnerable Inhabitants. Urban For. Urban Green. 2022, 73, 127585. [Google Scholar] [CrossRef]
  13. Byrne, J.; Wolch, J. Nature, Race, and Parks: Past Research and Future Directions for Geographic Research. Prog. Hum. Geogr. 2009, 33, 743–765. [Google Scholar] [CrossRef]
  14. Yao, W.; Yun, J.; Zhang, Y.; Meng, T.; Mu, Z. Usage Behavior and Health Benefit Perception of Youth in Urban Parks: A Case Study from Qingdao, China. Front. Public Health 2022, 10, 923671. [Google Scholar] [CrossRef]
  15. Chitra, B.; Jain, M.; Chundelli, F.A. Understanding the Soundscape Environment of an Urban Park through Landscape Elements. Environ. Technol. Innov. 2020, 19, 100998. [Google Scholar] [CrossRef]
  16. Yoon, J.I.; Lim, S.; Kim, M.-L.; Joo, J. The Relationship between Perceived Restorativeness and Place Attachment for Hikers at Jeju Gotjawal Provincial Park in South Korea: The Moderating Effect of Environmental Sensitivity. Front. Psychol. 2023, 14, 1201112. [Google Scholar] [CrossRef]
  17. Subiza-Pérez, M.; Hauru, K.; Korpela, K.; Haapala, A.; Lehvävirta, S. Perceived Environmental Aesthetic Qualities Scale (PEAQS)–A Self-Report Tool for the Evaluation of Green-Blue Spaces. Urban For. Urban Green. 2019, 43, 126383. [Google Scholar] [CrossRef]
  18. Rivera, E.; Timperio, A.; Loh, V.H.Y.; Deforche, B.; Veitch, J. Critical Factors Influencing Adolescents’ Active and Social Park Use: A Qualitative Study Using Walk-along Interviews. Urban For. Urban Green. 2021, 58, 126948. [Google Scholar] [CrossRef]
  19. Mak, B.K.L.; Jim, C.Y. Contributions of Human and Environmental Factors to Concerns of Personal Safety and Crime in Urban Parks. Secur. J. 2022, 35, 263–293. [Google Scholar] [CrossRef]
  20. Gosal, A.S.; Geijzendorffer, I.R.; Václavík, T.; Poulin, B.; Ziv, G. Using Social Media, Machine Learning and Natural Language Processing to Map Multiple Recreational Beneficiaries. Ecosyst. Serv. 2019, 38, 100958. [Google Scholar] [CrossRef]
  21. Liu, W.; Hu, X.; Song, Z.; Yuan, X. Identifying the Integrated Visual Characteristics of Greenway Landscape: A Focus on Human Perception. Sustain. Cities Soc. 2023, 99, 104937. [Google Scholar] [CrossRef]
  22. He, H.; Sun, R.; Li, J.; Li, W. Urban Landscape and Climate Affect Residents’ Sentiments Based on Big Data. Appl. Geogr. 2023, 152, 102902. [Google Scholar] [CrossRef]
  23. Wang, Z.; Miao, Y.; Xu, M.; Zhu, Z.; Qureshi, S.; Chang, Q. Revealing the Differences of Urban Parks’ Services to Human Wellbeing Based upon Social Media Data. Urban For. Urban Green. 2021, 63, 127233. [Google Scholar] [CrossRef]
  24. Li, J.; Fu, J.; Gao, J.; Zhou, R.; Wang, K.; Zhou, K. Effects of the Spatial Patterns of Urban Parks on Public Satisfaction: Evidence from Shanghai, China. Landsc. Ecol. 2023, 38, 1265–1277. [Google Scholar] [CrossRef]
  25. Shang, Z.; Cheng, K.; Jian, Y.; Wang, Z. Comparison and Applicability Study of Analysis Methods for Social Media Text Data: Taking Perception of Urban Parks in Beijing as an Example. Landsc. Archit. Front. 2023, 11, 8. [Google Scholar] [CrossRef]
  26. Huai, S.; Liu, S.; Zheng, T.; Van De Voorde, T. Are Social Media Data and Survey Data Consistent in Measuring Park Visitation, Park Satisfaction, and Their Influencing Factors? A Case Study in Shanghai. Urban For. Urban Green. 2023, 81, 127869. [Google Scholar] [CrossRef]
  27. Luo, J.; Zhao, T.; Cao, L.; Biljecki, F. Water View Imagery: Perception and Evaluation of Urban Waterscapes Worldwide. Ecol. Indic. 2022, 145, 109615. [Google Scholar] [CrossRef]
  28. Yang, C.; Liu, T.; Zhang, S. Using Flickr Data to Understand Image of Urban Public Spaces with a Deep Learning Model: A Case Study of the Haihe River in Tianjin. IJGI 2022, 11, 497. [Google Scholar] [CrossRef]
  29. Zhang, K.; Chen, Y.; Li, C. Discovering the Tourists’ Behaviors and Perceptions in a Tourism Destination by Analyzing Photos’ Visual Content with a Computer Deep Learning Model: The Case of Beijing. Tour. Manag. 2019, 75, 595–608. [Google Scholar] [CrossRef]
  30. Chen, Z.; Sheng, Y.; Luo, D.; Huang, Y.; Huang, J.; Zhu, Z.; Yao, X.; Fu, W.; Dong, J.; Lan, Y. Landscape Characteristics in Mountain Parks across Different Urban Gradients and Their Relationship with Public Response. Forests 2023, 14, 2406. [Google Scholar] [CrossRef]
  31. Chen, J.; van den Bosch, C.C.K.; Lin, C.; Liu, F.; Huang, Y.; Huang, Q.; Wang, M.; Zhou, Q.; Dong, J. Effects of Personality, Health and Mood on Satisfaction and Quality Perception of Urban Mountain Parks. Urban For. Urban Green. 2021, 63, 127210. [Google Scholar] [CrossRef]
  32. Song, S.; Goo, J.Y.J.E.; Ying, L.S.M.; Todd, P.A. Urban Coastal Parks: What Does the Public Want and What Are the Effects of Priming and Socio-Demographic Background? Urban For. Urban Green. 2025, 105, 128666. [Google Scholar] [CrossRef]
  33. Chakraborty, S.; Saha, S.K.; Ahmed Selim, S. Recreational Services in Tourism Dominated Coastal Ecosystems: Bringing the Non-Economic Values into Focus. J. Outdoor Recreat. Tour. 2020, 30, 100279. [Google Scholar] [CrossRef]
  34. Roberts, M.; Glenk, K.; McVittie, A. Urban Residents Value Multi-Functional Urban Greenspaces. Urban For. Urban Green. 2022, 74, 127681. [Google Scholar] [CrossRef]
  35. Mäntymaa, E.; Jokinen, M.; Juutinen, A.; Lankia, T.; Louhi, P. Providing Ecological, Cultural and Commercial Services in an Urban Park: A Travel Cost–Contingent Behavior Application in Finland. Landsc. Urban Plan. 2021, 209, 104042. [Google Scholar] [CrossRef]
  36. Lee, L.-H. Perspectives on Landscape Aesthetics for the Ecological Conservation of Wetlands. Wetlands 2017, 37, 381–389. [Google Scholar] [CrossRef]
  37. Li, J.; Pan, Q.; Peng, Y.; Feng, T.; Liu, S.; Cai, X.; Zhong, C.; Yin, Y.; Lai, W. Perceived Quality of Urban Wetland Parks: A Second-Order Factor Structure Equation Modeling. Sustainability 2020, 12, 7204. [Google Scholar] [CrossRef]
  38. Filali, H.; Riffi, J.; Boulealam, C.; Mahraz, M.A.; Tairi, H. Multimodal Emotional Classification Based on Meaningful Learning. BDCC 2022, 6, 95. [Google Scholar] [CrossRef]
  39. Wang, Z.; Zhou, X.; Wang, W.; Liang, C. Emotion Recognition Using Multimodal Deep Learning in Multiple Psychophysiological Signals and Video. Int. J. Mach. Learn. Cybern. 2020, 11, 923–934. [Google Scholar] [CrossRef]
  40. Gandhi, A.; Adhvaryu, K.; Poria, S.; Cambria, E.; Hussain, A. Multimodal Sentiment Analysis: A Systematic Review of History, Datasets, Multimodal Fusion Methods, Applications, Challenges and Future Directions. Inf. Fusion 2023, 91, 424–444. [Google Scholar] [CrossRef]
  41. Zhang, S.; Yang, Y.; Chen, C.; Zhang, X.; Leng, Q.; Zhao, X. Deep Learning-Based Multimodal Emotion Recognition from Audio, Visual, and Text Modalities: A Systematic Review of Recent Advancements and Future Prospects. Expert Syst. Appl. 2024, 237, 121692. [Google Scholar] [CrossRef]
  42. Lu, J.; Batra, D.; Parikh, D.; Lee, S. ViLBERT: Pretraining Task-Agnostic Visiolinguistic Representations for Vision-and-Language Tasks. In Proceedings of the Advances in Neural Information Processing Systems 32 (NIPS 2019), Vancouver, Canada, 8–14 December 2019; Volume 32. [Google Scholar]
  43. Chen, Y.-C.; Li, L.; Yu, L.; El Kholy, A.; Ahmed, F.; Gan, Z.; Cheng, Y.; Liu, J. UNITER: UNiversal Image-TExt Representation Learning. In Computer Vision—ECCV 2020; Lecture Notes in Computer Science; Vedaldi, A., Bischof, H., Brox, T., Frahm, J.-M., Eds.; Springer International Publishing: Cham, Switzerland, 2020; Volume 12375, pp. 104–120. [Google Scholar] [CrossRef]
  44. Alrbai, M.; Al-Dahidi, S.; Alahmer, H.; Al-Ghussain, L.; Al-Rbaihat, R.; Hayajneh, H.; Alahmer, A. Integration and Optimization of a Waste Heat Driven Organic Rankine Cycle for Power Generation in Wastewater Treatment Plants. Energy 2024, 308, 132829. [Google Scholar] [CrossRef]
  45. Ji, L.; Xiao, S.; Feng, J.; Gao, W.; Zhang, H. Multimodal Large Model Pretraining, Adaptation and Efficiency Optimization. Neurocomputing 2025, 619, 129138. [Google Scholar] [CrossRef]
  46. He, J.; Hu, H. MF-BERT: Multimodal Fusion in Pre-Trained BERT for Sentiment Analysis. IEEE Signal Process. Lett. 2022, 29, 454–458. [Google Scholar] [CrossRef]
  47. Ma, H.; Fan, B.; Ng, B.K.; Lam, C.-T. VL-Meta: Vision-Language Models for Multimodal Meta-Learning. Mathematics 2024, 12, 286. [Google Scholar] [CrossRef]
  48. Cao, Y.; Zhao, H.; Cheng, Y.; Shu, T.; Chen, Y.; Liu, G.; Liang, G.; Zhao, J.; Yan, J.; Li, Y. Survey on Large Language Model-Enhanced Reinforcement Learning: Concept, Taxonomy, and Methods. IEEE Trans. Neural Netw. Learn. Syst. 2024, 36, 9737–9757. [Google Scholar] [CrossRef]
  49. Xiong, L.; Wang, H.; Chen, X.; Sheng, L.; Xiong, Y.; Liu, J.; Xiao, Y.; Chen, H.; Han, Q.-L.; Tang, Y. DeepSeek: Paradigm Shifts and Technical Evolution in Large AI Models. IEEE/CAA J. Autom. Sinica 2025, 12, 841–858. [Google Scholar] [CrossRef]
  50. Wang, W.; Zheng, V.W.; Yu, H.; Miao, C. A Survey of Zero-Shot Learning: Settings, Methods, and Applications. ACM Trans. Intell. Syst. Technol. 2019, 10, 1–37. [Google Scholar] [CrossRef]
  51. Xian, Y.; Lampert, C.H.; Schiele, B.; Akata, Z. Zero-Shot Learning—A Comprehensive Evaluation of the Good, the Bad and the Ugly. IEEE Trans. Pattern Anal. Mach. Intell. 2019, 41, 2251–2265. [Google Scholar] [CrossRef]
  52. Houichime, T.; El Amrani, Y. Context Is All You Need: A Hybrid Attention-Based Method for Detecting Code Design Patterns. IEEE Access 2025, 13, 9689–9707. [Google Scholar] [CrossRef]
  53. Al-hammuri, K.; Gebali, F.; Kanan, A.; Chelvan, I.T. Vision Transformer Architecture and Applications in Digital Health: A Tutorial and Survey. Vis. Comput. Ind. Biomed. Art 2023, 6, 14. [Google Scholar] [CrossRef] [PubMed]
  54. Blanchard, A.E.; Shekar, M.C.; Gao, S.; Gounley, J.; Lyngaas, I.; Glaser, J.; Bhowmik, D. Automating Genetic Algorithm Mutations for Molecules Using a Masked Language Model. IEEE Trans. Evol. Computat. 2022, 26, 793–799. [Google Scholar] [CrossRef]
  55. Xie, Y.; Gu, L.; Harada, T.; Zhang, J.; Xia, Y.; Wu, Q. Rethinking Masked Image Modelling for Medical Image Representation. Med. Image Anal. 2024, 98, 103304. [Google Scholar] [CrossRef] [PubMed]
  56. Han, S.; Wang, M.; Zhang, J.; Li, D.; Duan, J. A Review of Large Language Models: Fundamental Architectures, Key Technological Evolutions, Interdisciplinary Technologies Integration, Optimization and Compression Techniques, Applications, and Challenges. Electronics 2024, 13, 5040. [Google Scholar] [CrossRef]
  57. Huai, S.; Chen, F.; Liu, S.; Canters, F.; Van De Voorde, T. Using Social Media Photos and Computer Vision to Assess Cultural Ecosystem Services and Landscape Features in Urban Parks. Ecosyst. Serv. 2022, 57, 101475. [Google Scholar] [CrossRef]
  58. Ren, W.; Zhan, K.; Chen, Z.; Hong, X.-C. Research on Landscape Perception of Urban Parks Based on User-Generated Data. Buildings 2024, 14, 2776. [Google Scholar] [CrossRef]
  59. Zheng, Y.; Lin, Y.; Zhao, L.; Wu, T.; Jin, D.; Li, Y. Spatial Planning of Urban Communities via Deep Reinforcement Learning. Nat. Comput. Sci. 2023, 3, 748–762. [Google Scholar] [CrossRef]
  60. Zhang, C.; Wu, T.; Zhang, Y.; Zhao, B.; Wang, T.; Cui, C.; Yin, Y. Deep Semantic-Aware Network for Zero-Shot Visual Urban Perception. Int. J. Mach. Learn. Cybern. 2022, 13, 1197–1211. [Google Scholar] [CrossRef]
  61. Ghermandi, A.; Langemeyer, J.; Van Berkel, D.; Calcagni, F.; Depietri, Y.; Egarter Vigl, L.; Fox, N.; Havinga, I.; Jäger, H.; Kaiser, N.; et al. Social Media Data for Environmental Sustainability: A Critical Review of Opportunities, Threats, and Ethical Use. One Earth 2023, 6, 236–250. [Google Scholar] [CrossRef]
  62. Park, S.; Kim, S.; Lee, J.; Heo, B. Evolving Norms: Social Media Data Analysis on Parks and Greenspaces Perception Changes before and after the COVID 19 Pandemic Using a Machine Learning Approach. Sci. Rep. 2022, 12, 13246. [Google Scholar] [CrossRef]
  63. Huai, S.; Van De Voorde, T. Which Environmental Features Contribute to Positive and Negative Perceptions of Urban Parks? A Cross-Cultural Comparison Using Online Reviews and Natural Language Processing Methods. Landsc. Urban Plan. 2022, 218, 104307. [Google Scholar] [CrossRef]
Figure 1. Prediction framework for comprehensive evaluation of multi-type parks based on pre-training and reinforcement learning. In this framework, orange and white boxes denote the text and image input/encoder modules, respectively, purple indicates the cross-attention module, and blue represents the output prediction module. Black arrows show the data flow within processing steps, and blue arrows illustrate the information flow between functional modules.
Buildings 15 02364 g001
Figure 2. Cross-attention fusion module.
Buildings 15 02364 g002
Figure 3. GRPO structure.
Buildings 15 02364 g003
Figure 4. Study area location.
Buildings 15 02364 g004
Figure 5. Samples of different park types and the expert scores: (a) seaside park; (b) urban park; (c) mountain park; (d) wetland park.
Buildings 15 02364 g005
Figure 6. Confusion matrix of model predictions for accessibility, usability, and aesthetics: (a) accessibility; (b) usability; (c) aesthetics.
Buildings 15 02364 g006
Figure 7. Heat map of similarity between park types.
Buildings 15 02364 g007
Figure 8. Training and testing performance based on end-to-end supervised training (SFT model).
Buildings 15 02364 g008
Figure 9. Training and testing performance based on GRPO RL.
Buildings 15 02364 g009
Table 1. Sample size for different types of parks.
Park TypeMountain ParkSeaside ParkUrban ParkWetland Park
Sample size6504933448443785
Table 2. Comparison of the average values of the metrics for different methods.
MethodAccuracyPrecisionRecallF1 Score
LSTM0.790.740.770.75
CNN0.810.750.780.76
Our0.850.820.840.83
Table 3. Comparison of metrics of different methods of forecasting in accessibility dimension.
Training SetTest SetAccuracyPrecisionRecallF1 Score
A, B, CD0.860.820.860.83
A, B, DC0.830.800.820.81
A, C, DB0.810.770.790.78
B, C, DA0.800.750.780.76
Table 4. Comparison of metrics of different methods of forecasting in usability dimension.
Training SetTest SetAccuracyPrecisionRecallF1 Score
A, B, CD0.800.770.800.78
A, B, DC0.800.770.790.79
A, C, DB0.790.760.780.77
B, C, DA0.780.740.760.75
Table 5. Comparison of metrics of different methods of forecasting in aesthetics dimensions.
Training SetTest SetAccuracyPrecisionRecallF1 Score
A, B, CD0.880.870.880.87
A, B, DC0.850.820.840.83
A, C, DB0.840.800.830.81
B, C, DA0.820.790.790.80
Table 6. Main inputs and key parameters of the proposed model.
CategoryItemDescription
Input DataImage dataUser-uploaded park images, associated with corresponding texts, sourced from https://www.dianping.com/ (accessed on 18 February 2025).
Text dataTextual reviews of parks provided by users, associated with corresponding images, collected from https://www.dianping.com/ (accessed on 18 February 2025).
Park typeFour categories: seaside, urban, mountainous, and wetland parks
Dimension labels
(manual)
Accessibility, usability, and aesthetics (annotated by three planning experts using majority vote)
Model ArchitectureText encoderFor extracting semantic features from text
Image encoderFor extracting visual features
Multimodal fusion moduleAttention-based text–image feature fusion strategy
Training StrategyPre-trainingSelf-supervised learning approach for mining latent representations of text and images
Reinforcement learningPolicy gradient method employed for optimizing sample selection and modal fusion pathways
Evaluation MetricsAccuracyThe proportion of correctly predicted cases among all prediction instances
PrecisionThe proportion of truly positive samples among all instances predicted as positive by the model
RecallThe ratio of positive samples in the original dataset that are correctly identified by the model
F1 ScoreThe harmonic mean of precision and recall
Experimental DesignTrain/test strategyThree types of parks were used for training, while the remaining type was reserved for testing to evaluate the model’s cross-type generalization capability
Sample sizeOver 24,000 samples were collected from user-generated image–text reviews of 31 urban parks in Zhuhai sourced from https://www.dianping.com/ (accessed on 18 February 2025).
Disclaimer/Publisher’s Note: The statements, opinions and data contained in all publications are solely those of the individual author(s) and contributor(s) and not of MDPI and/or the editor(s). MDPI and/or the editor(s) disclaim responsibility for any injury to people or property resulting from any ideas, methods, instructions or products referred to in the content.

