Article

Green Infrastructure: Opinion Mining and Construction Material Reuse Optimization Portal

by
Arturas Kaklauskas
1,*,
Elisabete Teixeira
2,
Yiannis Xenidis
3,
Anastasia Tzioutziou
3,
Lorcan Connolly
4,
Sarunas Skuodis
5,
Kestutis Dauksys
1,
Natalija Lepkova
1,
Laura Tupenaite
1,
Loreta Kaklauskiene
1,
Simona Kildiene
1,
Jurgita Zidoniene
1,
Virginijus Milevicius
1 and
Saulius Naimavicius
1
1
Department of Construction Management and Real Estate, Faculty of Civil Engineering, Vilnius Gediminas Technical University, Saulėtekio al. 11, LT-10223 Vilnius, Lithuania
2
Department of Civil Engineering, University of Minho, Largo do Paco, 4704-553 Braga, Portugal
3
Department of Civil Engineering, School of Engineering, Aristotle University of Thessaloniki, University Campus, 54124 Thessaloniki, Greece
4
Research Driven Solutions Ltd., 1a Saint Kevin’s Avenue, Blackpitts, D08 TX29 Dublin, Ireland
5
Department of Reinforced Concrete Structures and Geotechnics, Faculty of Civil Engineering, Vilnius Gediminas Technical University, Saulėtekio al. 11, LT-10223 Vilnius, Lithuania
*
Author to whom correspondence should be addressed.
Buildings 2025, 15(13), 2362; https://doi.org/10.3390/buildings15132362
Submission received: 30 May 2025 / Revised: 1 July 2025 / Accepted: 3 July 2025 / Published: 5 July 2025
(This article belongs to the Section Architectural Design, Urban Science, and Real Estate)

Abstract

More and more sustainability data are being generated from green buildings and from urban and civil infrastructures. For decades, various systems have been developed, and their data have been collected and stored. More detailed, real-time, and cost-effective data, however, are still in short supply. To address this gap, one of the main objectives of the present study is to propose the GREEN method for opinion analysis to support the development of green infrastructure. Google Search was used to gather substantial amounts of information reflecting the views of both ordinary individuals and professionals regarding the benefits, drawbacks, challenges, and limitations of green infrastructure. Previously, however, such data have not been employed to improve green infrastructure by means of opinion analytics. The GREEN method was developed for the analysis of green infrastructure (GI) and its context, enabling multiple-criteria, neural network, correlation, and regression analyses across micro-, meso-, and macro-environmental scales. A total of 788 global regression (R2 = 0.997) and neural network (R2 = 0.596) GREEN models were developed and tested. In addition, 34 regression models for 12 (R2 = 0.817) and 20 (R2 = 0.511) cities were created for the world and separate cities (Munich (R2 aver = 0.801) and London (R2 aver = 0.817)). The GREEN method is a new way to analyze stakeholder opinions on sustainable green infrastructure and its context. With the objective of making green infrastructure more efficient and reducing carbon emissions, the Construction Material Reuse Optimization (SOLUTION) Portal was created as part of this research. The portal generates multiple options and proposes optimal alternatives for reused construction products. The results show that the GREEN method and SOLUTION Portal are reliable tools for evidence-based and rational green infrastructure development.

1. Introduction

1.1. Data-Driven Solutions for the Development of Green Civil Infrastructure

Assessment systems for green buildings are not a recent invention and have existed for decades. Some of the most well-known systems include GB tools in Canada, CASBEE in Japan, BREEAM in the U.K., and LEED in the U.S. Assessment systems for projects in the field of green civil infrastructure, however, are rarely discussed and developed around the world [1].
Many authors have explored data collection technologies and data-driven solutions for developing green infrastructure. Their research directions are summarized in Figure 1. Green urban, civil, and building infrastructure data collection technologies include a diverse array of techniques and tools, such as multi-criteria assessment systems, big data solutions, AI-based solutions, sensors and IoT devices, drones, geospatial data, citizen-generated and engagement platforms’ data, open data initiatives, urban data platforms, and other data collection methods (surveys and interviews, social media analytics, GPS data from mobile devices, virtual and augmented reality), for collecting data on various aspects.
Fu et al. [2] investigated green civil infrastructure (buildings, roads, tunnels, bridges, plants, and utilities) assessment systems and analyzed their features, including benefits, carbon emission reduction, creativity, culture preservation, durability, ecology, energy saving, environmental protection, landscape, safety, and waste reduction. Fu et al. [2] proposed an assessment framework to evaluate green infrastructure performance based on promoting ecosystem functions and services for social–ecological system resilience.
Güntsch et al. [3] outlined ten essential functions of national biodiversity data infrastructures.
Several authors explored big data solutions. These solutions can be used to assess the performance of green infrastructure and monitor the quality of air in an effort to mitigate pollution. The City of New York, for instance, has installed environmental sensors throughout the city to monitor air quality in real time. City planners use this stream of data to assess to what extent green spaces help with enhancing urban sustainability and reducing air pollution, and how effective they are [4,5].
Lei [6] presented a data-driven approach of using big data to monitor urban green spaces, thus tracking their health and assessing their impact on the urban environment. Equipped with these data, cities can turn their focus to the development of green spaces in areas that can suffer the biggest negative impacts of the effects of climate change, such as flood-prone neighborhoods or urban heat islands [7].
D.V. Ogunkan and S.K. Ogunkan [8] demonstrated the transformative potential of big data in fostering sustainable infrastructure in Barcelona, Singapore, Amsterdam, and New York, where big data enhanced efficiency, reduced environmental impacts, and improved urban services. Environmental monitoring devices, satellite imagery, and weather sensors offer a continuous stream of data that cities can analyze and then use to optimize the size and location of green infrastructure for maximized environmental benefits. Yet the success stories highlight the necessity of customizing data-driven solutions, taking into account local economic, political, and social factors [8].
Meng et al. [9] explored the obstacles of BIM technology application in green building projects, and their findings show that a fundamental role in BIM adoption is played by management and policy factors. Bapat et al. [10] propose that the interactive inspection and evaluation of well-coordinated models to produce high-quality and maintainable infrastructure and the integration of architectural systems, structural systems, and 3D models for better coordination of infrastructure are two integrated sustainability BIM processes that owners can use to manage their regulatory process and green building infrastructure. This ensures that more environmentally friendly methods and materials are used in construction.
Creating sustainability reporting tools to support the administration of green building/infrastructure projects is crucial for delivering insights on advancements in sustainable practices. Nonetheless, the swift expansion of sustainability reporting tools over the past ten years, featuring various criteria and methodologies, has resulted in stakeholder challenges [11].
An application of the AI-based solutions for green infrastructure is another emerging field of research. For instance, Lin et al. [12] found that Data Envelopment Analysis (DEA) integrated with machine learning can be a promising approach for measuring environmental efficiency. Silva et al. [13] suggested a participatory approach where AI is combined with citizen science. Urban residents then become active contributors of data through IoT-enabled devices or mobile applications, leading to potentially richer datasets for AI algorithms and, at the same time, encouraging the community to engage in sustainability initiatives. Local residents could, for instance, provide valuable inputs for their city’s sustainability efforts by tracking air quality changes or reporting instances of illegal dumping via their mobile apps.
The literature review reveals that sustainable development needs a data revolution, in which these new real-time and cost-effective data are integrated with traditional data to produce timely and more detailed high-quality information relevant for many different individuals and purposes. In a world of ever-increasing streams of copious data, there is still a lack of qualitative data about green infrastructure (on barriers, motivations, perceptions, the existing involvement of individuals and societies, and human-centered needs; social equity and inclusion; the social, environmental, and economic well-being of the built environment; and city and climatic questions, monitoring and assessment, planning and optimization, resource management, enhancing sustainability, smart city initiatives, and resilience and adaptation). It would be beneficial to integrate stakeholders’ (users, residents, community, investors, developers, utility companies, public authorities, and environmental organizations) opinions into green infrastructure rating analysis. Usually, these qualitative data are gathered through methods like interviews, focus groups, and observations, revealing how green infrastructure impacts quality of life, social inclusion, and environmental sustainability [14]. However, the data available in many countries remain limited in quality, often arrive too late, and, when accessible, tend to inadequately address key issues. Good decision making requires more timely, integrated, diverse, and trustworthy information. Equipped with effective decision making, companies, public and private institutions, and individuals can make choices that serve both their own interests and the well-being of the environment [15].
Growing populations, climate change, and resource constraints make urban challenges more multifaceted, and in the face of this new complexity, new data gathering and management solutions are required. Opinion mining is a promising approach that can help address these issues. Many researchers [16,17,18] believe that words convey our emotions and interact with others and that words are a written or spoken representation of our thoughts.
Although many authors utilize big data, BIM-based approaches, AI-driven methods, and other advanced technologies, opinion mining remains a rarely employed solution. Opinion mining can be attractive for developing nations or smaller cities, where often only limited data are available, and as a tool, it can equip stakeholders with the ability to make proactive and preemptive decisions related to green infrastructure. Google data can help decision makers overcome the data shortage and completeness problems they face working with traditional sources of green infrastructure data.
Accordingly, one of the objectives of the present research is to propose an innovative Google-based opinion mining method for analyzing the attractiveness of green infrastructure, hereafter referred to as the GREEN method. The GREEN method is based on collecting stakeholders’ opinions and contextual data and on their integrated analysis to identify key ideas, significant trends and insights, and hidden associations related to green infrastructure.
This study raises the following research questions:
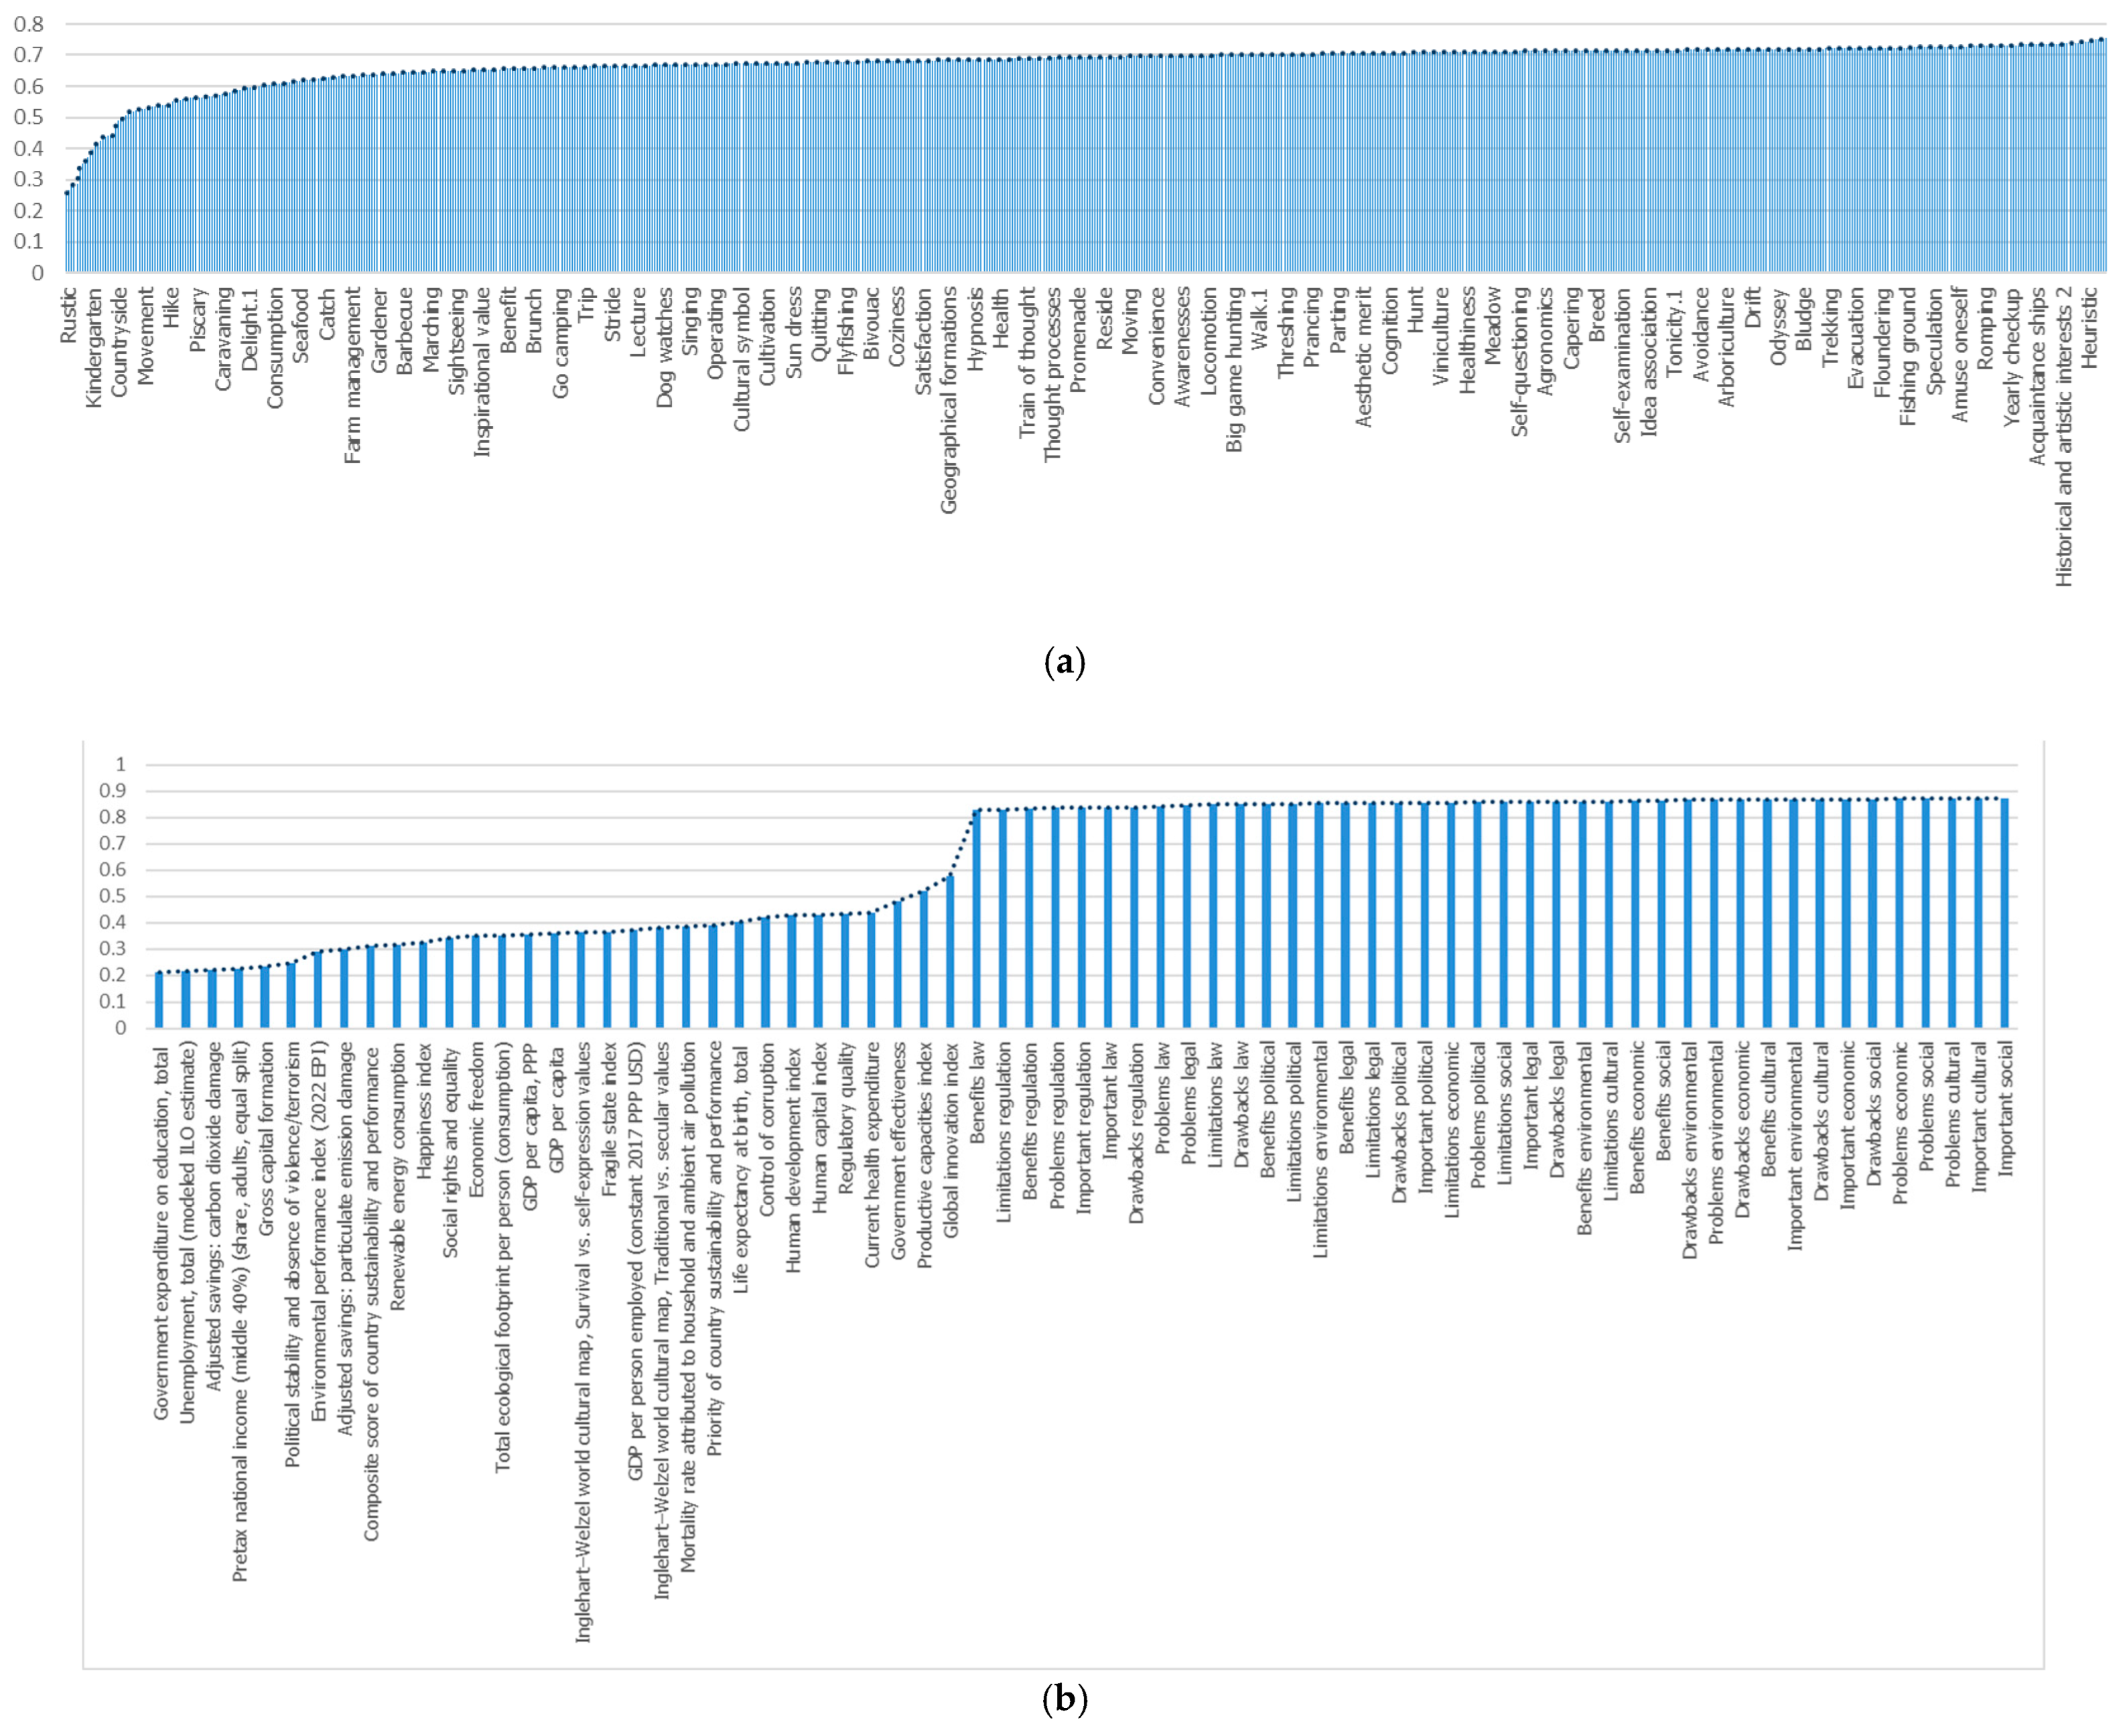
  • What are the most commonly used keywords related to green infrastructure on Google?
  • How is the attractiveness of green infrastructure related to micro-, meso-, and macro-environmental indicators?
  • How can opinion mining be used to predict how often people use words related to the attractiveness of green infrastructure in their online communication?
  • How well do opinion mining models perform across different countries and cities?
Moreover, in the development of green infrastructure, construction waste management must be taken into account. Innovative approaches to waste management are discussed in the following section.

1.2. Construction Waste Management Tools

Human activity generates significant waste related to agriculture, building and demolition, industry and commerce, and healthcare. This waste is generated by companies, hospitals, building sites, and farms. Unregulated waste crosses geopolitical and ecological boundaries. Emissions from burning and open waste dumping are deposited in terrestrial and aquatic ecosystems and the atmosphere, and they are transported via waterways within and between nations [19].
Globally, there has been an increase in construction and demolition (CD) waste as a direct result of fast urbanization. Effective CD waste management is essential to minimizing the negative environmental effects of CD waste, as it is estimated that 35% of this waste is put into landfills worldwide [20].
Minimizing waste production is essential for the advancement of eco-friendly infrastructure. If waste continues to be produced, it becomes necessary to discover methods to reuse the waste materials. If this cannot be done, then it becomes necessary to collect the materials for recycling and disposal, which is the last step in handling CD waste [21]. According to Pickin et al. [22], there are a number of advantages of decreasing waste, including earning money from gathering certain items, cutting expenses by buying fewer materials, lowering CO2 emissions, and lowering the cost of transporting waste to a landfill. The majority of CD waste can be recycled following demolition. Reduction and reuse are the best tactics to conserve natural resources, protect the environment, and cut costs. The reuse of building waste minimizes greenhouse gas emissions, which contribute to climate change; helps to preserve the environment for future generations; and extends the useful life of items [23].
Regrettably, most stakeholders in the construction sector have focused primarily on profit and have not given sufficient consideration to waste management aspects [24]. Clients are reluctant to select effective CD waste management strategies without taking profitability into account, since many firms’ primary goal is to maximize profits [25].
Lu et al. [26] examined the modeling of waste-handling processes in construction. A particular focus of their research is simulating and mapping out the waste-sorting processes happening on site. In the context of waste-handling process modeling for construction sites, mapping techniques have been shown to be linked to simulation techniques, and a “dynamic” operations simulation model can be created by using the process flowchart resulting from the mapping technique as a convenient model input [26].
The societal impact of people’s readiness to change their behavior and beliefs concerning the generation, collection, and disposal of construction waste has been examined. From a social perspective, the dedication and involvement of construction stakeholders are seen as significant drivers of construction waste management [27,28].
In terms of waste management, there are significant differences between developing and developed nations. These differences include a dedication to carbon policies, advances in waste recycling technologies and tools, programs to help stakeholders change their perspectives on better waste management, the implementation of the circular economy, the construction of additional waste recycling facilities in both urban and rural areas, and the development of markets for recycled goods and materials. Additionally, developing nations face challenges related to inadequate and imprecise data on waste generation, reuse, recycling, and the rate of diversion from landfills [20].
Velis [29] applied univariate non-linear regression and multivariate random forest (a machine learning model) to identify converging best-fit models of cities’ performances in the area of municipal solid waste for many diverse explanatory socio-economic variables. The most alarming aspect is that if cities follow the course of business as usual, their waste generation per capita would substantially increase, unless they promote decoupling by introducing new policies [29].
Xu et al. [30] proposed a prediction model to estimate urban waste on the basis of details such as the number of income earners, personal income, estimated resident population, population density, and land values. Their regression analysis showed that organic, residual, and recyclable waste tonnage is significantly linked to population changes and also shows a minor link with land values. The prediction model of the aforementioned metrics is a valuable tool for decision makers and practitioners, and it can be used to estimate urban waste and track trends in urban waste generation rates and streams.
Singh and Uppaluri [31] focused on examining the extent to which socio-economic and demographic parameters are important in the fair forecasting and prediction of municipal solid-waste streams. Using the case of Guwahati in the Indian state of Assam, they mapped solid-waste volumes at the municipal level, along with demographic and socio-economic variables for the city, and applied tree-based machine learning algorithms (gradient boosting, decision tree, and random forest) to build machine learning models with a data size of 1936 [31].
Tian et al. [32] made use of forecasting models to present the grey artificial neural network, which is a hybrid model designed to forecast the generation of waste electronic and electrical equipment (WEEE) in 31 province-level regions across China. They also used Pearson correlation analysis to examine seven types of WEEE from a socio-economic perspective. Based on their findings, more than 70% of WEEE from province-level regions showed a strong correlation with the GDP (Gross Domestic Product) (R > ±0.8) and the population, whereas the correlation in some top province-level regions generating WEEE (i.e., Shanghai and Tianjin) was weak or moderate.
Only the effective management of municipal solid waste can ensure environmental protection, economic benefits, good public health, and the generation of clean energy for future commercial needs. Efficiency is, however, hindered by challenges related to predictive maintenance, automated sorting systems, real-time monitoring, optimized collection routes, and public engagement and education. Unsupervised, supervised, and reinforcement machine learning can be applied in various waste management processes. Tools based on machine learning can offer effective predictions of waste generation, create predictive maintenance systems, classify waste materials, design collection routes, forecast real-time filling rates in landfills, prevent illicit dumping, and detect operational issues. However, they will only lead to a sustainable waste management system if they are combined with other regulations, policies, and strategies [33].
Along with advanced waste management techniques, there is a need for both digital and physical infrastructures where reused materials can be viewed and ordered. Systems for aligning supply with demand are necessary to link sources of surplus materials and reusable products with potential users. This alignment can be facilitated through the creation of storage facilities and digital platforms for reuse [34]. Therefore, the second objective of this research is to develop the Construction Material Reuse Optimization Portal.
The following research questions were raised:
  • How can a digital portal optimize the matching process between supply and demand of reused construction materials?
  • How can a digital portal be designed to recommend the most rational reused construction materials to customers based on economic, distance, time, quality, environmental, and other relevant criteria?

2. Materials and Methods

The present study uses regression, correlation, and multiple-criteria analysis techniques; Google Search; and neural networks to deliver timely evidence-based information about green infrastructure and construction material reuse optimization. The subsequent sections describe the methods employed for green infrastructure opinion mining and the development of the Construction Material Reuse Optimization Portal.

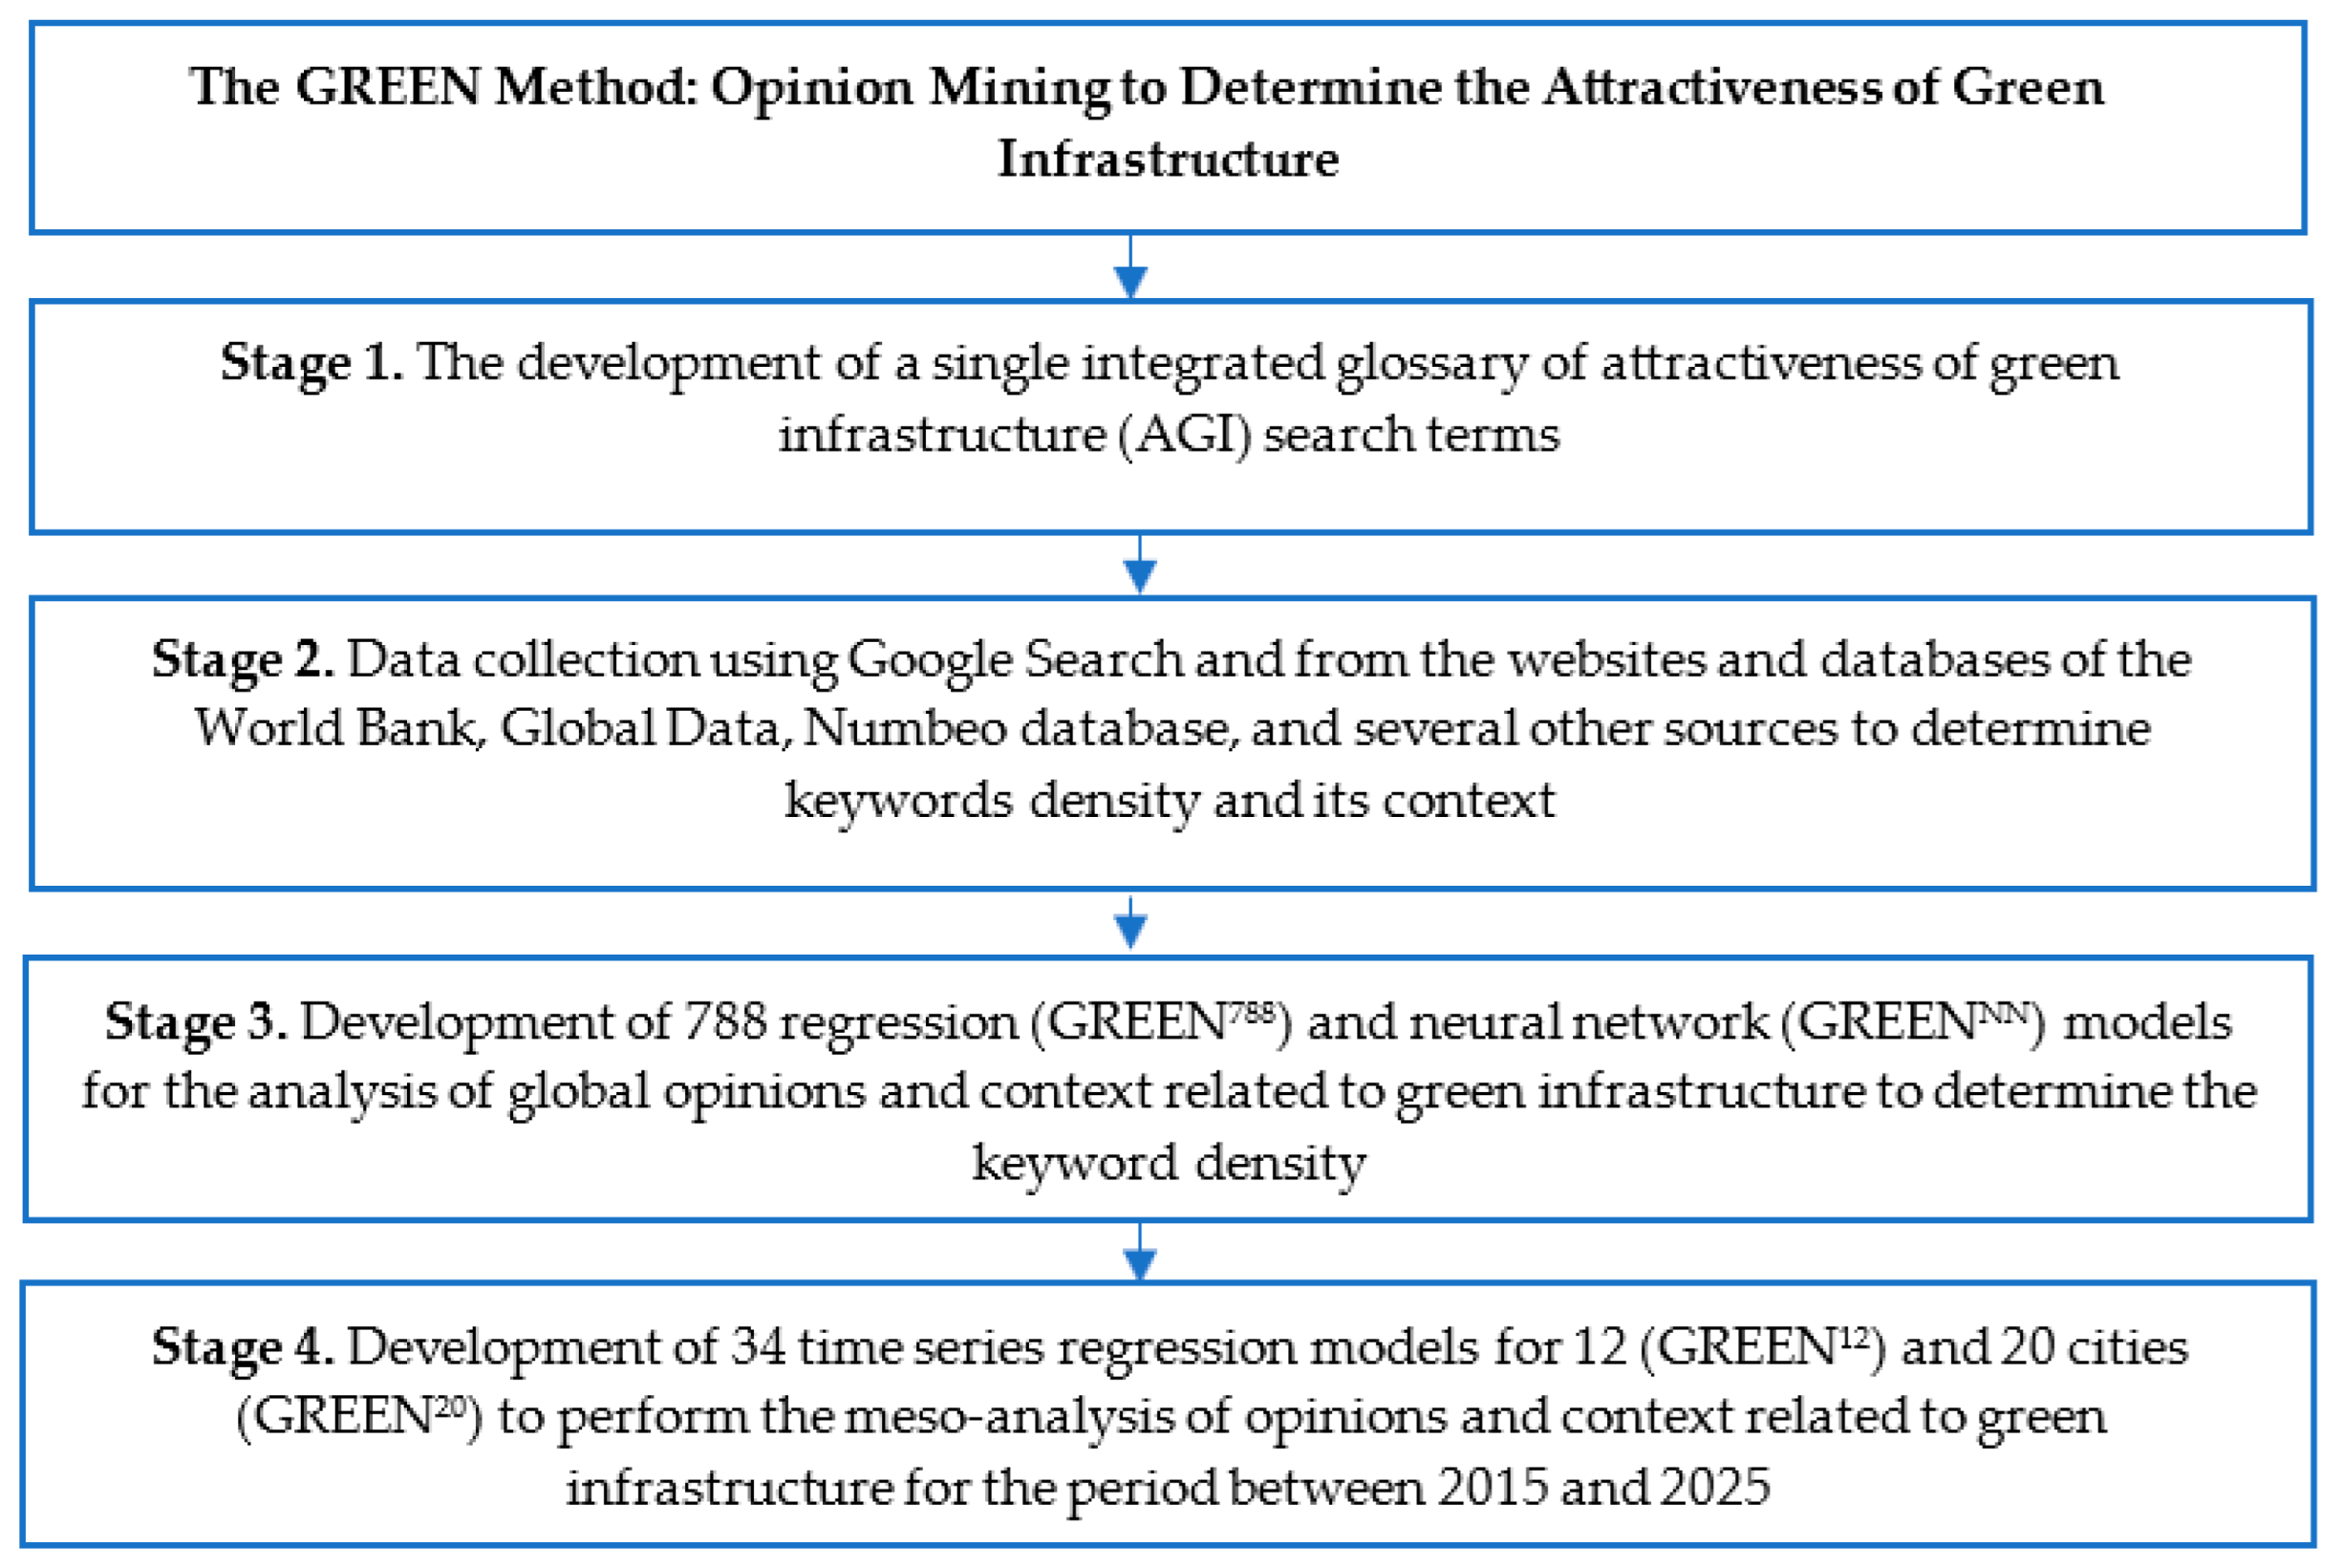
2.1. The GREEN Method: Opinion Mining to Determine the Attractiveness of Green Infrastructure

The opinion mining (GREEN) method includes the following four stages: (1) the development of a single integrated glossary of attractiveness of green infrastructure (AGI) search terms (Table S1a); (2) data collection using Google Search (Tables S1a, S2a and S3a) and from the websites and databases of the World Bank, Global Data, Numbeo database, and several other sources (Tables S1b, S2b and S3b) to determine the keyword density and its context; (3) the development of 788 regression (Table S1c, GREEN788) and neural network (Table S1e, GREENNN) models for the analysis of global opinions and context related to green infrastructure; and (4) the development of 34 time-series regression models for 12 (GREEN12) and 20 cities (GREEN20) to perform the meso-analysis of opinions and context related to green infrastructure for the period between 2015 and 2025 (see Figure 2).
The analysis of the AGI and its contextual information can provide policymakers with more detailed and timely cost-effective information about green infrastructure and help them create evidence-based policies.
Glossary-based studies use predetermined lists of keywords, known as glossaries, to classify documents into specific groups by their tags [35]. People use keywords to express their thoughts. A greater density of green infrastructure keywords in online texts shows that they are more closely linked with the research subject. Based on this assumption, a green infrastructure glossary was developed. Any terms specific to a single country and lacking international recognition were removed from the glossary.
Between 3 and 28 March 2025, the Google Keywords Analysis (GEKA) system, developed by the authors, was applied to collect density data from Google Search and, in this way, examine online information related to the attractiveness of green infrastructure (Tables S1a, S2a and S3a). The GEKA system uses Google Search API services to collect cost-effective data for rapid responses. These techniques enable users to connect with a large audience at a low cost. Countries can use the GREEN models based on “bag of words” and multi-criteria analysis to monitor the status of their green building and civil and urban infrastructures. They can keep track of the status on a monthly and annual basis. Equipped with the quantitative information provided by the smart system, which could “measure” the progress and detect the differences, decision makers could choose ways to improve the green infrastructure further.
The GREEN models are based on crowdsourcing. Crowdsourcing sentiment refers to the practice of gathering and analyzing public opinion on a specific topic, often through a large group of people (“the crowd”) rather than relying on a small expert group. This approach leverages the collective intelligence of many individuals to understand the general sentiment or emotional tone associated with a particular subject [36].
Google employs Site Reliability Engineering (SRE) practices to ensure the availability, latency, performance, capacity, and reliability of its services, including search [37]. Google’s sophisticated algorithms and ongoing efforts are designed to demote, filter, and provide context around such content, aiming to prioritize and present the most reliable and relevant information to users [38,39,40,41].
Data quality, in the context of Google’s search and data analysis tools, refers to the accuracy, completeness, and reliability of the data being utilized. It encompasses how effectively search results align with user queries, the extent to which data meet analytical expectations, and the overall trustworthiness of the data for informed decision making. Google employs a range of methods to evaluate and enhance data quality, including quality scores for advertisements, data quality dashboards for AI applications, and tools for scanning and assessing data quality within BigQuery API version 2.47.0 [42,43,44].
Google analyzes a group of duplicate URLs and chooses a canonical URL. The canonical URL is the most representative version of that page. Duplicate URLs are not usually shown in the search results [45]. False or incorrect search results on Google can stem from several issues, including spammy AI-generated content, inaccurate information, or even problems with a user’s browser or Internet connection. Users can report issues to Google, clear browser data, and troubleshoot their network to address these problems [46].
Considering ethics, Google, as a dominant force in the search engine landscape, grapples with open data ethics through a multifaceted approach, emphasizing principles of privacy, transparency, control, and responsible innovation [47]. The textual content of the individual search results was neither examined nor disclosed.
The created system used open data sources collected by Google’s search engine. During the research, Google’s search ethics were not violated when collecting keyword densities. The research shows the reproducibility of data and models concerning stakeholder opinion data, indicating that reliable results were obtained when using the same methods and approaches on the density data of keywords. It ensures that the outcomes of a stakeholder’s opinion study can be verified by others using the same techniques. Google’s data are growing, so the data may change over time.
The GEKA system has been designed to use the Google Search API and filter data by content type, date, language, and location to collect relevant and accurate data and information on the attractiveness of green infrastructure. This study aimed to determine how popular 788 green infrastructure terms are across 94 countries, 20 cities, and globally.
The sample included data found on Google Search using the following settings: terms appearing “anywhere in the page”, time period “anytime”, and document type “any”. This study examined selected exact-word combinations of AGI keywords, the topic “green infrastructure”, and a specific country; these items were combined as indicators to assess text density data found on Google Search. In addition, this study used the databases and websites of the World Bank, Numbeo database, Global Data, and several other sources as data sources (Tables S1b, S2b and S3b).
The relationship between the 788 AGI keywords’ density and its context (71 macro-environment metrics in 94 nations), as well as the interaction between 20 cities and their 22 context indicators was examined by creating 788 global (GREEN788 and GREENNN) and 34 city-level (GREEN12 and GREEN20) models for the world and separate cities.
The sample of countries selected for this research was divided into two groups: a control group of 77 countries that correspond to the countries included in the 2020 Inglehart–Welzel Cultural Map of the World and an experimental group of 17 countries not analyzed using the Inglehart map.
The GREEN models were examined by applying the feed-forward perceptron neural networks. Python’s scikit-learn version 1.6.1 library was used to analyze and identify the relationship between context-independent variables and the dependent variable (word count). Built using the Keras library in Python, the neural network consists of three main layers: an input layer that uses a rectified linear activation function (ReLU), two hidden layers (one with 50 neurons and the other with 7), and an output layer. Non-linearity was introduced in the hidden layers using the ReLU. We used the Adam optimizer to train the network, with the binary cross-entropy loss function applied for guiding, and used 71 context variables as our input data. Two input variables (the density of 788 AGI keywords (Table S1a) and 71 context indicators (Table S1b) for 94 countries) were used in the research to create the neural networks. From the input layer, data are fed to two hidden layers, which then feed them to the output layer. The neural network was used to analyze macro-environment indicators (71 inputs were used in total) and predict how often people use words related to the attractiveness of green infrastructure in their online communication.
The Keras library in Python was used to build a neural network with two hidden layers, one containing 50 neurons and the other containing 7 neurons. The ReLU (Python version 1.7) was used in the hidden layers to introduce non-linearity. Thirty-two context variables were input data. The network was trained using the Adam optimizer and also the binary cross-entropy loss function as a guide.
A total of 788 global regression and neural network GREEN models were created. For training and testing, our database was split into two subsets at a ratio of 70:30. The network was trained using an optimal batch size (=20) and epochs (=50). This means feeding the neural network 20 rows of data at a time to establish the gradient before updating the parameters and using the entire database 50 times to update the model. After its training, the model was tested, and a batch of predictive data was produced.
The performance of the 788 global neural network GREEN models was assessed using evaluation metrics, which included the coefficient of determination (R-squared that can take a value between 0 and 1), the mean absolute error (MAE), the mean squared error (MSE), and the root mean squared error (RMSE).
A higher R-squared value implies that the model more effectively captures the variability within the data [48]. Ozili [49] has pointed out that in social science research, an R-squared between 0.10 and 0.50 (in other words, between 10% and 50%) is acceptable when some or most of the explanatory variables are statistically significant. Different stakeholders have and pursue different personalized goals, which are expressed in detail through a specific “bag of words”. Google opinion analytics is performed based on the “bag of words” determined by these stakeholders. The research shows that the accuracy of the created models (R2 = 0.511–0.997) meets the requirements for social research.
The mean squared error (MSE) can take a value between 0 and +∞ (where 0 indicates a complete match), and it measures the mean error size between the actual and predicted values. This indicator shows the mean squared deviation of two values. A lower value indicates a higher accuracy for a prediction model. Zero, then, would be an ideal value and indicate a perfect model. The root mean squared error (RMSE) is the square root of the MSE. Models with low RMSE values give more accurate predictions and match the data better [48]. The mean absolute error (MAE) shows the mean error size by measuring the mean absolute difference between the predicted values and the actual values [50].
The evaluation metrics of the 788 green infrastructure keywords’ regression (GREEN778) models—(1) R-squared and its p-values, (2) β and (3) its p-values, (4) standardized β, and (5) sensitivity coefficients—were analyzed.
The key values of the 34 green infrastructure keywords’ regression models (R-squared and its p-values, β and its p-values, standardized β, and sensitivity coefficients) for 20 (GREEN20 models) and 12 (GREEN12 models) cities for the period between 2015 and 2025 were calculated.
The correlations and statistically significant relationships between context indicators and the density of AGI words for 34 GREEN models are provided in Tables S2d and S3d. Tables S2d1 and S3d1 show the correlations between the density of each keyword and city indicators. Tables S2d2 and S3d2 show the p-values of the original models using the Pearson correlation, a measure of the significance of correlation analysis. Tables S2d3 and S3d3 show the statistically significant correlations between city indicators and the density of AGI words. Tables S4 and S5 display the evaluation metrics of the 34 green infrastructure keywords’ Munich and London regression models accordingly: (1) R-squared and its p-values, (2) β and its (3) p-values, (4) standardized β, and (5) sensitivity coefficients for the period between 2015 and 2025.
The analysis revealed which green infrastructure topics are the most important to the analyzed cities and examined the effect city indicators have on the topics.

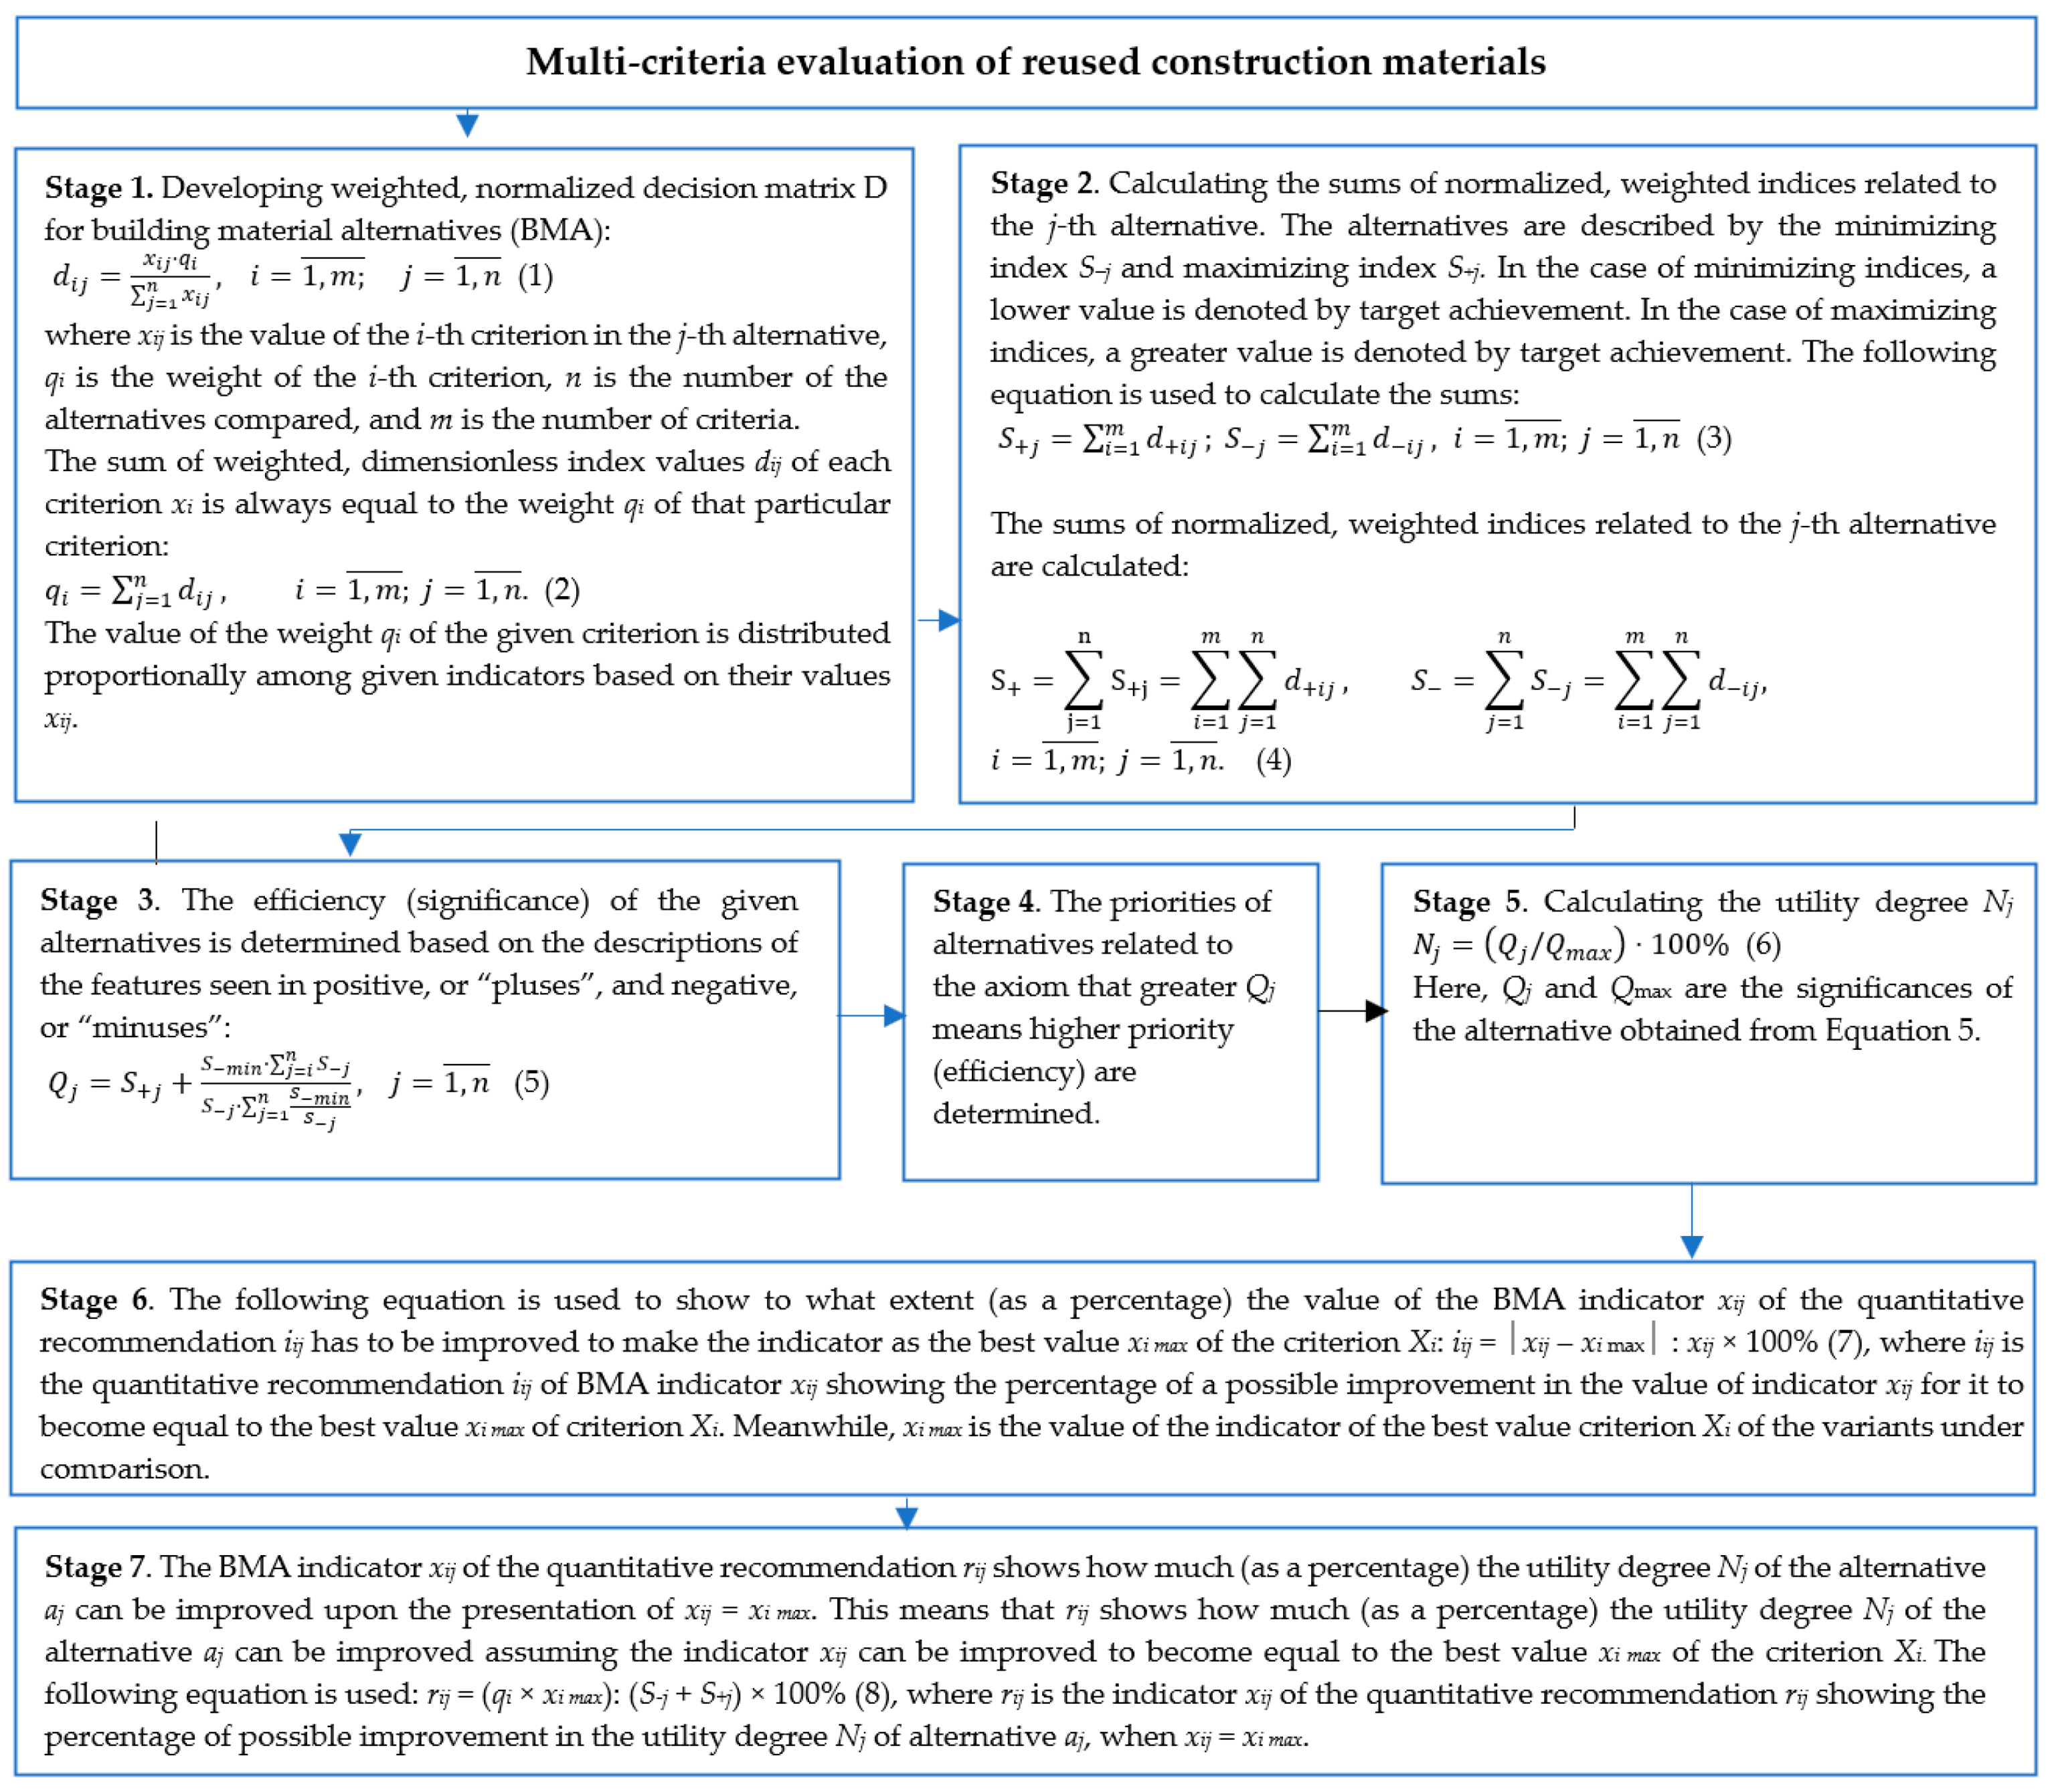
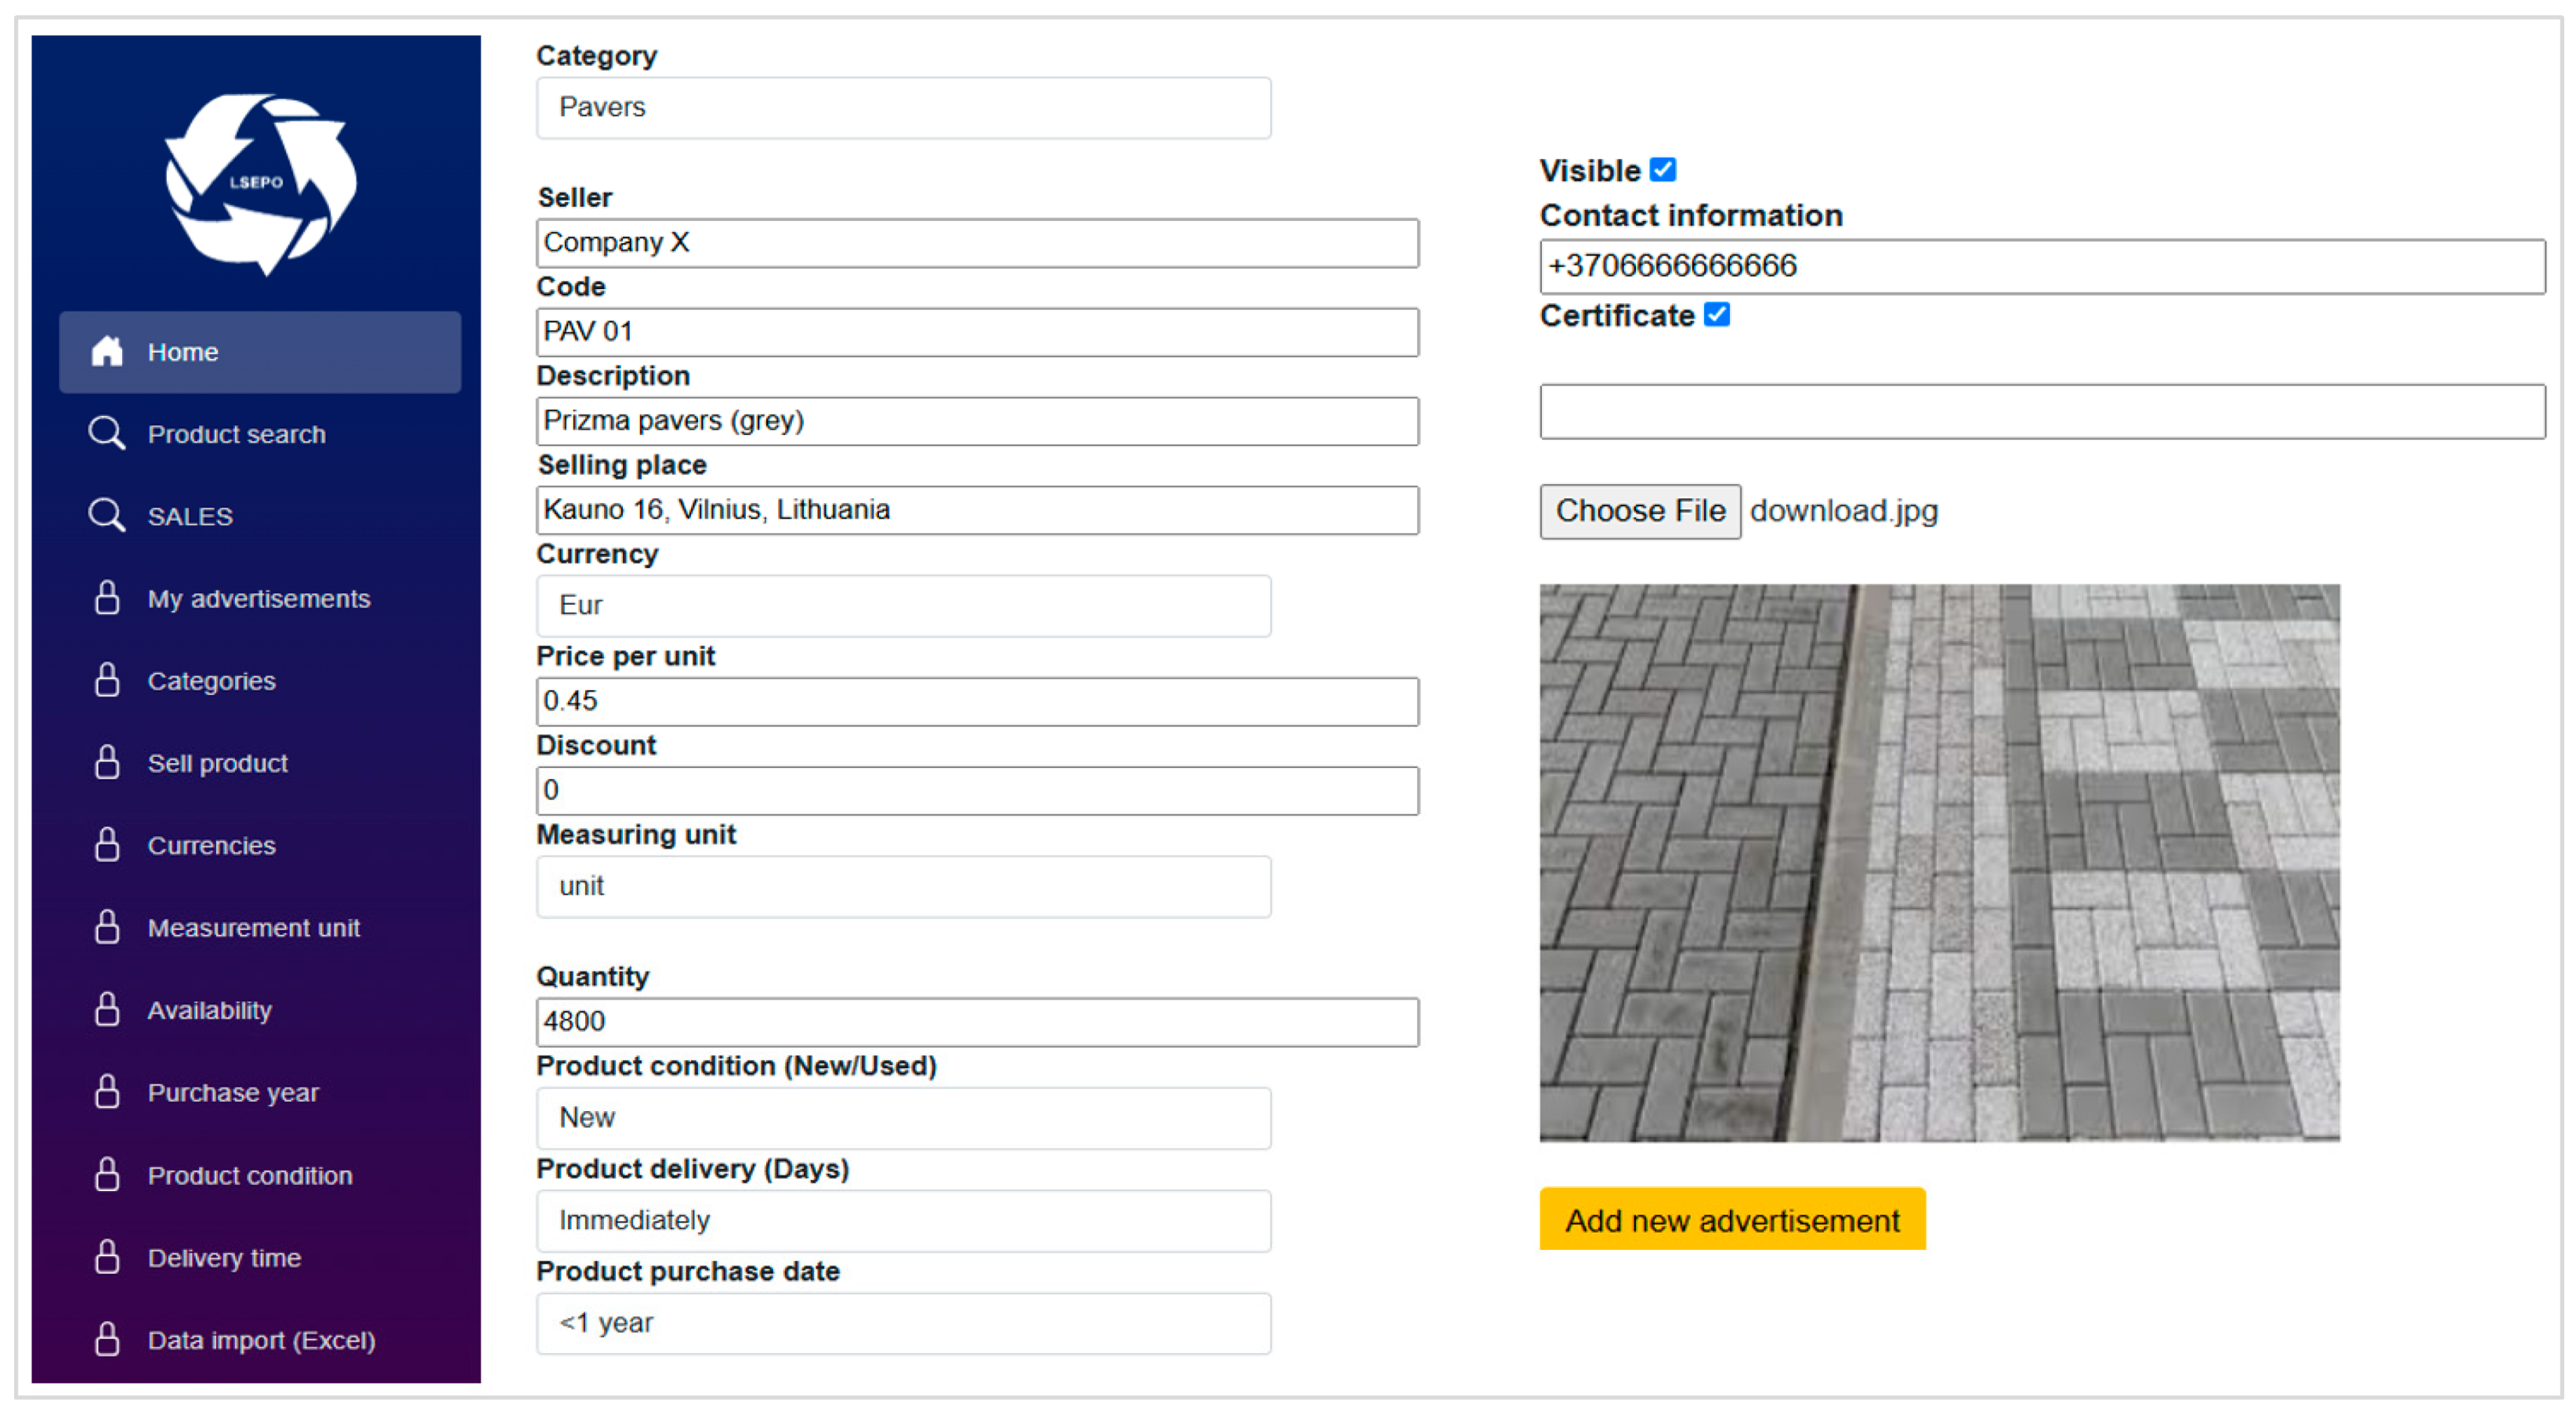
2.2. Construction Material Reuse Optimization (SOLUTION) Portal

As it was discussed in Section 1, one of the significant solutions in green infrastructure development is the reuse of construction waste. The proposed SOLUTION Portal is an open, co-creative, real-time collaborative platform that enables users—the construction industry, landfills, selling companies, individual sellers, and customers—to exchange and reuse construction materials.
Multiple stakeholders (clients, users, designers, contractors, suppliers, facility managers, and municipalities) with different goals, capacities, education, and experience take part in the process of construction material reuse. These stakeholder groups thus usually come to the decision-making process with differing views. A description of any considered alternatives using economic, technical, technological, environmental, aesthetic, and other information is often essential to obtain a comprehensive picture and reach an efficient middle-ground decision. Users need to receive this information in an easy-to-understand form.
The SOLUTION Portal can provide the information needed for decision making, such as numbers, texts, graphical representations, images, videos, etc. Numerical information, for instance, allows the user to see a comprehensive set of criteria describing the options and the measuring units, values, and weights. Information provided as text includes the conceptual descriptions of alternatives and their comprehensive criteria, the rationale and basis behind specific criteria weights and values.
Thus, a decision maker can use the SOLUTION Portal to obtain comprehensive and versatile quantitative and qualitative information on construction materials for reuse available in the database, use the model base to perform a flexible analysis of the factors, and make a purchasing decision.
The SOLUTION Portal database includes the following tables:
  • Input data tables: These provide general information about the proposed reused construction materials.
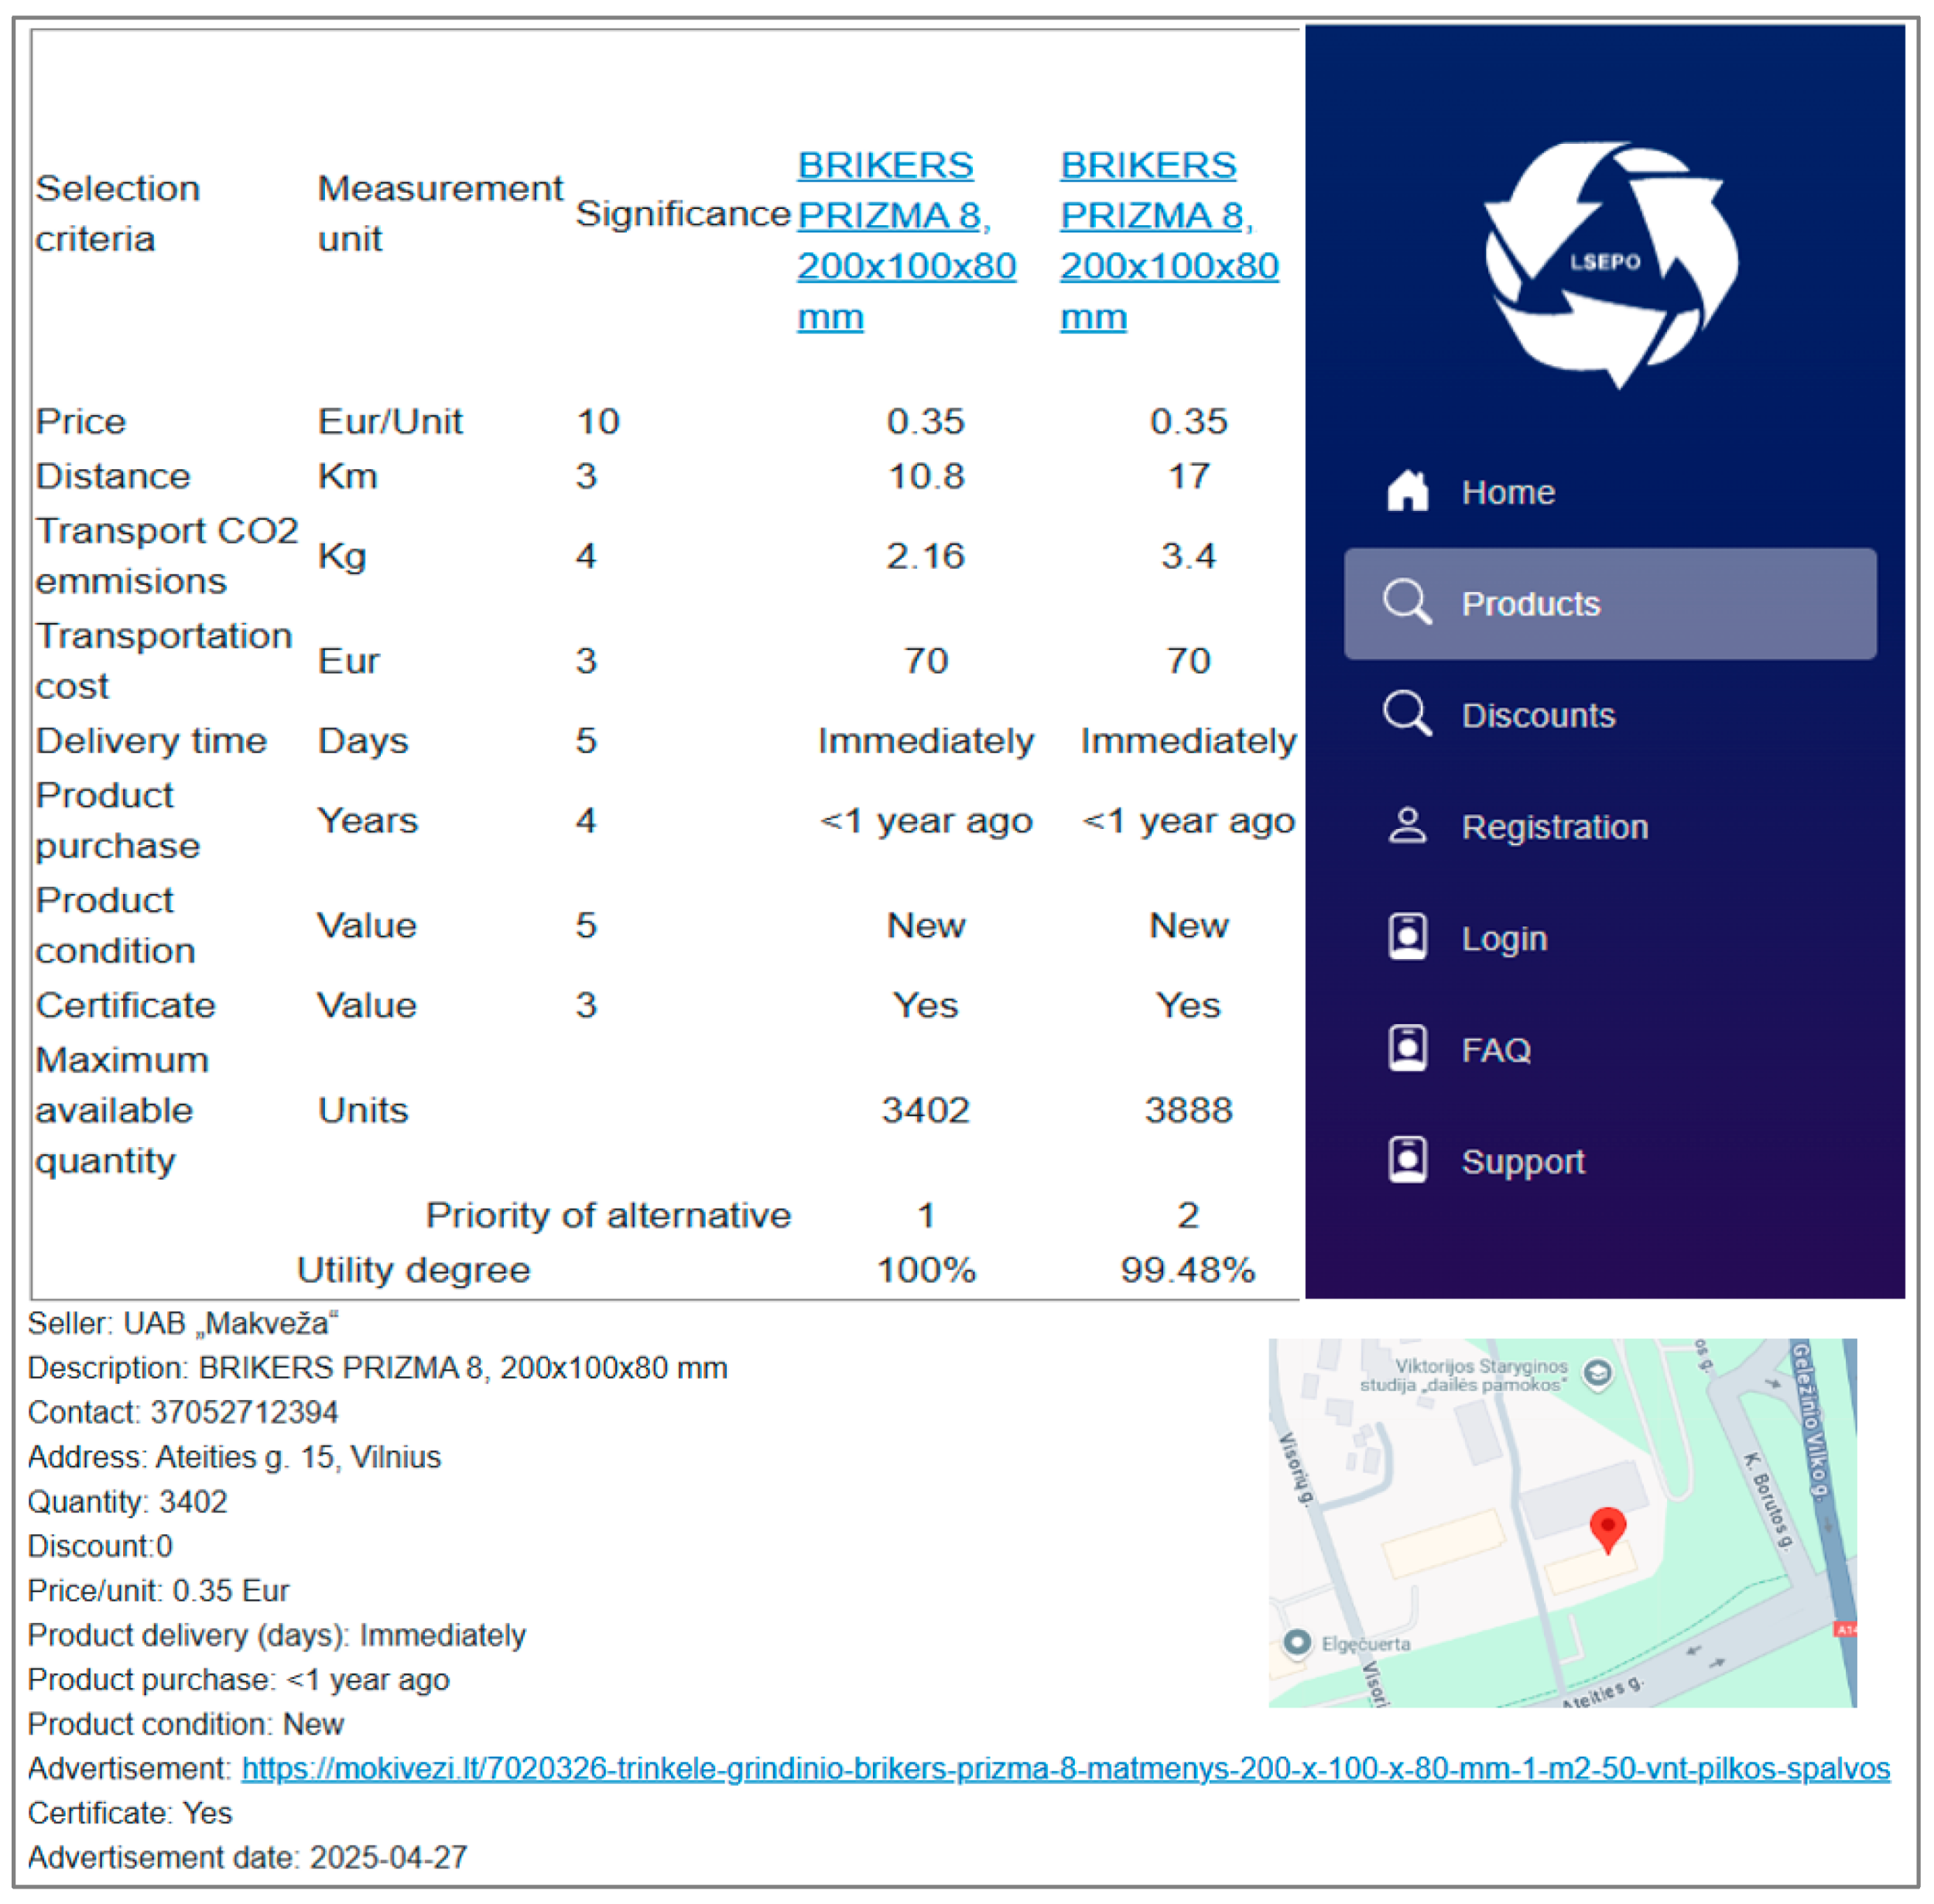
  • Construction materials assessment tables: These provide quantitative and conceptual information about alternative options of reused construction materials.
  • Multi-criteria and multivariate design tables: These include quantitative and conceptual information on links between the reused construction materials, their compatibility, and possible combinations.
The examination of possible alternative solutions is an essential step to make sure that the purchased reused construction materials will be efficient. Before turning to the automated multivariate design of reused construction materials considered for purchase, tables covering the links, compatibility, combinations, and multivariate design of the elements and solutions have to be created. All options are checked to see whether or not they meet the requirements. Any option that fails to meet the requirements is discarded. The multivariate design of reused construction materials faces the issue of criteria weight compatibility. In this kind of integrated assessment of alternatives, the weight of a specific criterion depends on the full set of examined criteria and on their values and initial weights.
The efficiency of reused construction material alternatives is often considered from economic, aesthetic, technical, technological, comfort, environmental, and other perspectives, and the SOLUTION Portal therefore uses the models that can help decision makers perform an integrated analysis of the options and reach a decision. The following base models perform this function in the SOLUTION Portal:
  • The alternative option generation model for reused construction materials;
  • The initial criteria-weight-setting model (using expert assessment methods);
  • The criteria-weight-setting model;
  • The multivariate design model for reused construction materials;
  • The multiple-criteria analysis and priority-setting model for reused construction materials;
  • The utility-degree-setting model for reused construction materials [33];
  • The recommender model.
The portal uses its models in its automatic process to generate alternative reused construction material options, perform multiple-criteria analysis, determine the utility degree, and select the most efficient options. The model base management system is used to run different models of the user’s choice. The model base management system facilitates the process, where the outputs produced by certain models (those for initial criteria weight setting) are used as the inputs in other models (those for reused construction material multivariate design and for multiple-criteria analysis), which then produce outputs that are used, in turn, as the inputs in yet other models (utility-degree calculation models and recommender models).
The methodology is based on the methods, previously developed by the authors of the present paper, namely Complex Proportional Assessment of Alternatives (COPRAS), the multivariate analysis method, and the utility degree evaluation method. These methods, including mathematical formulations, are described in previous publications [51,52,53,54,55].
The stages of multi-criteria analysis are summarized in Figure 3.

3. Results and Discussion

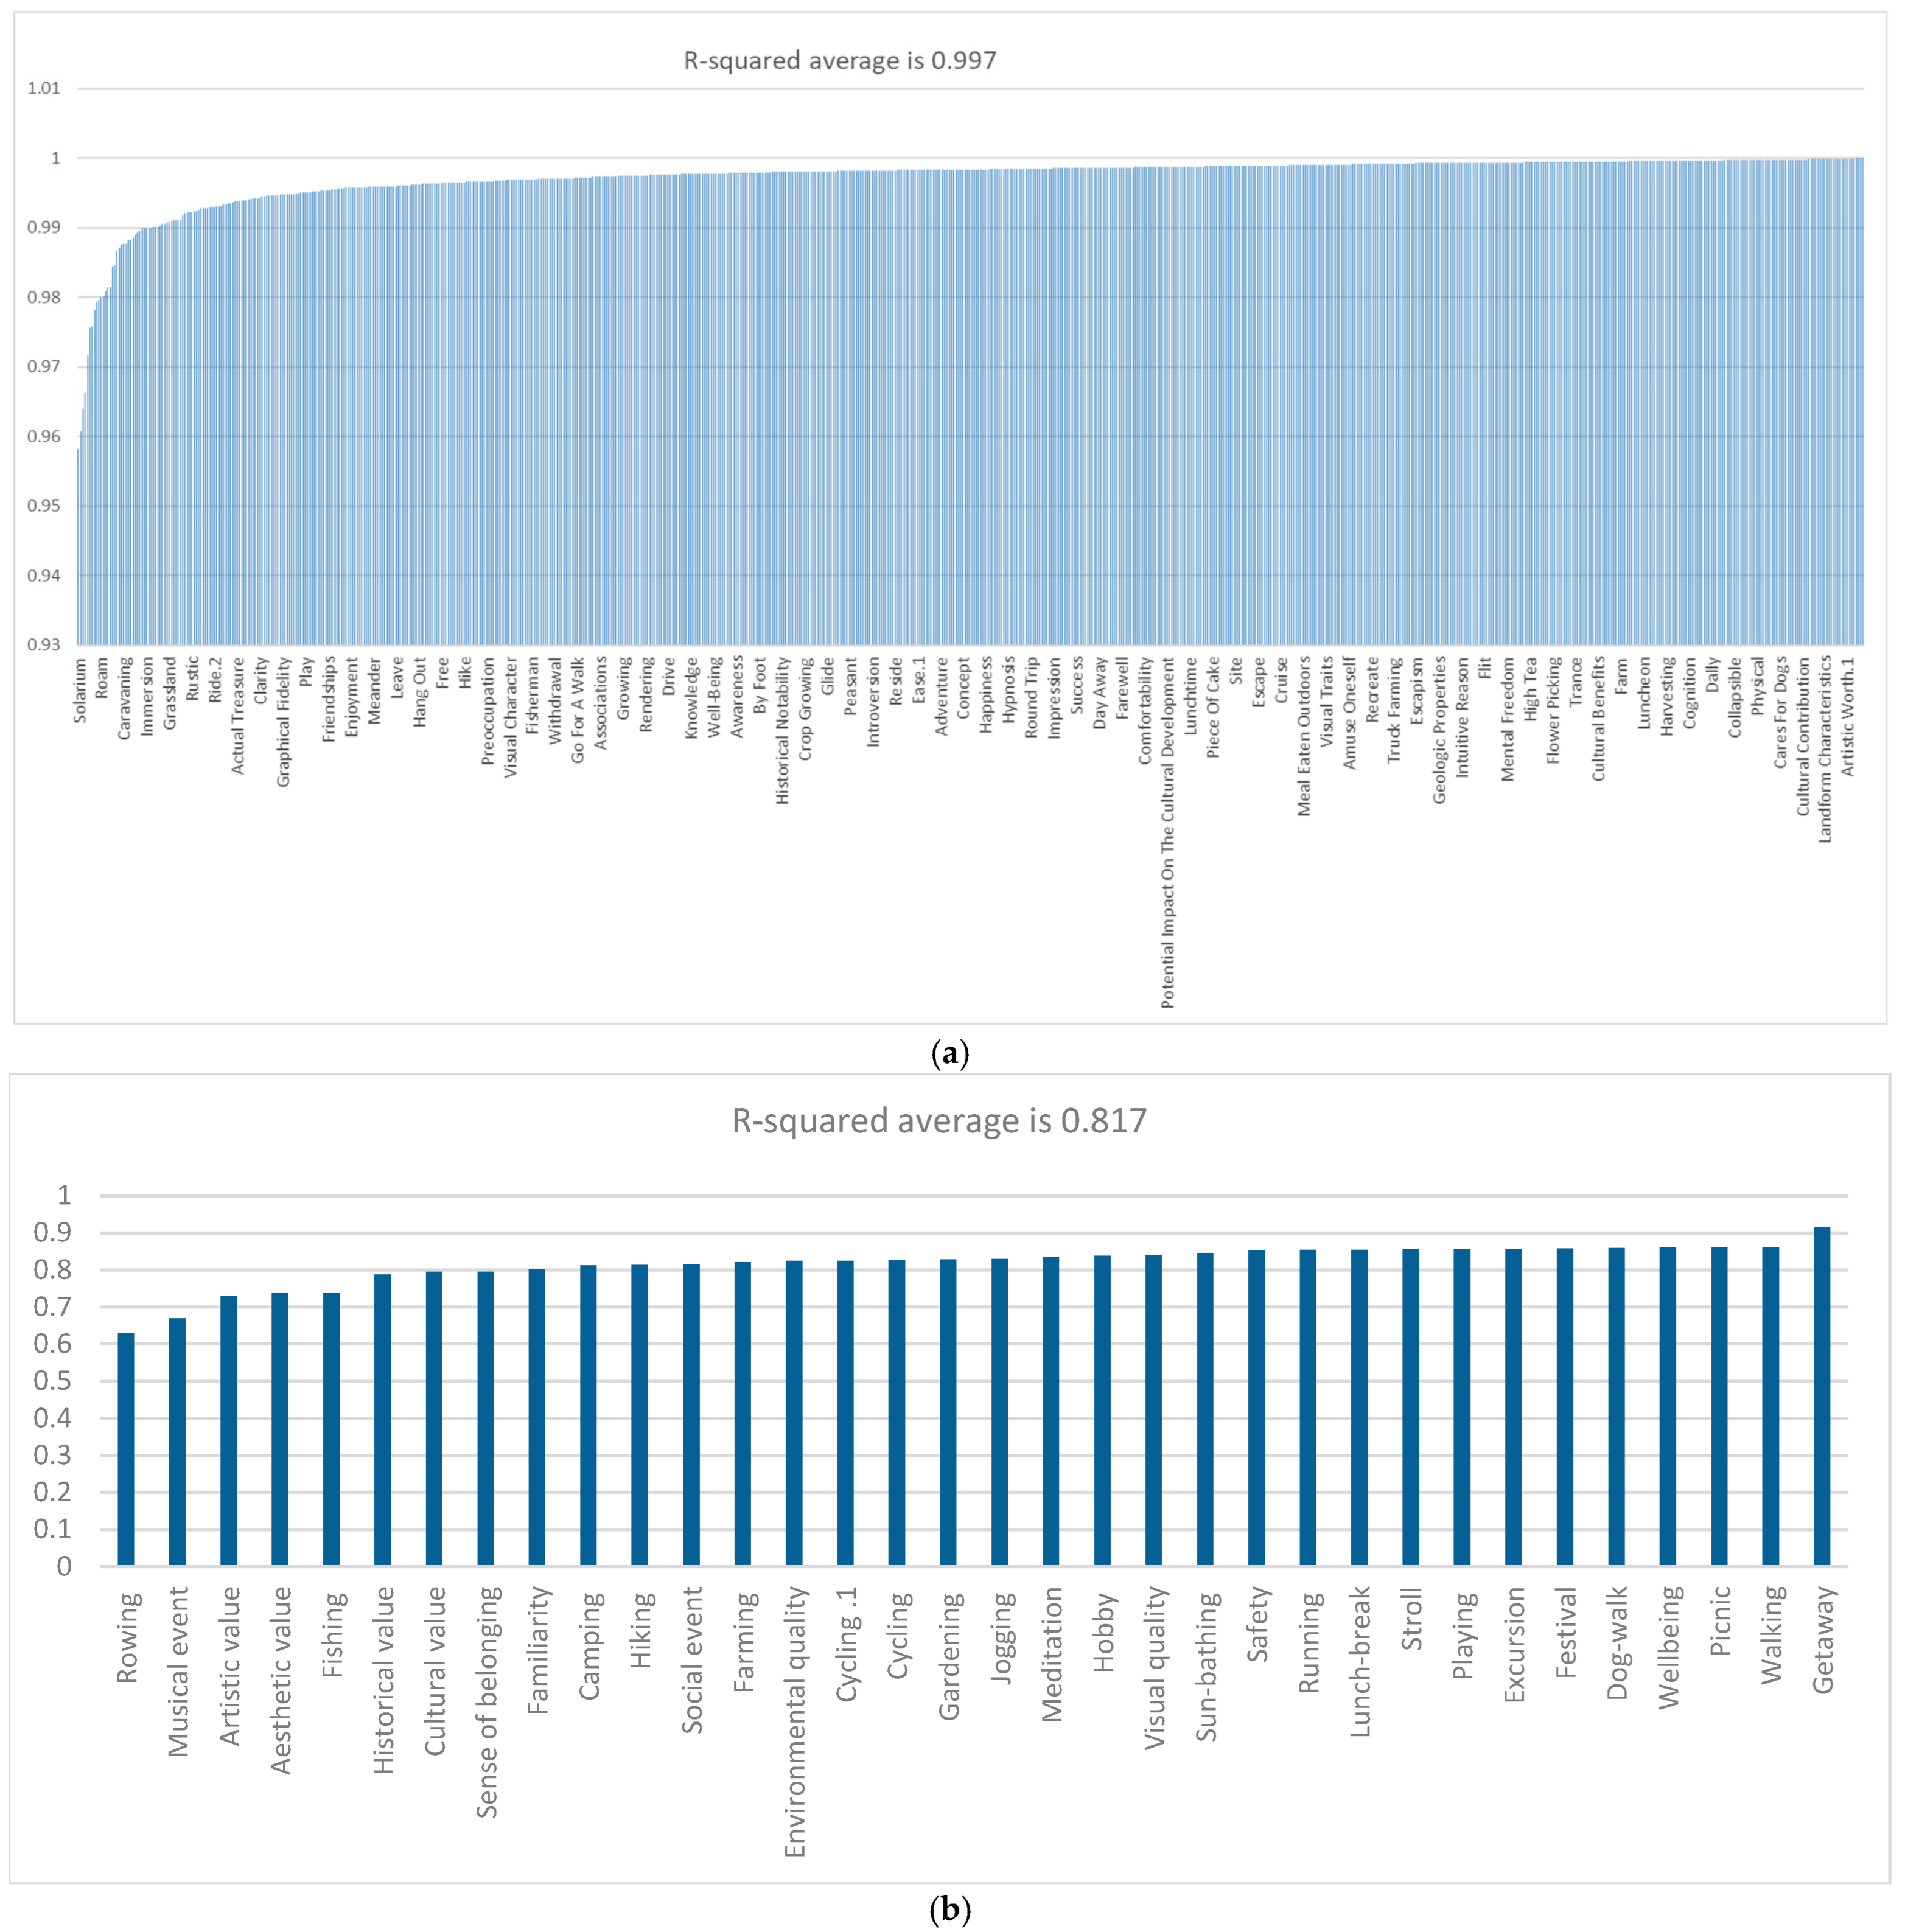
3.1. Attractiveness of Green Infrastructure

Table S1c1 displays the R-squared values (and their p-values) of the 788 green infrastructure keywords’ original GREEN788 regression models. Figure 4a presents the 788 GREEN788 models’ R-squared values (Figure 4a, R2 = 0.997). These values indicate that the GREEN models offer precise predictions and match the data appropriately. Table S1c2 shows the original regression models of the 788 green infrastructure keywords, with statistically significant variables (p < 0.05) highlighted in yellow. Table S1c3 shows the p-values of the variables from the original models. All context-independent model variables with a statistically non-significant effect on the dependent variable were removed, and modified models were created. Table S1c4 shows the modified GREEN788 regression models of the 788 green infrastructure keywords, with statistically significant variables (p < 0.05) highlighted in yellow.
It can be observed that the variation of verbal macro-environment independent variables explains changes in the word density of dependent variables more effectively than changes in statistical indicators. Figure 5 shows that the mean R2 value of verbal variables (M = 0.9749; SD = 0.03292) is higher than the mean of statistical macro-environment indicators (M = 0.7056; SD = 0.0752).
The R-squared values of the independent verbal macro-environment variables are also distributed closer around the average than those of the statistical macro-environment variables. The combined use of verbal and statistical macro-environment variables in regression clearly shows the synergy of these variables in explaining the changes in the dependent variables of keyword density. Another indication is the average of this use (0.997) and low scattering of the values around the average (SD = 0.004).
Figure 5 shows the distribution of R-squared in the 788 GREEN788 models. The overall median of all R-squared values above 0.9 shows that the R-squared values of the 94-country indicators are strong. The statistical and verbal indicators of the countries may be assumed to be inter-related as indicated by their strong correlation (Figure 5). This can be explained by the inter-relationship between global indicators.
Each country’s macro-environment variable (an independent variable) included in the 788 modified GREEN788 models was used to calculate elasticity coefficients. The aim was to measure the effect that changes in the independent variables have on the dependent variable of the density of AGI keywords. Table S1c5 presents the results of these calculations and shows that a 1% increase in the indicators for the 94 countries, respectively, leads to an increased attractiveness of green infrastructure words; countries and cities with better sustainability and performance indicators use AGI words more often. Similar trends have been observed in city models.
The correlations and statistically significant relationships between 71 context indicators and the density of AGI words for 788 GREEN models are provided in Tables S1d. Table S1d1 show the correlations (raver = 0.611) between the density of each keyword and city indicators. Tables S1d2 show the p-values of the original models using the Pearson correlation, a measure of the significance of correlation analysis. Tables S1d3 and Figure 6 show the statistically significant correlations (raver = 0.676) between city indicators and the density of AGI words.
MAE, R-squared value, MSE, and RMSE (Table S1e) values were calculated to verify the global performance of the 788 GREENNN neural network models. The database was split, with 70% of the data used for training and 30% for testing, to calculate the R-squared, a measure of the overall accuracy of the GREENNN models that shows how well they match the actual data. The larger the value of R-squared, the higher the accuracy. The R-squared was calculated for each model to verify its suitability for high-quality predictions. The respective mean values of the R-squared, MAE, MSE, and RMSE metrics are 0.596, 8.107, 5.549, and 2.595 (Table S1e).
In Table S2c1, the R-squared values and p-values of the original regression models of 34 AGI keywords are shown for 20 cities and 6 metrics, and in Table S3c1, they are shown for 12 cities and 22 metrics (Figure 4b, R2 = 0.817), with any statistically significant variables (p < 0.05) highlighted in yellow. The original regression models of the 34 AGI keywords are shown in Tables S2c2 and S3c2 for 20 cities (GREEN20) and 12 cities (GREEN12), respectively, with any statistically significant variables (p < 0.05) highlighted in yellow. Tables S2c3 and S3c3 show the p-values for the variables from the original models covering 20 cities and 12 cities, respectively. Modified versions of the models were created by removing any context-independent model variables that had a statistically non-significant effect on the dependent variable. These modified regression models of the 34 AGI keywords are shown in Table S2c4 for 20 cities and in Table S3c4 for 12 cities. The statistically significant variables (p < 0.05) in the tables are highlighted in yellow.
Tables S4 and S5 present the evaluation metrics of the 34 green infrastructure keywords’ Munich (R2 aver = 0.801) and London (R2 aver = 0.817) regression models accordingly: (1) R-squared and its p-values, (2) β and its (3) p-values, (4) standardized β, and (5) sensitivity coefficients for the period between 2015 and 2025 (all statistically significant variables (p < 0.05) are highlighted in yellow). It shows the transferability of models between regions and that the models are globally applicable.
Tables S2d and S3d list the (1) correlations, (2) p-values, and (3) significant correlations between the density of each AGI keyword and the urban indicators of 20 and 12 cities, respectively. The significance of city variables was determined by analyzing the relationship between context variables and the density of AGI words. The mean significant correlation between 6 and 22 urban indicators and the density of 34 AGI words was analyzed in the models of 20 (Table S2d, GREEN20 models, r20 = 0.789) and 12 (Table S3d, GREEN12 models, r12 = 0.656) cities, respectively.
This analysis enabled the identification of the most important and statistically significant topics related to the attractiveness of green infrastructure in these cities, as well as an examination of the influence of city-specific indicators on the attractiveness of the identified topics. GREEN models show that improvements in country and city context indicators lead to the increased use of attractive green infrastructure terms.
Furthermore, the density of 788 green infrastructure keywords, 71 macro-environment indicators, and 22 meso-environment indicators was analyzed to build linear regression and neural network models. The models show that AGI keywords are linked with 71 performance and sustainability macro-indicators at the country level and 22 meso-indicators at the city level. The GREEN models show that improvements in performance and sustainability indicators at the country and city levels coincide with more frequent use of AGI keywords. Countries and cities with better context indicators have a greater density of AGI terms on Google Search.
By utilizing real-time Google data, stakeholders can predict the appeal of green infrastructure and related factors and activities such as the following:
  • Aesthetic value: visual quality, environmental quality, cultural/historical value, and artistic value;
  • Sense of belonging: safety, well-being, and familiarity;
  • Leisure: picnic, excursion, lunch break, meditation, getaway, stroll, walking, dog walking, and sunbathing;
  • Recreation: gardening, farming, flower picking, fishing, camping, and playing;
  • Sports: running, jogging, cycling, rowing, swimming, and hiking;
  • Events: hobby, festival, musical event, social event, and outdoor lessons.
In summary, opinion mining incorporates political, cultural, social, economic, and environmental indicators, assisting stakeholders in tackling economic and social inequalities in a forward-thinking manner. By applying opinion mining to forecast green infrastructure tendencies, policymakers could distribute capital more efficiently, improving the living standard of their citizens.
Today, it is usual for people to share their opinions, expressions, views, feelings, and emotional states online. This practice brings new challenges and opens up new opportunities for neural networks and the multiple-criteria and statistical analyses of opinions and sentiment. Studies analyze how thoughts are expressed through words [56] and become actions [57,58].
The results correspond to the findings of previous studies. Researchers [59,60,61] argue that macro- and meso-environment factors affect the attractiveness of green infrastructure. This phenomenon reflects a prevailing widespread trend in today’s world. The contributions of the GREEN method in the context of previous studies are provided in Figure 7.
The GEKA system and GREEN models have several advantages over similar tools. Nations hold vast quantities of big data that are continuously growing; nonetheless, we still encounter a lack of comprehensive data on green infrastructure. In many countries, data are either lacking or come too late, and when they are accessible, they often fail to cover specific issues with adequate detail. Decision makers facing issues with data scarcity and completeness from traditional green infrastructure sources can leverage Google data to tackle these challenges. The GREEN models created have shown high average reliability (R2 aver = 0.511–0.997). The GEKA system and GREEN models can help decision makers tackle the challenges of data shortages and completeness faced with traditional green infrastructure data sources.
Nevertheless, some limitations of the methodology can be mentioned, namely possible data delays, inadequate data coverage (even when the data are available, inadequate data for too many issues), insufficient data disaggregation, and reliance on guessing/instinctive judgment.

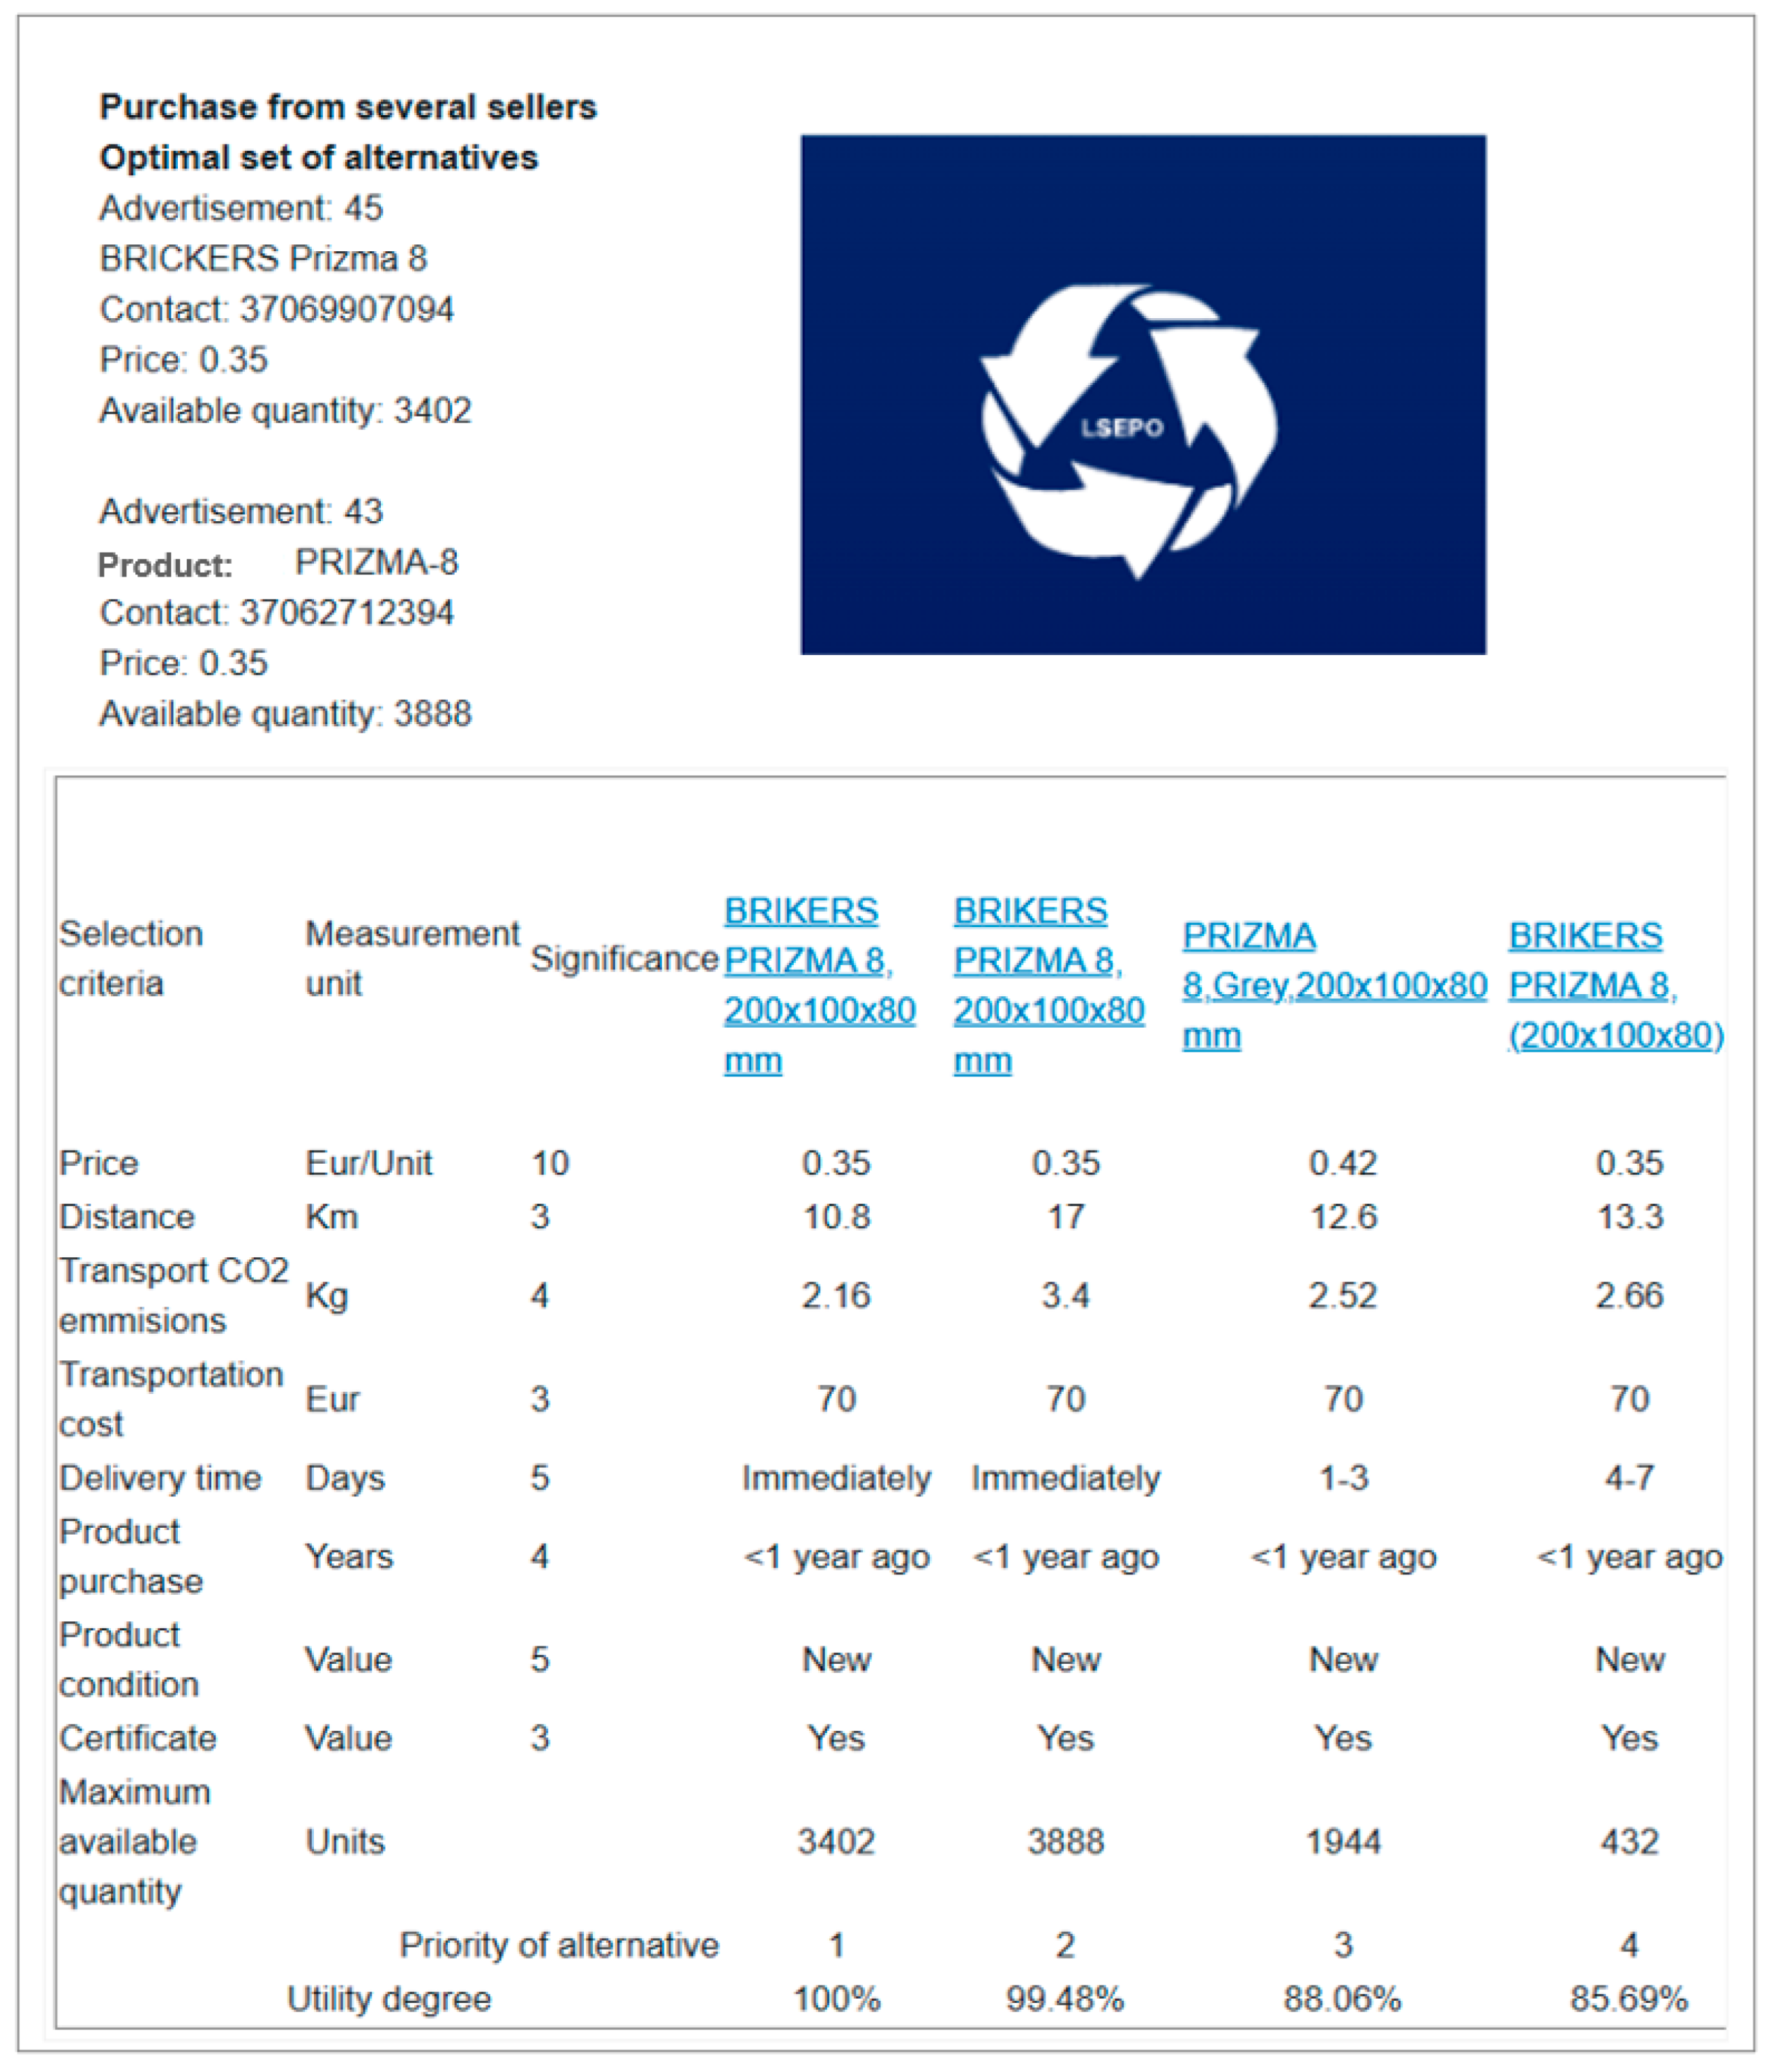
3.2. Use of Construction Material Reuse Optimization (SOLUTION) Portal

The SOLUTION Portal is an open, real-time collaboration platform that provides opportunities for construction companies, large-scale construction waste collection companies, residents, and other interested parties to offer unused construction materials and waste to the market in order to ensure their reusability.
The portal is user friendly and easily accessible online at https://iti4.vgtu.lt/lespo (accessed on 29 June 2025). The current version is available in Lithuanian, as the platform is being tested in the Lithuanian market. An English version will be developed in the future.
The main functions of the platform are as follows:
  • It collects information and data on construction material waste from construction sites, warehouses, landfills, recycling and trading sites, and residents and presents it on a unified digital platform.
  • On the platform, the users can search for information about the offered unused construction materials and find relevant suppliers.
  • The search subsystem allows users to search, filter, and compare thousands of building material alternatives based on price, location, delivery time, and other parameters; contact suppliers; and order the building materials they need.
  • The platform performs multi-criteria and multi-variate analyses and selects the most rational alternatives to make the reuse of construction material waste more efficient and at the same time reduce transportation costs and emissions along the entire value chain.
  • The platform helps to offer unused construction materials and construction waste to the market, thereby contributing to the reuse of construction materials and waste reduction, cooperation for sustainability in the field of construction and demolition works.
The portal can be used in various stages of the building life cycle. Potential scenarios include the resale of unused construction materials by construction and demolition companies or individuals and the search for available reused construction materials by contractors for new construction or renovation. To demonstrate the functionality of the portal, examples are presented next.
To offer reused construction materials for sale, suppliers must first register. After registering, they can enter the data on proposed materials into the database (see Figure 8).
The next example provides a description of the product search process. In this case, the customer wants to order 3000 units of pavers. The user has to choose a product category (pavers in this case), a preferred price range per unit, the requested quantity, the condition of the product (new or used), the delivery time, the delivery address, and the maximum distance from the site to the selling location. There is also an option to select a single supplier or multiple suppliers (see Figure 9).
Once the initial data are entered, the portal analyzes all available products in the database and provides detailed information about each alternative. The products are ranked according to several criteria, including price, distance, transport CO2 emissions, transportation cost, delivery time, supplier’s product purchase time, product condition, available certifications, and maximum available quantity.
Using multi-criteria analysis, the priorities are calculated for the alternative products, with the most preferred alternative of the highest utility degree of 100% [33]. In the present case, the best alternative is “BRIKERS PRIZMA 8, 200 × 100 × 80 mm” (see Figure 10). The portal provides the supplier’s contact information, enabling the customer to initiate direct communication.
If a higher quantity of a product is requested that cannot be fulfilled by a single supplier, the portal generates an optimal combination of products from multiple suppliers. For example, if 4800 units of pavers are required, the portal recommends selecting two listings: Advertisement 45 and Advertisement 43 (see Figure 11).
The SOLUTION Portal was tested and validated by the researchers from Vilnius Gediminas Technical University as well as industry representatives during the joint research project “Lithuanian Construction Materials’ Reuse Optimisation Platform”. The eight experts who validated the SOLUTION Portal were civil engineering and construction waste management industry experts, a researcher, and professors, all with at least 15 years of experience in the field (see Table 1).
Observations by experts played an important role regarding the validation and verification of the SOLUTION Portal. A questionnaire was used to validate the SOLUTION Portal. There were 16 questions administered, which went into the data analysis. The answers to these questions involved the selection of one option from the four that typically appear on the Likert scale: (1) strongly disagree, (2) disagree, (3) agree, or (4) strongly agree. Feedback evaluation results are provided in Table 2.
Analysis of the results revealed that the SOLUTION Portal generally received very positive feedback, and the scores of the 16 questions fell between 3 and 4 points, accordingly. All experts strongly agreed that the portal is easy to navigate, works well across different browsers and devices, has helpful filtering options (e.g., material type, quality, and location), correctly identifies the information and data on reused construction materials, provides useful estimations of the transport distance and environmental impact, and offers a valuable resource for sustainable construction practices. Lower average scores were for “The portal makes it easy to upload and manage multiple materials” (3.63) and “The portal offers enough criteria to reflect real-world decision-making needs” (3.50), indicating that these areas may benefit from further improvement in the future. Upon completion of this exercise, applications of the recommended SOLUTION Portal improvements by experts were enacted. In the future research, the portal will be tested in real-life conditions with higher number of real users.
The Construction Material Reuse Optimization (SOLUTION) Portal developed during this research offers the following innovative features:
  • It allows users to find, filter, and compare thousands of alternative reused building materials by price, location, collection time, and other parameters; contact suppliers; and order any building materials they need.
  • The platform performs multiple-criteria and multi-variate analyses, calculates utility degrees, and selects the most rational alternatives to ensure the more efficient reuse of second-hand building materials and, at the same time, reduce delivery costs and pollution emissions.
The SOLUTION Portal facilitates the buying, selling, donating, and trading of reused building materials. It connects individuals, contractors, demolition companies, and reuse centers to promote material reuse and reduce construction waste. The portal offers significant benefits to the construction sector, addressing key dimensions of sustainability:
  • Environmental benefits include reduced construction waste, lower CO2 emissions by avoiding the manufacturing and transport of new materials, and decreased demand for virgin resources like timber, metals, and aggregates.
  • Economic benefits include cost savings from cheaper reused materials, reduced disposal costs for sellers, easier sourcing of rare or discontinued items, and improved management of surplus materials across construction projects.
  • Social benefits include support for small-scale or budget-friendly projects, the stimulation of local reuse and deconstruction businesses, and the promotion of sustainable building practices based on circular economy principles.

4. Conclusions

This study presented a comprehensive examination of how Google opinion mining can be a helpful tool in green infrastructure research as a data-driven approach. The GREEN method was designed using a robust, multi-method analytical approach, including regression, correlation, neural networks, and multiple-criteria techniques.
The study aimed to determine how popular 788 green infrastructure terms (AGI keywords) are across 94 countries, 20 cities, and globally. The glossary development stage removed country-specific terms to ensure international relevance, enhancing generalizability. The models (GREEN788 and GREENNN) incorporate 71 macro-environmental indicators across countries, while city-level models (GREEN12 and GREEN20) apply to a range of urban contexts with differing geographic, economic, and cultural profiles. The GREEN models show that improvements in performance and sustainability indicators at the country and city levels coincide with more frequent use of AGI keywords. Countries and cities with better context indicators have a greater density of AGI terms on Google Search. The accuracy of the created models (R2 = 0.511–0.997) meets the requirements for social research.
The proposed GEKA system applies the Google Search API, filtering data by the location, date, and language. Furthermore, the inclusion of cities (Prague, Aveiro, Ruse, Fingal, and Cologne), covering five European regions, supports the method’s geographic flexibility. Both the statistical performance of the models (e.g., R2 values and RMSE) and the removal of non-significant variables enhance their predictive reliability across contexts. While regional customization may further refine outcomes, the methodological structure and wide-ranging dataset provide strong evidence of the GREEN method’s capacity for global application, scalability, and cross-regional transferability.
The countries contain large amounts of big data, which continues to increase; how-ever, there is still a deficiency in holistic green infrastructure data. Data are insufficient or arrive too late in numerous countries, and when available, they do not address specific issues in sufficient detail. Decision makers encountering data scarcity and completeness challenges with conventional green infrastructure data sources can utilize Google data to address these problems. The GEKA system and GREEN models can assist decision makers in addressing the issues of data scarcity and comprehensiveness encountered with conventional green infrastructure data sources.
One of the potential tools contributing to green infrastructure, as proposed in the present research, is the SOLUTION Portal. It is an open, real-time collaboration platform that provides opportunities for construction companies, large-scale construction waste collection companies, residents, and other interested parties to offer unused construction materials and waste to the market in order to ensure their reusability. Using this portal, customers can select the most suitable reused construction materials based on economic, distance, time, quality, environmental, and other relevant criteria. The portal was tested and positively evaluated by the experts. The SOLUTION Portal provides these groundbreaking features: (a) it enables users to discover, sort, and examine thousands of alternative reused construction materials by cost, location, delivery time, and additional criteria; reach out to suppliers; and purchase any construction materials they require; and (b) the platform conducts analyses based on multiple criteria and variables, computes utility values, and identifies the most rational options to guarantee the efficient repurposing of used construction materials while simultaneously lowering delivery expenses and pollution emissions.

4.1. Theoretical Contribution

This study presents several new important insights. A total of 788 global regression (R2 = 0.997) and neural network (R2 = 0.596) GREEN models were developed and tested. In addition, 34 regression models for 12 (R2 = 0.817) and 20 (R2 = 0.511) world cities and separate cities (Munich (R2 aver=0.801) and London (R2 aver = 0.817)) were created. A relationship between green infrastructure terms and the context was identified. GREEN models can be used to simulate various issues related to the attractiveness of green infrastructure as an integrated approach to addressing social, environmental, management/political, cultural, and economic issues. Aiming for a greater positive effect of the attractiveness of green infrastructure, 788 GREEN788 and GREENNN models and 34 GREEN12 and GREEN20 models can help identify the combinations of micro-, meso-, and macro-environment factors that would create a rational context to address issues related to the attractiveness of green infrastructure.
This research also adds essential contributions to the existing scientific literature on material reuse portals. The Construction Material Reuse Optimization Portal was proposed to generate multiple options and recommend optimal alternatives for the potential customers of reused construction materials.

4.2. Practical Significance

Decision makers considering the attractiveness of green infrastructure often rely on different data sources, but they need clear, accurate, and evidence-based insights. Helped by 788 global and 34 meso-scale GREEN models, decision makers can make evidence-based decisions on green infrastructure development. The key benefit of GREEN models is their ability to improve predictions of how people will talk about the attractiveness of green infrastructure, allowing decision makers to choose the most rational options in the future.
Stakeholders can use GREEN models to learn about various micro-, meso-, and macro-environment factors that would help make green infrastructure strategies more attractive. The GREEN models demonstrate that AGI metrics are linked with social, environmental, political, cultural, and economic aspects of the nations in question. The models also show that an improvement in a nation’s sustainability and performance indicators leads to the increased use of AGI keywords.
The innovative Construction Material Reuse Optimization (SOLUTION) Portal was developed. It facilitates the buying, selling, donating, and trading of reused building materials and connects individuals, contractors, demolition companies, and reuse centers to promote material reuse and reduce construction waste.

4.3. Limitations and Future Research Directions

Sentiment analysis, while robust, faces several key challenges. These include difficulty in handling variations in multiple languages and dialects due to linguistic and cultural differences, the need for domain adaptation to account for context-specific language, ensuring data quality, outliers in the data, dealing with unstructured data in various formats (blogs, social media posts, etc.), and addressing ethical considerations like bias present in the training data, possibly conducive to one-sided or prejudiced results, and detecting sarcasm and irony. These limitations will be addressed in future research.
The stability of a GREEN regression and neural network model refers to its ability to produce consistent and reliable results over time and with new data. In the future, it is intended to identify and address potential model stability issues, such as data errors, outliers, or shifts in trends.
The SOLUTION Portal was tested by eight experts. Future plans include testing and validation under real-life conditions through more extensive user feedback.
Moreover, future research could use robust GREEN models and the SOLUTION Portal to explore several options:
  • Expanding the analysis to include a broader range of macro- and meso-environment indicators—beyond the current 71 and 22, respectively—to provide a more comprehensive understanding of the factors influencing green infrastructure development needs and priorities.
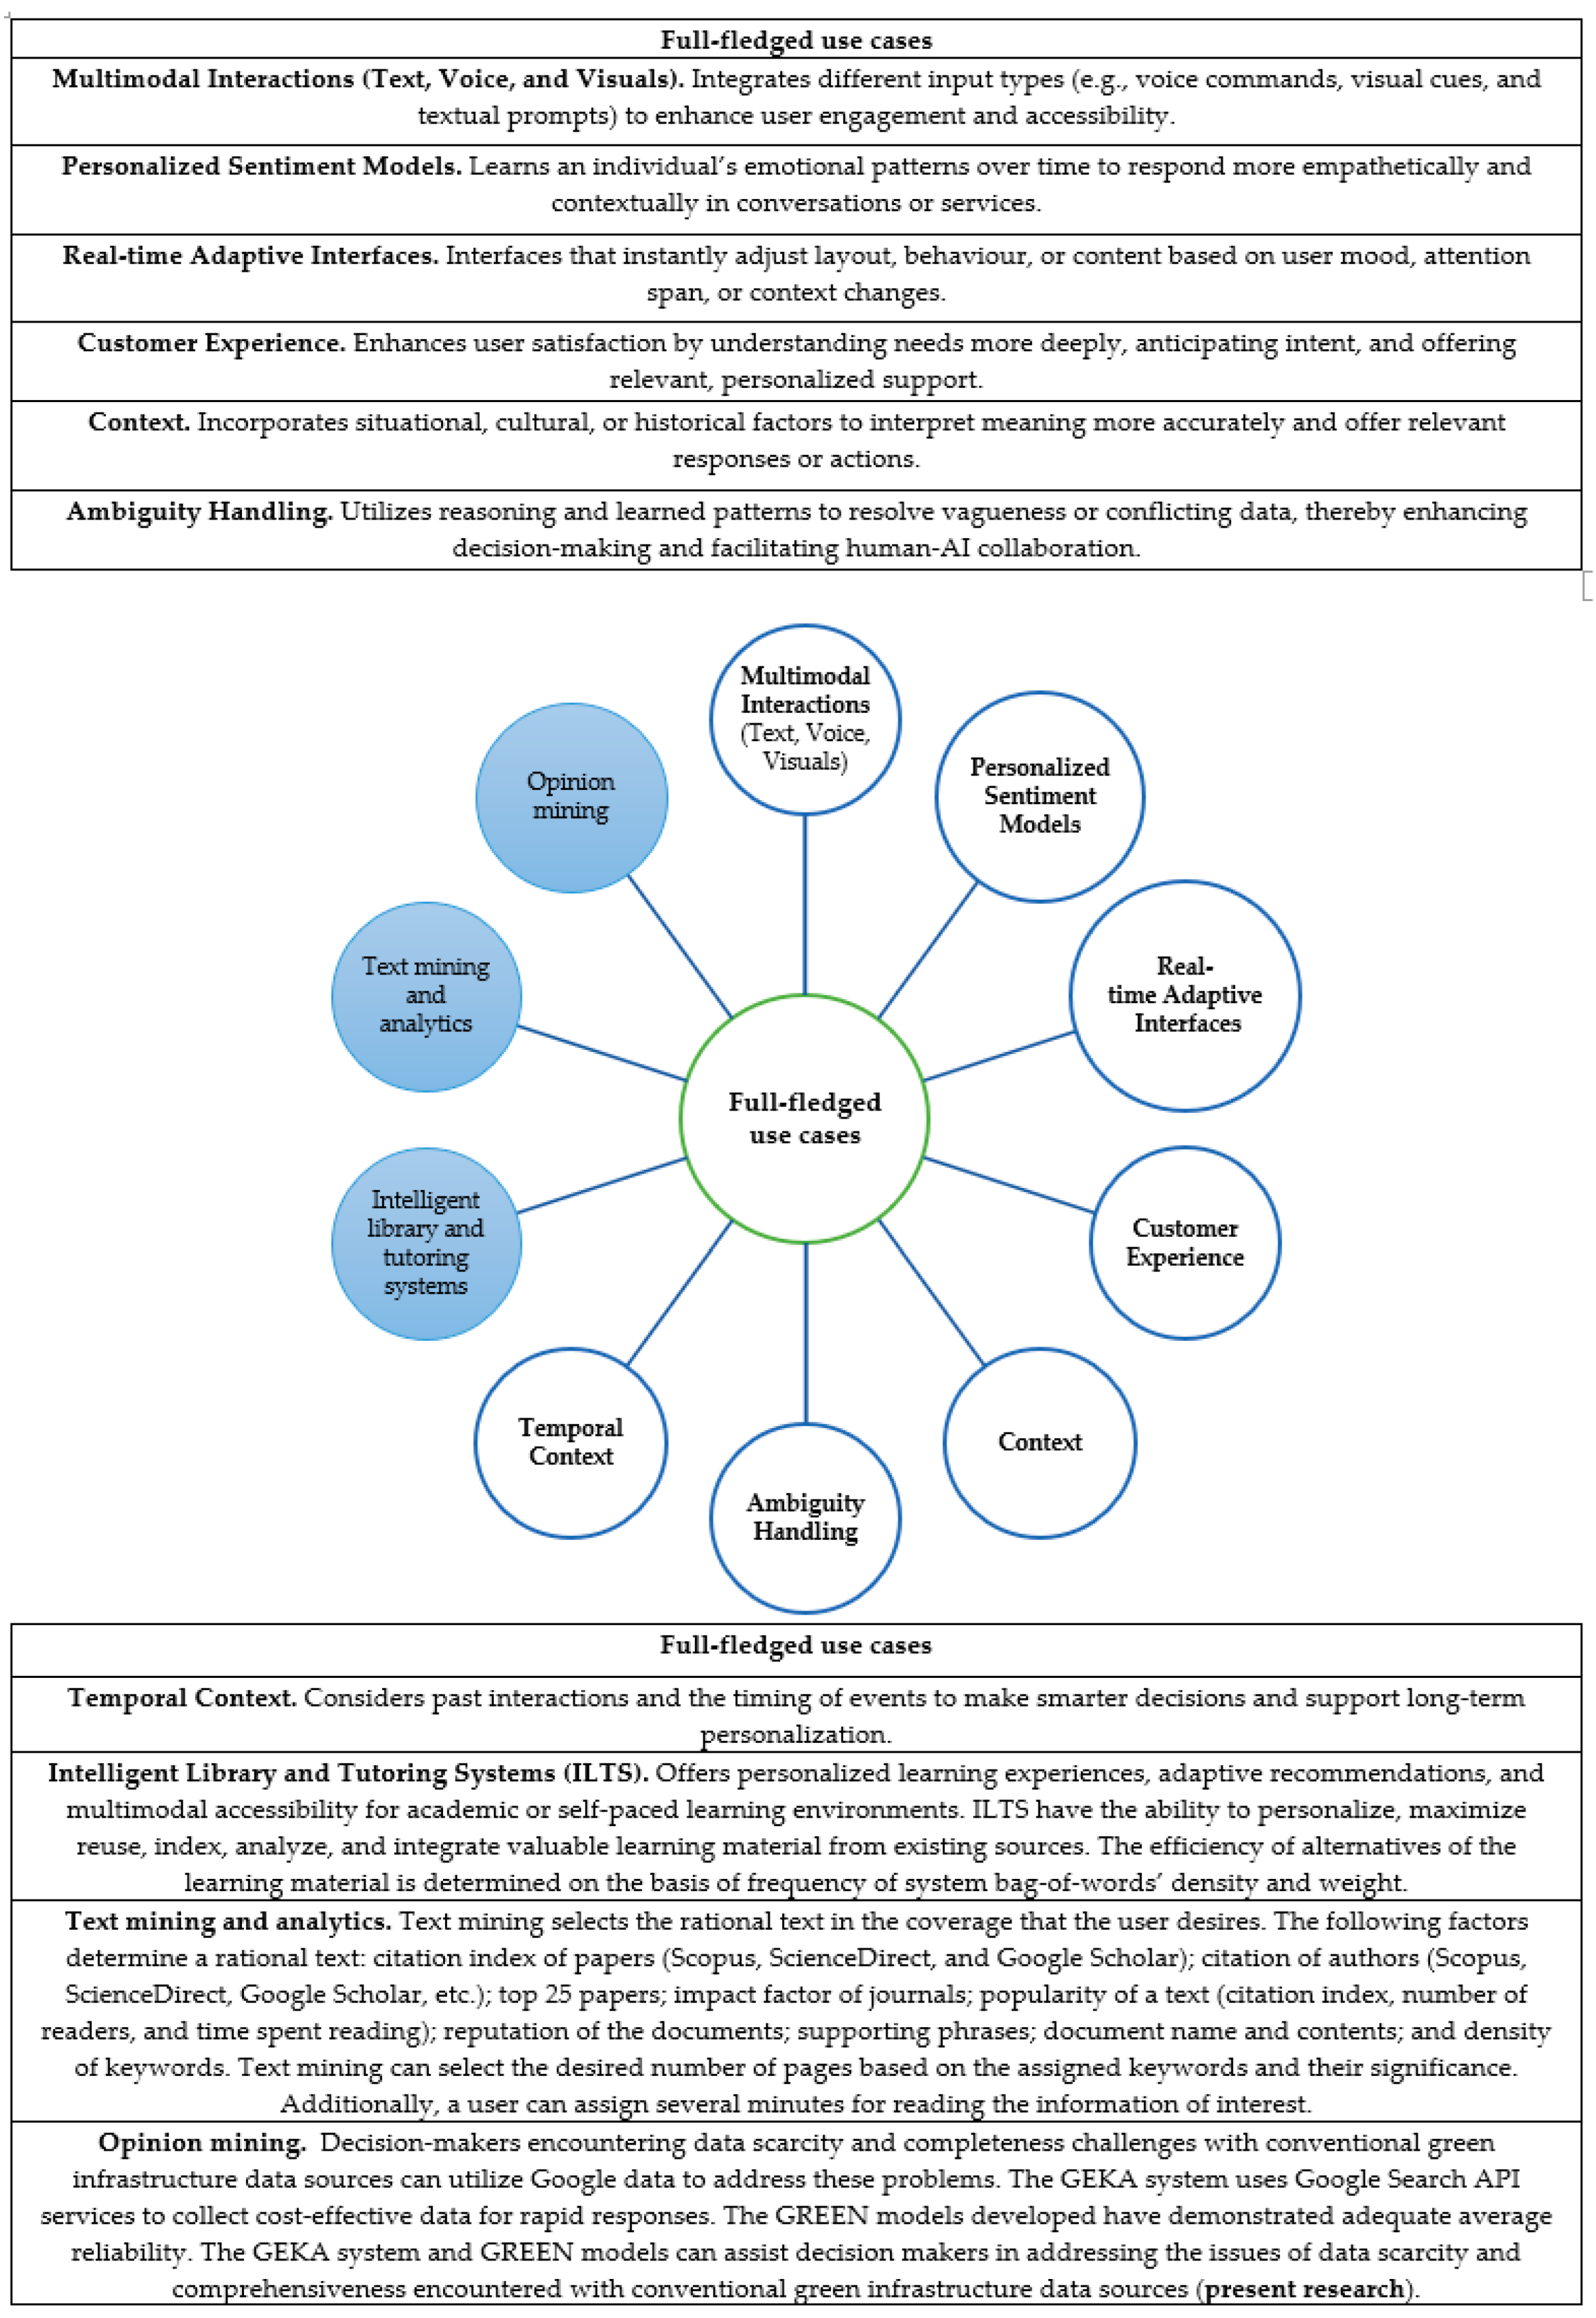
  • Expanding the GEKA system by developing Contextual Memory, Hierarchical Memory Retrieval, and Focus Modes, as well as Multimodal Interactions, Personalized Sentiment Models, Real-time Adaptive Interfaces, Ambiguity Handling, and Temporal Context subsystems.
  • Longitudinal studies tracking the actual implementation of green infrastructure initiatives in countries and cities with high AGI keyword densities, as predicted by the models, to validate the practical implications of increased online search interest.
  • Integrating the SOLUTION Portal’s material reuse optimization capabilities with the AGI keyword analysis, which could lead to opinion-based reuse of construction materials; this future research direction also corresponds to expert evaluation indicating that the portal could provide more criteria to reflect real-world decision-making needs.

Supplementary Materials

The following supporting information can be downloaded at: https://www.mdpi.com/article/10.3390/buildings15132362/s1, Table S1a: The density of the attractiveness of green infrastructure 788 keywords for 94 countries; Table S1b: Initial data and multiple criteria analysis of 94 countries and their 71 macro indicators (2022); Table S1c: The key values of the 788 green infrastructure keywords’ regression GREEN778 models: (1) R-squared and its p values, (2) β and its (3) p values, (4) standardized β, and (5) sensitivity coefficients; Table S1d: The matrix lists the 1) correlations, (2) its p values, and (3) significant correlations between the density of each AGI keyword and the macro indicators of 94 countries; Table S1e: R-squared, MAE, MSE, and RMSE metrics to measure the performance of the global 788 GREEN788 models; Table S2a: The density of the attractiveness of green infrastructure 34 keywords for 20 cities during 2015–2025; Table S2b: 20 cities’ Numbeo cost of living data during 2015–2025; Table S2c: The key values of the 34 green infrastructure keywords’ regression models (GREEN20): (1) R-squared and its p values, (2) β and its (3) p values, (4) standardized β, and (5) sensitivity coefficients for the period between 2015 and 2025 (all statistically significant variables (p < 0.05) are highlighted in yellow); Table S2d: The matrix lists the 1) correlations, (2) its p values, and (3) significant correlations between the density of each AGI keyword and the urban indicators of 20 cities; Table S3a: The density of the attractiveness of green infrastructure 34 keywords for 12 cities during 2015–2025; Table S3b: 12 cities’ Numbeo urban 22 indicators data during 2015–2025; Table S3c: The key values of the 34 green infrastructure keywords’ regression models (GREEN12): (1) R-squared and its p values, (2) β and its (3) p values, (4) standardized β, and (5) sensitivity coefficients for the period between 2015 and 2025.

Author Contributions

A.K.: conceptualization, raw data, data curation, investigation, formal analysis, methodology, validation, supervision, visualization, and writing—original draft. E.T., Y.X., A.T., L.C., S.S., K.D., N.L., L.T., L.K., S.K., J.Z., V.M. and S.N.: conceptualization, data curation, investigation, formal analysis, validation, visualization, and writing—original draft. All authors have read and agreed to the published version of the manuscript.

Funding

This research was funded by Project No. 101121210, “City Nature-Based Solutions Integration to Local Urban Infrastructure Protection for a Climate Resilient Society” (NBSINFRA) from the European Union’s Horizon Europe program and this research work has received funding from the project “Civil Engineering Research Centre” (agreement No. S-A-UEI-23-5, ŠMSM).

Data Availability Statement

All data supporting this research’s results are obtainable within the manuscript and its Supplementary Tables and links. Supplementary Data sources are provided in this manuscript.

Conflicts of Interest

Author Lorcan Connolly was employed by the company Research Driven Solutions Ltd. The remaining authors declare that the research was conducted in the absence of any commercial or financial relationships that could be construed as a potential conflict of interest.

References

  1. Liu, T.Y.; Chen, P.H.; Chou, N.N. Comparison of assessment systems for green building and green civil infrastructure. Sustainability 2019, 11, 2117. [Google Scholar] [CrossRef]
  2. Fu, X.; Hopton, M.E.; Wang, X. Assessment of green infrastructure performance through an urban resilience lens. J. Clean. Prod. 2021, 289, 125146. [Google Scholar] [CrossRef]
  3. Güntsch, A.; Overmann, J.; Ebert, B.; Bonn, A.; Le Bras, Y.; Engel, T.; Anders Hovstad, K.; Ann Lange Canhos, D.; Newman, P.; van Ommen Kloeke, E.; et al. National biodiversity data infrastructures: Ten essential functions for science, policy, and practice. BioScience 2025, 75, 139–151. [Google Scholar] [CrossRef]
  4. Hakuriah, P.; Tilahun, N.Y.; Zellner, M. Introduction to seeing cities through big data: Research, methods and applications in urban informatics. In Seeing Cities Through Big Data; Thakuriah, P., Tilahun, N., Zellner, M., Eds.; Springer: Berlin/Heidelberg, Germany, 2017; pp. 1–9. [Google Scholar] [CrossRef]
  5. Ugonnia, J.C.; Olaniyi, O.O.; Olaniyi, F.G.; Arigbabu, A.A.; Oladoyinbo, T.O. Towards sustainable IT infrastructure: Integrating green computing with data warehouse and big data technologies to enhance efficiency and environmental responsibility. J. Eng. Res. Rep. 2024, 26, 247–261. [Google Scholar] [CrossRef]
  6. Lei, Y. Enhancing environmental management through big data: Spatial analysis of urban ecological governance and big data development. Front. Environ. Sci. 2024, 12, 1358296. [Google Scholar] [CrossRef]
  7. Ependi, U.; Rochim, A.F.; Wibowo, A. A data-driven approach for real-time urban sustainability assessment using crowdsourced data. J. Syst. Manag. Sci. 2024, 14, 191–214. [Google Scholar] [CrossRef]
  8. Ogunkan, D.V.; Ogunkan, S.K. Exploring big data applications in sustainable urban infrastructure: A review. Urban Gov. 2025, 5, 54–68. [Google Scholar] [CrossRef]
  9. Meng, G.; Hu, H.; Chen, L. The application obstacles of BIM technology in green building project and its key role path analysis. Sci. Rep. 2024, 14, 30330. [Google Scholar] [CrossRef]
  10. Bapat, H.; Sarkar, D.; Gujar, R. Selection of sustainable materials for energy savings of infrastructure-transportation project in Ahmedabad, India using BIM and FCM. J. Constr. Dev. Ctries. 2021, 26, 135–161. [Google Scholar] [CrossRef]
  11. Siew, Y.J.R.; Balatbat, C.A.M.; Carmichael, G.D. A review of building/infrastructure sustainability reporting tools (SRTs). Smart Sustain. Built Environ. 2013, 2, 106–139. [Google Scholar] [CrossRef]
  12. Lin, Z.-H.; Laffan, S.W.; Metternicht, G. Role of green infrastructure planning in achieving sustainable development goals through an environmental efficiency lens: An integrated literature review. Ecol. Indic. 2025, 174, 113471. [Google Scholar] [CrossRef]
  13. Silva, E.; Khan, S.; Han, J. Optimizing data collection and integrating low-cost sensors for scalable smart city solutions. J. Urban Technol. 2021, 28, 45–67. [Google Scholar]
  14. Arzo, S.; Hong, M. Resilient green infrastructure: Navigating environmental resistance for sustainable development, social mobility in climate change policy. Heliyon 2024, 10, e33524. [Google Scholar] [CrossRef]
  15. UN IEAG. A World that Counts—Mobilising the Data Revolution for Sustainable Development. First Report of the UN Secretary General’s Independent Expert Advisory Group on a Data Revolution for Sustainable Development’s. 2014. Available online: http://www.undatarevolution.org/report (accessed on 10 January 2025).
  16. Mercer, N. How We Use Language to Think Together. In Words and Minds; Routledge: London, UK, 2002. [Google Scholar] [CrossRef]
  17. Dewey, J. How We Think; Dover Publications: Mineola, NY, USA, 1997. [Google Scholar]
  18. Bartlett, F. Thinking: An Experimental and Social Study; Taylor & Francis Group: Oxfordshire, UK, 2024. [Google Scholar]
  19. United Nations Environment Programme. Global Waste Management Outlook 2024: Beyond an Age of Waste—Turning RUBBISH into a Resource. Nairobi. Available online: https://wedocs.unep.org/20.500.11822/44939 (accessed on 20 January 2025).
  20. Kabirifar, K.; Mojtahedi, M.; Wang, C.; Tam, V.W. Construction and demolition waste management contributing factors coupled with reduce, reuse, and recycle strategies for effective waste management: A review. J. Clean. Prod. 2020, 263, 121265. [Google Scholar] [CrossRef]
  21. Huang, B.; Wang, X.; Kua, H.; Geng, Y.; Bleischwitz, R.; Ren, J. Construction and demolition waste management in China through the 3r principle. Resour. Conserv. Recycl. 2018, 129, 36–44. [Google Scholar] [CrossRef]
  22. Pickin, J.; Randell, P.; Trinh, J.; Grant, J.T.B. National Waste Report 2018. Available online: https://www.dcceew.gov.au/sites/default/files/documents/national-waste-report-2018.pdf (accessed on 30 May 2025).
  23. Park, J.; Tucker, R. Overcoming barriers to the reuse of construction waste material in Australia: A review of the literature. Int. J. Construct. Manag. 2017, 17, 228–237. [Google Scholar] [CrossRef]
  24. Manowong, E. Investigating factors influencing construction waste management efforts in developing countries: An experience from Thailand. Waste Manag. Res. 2017, 30, 56–71. [Google Scholar] [CrossRef] [PubMed]
  25. Hao, J.L.; Hill, M.J.; Shen, L.Y. Managing construction waste on-site through System Dynamics Modelling: The Case of Hong Kong. Eng. Constr. Archit. Manag. 2008, 15, 103–113. [Google Scholar] [CrossRef]
  26. Lu, M.; Poon, C.S.; Wong, L.C. Application framework for mapping and simulation of waste handling processes in construction. J. Constr. Eng. Manag. 2006, 132, 1212–1221. [Google Scholar] [CrossRef]
  27. Udawatta, N.; Zuo, J.; Chiveralls, K.; Zillante, G. Attitudinal and behavioural approaches to improving waste management on construction projects in Australia: Benefits and limitations. Int. J. Construct. Manag. 2015, 15, 137–147. [Google Scholar] [CrossRef]
  28. Kulatunga, U.; Amaratunga, D.; Haigh, R.; Rameezdeen, R. Attitudes and perceptions of construction workforce on construction waste in Sri Lanka. Manag. Environ. Qual. Int. J. 2006, 17, 57–72. [Google Scholar] [CrossRef]
  29. Velis, C. Waste pickers in Global South: Informal recycling sector in a circular economy era. Waste Manag. Res. J. Sustain. Circ. Econ. 2017, 35, 329–331. [Google Scholar] [CrossRef]
  30. Xu, S.; Shirowzhan, S.; Sepasgozar, S.M.E. Urban waste management and prediction through socio-economic values and visualizing the spatiotemporal relationship on an advanced GIS-Based dashboard. Sustainability 2023, 15, 12208. [Google Scholar] [CrossRef]
  31. Singh, T.; Uppaluri, R.V.S. Machine learning tool-based prediction and forecasting of municipal solid waste generation rate: A case study in Guwahati, Assam, India. Int. J. Environ. Sci. Technol. 2023, 20, 12207–12230. [Google Scholar] [CrossRef]
  32. Tian, R.; Hoy, Z.X.; Liew, P.Y.; Hanafiah, M.M.; Mong, G.R.; Chong, C.T.; Hossain, M.U.; Woon, K.S. Socio-economic correlation analysis and hybrid artificial neural network model development for provincial waste electrical and electronic equipment generation forecasting in China. J. Clean. Prod. 2023, 418, 138076. [Google Scholar] [CrossRef]
  33. Munir, M.T.; Li, B.; Naqvi, M. Revolutionizing municipal solid waste management (MSWM) with machine learning as a clean resource: Opportunities, challenges and solutions. Fuel 2023, 348, 128548. [Google Scholar] [CrossRef]
  34. Knoth, K.; Fufa, S.M.; Seilskjær, E. Barriers, success factors, and perspectives for the reuse of construction products in Norway. J. Clean. Prod. 2022, 377, 130494. [Google Scholar] [CrossRef]
  35. Hart, R.P.; Carroll, C. Appendix 1. Diction: The Text-Analysis Program. In Campaign Talk: Why Elections Are Good for Us; Princeton University Press: Princeton, NJ, USA, 2000; pp. 245–252. [Google Scholar] [CrossRef]
  36. Haralabopoulos, G.; Simperl, E. Crowdsourcing for beyond polarity sentiment analysis a pure emotion lexicon. arXiv 2017. [Google Scholar] [CrossRef]
  37. Beyer, B.; Jones, C.; Petoff, J.; Murphy, N.R. Site Reliability Engineering: How Google Runs Production Systems; O’Reilly Media, Inc: Sebastopol, CA, USA, 2016. [Google Scholar]
  38. Google. How Does Google Determine Ranking Results—Google Search. Available online: https://www.google.com/intl/en_us/search/howsearchworks/how-search-works/ranking-results/ (accessed on 18 June 2025).
  39. Google. Our Approach—How Google Search Works. Available online: https://www.google.com/intl/en_us/search/howsearchworks/our-approach/ (accessed on 18 June 2025).
  40. Google. Creating Helpful, Reliable, People-First Content. Available online: https://developers.google.com/search/docs/fundamentals/creating-helpful-content (accessed on 18 June 2025).
  41. Google. Trusted Information and Content—Google Safety Center. Available online: https://safety.google/content-safety/ (accessed on 18 June 2025).
  42. Google. About Quality Score for Search Campaigns. Available online: https://support.google.com/google-ads/answer/6167118?hl=en (accessed on 18 June 2025).
  43. Cloud, J. Exploring the New Data Quality Dashboard in Google Discovery AI. And How to Use Generative AI in BigQuery to Generate Product Catalog Descriptions and Improve Data Quality. Google Cloud Community, 2017. Available online: https://medium.com/google-cloud/exploring-the-new-data-quality-dashboard-in-google-discovery-ai-a44b6a1b9615 (accessed on 18 June 2025).
  44. Google. General Structured Data Guidelines. Available online: https://developers.google.com/search/docs/appearance/structured-data/sd-policies (accessed on 18 June 2025).
  45. Google. Duplicate URL. Available online: https://support.google.com/webmasters/answer/12642436?hl=en (accessed on 18 June 2025).
  46. Nguyen, N. Beware the Top Google Search Result. It Might be Wrong. Str. J. 2024. Available online: https://www.wsj.com/tech/ai/google-search-results-ai-spam-cf8c2605 (accessed on 18 June 2025).
  47. Google. How Google Approaches Privacy and Data Ethics. Available online: https://policies.google.com/privacy/frameworks (accessed on 18 June 2025).
  48. Montgomery, D.C.; Peck, E.A.; Vining, G.G. Introduction to Linear Regression Analysis, 5th ed.; John Wiley & Sons Inc.: Hoboken, NJ, USA, 2012. [Google Scholar]
  49. Ozili, P.K. The acceptable R-Square in empirical modelling for social science research. Soc. Res. Methodol. Publ. Results 2022. [Google Scholar] [CrossRef]
  50. Jierula, A.; Wang, S.; Oh, T.M.; Wang, P. Study on accuracy metrics for evaluating the predictions of damage locations in deep piles using artificial neural networks with acoustic emission data. Appl. Sci. 2021, 11, 2314. [Google Scholar] [CrossRef]
  51. Zavadskas, E.K.; Kaklauskas, A.; Sarka, V. The new method of multi-criteria complex proportional assessment of projects. Technol. Econ. Dev. Econ. 1994, 1, 131–139. [Google Scholar]
  52. Kaklauskas, A.; Herrera-Viedma, E.; Echenique, V.; Zavadskas, E.K.; Ubarte, I.; Mostert, A.; Podvezko, V.; Binkyte, A.; Podviezko, A. Multiple criteria analysis of environmental sustainability and quality of life in post-Soviet states. Ecol. Indic. 2018, 89, 781–807. [Google Scholar] [CrossRef]
  53. Kaklauskas, A.; Abraham, A.; Kaklauskiene, L.; Ubarte, I.; Amaratunga, D.; Lill, I.; Milevicius, V.; Kaklauskaite, U. Synergy of climate change with country success and city quality of life. Sci. Rep. 2023, 13, 7872. [Google Scholar] [CrossRef]
  54. Kaklauskas, A. Degree of project utility and investment value assessments. Int. J. Comput. Commun. Control 2016, 11, 666–683. [Google Scholar] [CrossRef]
  55. Kaklauskas, A.; Rajib, S.; Piaseckiene, G.; Kaklauskiene, L.; Sepliakovas, J.; Lepkova, N.; Abaravicius, Z.; Milevicius, V.; Kildiene, S.; Sapurov, M. Multiple criteria and statistical sentiment analysis on flooding. Sci. Rep. 2024, 14, 30291. [Google Scholar] [CrossRef]
  56. Dimbleby, R.; Burton, G. More Than Words: An Introduction to Communication; Routledge: New York, NY, USA, 2020. [Google Scholar] [CrossRef]
  57. Tambiah, S.J. Form and meaning of magical acts: A point of view. HAU J. Ethnogr. Theory 2017, 7, 451–473. [Google Scholar] [CrossRef]
  58. Collins, P.H. Defining black feminist thought. In Feminist Theory Reader; McCann, C., Kim, S.K., Ergun, E., Eds.; Routledge: New York, NY, USA, 2020; p. 532. [Google Scholar]
  59. Liberalesso, T.; Cruz, C.O.; Silva, C.M.; Manso, M. Green infrastructure and public policies: An international review of green roofs and green walls incentives. Land Use Policy 2020, 96, 104693. [Google Scholar] [CrossRef]
  60. Hamel, P.; Tan, L. Blue–green infrastructure for flood and water quality management in Southeast Asia: Evidence and knowledge gaps. Environ. Manag. 2022, 69, 699–718. [Google Scholar] [CrossRef]
  61. Ersoy Mirici, M. The ecosystem services and green infrastructure: A systematic review and the gap of economic valuation. Sustainability 2022, 14, 517. [Google Scholar] [CrossRef]
  62. Das, R.; Singh, T.D. Multimodal sentiment analysis: A survey of methods, trends, and challenges. ACM Comput. Surv. 2023, 55, 1–38. [Google Scholar] [CrossRef]
  63. Al-Saadawi, H.F.T.; Das, B.; Das, R. A systematic review of trimodal affective computing approaches: Text, audio, and visual integration in emotion recognition and sentiment analysis. Expert Syst. Appl. 2024, 255, 124852. [Google Scholar] [CrossRef]
  64. Kaklauskas, A.; Seniut, M.; Amaratunga, D.; Lill, I.; Safonov, A.; Vatin, N.; Peciure, L. Text analytics for ANDROID project. Procedia Econ. Financ. 2014, 18, 610–617. [Google Scholar] [CrossRef]
  65. Kaklauskas, A.; Gudauskas, R.; Kozlovas, M.; Peciure, L.; Lepkova, N.; Cerkauskas, J.; Banaitis, A. An affect-based multimodal video recommendation system. Stud. Inform. Control 2016, 25, 5–14. [Google Scholar] [CrossRef]
  66. Zhu, L.; Mao, R.; Cambria, E.; Jansen, B.J. Neurosymbolic AI for personalized sentiment analysis. In International Conference on Human-Computer Interaction; Springer Nature: Cham, Switzerland, 2024; pp. 269–290. [Google Scholar]
  67. Khamaj, A.; Ali, A.M. Adapting user experience with reinforcement learning: Personalizing interfaces based on user behavior analysis in real-time. Alex. Eng. J. 2024, 95, 164–173. [Google Scholar] [CrossRef]
  68. Mandava, S.K. Emotion-driven user interface (UI) adaptation using real-time user feedback. J. Data Acquis. Process. 2023, 38. [Google Scholar]
  69. Gallagher, C.; Furey, E.; Curran, K. The application of sentiment analysis and text analytics to customer experience reviews to understand what customers are really saying. Int. J. Data Warehous. Min. (IJDWM) 2019, 15, 21–47. [Google Scholar] [CrossRef]
  70. Kang, D.; Park, Y. Review-based measurement of customer satisfaction in mobile service: Sentiment analysis and VIKOR approach. Expert Syst. Appl. 2014, 41, 1041–1050. [Google Scholar] [CrossRef]
  71. Chowdhury, R.H. Sentiment analysis and social media analytics in brand management: Techniques, trends, and implications. World J. Adv. Res. Rev. 2024, 23, 287–296. [Google Scholar] [CrossRef]
  72. Suryavanshi, P.; Gangele, S. Sentiment analysis view for brand reputation monitoring on social media. Int. J. Innov. Res. Comput. Commun. Eng. 2024, 12, 111–115. [Google Scholar] [CrossRef]
  73. Valle-Cruz, D.; Fernandez-Cortez, V.; López-Chau, A.; Sandoval-Almazán, R. Does twitter affect stock market decisions? financial sentiment analysis during pandemics: A comparative study of the h1n1 and the covid-19 periods. Cogn. Comput. 2022, 14, 372–387. [Google Scholar] [CrossRef] [PubMed]
  74. Kumar, A.; Garg, G. Systematic literature review on context-based sentiment analysis in social multimedia. Multimed. Tools Appl. 2020, 79, 15349–15380. [Google Scholar] [CrossRef]
  75. Osman, N.A.; Mohd Noah, S.A.; Darwich, M.; Mohd, M. Integrating contextual sentiment analysis in collaborative recommender systems. PLoS ONE 2021, 16, e0248695. [Google Scholar] [CrossRef]
  76. Smatov, N.; Kalashnikov, R.; Kartbayev, A. Development of Context-Based Sentiment Classification for Intelligent Stock Market Prediction. Big Data Cogn. Comput. 2024, 8, 51. [Google Scholar] [CrossRef]
  77. Yadav, P.; Kashyap, I.; Bhati, B.S. Contextual Ambiguity Framework for Enhanced Sentiment Analysis. Teh. Glas. 2024, 18, 385–393. [Google Scholar] [CrossRef]
  78. Nadeem, A.; Missen, M.M.S.; Al Reshan, M.S.; Memon, M.A.; Asiri, Y.; Nizamani, M.A.; Shaikh, A. Resolving ambiguity in natural language for enhancement of aspect-based sentiment analysis of hotel reviews. Peerj Comput. Sci. 2025, 11, e2635. [Google Scholar] [CrossRef]
  79. Ahmed, U.; Lin, J.C.W.; Garcia Diaz, V. Automatically temporal labeled data generation using positional lexicon expansion for focus time estimation of news articles. ACM Trans. Asian Low-Resour. Lang. Inf. Process. 2024, 23, 1–20. [Google Scholar] [CrossRef]
  80. Zhao, A.; Tian, S.; Yu, Y. Modeling Temporal Interaction for Dynamic Sentiment Analysis on Social Network. IEEE Trans. Comput. Soc. Syst. 2024, 12, 1233–1242. [Google Scholar] [CrossRef]
  81. Rodríguez-Ibánez, M.; Casánez-Ventura, A.; Castejón-Mateos, F.; Cuenca-Jiménez, P.M. A review on sentiment analysis from social media platforms. Expert Syst. Appl. 2023, 223, 119862. [Google Scholar] [CrossRef]
  82. Kaklauskas, A.; Zavadskas, E.; Babenskas, E.; Seniut, M.; Vlasenko, A.; Plakys, V. Intelligent library and tutoring system for Brita in the PuBs project. In Proceedings of the Cooperative Design, Visualization, and Engineering: 4th International Conference, CDVE 2007, Shanghai, China, 16–20 September 2007; pp. 157–166. [Google Scholar]
  83. Kaklauskas, A.; Holder, G.; Bianchi, M. Project TEMPUS CENEAST-Reformation of the Curricula on Built Environment in the Eastern Neighbouring Area. 2022. Available online: https://cris.unibo.it/handle/11585/128060 (accessed on 2 July 2025).
Figure 1. Green urban, civil, and building infrastructure data collection technologies and data-driven solutions.
Buildings 15 02362 g001
Figure 2. The GREEN method.
Buildings 15 02362 g002
Figure 3. Multi-criteria evaluation of reused building material alternatives.
Buildings 15 02362 g003
Figure 4. R-squared metrics of: (a) 788 GREEN788 and (b) 34 GREEN12 models.
Buildings 15 02362 g004
Figure 5. The distribution of the coefficient of determination of the (1) statistical, (2) verbal, and (3) combined indicators’ coefficient of determination in the 788 GREEN788 models.
Buildings 15 02362 g005
Figure 6. (a) The 788 keywords and (b) the significant correlations between the density of each AGI keyword and the macro-indicators of 94 countries.
Buildings 15 02362 g006
Figure 7. Full-fledged use cases [62,63,64,65,66,67,68,69,70,71,72,73,74,75,76,77,78,79,80,81,82,83].
Buildings 15 02362 g007
Figure 8. Uploading the product data into the database.
Buildings 15 02362 g008
Figure 9. Selection of the product.
Buildings 15 02362 g009
Figure 10. Determining the most efficient proposal (single seller).
Buildings 15 02362 g010
Figure 11. Determining the most efficient proposals (several sellers).
Buildings 15 02362 g011
Table 1. The profiles of the experts.
ExpertField of ExpertisePositionYears of Experience
E1Civil engineeringProfessor30
E2Civil engineeringProfessor21
E3Civil engineeringResearcher16
E4Civil engineeringProfessor18
E5Construction managementSenior specialist15
E6Construction managementProject manager25
E7Construction waste managementManager22
E8Real estate developmentManager17
Table 2. Feedback evaluation results.
NoQuestionMeanMedianStandard Deviation
1.The design and layout of the portal are user-friendly3.754.000.46
2.The portal is easy to navigate4.004.000.00
3.The portal works well across different browsers and devices4.004.000.00
4.The portal makes it easy to upload and manage multiple materials3.634.000.52
5.The portal offers enough criteria to reflect real-world decision-making needs3.503.500.53
6.The filtering options (e.g., material type, quality, location) are helpful4.004.000.00
7.The portal correctly identifies the information and data on reused construction materials4.004.000.00
8.The portal correctly performs the search for information about the construction materials offered and relevant suppliers3.884.000.35
9.The search subsystem allows users to search, filter, and compare many of building material alternatives based on price, location, delivery time, and other parameters and contact suppliers to order the building materials3.884.000.35
10.The search and ranking system fairly represents materials based on quality and relevance3.754.000.46
11.The listings are displayed in a way that help to compare options easily3.754.000.46
12.The estimated transport distance and environmental impact information is useful4.004.000.00
13.The platform correctly performs multi-criteria and multi-variate analyses and selects the most rational material alternatives and their combinations3.884.000.35
14.The portal offers a valuable resource for sustainable construction practices4.004.000.00
15.Overall, I am satisfied with my experience using the SOLUTION Portal3.754.000.46
16.I would recommend this portal to others in construction or renovation3.884.000.35
Disclaimer/Publisher’s Note: The statements, opinions and data contained in all publications are solely those of the individual author(s) and contributor(s) and not of MDPI and/or the editor(s). MDPI and/or the editor(s) disclaim responsibility for any injury to people or property resulting from any ideas, methods, instructions or products referred to in the content.

