Article

Soundscape Preferences and Cultural Ecosystem Services in the Grand Canal National Cultural Park: A Case Study of Tongzhou Forest Park

1
Department of Architecture and Arts, Shijiazhuang Tiedao University, Shijiazhuang 050043, China
2
Faculty of Humanities and Social Sciences, Macao Polytechnic University, Macao 999078, China
*
Author to whom correspondence should be addressed.
Buildings 2025, 15(13), 2360; https://doi.org/10.3390/buildings15132360
Submission received: 14 May 2025 / Revised: 23 June 2025 / Accepted: 3 July 2025 / Published: 5 July 2025
(This article belongs to the Special Issue Acoustics and Well-Being: Towards Healthy Environments)

Abstract

As research on national cultural parks advances, the significance of conducting multi-dimensional perception evaluations of their cultural ecosystem services (CESs) becomes increasingly apparent. This study examines the eight dimensions of CESs within the Grand Canal National Cultural Park from the perspective of soundscape preference. Using Tongzhou Grand Canal Forest Park as a case study, five categories of soundscapes comprising 19 sound sources were identified through the analysis of online textual data. This study then collected public preferences and perceptions of these five soundscapes via on-site questionnaires and analyzed the data using SPSS26 for correlation and IPA analyses. The results indicate that the overall evaluation of the park’s CESs is positive. There is a significant mutual influence between soundscape preference and CES perception. Specifically, the preference for natural soundscape significantly impacts the evaluation of each CES dimension, while satisfaction with leisure and entertainment is positively correlated with preferences for all types of soundscapes. Additionally, there are notable differences in soundscape preference among different age groups. These findings not only enhance our understanding of soundscape planning in national cultural parks but also provide valuable guidance for their management and design.

1. Introduction

The National Cultural Park is a distinctive cultural heritage conservation initiative unique to China, aiming to preserve and promote the country’s profound cultural heritage while facilitating public access to cultural resources and enhancing cultural identity [1,2,3], which is different from the concept of the national park, which originated in the United States and primarily emphasizes wilderness protection and ecological conservation [4,5,6]. While both models share the goal of safeguarding valuable natural and cultural assets, their underlying philosophies and priorities diverge significantly, with the Chinese National Cultural Park initiative placing a greater emphasis on cultural inheritance and public cultural services. As a significant cultural heritage, the Grand Canal embodies profound historical accumulation and cultural values [7,8,9,10]. The establishment of the Grand Canal National Cultural Park marks an innovative practice in active heritage protection [11,12,13,14].
With the growing global awareness of ecosystem services, especially after the Millennium Ecosystem Assessment, the significance of cultural ecosystem services has become increasingly prominent [15]. Cultural ecosystem services (CESs) refer to the cultural service functions that exist within an ecosystem [16]. Existing CES evaluation methods often struggle to capture the public’s deep-seated perception and demand for cultural ecosystem services [17]. The intangible and subjective nature of CESs poses challenges for large-scale research and data collection for quantitative evaluation [18]. However, the era of big data has presented new opportunities, with social media text evaluation data emerging as a valuable resource for CES assessment [19,20]. Using big data in CES research has become an established trend [21,22].
Globally, CES research has evolved from traditional “value-management” frameworks to a focus on “perception”, “preference” and social media data [23,24,25,26,27]. CESs are closely intertwined with public spiritual needs and cultural identity [28], aligning seamlessly with the park’s goal of promoting harmonious human–nature interaction [29,30]. Meanwhile, soundscape, defined by ISO as the perceived acoustic environment, has gained theoretical depth through soundscape ecology. Natural soundscapes, such as flowing water and bird sounds, serve as both ecological signals and cultural symbols, influencing public perceptions of heritage value. The combination of historical and natural soundscapes can evoke cultural memories and emotional resonance in Chinese classical gardens [31,32] and link soundscape preferences with psychological health and place attachment [33]. There is a positive correlation between the nostalgic emotions triggered by traditional canal sounds, cultural pride related to local dialects, and perceived value evaluation of CESs. However, the interaction between soundscape preference differences and CES in national cultural parks, particularly regarding public perception and its implications for park management, remains under-researched [34]. Against this backdrop, this study aims to answer three key questions: (1) What is the current state of soundscape preference and CES perception in the Grand Canal National Cultural Park? (2) How do soundscape preferences correlate with different CES dimensions? (3) What are the implications of these correlations for the management and planning of national cultural parks? To address these questions, this study employs social media text data collection and analysis, questionnaire surveys, IPA analysis, and correlation testing, using Tongzhou Grand Canal Forest Park in Beijing as a case study. The research seeks to explore the relationship between public soundscape preferences and park CES, offering insights for future national cultural park construction and active canal cultural heritage protection.

2. Materials and Methods

2.1. Study Area

Tongzhou Grand Canal Forest Park is located at the source of the Hebei Canal section of China’s Grand Canal, which is integrated with the ecological environment and historical heritage of the Grand Canal, and is a typical case study site (Figure 1). Since 2019, as a pilot project of the Tongzhou section of the Grand Canal National Cultural Park [35], the park has been built with the natural landscape of the canal as the core, forming a close geographical connection with the surrounding important canal relics such as the Lantern Stupa and the Daguang Tower. The canal’s historical and cultural landscape in the park is rich and diverse, and the ancient canal road, dock ruins, and canal culture display areas under key protection are all important carriers of CES in this study.
In terms of natural conditions, the park shows unique advantages. In the park, you can hear a variety of sound sources, including natural sounds such as bird sounds, wind and water, artificial sounds such as boat motors, and human activity sounds brought by crowd conversation and folk culture display, making the soundscape experience extremely rich. At the same time, as a 5A cultural tourism scenic spot in Beijing, the Grand Canal Forest Park attracts a large number of tourists and provides sufficient sample resources for data acquisition (5A usually refers to the national 5A tourist attraction, which is the highest standard for the quality of tourist attractions in China). The recipients of the questionnaire were randomly selected within the area of sites 1–4. The management of the park is standardized and orderly, and the transportation is convenient, which provides great convenience for researchers to conduct field research and questionnaire surveys. These factors together form a solid basis for the research, making Grand Canal Forest Park an ideal location to study the relationship between soundscape preferences and CES perception.

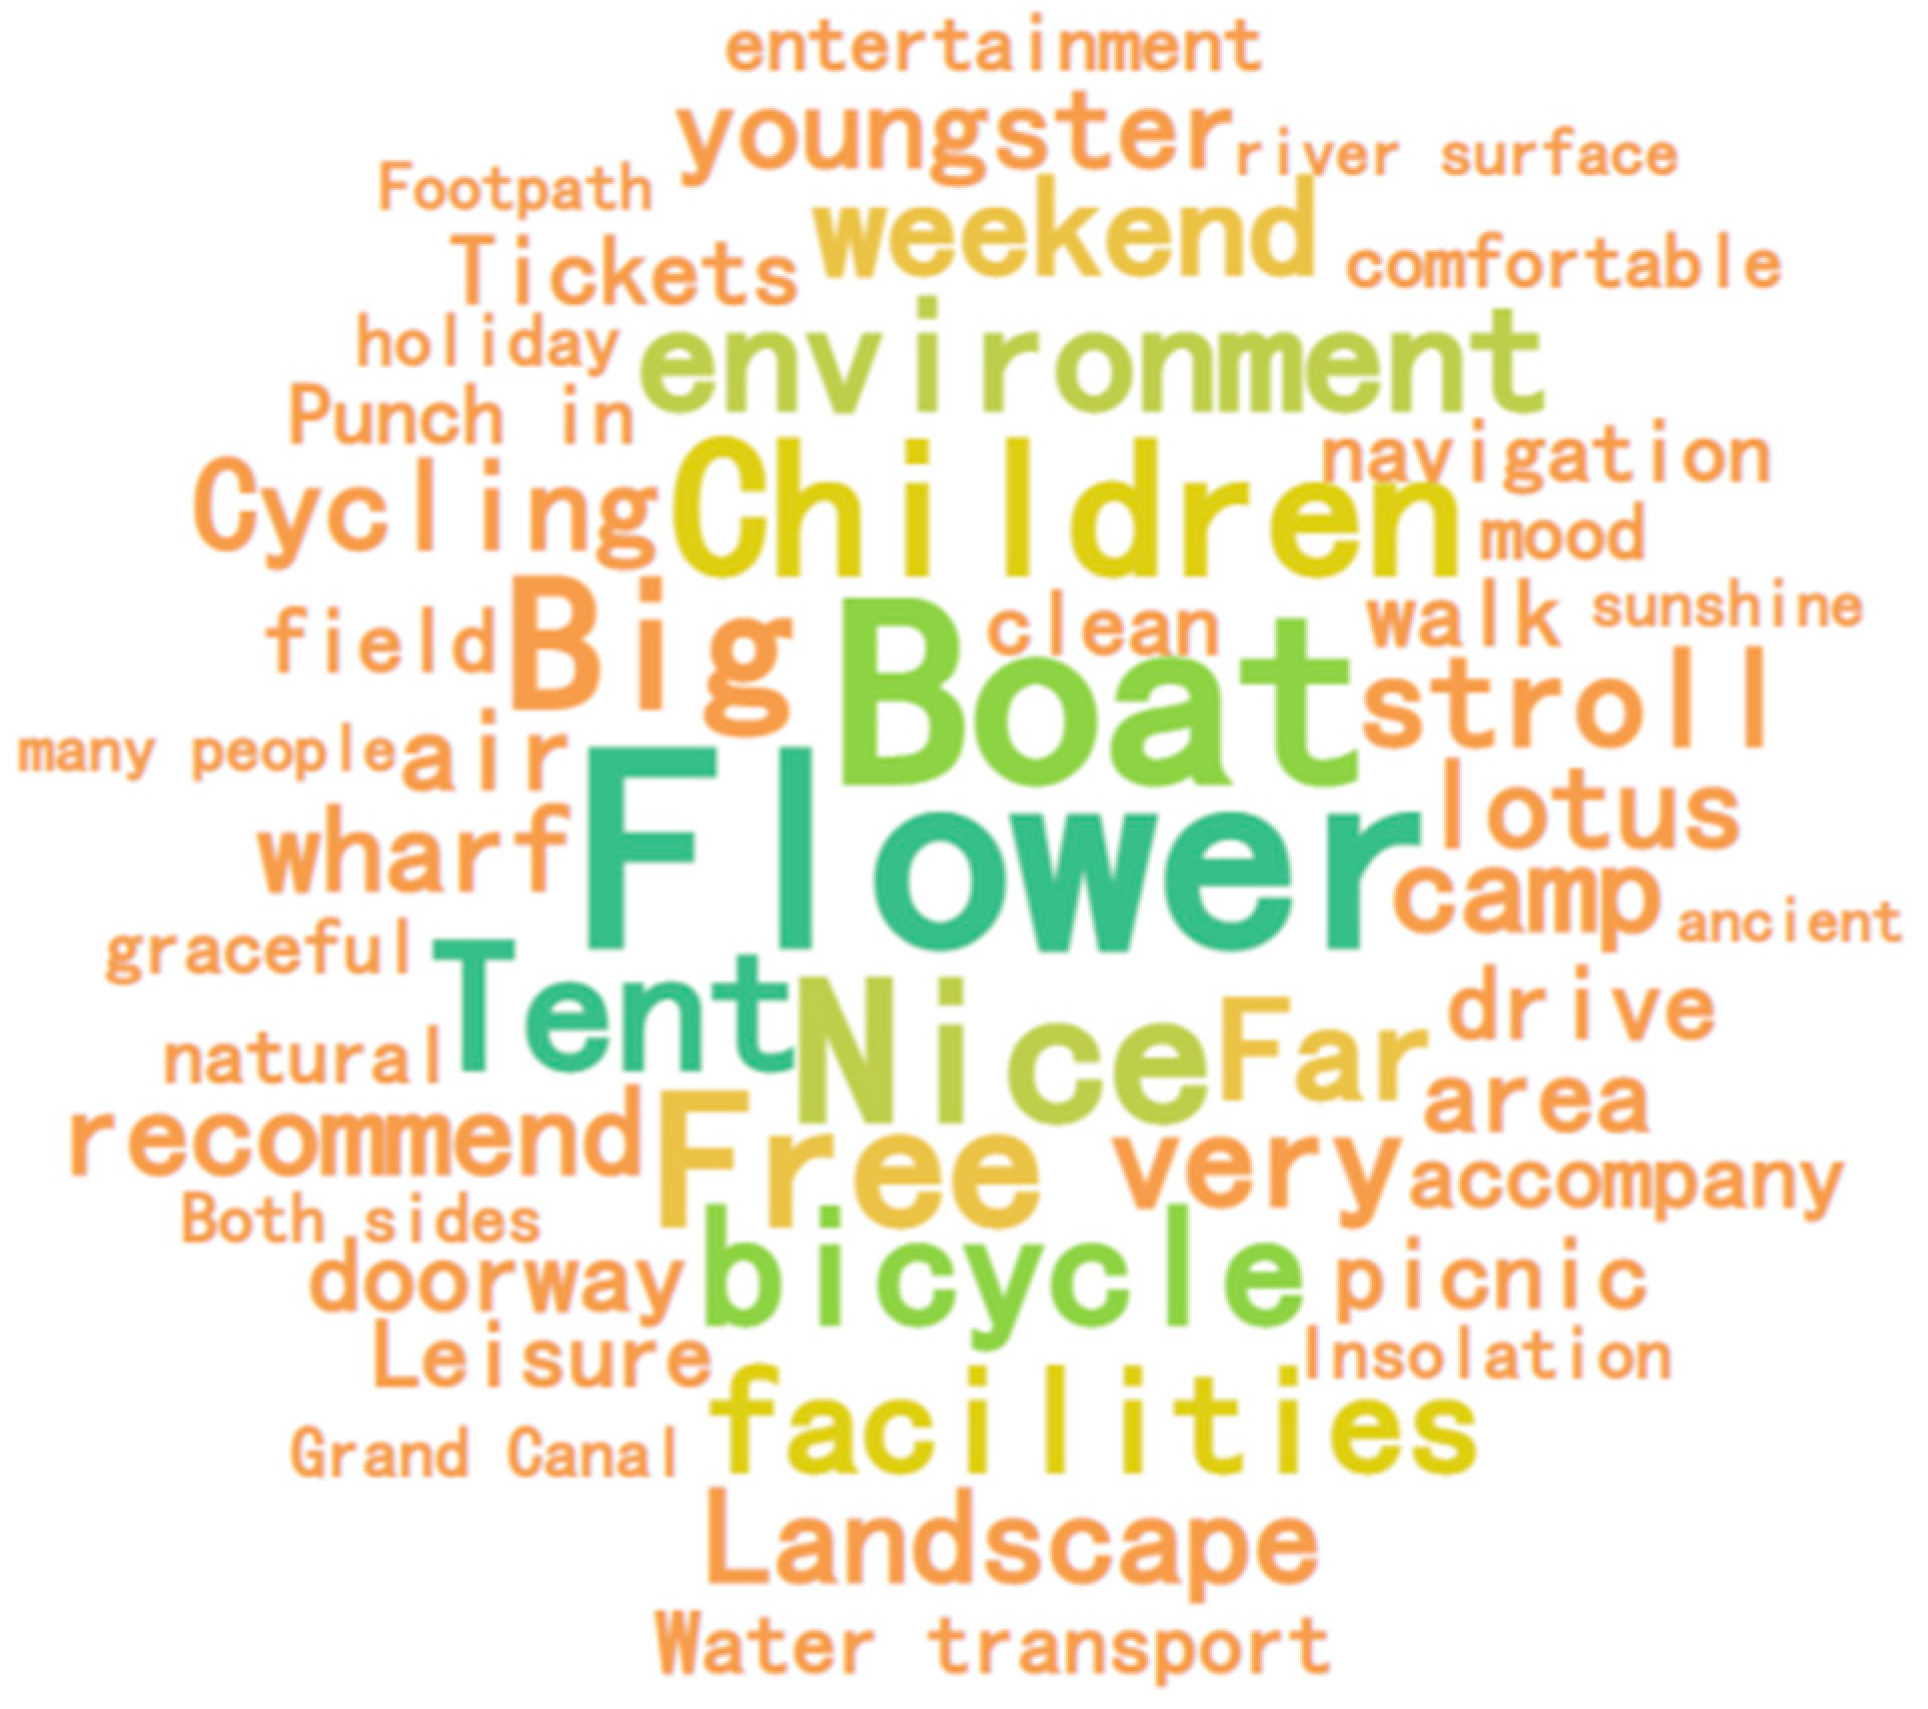
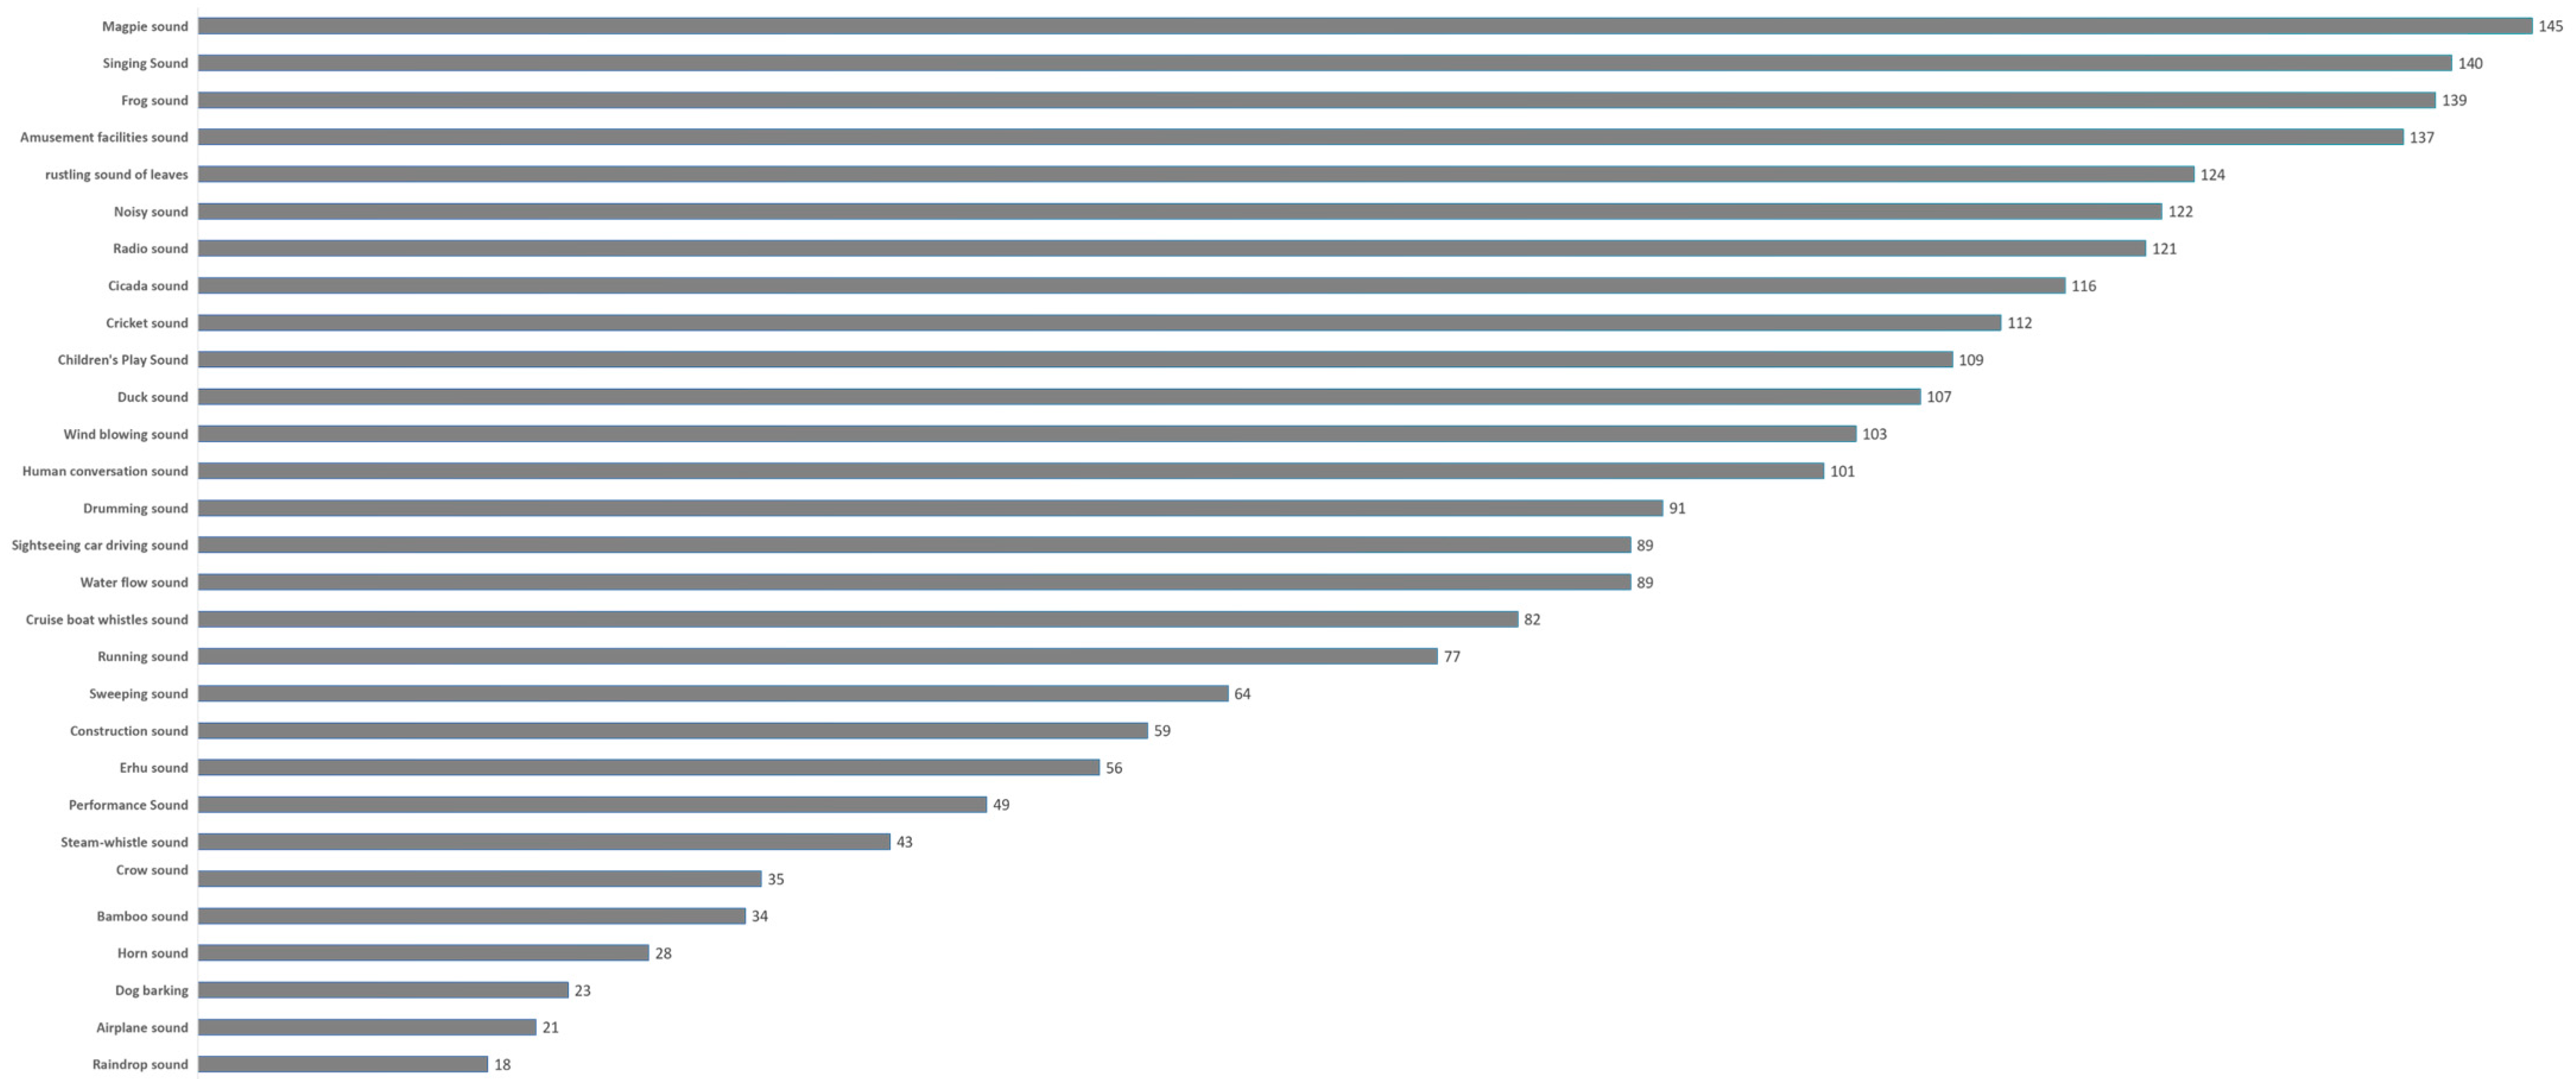
2.2. Social Media Text Data Collection

Two authoritative review platforms in China—Dianping and Ctrip—were selected as data sources in this study. Ctrip ranks first in terms of monthly active users of online travel service apps in China, while Dianping is currently the largest review website in China. Using “Beijing (Tongzhou) Grand Canal Cultural Tourism Scenic spot” as the keyword, it collected 3138 user reviews from 1 May 2021 to 1 May 2024, using Octopus software v 8.7.7 (Shenzhen Shukuo Information Technology Co., Ltd., Shenzhen, China)’s data crawling technology (https://octopus-code.org/ (accessed on 16 March 2025). ROST Content Mining Toolkit 6.0 (Developer: Professor Shenyang from Wuhan University, Wuhan, China) software was used to preprocess the collected text data (data sources: https://www.dianping.com/, https://www.ctrip.com/), including steps such as word segmentation, denoising, and word frequency statistics (Table 1). Among them, high-frequency nouns are mainly composed of place names and common landscapes in the park, high-frequency adjectives reflect the public’s aesthetic feelings, and high-frequency verbs reflect the main activities of the public in the forest park (Figure 2).
Based on the collected social media data [36], salient sound source type is an important trait that stimulates soundscape perception [37]. This study sorted out the types and distribution of sounds in the forest park. After analyzing the frequency of soundscape-related words in the text data, representative sound source analysis was conducted on soundscape-related words that appeared more than 50 times (Figure 3). Through word segmentation retrieval of text data and selection of soundscape words, 19 representative sound sources were identified by consensus, and the search results were divided into 5 types of soundscape based on sound properties: animal soundscape, natural soundscape, human activity soundscape, artificial soundscape, and traffic soundscape (Table 2). In addition, according to the statistics of the locations of high-frequency scenic spots in the text data and the richness of the overall visual landscape and soundscape of the scenic spot, four actual survey sites were determined (Table 3):

2.3. Questionnaire Design

Previous studies have shown that it is effective to use questionnaires to evaluate individuals’ perception of the acoustic environment [38]. The preliminary research results show that the forest park has abundant plant landscapes and frequent animal activities in summer. Meanwhile, summer is the peak season of annual tourist flow and the best viewing season of the forest park landscape. Therefore, this study selected the key month of June and randomly distributed questionnaires at four survey sites within the forest park. The specific time of the questionnaire was from 3 p.m. to 6 p.m. every day, which was not only the period with the most abundant and changeable soundscape elements, but also the most concentrated time for the public to visit the park, thus ensuring the effectiveness and representativeness of the data collection. Respondents scored the questionnaire according to their overall experience in the park, and the questionnaire content was divided into three parts: investigation of the current situation of soundscape perception, CES perception evaluation, and interviewee characteristics.
The soundscape perception questionnaire consists of two parts: sound source perception frequency statistics and soundscape preference evaluation. A Likert scale was used to measure the soundscape preference evaluation. The scale was divided into five levels: strongly disagree (1 point), disagree (2 points), neutral (3 points), agree (4 points), and strongly agree (5 points). The statistical content of sound-source perception frequency refers to the proportion of the public’s perception frequency of each representative sound source in the soundscape type. Based on the summary of previous CES studies, this study selected 8 appropriate CES dimensions to define and evaluate in the context of national cultural parks. Meanwhile, in order to facilitate tourists’ understanding, the questionnaire content transformed the conceptualized connotation of CES in each dimension into 14 questions closely related to tourists’ recreational experience for inquiry (Table 4). As for CES perception evaluation, A Richter scale was also adopted, and the satisfaction evaluation scale was divided into 5 levels: very dissatisfied (1 point), dissatisfied (2 points), neutral (3 points), satisfied (4 points), and very satisfied (5 points). The importance rating scale is divided into five levels: very unimportant (1 point), unimportant (2 points), neutral (3 points), important (4 points), and very important (5 points).
The questionnaire investigates the characteristics of the interviewees, including the collection of variables such as identity, gender, age, educational background, and interview frequency of the population group. Since the survey group was randomly selected on site, the difference in the number of tourists and residents was affected by the function of Tongzhou Grand Canal Forest Park as a tourist destination, which attracted more tourists to visit. Therefore, the number of tourists in the park far exceeds that of the surrounding residents. This flow characteristic is directly reflected in the random sampling results; that is, the number of tourists significantly exceeds the number of residents. A total of 138 questionnaires were sent out, and 130 valid questionnaires were retained after screening based on the completion of the questionnaires. In similar studies, a sample size of 100–150 has been proven effective [39,40,41]. All valid questionnaire data were recorded into SPSS 26.0 for statistical analysis. In order to ensure the scientific and validity of the research data, this study first used Cronbach’s alpha coefficient to test the internal consistency of the questionnaire and obtained the combined analysis method of the Likert scales to ensure that the attitudes or tendencies of the respondents could be reflected more comprehensively. When SPSS software 26.0 (SPSS Inc., Shanghai, China) was used to analyze the reliability of quantitative data (such as attitude scale questions), reliability analysis was carried out on 33 groups of scale data (CES importance evaluation, satisfaction evaluation, soundscape preference evaluation scale). The Cronbach’s α coefficient was 0.931, which is greater than 0.8, indicating high data reliability, and the KMO value was 0.812, higher than 0.8. The validity of the side response data was good, verifying that the questionnaire data was suitable for further analysis.
In the stage of descriptive statistical analysis, the mean, standard deviation, and median of the soundscape preference data were calculated to characterize the central tendency of the data, etc., for the Likert scale, to quantify the respondents’ perceived soundscape preferences and their degree of dispersion. At the same time, combined with the satisfaction and importance scores within the CES scale, IPA analysis was carried out to evaluate the advantages and disadvantages of CESs in the forest park. In addition, an analysis of variance (ANOVA) was also used to explore the differences in soundscape preferences among different survey groups, and Spearman’s rho was used for correlation analysis. This method is not only suitable for data with a non-normal distribution, but can also effectively reveal the hierarchical relationship between variables.

3. Results

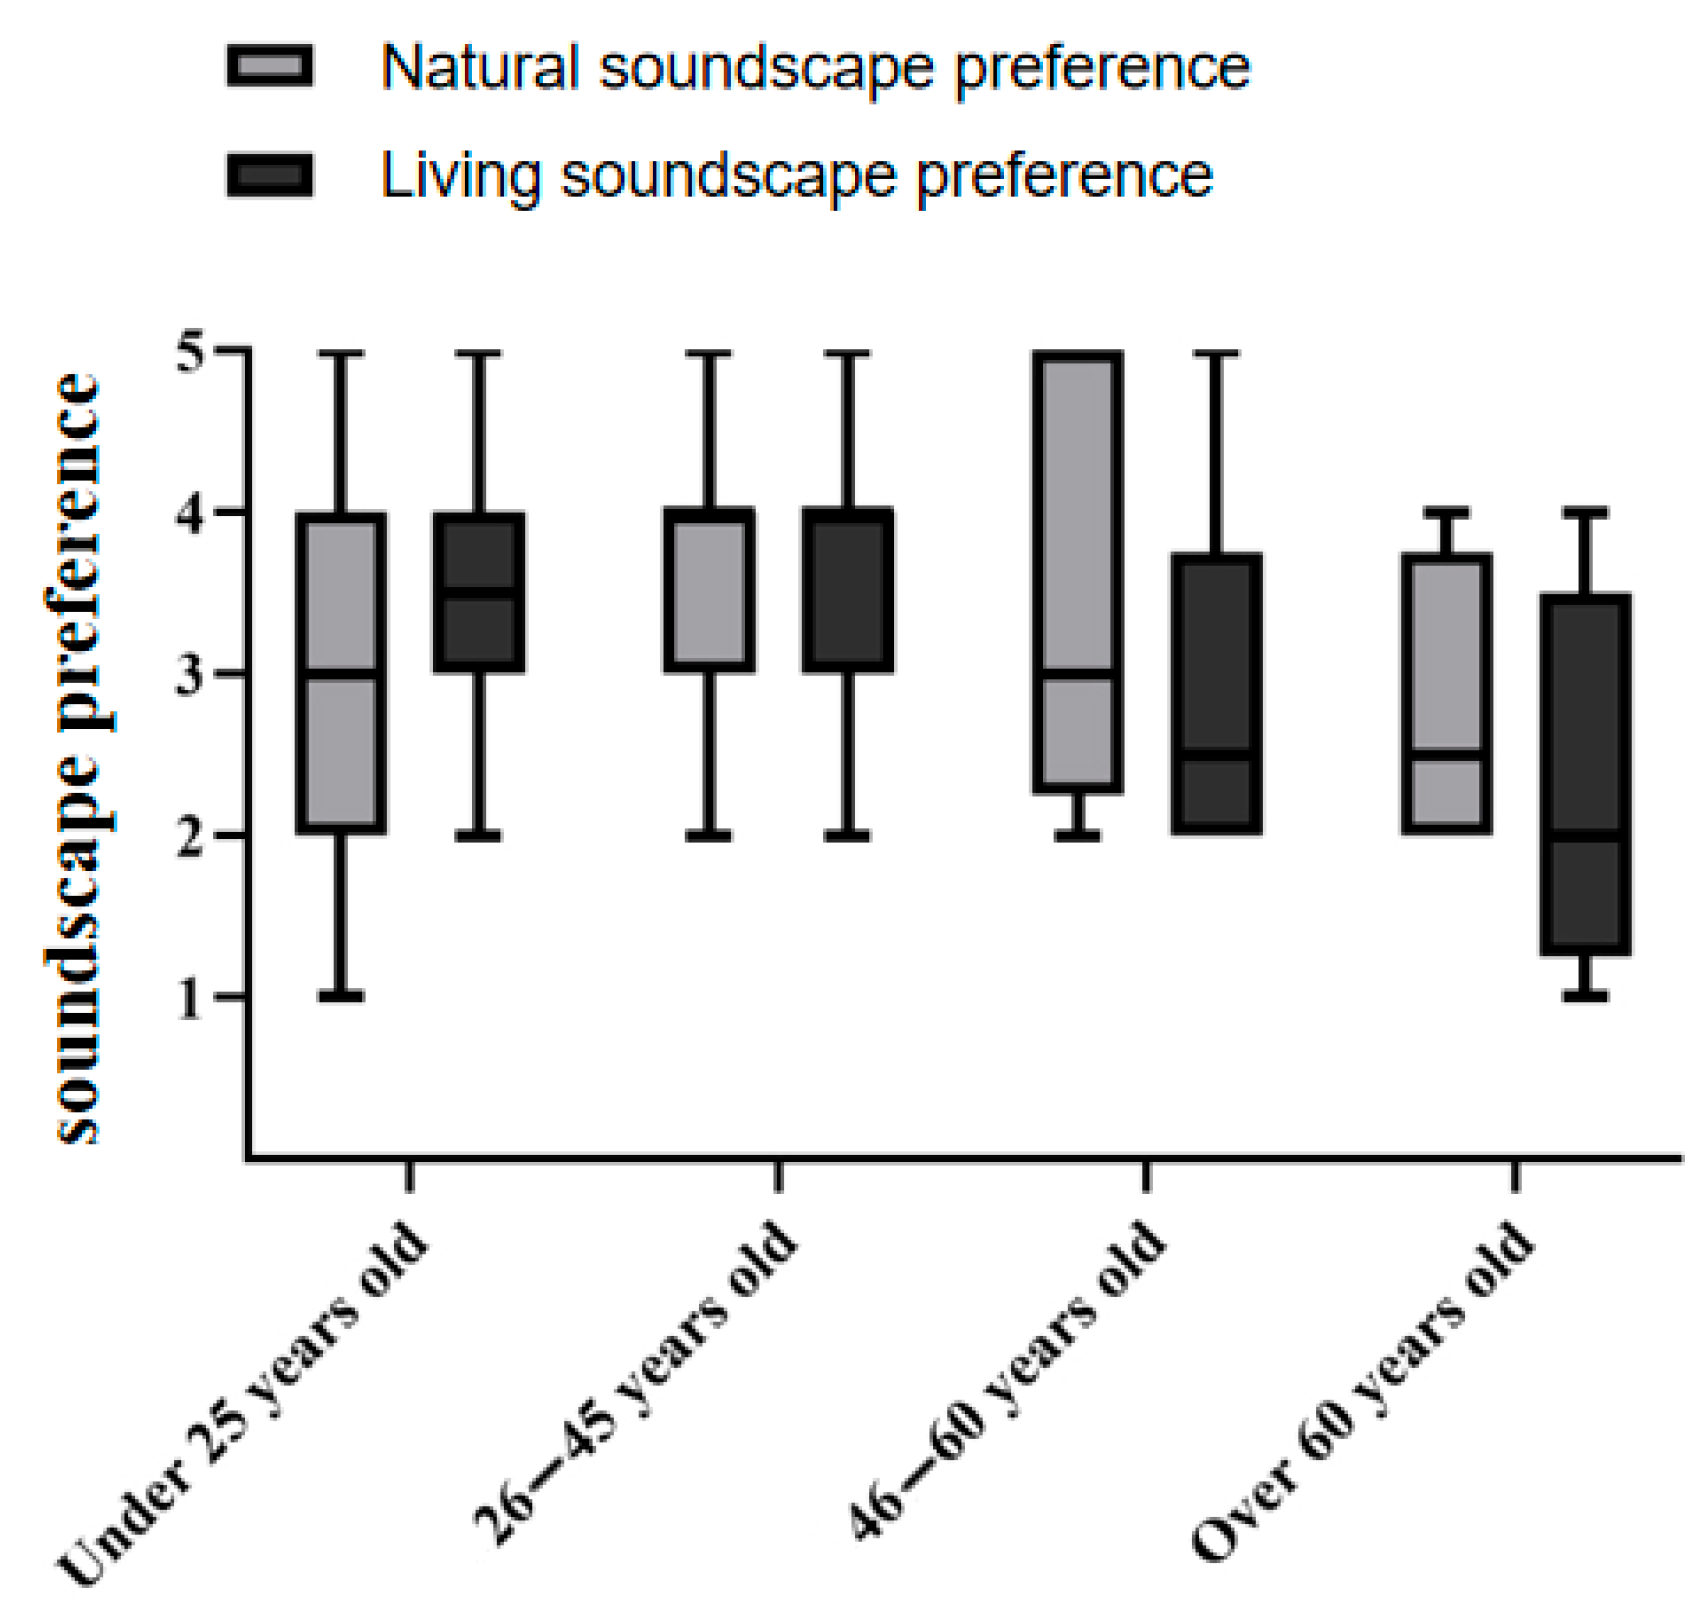
3.1. Differences in Soundscape Perception Preferences

According to the statistics on the perception frequency of various sounds under different sound source types, it was found that bird sounds and cicada sound had the highest perception in animal soundscape, accounting for 74.9% of the total frequency of animal soundscape. The natural soundscape was dominated by wind (36.2%) and leaves (46.7%). In the human activity soundscape, the perceived frequency of children’s playing, talking, and moving sounds is higher, accounting for nearly 80% of the total frequency of human activity sounds. The perception frequency of artificial soundscape is mainly composed of entertainment sounds (34.5%) and broadcasting sounds (26.9%). In terms of the traffic soundscape, the perceived frequencies of cruise ship whistles and sightseeing car driving sounds are similar, accounting for 59.7% and 40.3%, respectively (Table 5).
According to the statistical results of soundscape preference evaluation (Table 6), the median scores of natural soundscape, animal soundscape, human activity soundscape, traffic soundscape, and artificial soundscape were all over 4 points, which means that more than 50% of respondents rated these five types of soundscape preferences as agree (4 points) or strongly agree (5 points). Among them, the mean value of the animal soundscape (M = 3.65) was higher than that of the natural soundscape (M = 3.60) and that of the human activity soundscape (M = 3.48), while respondents’ preference for traffic soundscape and artificial soundscape was relatively low, with the artificial soundscape in particular being the lowest (M = 3.24). The standard deviation of animal soundscape preference score was 0.83, indicating that the deviation between the overall preference evaluation of animal soundscape and the mean value of preference (M = 3.65) was relatively small, and the data distribution was relatively concentrated. The standard deviation of preference for natural soundscape (1.02), human activity soundscape (0.97), traffic soundscape (1.03), and artificial soundscape (1.06) were all larger than those of animal soundscape, indicating that the evaluation of these four types of soundscape preferences was relatively dispersed compared with animal soundscape preferences. Eta2 is an effect size indicator in one-way analysis of variance (ANOVA), which reflects the degree to which the five soundscape types explain the variation in the dependent variable, soundscape preference.
The Eta2 of human activity soundscape preference was the highest (0.129), indicating that human activity soundscape had the largest impact on soundscape preference evaluation among the five soundscape types, while the Eta2 of artificial soundscape preference was the lowest (0.039), indicating that the difference between artificial soundscapes accounted for the smallest proportion in the total preference variation; that is, artificial soundscapes had the least impact on the soundscape preference evaluation. The influence of soundscape type on soundscape preference evaluation was as follows: human activity soundscape (0.129) > nature soundscape (0.089) > animal soundscape (0.061) > traffic soundscape (0.067) > artificial soundscape (0.039) (Table 6).
At the same time, in order to further explore the differences in soundscape perception preferences [42], an ANOVA was conducted on the gender, education background, identity, and other demographic statistical data of the surveyed population, and the results showed that the age distribution of the interviewees was significantly correlated with the soundscape preference evaluations of the natural soundscape and the human activity soundscape, respectively (Table 6). According to the age distribution (Table 7), there is a significant association at the 0.05 level between age distribution and natural soundscape preference and a significant association at the 0.01 level between age distribution and human activity soundscape preference. People aged 26–45 have the highest score for natural soundscape preference (3.82), and people over 60 have the lowest evaluation of natural soundscape preference (2.75). People aged 26–45 years old had the highest score (3.69), and people over 60 years old had the lowest score (2.25), which reflected the overall trend in the evaluation of population differences.
Among them, the people aged 26–45 show the most consistent evaluation of natural soundscape preference, while the people aged 46–60 show a great difference in the evaluation of natural soundscape preference. In the evaluation of human activity soundscape preference, the evaluations of people under 45 years old are more uniform, while the evaluations of people over 60 years old are more diverse. According to the observation of the maximum value, it was found that only the people over 60 years old had a maximum score of 4 points (agree), while the other people had a maximum score of 5 points (strongly agree). In addition, only the people under 25 years old had a natural soundscape preference score of 1 point (strongly disagree), and the people over 60 years old also had a minimum score of 1 point (strongly disagree). The score range of the rest of the population was 2–5 points (Figure 4).

3.2. Evaluation of CES Dimensions

According to the descriptive statistical results of the public’s evaluation of the importance and satisfaction of the eight dimensions of park CESs (Table 8), the evaluation range of importance scores is from 3.90 to 4.09, and the evaluation range of satisfaction scores is from 3.88 to 3.99. There is not much difference between the evaluation of importance and satisfaction, and the mean importance score of the eight dimensions is 4.00. The mean satisfaction score is 3.93, both of which are above 3 points, indicating that the overall evaluation of park CESs is good. The importance of the historical and cultural dimension was the highest (4.09), indicating that the respondents considered the historical and cultural dimension to be the most important dimension of cultural ecosystem service perception in forest parks. The sense of place had the lowest importance score (3.90) and was the least valued among CES. The satisfaction score for healing through sports was the highest (3.99), indicating that it was the CES dimension with the best experience in the park, while the satisfaction score for popular science education was the lowest (3.88), indicating that the public was the least satisfied with this CES dimension in the park.
Quadrant I (high importance + high satisfaction) is the dominant area of CESs, Quadrant II (medium importance + medium satisfaction) is the maintenance area, Quadrant III (low importance + low satisfaction) is the secondary improvement area, and Quadrant IV (high importance + low satisfaction) is the key improvement area (Figure 5). Among them, the dimension of leisure and entertainment is in Quadrant I, indicating that the leisure and entertainment experience in the park is relatively important to the public, and the actual satisfaction is relatively high, so it can be prioritized as the park’s advantage. The four dimensions of sense of place, healing through sports, social relations and aesthetic experience are distributed in Quadrant II, indicating that these four dimensions, related to CES satisfaction and importance evaluation of the forest park, have relatively flat perceived content, suggesting that their status quo can continue to be maintained. The dimension of popular science education is distributed in Quadrant III, and the importance of this CES dimension in this area is relatively lower than that of the advantage and maintenance areas, indicating that greater attention should be paid to its development. The dimension of historical culture and heritage protection is located in Quadrant IV, with a lower satisfaction score compared to other dimensions but a higher importance score, indicating that satisfaction with this CES dimension in the forest park needs to be improved.
Most of the CES dimensions are distributed in Quadrant II, indicating that the overall CES evaluation level is above average. The more ecological attributes, including leisure and entertainment, healing through sports, social relations, sense of place, and aesthetic experience, are located in quadrant I (advantage area) and Quadrant II (maintenance area), while the more cultural attributes, such as science popularization education, history and culture, and heritage protection are distributed in Quadrant III and Quadrant IV. According to the distribution in each quadrant, the importance of the dimension of popular science education is the same as that of aesthetic experience, but the satisfaction score is lower. The importance of the historical and cultural dimension is the highest among the eight dimensions, but the satisfaction score is lower than the average. The importance of heritage preservation is higher than most other dimensions, but its satisfaction is the lowest among the eight dimensions. According to the IPA analysis results of each dimension of forest park CESs, specific strategies for park planning can be further proposed.

3.3. Correlation Between Soundscape Perception Preference and CES

The research results show that there is an interaction between soundscape preference evaluation and the public’s satisfaction with CESs in national cultural parks. According to the correlation results (Table 9), there was a significant positive correlation between the natural soundscape and all CES dimensions, as well as a significant positive correlation between the human activity soundscape and CES dimensions, except for exercise healing (EH-2) and social relationships (SR-1). Compared with other soundscape preferences, natural soundscape and human activity soundscape have a stronger correlation with CES dimensions. Among all soundscape types, artificial soundscape is only correlated with the dimension of leisure and entertainment, aesthetic experience (LE-2, AE-3), and science education (SE-1), and is the least correlated soundscape type, indicating that artificial soundscape preference evaluation has the least impact on the satisfaction of CES dimensions. From the perspective of CES dimensions, it was found that the leisure and entertainment dimension has a significant positive correlation with the preference evaluation of the five soundscapes. The aesthetic experience dimension and social relationship dimension are significantly correlated with the four soundscape preferences, indicating that leisure and entertainment, aesthetic experience, and social relationships are highly correlated with soundscape preferences. The exercise healing dimension (EH-2) and social relation dimension (SR-1) were less correlated with soundscape preference evaluation. The exercise healing dimension (EH-2) was only correlated with animal soundscape preference and natural soundscape preference, while the social relationships dimension (SR-1) was only correlated with natural soundscape preference, indicating the least correlation between these two dimensions and soundscape preference evaluation.

4. Discussion

4.1. Reasons for Differences in Soundscape Preference Evaluations

Respondents’ preferences for the overall soundscape of forest parks tended to be above average, but there are differences in their evaluations of the five different soundscape preferences. Higher ratings for natural soundscape preferences and animal soundscape preferences indicate that people prefer natural sounds in the park, which is similar to the results of previous studies [43,44,45]. On the other hand, the traffic soundscape preference and artificial soundscape preference were evaluated as having low preference in the park. These results may be due to the construction characteristics of the Grand Canal National Cultural Park [46]. The main construction goal of the park is to provide an ecological environment experience [47]. Therefore, in order to control the impact of noise on ecological environment experience, the overall planning of the park intentionally separates the recreational facilities area from the scenic spots dominated by natural soundscapes, such as sports trails, Luliu Yaohe, and Popular Reed area, etc. However, people still believe that the sounds produced by recreational facilities and children will cause an adverse soundscape experience that affects the experience of the natural environment. The human activity soundscape has the greatest impact on the evaluation of soundscape preference. The sounds of human activity, including children’s sounds, the sounds of conversation, movement sounds, and other sounds, occur frequently in daily life, often arousing people’s sense of familiarity and easily evoking their emotional resonance [48]. In addition, the low frequency of musical instruments playing in the artificial soundscape is often ignored by tourists, which may be the reason why the artificial soundscape has little influence on the evaluation of soundscape preference.
At the same time, to improve the evaluation of the artificial soundscape, we can give priority to adjusting the sounds of entertainment facilities and broadcasts, which have the highest frequency in the artificial soundscape. People under 25 years old and those between 26 and 45 years old have a higher preference score for human activity sounds, which may be related to entertainment facilities in parks. Most users of entertainment facilities are children and young people under 18 years old and their parents [49]. According to the statistical results of sound frequency, entertainment facilities contribute the most to the perceived frequency within the human activity soundscape. Therefore, people in this age group can have more exposure to the human activity soundscape in parks and have more positive feelings. Individuals aged 26 to 45 and 45 to 60 have higher preference for natural soundscape, which may be related to middle-aged people’s greater preference for natural and relaxing soundscape experience compared with other age groups [50]. However, people over 60 years old have the lowest preference for natural soundscape and human activity soundscape among different age groups, which is often because the elderly may prefer a relatively quiet environment [51], so they have a more negative experience of soundscape. The difference in soundscape preference caused by age confirms the research hypothesis that natural soundscape preference is related to the change in environmental needs during the individual life cycle. This finding complements the discussion on ‘population heterogeneity of soundscape CES Association’ in research question 2.

4.2. Analysis of the Advantages of Cultural Attribute Dimensions Based on IPA

According to the IPA analysis, cultural attribute dimensions (popular science education, history and culture, and heritage protection) were categorized into Quadrant III (low importance + low satisfaction) and IV (high importance + low satisfaction), where satisfaction ratings lagged relative to importance rankings. Notably, the heritage protection dimension showed the lowest satisfaction among all eight CES dimensions, indicating a critical gap between public expectations and current performance. Although the park has implemented educational measures—such as birdcall-based science broadcasting at Yuedao Warbler and canal history placards along the walkways—these efforts have not sufficiently elevated the perceived value of cultural attributes. The parity in importance between popular science education and aesthetic experience, coupled with the former’s low satisfaction, further highlights deficiencies in cultural engagement.
To address these gaps, we propose evidence-based interventions: Install solar-powered audio pillars at heritage sites, activating period-accurate soundscapes (boatmen’s chants, trade ambience) via proximity sensors. QR codes will link to multilingual narratives blending historical context with scientific explanations of water management technologies, building on Hangzhou Xixi Wetland’s 42% increase in engagement through similar installations [52]. Pair birdsong with wetland ecology audio guides along the Ecosystem Trail. Integrate reconstructed engineering sounds with technical annotations along the Historical Acoustics Trail. Establish an interactive sound lab that allows visitors to record park sounds via a gamified app, aligning with studies showing 35–40% higher educational satisfaction for interactive vs. static displays [53]. Establish a soundscape education volunteer program: Recruit locals to conduct guided sound tours, maintain installations, and host seasonal workshops (e.g., “Canal Acoustic Archaeology” in autumn). This leverages research indicating that living soundscapes (children’s play, guided tours) enhance emotional resonance, fostering deeper cultural identification [54,55].
In contrast, ecological dimensions (recreation, healing through sports, social relations, sense of place, aesthetic experience) occupied IPA Quadrant I (high importance + high satisfaction) and II (medium importance + medium satisfaction), exceeding public expectations. This aligns with the park’s ecological construction mandate, validating its success in delivering natural environment experiences.

4.3. Analysis of the Correlation and Impact Between Soundscape Preference and CES Dimension

Previous research results show that soundscape preference not only affects people’s quality of life, activities, and psychological state, but also affects people’s evaluation of and connection with the external environment [56,57]. The results of this study indicate that there is an interaction between soundscape preference evaluation and the public’s perception of CESs in national cultural parks. From the perspective of evaluating different types of soundscape preferences, there is a significant positive correlation between natural sound preference and the eight CES dimensions, indicating that natural sounds are closely related to park CESs and can have the greatest influence on their perception, so they can be prioritized in soundscape planning.
However, the correlation between artificial sound preference evaluations and CES dimensions is lower than that of the other four soundscape types, which may be related to the low score for artificial sound preference itself. Comparisons with other cultural parks highlight contextual differences. A Hangzhou West Lake study found artificial soundscapes enhanced aesthetic experience and historical culture, differing from our results—likely because West Lake emphasizes cultural performances, while Tongzhou Park prioritizes natural ecology [58]. Conversely, a Kyoto Arashiyama Bamboo Grove study aligns with our findings: natural soundscapes strongly correlate with all CES dimensions, underscoring their universal value in heritage sites [59]. These comparisons emphasize context-specific design: cultural-performance parks may utilize artificial sounds, while ecological parks such as Tongzhou should preserve natural soundscapes.
From the perspective of CES dimensions, the leisure and entertainment dimension showed a significant positive correlation with the five types of soundscape preference evaluations, and it was the only dimension that showed a significant correlation with all types of soundscape preference evaluation in parks. In addition, the leisure and entertainment dimension was the dominant area dimension in the IPA analysis. This indicates that the establishment of a close relationship between soundscape preferences may improve the evaluation of leisure and entertainment dimensions. EH-2 (parks can meet the needs of emotional relief) and SR-1 (parks can meet the needs of daily parent–child interaction) showed the lowest correlation with soundscape preference evaluation. EH-2 was only related to the preference for natural sounds and animal sounds, while SR-1 was significantly related to the preference for natural soundscapes. This indicates that the natural environment of the park is the main place to relieve emotions and meet the needs of parent–child activities. According to the IPA analysis results, the CES dimensions located in the key improvement area, namely the heritage protection and the historical and cultural dimension, were found to be significantly positively correlated with the natural soundscape, the human activity soundscape, and the traffic soundscape, indicating that we can improve the public’s evaluation of their experience with the heritage protection dimension and the historical and cultural dimension by improving the soundscape preference evaluations of natural sounds, human activity sounds, and traffic sounds.

5. Conclusions

Based on the soundscape survey and evaluations of the Cultural Ecosystem Services (CESs) of Tongzhou Grand Canal National Cultural Park, combined with relevance analysis, the key findings are as follows:
(1)
Soundscape preference patterns: The public exhibited higher preferences for natural and animal soundscapes, while traffic and artificial soundscapes were less favored. The ANOVA results showed that human activity soundscapes had the greatest impact on preference evaluations, whereas artificial soundscapes had the least. Age significantly influenced preferences: individuals aged 26–45 showed the strongest affinity for natural and human activity soundscapes, while those over 60 had the lowest ratings.
(2)
CES evaluation results: The park’s CESs received favorable overall ratings (mean importance = 4.00, satisfaction = 3.93). Recreation and healing through sports fell into the IPA advantage or maintenance areas, while science education and cultural attribute dimensions required improvement. History and culture had the highest importance score, but heritage protection had the lowest satisfaction among the eight dimensions.
(3)
Soundscape–CES correlations: Soundscape preference significantly interacted with CES satisfaction. Preference for natural soundscapes showed positive correlations with all CES dimensions, exerting the strongest influence. Artificial soundscape correlated only with specific dimensions. The leisure dimension had strong links with various soundscapes, while the heritage protection dimension was significantly associated with natural, human activity, and traffic soundscapes.
Although this study provides analysis results on the correlation between soundscape preference and CES dimensions, some factors may have affected the final results during the investigation process. The sample was confined to Tongzhou Grand Canal Forest Park in Beijing, potentially limiting the generalizability of findings to other national cultural parks with distinct geographical, cultural, or climatic contexts. With a sample size of 130, while statistically sufficient for basic correlations, the universality of the research results may be limited by the regional background of the surveyed population. The correlation analyses revealed associative relationships, but they cannot establish causality. For example, whether natural soundscape preference directly drives CES perception or is mediated by other factors remains unaddressed. Therefore, there are some limitations to this study.
Future research could focus on experimental designs such as controlled soundscape simulations or longitudinal studies to test the relationships between soundscape preference and CES perception. Additionally, expanding the research area to other sections of the Canal National Cultural Park would help assess regional variability in the soundscape–CES dynamics. Furthermore, designing and testing context-specific soundscape interventions—such as historical sound installations—to enhance cultural CES dimensions, while integrating quantitative evaluations with qualitative visitor interviews, could provide deeper insights for targeted management strategies.

Author Contributions

Conceptualization, L.M.; methodology, L.M. and H.H.; software, L.M., H.H. and Z.X.; validation, L.M.; formal analysis, L.M. and H.H.; investigation, L.M., H.H. and Z.X.; resources, L.M. and H.H.; data curation, L.M., H.H., and Z.X.; writing—original draft preparation, L.M. and H.H.; writing—review and editing, L.M.; visualization, H.H. and X.Z.; supervision, L.M. and X.Z.; project administration, L.M. and X.Z.; funding acquisition, L.M. All authors have read and agreed to the published version of the manuscript.

Funding

This work was funded by the Ministry of Education’s Humanities and Social Sciences Research Project (Grant No. 22YJA760058); the Natural Science Foundation of Hebei Province (Grant No. E2024210016); Shijiazhuang City Postgraduate School Basic Research Project (Grant No. 241791407A); Research Base for Humanities and Social Sciences in Higher Education Institutions in Hebei Province—Research Center for Sustainable Development of Human Settlements, Shijiazhuang Tiedao University.

Data Availability Statement

The data presented in this study are available on request from the corresponding author. The data are not publicly available due to privacy.

Conflicts of Interest

The authors declare no conflicts of interest.

References

  1. Gong, D. Interpretation of the origin and characteristics of the concept of National Cultural Park. Chin. Gard. 2021, 37, 38. [Google Scholar]
  2. Li, F.; Zou, T. National Culture Park: Logic, origins and implications. Tour. Trib. 2021, 36, 14–26. [Google Scholar]
  3. Zou, T.; Qiu, Z.; Huang, X. The origin and vision of National Cultural Park management policy in China. J. Resour. Ecol 2022, 13, 720–733. [Google Scholar]
  4. Runte, A. National Parks: The American Experience; U of Nebraska Press: Lincoln, NE, USA, 1997. [Google Scholar]
  5. Everhart, W. The National Park Service; Routledge: New York, NY, USA, 2019. [Google Scholar]
  6. Miller, N.P. US National Parks and management of park soundscapes: A review. Appl. Acoust. 2008, 69, 77–92. [Google Scholar] [CrossRef]
  7. Zhang, S.; Liu, J.; Pei, T.; Chan, C.S.; Wang, M.; Meng, B. Tourism value assessment of linear cultural heritage: The case of the Beijing–Hangzhou Grand Canal in China. Curr. Issues Tour. 2023, 26, 47–69. [Google Scholar] [CrossRef]
  8. Shi, K.; Zhang, Y.; Liu, Y. Study on Tourists’ Perception of the Grand Canal Cultural Heritage Based on Network Travels. In Proceedings of the 2019 IEEE Fifth International Conference on Big Data Computing Service and Applications (BigDataService), Newark, CA, USA, 4–9 April 2019; pp. 79–82. [Google Scholar]
  9. Zhang, S.; Liu, J.; Pei, T.; Chan, C.S. Perception in cultural heritage tourism: An analysis of tourists to the Beijing-Hangzhou Grand Canal, China. J. Tour. Cult. Chang. 2023, 21, 569–591. [Google Scholar] [CrossRef]
  10. Wei, Q. Negotiation of social values in the World Heritage listing process: A case study on the Beijing-Hangzhou Grand Canal, China. Archaeologies 2018, 14, 501–526. [Google Scholar] [CrossRef]
  11. Qian, Z.; Yang, H.; Zhang, J. Sustainable Development of the Grand Canal Cultural Heritage Ecological Reserve: Policy Framework, Construction Model, Technological Innovation. In Proceedings of the 2024 3rd International Conference on Social Sciences and Humanities and Arts (SSHA 2024); Atlantis Press: Dordrecht, The Netherlands, 2024; pp. 550–562. [Google Scholar]
  12. Cao, L.; Han, Y.; Li, Z. Spatial Pattern Construction of the Grand Canal National Cultural Park in Tianjin from the Perspective of Narrative Space. Landsc. Archit. 2023, 30, 65–72. [Google Scholar]
  13. He, Y.; Wu, L. Analysis on spatial development mode of eco-sports tourism in Grand Canal landscape environment culture belt. Environ. Monit. Assess. 2022, 194, 925. [Google Scholar] [CrossRef]
  14. Zhang, Y.; Jing, Z.; Huang, Q.; Wang, X.; Sun, W.; Zhang, C.; Wang, J.; Zhong, Y.; Wang, J.; Tan, L.; et al. On conservation of world heritage Beijing-Hangzhou grand canal for enhancing cultural ecosystem services. Herit. Sci. 2023, 11, 269. [Google Scholar] [CrossRef]
  15. Gai, S.; Fu, J.; Rong, X.; Dai, L. Users’ views on cultural ecosystem services of urban parks: An importance-performance analysis of a case in Beijing, China. Anthropocene 2022, 37, 100323. [Google Scholar] [CrossRef]
  16. Smith, M.; Ram, Y. Tourism, landscapes and cultural ecosystem services: A new research tool. Tour. Recreat. Res. 2017, 42, 113–119. [Google Scholar] [CrossRef]
  17. Cheng, X.; Van Damme, S.; Li, L.; Uyttenhove, P. Evaluation of cultural ecosystem services: A review of methods. Ecosyst. Serv. 2019, 37, 100925. [Google Scholar] [CrossRef]
  18. Zhao, J.; Yan, Y.; Deng, H.; Liu, G.; Dai, L.; Tang, L.; Shi, L.; Shao, G. Remarks about landsenses ecology and ecosystem services. Int. J. Sustain. Dev. World Ecol. 2020, 27, 196–201. [Google Scholar] [CrossRef]
  19. Liu, J.; Wen, J.; Zhang, X. Research progress of landscape ecology and Its Enlightenment on human settlements. J. West. Hum. Settl. 2024, 38, 75–81. [Google Scholar]
  20. Mijatov Ladičorbić, M.; Dragin, A.S.; Surla, T.; Tešin, A.; Amezcua-Ogáyar, J.M.; Calahorro-López, A.; Stojanović, V.; Zadel, Z.; Košić, K.; Ivanović, O.M.; et al. Towards Healthy and Sustainable Human Settlement: Understanding How Local Communities Perceive and Engage with Spa Tourism Development Initiatives in Rural Areas. Land 2024, 13, 1817. [Google Scholar] [CrossRef]
  21. Dai, P.; Zhang, S.; Chen, Z.; Gong, Y.; Hou, H. Perceptions of cultural ecosystem services in urban parks based on social network data. Sustainability 2019, 11, 5386. [Google Scholar] [CrossRef]
  22. Zhang, H.; Huang, R.; Zhang, Y.; Buhalis, D. Cultural ecosystem services evaluation using geolocated social media data: A review. Tour. Geogr. 2022, 24, 646–668. [Google Scholar] [CrossRef]
  23. Van Berkel, D.B.; Verburg, P.H. Spatial quantification and valuation of cultural ecosystem services in an agricultural landscape. Ecol. Indic. 2014, 37, 163–174. [Google Scholar] [CrossRef]
  24. Ram, Y.; Smith, M.K. An assessment of visited landscapes using a Cultural Ecosystem Services framework. Tour. Geogr. 2022, 24, 523–548. [Google Scholar] [CrossRef]
  25. Rall, E.; Bieling, C.; Zytynska, S.; Haase, D. Exploring city-wide patterns of cultural ecosystem service perceptions and use. Ecol. Indic. 2017, 77, 80–95. [Google Scholar] [CrossRef]
  26. Vidal, D.G.; Dias, R.C.; Oliveira, G.M.; Dinis, M.A.P.; Filho, W.L.; Fernandes, C.O.; Barros, N.; Maia, R.L. A review on the cultural ecosystem services provision of urban green spaces: Perception, use and health benefits. In Sustainable Policies and Practices in Energy, Environment and Health Research: Addressing Cross-Cutting Issues; Springer: Berlin/Heidelberg, Germany, 2022; pp. 287–331. [Google Scholar]
  27. Hubatova, M.; McGinlay, J.; Parsons, D.J.; Morris, J.; Graves, A.R. Assessing preferences for cultural ecosystem services in the English countryside using Q methodology. Land 2023, 12, 331. [Google Scholar] [CrossRef]
  28. Crouzat, E.; De Frutos, A.; Grescho, V.; Carver, S.; Büermann, A.; Carvalho-Santos, C.; Kraemer, R.; Mayor, S.; Pöpperl, F.; Rossi, C.; et al. Potential supply and actual use of cultural ecosystem services in mountain protected areas and their surroundings. Ecosyst. Serv. 2022, 53, 101395. [Google Scholar] [CrossRef]
  29. Clemente, P.; Calvache, M.; Antunes, P.; Santos, R.; Cerdeira, J.O.; Martins, M.J. Combining social media photographs and species distribution models to map cultural ecosystem services: The case of a Natural Park in Portugal. Ecol. Indic. 2019, 96, 59–68. [Google Scholar] [CrossRef]
  30. Botteldooren, D.; Lavandier, C.; Preis, A.; Dubois, D.; Aspuru, I.; Guastavino, C.; Brown, L.; Nilsson, M.; Andringa, T.C. Understanding urban and natural soundscapes. In Forum Acusticum 2011; European Accoustics Association (EAA): Madrid, Spain, 2011; pp. 2047–2052. [Google Scholar]
  31. Heras-Saizarbitoria, I.; Boiral, O. ISO 9001 and ISO 14001, towards a research agenda on management system standards. Int. J. Manag. Rev. 2013, 15, 47–65. [Google Scholar] [CrossRef]
  32. Liu, Y.; Ye, J.; Chen, L.; He, T.; Zheng, Y. Progress in Research on Soundscape of China Classical Gardens. Sichuan Archit. 2022, 42, 4–8. [Google Scholar]
  33. Yang, L.; Liu, J.; Albert, C.; Guo, X. Exploring the effects of soundscape perception on place attachment: A comparative study of residents and tourists. Appl. Acoust. 2024, 222, 110048. [Google Scholar] [CrossRef]
  34. Liu, J.; Kang, J.; Luo, T.; Behm, H. Landscape effects on soundscape experience in city parks. Sci. Total Environ. 2013, 454, 474–481. [Google Scholar] [CrossRef]
  35. Fu, J. Exploring the construction path of the Grand Canal National Cultural Park based on territorial spatial planning. J. Nat. Resour. 2023, 38, 2312–2331. [Google Scholar] [CrossRef]
  36. Li, Y.; Xie, L.; Zhang, L.; Huang, L.; Lin, Y.; Su, Y.; AmirReza, S.; He, S.; Zhu, C.; Li, S.; et al. Understanding different cultural ecosystem services: An exploration of rural landscape preferences based on geographic and social media data. J. Environ. Manag. 2022, 317, 115487. [Google Scholar] [CrossRef]
  37. Mao, L.; Zhang, X.; Ma, J.; Jia, Y. Cultural relationship between rural soundscape and space in Hmong villages in Guizhou. Heliyon 2022, 8, e11641. [Google Scholar] [CrossRef]
  38. Liu, J.; Kang, J.; Behm, H.; Luo, T. Effects of landscape on soundscape perception: Soundwalks in city parks. Landsc. Urban Plan. 2014, 123, 30–40. [Google Scholar] [CrossRef]
  39. Hong, J.Y.; Jeon, J.Y. Influence of urban contexts on soundscape perceptions: A structural equation modeling approach. Landsc. Urban Plan. 2015, 141, 78–87. [Google Scholar] [CrossRef]
  40. Xu, X.; Yang, R.; Peter, N.; Derek, T. A review of soundscape research in national parks. Chin. Landscpae Archit. 2016, 32, 25–30. [Google Scholar]
  41. Li, M.; Han, R.; Xie, H.; Zhang, R.; Guo, H.; Zhang, Y.; Kang, J. Mandarin Chinese translation of the ISO-12913 soundscape attributes to investigate the mechanism of soundscape perception in urban open spaces. Appl. Acoust. 2024, 215, 109728. [Google Scholar] [CrossRef]
  42. Yang, W.; Kang, J. Soundscape and sound preferences in urban squares: A case study in Sheffield. J. Urban Des. 2005, 10, 61–80. [Google Scholar] [CrossRef]
  43. Fang, X.; Gao, T.; Hedblom, M.; Xu, N.; Xiang, Y.; Hu, M.; Chen, Y.; Qiu, L. Soundscape perceptions and preferences for different groups of users in urban recreational forest parks. Forests 2021, 12, 468. [Google Scholar] [CrossRef]
  44. Buxton, R.T.; Pearson, A.L.; Allou, C.; Fristrup, K.; Wittemyer, G. A synthesis of health benefits of natural sounds and their distribution in national parks. Proc. Natl. Acad. Sci. USA 2021, 118, e2013097118. [Google Scholar] [CrossRef]
  45. Gim, J.; Lee, J.Y.; Ki, K.S. Differences in the soundscape characteristics of a natural park and an urban park. Korean J. Environ. Ecol. 2017, 31, 112–118. [Google Scholar] [CrossRef]
  46. Lyu, Y.Y.; Lu, S. Evaluation of Landscape Resources of Urban Forest Park Based on GIS–Take Beijing Tongzhou Grand Canal Forest Park as an Example. In Proceedings of the 2019 International Conference on Robots & Intelligent System (ICRIS), Haikou, China, 15–16 June 2019; IEEE: Piscataway, NJ, USA, 2019; pp. 418–424. [Google Scholar]
  47. Zhang, F.; Yang, L.; Luo, X. A study on the distribution and utilization of recreational resources along the grand canal culture belt. Chin. J. Urban Environ. Stud. 2019, 7, 1950015. [Google Scholar] [CrossRef]
  48. Brown, A.L. A review of progress in soundscapes and an approach to soundscape planning. Int. J. Acoust. Vib 2012, 17, 73–81. [Google Scholar] [CrossRef]
  49. Huynh, L.T.M.; Gasparatos, A.; Su, J.; Dam Lam, R.; Grant, E.I.; Fukushi, K. Linking the nonmaterial dimensions of human-nature relations and human well-being through cultural ecosystem services. Sci. Adv. 2022, 8, eabn8042. [Google Scholar] [CrossRef] [PubMed]
  50. Bockstael, A.; Steele, D.; Trudeau, C.; Guastavino, C. Forever young: Is age of importance in urban soundscape design. In Proceedings of the 26th International Congress on Sound and Vibration, Montreal, Canada, 7–11 July 2019; Canadian Acoustical Association: Montreal, Canada, 2019. [Google Scholar]
  51. Engel, M.S.; Fiebig, A.; Pfaffenbach, C.; Fels, J. A review of socio-acoustic surveys for soundscape studies. Curr. Pollut. Rep. 2018, 4, 220–239. [Google Scholar] [CrossRef]
  52. Pan, L.; Cui, L.; Wu, M. Tourist behaviors in wetland park: A preliminary study in Xixi National Wetland Park, Hangzhou, China. Chin. Geogr. Sci. 2010, 20, 66–73. [Google Scholar] [CrossRef]
  53. Guo, R.Z.; Lin, L.; Xu, J.F.; Dai, W.H.; Song, Y.B.; Dong, M. Spatio-temporal characteristics of cultural ecosystem services and their relations to landscape factors in Hangzhou Xixi National Wetland Park, China. Ecol. Indic. 2023, 154, 110910. [Google Scholar] [CrossRef]
  54. Jennings, P.; Cain, R. A framework for improving urban soundscapes. Appl. Acoust. 2013, 74, 293–299. [Google Scholar] [CrossRef]
  55. Van Renterghem, T.; Vanhecke, K.; Filipan, K.; Sun, K.; De Pessemier, T.; De Coensel, B.; Joseph, W.; Botteldooren, D. Interactive soundscape augmentation by natural sounds in a noise polluted urban park. Landsc. Urban Plan. 2020, 194, 103705. [Google Scholar] [CrossRef]
  56. Liu, J.; Yang, L.; Xiong, Y.; Yang, Y. Effects of soundscape perception on visiting experience in a renovated historical block. Build. Environ. 2019, 165, 106375. [Google Scholar] [CrossRef]
  57. Ma, K.W.; Mak, C.M.; Wong, H.M. Effects of environmental sound quality on soundscape preference in a public urban space. Appl. Acoust. 2021, 171, 107570. [Google Scholar] [CrossRef]
  58. Zhang, S.; Yu, W. Canal Heritage Tourism Utilization Models: Experience and Inspirations from the Grand Canal (Beijing Section). Land 2024, 13, 860. [Google Scholar] [CrossRef]
  59. Jiao, Y.; Ding, Y.; Zha, Z.; Okuro, T. Crises of biodiversity and ecosystem services in Satoyama landscape of Japan: A review on the role of management. Sustainability 2019, 11, 454. [Google Scholar] [CrossRef]
Figure 1. Research scope and main research sites.
Buildings 15 02360 g001
Figure 2. Cloud picture of high-frequency words.
Buildings 15 02360 g002
Figure 3. Visualization of soundscape words.
Buildings 15 02360 g003
Figure 4. Comparison of natural sound preference and human activity sound preference groups.
Buildings 15 02360 g004
Figure 5. IPA quadrant diagram.
Buildings 15 02360 g005
Table 1. Top 50 high-frequency words in social media text crawling.
WordFrequencyWordFrequencyWordFrequency
Park754recommend245entertainment109
Flower710lotus243mood108
Boat646wharf238natural106
Nice476youngster233graceful95
Children447air215comfortable94
Free428area204insolation87
Big424drive184holiday86
Tent410doorway182Grand Canal81
Bicycle369picnic173both sides79
Environment348Tickets160river surface72
Facilities314walk156sunshine67
Far302leisure152many people66
Very293accompany151footpath65
Weekend291field139ancient62
Stroll284clean138
Landscape269water transport135
Camp269navigation131
Cycling252punch in119
Table 2. Representative sound source.
Main Soundscape TypesAnimal SoundscapeNature SoundscapeHuman Activity SoundscapeArtificial SoundscapeTraffic Soundscape
Representative
sound sources
Cicada sounds
Bird sounds
Frog sounds
Duck sounds
Water
Wind
Leaves
Children’s sounds
Conversation sounds
Singing sounds
Movement sounds
Footsteps
Sweeping sounds
Entertainment sounds
Radio sounds
Instrumental sounds
Construction sounds
Boat sounds
Traffic sounds
Sightseeing car sounds
Table 3. Introduction to the survey location.
Site 1Site 2Site 3Site 4
Located to the south of Lutong Bridge in Forest Park, it is mainly landscaped with plants. The overall landscape has a strong historical memory and natural scenery characteristics, and the natural sound is abundant.The only area in the park surrounded by water on all sides, it features Qiao planting, irrigation, flowers, grass, ground cover, wet and other kinds of plants (more than 100 species. It is the habitat of many birds, and animal sounds and natural sounds are prominent.There is a pro-level platform built in the area, so that visitors can walk into the deep reed of the Grand Canal, and the sound environment is obviously different from other areas.With the Grand Canal transport dock as the background, the canal transport culture is displayed. There are special historical and cultural sounds, and artificial and natural sounds are integrated.
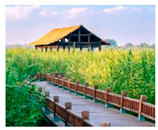
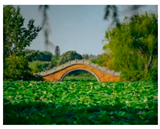
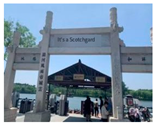
Buildings 15 02360 i001Buildings 15 02360 i002Buildings 15 02360 i003Buildings 15 02360 i004
Site 1: Luhe Yaoliu
scenic spot
Site 2: Yuedao Wenying
scenic spot
Site 3: Popular Reed
scenic spot
Site 4: Silver Maple Autumn Fruit scenic spot
Table 4. Meaning of CES dimension.
DimensionConnotative DefinitionCodeDescription
Leisure and entertainmentThe value of leisure and recreational activities provided in the parkLE-1Parks can meet the demand for dynamic entertainment activities
LE-2Parks can meet the demand for static entertainment activities
Aesthetic experienceThe aesthetic perception and viewing value provided by the internal scenery of the parkAE-1The water scenery in the park is rich and aesthetically pleasing
AE-2The night scenery in the park is rich and aesthetically pleasing
AE-3The floral landscape in the park is rich and aesthetically pleasing
Exercise healingThe value of sports-related relaxation and stress relief provided by the parkEH-1Parks can meet the needs of sports and fitness
EH-2Parks can meet the needs of regulating emotions and releasing stress
Social relationshipsParks provide opportunities for the public to interact and meet their social needsSR-1Parks can meet the daily needs of parent–child interaction
SR-2Parks can meet the needs of daily social activities with friends, colleagues, etc.
Science educationParks provide the public with opportunities for knowledge dissemination and educationSE-1The educational activities that can be carried out on the site are sufficiently diverse
SE-2There are plenty of volunteer activities available in the park
History and cultureThe cultural and historical value contained in the parkHCParks can reflect the historical value and distinctive culture of the canal
Heritage protectionThe contribution value related to the heritage protection function provided by the parkHPParks play a protective role in the cultural heritage of the Grand Canal
A sense
of place
The value of parks in evoking local memories or attachment among the publicSPThere is a place within the park that can evoke memories or special emotions in you
Table 5. Sound perception frequency statistics.
Soundscape TypeRepresentative Sounds Frequency Proportion
Animal soundscapeCicada sounds35.18%
Bird sounds39.74%  max
Frog sounds18.24%
Duck sounds6.84%
Natural soundscapeWater17.14%
Wind36.19%
Leaves46.67%  max
Human activity soundscapeChildren’s sounds25.14%
Conversation sounds29.43%  max
Singing sounds7.14%
Movement sounds22.57%
Footsteps10.29%
Sweeping sounds5.43%
Artificial soundscapeEntertainment sounds34.52%  max
Radio sounds26.90%
Instrumental sounds21.32%
Construction sounds17.26%
Traffic soundscapeCruise boat whistles sounds59.66%  max
Sightseeing car driving sounds40.34%
The ‘green value’ represents the sound type with the highest frequency proportion.
Table 6. Evaluation results of soundscape preferences.
Latent VariableMean ValueStandard DeviationFPEta2
Animal soundscape preference3.650.832.0760.1080.061
Natural soundscape preference3.601.023.1150.030 *0.089
human activity soundscape preference3.480.974.7230.004 **0.129
Traffic soundscape preference3.251.032.3080.0810.067
Artificial soundscape preference3.241.061.3090.2760.039
Spearman’s rho correlation; * p < 0.05, ** p < 0.01.
Table 7. Results of correlation analysis.
Age Distribution (Mean ± SD)FP
Under 25Ages 26–4545–60 Years OldOver 60 Years old
Natural soundscape preference3.26 ± 1.163.82 ± 0.853.50 ± 1.312.75 ± 0.963.1150.030 *
Human activity soundscape preference3.37 ± 0.883.69 ± 0.892.88 ± 1.132.25 ± 1.264.7230.004 **
Spearman’s rho correlation; * p < 0.05, ** p < 0.01.
Table 8. Importance and performance evaluation of CESs.
CES DimensionsImportance (I) Mean ValuePerformance (P) Mean Value
Leisure and entertainment (LE)4.083.95
Aesthetic experience (AE)3.993.93
Exercise healing (EH)3.963.99
Social relationship (SR)3.973.96
Science education (SE)3.993.88
History and culture (HC)4.093.92
Heritage protection (HP)4.043.85
A sense of place (SP)3.903.97
Total average4.003.93
Table 9. Correlation analysis between soundscape preference and CES dimensions.
VariablesLeisure EntertainmentAesthetic ExperienceExercise HealingSocial RelationshipsScience EducationHistory and CultureHeritage ProtectionA Sense of Place
LE-1LE-2AE-1AE-2AE-3EH-1EH-2SR-1SR-2SE-1SE-2HCHPSP
Animal soundscape
preference
0.278 **0.224 *0.1100.1860.1530.203 *0.282 **0.1340.226 *0.0510.0860.264 **0.1780.177
Natural soundscape
preference
0.388 **0.337 **0.205 *0.313 **0.306 **0.333 **0.412 **0.322 **0.382 **0.396 **0.316 **0.352 **0.265 **0.248 *
Human activity soundscape
preference
0.261 **0.505 **0.287 **0.259 **0.385 **0.287 **0.1700.1740.432 **0.279 **0.275 **0.300 **0.332 **0.472 **
Traffic soundscape
preference
0.243 *0.246 *0.209 *0.220 *0.199 *0.1410.1340.1200.262 **0.256 *0.1620.1930.199 *0.312 **
Artificial soundscape
preference
0.246 *0.264 **0.1740.264 **0.199 *0.1050.1760.1470.1770.237 *0.1620.1770.1730.195
Spearman’s rho correlation; * p < 0.05, ** p < 0.01.
Disclaimer/Publisher’s Note: The statements, opinions and data contained in all publications are solely those of the individual author(s) and contributor(s) and not of MDPI and/or the editor(s). MDPI and/or the editor(s) disclaim responsibility for any injury to people or property resulting from any ideas, methods, instructions or products referred to in the content.

