Article

IoT-Driven Intelligent Curing of Face Slab Concrete in Rockfill Dams Based on Integrated Multi-Source Monitoring

by
Yihong Zhou
1,2,
Yuanyuan Fang
1,2,
Zhipeng Liang
1,2,*,
Dongfeng Li
3,
Chunju Zhao
1,2,
Huawei Zhou
1,2,
Fang Wang
1,2,
Lei Lei
1,2,
Rui Wang
1,2,
Dehang Kong
1,2,
Tianbai Pei
1,2 and
Luyao Zhou
1,2
1
Key Laboratory of Health Intelligent Perception and Ecological Restoration of River and Lake, Ministry of Education, Hubei University of Technology, Wuhan 430068, China
2
School of Civil Engineering, Architecture & the Environment, Hubei University of Technology, Wuhan 430068, China
3
Sinohydro Bureau 3 Co., Ltd., PowerChina, Xi’an 710024, China
*
Author to whom correspondence should be addressed.
Buildings 2025, 15(13), 2344; https://doi.org/10.3390/buildings15132344
Submission received: 6 June 2025 / Revised: 25 June 2025 / Accepted: 1 July 2025 / Published: 3 July 2025
(This article belongs to the Section Building Structures)

Abstract

To better understand the temperature changes in face slab concrete and address challenges such as delayed curing and outdated methods in complex and variable environments, this study investigates the use of visualization and real-time feedback control in concrete construction. The conducted study systematically develops an intelligent curing control system for face slab concrete based on multi-source measured data. A tailored multi-source data acquisition scheme was proposed, supported by an IoT-based transmission framework. Cloud-based data analysis and feedback control mechanisms were implemented, along with a decoupled front-end and back-end system platform. This platform integrates essential functions such as two-way communication with gateway devices, data processing and analysis, system visualization, and intelligent curing control. In conjunction with the ongoing Maerdang concrete face rockfill dam (CFRD) project, located in a high-altitude, cold-climate region, an intelligent curing system platform for face slab concrete was developed. The platform enables three core visualization functions: (1) monitoring the pouring progress of face slab concrete, (2) the early warning and prediction of temperature exceedance, and (3) dynamic feedback and adjustment of curing measures. The research outcomes were successfully applied to the intelligent curing of the Maerdang face slab concrete, providing both theoretical insight and practical support for achieving scientific and precise curing control.

1. Introduction

Concrete face rockfill dams (CFRDs) have been extensively utilized in water conservancy projects worldwide owing to their safety, cost-efficiency, and adaptability [1,2,3]. To date, nearly 400 CFRDs exceeding 30 m in height have been constructed in China, positioning the country as a global leader in terms of quantity, scale, and technical sophistication, and demonstrating significant progress in dam construction technologies. Concrete face slab, serving as the primary anti-seepage element in CFRDs, plays a vital role in maintaining structural integrity and operational safety [4,5]. Designed as a thin-walled structure and typically constructed using high-grade concrete, the face slab is particularly vulnerable to early-age cracking due to its rapid construction process and the absence of vertical joints along the elevation. During early curing, when tensile strength remains low, cracks induced by temperature gradients and drying shrinkage often develop, primarily due to hydration heat [6,7,8], shrinkage effects [9,10,11,12], and environmental influences [13,14]. Such cracking adversely affects construction safety, quality, and durability. Previous studies [15] have identified temperature-induced deformation, shrinkage, and uneven stress distribution as the primary causes. Consequently, research focused on temperature control and crack prevention, and curing practices is essential to improve the structural safety and long-term performance of CFRDs.
Pipe cooling is a primary technique used in mass concrete construction to dissipate internal hydration heat, limit temperature rises, and reduce cracking risk [16,17,18,19,20,21]. However, the concrete face slab, characterized by its thin-walled plate structure with disproportionate length, width, and thickness, renders the conventional embedding of cooling pipes impractical. As a result, quality control during the curing phase becomes particularly critical. The curing of face slab concrete has traditionally relied on manual water spraying and thermal insulation using materials, such as plastic sheets, straw mats, burlap sacks, or geomembranes [22,23]. Despite these measures, cracking in concrete face slabs induced by temperature and humidity fluctuations remains prevalent. A major contributing factor is the absence of timely, accurate, and comprehensive monitoring of internal temperature and humidity, as well as the limited feedback on the effectiveness of applied measures. This results in significant discrepancies between the actual and intended material states. To address these limitations, the development of an intelligent curing system is urgently required. Such a system should incorporate high-frequency temperature sensing, the intelligent evaluation of curing performance, and real-time adjustment of curing measures. Such a system would facilitate the intelligent regulation of the face slab concrete’s internal temperature and humidity, thereby improving the precision and automation of on-site quality control.
The acquisition of multi-source data serves as the foundation for the intelligent regulation of face slab concrete, while the timely and accurate transmission of such data is essential for achieving intelligent curing. In this context, Internet of Things (IoT) technology plays a crucial role [24,25]. Through the deployment of sensor networks and the implementation of remote monitoring and data analysis, the efficiency and accuracy of curing processes have been significantly improved. Consequently, concrete curing has evolved from traditional manual approaches to an intelligent model based on the closed-loop control principle of “perception–analysis–feedback control” [26,27,28]. To support this paradigm, various studies have explored IoT-enabled solutions. Madni [29] addressed protocol diversity across industrial equipment by introducing a sensor-based data acquisition and storage method. Yeh [30] developed an intelligent manufacturing information management system using a message queuing telemetry transport (MQTT) protocol-based smart factory network, achieving low-power communication between devices, building a communication bridge for heterogeneous interfaces. Kong [31] proposed a communication mapping method based on MQTT to overcome interoperability challenges and enable seamless connectivity among distributed IoT devices. Kumar [32] introduced an MQTT-based smart city model, demonstrating reduced packet overhead compared to hypertext transfer protocol (HTTP), and devices can be remotely monitored from anywhere in the world to meet the needs of the smart city model. Jaquez [33] enhanced the reliability of water quality monitoring through an IoT system with extended long-range radio (LoRa) signal coverage, extending the distance of long-range wireless communication and expanding the coverage of the LPWAN network. Taleb [34] implemented a LoRa-based low-power healthcare monitoring platform for adaptive patient monitoring processes. Additionally, a model for analyzing LoRa transmission energy consumption was proposed. The results showed that the energy consumed by the system was reduced by 3 to 10 times. Li [35] applied LoRa in environmental monitoring for high-speed railway stations to track temperature, humidity, illumination, and noise in real time. The wireless communication in the proposed system used the technical characteristics of LoRa, such as low power consumption, low cost, and long-range communication. A LoRa-supported network prototype was established to transmit environmental data. In addition, the signal propagation of LoRa in indoor environments was analyzed. Zhang [36] presented a low-power wide-area network solution integrating IoT and LoRa, achieving a 1.6 km communication range and a packet loss rate of approximately 3% in complex environments. The proposed approach satisfies the requirements for large-scale data acquisition, transmission, storage, and processing. The referenced studies offer important guidance for ensuring reliable data collection and communication in face slab concrete curing. However, the deployment of heterogeneous sensors at rockfill dam construction sites results in inconsistent communication protocols and data formats, posing persistent challenges for multi-source data integration. Moreover, the complex terrain and adverse climatic conditions further undermine the timeliness and stability of data transmission.
To overcome the limitations of conventional curing practices and the delayed execution of curing measures, this study systematically investigated the development of an intelligent curing system for face slab concrete utilizing multi-source monitoring data. An IoT-driven framework integrating LoRa + 5G heterogeneous networks and the MQTT protocol was established for real-time multi-source data perception in high-altitude and cold-climate regions, overcoming transmission challenges in complex terrains. Digital twin technology was used to synchronize the physical construction progress with the virtual model, and an adaptive curing strategy was generated based on grey relational analysis and the entropy weight method. A multifunctional system platform was developed using a front-end and back-end framework. This platform integrates gateway device communication, data processing and analysis, construction visualization, and intelligent curing control. The system was successfully deployed in the Maerdang Dam project, enabling intelligent curing throughout the face slab concrete construction phase. Through the dynamic adjustment of curing parameters and intelligent decision-making, the system achieves enhanced precision in curing management. By integrating IoT technology with curing processes, the study presents a practical solution for quality control in concrete construction, particularly in high-altitude and cold-climate regions. The system’s innovative application in improving crack resistance and the full-cycle quality management of the face slab demonstrates significant potential for advancing intelligent construction in hydraulic engineering.
This paper is organized as follows: Section 2 presents the overall system architecture; Section 3 outlines the construction process; Section 4 details the technical implementation; Section 5 introduces the curing strategy generation mechanism; Section 6 provides a case study; Section 7 discusses the paper; and Section 8 concludes the paper.

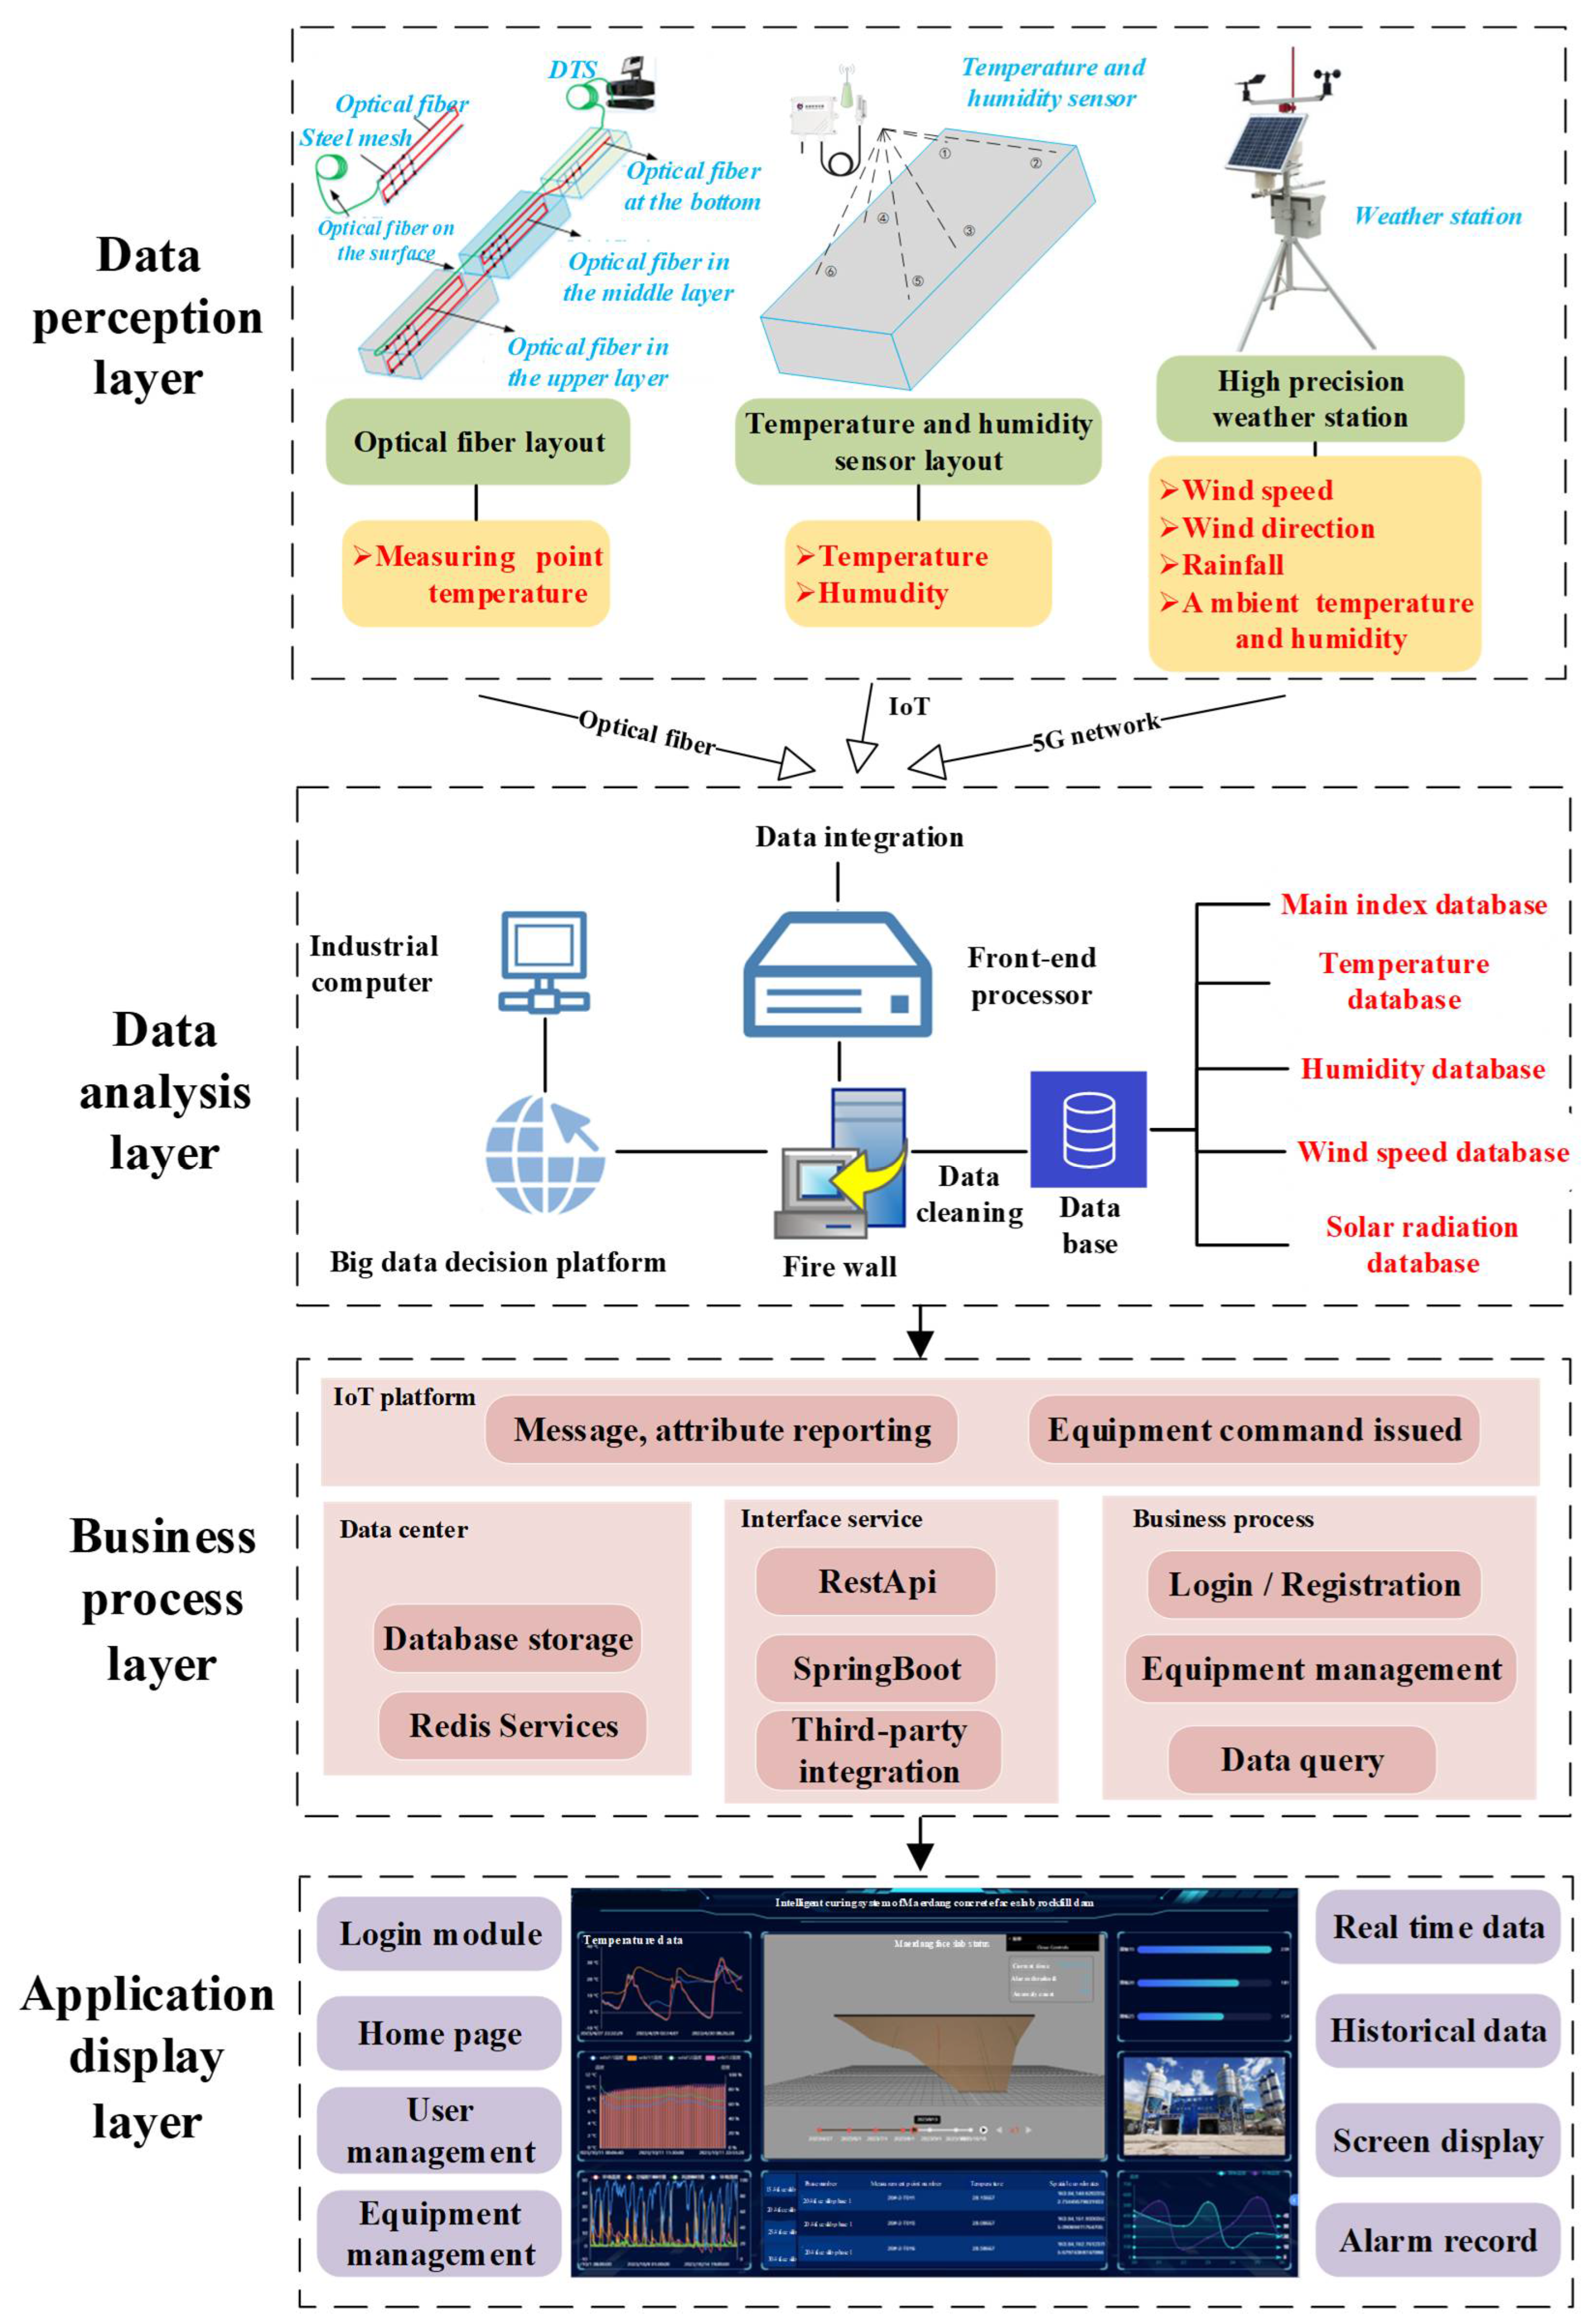
2. The Overall Frame Design of the System

The framework for an intelligent curing system for face slab concrete based on multi-source data is proposed, integrating wireless transmission technology, the IoT, and digital twin technology. The IoT platform, functioning as a core component for centralized device connectivity, unified data management, and service delivery, provides a solid foundation for intelligent device management. To address challenges associated with the large number of heterogeneous monitoring devices and the volume of monitoring data generated during the concrete pouring and curing processes, the IoT platform offers standardized access interfaces and normalized monitoring reports [37,38,39]. This approach abstracts the heterogeneity of underlying sensor devices, allowing for consistent integration with data acquisition equipment. Simultaneously, wireless transmission technology is utilized for the real-time delivery of multi-source monitoring data, while big data analytics and data fusion techniques are applied to process and manage large volumes of raw data. As a result, a secure, reliable, and data-rich multi-source IoT information management system is formed. Built on this foundation, the system adopts a model-view-controller (MVC) architecture with a decoupled front-end and back-end structure. Bidirectional communication with gateway devices is established via the MQTT protocol, allowing for mapping between physical gateway hardware and corresponding virtual entities. This enables the ingestion, transmission, processing, and visualization of sensor data across multiple monitoring sites. Authorized users are granted real-time access to monitoring data through the front-end interface and may issue control commands to connected devices.
The overall system framework is illustrated in Figure 1, with its core components summarized as follows:
(1)
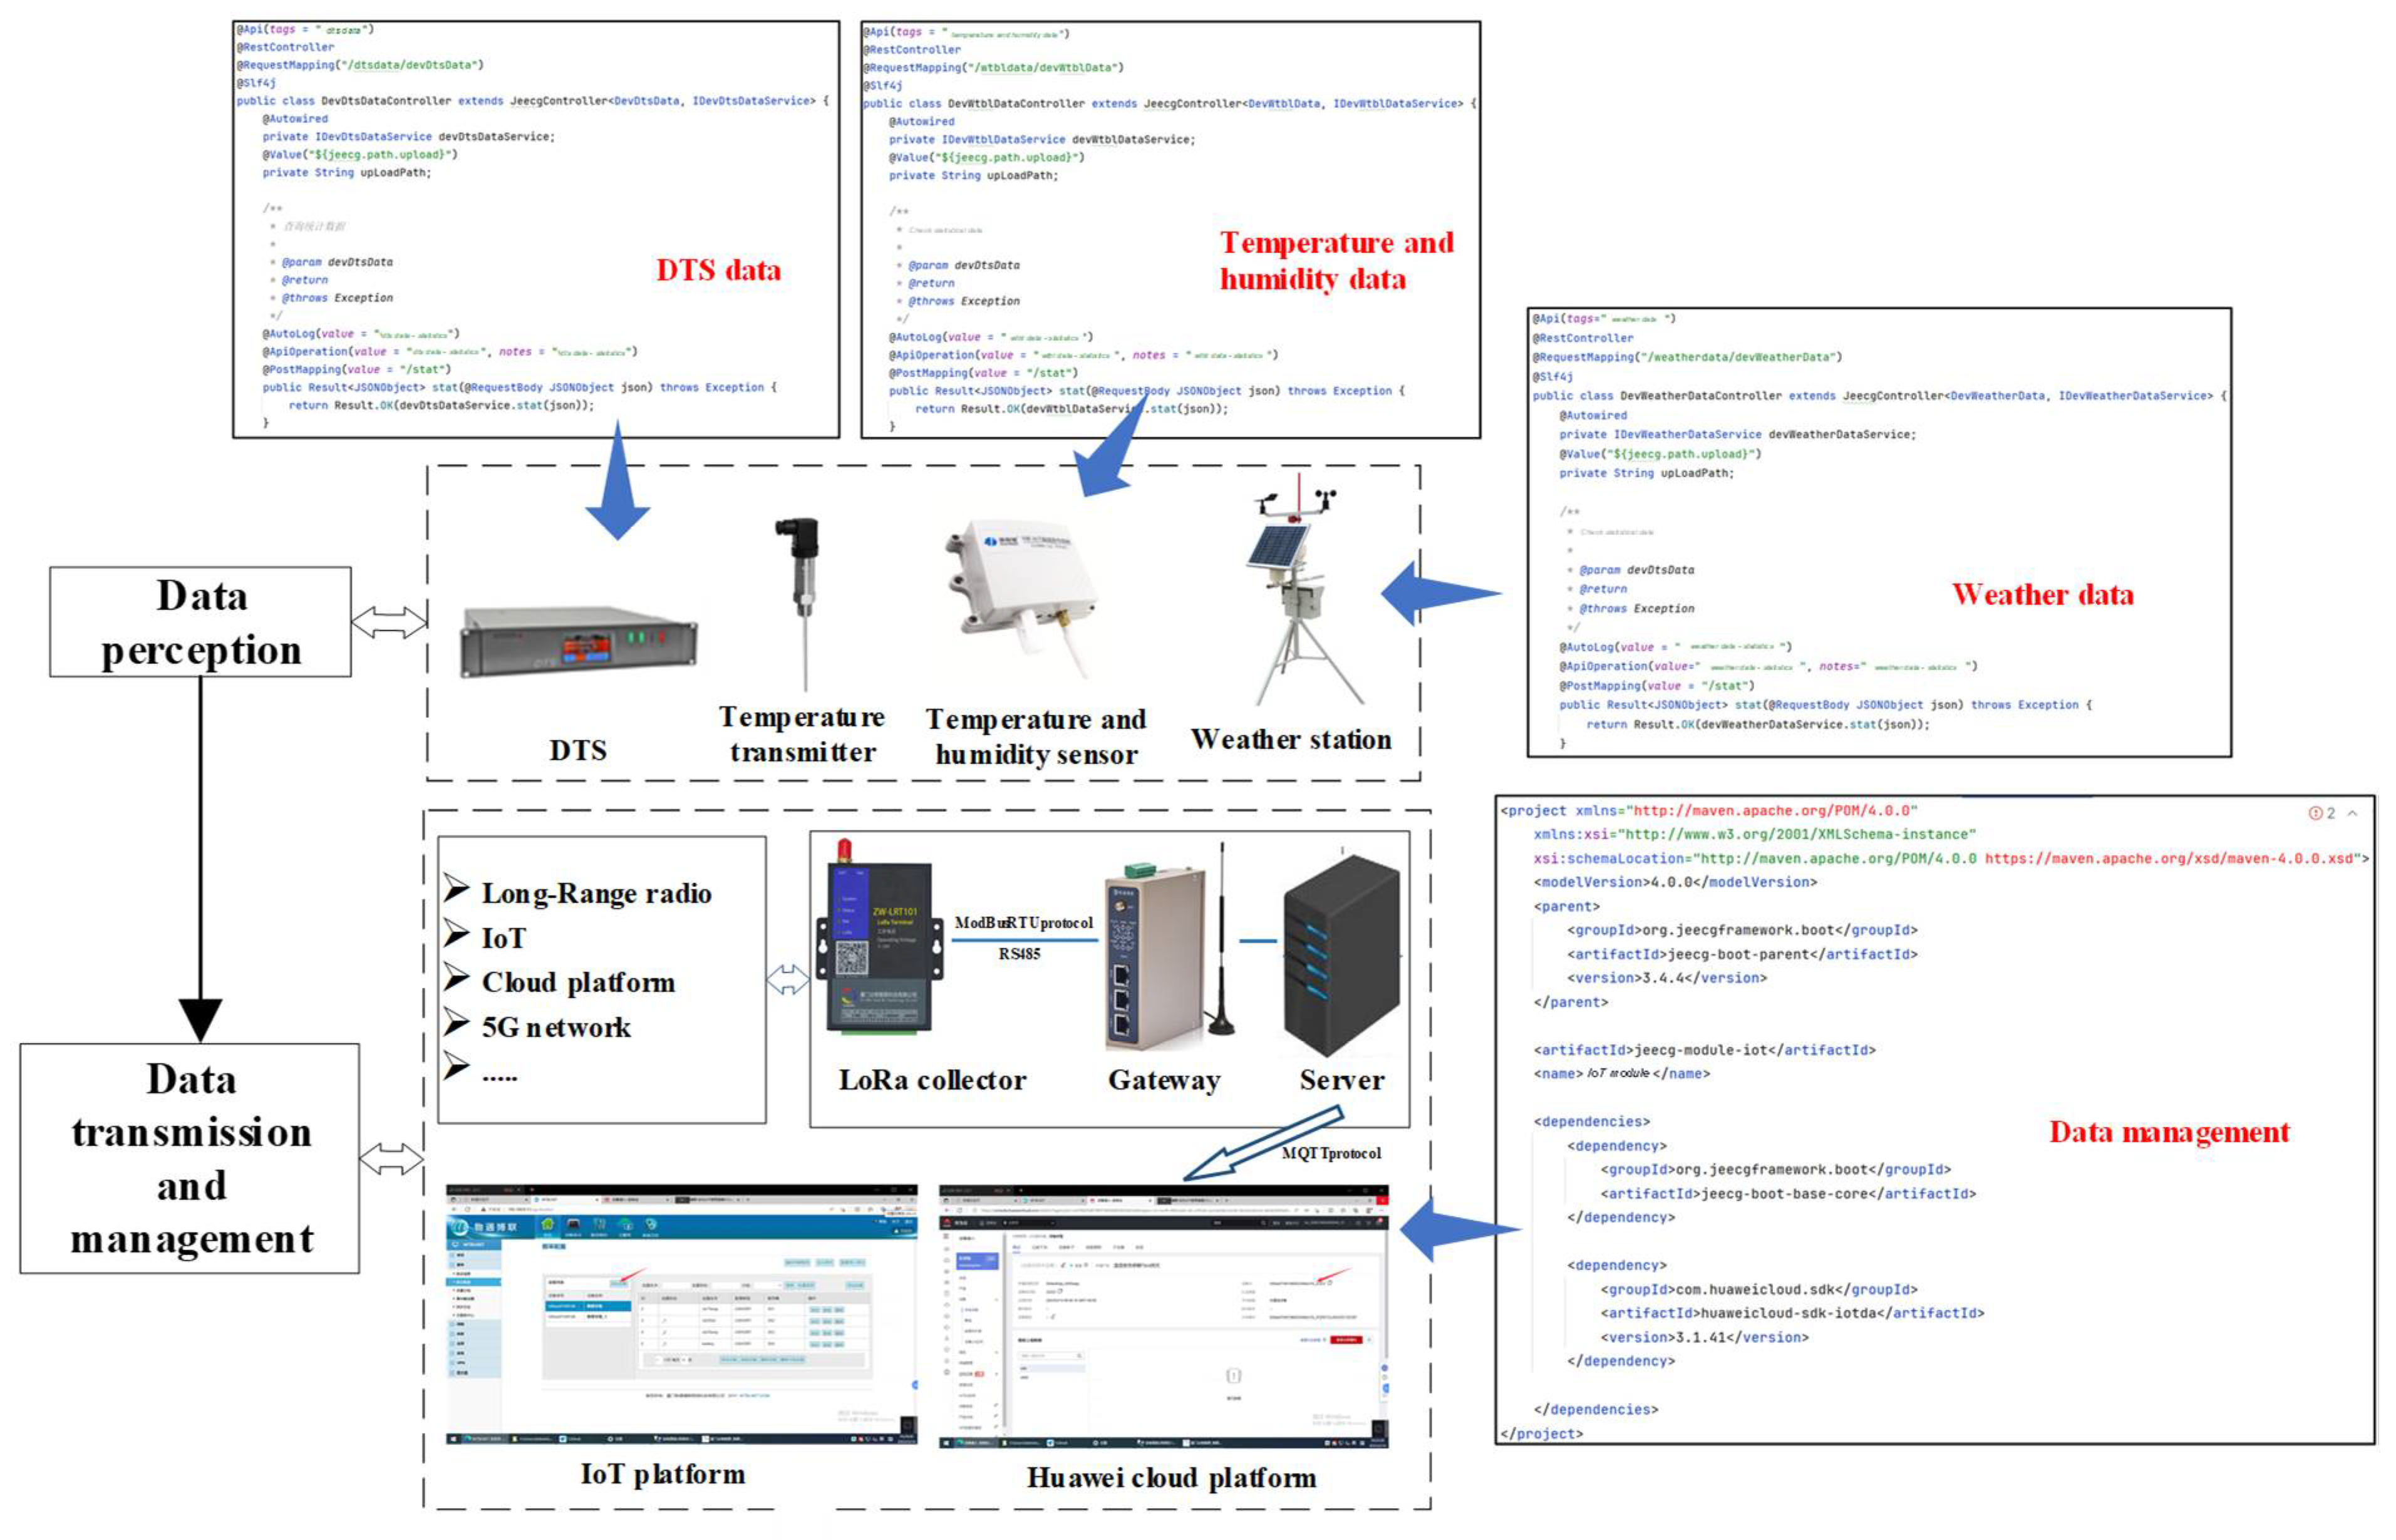
Data perception layer: Real-time multi-source data are acquired through monitoring instruments, such as distributed temperature sensing (DTS) systems, temperature-humidity sensors, and weather stations. These data are transmitted via LoRa, IoT, and 5G technologies to a front-end server for integration. The MQTT protocol is employed at the data access layer to authenticate gateway devices and enable real-time bidirectional data transmission.
(2)
Data analysis layer: The monitoring areas of each concrete face slab are categorized based on business requirements, with each area identified by a unique monitoring area number, which serves as the primary index. This index links temperature, humidity, wind speed, solar radiation, and other monitored data within the area. Upon transmission to the front-end server, raw data are subjected to preprocessing to eliminate invalid entries before storage in specialized databases, including temperature and humidity repositories and corresponding knowledge bases. Data fusion and integrated management are then conducted using predefined processing rules and boundary conditions from the knowledge bases, providing support for decision-making and management processes.
(3)
Business process layer: Developed using the Spring Boot framework, this layer utilizes asynchronous I/O and event-driven mechanisms. REST API interfaces are used to enable interaction among the application presentation layer, data access layer, and databases.
(4)
Application display layer: Constructed using a Vue.js-based front-end and back-end framework and Alibaba component libraries, this layer adopts a frontend-backend decoupled design. It consists of eight functional modules: login, home page, user management, device management, real-time and historical data access, large screen display, and alarm records. Each request is sent to the back-end server via the HTTP protocol for processing, such as querying historical data, device registration, and data synchronization. By integrating the Echarts chart plugin, users can visualize the historical data trends of relevant parameters, making it easier to monitor and analyze the environment for statistical purposes.

3. System Construction Process

The construction process of the intelligent curing system for face slab concrete consists of the following stages (Figure 2):
(1)
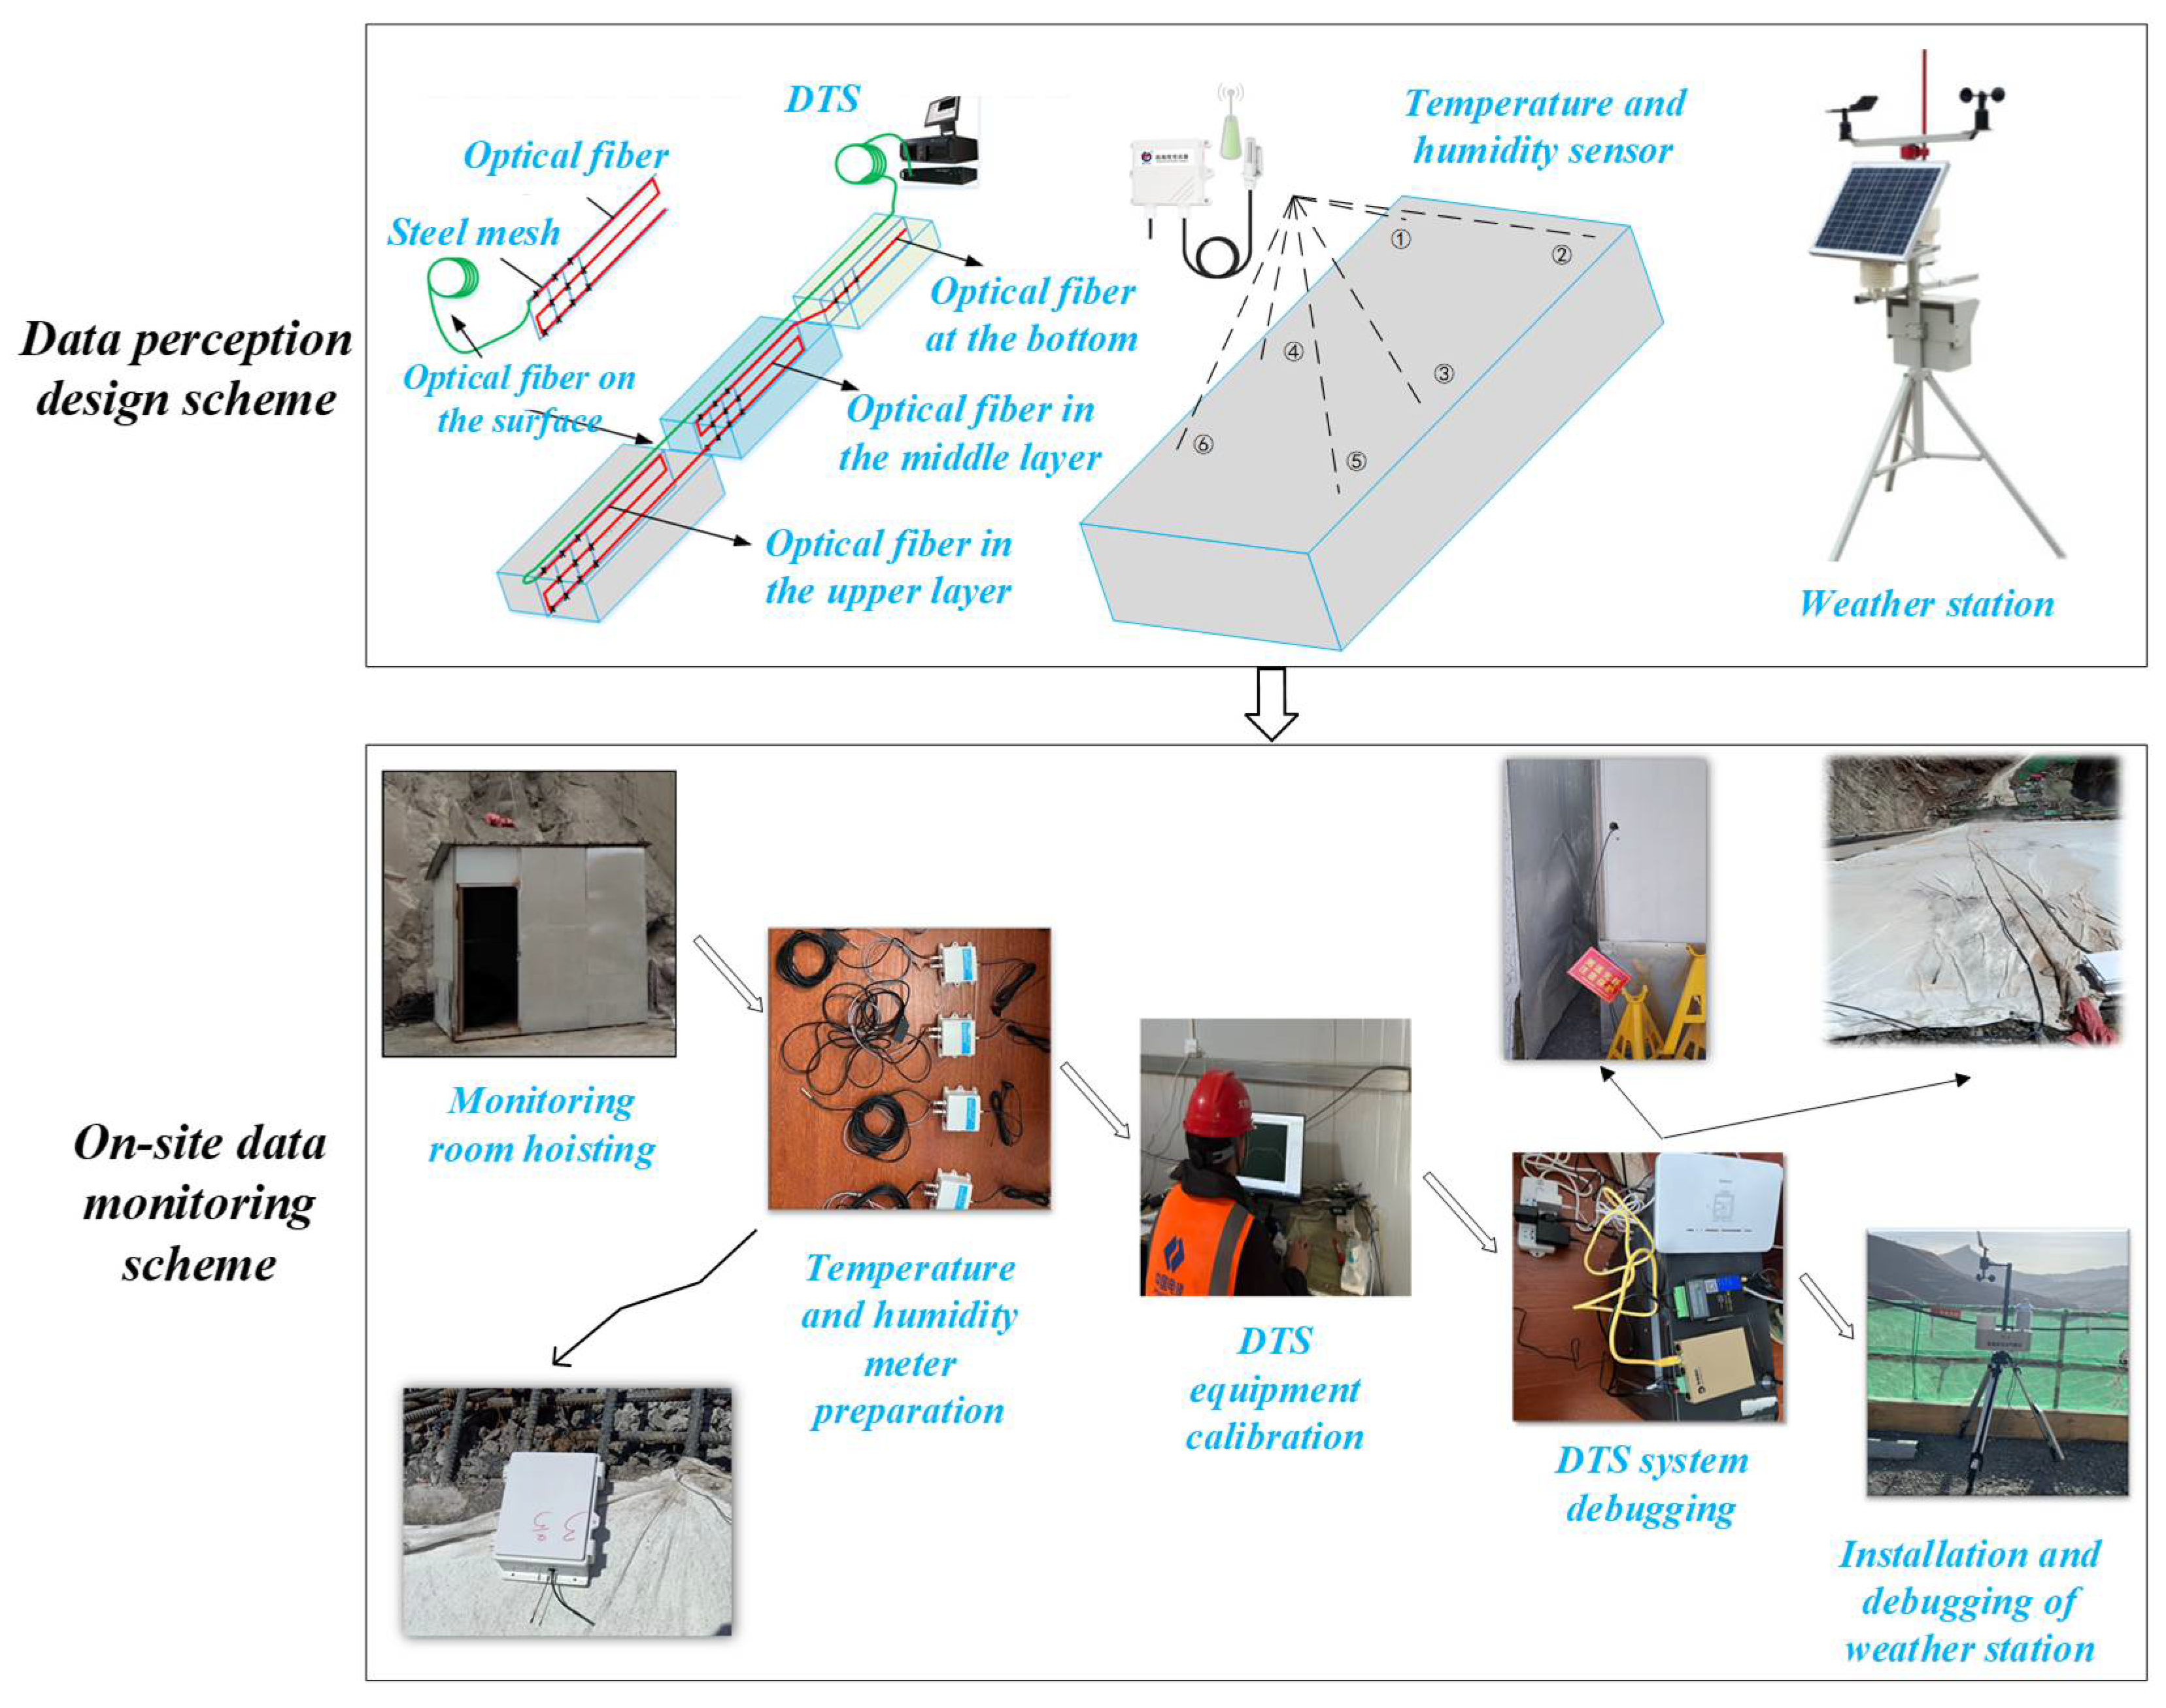
Multi-source data perception: The internal temperature distribution of the face slab concrete is monitored using DTS technology. Surface temperature and humidity are measured by temperature–humidity sensors, while environmental variables, including wind speed, wind direction, solar radiation, and ambient temperature and humidity, are recorded through high-precision weather stations. Water flow rates used in the curing process are measured with flow meters.
(2)
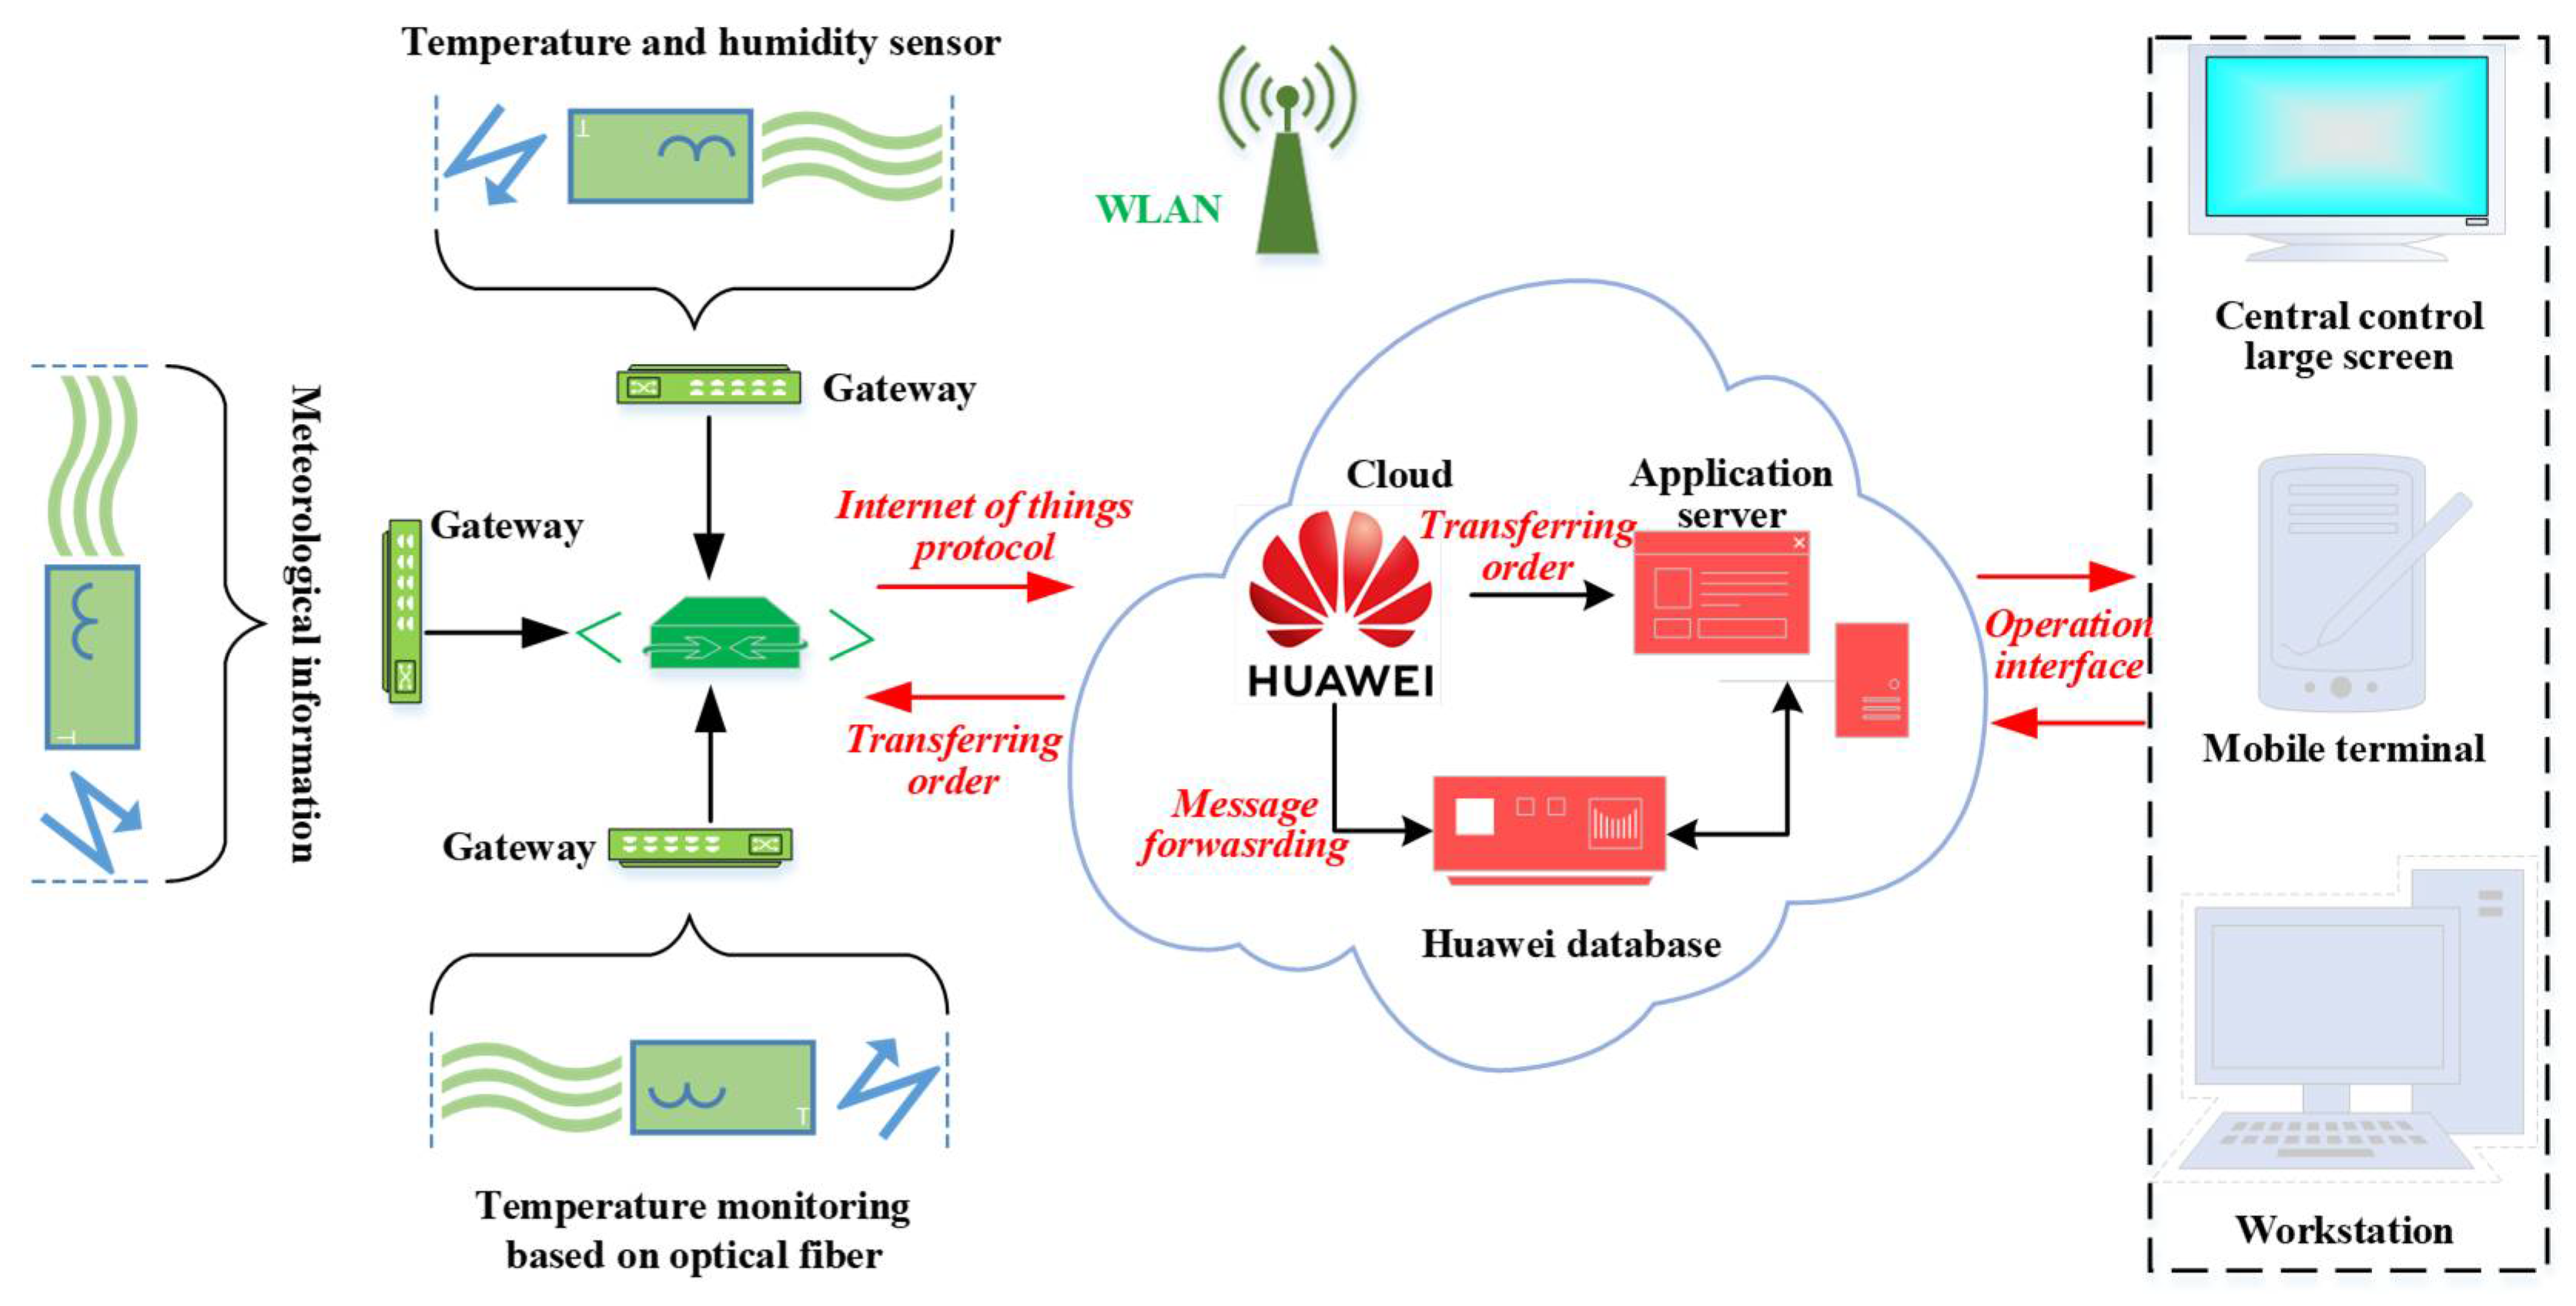
Multi-source data management: A remote IoT-based transmission framework is established to facilitate the efficient transfer and centralized management of the collected data.
(3)
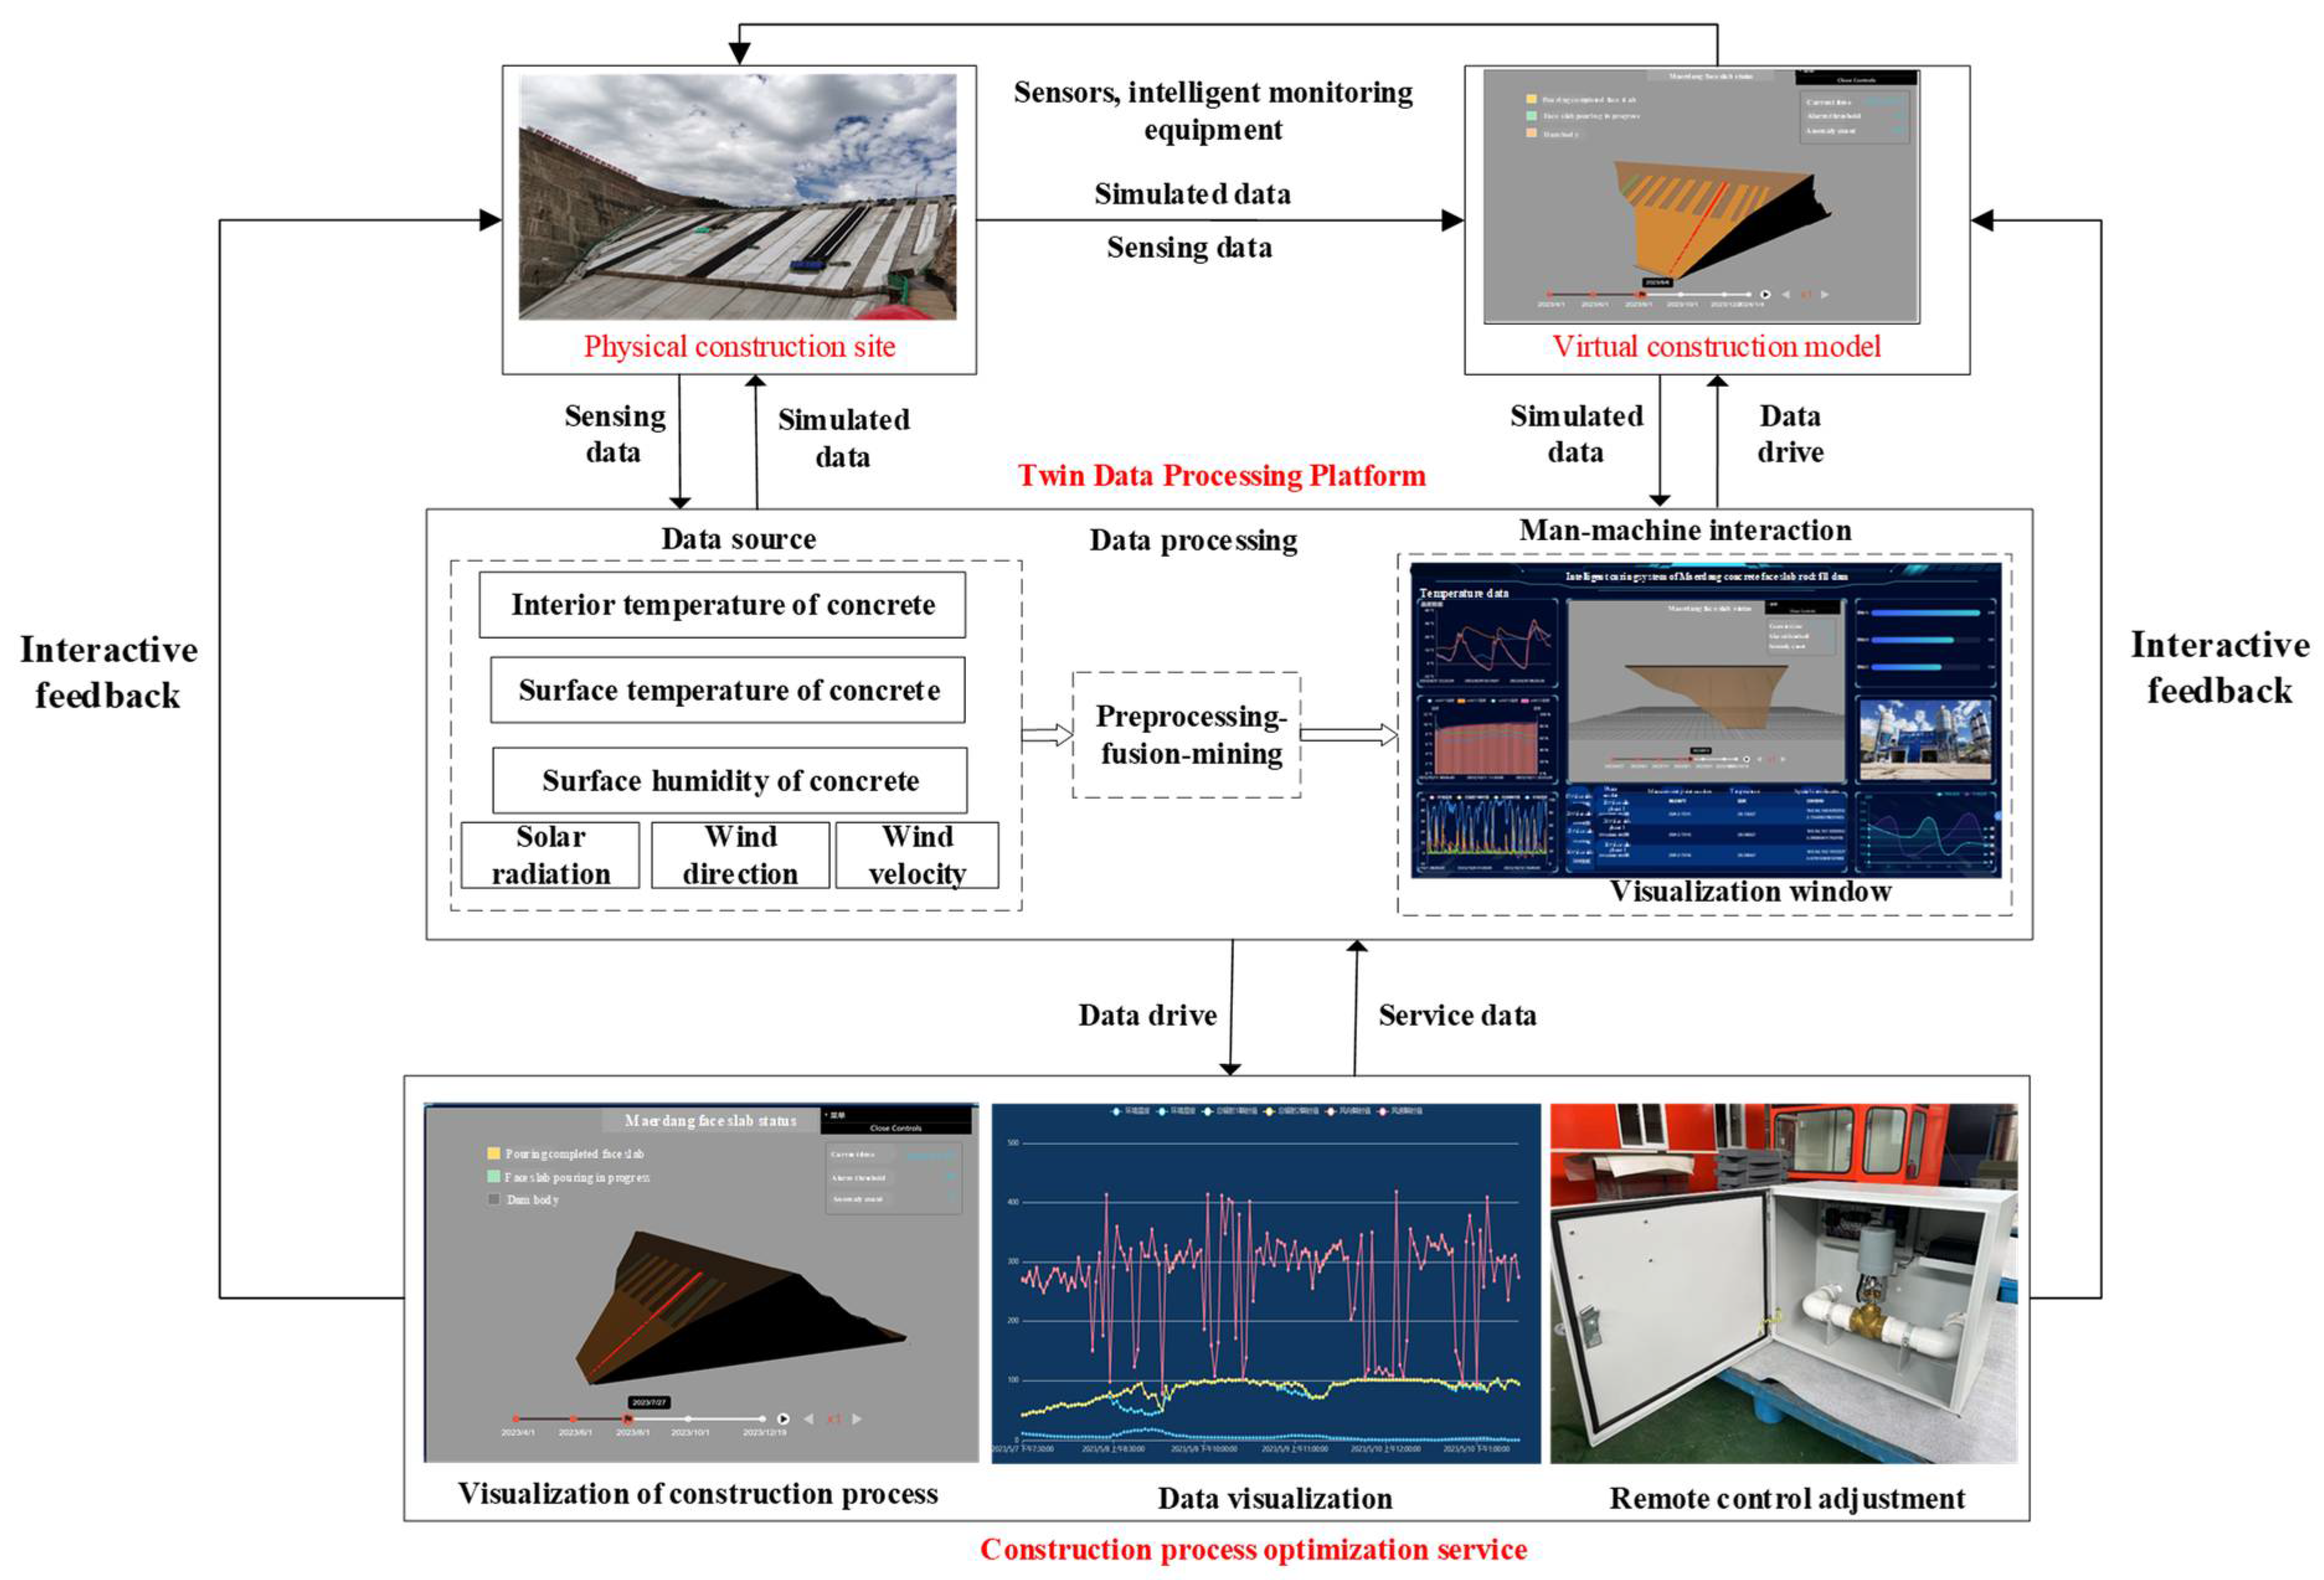
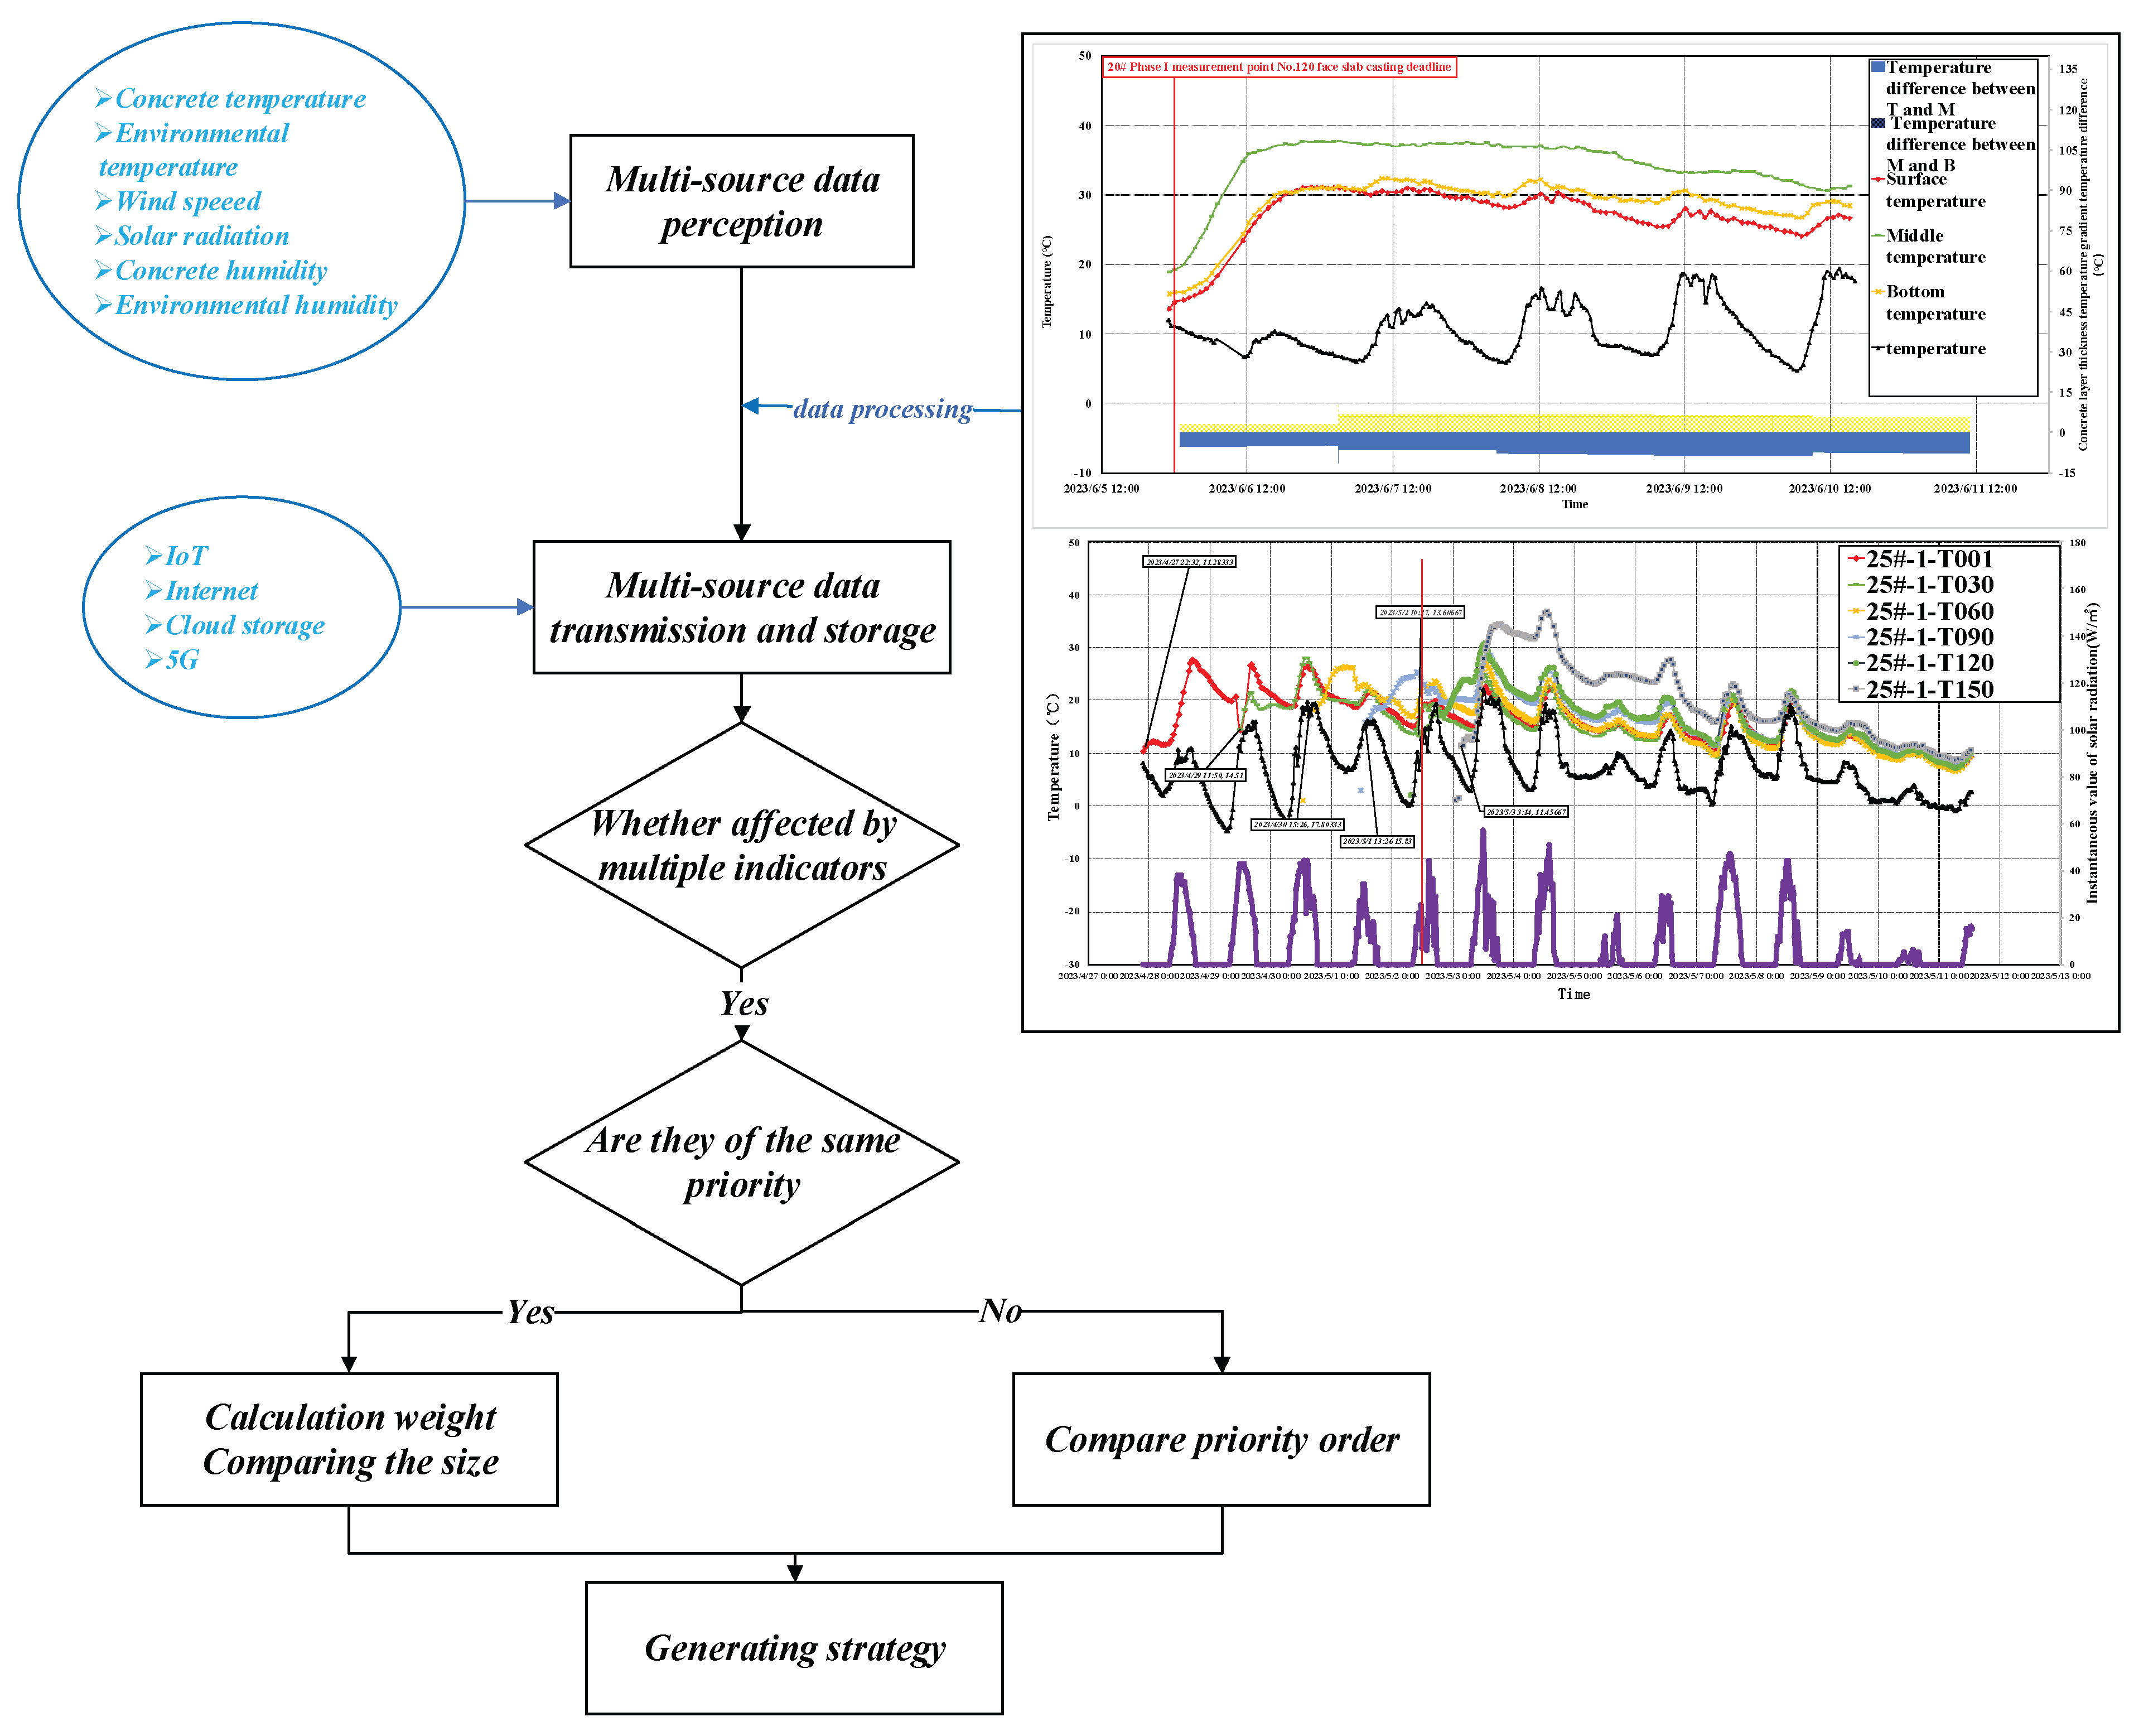
Multi-source data analysis: Data mining, finite element simulation, and intelligent algorithms are employed to construct a smart curing control strategy model and establish a curing strategy generation mechanism for face slab concrete based on grey relational analysis and the entropy weight method. This model integrates multiple influencing factors, such as concrete temperature, surface humidity, wind speed, and solar radiation, for comprehensive data analysis and processing.
(4)
Dynamic feedback control: Automated control, IoT technologies, and cloud computing are utilized to implement curing strategies based on real-time data, enabling the remote regulation of intelligent curing devices.
(5)
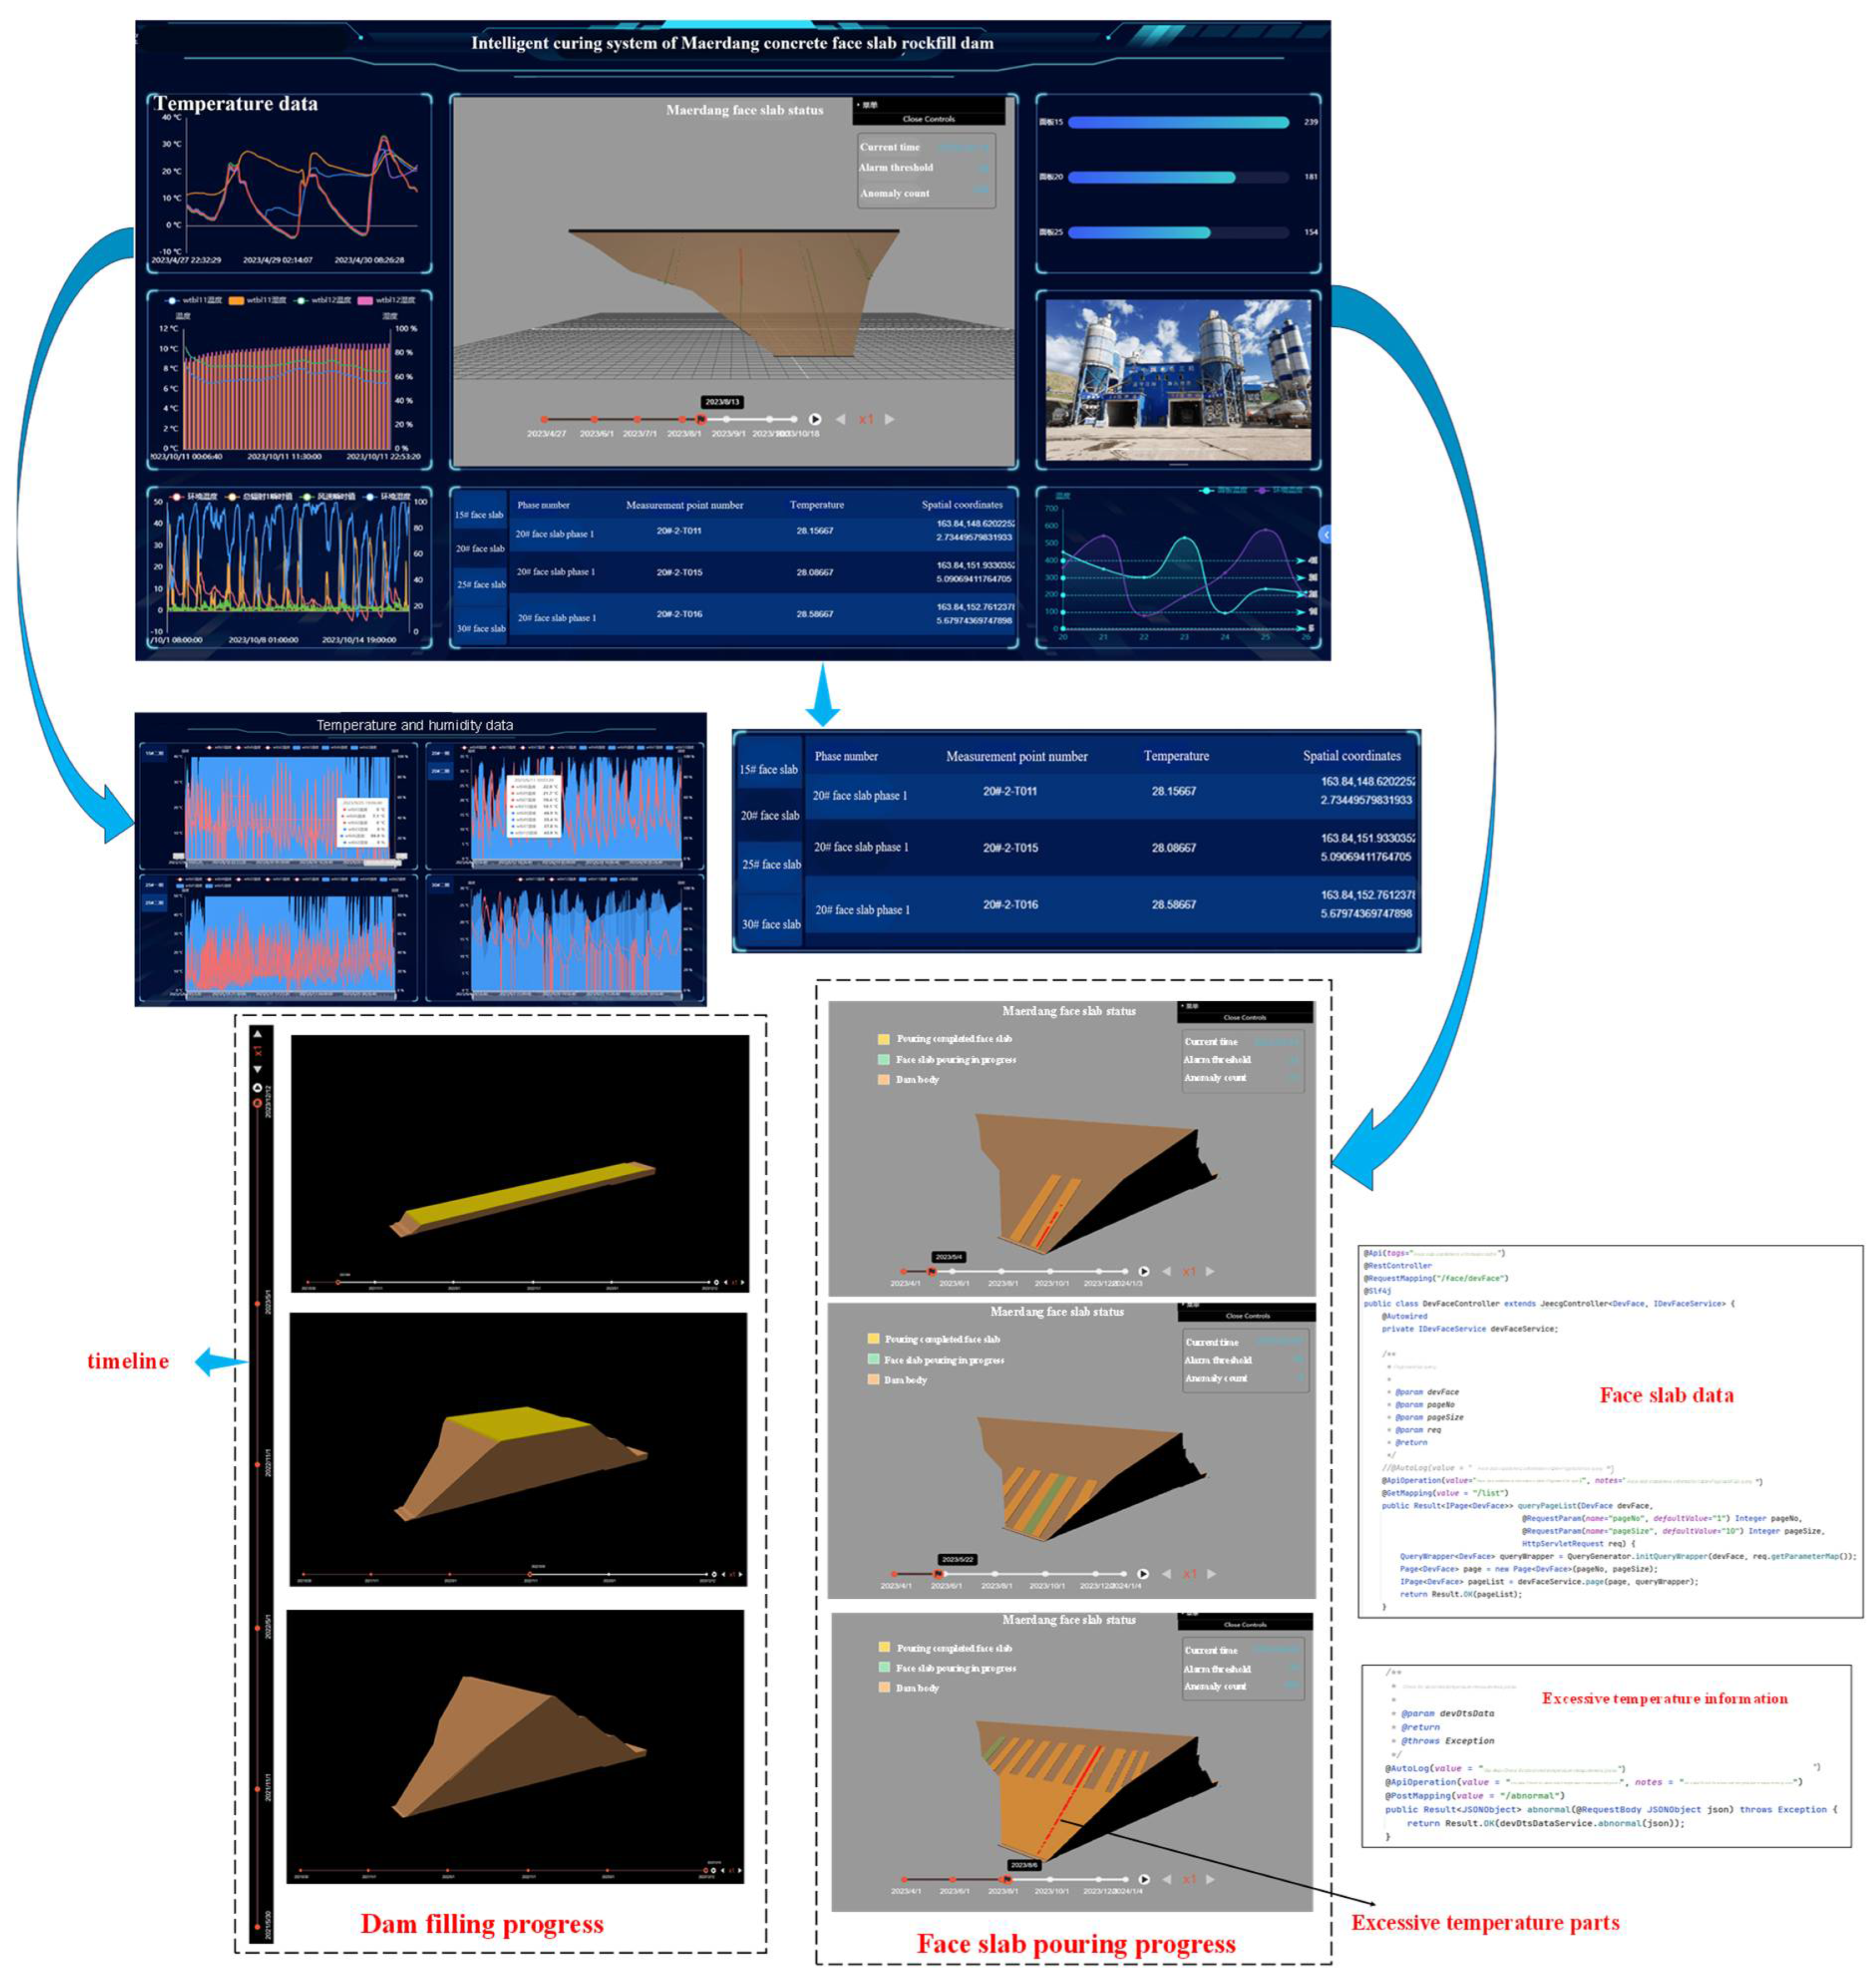
Data visualization: A dedicated system platform is developed to display real-time monitoring data, analysis outcomes, face slab pouring and construction progress, curing strategies, and system status, thereby supporting intelligent decision-making and quality management.

4. Technical Implementation

The key technologies underpinning the intelligent curing system for face slab concrete comprise four core components:
(1)
Dam body modeling: Completion of the CFRD model.
(2)
Multi-source data acquisition: Real-time monitoring of various data types through sensors.
(3)
Physical–virtual synchronization: Binding of on-site construction devices with virtual counterparts on the IoT platform using digital twin technology for real-time mapping.
(4)
Data visualization: Analysis and processing of collected data by the data management system to achieve dynamic feedback control, with the results displayed visually for curing data monitoring.

4.1. Construction of Multi-Source Data Integrated Management System

The core task of data integration is to unify distributed, heterogeneous, and interrelated data sources to allow transparent access for users. Integrated data management involves the centralized oversight of the entire data lifecycle, relying primarily on computer hardware and database technologies.
In the development of the data acquisition system, various types of devices are utilized, including distributed optical fibers, temperature–humidity sensors, and high-precision weather stations. The use of distributed optical fibers for monitoring the internal temperature of concrete offers several key advantages over traditional point sensors [40,41], such as thermocouples and thermistors, including the following:
(1)
Distributed temperature sensing (DTS) technology enables continuous temperature measurement along the entire length of the fiber, providing a comprehensive temperature profile across the full cross-section instead of just at discrete points.
(2)
A distributed optical fiber temperature measurement system allows for online, real-time monitoring. It can be configured to set alarm thresholds for maximum, minimum, and average temperatures, among other parameters, enabling automatic early warnings, forecasts, and remote automation control as per the project’s requirements.
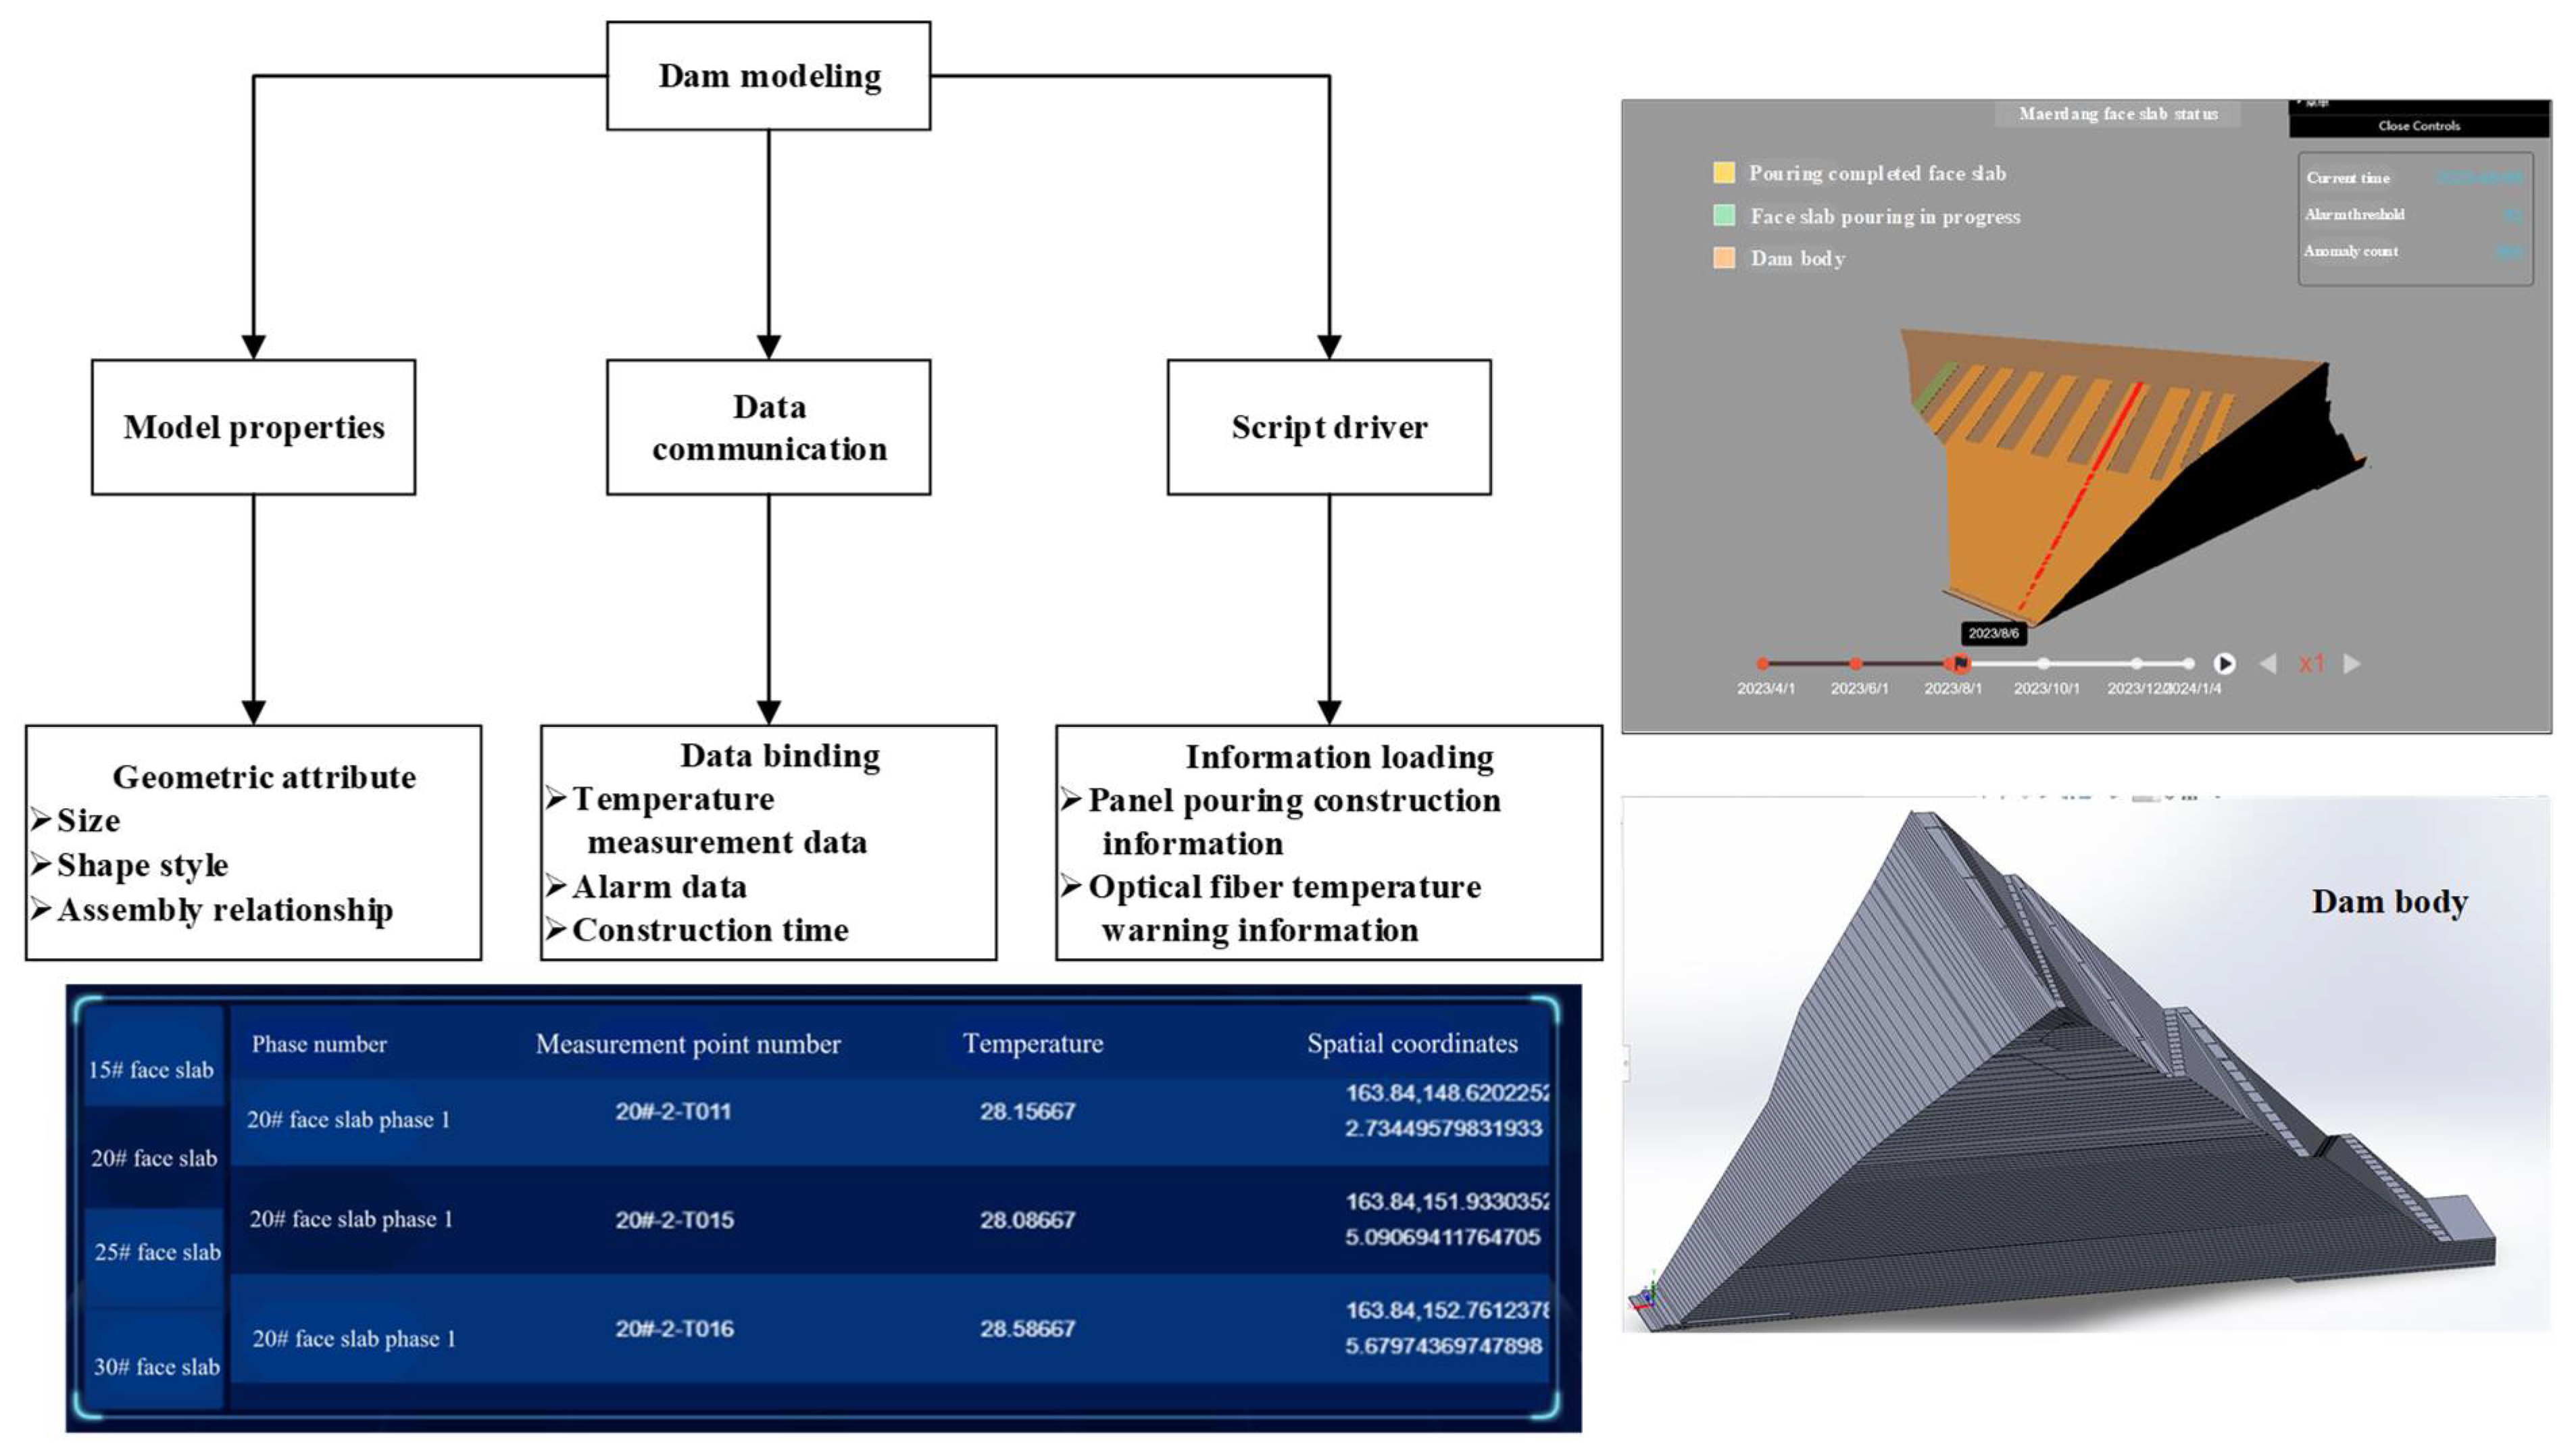
These devices typically utilize different communication protocols. To enable effective management and real-time monitoring, the data acquisition system must support multiple communication protocols concurrently. Therefore, a multi-source measured data acquisition system specific to face slab concrete has been developed. This system enables the real-time collection, transmission, and processing of heterogeneous data from various devices and data types. Computer software is then used to reflect the operational status and fault information of physical devices, supporting the temperature monitoring of concrete. The system structure is illustrated in Figure 3.
The multi-source IoT information management system is based on the industry-standard MVC architecture and features a decoupled front-end and back-end design. Fiber-optic temperature data are transmitted to the cloud platform via DTS hosts. Surface temperature and humidity data are acquired through data acquisition cards, while meteorological data are transmitted in real time over 5G networks. The collected data are sent to an SQL server using the MQTT protocol, enabling mapping between physical gateways and virtual devices on the platform.

4.2. Dam Modeling

The purpose of dam modeling is to establish mappings between the components of a physical CFRD, enabling a comprehensive perception of the surrounding environment. This encompasses the monitoring of the dam structure, face slab construction progress, concrete internal temperature, surface temperature and humidity, and meteorological conditions. Script programming was used to associate physical attributes with their virtual counterparts, forming a digital twin model that closely mirrors the actual dam in geometric configuration, boundary conditions, and operational parameters. The SolidWorks 2020 3D modeling software was utilized to create three-dimensional models of the dam structure, face slab, and optical fibers. As shown in Figure 4, the components involved in dam modeling include the following:
(1)
Model properties: The geometric attributes of the dam include dimensions, structural configuration, and component assembly relationships.
(2)
Data communication: Real-time synchronization between the virtual model and the physical dam is achieved by binding collected data, such as temperature measurements, alarm signals, and construction schedules. These data are uploaded to servers via the IoT.
(3)
Script driver: Script-driven commands dynamically load construction progress, temperature monitoring, and warning data to the user interface, enabling efficient information management.
To replicate real-time construction site conditions, various sensors and monitoring devices are deployed to collect on-site data, with real-time transmission achieved through IoT communication technology. A sensor data vector S i ( t ) is defined in (1), where i = 1 , 2 , , 6 .
S i ( t ) = S 1 ( t ) S 2 ( t ) S 3 ( t ) S 4 ( t ) S 5 ( t ) S 6 ( t ) = T S ( t ) , T M ( t ) , T B ( t ) T T s u r f ( t ) , H s u r f ( t ) T T e n v ( t ) , H e n v ( t ) , R s o l a r ( t ) , F w i n d ( t ) , V w i n d ( t ) T P p o w e r ( t ) Q f l o w ( t ) T w a t e r ( t )
where the sensors corresponding to S 1 ~ S 6 represent DTS, temperature and humidity sensors, high-precision weather stations, pressure sensors, flowmeters, and water temperature meters, respectively; T S , T M , and T B represent the temperature at different depths within concrete; T s u r f indicates the concrete internal and surface temperatures; H s u r f represents the humidity; T e n v denotes the ambient temperature; H e n v signifies environmental humidity; R s o l a r is the solar radiation; F w i n d represents the wind; and V w i n d refers to the wind speed. Water pressure, flow, and temperature are indicated by P w a t e r , Q f l o w , and T w a t e r .
The specific application of T S , T M , and T B is shown in Formulas (12) and (13). T s u r f , H s u r f , meteorological data (such as T e n v , H e n v , R s o l a r   F w i n d , V w i n d , etc.), P w a t e r , Q f l o w , and T w a t e r are primarily used during the formulation of curing strategies to provide quantitative basis for the scientific setting of critical control thresholds.

4.3. Virtual–Real Synchronization

A digital twin enables interaction and integration between the physical and digital worlds. With its multi-physical, multi-scale, and multi-disciplinary nature, it synchronizes the full lifecycle data of physical entities with virtual models in real time, enabling accurate mapping and interaction. This capability supports humans in conducting more objective analysis and decision-making. A digital twin comprises four core components: physical entities, virtual models, data, and services, along with their interconnections. Driven by models and data, it can represent physical attributes, analyze behavior, predict future states, and support functions, such as monitoring, operation, curing, and optimization. The five-dimensional model of the concrete face slab construction process is shown in Figure 5.
Virtual–physical synchronization enables the real-time mapping of field data to corresponding digital twin devices, forming the technical basis for functions, such as 3D dam visualization, multi-source data display, and early warning systems. This paper presents a multi-protocol data acquisition method for heterogeneous equipment. Sensor data are classified by characteristics, such as equipment name, location, and type, and then stored in a centralized database. Face slab concrete construction data are transmitted to the server for unified management. A one-to-one binding is established between physical gateways and virtual devices, ensuring a deterministic mapping across the cyber–physical system.

4.3.1. Dynamic Display of Face Slab Construction Progress

During the construction of large-scale water conservancy projects, accurate progress control and timely responses to on-site changes are essential for smooth advancement. The progress management platform integrates virtual reality with real-time monitoring to simulate the concrete face slab construction process through real–virtual synchronization, enabling the precise 3D visualization of construction phases. Time-axis data allow the real-time tracking of key parameters, such as phase numbers, monitoring point codes, spatial coordinates, and pouring progress, maintaining strong alignment between the virtual and actual conditions. This synchronized visualization enhances management transparency and efficiency while supporting timely, informed decision-making.

4.3.2. Optical Fiber Temperature Measurement Data Dynamic Display and Early Warning

The optimal temperature range for concrete pouring is generally maintained between 5 °C and 32 °C to ensure uniform hydration and stable material performance. Temperatures above 32 °C may result in premature setting and strength reduction due to excessive heat, while temperatures below 5 °C tend to delay curing, adversely affecting strength development and construction progress. During pouring, substantial hydration heat is generated, and large temperature gradients may cause cracking. The heat of hydration is typically modeled using a double exponential function, expressed as (2):
θ ( τ ) = θ 0 ( 1 exp ( a τ b ) )
where θ ( τ ) denotes the cumulative hydration heat per unit mass of concrete at age τ ; θ 0 indicates the maximum hydration heat; and a and b represent the temperature rise coefficients. Based on temperature monitoring feedback, the values of θ 0 , a , and b can be determined, enabling the derivation of the actual adiabatic temperature rise curve. This curve serves as a critical reference for developing appropriate curing measures.
In practical engineering, the temperature field distribution in concrete is primarily influenced by ambient temperature and internal hydration heat. According to Fourier’s law, the heat conduction behavior of concrete is expressed by (3):
ρ c T t = x [ λ ( T x ) ] + Q
where T , ρ , c , λ , and Q denote the absolute temperature, the mass density of the material, the specific heat capacity, the effective thermal conductivity, and the heat source, respectively.
To analyze temperature evolution in concrete, fiber optic sensors are embedded within the face slab to acquire real-time temperature data. These data are transmitted to the system and processed using algorithmic models to generate intuitive outputs, such as temperature distribution maps and trend curves, enabling comprehensive and dynamic monitoring. Although Fourier’s heat conduction equation provides a theoretical basis, its accuracy is constrained by parameter uncertainties arising from material variability and construction conditions. To improve model precision, data assimilation techniques are employed to calibrate parameters in real time by integrating measured fiber optic data with model predictions, thereby refining the virtual–physical mapping.
Data assimilation based on the Kalman filter algorithm involves two primary steps: prediction and update. Prediction is expressed in (4) and (5):
(1)
Prediction
X k + 1 f = M k , k + 1 X k a
P k + 1 f = M k , k + 1 P k a M k , k + 1 T + Q k
where X k + 1 f denotes the predicted state at time k + 1 ; X k a represents the analyzed state at time k ; and M k , k + 1 indicates the linear state transition model from time k to time k + 1 , typically determined by the physical interpretation of the state variable’s temporal evolution. The predicted error covariance matrix at time k + 1 is denoted as P k + 1 f , P k a signifies the error covariance matrix of the analysis value at time k , and Q k denotes the model error variance matrix.
(2)
Update
When an observation becomes available at time k + 1 , the predicted state is updated using the observation data. This update yields the refined state analysis value and its associated error covariance. The corresponding update equations are expressed as (6)–(8):
X k + 1 a = X k + 1 f + K k + 1 ( Y k + 1 O H k + 1 X k + 1 f )
P k + 1 a = ( I K k + 1 H k + 1 ) P k + 1 f
where K k + 1 denotes the Kalman gain matrix at time k + 1 , Y k + 1 O represents the observation at time k + 1 , and H k + 1 signifies the observation operator, which defines the functional relationship between the observed values and the system’s state variables.
To enhance proactive temperature control, the system incorporates an intelligent early warning and forecasting mechanism. A threshold is defined for the internal temperature of the concrete, and once real-time data exceed this threshold, the alarm system is activated. Alerts are issued via multiple channels, including audible and visual signals as well as SMS notifications, providing detailed information, such as the anomaly location, monitoring point number, severity level, and recommended responses. By dynamically mapping virtual and physical spatial data, warning information is aligned with the structural characteristics of the face slab and the ongoing construction progress. This facilitates visualized risk localization and significantly improves the accuracy and applicability of early warnings.

4.4. Information Visualization

Data visualization focuses on two core functions: real-time dynamic monitoring and data-driven adjustment of curing strategies. Through the intelligent curing system platform, multi-source data, such as equipment status, pouring progress, and fiber-optic temperature measurements are integrated to enable the comprehensive, real-time visual management of the construction process. Concurrently, the data management system applies intelligent algorithms to analyze transmitted and stored data, refine curing strategies, and deliver timely updates on construction progress and early warning via graphical interfaces. This approach ensures accurate monitoring of the full-cycle quality and curing effectiveness of concrete face slab construction.

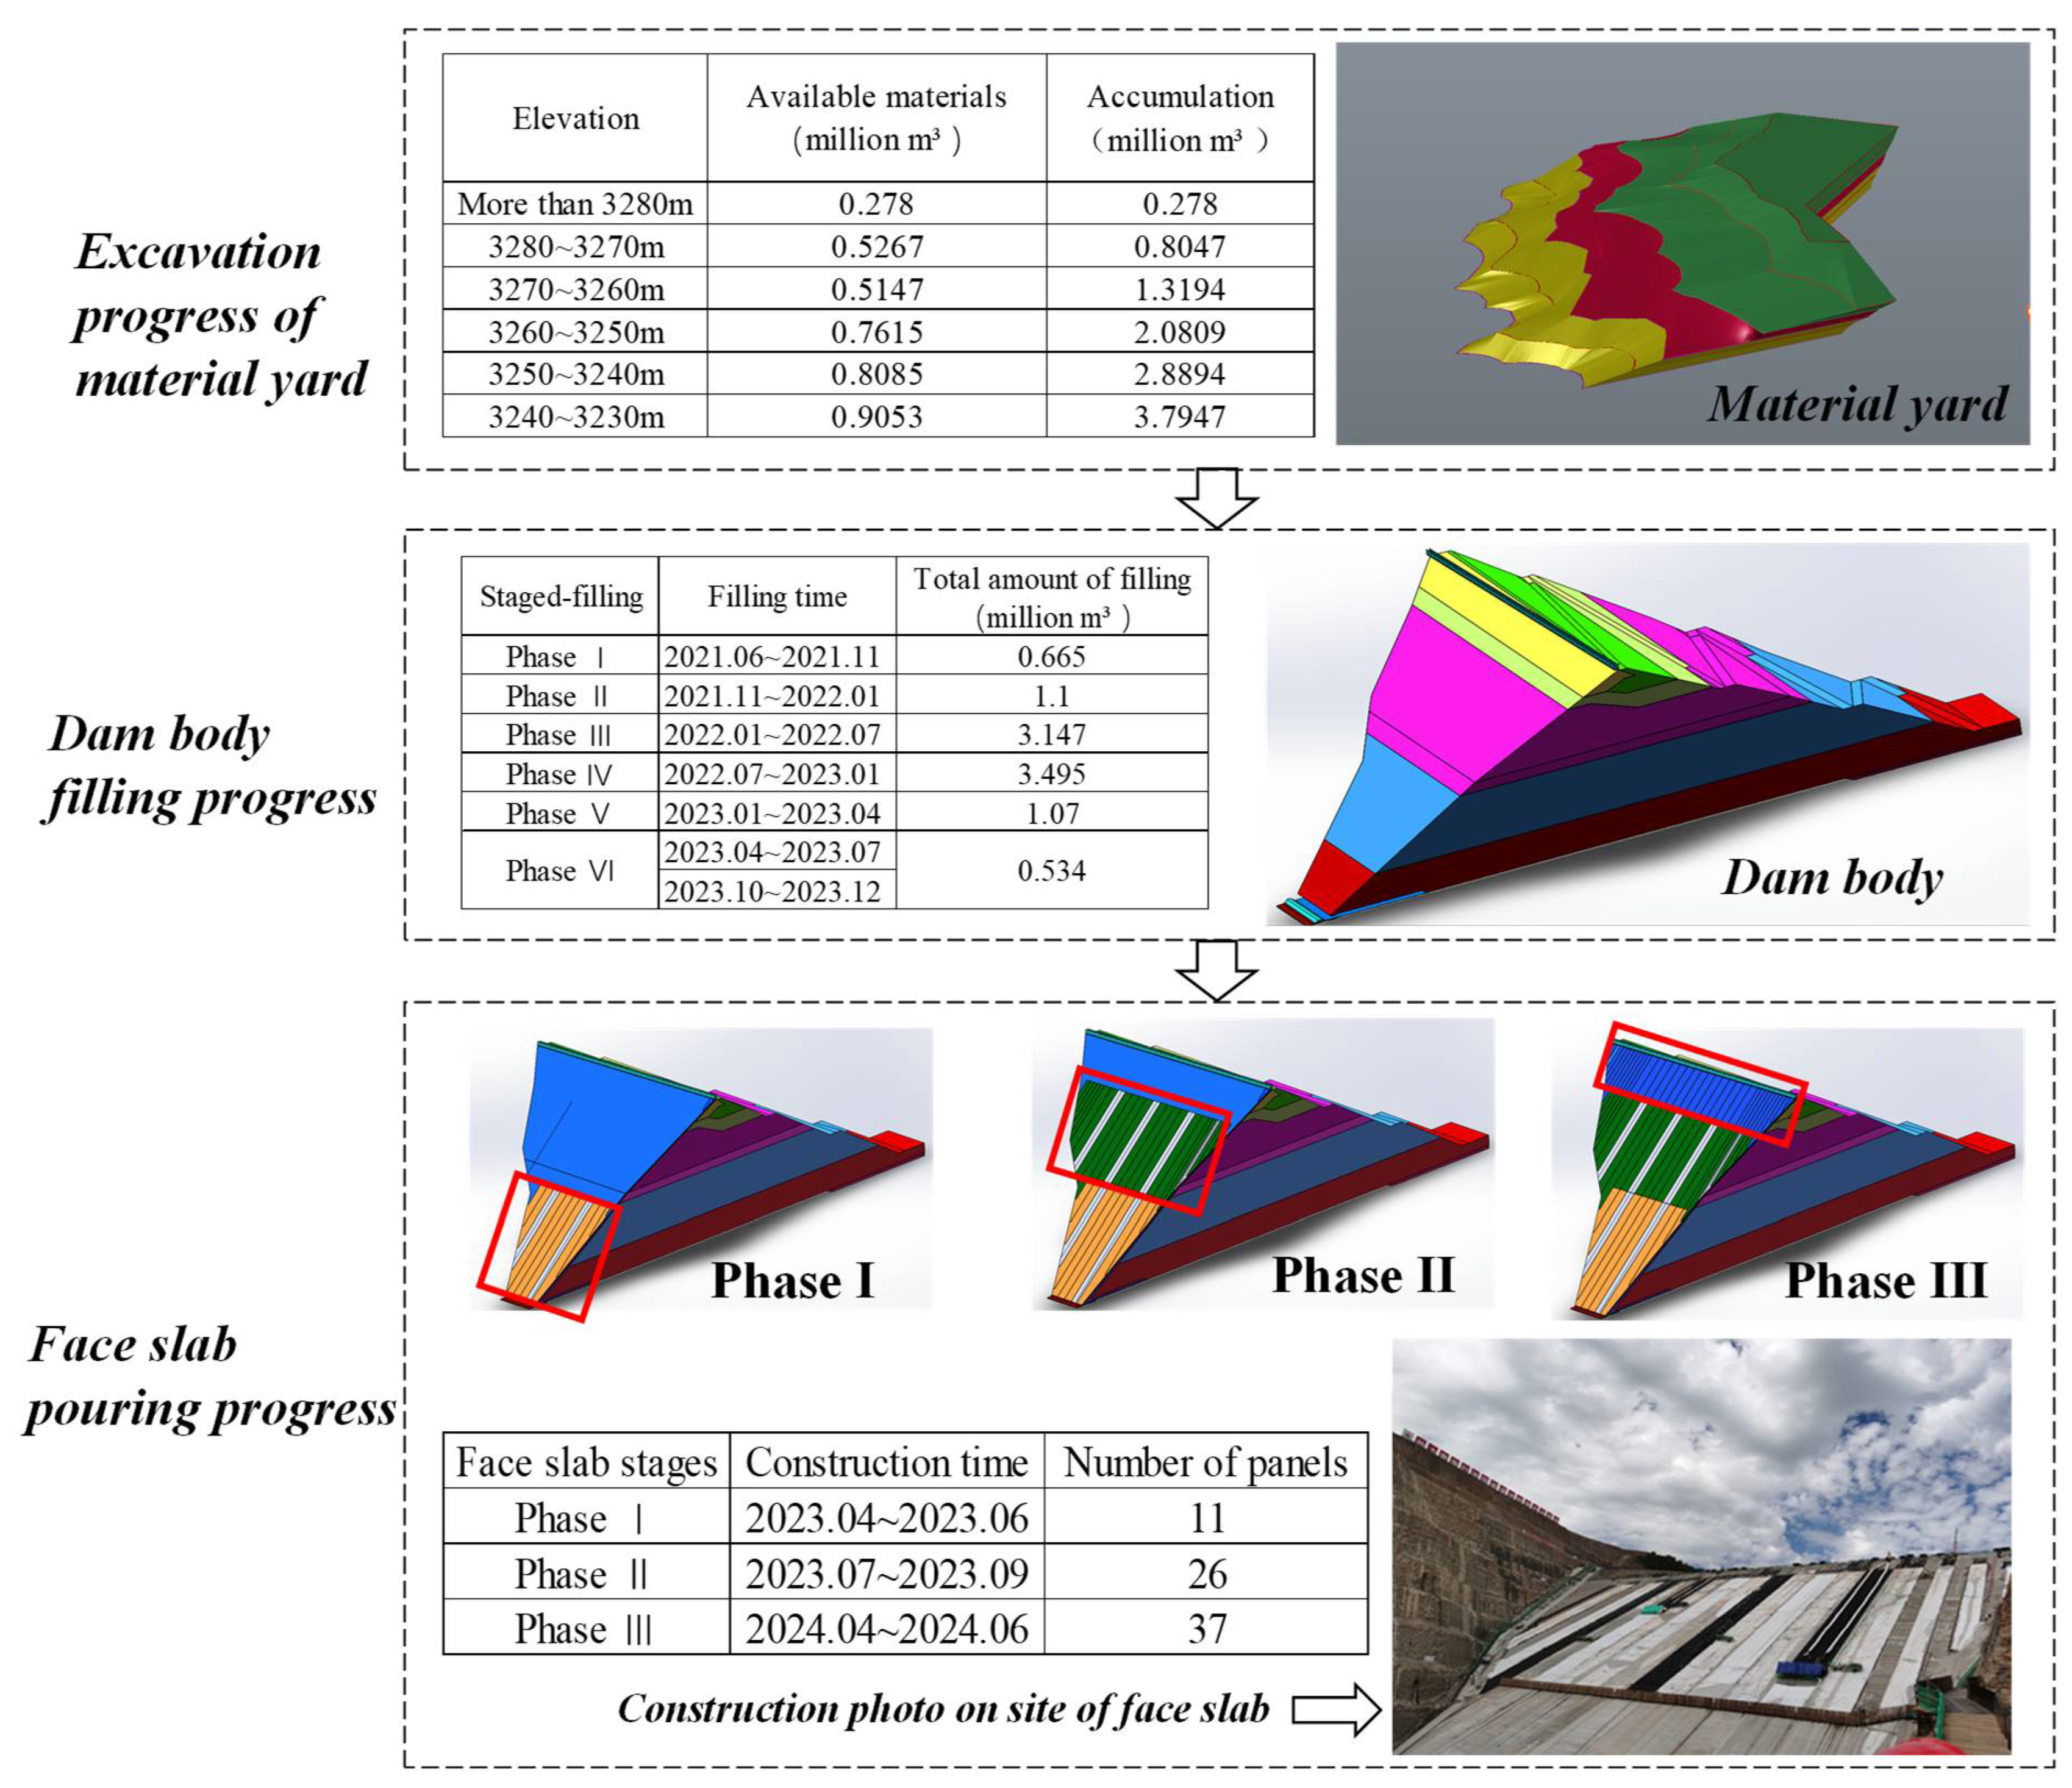
4.4.1. Visualization of Material Field Excavation Information

A 3D geological model of the material yard was established using large-scale 3D laser scanners, UAV-mounted 3D laser scanning systems, and image recognition technology. Based on theoretical analysis and historical monitoring data, dynamic monitoring was conducted across excavation methods and working faces. The real-time acquisition of material extraction data enables the development of rapid perception and analysis technologies for dam material excavation. An intelligent mining management system was constructed to support real-time material quantification and automatic detection of material inflow and outflow. Both 3D physical and geological models of the stockyard are dynamically updated. Data mining and intelligent algorithms were applied to construct material flow information models that guide on-site mining planning and zonal management.

4.4.2. Visualization of Dam Body Filling Progress

The visualization of dam body filling progress was achieved by constructing layered dynamic scenes that integrate data on dam phases, elevation changes, material transport paths, and compaction levels. Construction simulation animations were generated to dynamically present the filling process. The system platform allows users to monitor the dam’s real-time appearance at specific time points, track progress, and support future construction planning.

4.4.3. Visualization of Face Slab Construction Progress

The visualization of face slab construction progress was achieved using 3D modeling tools, such as Unity and Blender, to create virtual dynamic scenarios. Integrated data drives animated simulations of concrete pouring schedules, progress milestones, and engineering status. Real-time monitoring from remote cameras, drones, and other field devices enables multi-dimensional restoration of site conditions. The system supports timeline backtracking and progress simulation, allowing the precise tracking of construction status at specific periods. Through synchronized digital–physical interactions, the immersive and panoramic monitoring of the construction progress is achieved.

4.4.4. Visualization of Multi-Source Measured Data

The visualization of multi-source measured data for face slab concrete integrates temperature and humidity gradients with environmental parameters through an interactive platform. This platform supports time series analysis and anomaly warnings, enabling technicians to track performance trends, identify potential defects, and locate risk points. As a result, the intelligent management of face slab concrete construction is significantly improved.

4.4.5. Visualization of Early-Warning and Forecast of Face Slab Concrete Temperature-Exceeding Standard

The face slab concrete temperature over-limit warning and prediction function utilizes intelligent algorithms to forecast temperature rise and employs a threshold-based triggering mechanism. When the predicted values exceed the set limit, the system issues targeted alerts through visual cues, such as highlights, flashing indicators, and pop-up boxes, detailing abnormal batch numbers, monitoring point IDs, and real-time temperatures. This enables the prompt identification of temperature anomalies and supports technicians in diagnosing causes via historical data comparison, facilitating the timely implementation of cooling measures.

4.4.6. Visualization of Face Slab Concrete Curing Information

The visualization of concrete face slab curing information involves the real-time display of curing equipment operation and temperature field simulations on a construction monitoring platform. Given the direct influence of face slab quality on dam safety and durability, a temperature field simulation module is integrated into the platform. This module, driven by predefined mathematical models and real-time temperature data, simulates temperature distribution across various stages, allowing for the evaluation of curing strategy effectiveness and the refinement of curing plans.

5. Curing Strategy Generation Mechanism

Concrete progressively hardens and gains strength through the hydration process, which requires specific temperature and humidity conditions. When external environmental conditions fail to meet these requirements, human intervention becomes necessary. During the concrete pouring process, the hydration reaction also elevates the internal temperature, leading to significant temperature differences between the interior and surface layers. This temperature gradient induces thermal stress, which can result in cracking. Since concrete face slabs serve as the primary impervious structure, their quality directly affects the overall safety of the dam. Therefore, the curing process for face slab concrete is particularly critical. This study proposes a flowing water curing strategy generation method for concrete face slabs in rockfill dams. As shown in Figure 6, the method includes the following steps:
(1) Analysis of factors influencing concrete face slab temperature: Based on multi-source measured data, a comprehensive analysis was conducted to identify potential damage phenomena in face slab concrete. Key factors contributing to crack formation were found to include: difference between internal and external temperatures at the maximum temperature of a typical measuring point, surface humidity, temperature gradient, surface temperature, ambient temperature, instantaneous total radiation, and wind speed.
Difference between internal and external temperatures at the maximum temperature of a typical measuring point:
T S e = T S max T e
T M e = T M max T e
T B e = T B max T e
where T S e , T M e , and T B e represent the temperature differences between the surface layer, middle layer, and bottom layer of the optical fiber measurement points and the environmental temperature, respectively. T S max , T M max , and T B max represent the maximum temperature of the surface, middle, and bottom fiber optic measurement points, respectively. T e denotes the environmental temperature. And the distance between the surface layer optical fiber and the concrete face slab surface is 5–7 cm.
Temperature gradient:
T T M = T T T M
T M B = T M T B
where T T , T M , and T B represent the temperature of the surface, middle, and bottom fiber optic measurement points, respectively.
(2) Establishment of a priority system. Evaluation criteria were defined to systematically reflect the influence of various factors. Due to differences in dimensions and scales among original data, dimensionless processing was applied to generate comparable data sequences. Subsequently, a reference sequence representing the system’s behavior was determined. Different weights were assigned to indicators based on their relative importance. The correlation coefficient was used to assess the degree of association between each comparison sequence and the reference sequence over time, with smaller differences indicating larger correlation coefficients and higher levels of association.
(3) Calculation of grey relational degree. The grey relational degree was calculated using the sample data of each factor or object. A higher relational degree signifies a stronger correlation with the target, thus indicating a higher priority in the ranking [42,43,44]. The factors or objects were then ranked based on their grey relational degrees. This ranking helps decision-makers better understand the relative importance of various factors, facilitating the development of more scientific and rational decision-making strategies.
The calculation steps for conducting grey relational analysis to determine priority divisions are as follows:
(a) Determination of comparative and reference sequences: Assume there are i samples and j indicators, where i denotes the number of priorities and j represents the number of influencing factors within each priority. Each y i ( j ) ( i = 1 , 2 , 3 , m ; j = i = 1 , 2 , 3 , n ) denotes the value of the j th indicator in the i th year, and y 0 ( j ) represents the optimal value for each indicator.
The comparative sequence is defined as:
y i ( j ) = y 1 ( 1 ) y 2 ( n ) y m ( 1 ) y m ( n )
The reference sequence is defined as:
y 0 ( j ) = ( y 0 ( 1 ) , y 0 ( n ) )
(b) Dimensionless processing of indicator data.
The dimensionless form of the comparative sequence is:
y ^ i = y ^ 1 ( 1 ) y ^ 1 ( n ) y ^ m ( 1 ) y ^ m ( n )
The dimensionless form of the reference sequence is:
y ^ 0 ( j ) = ( y ^ 0 ( 1 ) , y ^ 0 ( n ) )
(c) Calculate the absolute differences between each element in the comparative sequence and the corresponding element in the reference sequence, and determine their maximum and minimum values:
D i = y ^ 0 ( j ) y ^ i ( j )
(d) Determine the weight values for each indicator, where the comprehensive weights are obtained by combining both objective and subjective evaluations.
(e) Calculate the grey relational coefficients [45,46]:
ρ i ( j ) = δ min + ζ δ max D i ( j ) + ζ δ max
Where ζ represents the distinguishing coefficient, generally set to 0.5.
δ min = min i = 1 m min j = 1 n D i ( j ) ; δ max = max i = 1 m max j = 1 n D i ( j )
(f) Calculate the grey relational degree.
This measure is determined by multiplying the grey relational coefficient by the comprehensive weight of each indicator. The resulting value is then mapped to the range of (0, 10]. The corresponding calculation and transformation formulas are as follows:
x ( j ) = i = 1 m ω i ρ i ( j )
x ( j ) 10 = x ( j )
The finalized priority hierarchy is determined as follows: Concrete surface humidity is classified as the first priority. The second priority includes the maximum temperature difference between the interior and exterior layers of the surface layer, the peak surface temperature of the surface layer, the temperature difference between the core and surface layer, and the surface temperature. The third priority encompasses environmental temperature, instantaneous total radiation, and wind speed. While the grey relational analysis method introduces a certain level of objectivity in establishing this priority hierarchy, the comprehensive integration of practical considerations remains essential during actual implementation.
Next, the weights of each factor are assessed. Given that the temperature of the concrete face slab is influenced by multiple factors with complex and difficult-to-quantify decision criteria, and considering that multiple factors exist under the same priority level, the entropy weight method is employed to allocate weights among factors within the same level. For factors within the same priority category, judgment matrices are developed based on experimental data, historical observations, and expert evaluations to determine their respective weights. The specific calculation steps for determining the objective weights using the entropy weight method are as follows:
(a) Normalize the collected relevant data, aiming to standardize different measurements by converting absolute indicator values into relative values, and set x i j = x i j .
The conversion formula for positive indicators is:
x i j = 0.998 x i j min { x i j , x n j } max { x i j , x n j } min { x i j , x n j } + 0.002
The conversion formula for negative indicators is:
x i j = 0.998 max { x i j , x n j } max { x i j , x n j } min { x i j , x n j } + 0.002
(b) Calculate the proportion P i j of the indicator value for the i th item under the j th criterion [47]:
P i j = x i j i = 1 n x i j ( j = 1 , 2 , m )
(c) Calculate information entropy. A smaller information entropy indicates a greater variability in the indicator’s values, suggesting higher information content and a more significant role in comprehensive evaluations. Determine the information entropy value e j ( e > 0 ) for the j th indicator [48]:
e j = k i = 1 n p i j ln P i j
k = 1 ln n
(d) Calculate the coefficient of variation g j ; a higher coefficient implies a greater weight for that indicator:
g j = 1 e j
(e) Determine the weights of each indicator. Calculate the weight w j of the j th indicator.
w j = g j j = 1 m g j
Next, strategies are developed based on the established priority weighting system: For factors with different priority levels, higher-priority factors should take precedence. For factors within the same priority level, their interrelationships and interactions must be considered to avoid conflicts. After calculating the weight values for factors at the same priority level, they should be compared, and execution should follow the descending order of these weights. It is important to note that, when factors at the same priority level have an “or” relationship, if any individual indicator fails to meet the curing requirements, corresponding strategies should be implemented. If multiple indicators fail simultaneously, all relevant factors must be addressed and executed based on their assigned weights. During strategy implementation, changes in other indicators should be monitored. Additionally, practical considerations and resource limitations must be taken into account to determine the most appropriate solutions.

6. Case Study

An engineering case involving a CFRD was employed to validate the proposed method. To address outdated curing standards, delayed interventions, and inefficient management, an intelligent curing system was established. The process began with the development of a 3D dam model in the SolidWorks software to replicate on-site conditions. A multi-source data acquisition scheme was then designed based on construction techniques, with IoT technology facilitating the real-time transmission and integrated management of heterogeneous data. An intelligent curing platform and related devices were subsequently deployed. Based on data analysis, solenoid valves were remotely controlled, and curing water flow rates were regulated in real-time, enabling intelligent curing throughout the construction phase.

6.1. Project Overview

The geographical location of the Maerdang CFRD is illustrated in Figure 7. Serving as a key power source for China’s “West–East Power Transmission” initiative and the “Qinghai-to-Henan” project, it is a major hydropower facility under construction on the upper reaches of the Yellow River. Situated in the high-altitude northwestern plateau of China, the site experiences extreme cold, arid conditions and prolonged sunshine exposure. The multi-year average temperature is approximately −5 °C, with relative humidity ranging from 50% to 55%. This project represents a globally significant example of large-scale hydropower construction in severe, high-altitude, low-temperature environments.
Due to the harsh natural conditions of the project site, characterized by extreme cold, high altitude, low air humidity, intense solar radiation, and large diurnal temperature fluctuations, ensuring construction quality and effective crack control during concrete face slab construction presents significant challenges. To mitigate these issues, an intelligent curing system based on multi-source real-time monitoring data must be established to enable intelligent curing throughout the construction period.

6.2. Construction of Material Yard, Dam Body, and Face Slab Model

For material sourcing, the Erchangyan material yard is designed to supply 9.78 million m3 of dam materials (including 0.97 million m3 of transportation loss). Of this, 3.76 million m3 is classified as reserve material, while 5.51 million m3 is designated for stripping. The final mining elevations are EL3170 m and EL3140 m for the main and reserve resources, respectively. The maximum slope height reaches 160 m, with slope gradients of 1:0.3, 1:1, and 1:1.25. The designed mining area is 2.319 million m3, and the reserve mining area (including reserves) is 2.348 million m3. A three-dimensional model of the Maerdang CFRD was developed using the SolidWorks software. Based on staged filling requirements, the dam geometry and material distribution were accurately simulated, with the dam body segmented into six sequential filling stages. The concrete face slab, positioned along the upstream face, functions as the primary anti-seepage structure of the CFRD. The Maerdang dam reaches a maximum height of 211 m, with a crest elevation, width, and crest length of 3282, 12, and 342.5 m. The reinforced concrete face slab features a bottom slope of 1:1.06, tapering in thickness from 1.1 m at the base to 0.4 m at the top, and is poured in three stages. Figure 8 illustrates excavation activities at the material yard, dam body filling stages, and face slab-pouring operations.

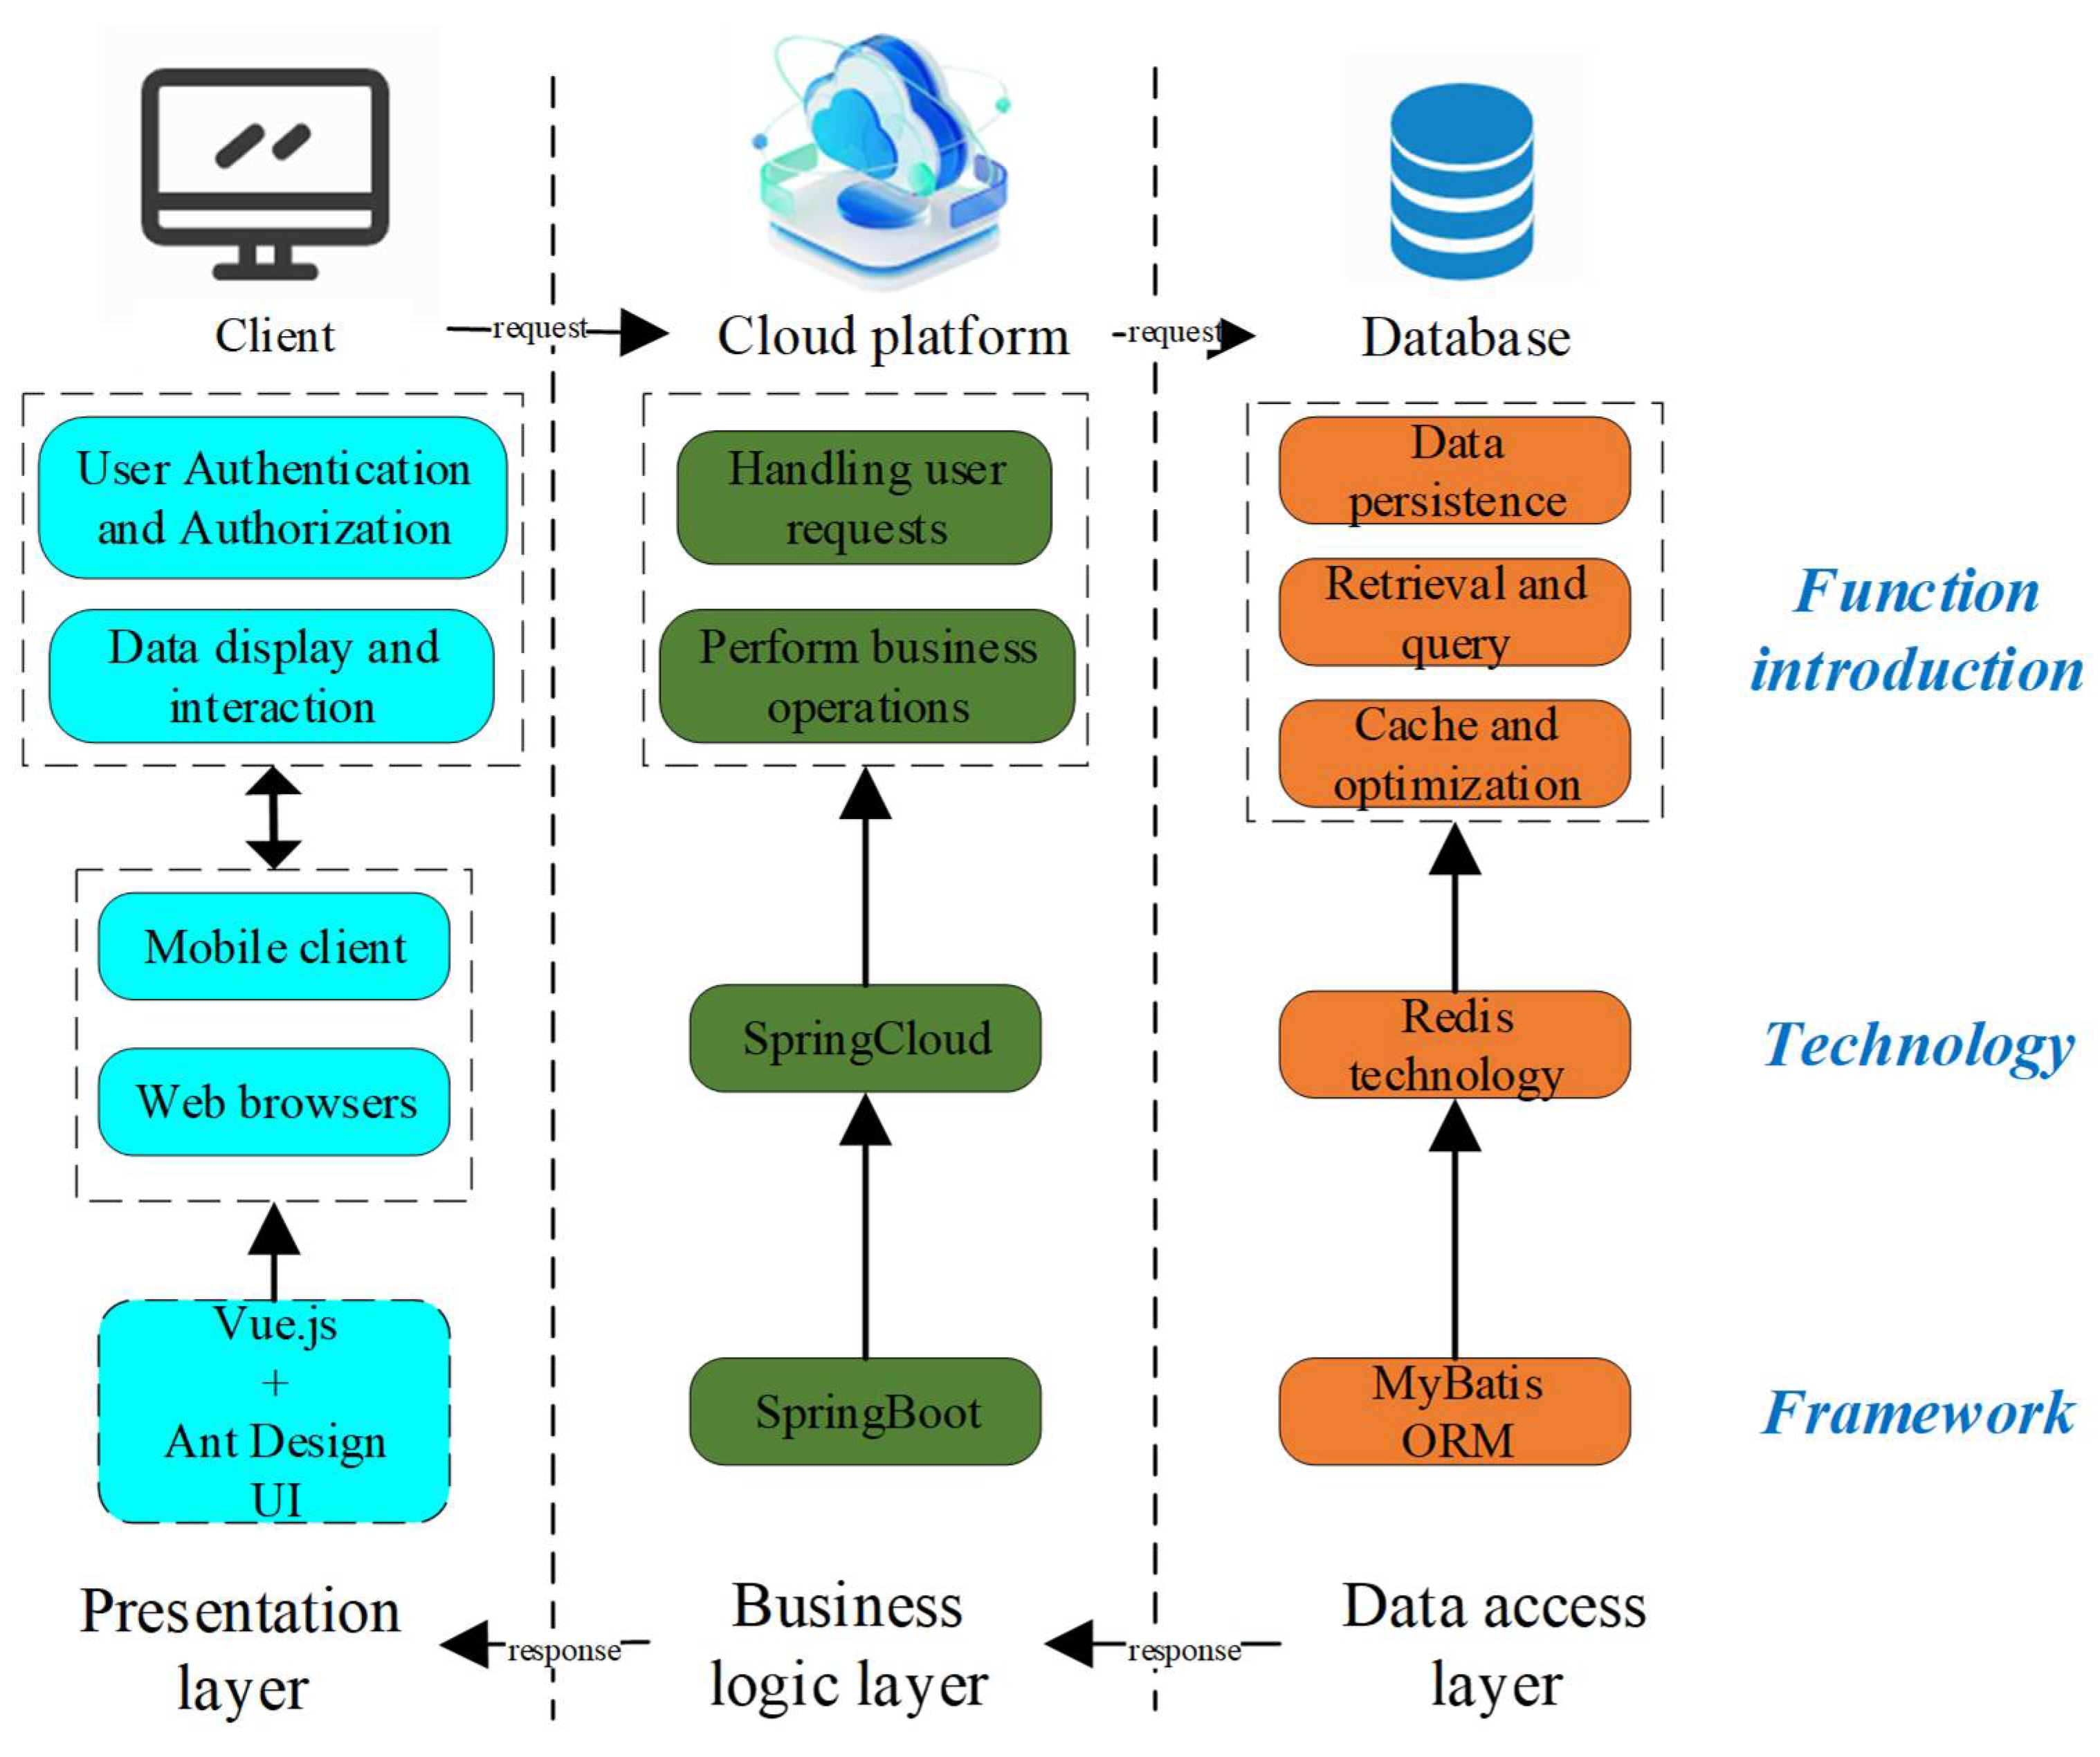
6.3. System Development Architecture

The system adopted a three-tier architecture [49,50] consisting of the Presentation Layer, Business Logic Layer, and Data Access Layer (Figure 9). This hierarchical structure ensures high cohesion and low coupling, thereby improving system maintainability and scalability. Key advantages include: (1) independent development and deployment of each layer, supporting modular expansion; (2) layered security mechanisms: authentication at the presentation layer, exception handling and logging at the business logic layer, and backup/recovery at the data layer; and (3) standardized interfaces that simplify integration and ensure reliable system operation. The roles of each layer are as follows:
(1)
Presentation layer: Manages user interface display and interaction, employing responsive design for cross-device compatibility.
(2)
Business logic layer: Handles core business logic, processes user input, executes operations, and returns results.
(3)
Data access layer: Oversees interaction with persistent storage, using the MyBatis ORM framework to abstract data access operations and provide a consistent interface.

6.4. Multi-Source Measured Data Perception

Traditional temperature measurement methods exhibit limitations due to low accuracy, limited sensitivity, and the inability to perform simultaneous multi-point monitoring. Moreover, the complex climatic conditions in high-altitude and high-cold regions further hinder reliable data collection and transmission, reducing measurement precision. To overcome these challenges and support the intelligent curing of face slab concrete, a comprehensive multi-source data acquisition scheme was developed. This scheme incorporates distributed optical fiber temperature sensing, temperature–humidity monitoring, and meteorological data collection. The proposed multi-source data acquisition framework is illustrated in Figure 10.
To obtain the real-time internal temperature distribution of the face slab concrete, optical fibers were embedded using a top-down pulling and laying method. The temperature accuracy of the DTS system is ≤±1 °C, and the temperature resolution is ≤±0.5 °C. One end of the fiber is connected to a pigtail linked to the temperature measurement unit, while the other end extends vertically along the thickness direction of the face slab. Temperature data are collected at hourly intervals. Simultaneously, to mitigate the risk of drying shrinkage cracks, temperature–humidity sensors were installed at the upper, middle, and lower sections along the length of the face slab to monitor surface conditions, with data acquisition conducted every 30 min. Additionally, due to the substantial influence of environmental conditions on curing effectiveness, a weather station was positioned atop the face slab to monitor ambient parameters, such as temperature, humidity, solar radiation, wind speed, and wind direction, also at 30-min intervals.

6.5. Integrated Management System of Multi-Source Measured Data

The multi-source IoT information management system was developed based on the MVC architecture and implemented a front-end and back-end separation design. Bidirectional communication with gateway devices was achieved through the MQTT protocol, enabling the mapping of physical gateways to their corresponding virtual representations. All wireless controllers, including fiber-optic temperature measurement hosts, temperature–humidity sensors, and high-precision weather stations, utilize LoRa collectors for data transmission and reception control. These devices connect to the IoT gateway via RS485 interfaces and operate using the ModBus RTU protocol. Subsequently, data are transmitted to Huawei Cloud servers over 5G networks using the MQTT protocol.
Following the configuration of devices and variables on the Wutongbolian platform, data collection was enabled once device wiring was verified, configurations were completed, and all units functioned normally. The collected data were transmitted to Huawei Cloud via the MQTT protocol, facilitating the integrated management of multi-source information. On the Huawei Cloud platform, users can remotely control solenoid valve operations by inputting values from 1 to 16 to adjust valve opening states and degrees. A schematic of the integrated multi-source data management system is presented in Figure 11.

6.6. Synchronization of Construction Information and Virtual Visualization

In the intelligent curing system for face slab concrete, synchronization between the virtual and physical environments is achieved through two primary mechanisms. First, the construction progress is virtually mirrored using a 3D model of the Maerdang dam. The model simulates actual on-site operations, enabling users to observe dam filling and face slab-pouring status at specified time points via an interactive timeline. In the visualization, brown indicates completed dam fill, yellow represents sections under filling, and green highlights face slab areas currently being poured. Dam filling commenced on 30 May 2021 and concluded on 12 December 2023, while face slab construction spanned from 1 April 2023 to 16 May 2024. Second, the system continuously integrates real-time sensor data, including temperature, humidity, and solar radiation. When temperature readings exceed predefined thresholds, the alert mechanism is activated, and critical zones are highlighted in red within the model to indicate the spatiotemporal extent of temperature exceedance. Additionally, real-time data, such as slab phase, monitoring point ID, temperature, and spatial coordinates, are accessible, providing a comprehensive visualization of face slab conditions. The synchronization is illustrated in Figure 12.

6.7. System Integration and Management

The intelligent curing system for face slab concrete serves as a scientific and refined management platform that integrates the 3D visualization of concrete-pouring progress, multi-source data visualization, and the dynamic visualization of curing measure adjustments (Figure 13). Accessible via a web interface, the platform consolidates all operational functions for user terminals. Its main menu comprises the following modules:
(1)
System homepage: Displays the real-time visualization of dam filling and face slab-pouring progress. It highlights conflicting data alerts, visualizes temperature exceedances on specific face slab areas, and aids in promptly identifying weaknesses in curing performance.
(2)
System management: Manages user registration, role classifications, system development department details, data source categorization, and platform configuration for construction monitoring.
(3)
System monitoring: Allows performance analysis by administrators or users, enabling real-time issue detection, system optimization, and improvements in reliability and stability.
(4)
IoT management: Facilitates access to monitoring device configurations and raw data. Users can query time-specific parameters of the concrete face slab across modules, supporting data-driven decision-making.
(5)
Data analysis: Incorporates modules, such as “DTS data analysis”, “temperature and humidity data analysis”, and “meteorological data analysis”, enabling the evaluation of concrete curing conditions and supporting the timely implementation of corrective measures.

7. Discussion

7.1. System Performance and Practical Outcomes

The intelligent curing system for the face slab concrete demonstrated strong performance during its implementation in the Maerdang CFRD project. Key findings include:
(1)
Real-time monitoring and early warning: The system utilizes DTS to provide a continuous monitoring of internal temperature distribution. The temperature accuracy is ±1 °C, with positioning below 1 m. The selected humidity sensor offers a resolution of 0.1% relative humidity. The meteorological station has a temperature measurement range from −40 °C to 80 °C, with a resolution of 0.1 °C. If the temperature gradient exceeds a preset threshold, immediate visual and SMS alerts are triggered for swift intervention, significantly minimizing the risk of thermal cracking.
(2)
Dynamic feedback control: By integrating environmental and surface temperature and humidity data, the system dynamically adjusts the water flow through the solenoid valve, with the valve opening ranging from 8 to 16. This adaptive method ensures that surface humidity remains above 95% and reduces the internal–external temperature difference below 15 °C, effectively alleviating stress caused by hydration heat.

7.2. Advantages over Traditional Methods

Since the current concrete curing methods for face slab still rely primarily on manual labor with mechanical assistance, lacking scientific and precise management, and given the scarcity of research on an intelligent concrete curing system for face slab, we innovatively developed an intelligent concrete curing system for face slab based on IoT technology.
Compared to conventional manual curing techniques, the proposed system demonstrated superior performance:
(1)
Data comprehensiveness: The distributed optical fibers replaced hundreds of individual sensors, capturing temperature profiles across the entire face slab without any spatial blind spots. In contrast, traditional methods relying on thermocouples provided only localized data.
(2)
Cost-effectiveness: Although the initial investment in IoT infrastructure is significant, long-term maintenance costs are reduced due to decreased manual labor and fewer sensor replacements.
(3)
Energy and water saving: The system addresses the past issue of prolonged large flow water flow during construction and automatically adjusts the water supply through intelligent control, resulting in actual energy and water savings.
(4)
Scientific and refined management: The intelligent curing control system platform described in this paper is a scientific management tool that integrates concrete pouring progress visualization, massive data visualization, and dynamic curing measure adjustments. This enhances transparency in the dam construction process and supports management innovation in water conservancy projects.

7.3. Limitations and Future Prospects

While successfully implemented in the Maerdang CFRD project, several limitations remain. First, the accuracy of sensor data and device reliability may be influenced by extreme environmental conditions. Second, system performance relies on network stability, which could be compromised in remote areas. Third, despite the benefits of digital twin technology for physical and virtual mapping, challenges remain in the real-time processing of large-scale data, such as delays in fiber-optic temperature data acquisition and analysis, which could impact the immediacy of feedback control. Future research should focus on developing more robust wireless communication technologies, such as satellite-based solutions, to ensure reliable data transmission in remote or harsh environments. Additionally, the intelligent curing system proposed in this paper employed a modular architecture and generic technologies, enabling seamless adaptation to various concrete structures. While initially developed for concrete face slab of rockfill dams, its core functionalities, including multisource monitoring, IoT-driven data transmission, intelligent analysis, and dynamic control, can be customized to meet the curing requirements of diverse concrete applications. Further research and practical validation across different scenarios will enhance its versatility, establishing it as a universal solution for intelligent concrete curing in civil engineering projects. It could promote a wider adoption of intelligent curing technologies, contributing to more scientific and precise engineering management.

8. Conclusions

This study focuses on the face slab concrete of CFRD, addressing challenges associated with outdated curing practices and the delayed implementation of curing measures. An intelligent curing control system for face slab concrete was systematically developed, and its feasibility was successfully verified through application in the Maerdang dam project, situated in a high-altitude, cold-climate region. The primary research contributions are as follows:
(1)
A multi-source data acquisition and transmission scheme tailored for face slab concrete was established to enable real-time perception. A LoRa+5G heterogeneous network architecture was adopted, and the MQTT protocol was utilized to complete gateway authentication and support real-time bidirectional data communication.
(2)
Upon data transmission to the front-end server, preprocessing and storage procedures were implemented. Data cleaning was conducted, followed by the establishment of analysis rules and boundary conditions to facilitate integrated fusion analysis and centralized data management.
(3)
A concrete curing effectiveness evaluation system was constructed, integrating multiple indicators, such as internal–external temperature differentials, cooling rates, temperature gradients, and humidity levels. Data mining, intelligent algorithms, and finite element analysis were employed to support the evaluation framework.
(4)
Intelligent curing devices and systems were developed to formulate adaptive curing strategies based on analytical outputs. By controlling solenoid valve openings, curing water flow was dynamically adjusted. A web-based user interface and visual data dashboard were also established, providing real-time curing recommendations and supporting intelligent management throughout the face slab construction process.
The proposed system enables full digital mapping and closed-loop intelligent control of the curing process, establishing a comprehensive “monitoring–prediction–regulation–evaluation” framework. This solution significantly improves the durability of dam concrete structures in extreme environments and offers critical support for transitioning from digital monitoring to intelligent decision-making in hydraulic engineering construction.

Author Contributions

Investigation, Methodology, Writing—original draft preparation, Y.Z.; Writing—original draft preparation, Investigation, Methodology, Y.F.; Writing—review and editing, Validation, Z.L.; Investigation, Resources, Methodology, D.L.; Conceptualization, C.Z.; Funding acquisition, Methodology, Investigation, H.Z.; Conceptualization, F.W.; Methodology, L.L.; Investigation, R.W., D.K., T.P. and L.Z. All authors have read and agreed to the published version of the manuscript.

Funding

This research work was funded by the Youth Fund project of the National Natural Science Foundation of China (No. 52109157) and the Natural Science Foundation of Hubei Province (No. 2025AFB462).

Data Availability Statement

The original contributions presented in this study are included in the article. Further inquiries can be directed to the corresponding author.

Acknowledgments

The authors thank the reviewers and editors for useful comments and suggestions that assisted in improving the paper.

Conflicts of Interest

Author Dongfeng Li was employed by the company Sinohydro Bureau 3 Co., Ltd., PowerChina. The remaining authors declare that the research was conducted in the absence of any commercial or financial relationships that could be construed as a potential conflict of interest.

References

  1. Ma, H.Q.; Chi, F.D. Technical Progress on researches for the safety of high concrete-faced rockfill dams. Engineering 2016, 2, 332–339. [Google Scholar] [CrossRef]
  2. Qu, P.F.; Chai, J.R.; Xu, Z.G. Three-dimensional static and dynamic analyses of an embedded concrete-face rockfill dam. Water 2023, 15, 4189. [Google Scholar] [CrossRef]
  3. Li, N.H.; Yang, Z.Y. Technical advances in concrete face rockfill dams in China. Chin. J. Geotech. Eng. 2012, 34, 1361–1368. [Google Scholar]
  4. Modares, M.; Quiroz, J.E. Structural analysis framework for concrete-faced rockfill dams. Int. J. Geomech. 2016, 16, 04015024. [Google Scholar] [CrossRef]
  5. Zheng, Y.H.; Shan, K.; Xu, Y.X.; Chen, X.Y. Numerical simulation of mechanical characteristics of concrete face rockfill dam under complicated geological conditions. Arab. J. Geosci. 2019, 12, 674. [Google Scholar] [CrossRef]
  6. Xin, J.D.; Zhang, G.X.; Liu, Y.; Wang, Z.H.; Wu, Z. Effect of temperature history and restraint degree on cracking behavior of early-age concrete. Constr. Build. Mater. 2018, 192, 381–390. [Google Scholar] [CrossRef]
  7. Shi, N.; Ouyang, J.S.; Zhang, R.X.; Huang, D.H. Experimental study on early-age crack of mass concrete under the controlled temperature history. Adv. Mater. Sci. Eng. 2014, 2014, 671795. [Google Scholar] [CrossRef]
  8. Ouyang, J.S.; Chen, X.M.; Huangfu, Z.H.; Lu, C.; Huang, D.H.; Li, Y.B. Application of distributed temperature sensing for cracking control of mass concrete. Constr. Build. Mater. 2019, 197, 778–791. [Google Scholar] [CrossRef]
  9. Ma, F.J.; Kwan, A. Finite element analysis of concrete shrinkage cracks. Adv. Struct. Eng. 2018, 21, 1454–1468. [Google Scholar] [CrossRef]
  10. Combrinck, R.; Steyl, L.; Boshoff, W.P. Influence of concrete depth and surface finishing on the cracking of plastic concrete. Constr. Build. Mater. 2018, 175, 621–628. [Google Scholar] [CrossRef]
  11. Cai, C.; Tang, H.Q.; Wen, T.; Li, J.Y.; Chen, Z.; Li, F.H.; Su, Q.; Li, R. Long-term shrinkage performance and anti-cracking technology of concrete under dry-cold environment with large temperature differences. Constr. Build. Mater. 2022, 349, 128730. [Google Scholar] [CrossRef]
  12. Nasir, M.; Al-Amoudi, O.S.B.; Maslehuddin, M. Effect of placement temperature and curing method on plastic shrinkage of plain and pozzolanic cement concretes under hot weather. Constr. Build. Mater. 2017, 152, 943–953. [Google Scholar] [CrossRef]
  13. Asamoto, S.; Ohtsuka, A.; Kuwahara, Y.; Miura, C. Study on effects of solar radiation and rain on shrinkage, shrinkage cracking and creep of concrete. Cem. Concr. Res. 2011, 41, 590–601. [Google Scholar] [CrossRef]
  14. Lv, Z.Y.; Yu, S.; Su, A.S.; Guan, R.C.; Jia, S.Z.; Yin, P.H. Feasibility study of temperature control measures during the construction of large-volume concrete gravity dams in cold regions, A case study. Water 2024, 16, 2761. [Google Scholar] [CrossRef]
  15. Safiuddin, M.; Kaish, A.; Woon, C.; Raman, S. Early-age cracking in concrete, causes, consequences, remedial measures, and recommendations. Appl. Sci. 2018, 8, 1730. [Google Scholar] [CrossRef]
  16. Ding, L.J.; Liu, Y.H. Study on temperature control of mass concrete. Fresen Environ. Bull. 2021, 30, 8696–8704. [Google Scholar]
  17. Wang, Z.H.; Liu, Y.; Zhang, G.X.; Hou, W.Q. Schematic study on temperature control and crack prevention during spillway tunnel concreting period. Mater. Struct. 2015, 48, 3517–3525. [Google Scholar] [CrossRef]
  18. Jin, H.W.; Wang, G.A.; Chen, Z.M. Temperature control technology for construction of jinsha river bridge. Adv. Civ. Eng. 2021, 2021, 3452167. [Google Scholar] [CrossRef]
  19. Zhang, Y.N.; Wang, S.Q.; He, S.J.; Hao, X.W. Analysis of factors influencing the temperature field variation in mass concrete during hydration heat release. Case Stud. Therm. Eng. 2023, 52, 103737. [Google Scholar] [CrossRef]
  20. Tasri, A.; Susilawati, A. Effect of cooling water temperature and space between cooling pipes of post-cooling system on temperature and thermal stress in mass concrete. J. Build. Eng. 2019, 24, 100731. [Google Scholar] [CrossRef]
  21. Zhu, F.X.; Chen, G.R.; Zhang, F.; Li, Q.W. Numerical simulation of thermal field in mass concrete with pipe water cooling. Front. Phys. 2021, 9, 716859. [Google Scholar] [CrossRef]
  22. Maslehuddin, M.; Ibrahim, M.; Shameem, M.; Ali, M.R.; Al-Mehthel, M.H. Effect of curing methods on shrinkage and corrosion resistance of concrete. Constr. Build. Mater. 2013, 41, 634–641. [Google Scholar] [CrossRef]
  23. Chatterji, S. Probable mechanisms of crack formation at early ages of concretes, A literature survey. Cem. Concr. Res. 1982, 12, 371–376. [Google Scholar] [CrossRef]
  24. Samer, S.; Ghazi, A. Towards an efficient big data management schema for IoT. J. King Saud Univ.-Comput. Inf. Sci. 2022, 34, 7803–7818. [Google Scholar]
  25. Xu, L.D.; He, W.; Li, S. Internet of Things in industries, A survey. IEEE Trans. Ind. Inf. 2014, 10, 2233–2243. [Google Scholar] [CrossRef]
  26. Lin, P.; Hu, H.; Zheng, D.; Li, Q.B. Field tests on the evolution of a real thermal field in concrete. J. Tsinghua Univ. Sci. Technol. 2015, 55, 27–32. [Google Scholar]
  27. Lin, P.; Ning, Z.Y.; Li, M.; Fan, Q.X.; Wang, Z.L.; Chen, W.F. Study on prototype intelligent control test of cooling pipeline for a super-high arch dam. J. Hydraul. Eng. 2021, 52, 819–828. [Google Scholar]
  28. Lin, P.; Li, M.; Liu, K.; Ouyang, J.S.; Yang, Z.L.; Qiao, Y. Study on adaptive intelligent cooling strategy for low-heat cement RCC. J. Hydraul. Eng. 2022, 53, 1028–1038. [Google Scholar]
  29. Madni, A.; Madni, C.; Lucero, S. Leveraging digital twin technology in model-based systems engineering. Systems 2019, 7, 7. [Google Scholar] [CrossRef]
  30. Yeh, C.S.; Chen, S.L.; Li, I.C. Implementation of MQTT protocol based network architecture for smart factory. Proc. Inst. Mech. Eng. B-J. Eng. Manuf. 2021, 235, 2132–2142. [Google Scholar] [CrossRef]
  31. Kong, C.; Chen, Y.; Zhao, Q. Research on cloud-side communication mapping of the distribution Internet of Things based on MQTT protocol. Power Syst. Prot. Control 2021, 49, 168–176. [Google Scholar]
  32. Kumar, V.; Sakya, G.; Shankar, C. WSN and IoT based smart city model using the MQTT protocol. J. Discret. Math. Sci. Cryptogr. 2019, 22, 1423–1434. [Google Scholar] [CrossRef]
  33. Jaquez, A.D.B.; Herrera, M.T.A.; Celestino, A.E.M.; Ramirez, E.N.; Cruz, D.A.M. Extension of Lora coverage and integration of an unsupervised anomaly detection algorithm in an IoT water quality monitoring system. Water 2023, 15, 1351. [Google Scholar] [CrossRef]
  34. Taleb, H.; Nasser, A.; Andrieux, G.; Charara, N.; Cruz, E.M. Energy consumption improvement of a healthcare monitoring system, Application to LoRaWAN. IEEE Sens. J. 2022, 22, 7288–7299. [Google Scholar] [CrossRef]
  35. Li, W.; Liu, G.G.; Choi, J. Environmental monitoring system for intelligent stations. Concurr. Comput.-Pract. Exp. 2021, 33, e5131. [Google Scholar] [CrossRef]
  36. Zhang, X.H.; Zhang, M.M.; Meng, F.F.; Qiao, Y.; Xu, S.J.; Hour, S. A low-power wide-area network information monitoring system by combining NB-IoT and Lora. IEEE Internet Things J. 2019, 6, 590–598. [Google Scholar] [CrossRef]
  37. Kim, D.Y.; La, H.J.; Kim, S.D. A framework for effectively managing heterogeneity of IoT devices. J. KISS Softw. Appl. 2014, 41, 353–366. [Google Scholar]
  38. Noaman, M.; Khan, M.S.; Abrar, M.F.; Ali, S.; Alvi, A.; Saleem, M.A. Challenges in integration of heterogeneous Internet of Things. Sci. Program. 2022, 14, 8626882. [Google Scholar] [CrossRef]
  39. Gupta, S.; Patel, N.; Kumar, A.; Jain, N.K.; Dass, P.; Hegde, R.; Rajaram, A. Intelligent resource optimization for scalable and energy-efficient heterogeneous IoT devices. Multimed. Tools Appl. 2024, 83, 82343–82367. [Google Scholar] [CrossRef]
  40. Zhou, H.W.; Pan, Z.G.; Liang, Z.P.; Zhao, C.J.; Zhou, Y.H.; Wang, F. Temperature field reconstruction of concrete dams based on distributed optical fiber monitoring data. KSCE J. Civ. Eng. 2019, 23, 1911–1922. [Google Scholar] [CrossRef]
  41. Zhou, H.W.; Zhao, C.J.; Liang, Z.P.; Zhou, Y.H.; Wang, F. Method and Application of Spatial Positioning for Valid Temperature-measuring Optical Fibers in Concrete Dams. KSCE J. Civ. Eng. 2023, 27, 3484–3500. [Google Scholar] [CrossRef]
  42. Chu, J.J.; Xiao, X.P. Benefits evaluation of the Northeast Passage based on grey relational degree of discrete Z-numbers. Inform. Sci. 2023, 626, 607–625. [Google Scholar] [CrossRef]
  43. Zhang, Y.M.; Shang, K.J. Evaluation of mine ecological environment based on fuzzy hierarchical analysis and grey relational degree. Environ. Res. 2024, 257, 119370. [Google Scholar] [CrossRef] [PubMed]
  44. Wei, B.L.; Li, Y.W. Grey relational analysis in the metric space of continuous functions, Foundations, extensions, and applications. Appl. Math. Model. 2025, 142, 115978. [Google Scholar] [CrossRef]
  45. Lv, H.L.; Chen, X.Y.; Wang, X.Y.; Zeng, X.W.; Ma, Y.B. A novel study on a micromixer with Cantor fractal obstacle through grey relational analysis. Int. J. Heat Mass Transf. 2022, 183, 122159. [Google Scholar] [CrossRef]
  46. Rajush, R.; Ravi, V. Supplier selection in resilient supply chains: A grey relational analysis approach. J. Clean. Prod. 2015, 86, 343–359. [Google Scholar] [CrossRef]
  47. Chen, C.H. A Novel Multi-Criteria Decision-Making Model for Building Material Supplier Selection Based on Entropy-AHP Weighted TOPSIS. Entropy 2020, 22, 259. [Google Scholar] [CrossRef]
  48. Wang, N.; Zhang, Y.X. Research on evaluation of Wuhan air pollution emission level based on entropy weight method. Sci. Rep. 2024, 14, 5012. [Google Scholar] [CrossRef]
  49. Ferrag, M.A.; Shu, L.; Yang, X.; Derhab, A.; Maglaras, L. Security and privacy for green IoT-based agriculture: Review, blockchain solutions, and challenges. IEEE Access 2020, 8, 32031–32053. [Google Scholar] [CrossRef]
  50. Gupta, B.B.; Quamara, M. An overview of Internet of Things (IoT): Architectural aspects, challenges, and protocols. Concurr. Comput. Pract. Exp. 2020, 32, e4946. [Google Scholar] [CrossRef]
Figure 1. Intelligent curing system framework for face slab concrete.
Buildings 15 02344 g001
Figure 2. Intelligent curing system construction process for face slab concrete.
Buildings 15 02344 g002
Figure 3. Multi-source data integrated management system construction for face slab concrete.
Buildings 15 02344 g003
Figure 4. Dam modeling architecture.
Buildings 15 02344 g004
Figure 5. Framework of the five-dimensional digital twin model for face slab concrete.
Buildings 15 02344 g005
Figure 6. Curing strategy generation mechanism.
Buildings 15 02344 g006
Figure 7. Geographic and project overview map of Maerdang hydropower station.
Buildings 15 02344 g007
Figure 8. Material excavation, dam filling, and face slab-pouring information.
Buildings 15 02344 g008
Figure 9. System architecture diagram.
Buildings 15 02344 g009
Figure 10. On-site implementation plan of multi-source data monitoring.
Buildings 15 02344 g010
Figure 11. Multi-source data integration management diagram.
Buildings 15 02344 g011
Figure 12. Dynamic display of dam filling progress and fiber-optic temperature measurement data.
Buildings 15 02344 g012
Figure 13. Intelligent curing system platform and function display for the Maerdang hydropower station.
Buildings 15 02344 g013
Disclaimer/Publisher’s Note: The statements, opinions and data contained in all publications are solely those of the individual author(s) and contributor(s) and not of MDPI and/or the editor(s). MDPI and/or the editor(s) disclaim responsibility for any injury to people or property resulting from any ideas, methods, instructions or products referred to in the content.

