Abstract
Ground Penetrating Radar (GPR) is a high-resolution nondestructive technique for detecting subsurface defects, yet its image interpretation suffers from strong subjectivity, low efficiency, and high false-alarm rates. To establish a customized underground GPR defect detection algorithm, this paper introduces SESM-YOLO which is an enhancement of YOLOv8n tailored for GPR images: (1) A Slim_Efficient_Block module replaces the bottleneck in the backbone, enhancing feature extraction while maintaining lightweight properties through a conditional gating mechanism. (2) A feature fusion network named Efficient_MS_FPN is designed, which significantly enhances the feature representation capability and performance. Additionally, the SCSA attention mechanism is introduced before the detection head, enabling precise extraction of defect object features. (3) As a novel loss function, MPDIoU is proposed to reduce the disparity between the corners of the predicted bounding boxes and those of the ground truth boxes. Experimental results on a custom dataset show that SESM-YOLO achieves an average precision of 92.8% in detecting hidden road defects, which is 6.2% higher than the YOLOv8n baseline. The model also shows improvements in precision (92.4%) and recall (86.7%), with reductions in parameters and computational load, demonstrating significant advantages over current mainstream detection models.
1. Introduction
Urban road surface collapse incidents severely compromise the safety of pedestrians and vehicles. Hidden defects such as cracks and voids constitute the primary causes of pavement collapse [1]. Ground Penetrating Radar (GPR), as an efficient nondestructive testing technology, has been increasingly adopted for thickness measurement, geological surveys, and defect detection tasks. The one-dimensional amplitude of received signals (A-scan) can be converted into grayscale values through defined mapping rules, generating GPR images representing both longitudinal and depth directions of the road (B-scan) [2,3]. Recently, it has been widely adopted for road defects detection, achieving significant success [4]. However, the rapid generation of large volumes of images by GPR for detection lacks timely and effective processing, severely constraining the development and application of this technology. Several factors contribute to discrepancies between GPR detection data and actual conditions [5]. These include the distance between the antenna and the surface of the road, road surface lifespan, electromagnetic wave attenuation patterns, data acquisition speed, and issues such as water accumulation and interference. Addressing these factors is of importance for improving the accuracy and reliability of GPR in road defects detection [6].
In recent years, deep learning methodologies have attained remarkable success across a wide range of domains [7]. By extracting hidden high-dimensional features from training data, these methods can eliminate the complex image processing steps involving manual feature design inherent in traditional approaches. For example, convolutional neural networks [8] are capable of directly learning features of buried landmine signals from GPR B-scan images, without imposing any predetermined features [9,10]. The mainstream object detection algorithms are primarily divided into two categories: single-stage and two-stage detection frameworks [11].
The R-CNN series [12,13,14] represents a classic two-stage detection framework. It initially generates regional proposals, followed by classification to refine these proposals. After that, it ultimately employs non-maximum suppression to eliminate redundant boxes and refine the predicted bounding boxes. While two-stage detectors excel in detection accuracy, they face challenges in training efficiency, inference speed, and complex optimization. In contrast, single-stage detection frameworks like YOLO [15] and SSD [16] directly predict object categories and spatial locations from the input image, bypassing the need for a separate region proposal generation step. Then, they transform the problem of locating object boundaries into a regression task. These detection models have been extensively applied in infrastructure monitoring, notably in the field of road defects. Wang et al. [17] applied YOLOv3 to road surface pothole detection. Experimental results demonstrate that the model performs robustly with consistent effectiveness on samples subjected to random occlusion and noise interference. Du et al. [18] employed the Hilbert transform to convert GPR signals from the time domain to the time–frequency domain. Through feature fusion, they generated integrated images for detection using YOLOv7. Experimental results demonstrated significantly improved recognition of signal features at defect locations. Liu et al. [19] employed Auto Augment techniques to enhance dataset generalization capability and utilized the YOLOv8 model for GPR image detection. Their approach achieved a road crack mAP50 of 90.7%. These frameworks are characterized by their efficiency and real-time image processing capabilities, making them widely adopted in fields like transportation infrastructure monitoring. Nevertheless, the training processes of mainstream object detection algorithms require public datasets such as ImageNet [20], COCO, VOC, and others. However, GPR datasets are difficult to establish due to complex geological structures, noise interference, and damage form. Even if such a dataset is established, the features of GPR B-scan images differ significantly from those of common image datasets. Therefore, the speed and accuracy of existing object detection algorithms are still problems when applied to GPR defect B-scan images.
2. Objectives
The primary objective of this study is to construct a high-quality GPR subsurface defect dataset (including cracks and cavities) and propose a high-precision and efficient object detection algorithm specifically tailored for GPR defect images. The methodology is outlined as follows:
- We replace the bottleneck in the backbone’s C2f module with the Slim_Efficient_Block, maintaining the lightweight design while enhancing the network’s feature extraction capabilities.
- We replace the PAFPN feature fusion network in the neck with the Efficient_MS_FPN feature fusion network, which effectively combines multi-scale and edge information, thereby improving the feature representation and model performance.
- We introduce the SCSA attention mechanism before the P3 detection head to enhance feature extraction and model robustness.
- We replace the loss function with MPDIoU, improving the localization accuracy of the target boxes.
3. Preparation of GPR Dataset
The radar system employs an encoder to trigger antenna emission of electromagnetic waves, ensuring consistent spatial sampling intervals regardless of vehicle speed. The system is equipped with GPS for defect localization.
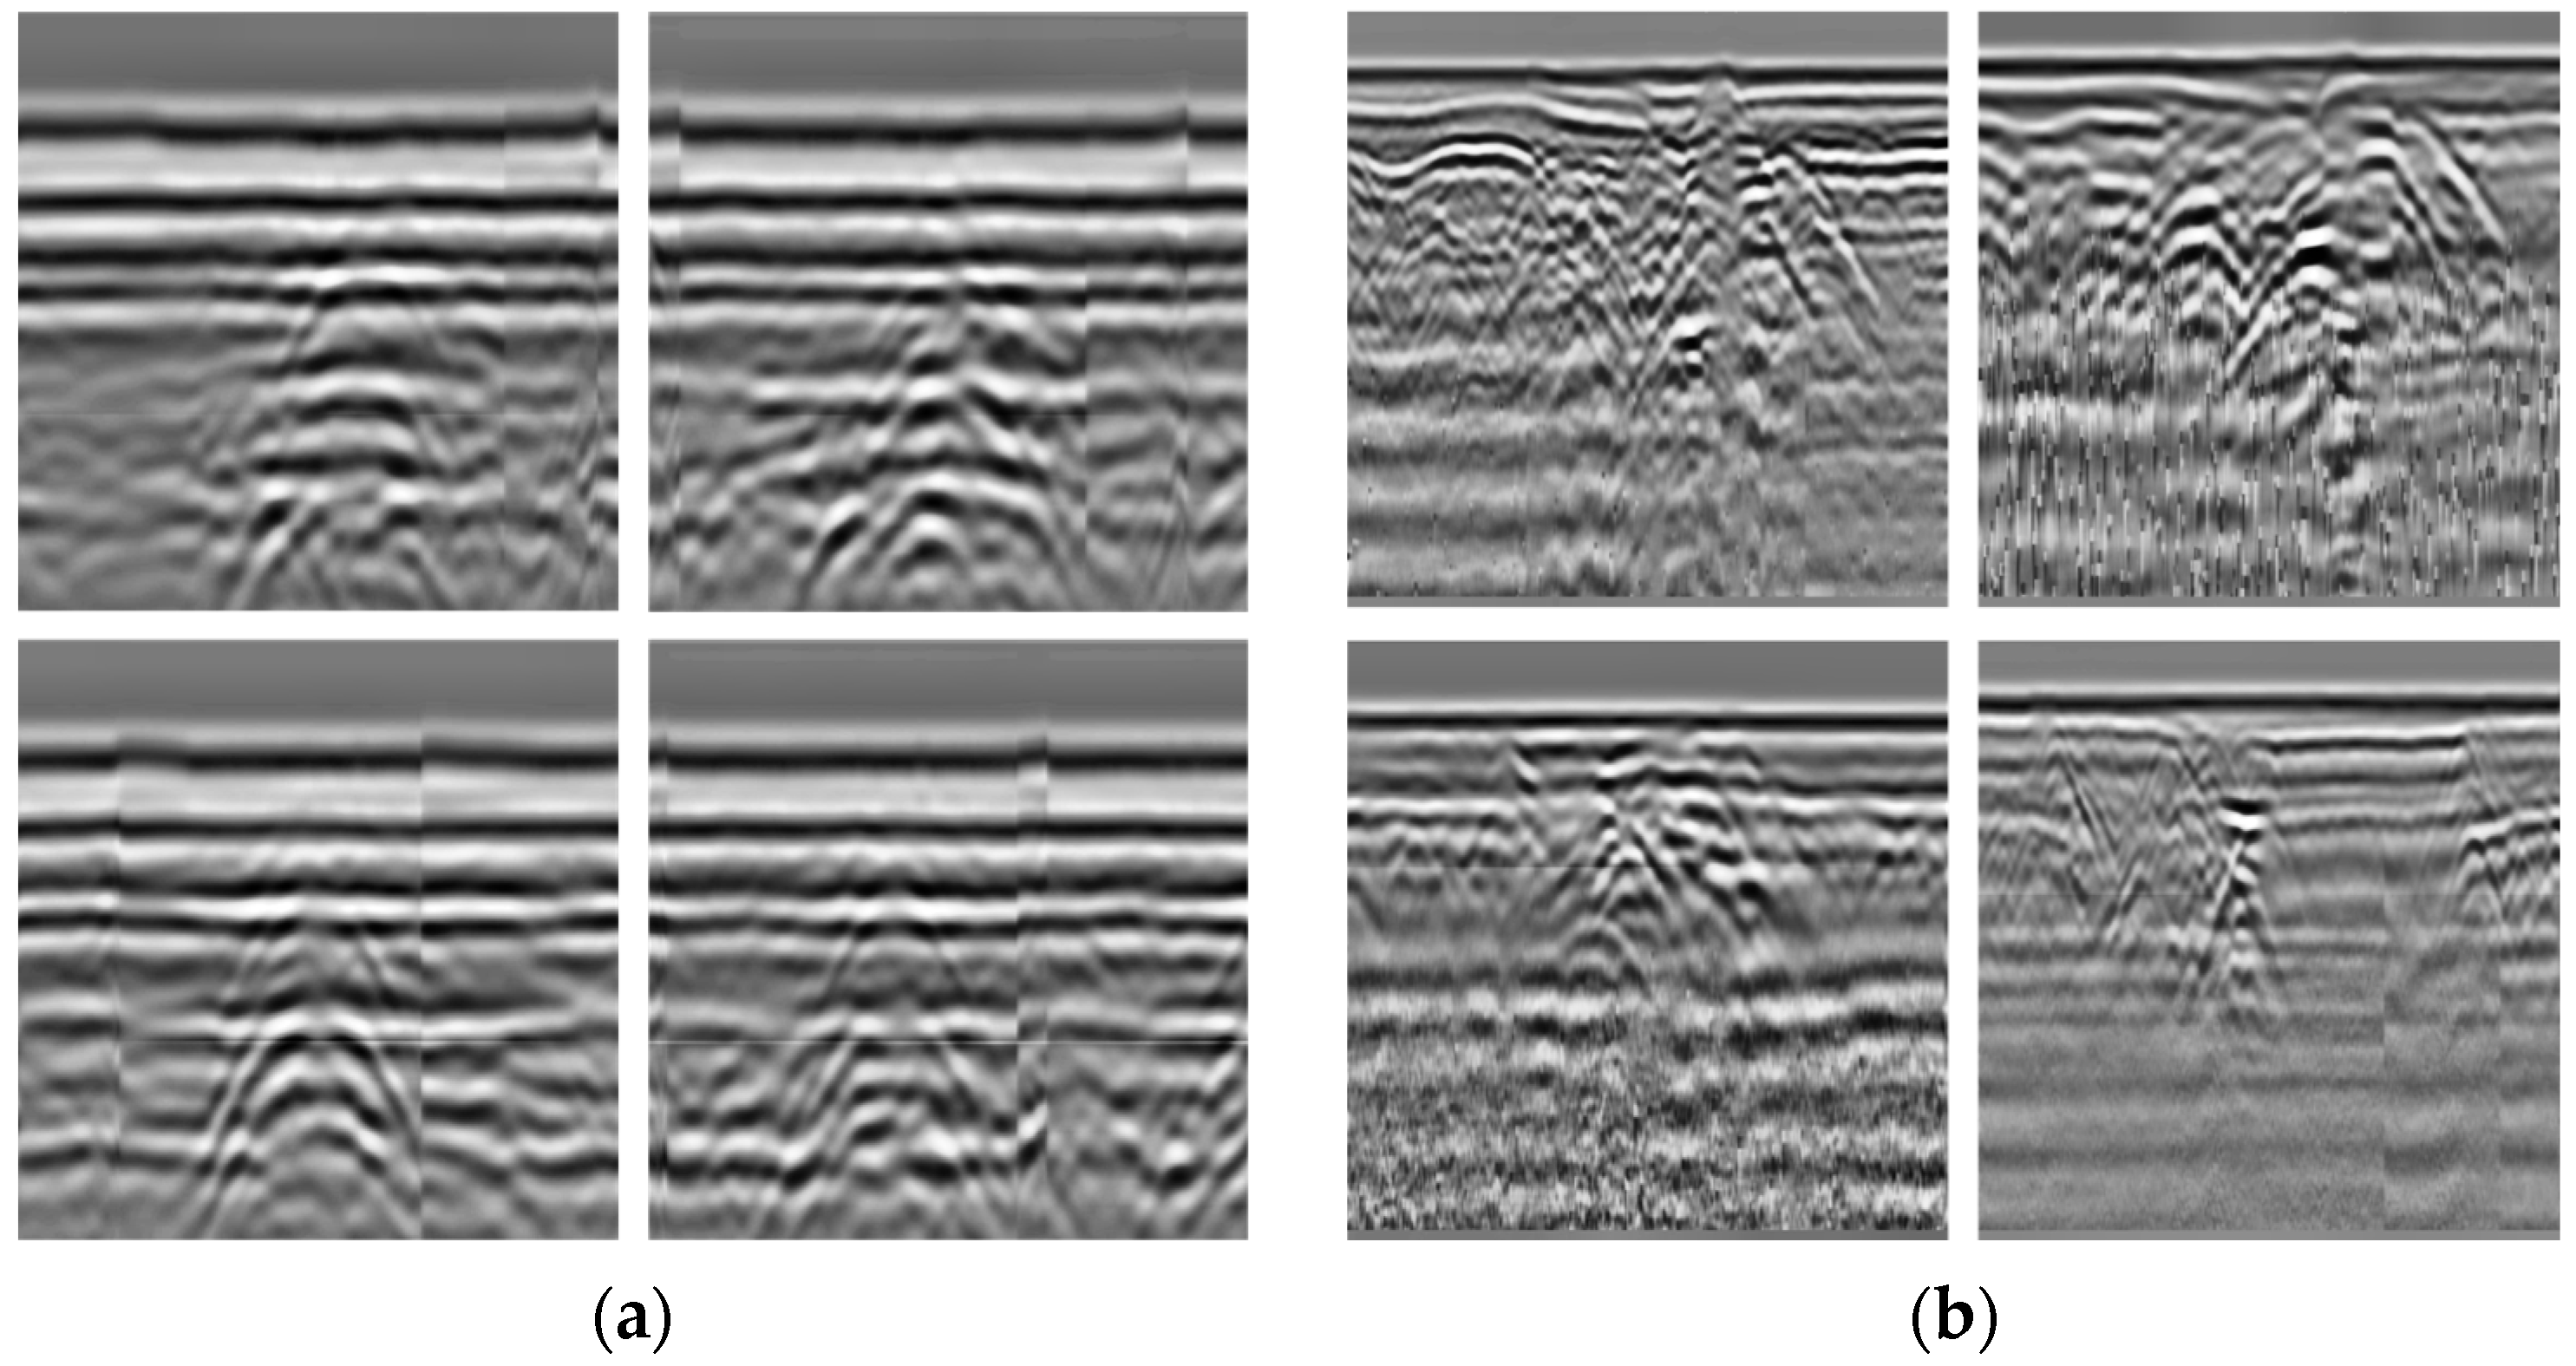
This investigation focused on common hidden road defects including cavity defects and crack defects, with Figure 1 displaying representative radar profile images of these two types of anomalies.
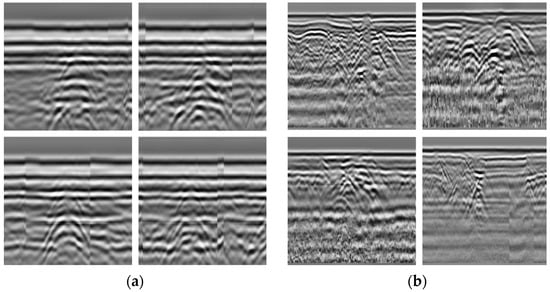
Figure 1.
GPR B-scan images: (a) crack; (b) cavity.
Data preprocessing is required to eliminate random and coherent noise, enhance the visibility of reflected wave signals in GPR image profiles at the highest possible resolution, and extract critical parameters to facilitate the interpretation of detection results. Typical preprocessing steps for GPR data include zero-time correction, direct wave removal, linear gain, background removal, and digital filtering [21].
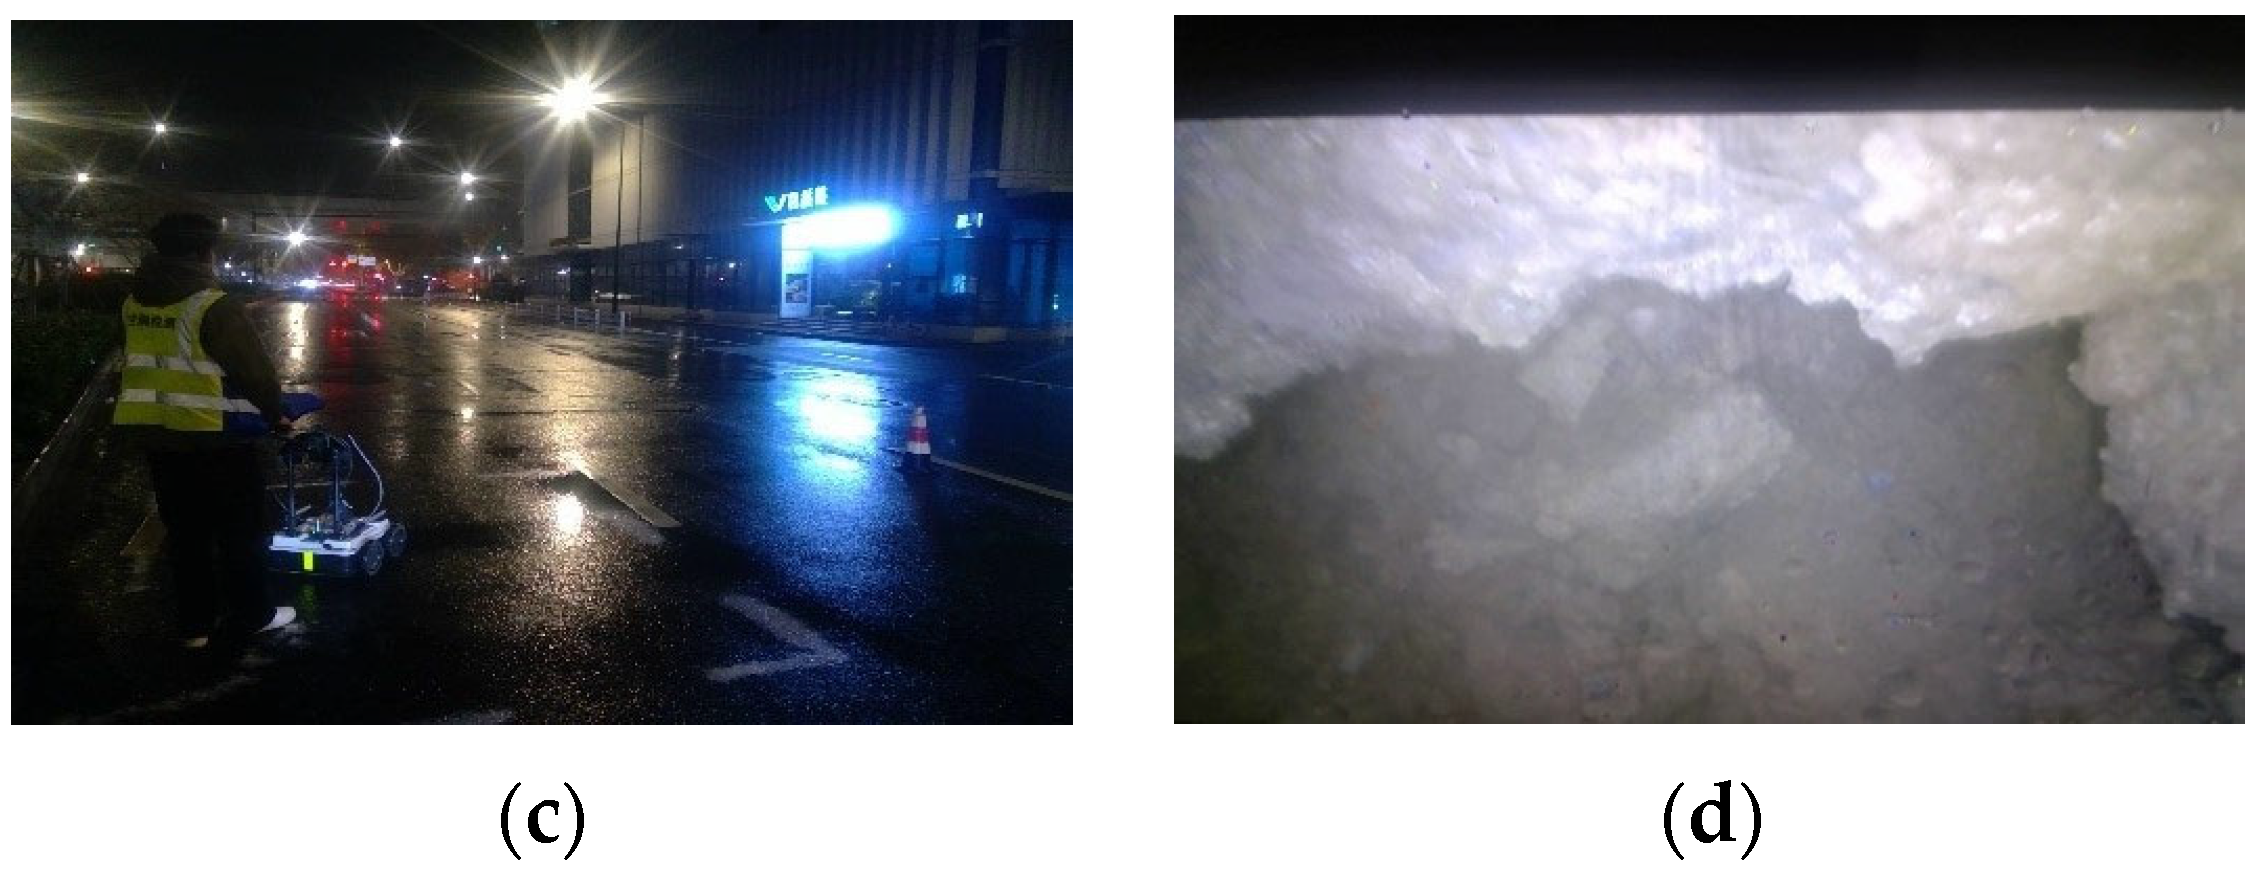
The collected data requires field validation to demonstrate the validity and rationality of the dataset. In this study, endoscopic inspection is employed to verify potential hazard sites in situ, enabling the creation of defect information profiles. Figure 2 illustrates one such defect information profile for a representative subsurface defect case.
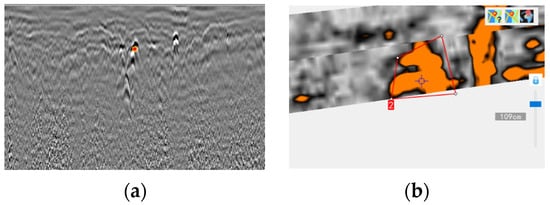
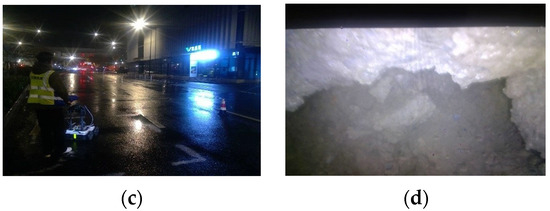
Figure 2.
Defect information: (a) radar imaging map; (b) horizontal cross-section; (c) field photo of detection point; (d) endoscopic image.
The dataset employed in this research is a custom collection totaling 540 images, including 270 images of underground cracks and 270 images of cavities.
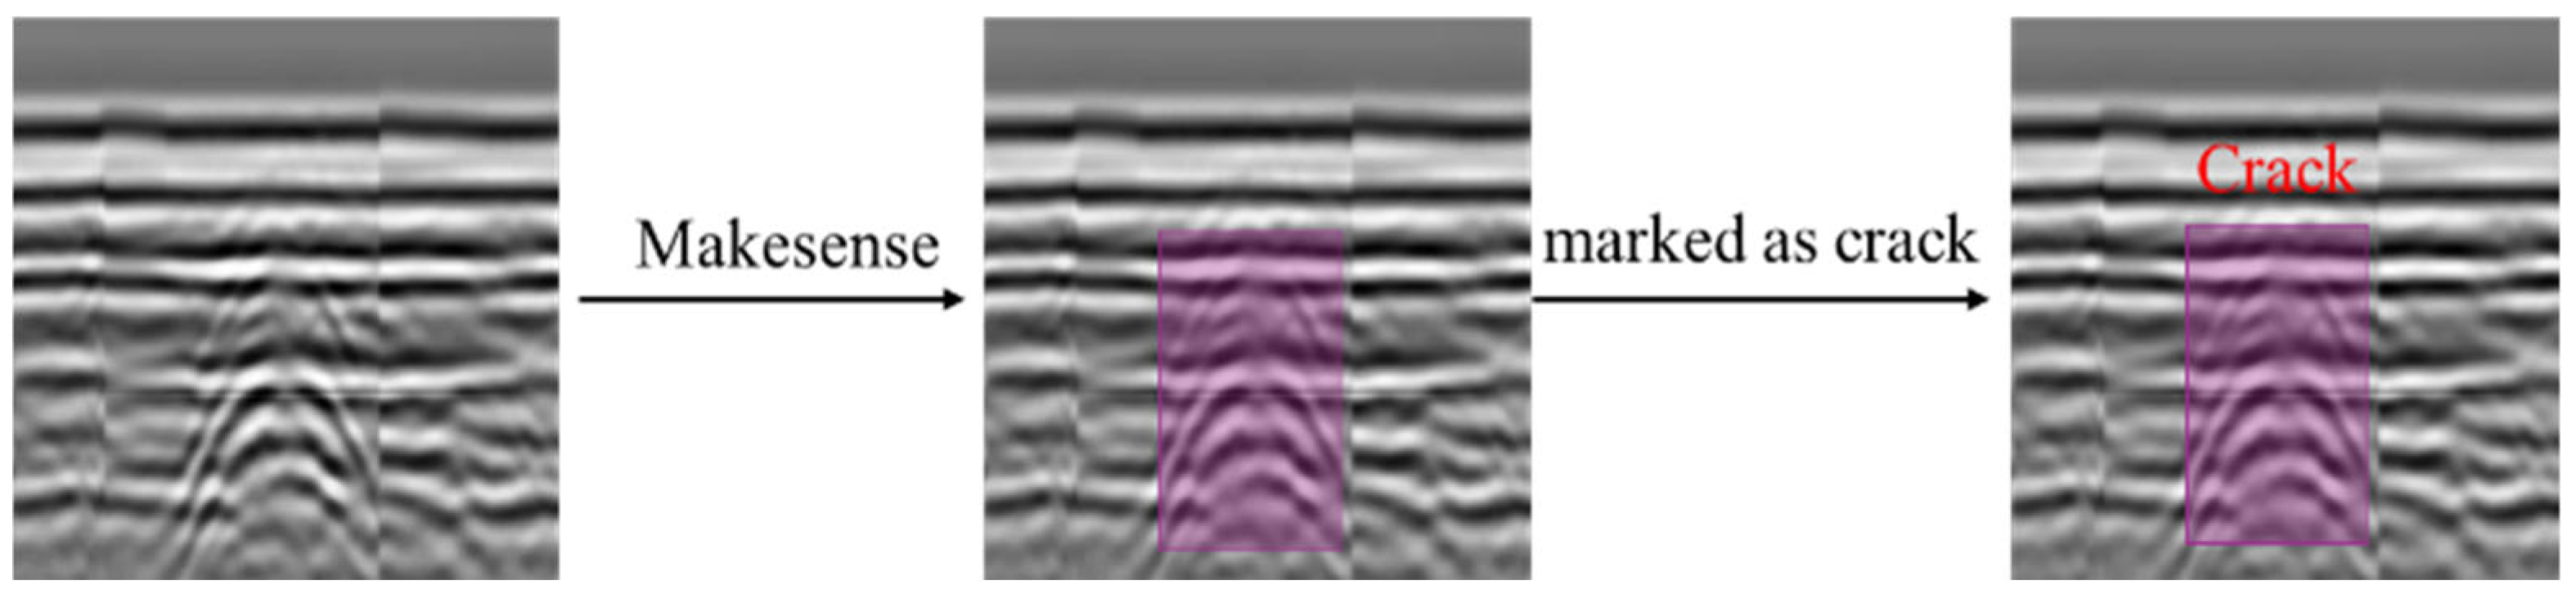
The process of labeling defects is necessary but labor-intensive. It is also worth mentioning that the labeling was monitored by professors in the field of road engineering. Moreover, the process was tested by cross-checking, which can greatly improve accuracy. The specific effect is as shown in Figure 3.

Figure 3.
The specific process of annotation.
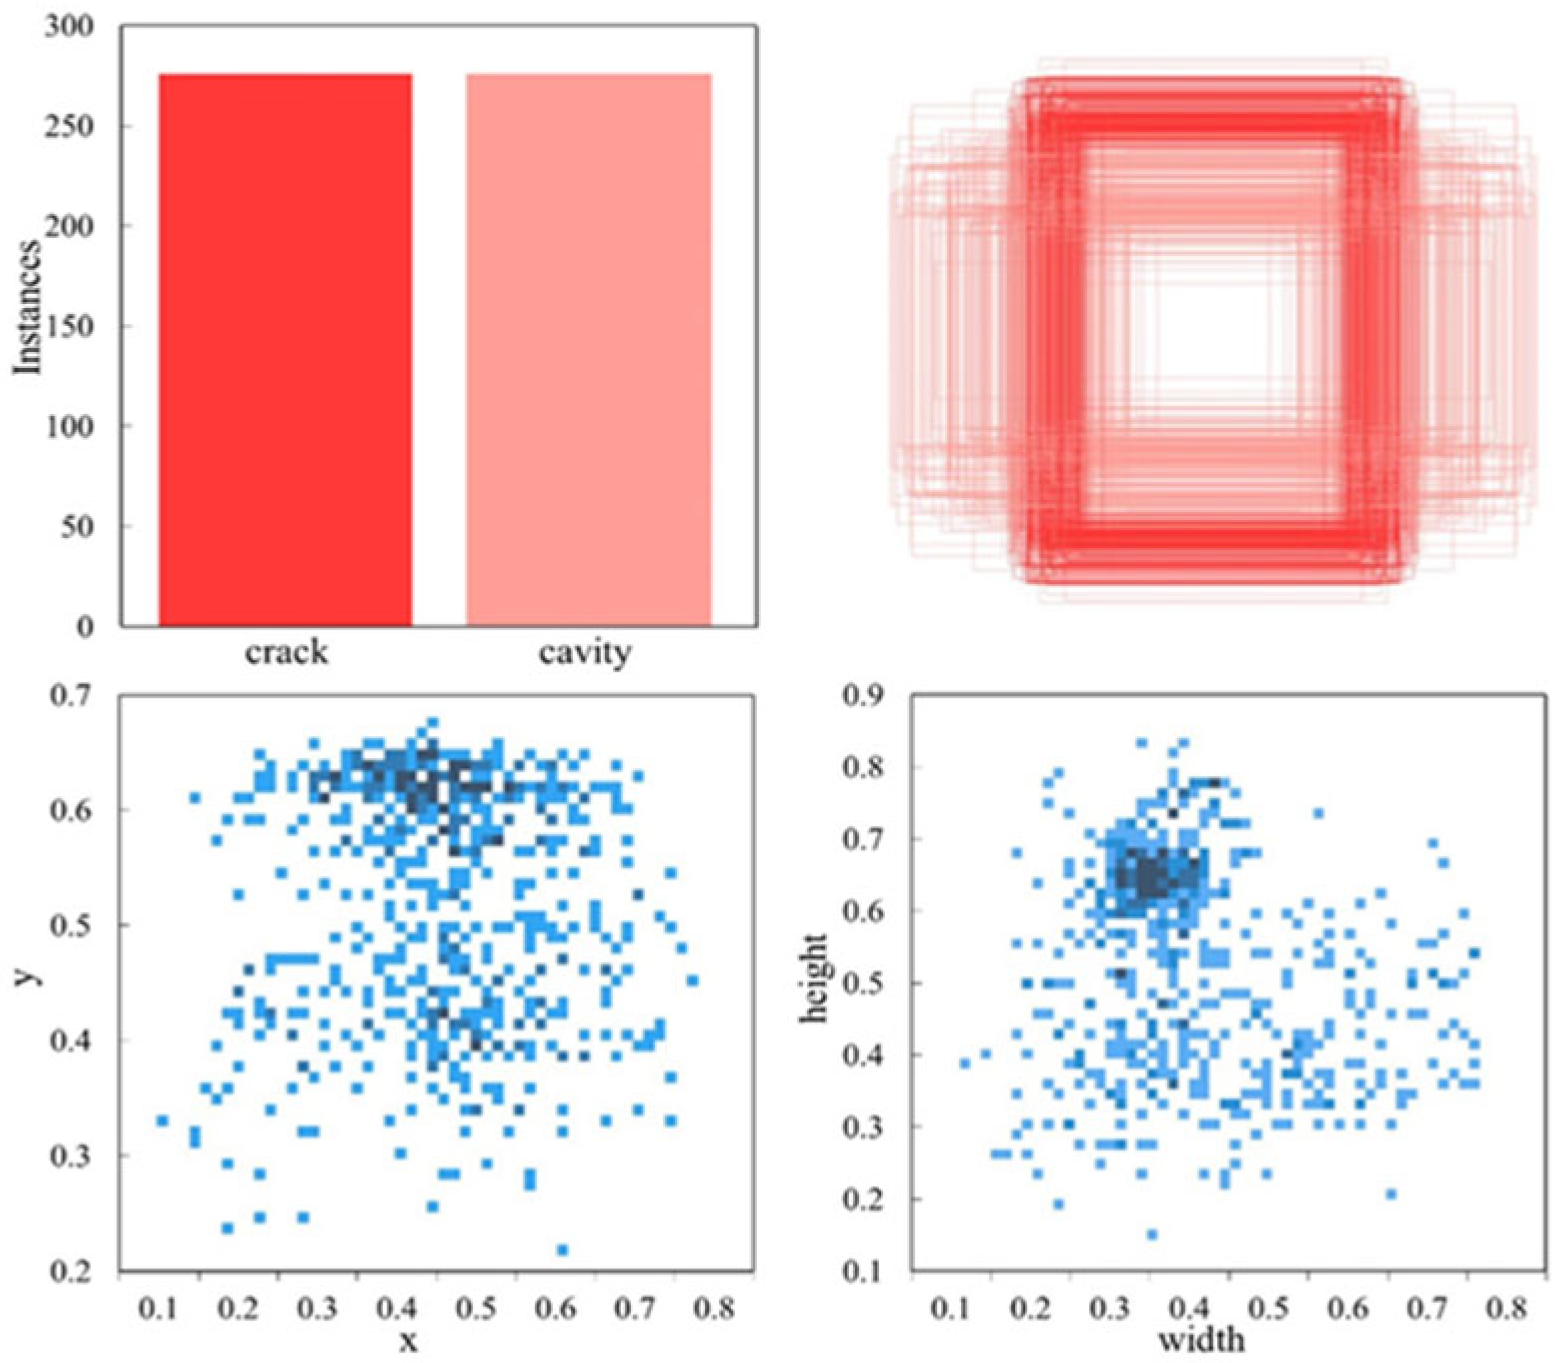
To ensure adequate training data for the model while facilitating effective evaluation, the images were randomly assigned, with 70% divided into the training set, while the verification set and the test set each accounted for 15%. As shown in Figure 4, relevant details about the annotated objects in the dataset are provided. The top-left subplot highlights the categories and quantities of the images. The top-right subplot displays the sizes of the object bounding boxes, with all boxes anchored at a single point. The bottom-left subplot represents the distribution of the bounding box center coordinates, indicating that the object centers are predominantly clustered around the middle and slightly above the center of the image data area. The bottom-right subplot presents a scatter plot of the corresponding widths and heights of the bounding boxes, with the darkest regions located in the top-left corner of the plot.
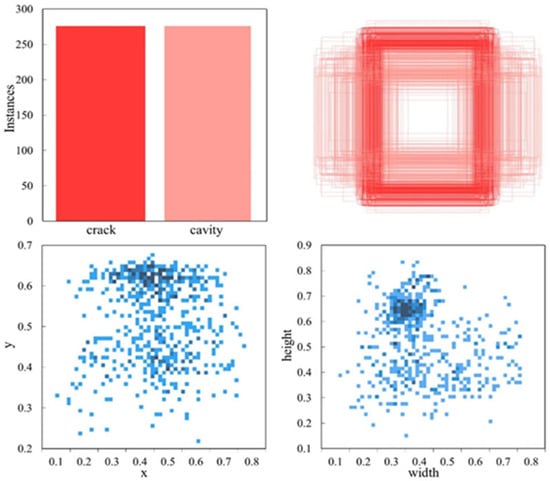
Figure 4.
Information about the labeling.
4. Methodology
4.1. SESM-YOLO Network Architecture
YOLOv8 [22] is an improved single-stage detection algorithm based on YOLOv5 [23], integrating state-of-the-art computer vision techniques and introducing new network structure and feature-enhancing strategies, resulting in outstanding detection performance. Although YOLOv8 demonstrates exceptional performance in object detection tasks, it is predominantly applied to public datasets. For datasets like GPR defect data, which exhibit distinct texture and waveform features, there remains room for improvement in the YOLOv8 algorithm’s speed and accuracy. Therefore, this study will enhance YOLOv8 across four key aspects—the backbone network, neck network, attention mechanism, and loss function—to meet the requirements of lightweight detection. The specific improvement measures are as follows:
- (1)
- To reduce model parameters and computational load, this study designed a Slim Efficient Block, as detailed in Section 4.2.
- (2)
- To extract deeper feature information from images, this study retains the PAN [24] and FPN [25] architectures of YOLOv8n while introducing the novel MEICSP module, as detailed in Section 4.3.
- (3)
- To enhance the model’s focus on defect-related features, we introduce the SCSA attention module, as detailed in Section 4.4.
- (4)
- To address the limitations of the CIoU loss function, we finally introduce the MPDIoU loss function, with comprehensive implementation and analysis presented in Section 4.5.
The structure of SESM-YOLO is shown in Figure 5.
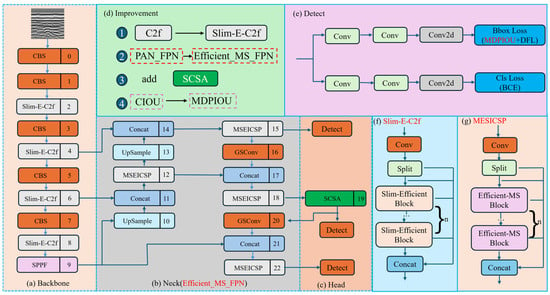
Figure 5.
The structure of SESM-YOLO.
4.2. Improvement of the Backbone Module
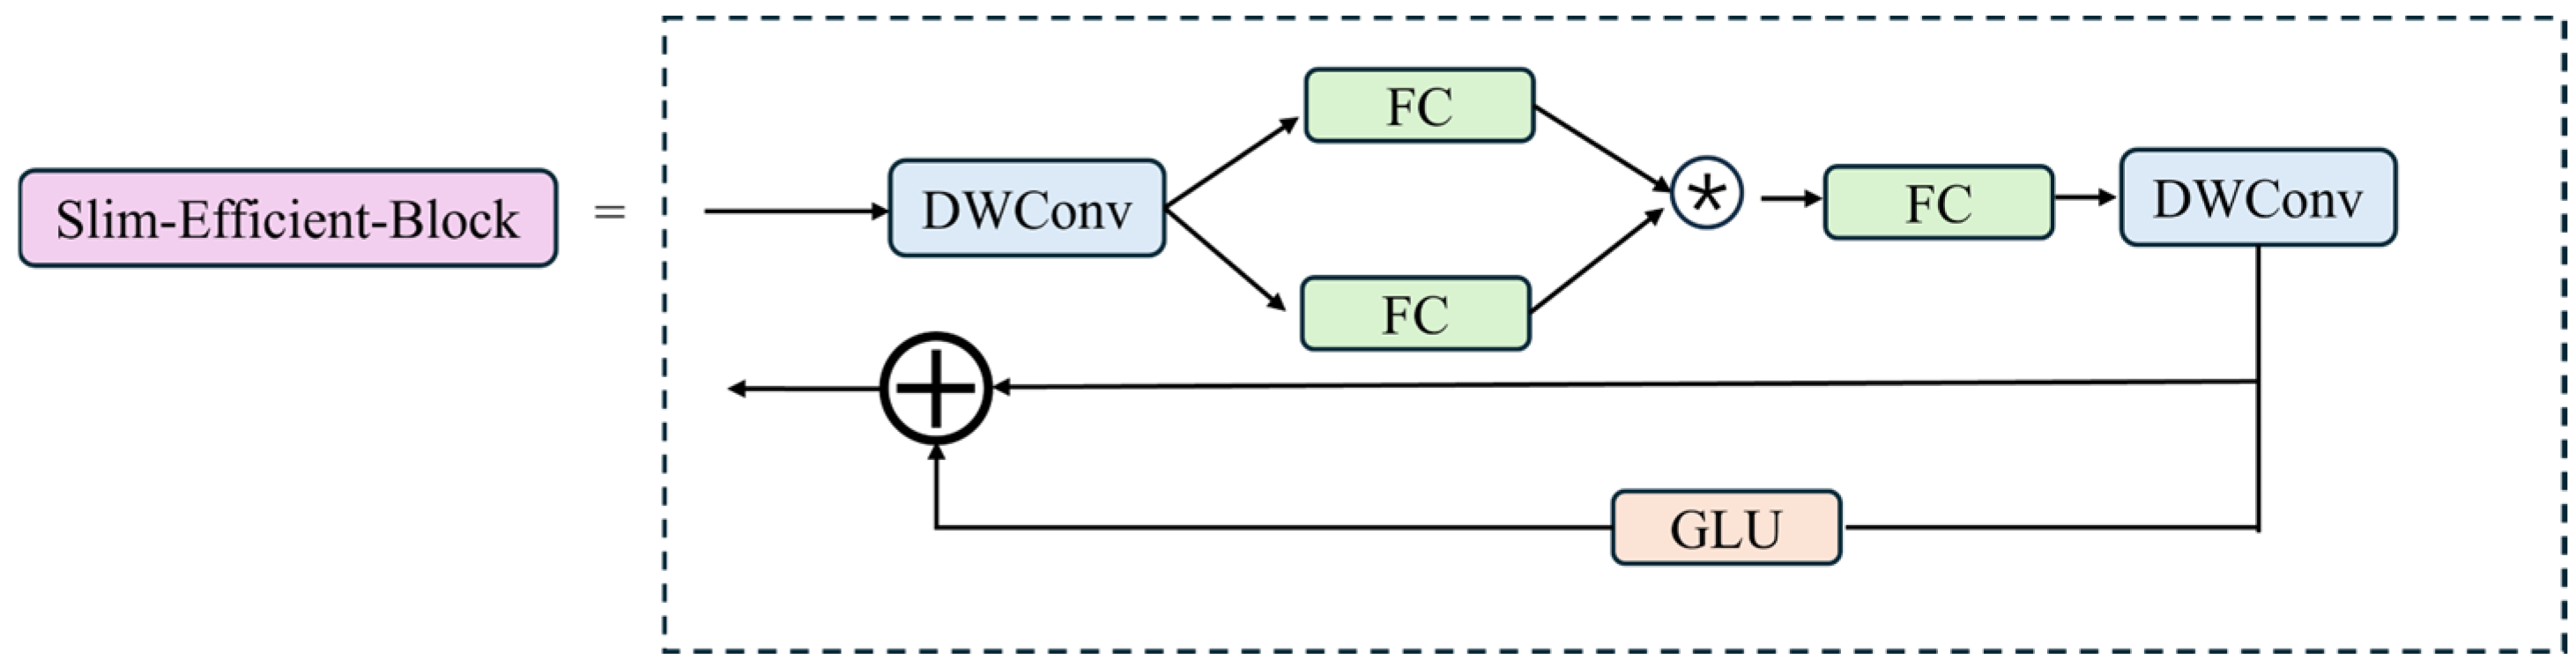
For GPR hidden defects detection, there is a requirement for high precision and efficiency for engineering. Traditional convolutional networks often generate numerous similar feature maps when attempting to capture comprehensive information, leading to issues such as large model parameter sizes and long computation times, contradicting our need for high efficiency. Therefore, it is possible to skip unnecessary convolution operations to obtain the desired feature maps. To address this issue, this study designs a new module called Slim_Efficient_Block. This module consists of two parts: the first part introduces Star Blocks [26], a simple yet powerful network building block based on “star operations” (element-wise multiplication). The second part is composed of Gated Linear Units (GLUs) [27], a structure primarily consisting of two linear projections that perform element-wise multiplication. One of the projections is activated by a gating function, and a 3 × 3 depthwise convolution is added before the activation function in the gating branch. This structure leverages neighboring features to form a gating-based channel attention mechanism. The structure of Slim_Efficient_Block is shown in Figure 6.

Figure 6.
The structure of Slim_Efficient_Block.
Star Blocks employ Star Operation (element-wise product) to merge features from dual linear transformations. This operation mimics a polynomial kernel, enabling projection into a high-dimensional nonlinear space without expanding network width. Unlike traditional width-based approaches, stacked layers with Star Operations exponentially increase implicit feature complexity, achieving near-infinite dimensionality within compact channels. Crucially, it introduces no extra parameters—only input feature interactions—thereby slashing computational and memory costs during training.
To achieve a balance between lightweight design and high accuracy, we replaced the bottleneck in the C2f module of the YOLOv8n backbone with our proposed Slim_Efficient_Block, as shown in Figure 5f. This structure maintains lightweight characteristics while enhancing the network’s feature extraction capabilities. By incorporating a conditional gating mechanism, it provides dynamic adjustment of information flow, enabling the network to self-regulate based on different input features. This improves the model’s ability to handle complex or varying inputs.
4.3. Improvement of the Neck Module
GPR images of defect conditions are characterized by complex backgrounds, often containing clutter and noise. These interferences make it challenging to accurately extract defect-related features. Therefore, to extract deeper features from defect images, this paper proposes the Efficient_MS_FPN feature fusion network, whose architecture is illustrated in Figure 5b. Compared to the neck structure in YOLOv8n, this paper replaces the C2f module with the MSEICSP module, which fully leverages multi-scale and edge information while maintaining computational efficiency. Additionally, the Conv module is replaced with the GSConv module [28], achieving a balance between model accuracy and speed.
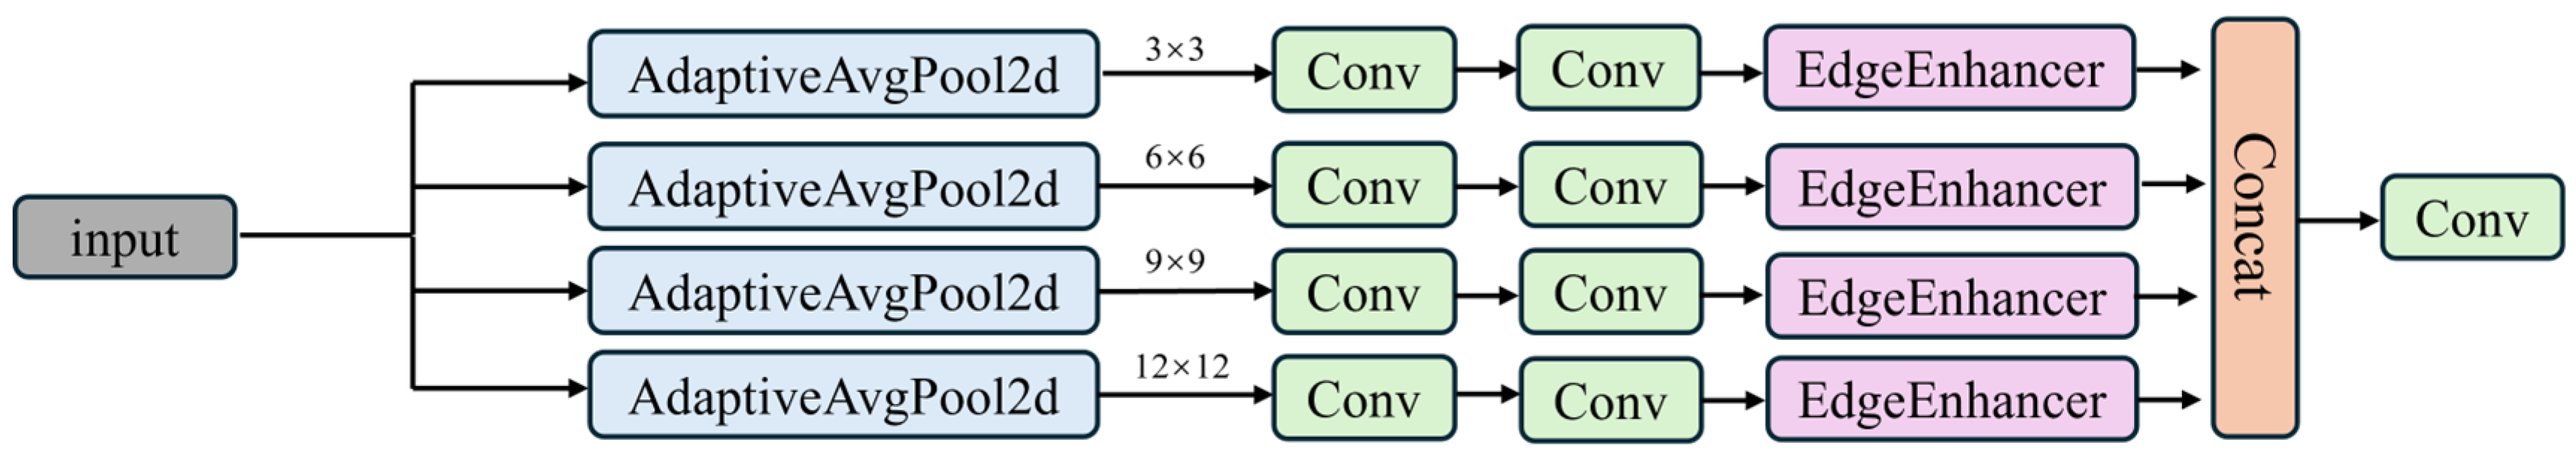
To fully leverage the multi-scale information of input feature maps, this paper designs the Efficient_MS_Block module, whose schematic diagram is shown in Figure 7. Initially, we utilize AdaptiveAvgPool2d to conduct average pooling on the input feature maps at scales of 3 × 3, 6 × 6, 9 × 9, and 12 × 12, respectively, to capture local information across multiple levels. This method effectively extracts features at varying resolutions, thereby improving the model’s capability to interpret complex image structures. Following the pooling operation, each feature map is processed through two convolutional layers, and the Edge Enhancer module is integrated to emphasize the extraction and enhancement of edge information. By reinforcing edge features, the model attains greater precision in managing details and boundaries, which is especially critical for tasks demanding accurate localization and segmentation. These features are then concatenated and further refined through a convolutional layer, resulting in a comprehensive and enriched feature representation that enhances the overall feature expression and the model’s perceptual performance.
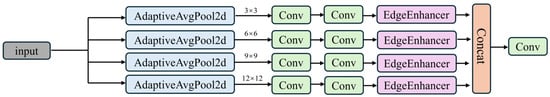
Figure 7.
The structure of Efficient_MS_Block module.
As depicted in Figure 5g, the MSEICSP module incorporates multiple Efficient_MS_Block modules. By employing multi-scale feature extraction, enhancing edge information, and enabling efficient feature fusion, it substantially boosts the network’s feature representation capacity and effectiveness. Without compromising computational efficiency, MSEICSP effectively utilizes multi-scale and edge information to improve the model’s performance in diverse image processing tasks.
4.4. Spatial and Channel-Wise Selective Attention
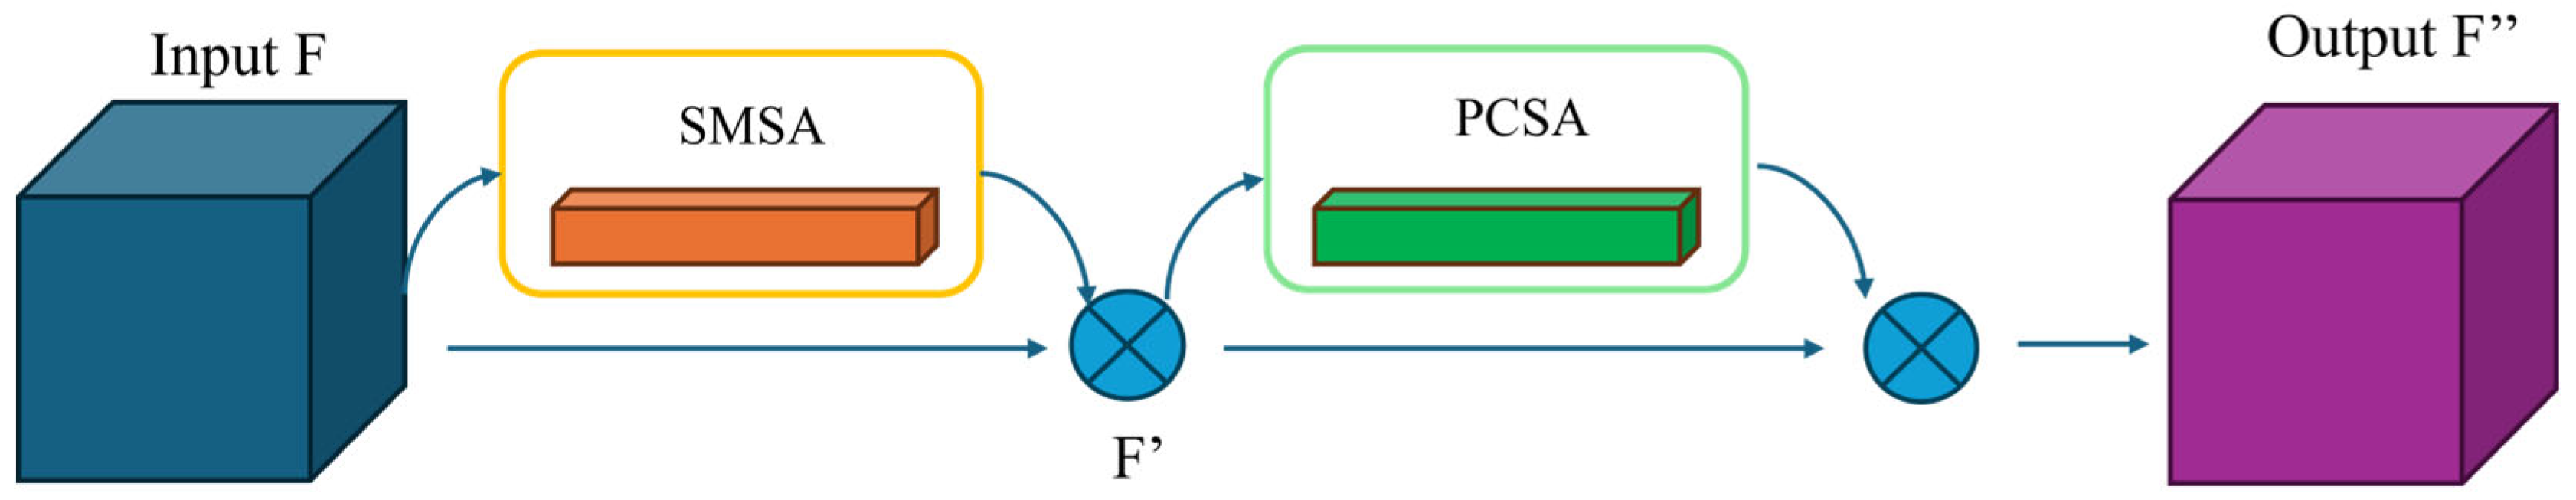
Due to the complex and variable underground environment, many hidden defect images may exhibit mutual occlusion, leading to reduced recognition accuracy. To improve the detection accuracy of the model under such conditions, a Spatial and Channel-wise Cooperative Attention (SCSA) mechanism [29] is added before the detection head. By combining shareable multi-semantic spatial attention (SMSA) and progressive channel self-attention (PCSA), SMSA achieves synergistic enhancement of spatial and channel features. Specifically, SMSA effectively extracts spatial information of targets in complex scenes by capturing both local and global features, significantly improving the model’s ability to focus on target areas, especially under conditions such as overlapping defects. PCSA, on the other hand, dynamically adjusts channel weights to strengthen the feature representation of key targets while reducing interference from redundant information, thereby improving the robustness of the model. The structure of the SCSA mechanism is shown in Figure 8.
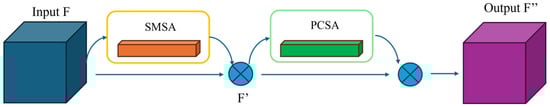
Figure 8.
The structure of SCSA.
This paper introduces the SCSA mechanism before the P3 detection head, aiming to achieve precise extraction of defect objects’ features while ensuring less computational overhead.
4.5. Improvement of the Loss Function
The magnitude of the loss reflects the size of the discrepancy between predicted and ground truth values, with smaller losses indicating better regression capability of the network. The original model utilizes the CIOU loss function, defined by the following equation:
CIoU not only considers the overlapping region of bounding boxes (IoU) but also incorporates the distance between center points and the similarity of aspect ratios, thereby providing a more comprehensive measure of the discrepancy between predicted and ground truth boxes. However, when the centers of the predicted and ground truth boxes overlap and their aspect ratios are identical, the CIoULoss calculation related to the center points and aspect ratios yields zero. In such cases, CIoULoss reduces to the original IoU, where different widths and heights of predicted boxes may produce identical L_CIoU values, significantly compromising the precision of the predicted boxes, as illustrated in Figure 9. To mitigate this issue, the MPDIoULoss [30] is adopted as the bounding box loss function for the model.
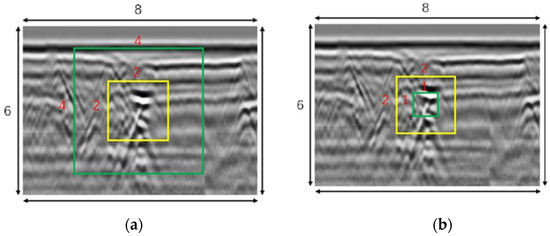
Figure 9.
The predicted results of the loss function under two different scenarios: (a) = 0.75 = 0.79; (b) = 0.75 = 0.76.
MPDIoU incorporates minimum point distance, redefining the loss function with a metric that reduces the overall degrees of freedom. The calculation formula for MPDIoU loss is given by Equation (4), where h and w represent the height and width of the input image in the network. In Equations (5) and (6), (, ) and (, ) represent the coordinates of the prediction box, which are the top left and bottom right, respectively, while (, ) and (, ) represent the ground truth box.
The MPDIoU loss function improves the problem of CIoU loss function, making it more suitable for GPR hidden defects detection. According to the formula of the MPDIoU loss function, it encourages the predicted box to approach the ground truth box when their center points do not overlap, among other conditions. Moreover, in cases where the predicted box and ground truth box have overlapping center points and consistent aspect ratios but differ in predicted dimensions, the penalty term in MPDIoU remains non-zero, preventing degradation to IoU loss. Therefore, compared to the CIoU loss function, employing MPDIoU not only simplifies computation but also stabilizes model convergence, enhancing accuracy in detecting minor defects in complex environments.
5. Experiment Results and Discussion
5.1. Experiment Introduction
5.1.1. Experimental Environment
The hardware and software facilities required for the experiments in this paper are listed in Table 1. The hyperparameters were configured as shown in Table 2. To ensure the validity and accuracy of the experimental results, the hyperparameters remained consistent for each experiment.

Table 1.
Experimental software and hardware-related parameters.
Table 2.
Some key parameters set during model training.
5.1.2. Evaluation Indicators
In the object detection task, typical metrics for evaluating performance include Precision, Recall, Average Precision (AP), and mean Average Precision (mAP).
“Positive” and “Negative” refer to the predicted sample labels, with “Positive” indicating the target defect to be identified and “Negative” representing the background as classified by YOLO. “True” and “False” describe the accuracy of predictions, where “True” signifies accurate predictions and “False” denotes errors. Based on this, TP (True Positive) corresponds to correctly classified positive samples, FP (False Positive) represents negative samples incorrectly identified as positive, FN (False Negative) indicates positive samples mistakenly classified as negative (resulting in missed detections), and TN (True Negative) refers to negative samples correctly predicted as negative.
where represents class (cavity or crack); represents the total number of the specific samples in the validation set; and represents the index of one specific sample.
In addition, for consideration of detection efficiency, this paper also includes model parameter count and computational GFLOPs as evaluation metrics.
5.2. Experiment Results
5.2.1. Training Process Comparison
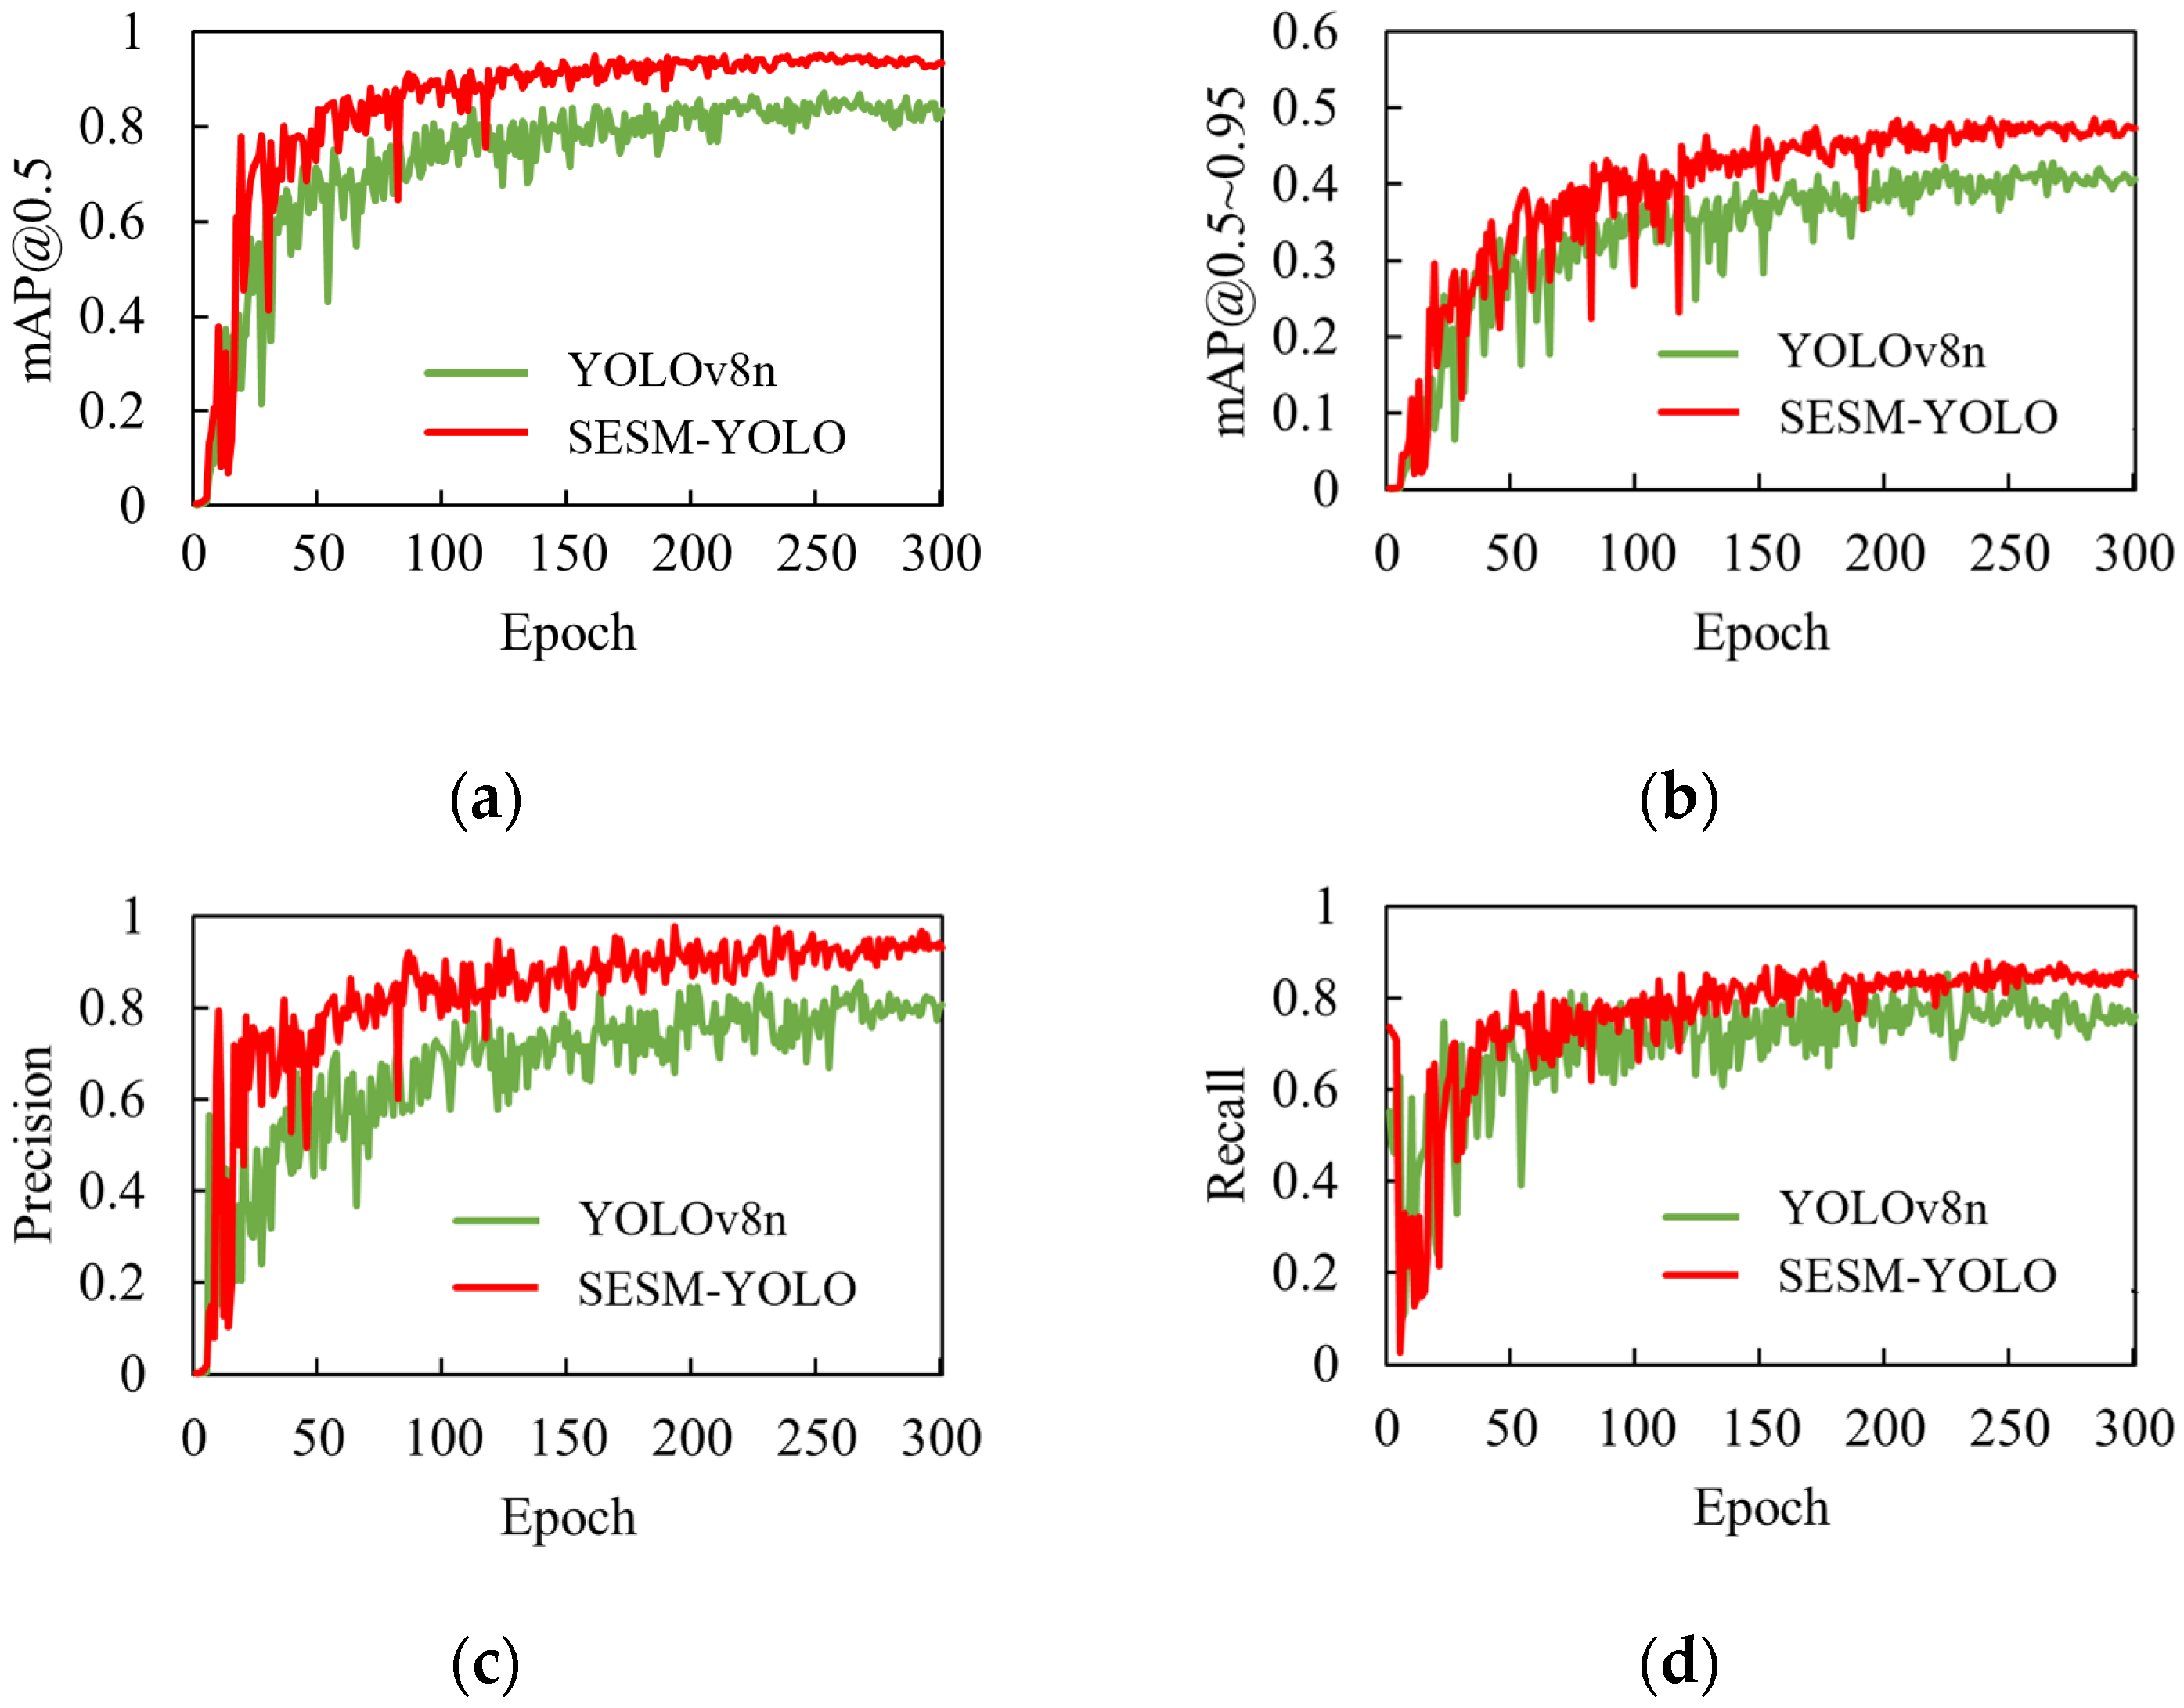
As shown in Figure 10, the mAP@0.5, mAP@0.5~0.95, Precision, and Recall curves of our proposed model and YOLOv8n during the training process are displayed. The green curve corresponds to the original model, while the red curve represents the enhanced model introduced in this study. From the figure, it is evident that after the training stabilizes, the red curve consistently outperforms the green curve at the same training epoch and demonstrates a quicker convergence speed. This suggests that the overall performance of the improved model, SESM-YOLO, exceeds that of the original model.
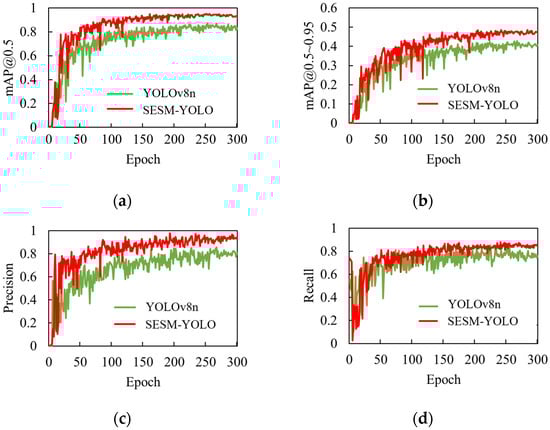
Figure 10.
Comparison of model improvement effects: (a) mAP@0.5; (b) mAP@0.5~0.95; (c) Precision; (d) Recall.
5.2.2. Comparison Experiment of Attention Mechanisms
To demonstrate the superiority of the SCSA mechanism selected in this study, several common attention mechanisms, including IEMA [31], CBAM [32], PSA [33], iRMB [34], and the SCSA mechanism used in this paper, were integrated into the small object detection head of the YOLOv8n neck structure. All other experimental conditions were kept consistent. Meanwhile, to provide a more intuitive presentation of the experimental results, we normalized the outcomes of various metrics and displayed them using bar charts. Table 3 illustrates the experimental results.
Table 3.
Comparison of different attention mechanisms.
According to the results presented above, while the CBAM attention mechanism obtains higher accuracy, the SCSA attention mechanism proposed in this paper still attains the highest mAP value while requiring significantly lower computational cost and fewer parameters.
5.2.3. Comparison Experiment of Modified C2f Module
To validate the superiority of the proposed Slim_Efficient_Block module, this section replaces the bottleneck module in C2f with other modules and compares their performance against the proposed module. The experimental results are presented in Table 4.
Table 4.
Comparison of different modified C2f modules.
According to the results presented in the table, while the WTConv module achieves lower computational cost and fewer parameters, its accuracy is inferior to that of the proposed Slim_Efficient_Block module. Considering both lightweight design and high accuracy, the Slim_Efficient_Block module demonstrates significant superiority over other approaches.
5.2.4. Comparison Experiment of Feature Fusion Network
This section analyzes the experimental results of various feature fusion networks. The experimental results are presented in Table 5.
Table 5.
Comparison of different loss functions.
From the table results, it can be observed that although the CCFM network structure minimizes model parameters and computational costs to the greatest extent, it does not demonstrate outstanding performance on other metrics. The HSFPN structure significantly improves recall and precision metrics, but its substantial growth in model parameters and computational load contradicts the requirements for lightweight detection. Meanwhile, the proposed Efficient_MS_FPN feature fusion network achieves higher accuracy compared to other feature fusion networks while effectively reducing both parameter quantity and computation amount. This aligns with the requirements for lightweight detection, making Efficient_MS_FPN the selected feature fusion network structure for SESM-YOLO.
5.2.5. Ablation Experiments
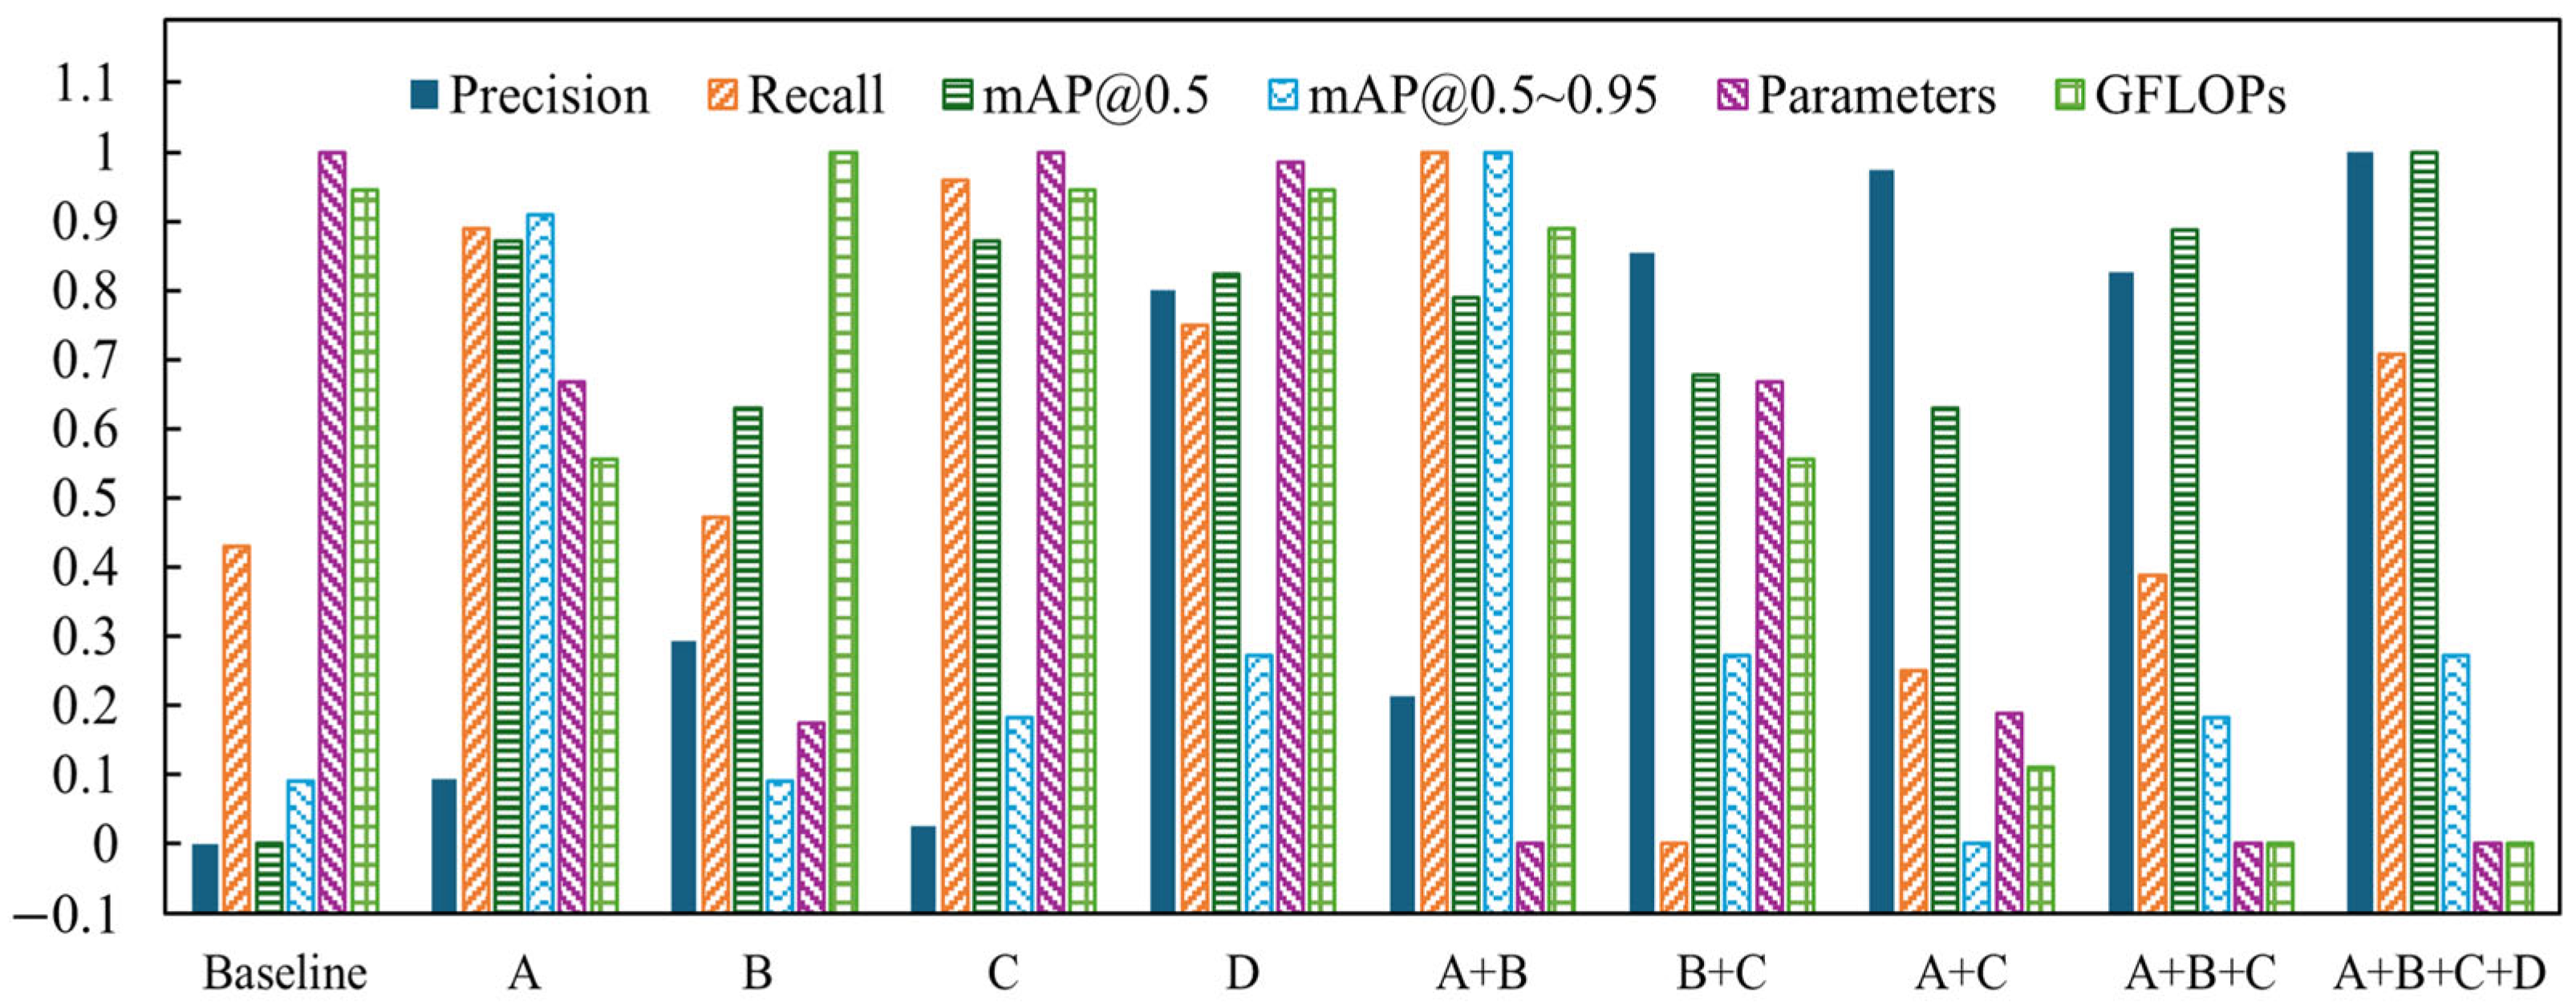
The baseline model for ablation experiments was the original YOLOv8n. To methodically evaluate the performance enhancements brought by each component, we established a series of models: the baseline model, model A(Slim_Efficient_Block), model B (Efficient_MS_FPN), model C (SCSA Module), model D (MPDIoU Loss Function), model A + B, model A + C, model B + C, model A + B + C, and model A + B + C + D. We quantitatively analyzed the variations in evaluation metrics across these eight models, with the results detailed in Table 6 and Figure 11.
Table 6.
Ablation of experimental results.
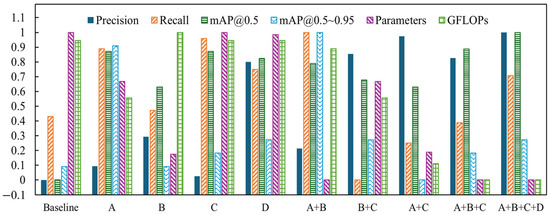
Figure 11.
Normalization effect diagram of overall indicators.
As shown in the table, each individual module improvement contributes to the enhancement of the evaluation metrics. The introduction of the Slim_Efficient_Block and SCSA Module results in the most significant improvement in mAP, with an increase of 5.4%. Meanwhile, the Efficient_MS_FPN structure effectively reduces the computational cost by 18.9%. In terms of computational efficiency, the Slim_Efficient_Block module alone reduces computational cost by 8.6%, while other improvements show no significant changes. Notably, although Efficient_MS_FPN and SCSA Module do not reduce computational cost when applied individually, their combined use leads to a significant reduction of 18.5%, likely due to the shared weight parameters between the two structures.
Compared to the baseline model, SESM-YOLO achieves a 7.5% improvement in precision, a 2% increase in recall, and a 6.2% boost in mAP, while reducing the number of parameters and computational cost by 22.9% and 21.0%, respectively. These results align with the requirements for high-accuracy lightweight detection.
5.2.6. Comparison Experiments
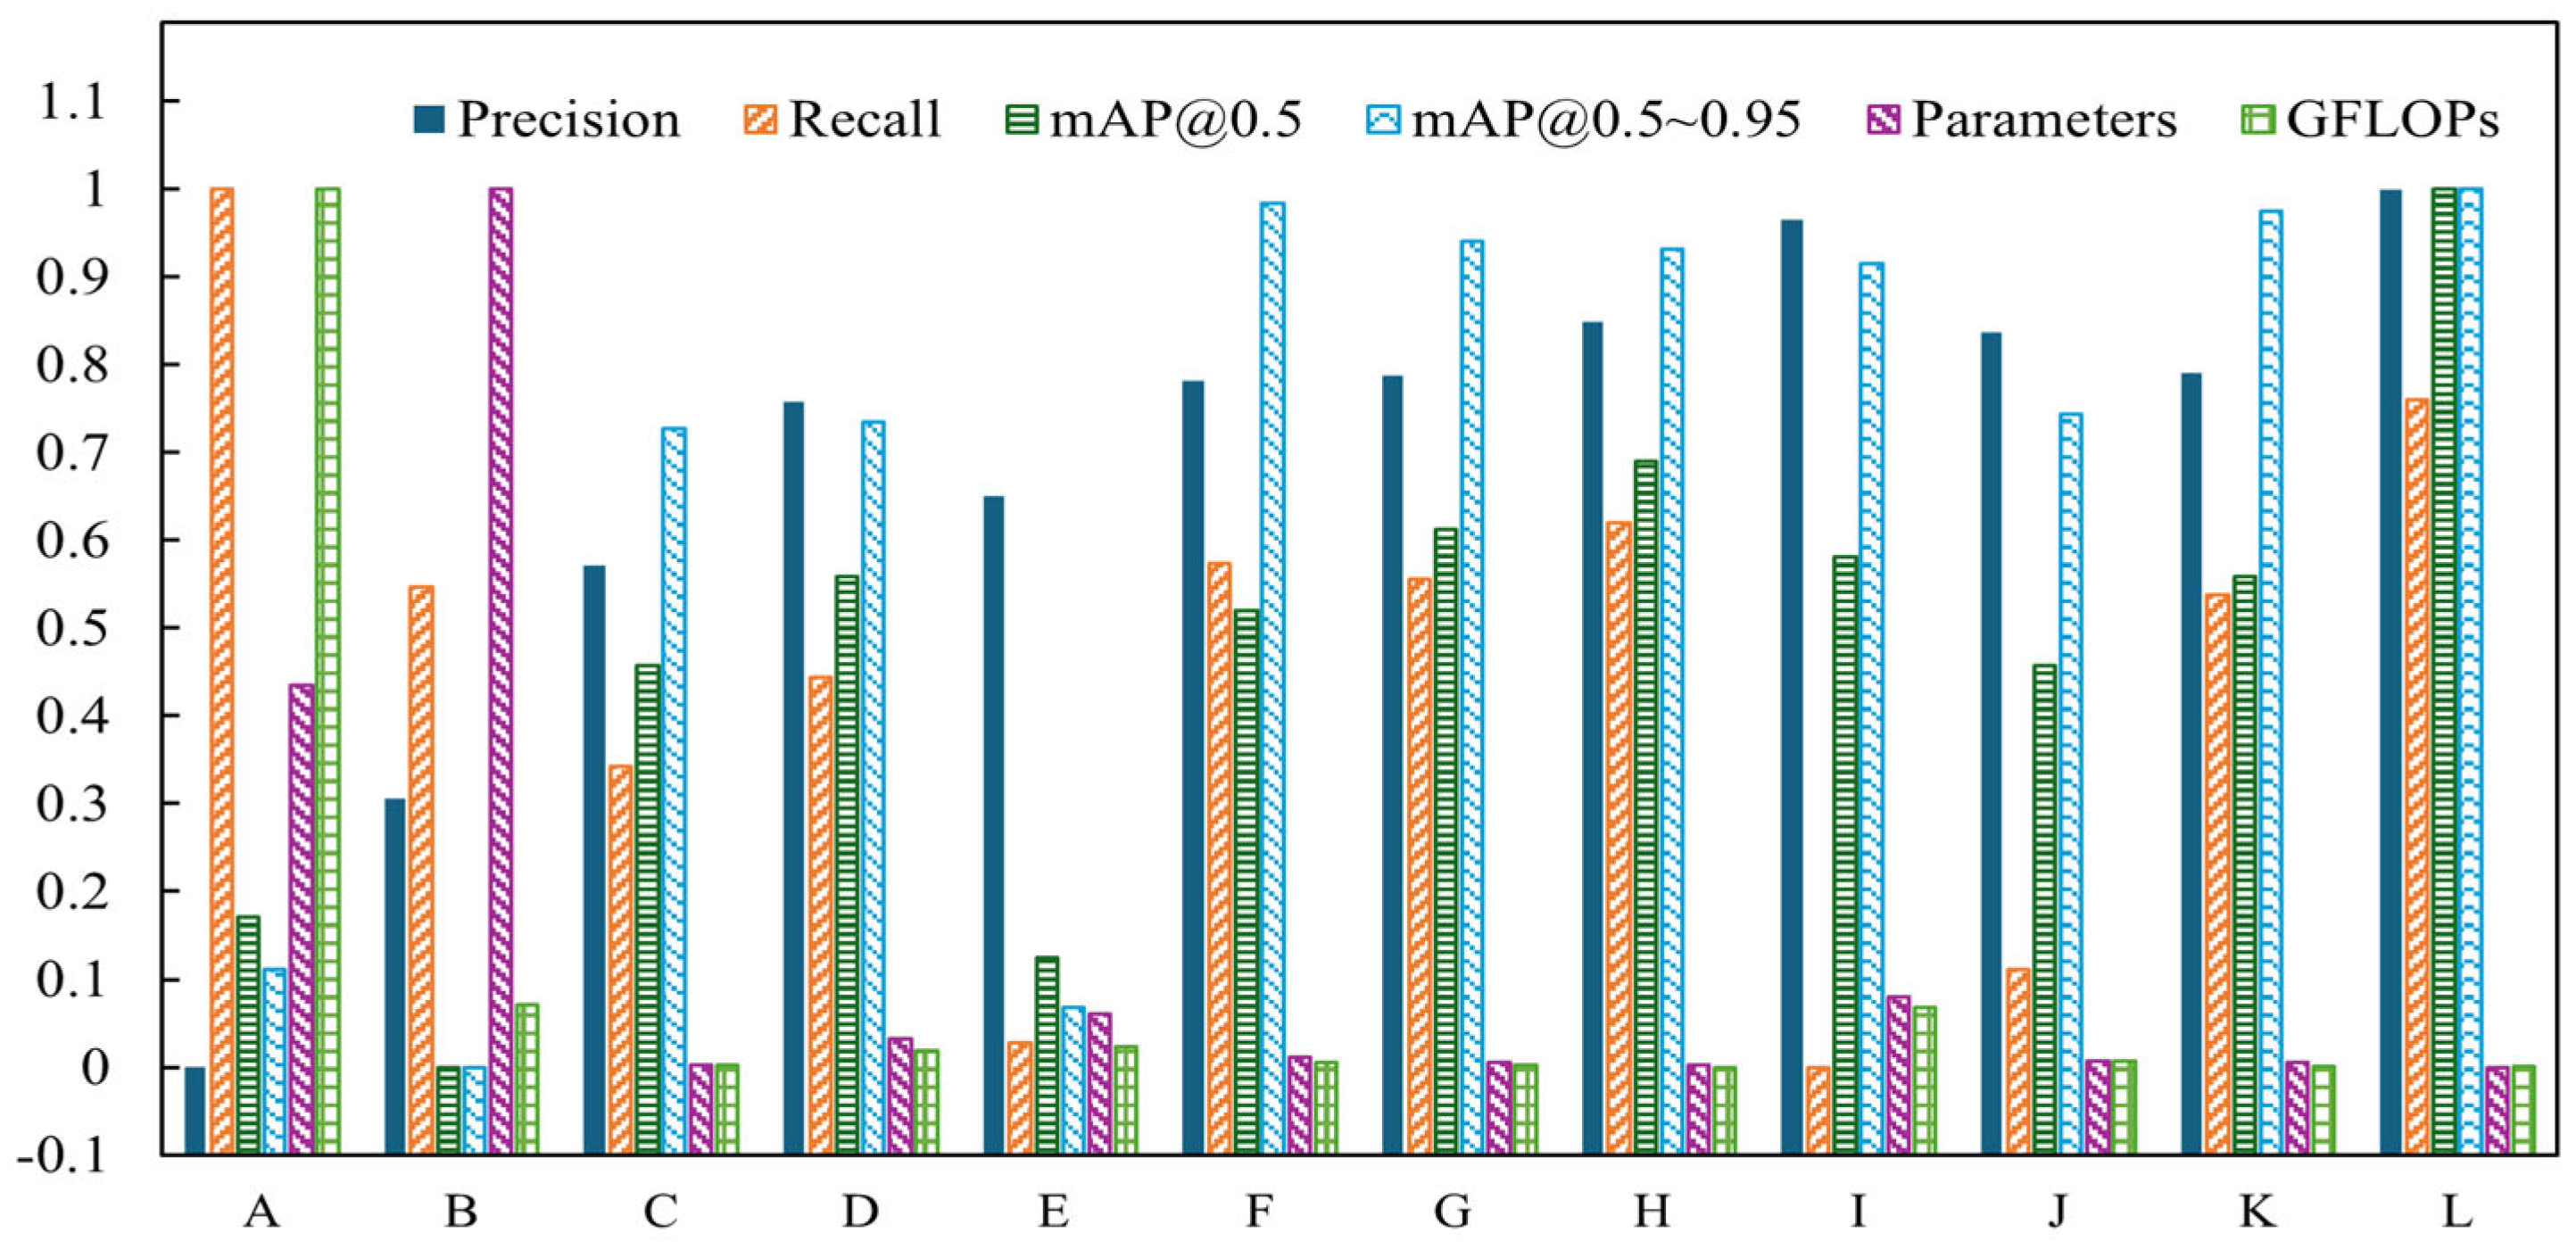
To demonstrate the superiority and effectiveness of the improved algorithm proposed, we compared SESM-YOLO to several popular object detection models, including Faster R-CNN, SSD, YOLOv5n, YOLOv6n, YOLOv7n-tiny, YOLOv9s, and YOLOv10n under the same conditions. Table 7 and Figure 12 show the experimental results. For ease of result aggregation, Faster R-CNN, YOLOv5n, YOLOv6n, YOLOv7n-tiny, YOLOv8n, YOLOv8n-WTConv, YOLOv8n-CCFM, YOLOv9s, YOLOv10n, YOLOv11n, and SESM-YOLO are labeled as A to M, respectively. Additionally, since the parameter and the computational complexity for Faster R-CNN are substantially higher than those of the other models, these two metrics are excluded from the regularization data.
Table 7.
Comparison of experimental results.
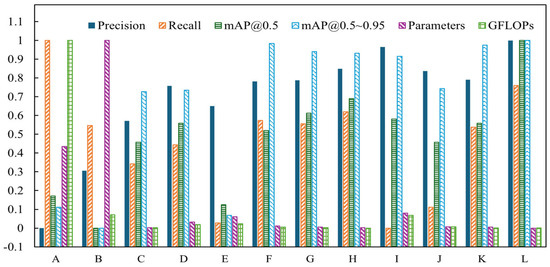
Figure 12.
Comparison of the normalization effect of experimental indicators (comparison experiment).
Based on the table results, it can be observed that Faster R-CNN, as a two-stage object detection model, requires an initial region proposal extraction followed by object detection within these regions, resulting in significantly higher model parameters and computational load compared to other detection algorithms. Among single-stage detectors, YOLO demonstrates superior recognition performance over SSD. The model proposed in this paper has fewer parameters and lower computational requirements compared to current mainstream object detection models. Moreover, the mAP50 scores have improved significantly by 10.7%, 12.9%, 7%, 5.7%, 11.3%, 6.2%, 5%, 4%, 5.4%, 7%, and 5.7%, respectively. Thus, the detection accuracy has been greatly enhanced.
YOLOv9, YOLOv10, and YOLOv11 are new versions of the YOLO model released in 2024, and thus, they were included in comparative experiments in this study. The results in the table indicate that while YOLOv9 shows improved accuracy in GPR hidden defects detection compared to YOLOv8, its computational and parameter requirements increased nearly threefold. YOLOv10, on the other hand, offers enhanced detection speed but performs worse in detecting small and overlapping defects in GPR images, resulting in lower accuracy than YOLOv8. YOLOv11 is a new model proposed by the Ultralytics team based on YOLOv8. Its main improvements involve replacing the C2f module with the C3k2 module and adding a new C2PSA module after the SPPF module. The fundamental structure of the model remains largely unchanged; in other words, YOLOv11 essentially represents an official variant of YOLOv8. In terms of results, the model’s parameters and computational complexity are significantly reduced compared to YOLOv8. However, for the task of detecting defect images in GPR data, YOLOv11’s performance metrics show no significant improvement, indicating that these particular modifications are not well-suited for this application. The improvements in this study also focus on both performance and efficiency. The results demonstrate that the performance gains achieved here are significantly better than those of YOLOv11. Furthermore, directly modifying YOLOv8 proves to be more efficient than modifying YOLOv11. Therefore, considering both detection accuracy and speed, YOLOv8 is chosen as the baseline model for GPR defect image detection to achieve better experimental results.
5.2.7. Visualization Analysis
The current research on deep learning is still in the exploratory stage, and people often regard deep learning models as black box models. This makes it difficult to explain the decision-making and reasoning processes involved, despite the remarkable results achieved in applying deep learning methods. In order to further judge whether the model performance is superior, we need to deeply study the interpretability of deep learning models. Therefore, to display the detection performance of our proposed model more directly, we conducted comparative experiments from three aspects: confusion matrix, model inference results, and heat maps, and then analyzed the advantages and disadvantages of the model’s performance.
- 1.
- Confusion matrix
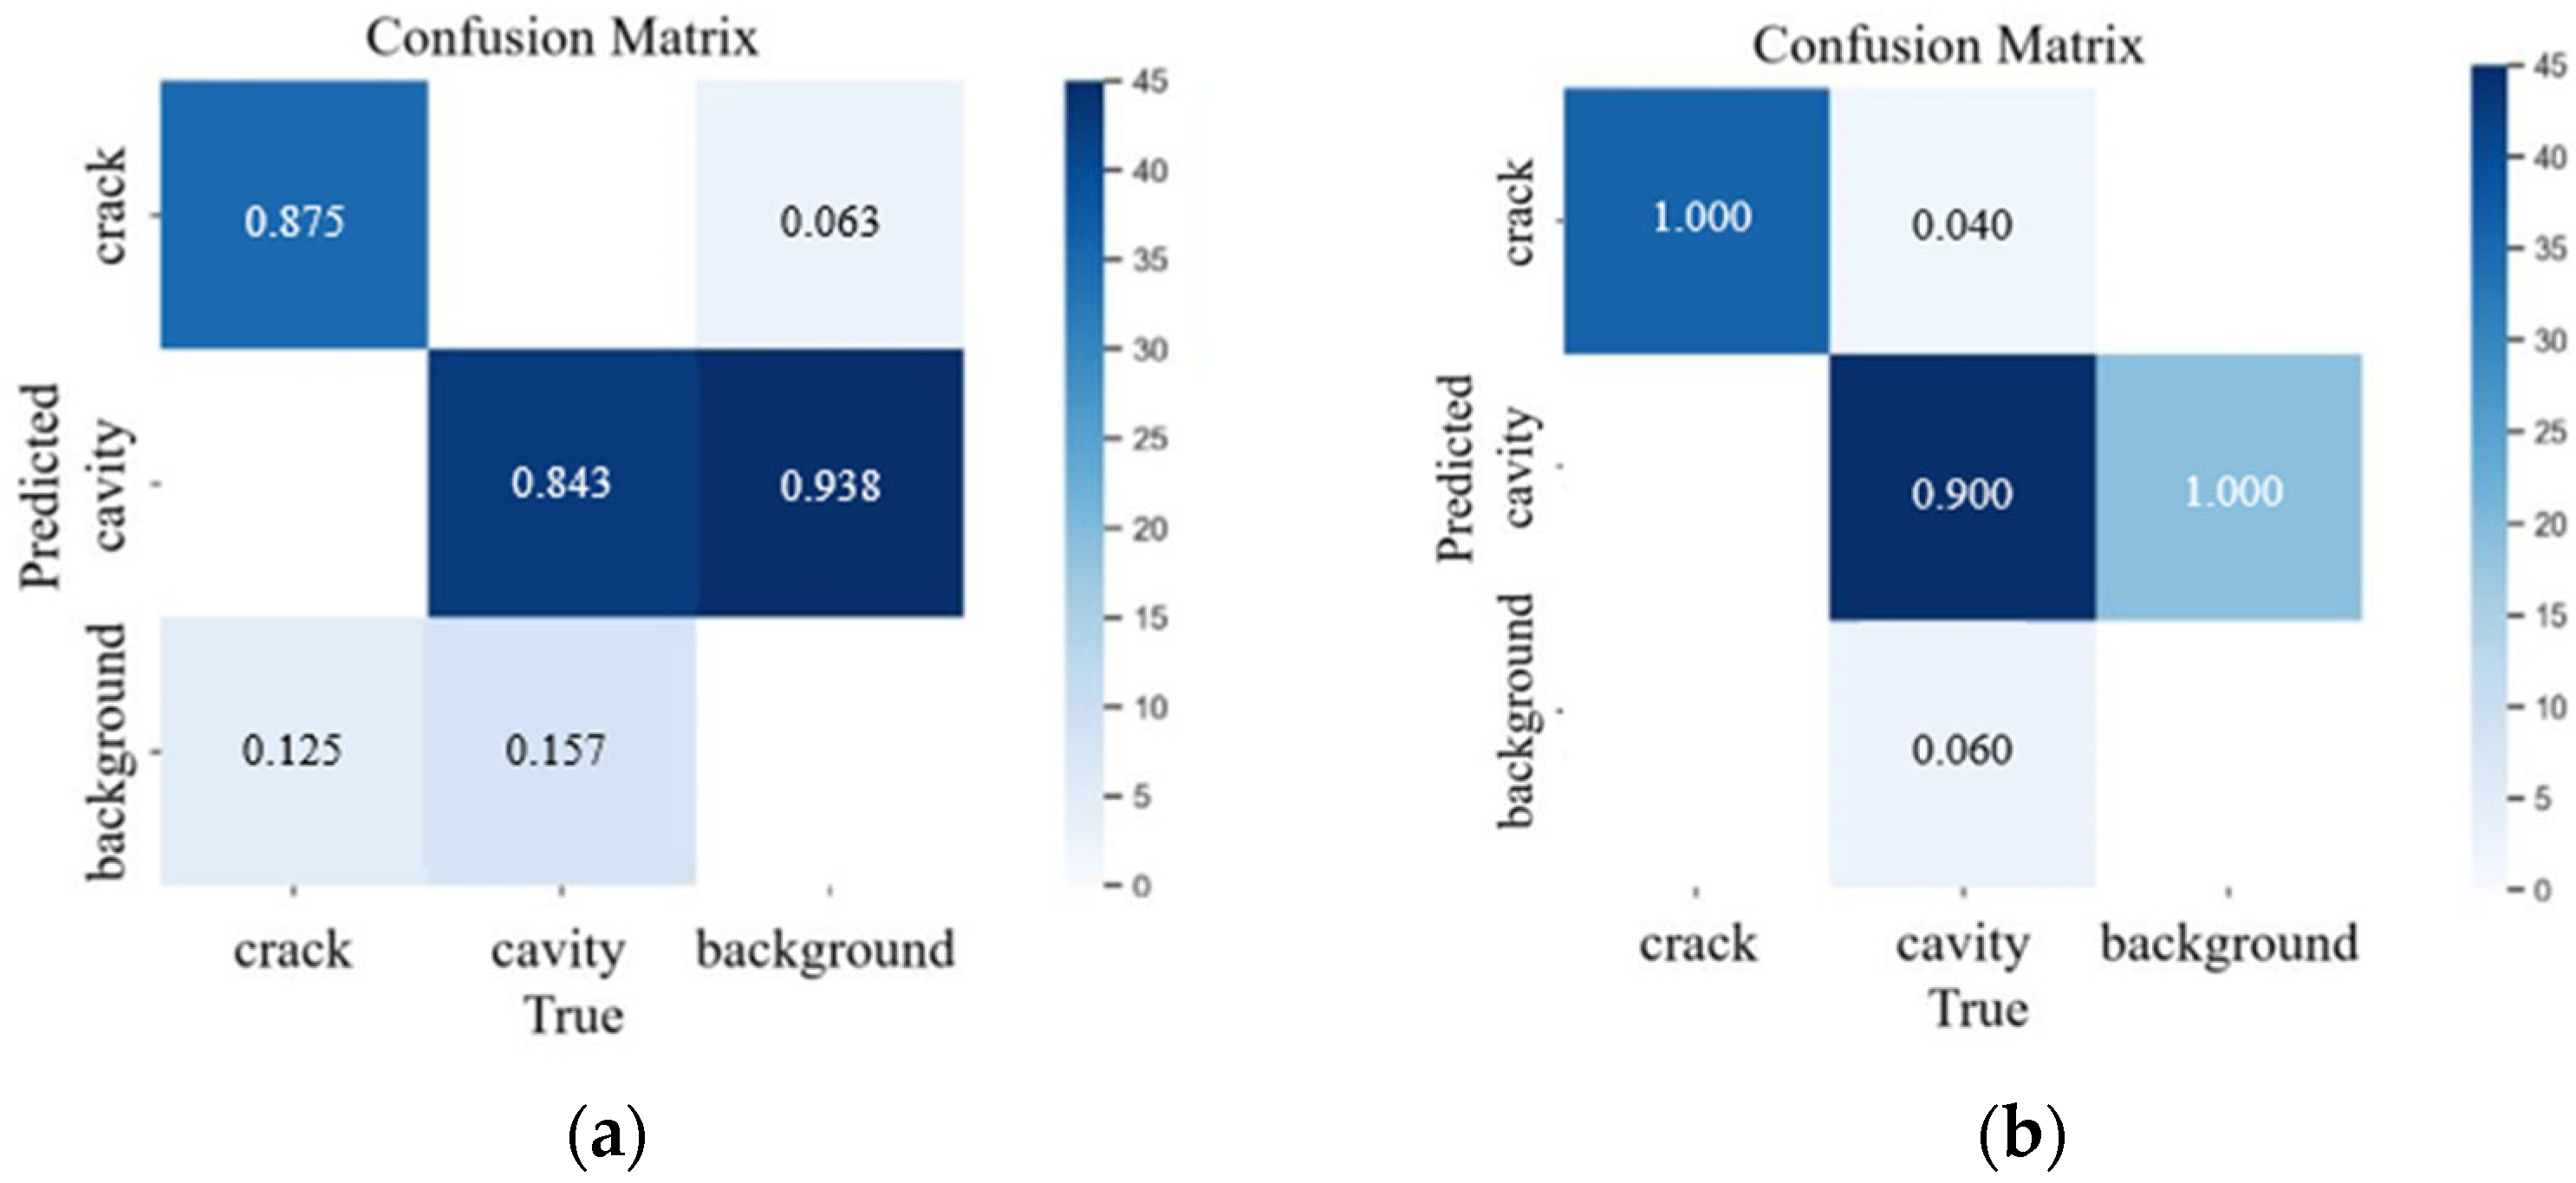
To illustrate the category prediction performance of the proposed model, we generated confusion matrices for YOLOv8n and SESM-YOLO, as depicted in Figure 13. In the confusion matrix, the target real class is represented by rows, and the predicted class is represented by columns. Correspondingly, the proportion of correctly predicted categories is represented by diagonal entries, and the proportion of incorrectly classified categories is represented by non-diagonal entries.

Figure 13.
Confusion matrix of the YOLOv8 model and SESM-YOLO model: (a) confusion matrix of YOLOv8n; (b) confusion matrix of SESM-YOLO.
Figure 13 shows that the original YOLOv8n model had a high false detection rate for void defects, often misidentifying background as voids, which reduced accuracy. SESM-YOLO was significantly improved on this issue. Due to the pronounced hyperbolic features of crack defects, the original YOLOv8n model performed reasonably well in detecting cracks, though it still missed some cracks. In comparison, SESM-YOLO addresses this error, improving detection accuracy.
- 2.
- Inference results
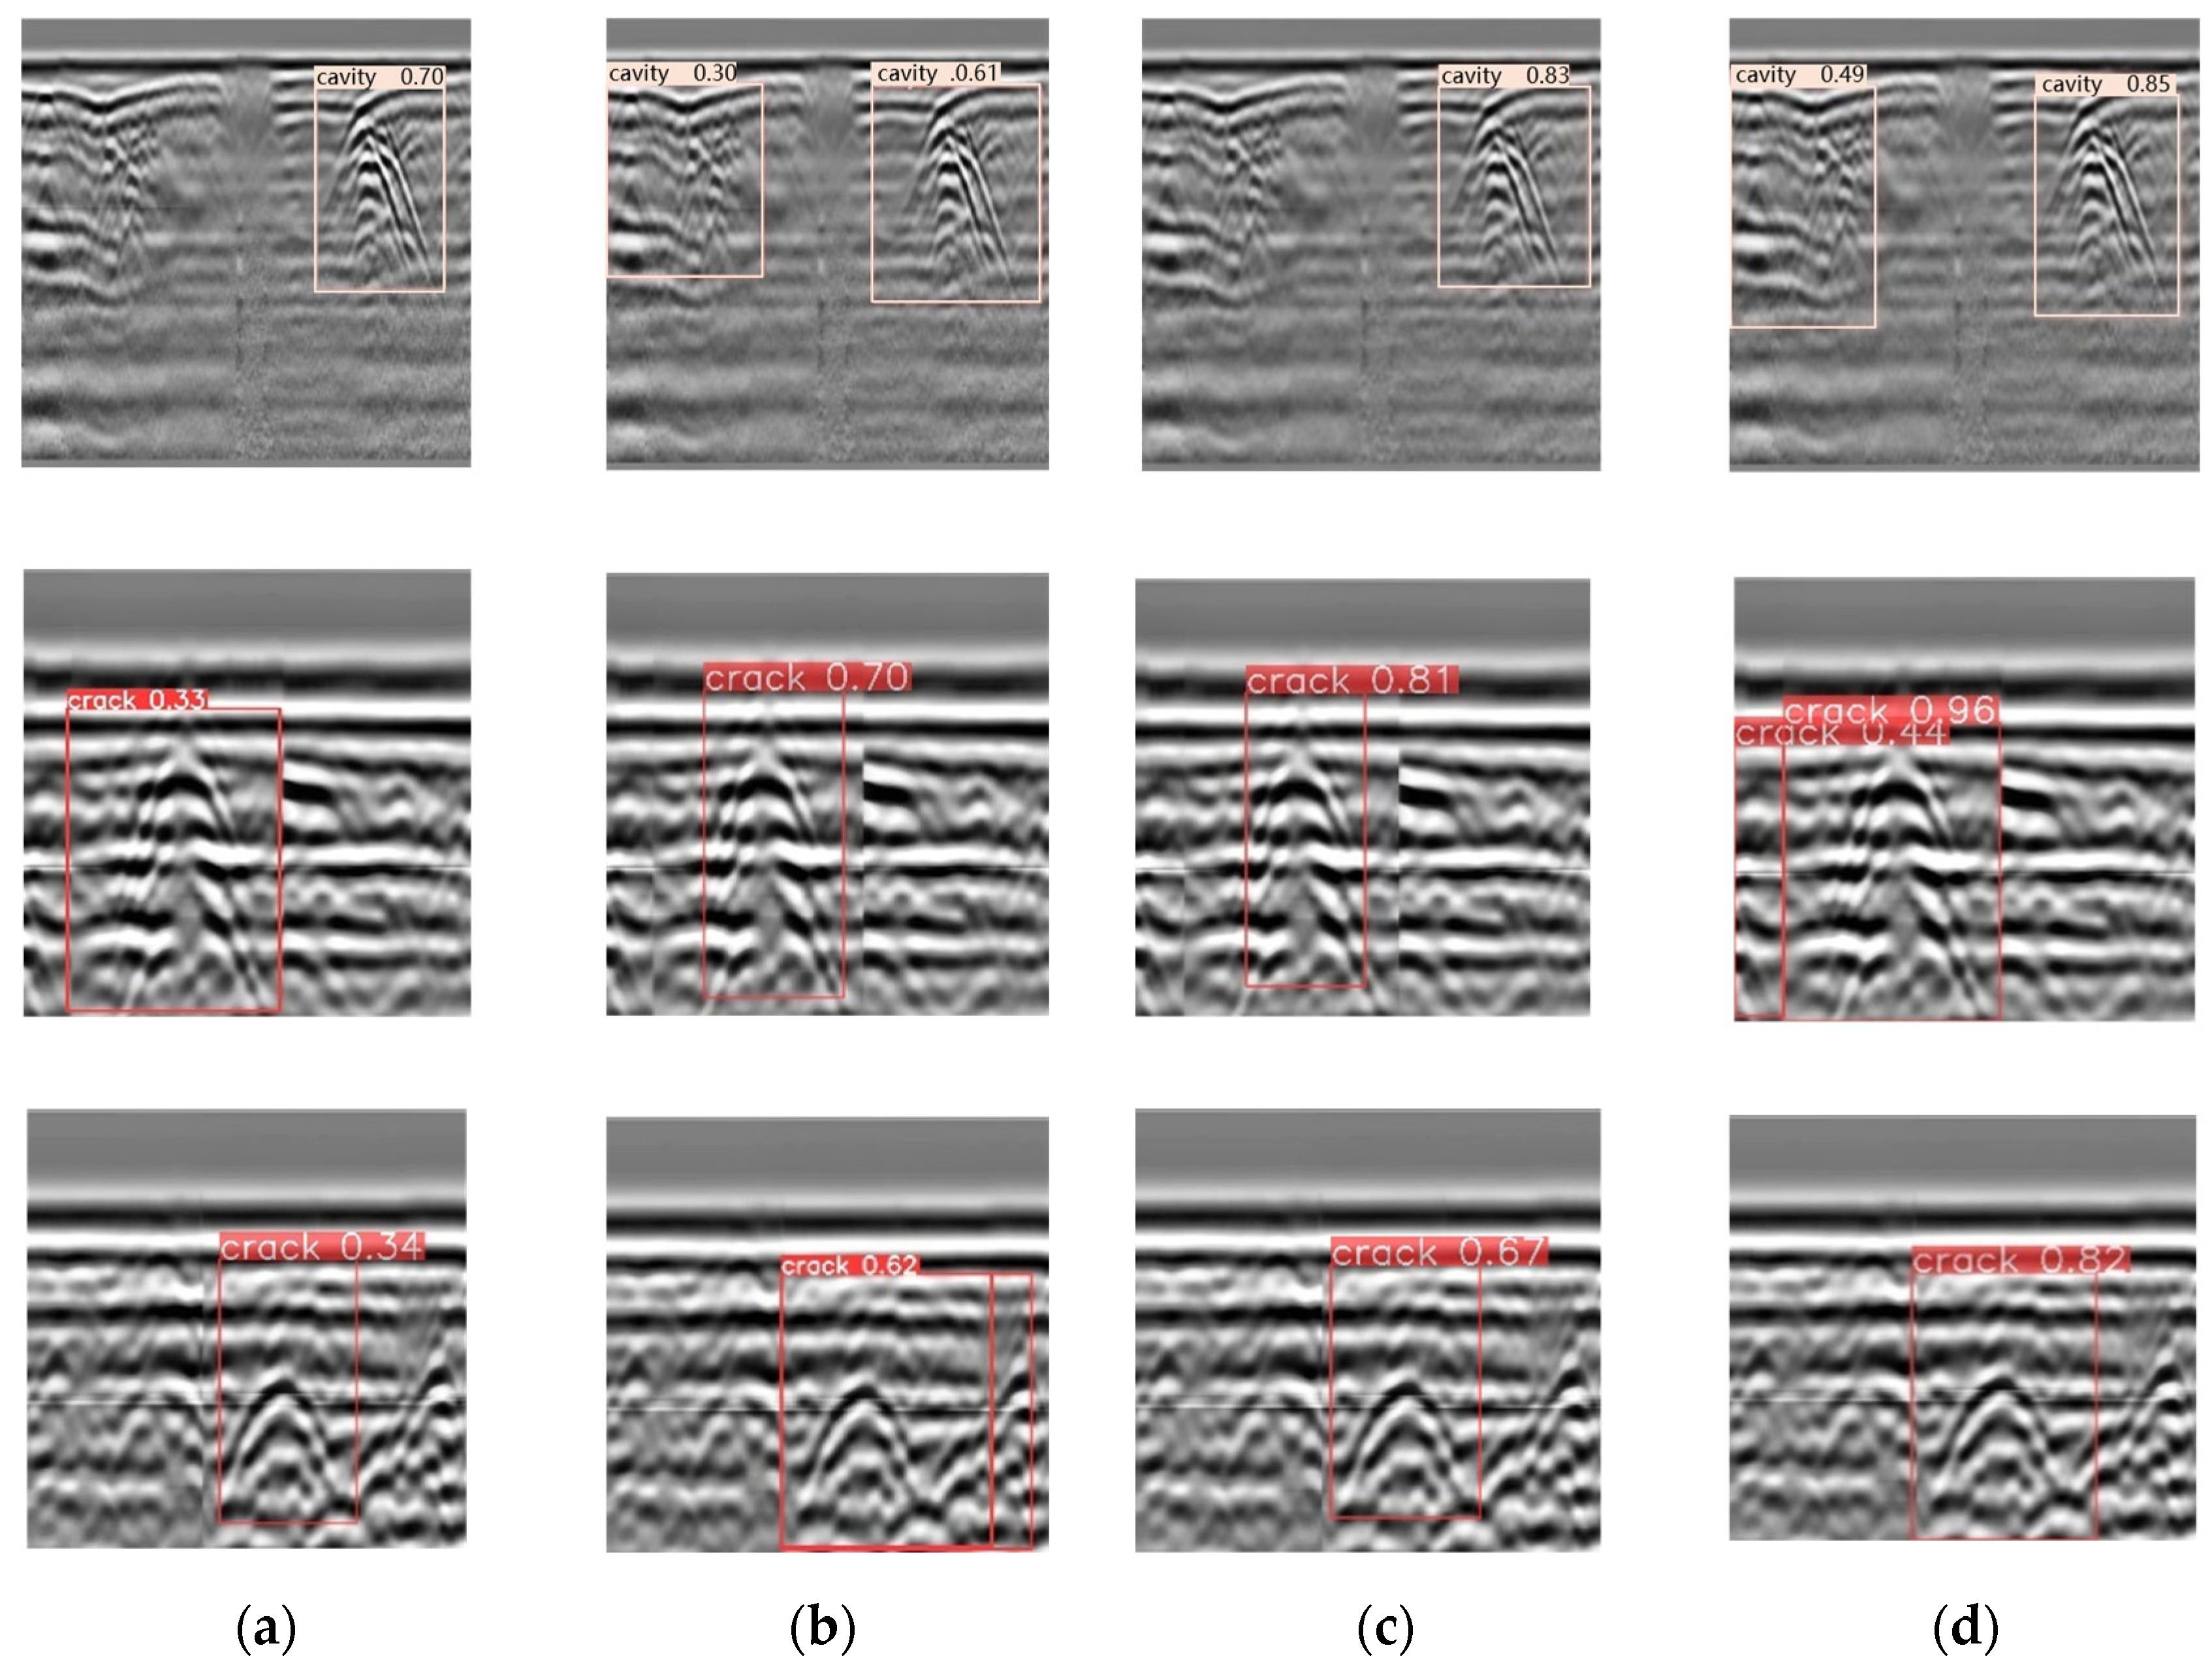
To intuitively demonstrate the detection performance of the proposed method, inference experiments were conducted using YOLOv5s, YOLOv10n, YOLOv8n, and SESM-YOLO. Figure 14 indicates the results. It can be observed that the confidence scores for the SESM-YOLO inference results are the highest, indicating reliable classification outcomes. Additionally, this method effectively avoids the issue of missed hidden defects.

Figure 14.
Partial visualization results of SESM-YOLO and baseline models in the data set: (a) YOLOv5s; (b) YOLOv10n; (c) YOLOv8n; (d) SESM-YOLO.
- 3.
- Heat maps
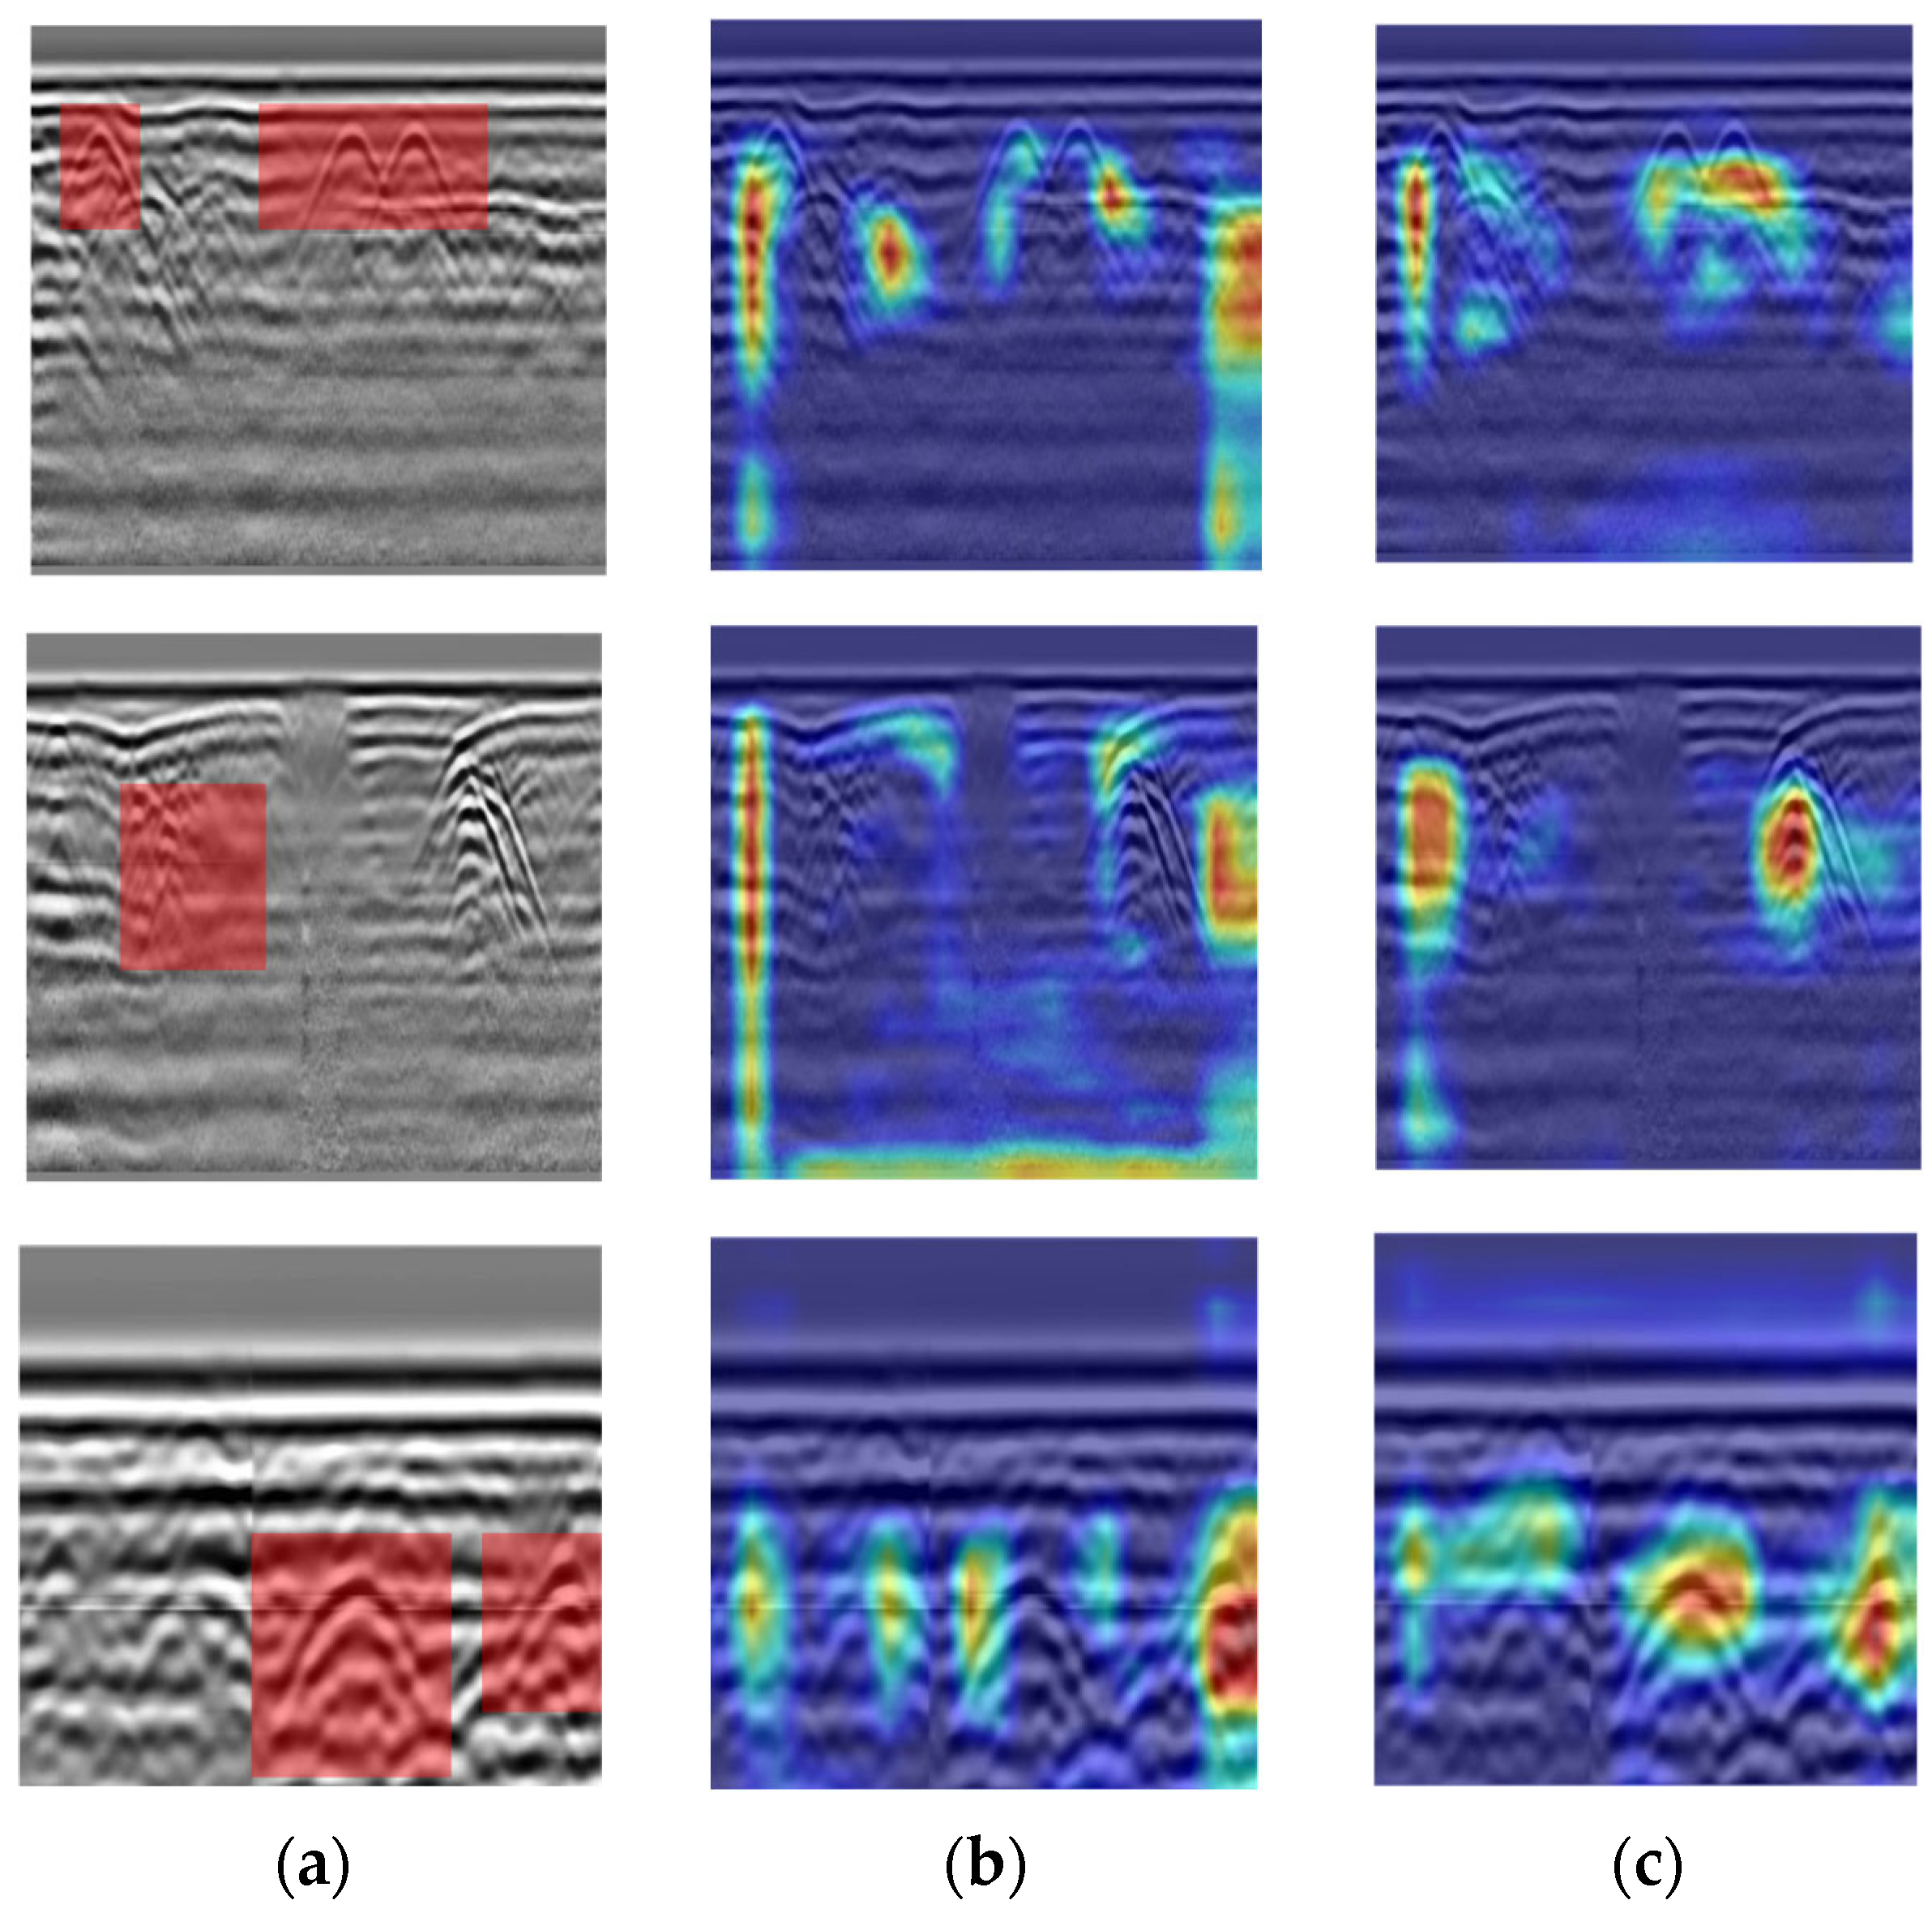
To visually demonstrate the regions of the feature map that the models prioritize before and after enhancement, this study utilizes Gradient-weighted Class Activation Mapping (Grad-CAM) [44] to create heatmaps for YOLOv8n and SESM-YOLO.
The gradient values are derived by backpropagating the confidence scores of the model’s output categories, where pixels with lower gradient values are depicted in darker blue on the heatmap, while those with higher gradient values are shown in darker red. The experimental results are presented in Figure 15. From the figure, it is clear that the heatmap for SESM-YOLO shows a stronger focus on defect-related features, suggesting that the improved model significantly reduces the influence of background noise, thereby improving recognition accuracy.
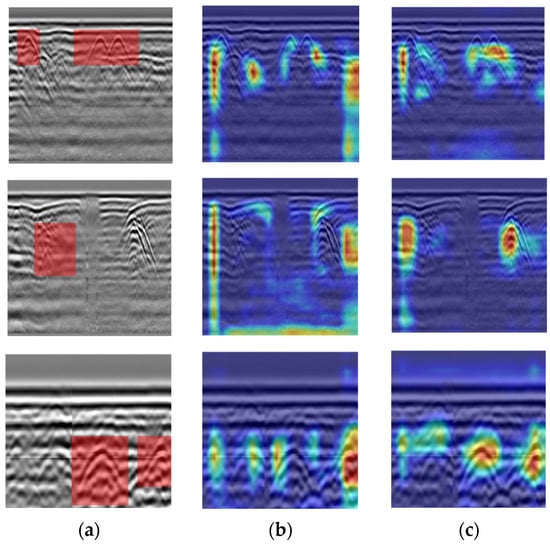
Figure 15.
Heat maps results: (a) original images; (b) heat maps of YOLOv8n; (c) heat maps of SESM-YOLO.
6. Conclusions
The lightweight detection of subsurface defects in urban roads using GPR is crucial for road maintenance and collapse prevention. This study developed an endoscopically validated dataset of cavity and crack defects and performed data preprocessing to enhance image quality. In addition, this study designed a novel object detection algorithm named SESM-YOLO to enhance both accuracy and efficiency in identifying defects from GPR images.
To validate the effectiveness of SESM-YOLO, this study applied the improved algorithm to the dataset and conducted a series of experiments. The evaluation framework comprised three key components: (1) benchmarking each enhanced module against conventional improvement approaches; (2) systematic ablation studies to verify the efficacy of the proposed modifications; and (3) comparative analysis with mainstream object detection algorithms to assess speed and accuracy metrics. The experimental results led to the following conclusions:
- In comparative module-wise experiments, although the proposed improvements in this study did not achieve universal superiority across all evaluation metrics, they demonstrated marked superiority when holistically considering detection accuracy and lightweight deployment requirements. This balanced optimization stems from our systematic approach that prioritizes critical performance dimensions for embedded GPR applications;
- Compared to the YOLOv8n, the detection accuracy of SESM-YOLO is improved to 92.8%, while reducing the number of model parameters to 2.32M, meeting the requirements for lightweight detection;
- Comparative experiments with mainstream object detection models demonstrate that the algorithm proposed in this study outperforms existing state-of-the-art methods in both accuracy and inference speed for GPR defect image recognition tasks;
- The comparison results of real-time inference and heat maps indicate that SESM-YOLO places greater emphasis on the features of damage, reducing interference from background factors and effectively enhancing identification accuracy.
The SESM-YOLO proposed in this study is an enhancement of YOLOv8n. While it has been proved to outperform both YOLOv10 and YOLOv11, further research is needed to determine whether even greater improvements can be achieved by using the latest object detection models as the baseline. Additionally, this study only addresses two types of hidden defects, leaving many others unexamined, such as water-related issues and poor inter-layer contact. Future research will consider a wider variety of complex defect types to develop a more comprehensive detection model.
Author Contributions
Conceptualization, G.J.; methodology, Y.Y.; software, G.J.; validation, M.C.; formal analysis, G.J.; investigation, L.N.; resources, Y.Y.; data curation, G.J.; writing—original draft preparation, G.J.; writing—review and editing, G.J. and Y.Y.; visualization, L.N.; supervision, Y.Y.; project administration, Y.Y.; funding acquisition, Y.Y. All authors have read and agreed to the published version of the manuscript.
Funding
This work was funded by the Natural Science Foundation of Hebei Province of China (No. E2024210157) and the Hebei Province Key Research and Development Program (No. 232A7601Z).
Data Availability Statement
The data used to support the findings of this study are available from the corresponding author upon reasonable request.
Conflicts of Interest
The authors declare that the research was conducted in the absence of any commercial or financial relationships that could be construed as a potential conflicts of interest.
References
- Rasol, M.A.; Pérez-Gracia, V.; Fernandes, F.M.; Pais, J.C.; Santos-Assunçao, S.; Santos, C.; Sossa, V. GPR Laboratory Tests and Numerical Models to Characterize Cracks in Cement Concrete Specimens, Exemplifying Damage in Rigid Pavement. Measurement 2020, 158, 107662. [Google Scholar] [CrossRef]
- Solla, M.; Pérez-Gracia, V.; Fontul, S. A Review of GPR Application on Transport Infrastructures: Troubleshooting and Best Practices. Remote Sens. 2021, 13, 672. [Google Scholar] [CrossRef]
- Liu, C.; Du, Y.; Yue, G.; Li, Y.; Wu, D.; Li, F. Advances in Automatic Identification of Road Subsurface Distress Using Ground Penetrating Radar: State of the Art and Future Trends. Autom. Constr. 2024, 158, 105185. [Google Scholar] [CrossRef]
- Zhang, M.; Feng, X.; Bano, M.; Xing, H.; Wang, T.; Liang, W.; Zhou, H.; Dong, Z.; An, Y.; Zhang, Y. Review of Ground Penetrating Radar Applications for Water Dynamics Studies in Unsaturated Zone. Remote Sens. 2022, 14, 5993. [Google Scholar] [CrossRef]
- Liu, Z.; Wu, W.; Gu, X.; Li, S.; Wang, L.; Zhang, T. Application of Combining YOLO Models and 3D GPR Images in Road Detection and Maintenance. Remote Sens. 2021, 13, 1081. [Google Scholar] [CrossRef]
- Leng, Z.; Al-Qadi, I.L. An Innovative Method for Measuring Pavement Dielectric Constant Using the Extended CMP Method with Two Air-Coupled GPR Systems. NDT E Int. 2014, 66, 90–98. [Google Scholar] [CrossRef]
- Krizhevsky, A.; Sutskever, I.; Hinton, G.E. ImageNet Classification with Deep Convolutional Neural Networks. Commun. ACM 2017, 60, 84–90. [Google Scholar] [CrossRef]
- Bhatt, D.; Patel, C.; Talsania, H.; Patel, J.; Vaghela, R.; Pandya, S.; Modi, K.; Ghayvat, H. CNN Variants for Computer Vision: History, Architecture, Application, Challenges and Future Scope. Electronics 2021, 10, 2470. [Google Scholar] [CrossRef]
- Besaw, L.E.; Stimac, P.J. Deep Convolutional Neural Networks for Classifying GPR B-Scans; Bishop, S.S., Isaacs, J.C., Eds.; SPIE: Baltimore, MD, USA, 2015; p. 945413. [Google Scholar]
- Reichman, D.; Collins, L.M.; Malof, J.M. Some Good Practices for Applying Convolutional Neural Networks to Buried Threat Detection in Ground Penetrating Radar. In Proceedings of the 2017 9th International Workshop on Advanced Ground Penetrating Radar (IWAGPR), Edinburgh, UK, 28–30 June 2017; pp. 1–5. [Google Scholar]
- Hou, Y.; Li, Q.; Zhang, C.; Lu, G.; Ye, Z.; Chen, Y.; Wang, L.; Cao, D. The State-of-the-Art Review on Applications of Intrusive Sensing, Image Processing Techniques, and Machine Learning Methods in Pavement Monitoring and Analysis. Engineering 2021, 7, 845–856. [Google Scholar] [CrossRef]
- Girshick, R.; Donahue, J.; Darrell, T.; Malik, J. Rich Feature Hierarchies for Accurate Object Detection and Semantic Segmentation. In Proceedings of the IEEE Conference on Computer Vision and Pattern Recognition, Columbus, OH, USA, 23–28 June 2014. [Google Scholar]
- Wang, X.; Shrivastava, A.; Gupta, A. A-Fast-RCNN: Hard Positive Generation via Adversary for Object Detection. In Proceedings of the 2017 IEEE Conference on Computer Vision and Pattern Recognition (CVPR), Honolulu, HI, USA, 21–26 July 2017; pp. 3039–3048. [Google Scholar]
- Ren, S.; He, K.; Girshick, R.; Sun, J. Faster R-CNN: Towards Real-Time Object Detection with Region Proposal Networks. IEEE Trans. Pattern Anal. Mach. Intell. 2017, 39, 1137–1149. [Google Scholar] [CrossRef]
- Redmon, J.; Divvala, S.; Girshick, R.; Farhadi, A. You Only Look Once: Unified, Real-Time Object Detection. In Proceedings of the 2016 IEEE Conference on Computer Vision and Pattern Recognition (CVPR), Las Vegas, NV, USA, 27–30 June 2016; pp. 779–788. [Google Scholar]
- Liu, W.; Anguelov, D.; Erhan, D.; Szegedy, C.; Reed, S.; Fu, C.-Y.; Berg, A.C. SSD: Single Shot MultiBox Detector. In Computer Vision—ECCV 2016; Leibe, B., Matas, J., Sebe, N., Welling, M., Eds.; Lecture Notes in Computer Science; Springer International Publishing: Cham, Switzerland, 2016; Volume 9905, pp. 21–37. ISBN 978-3-319-46447-3. [Google Scholar]
- Wang, D.; Liu, Z.; Gu, X.; Wu, W.; Chen, Y.; Wang, L. Automatic Detection of Pothole Distress in Asphalt Pavement Using Improved Convolutional Neural Networks. Remote Sens. 2022, 14, 3892. [Google Scholar] [CrossRef]
- Du, Y.; Yue, G.; Liu, C.; Li, F.; Cai, W. Automatic Identification Method for Urban Cavities Using Multi-Feature Fusion of Ground Penetrating Radar. China J. Highw. Transp. 2023, 36, 108–119. [Google Scholar]
- Liu, Z.; Gu, X.; Li, J.; Dong, Q.; Jiang, J. Deep Learning-Enhanced Approach for Numerical Simulation of Ground-Penetrating Radar and Road Crack Image Detection. Chin. J. Geophys. 2024, 67, 2455–2471. [Google Scholar]
- Deng, J.; Dong, W.; Socher, R.; Li, L.-J.; Li, K.; Li, F.-F. ImageNet: A Large-Scale Hierarchical Image Database. In Proceedings of the 2009 IEEE Conference on Computer Vision and Pattern Recognition, Miami, FL, USA, 20–25 June 2009; pp. 248–255. [Google Scholar]
- Ozkaya, U.; Melgani, F.; Belete Bejiga, M.; Seyfi, L.; Donelli, M. GPR B Scan Image Analysis with Deep Learning Methods. Measurement 2020, 165, 107770. [Google Scholar] [CrossRef]
- Jocher, G.; Qiu, J.; Chaurasia, A. Ultralytics YOLO (Version 8.0.0) [Computer Software]. 2023. Available online: https://github.com/ultralytics/ultralytics (accessed on 27 May 2025).
- Zhou, F.; Zhao, H.; Nie, Z. Safety Helmet Detection Based on YOLOv5. In Proceedings of the 2021 IEEE International Conference on Power Electronics, Computer Applications (ICPECA), Shenyang, China, 22–24 January 2021; pp. 6–11. [Google Scholar]
- Lin, T.-Y.; Dollar, P.; Girshick, R.; He, K.; Hariharan, B.; Belongie, S. Feature Pyramid Networks for Object Detection. In Proceedings of the 2017 IEEE Conference on Computer Vision and Pattern Recognition (CVPR), Honolulu, HI, USA, 21–26 July 2017; pp. 936–944. [Google Scholar]
- Liu, S.; Qi, L.; Qin, H.; Shi, J.; Jia, J. Path Aggregation Network for Instance Segmentation. In Proceedings of the IEEE Conference on Computer Vision and Pattern Recognition, Salt Lake City, UT, USA, 18–23 June 2018. [Google Scholar]
- Zhao, L.; Wu, Y.; Yan, W.; Zhan, W.; Huang, X.; Booth, J.; Mehta, A.; Bekris, K.; Kramer-Bottiglio, R.; Balkcom, D. StarBlocks: Soft Actuated Self-Connecting Blocks for Building Deformable Lattice Structures. IEEE Robot. Autom. Lett. 2023, 8, 4521–4528. [Google Scholar] [CrossRef]
- Dauphin, Y.N.; Fan, A.; Auli, M.; Grangier, D. Language Modeling with Gated Convolutional Networks. In Proceedings of the 34th International Conference on Machine Learning, Sydney, Australia, 6–11 August 2017. [Google Scholar]
- Li, H.; Li, J.; Wei, H.; Liu, Z.; Zhan, Z.; Ren, Q. Slim-Neck by GSConv: A Better Design Paradigm of Detector Architectures for Autonomous Vehicles. arXiv 2022, arXiv:2206.02424. [Google Scholar]
- Si, Y.; Xu, H.; Zhu, X.; Zhang, W.; Dong, Y.; Chen, Y.; Li, H. SCSA: Exploring the Synergistic Effects Between Spatial and Channel Attention. Neurocomputing 2025, 634, 129866. [Google Scholar] [CrossRef]
- Ma, S.; Xu, Y. MPDIoU: A Loss for Efficient and Accurate Bounding Box Regression. arXiv 2023, arXiv:2307.07662. [Google Scholar]
- Bin, F.; He, J.; Qiu, K.; Hu, L.; Zheng, Z.; Sun, Q. CI-YOLO: A Lightweight Foreign Object Detection Model for Inspecting Transmission Line. Measurement 2025, 242, 116193. [Google Scholar] [CrossRef]
- Woo, S.; Park, J.; Lee, J.-Y.; Kweon, I.S. CBAM: Convolutional Block Attention Module. In Computer Vision—ECCV 2018; Ferrari, V., Hebert, M., Sminchisescu, C., Weiss, Y., Eds.; Lecture Notes in Computer Science; Springer International Publishing: Cham, Switzerland, 2018; Volume 11211, pp. 3–19. ISBN 978-3-030-01233-5. [Google Scholar]
- Chen, G.; Gu, T.; Lu, J.; Bao, J.-A.; Zhou, J. Person Re-Identification via Attention Pyramid. IEEE Trans. Image Process. 2021, 30, 7663–7676. [Google Scholar] [CrossRef]
- Yu, Z. RT-DETR-iRMB: A Lightweight Real-Time Small Object Detection Method. In Proceedings of the 2024 IEEE 6th Advanced Information Management, Communicates, Electronic and Automation Control Conference (IMCEC), Chongqing, China, 24–26 May 2024; pp. 1454–1458. [Google Scholar]
- Huang, B. ASD-YOLO: An Aircraft Surface Defects Detection Method Using Deformable Convolution and Attention Mechanism. Measurement 2024, 238, 115300. [Google Scholar] [CrossRef]
- Jo, Y.; Oh, S.W.; Kang, J.; Kim, S.J. Deep Video Super-Resolution Network Using Dynamic Upsampling Filters Without Explicit Motion Compensation. In Proceedings of the 2018 IEEE/CVF Conference on Computer Vision and Pattern Recognition, Salt Lake City, UT, USA, 18–23 June 2018; pp. 3224–3232. [Google Scholar]
- Jia, G.; Xu, L.; Zhu, L. WTConv-Adapter: Wavelet Transform Convolution Adapter for Parameter Efficient Transfer Learning of Object Detection ConvNets. In Proceedings of the Eighth International Conference on Video and Image Processing (ICVIP 2024), Kuala Lumpur, Malaysia, 13–15 December 2024; p. 3. [Google Scholar]
- Han, D.; Wang, Z.; Xia, Z.; Han, Y.; Pu, Y.; Ge, C.; Song, J.; Song, S.; Zheng, B.; Huang, G. Demystify Mamba in Vision: A Linear Attention Perspective. arXiv 2024, arXiv:2405.16605. [Google Scholar]
- Chen, J.; Mai, H.; Luo, L.; Chen, X.; Wu, K. Effective Feature Fusion Network in BIFPN for Small Object Detection. In Proceedings of the 2021 IEEE International Conference on Image Processing (ICIP), Anchorage, AK, USA, 19–22 September 2021; pp. 699–703. [Google Scholar]
- Zhao, Y.; Lv, W.; Xu, S.; Wei, J.; Wang, G.; Dang, Q.; Liu, Y.; Chen, J. DETRs Beat YOLOs on Real-Time Object Detection. In Proceedings of the 2024 IEEE/CVF Conference on Computer Vision and Pattern Recognition (CVPR), Seattle, WA, USA, 16–22 June 2024; pp. 16965–16974. [Google Scholar]
- Kang, M.; Ting, C.-M.; Ting, F.F.; Phan, R.C.-W. ASF-YOLO: A Novel YOLO Model with Attentional Scale Sequence Fusion for Cell Instance Segmentation. Image Vis. Comput. 2024, 147, 105057. [Google Scholar] [CrossRef]
- Wang, C.; Nie, W.H.Y.; Guo, J.; Liu, C.; Han, K.; Wang, Y. Gold-YOLO: Efficient Object Detector via Gather-and-Distribute Mechanism. Adv. Neural Inf. Process. Syst. 2023, 36, 51094–51112. [Google Scholar]
- Liu, R.-M.; Su, W.-H. APHS-YOLO: A Lightweight Model for Real-Time Detection and Classification of Stropharia Rugoso-Annulata. Foods 2024, 13, 1710. [Google Scholar] [CrossRef]
- Selvaraju, R.R.; Cogswell, M.; Das, A.; Vedantam, R.; Parikh, D.; Batra, D. Grad-CAM: Visual Explanations from Deep Networks via Gradient-Based Localization. In Proceedings of the IEEE International Conference on Computer Vision, Venice, Italy, 22–29 October 2017. [Google Scholar]


Disclaimer/Publisher’s Note: The statements, opinions and data contained in all publications are solely those of the individual author(s) and contributor(s) and not of MDPI and/or the editor(s). MDPI and/or the editor(s) disclaim responsibility for any injury to people or property resulting from any ideas, methods, instructions or products referred to in the content. |
© 2025 by the authors. Licensee MDPI, Basel, Switzerland. This article is an open access article distributed under the terms and conditions of the Creative Commons Attribution (CC BY) license (https://creativecommons.org/licenses/by/4.0/).