Abstract
This paper conducts a full-scale shaking table test on a prototype prefabricated L-shaped column concrete house structure to experimentally verify its seismic performance in high-intensity seismic areas. We analyze the frequency of the structure, story drift angle, amplification factor of peak acceleration of ground motion, and damage distribution. The corresponding finite element model is established using ABAQUS to verify the experimental results and further study the damage forms and weak areas of the structure under a strong earthquake. The results show that the structure can maintain an elastic state under the rare intensity of a level 7 earthquake, but begins to bend and deform in the direction of the two main axes under the rare intensity of a level 8 earthquake. At a rare intensity of a level 9 earthquake, the structure is completely destroyed. This result shows that the unitary precast special-shaped column concrete structure meets the requirements of the current code.
1. Introduction
With the development of China’s economy, prefabricated buildings are widely used in transportation infrastructure and various types of buildings due to their high efficiency, environmental friendliness, and industrialization, and are gradually applied to temporary houses, multi-storey and high-rise buildings [1,2,3]. In building construction, seismic performance is the key to design and construction [4,5,6,7]. Saoud et al. [8] developed an isolation system based on periodic materials with H-fractal geometry in order to obstruct, absorb or completely modify the pattern of seismic energy before it reaches the foundations of structures. Salah et al. [9] experimentally and analytically studied the behavior of strengthened L-shaped RC columns. Xu et al. [10] proposed a novel L-shaped column fabricated using STC (L-STC). Zhao et al. [11] systematically analyzed the seismic performance of the beams-column assembly under different construction methods through the low-cycle repeated load test and found that the rational design of prefabricated joints can significantly improve the ductility and energy dissipation capacity of the structure, and its bearing capacity is basically the same as the cast-in-place structure. Cao [12,13] verified the collapse-carrying capacity of the prefabricated concrete frame structure by pseudo-dynamic test and found that the structure can still maintain the overall stability under multi-degree-of-freedom seismic input, which provides a basis for the seismic design of complex components. Wang et al. [14] analyzed the axial behavior of an innovative L-shaped composite column. Palanci et al. [15] conducted a risk assessment of a one-story precast building in a probabilistic manner by using damage probability matrices (DPMs), and their methods can be used in the risk assessment of precast industrial buildings. However, most of the existing studies focus on cast-in-place and shaped steel concrete frames. The research on the seismic performance of prefabricated concrete special-shaped column frames is still limited.
This study designed a modular prefabricated special-shaped column concrete structure to carry out a prototype full-scale shaking table test. Establishing the corresponding finite element model according to the frequency change, inter-story displacement Angle distribution, ground motion peak acceleration amplification factor response, and structural damage distribution of the prefabricated special-shaped column concrete structure under the condition that the forced intensity is 7 degrees (0.15 g) and compared with the test results. The failure forms of the structure under the action of strong earthquakes were analyzed, and the corresponding design suggestions were put forward. In this study, the full-scale test is used to obtain the shaking table simulation data more accurately, which provides an accurate reference for the follow-up finite element simulation research and the seismic performance research of L-shaped column prefabricated concrete buildings.
2. Materials and Methods
2.1. Model Design
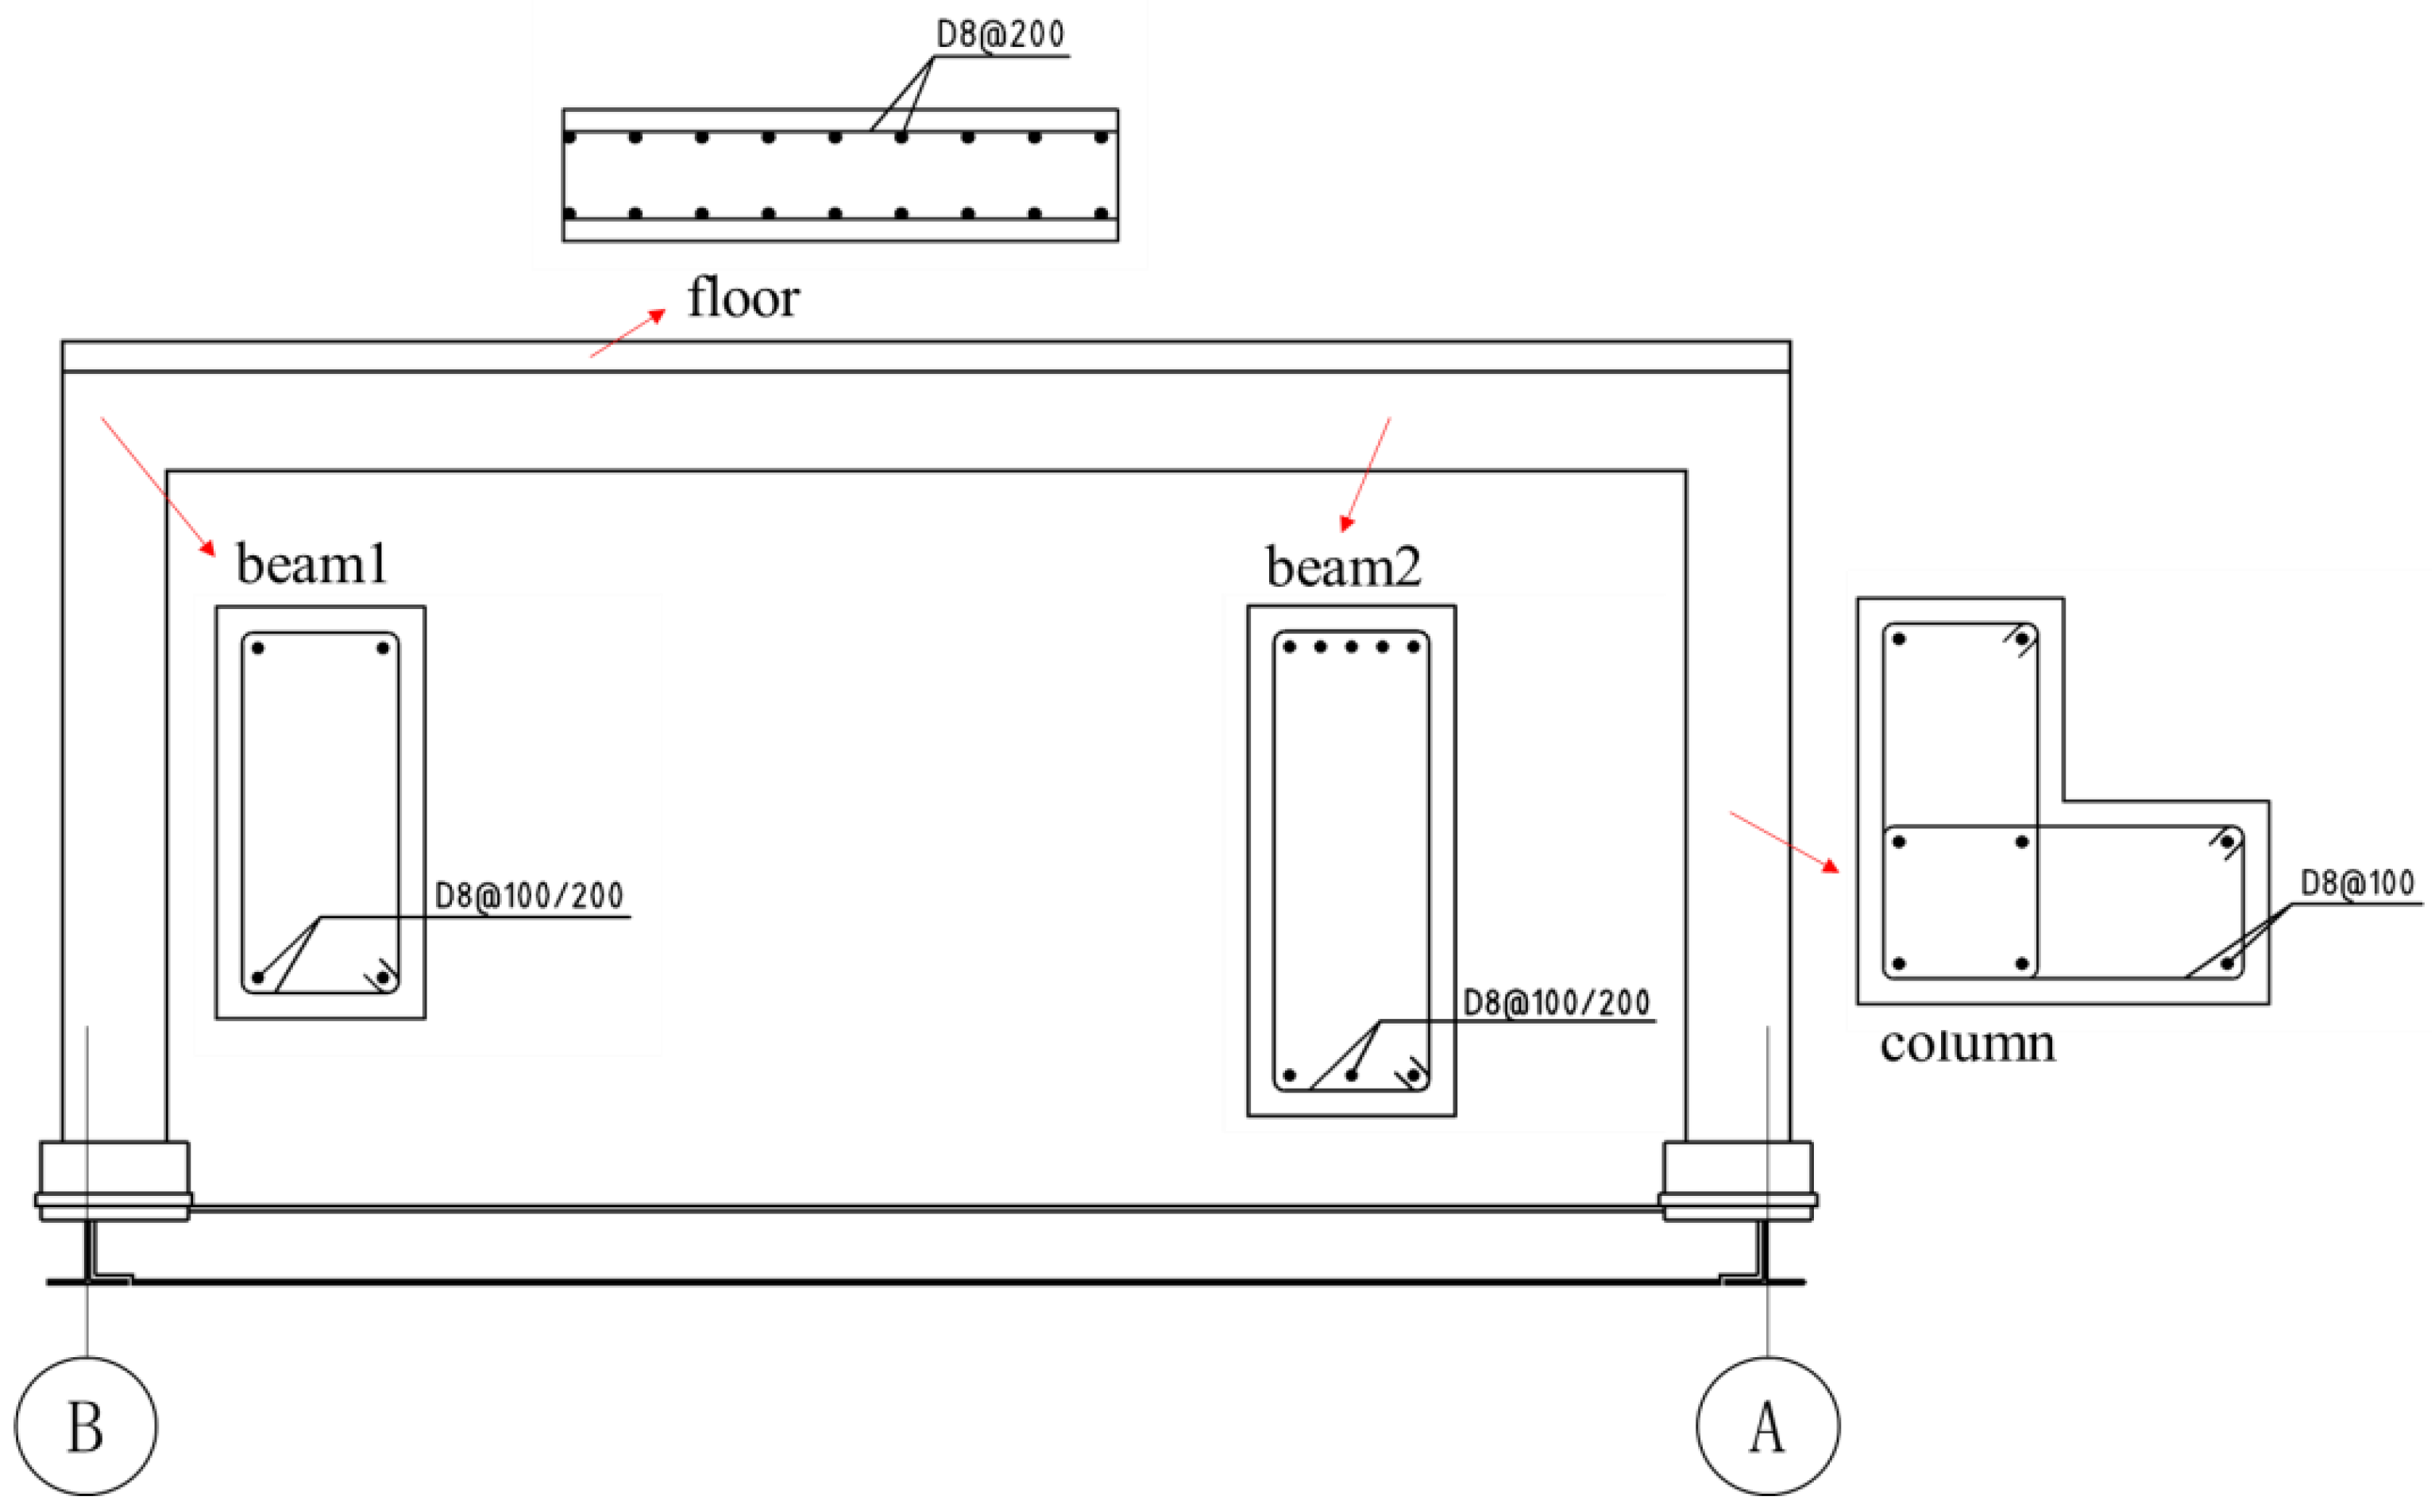
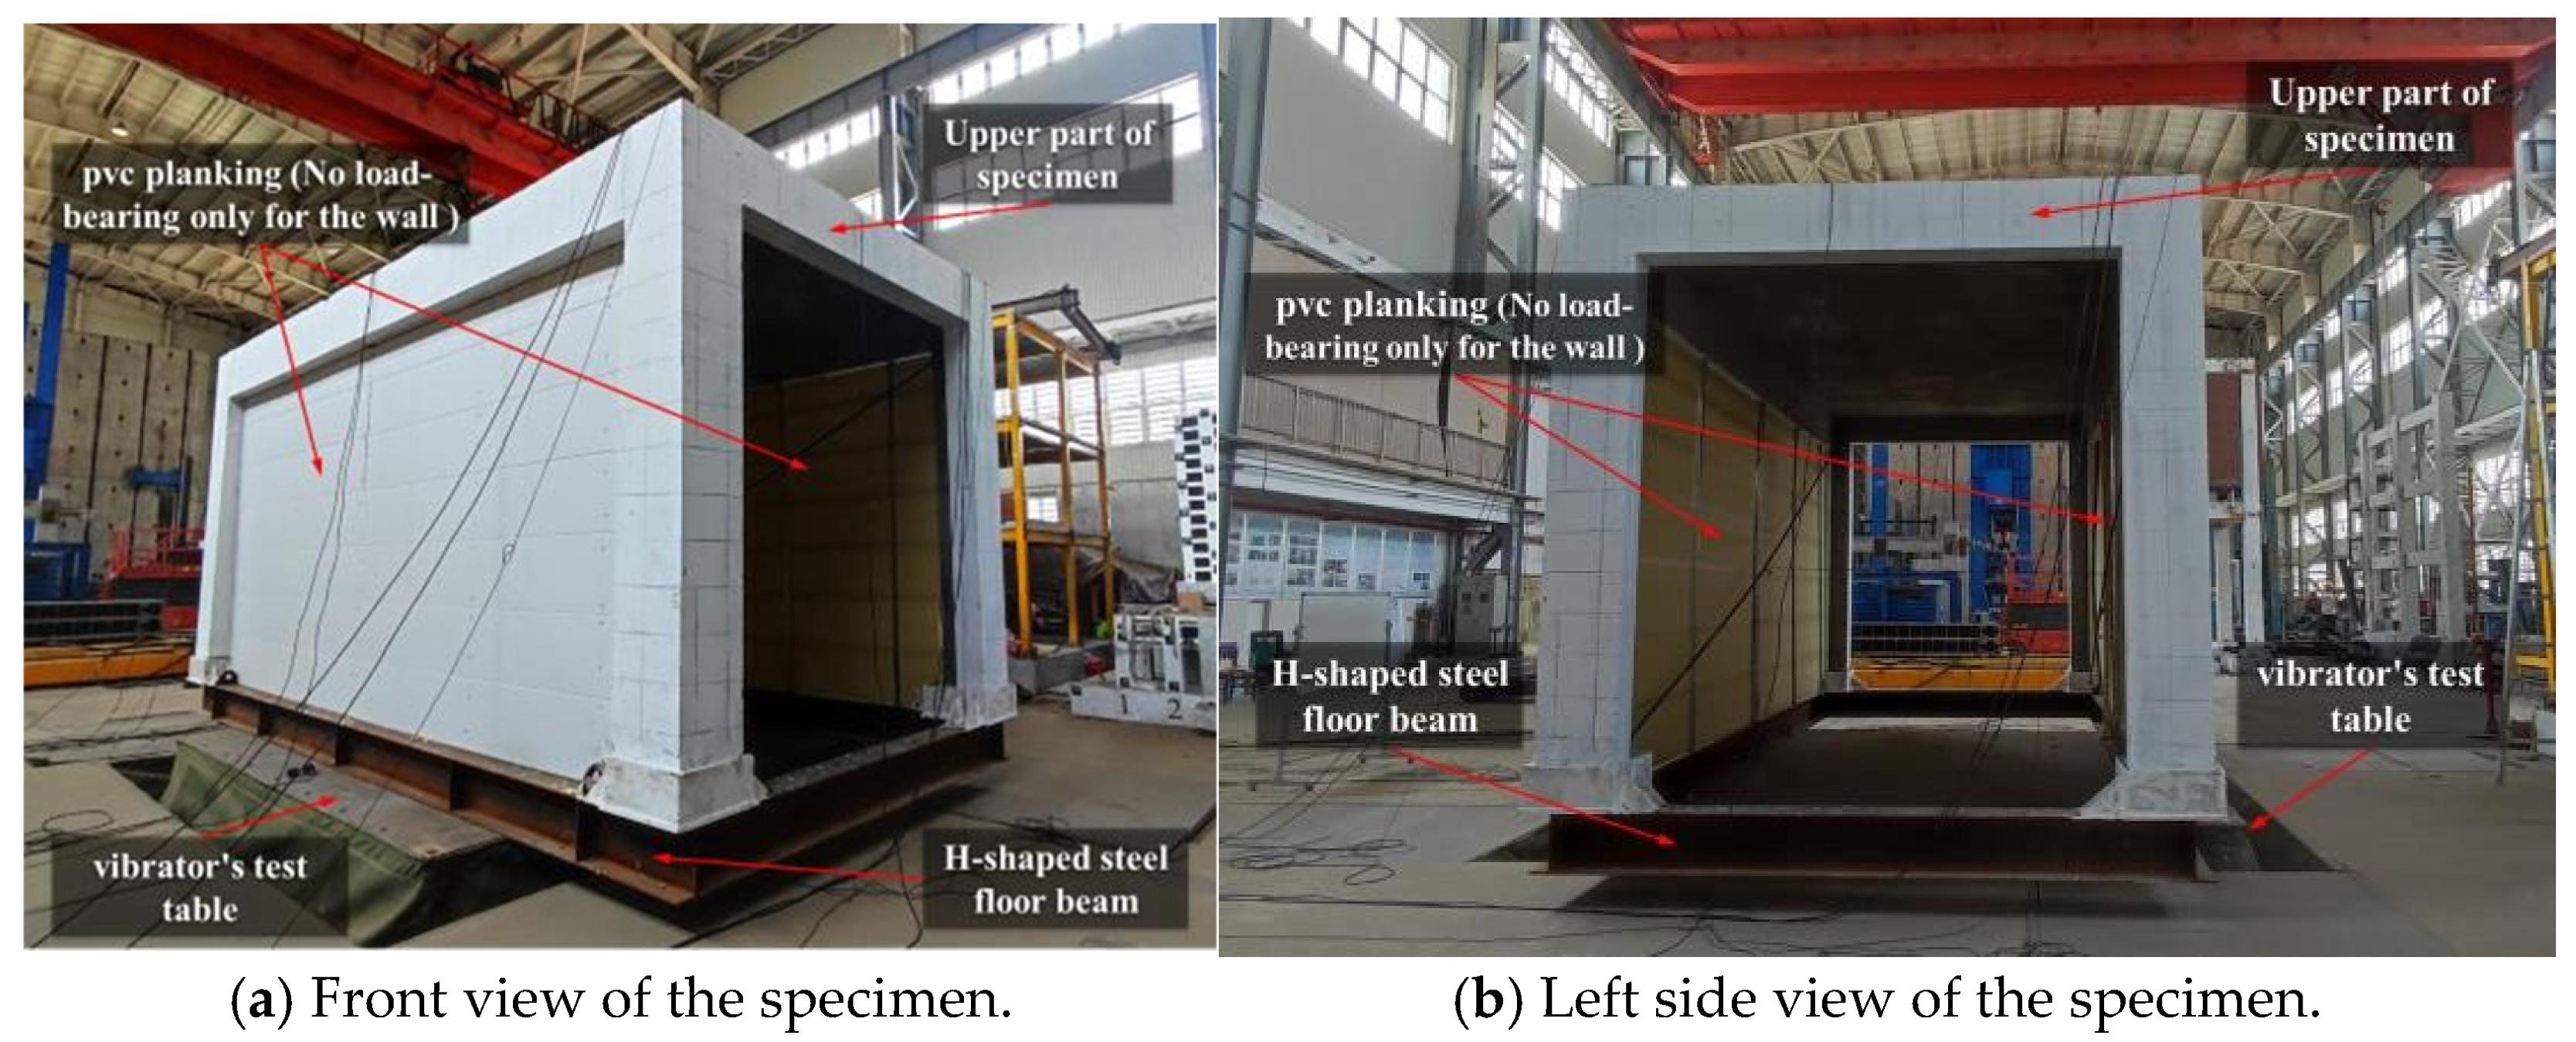
The prototype is a unit precast special-shaped column reinforced concrete house, and a specimen is designed and manufactured on a full scale. The seismic fortification intensity of the specimen is 7, the basic seismic acceleration is 0.15 g, the seismic group is second, the site category is the second class, and the characteristic period is 0.40 s. The specimen adopts the concrete frame structure of a special-shaped column without a lift plate, as shown in Figure 1.
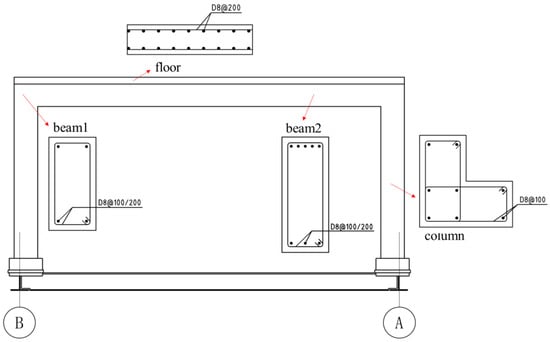
Figure 1.
Structure diagram of the specimen.
The specimens are made of H-beam foundation [16], whose size is 300 × 200 × 12 × 8, and Q235 steel, which can meet the bearing capacity requirements of the model when hoisting. Vertical holes are reserved for H-shaped steel according to the distance between the anchor holes of the shaking table, and anchor bolts are reliably connected to the vibrating table.
The specimen is 3300 mm in the opening direction, 6600 mm in the depth direction, and 3100 mm in height. It is equipped with an H-shaped steel ground beam with a total weight of 17 t and L-shaped columns. The parameters of the specimen are shown in Table 1. The length of the superstructure in the depth direction of the model is 7.1 m (the net distances of the left and right distances are 3.7 m and 2.0 m, respectively). Two ends are L-shaped section columns, and the middle is an I-shaped section column. In the loading direction, the section height is 500 mm and 400 mm, respectively, the limb thickness is 200 mm, and the flange width of the L-column at the end is 600 mm. The heights of the first and second floors are 3.26 m and 3.00 m, respectively, and the height of the frame beam is 400 mm. The beams, plates, and columns of the specimens were all made of C35 strength grade concrete, and the model was made of ready-mixed concrete as a whole, with a strength grade of C35.

Table 1.
Structural parameters of the specimens.
During the post-pouring of all prefabricated and connected areas, a 150 mm side length cube test block with the same curing conditions shall be reserved. When loading, the measured compressive strength of the concrete cube in the precast member and the joint after the pouring area is 30.6 MPa and 36.5 MPa, respectively. The longitudinal reinforcement and stirrup of each precast member are HRB400 grade, and the mechanical properties of the reinforcement are shown in Table 2.
Table 2.
Mechanical properties of rebar.
2.2. Test
2.2.1. Model Making
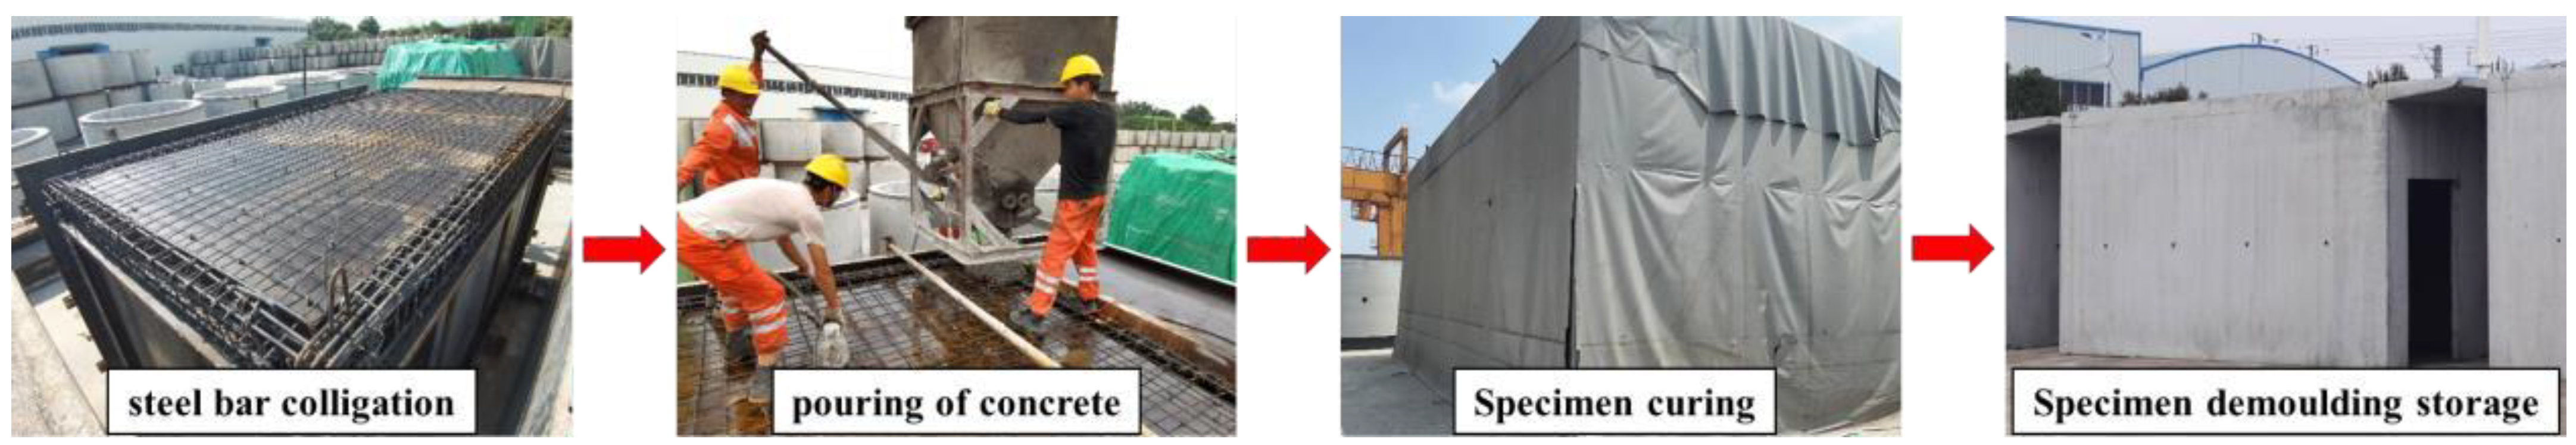
The specimen was cast as a whole and finished in the factory. After reaching the lifting and transshipment strength, it was transported to the loading site for a loading test. The process is shown in Figure 2. The model adopts pre-mixed concrete integral pouring, the strength grade is C35, and the impermeability grade is P8. After pouring, cover it, and steam-cure for 1 h after pre-curing. During steam-curing, the temperature and humidity should be strictly controlled. Demoulding was carried out when the concrete compressive strength of the specimen reached 75% of the design value and was not less than 15 N/mm2. After demoulding, the components were placed in the spray curing area and transported to the storage yard after 14 days of spray curing. Because the specimen was cast as a whole, only the connection with the ground beam needed to be completed during assembly. Before assembly, chisel the concrete at the joint surface between the column end face and the ground beam and rinse it clean with a high-pressure water gun. Then, the column root area was sealed and maintained after being straightened and fixed with diagonal bracing. When the edge sealing material met the strength requirements, the cement-based grouting material was injected with pressure grouting. Until each reserved grouting outlet uniformly flows out the grouting material, the sealing and curing are performed for 24 h.
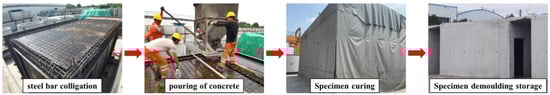
Figure 2.
Specimen-making process.
2.2.2. Sensors and Data Acquisition
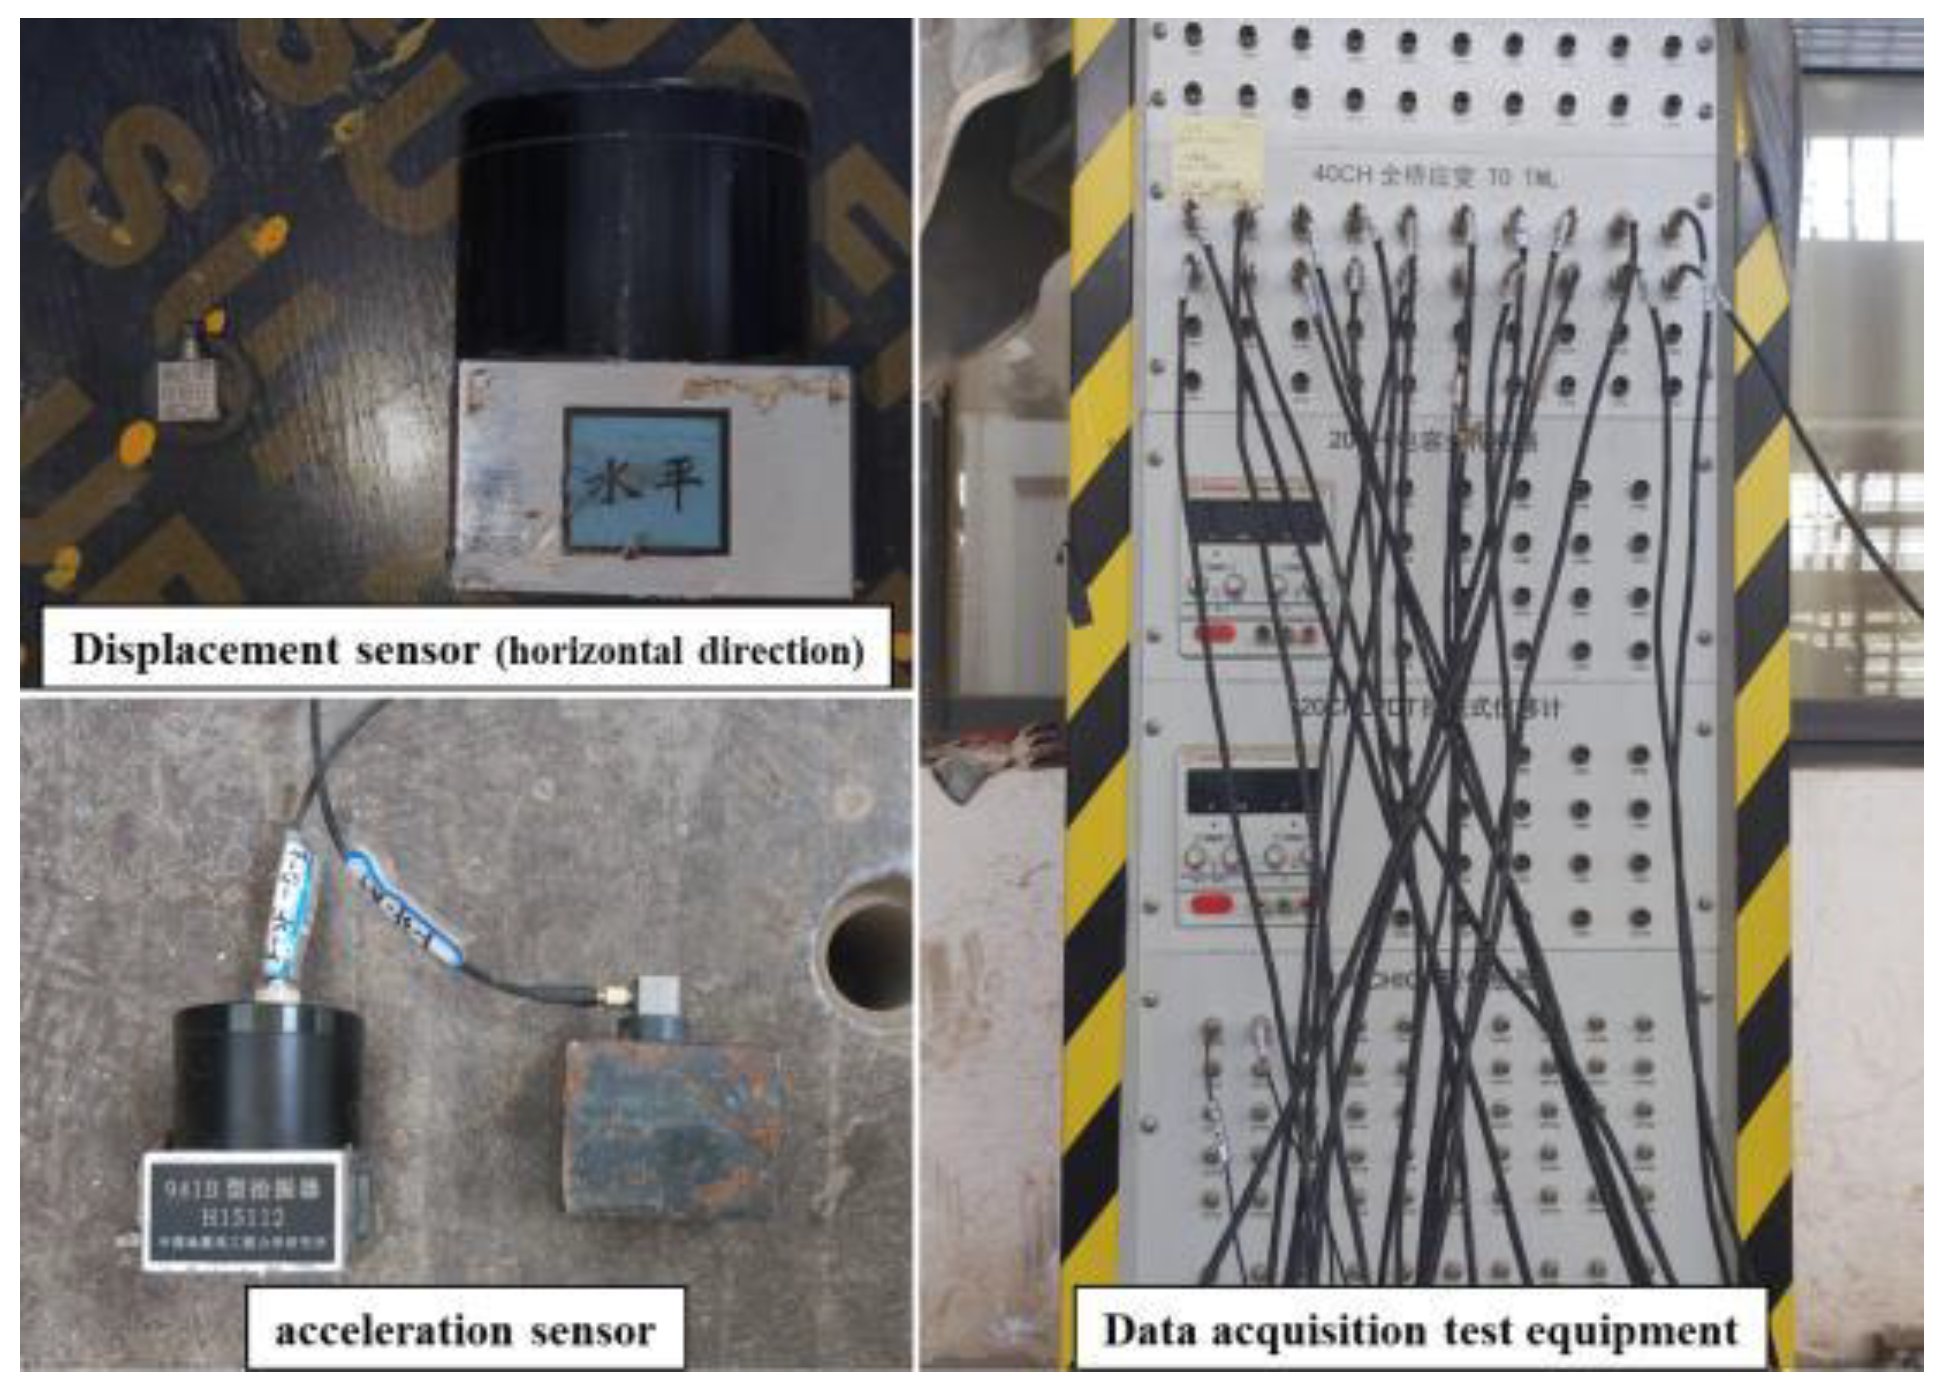
The main equipment is shown in Figure 3. Using a 4 m × 4 m three-dimensional six-degrees-of-freedom seismic simulation shaking table test system produced by MTS in the United States. The main technical indicators of the shaking table system are shown in Table 3, and the basic structure of the shaking table system is shown in Figure 4.
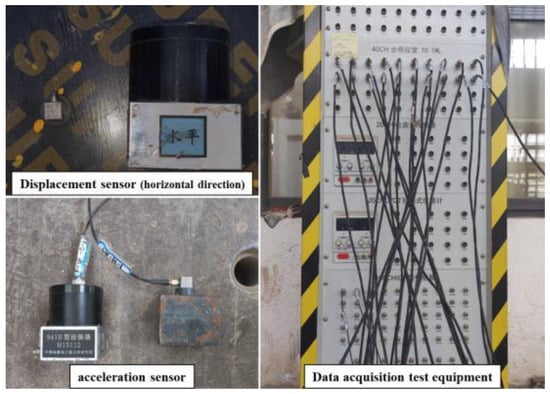
Figure 3.
Test equipment.
Table 3.
Vibration table system main technical indicators.
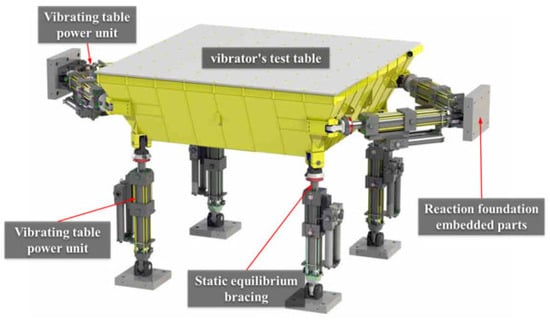
Figure 4.
Shake table.
Figure 5 is the loading site. The simulated seismic shaking table test was carried out in the Shaking Table Laboratory of the Structure and Seismic Resistance Laboratory, Xi’an University of Architecture and Science and Technology.
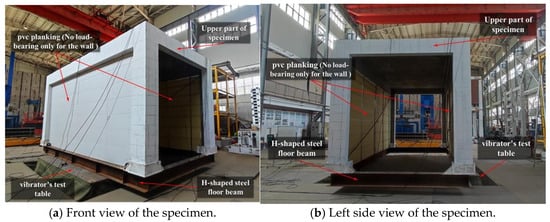
Figure 5.
Photographs of entire test set-up.
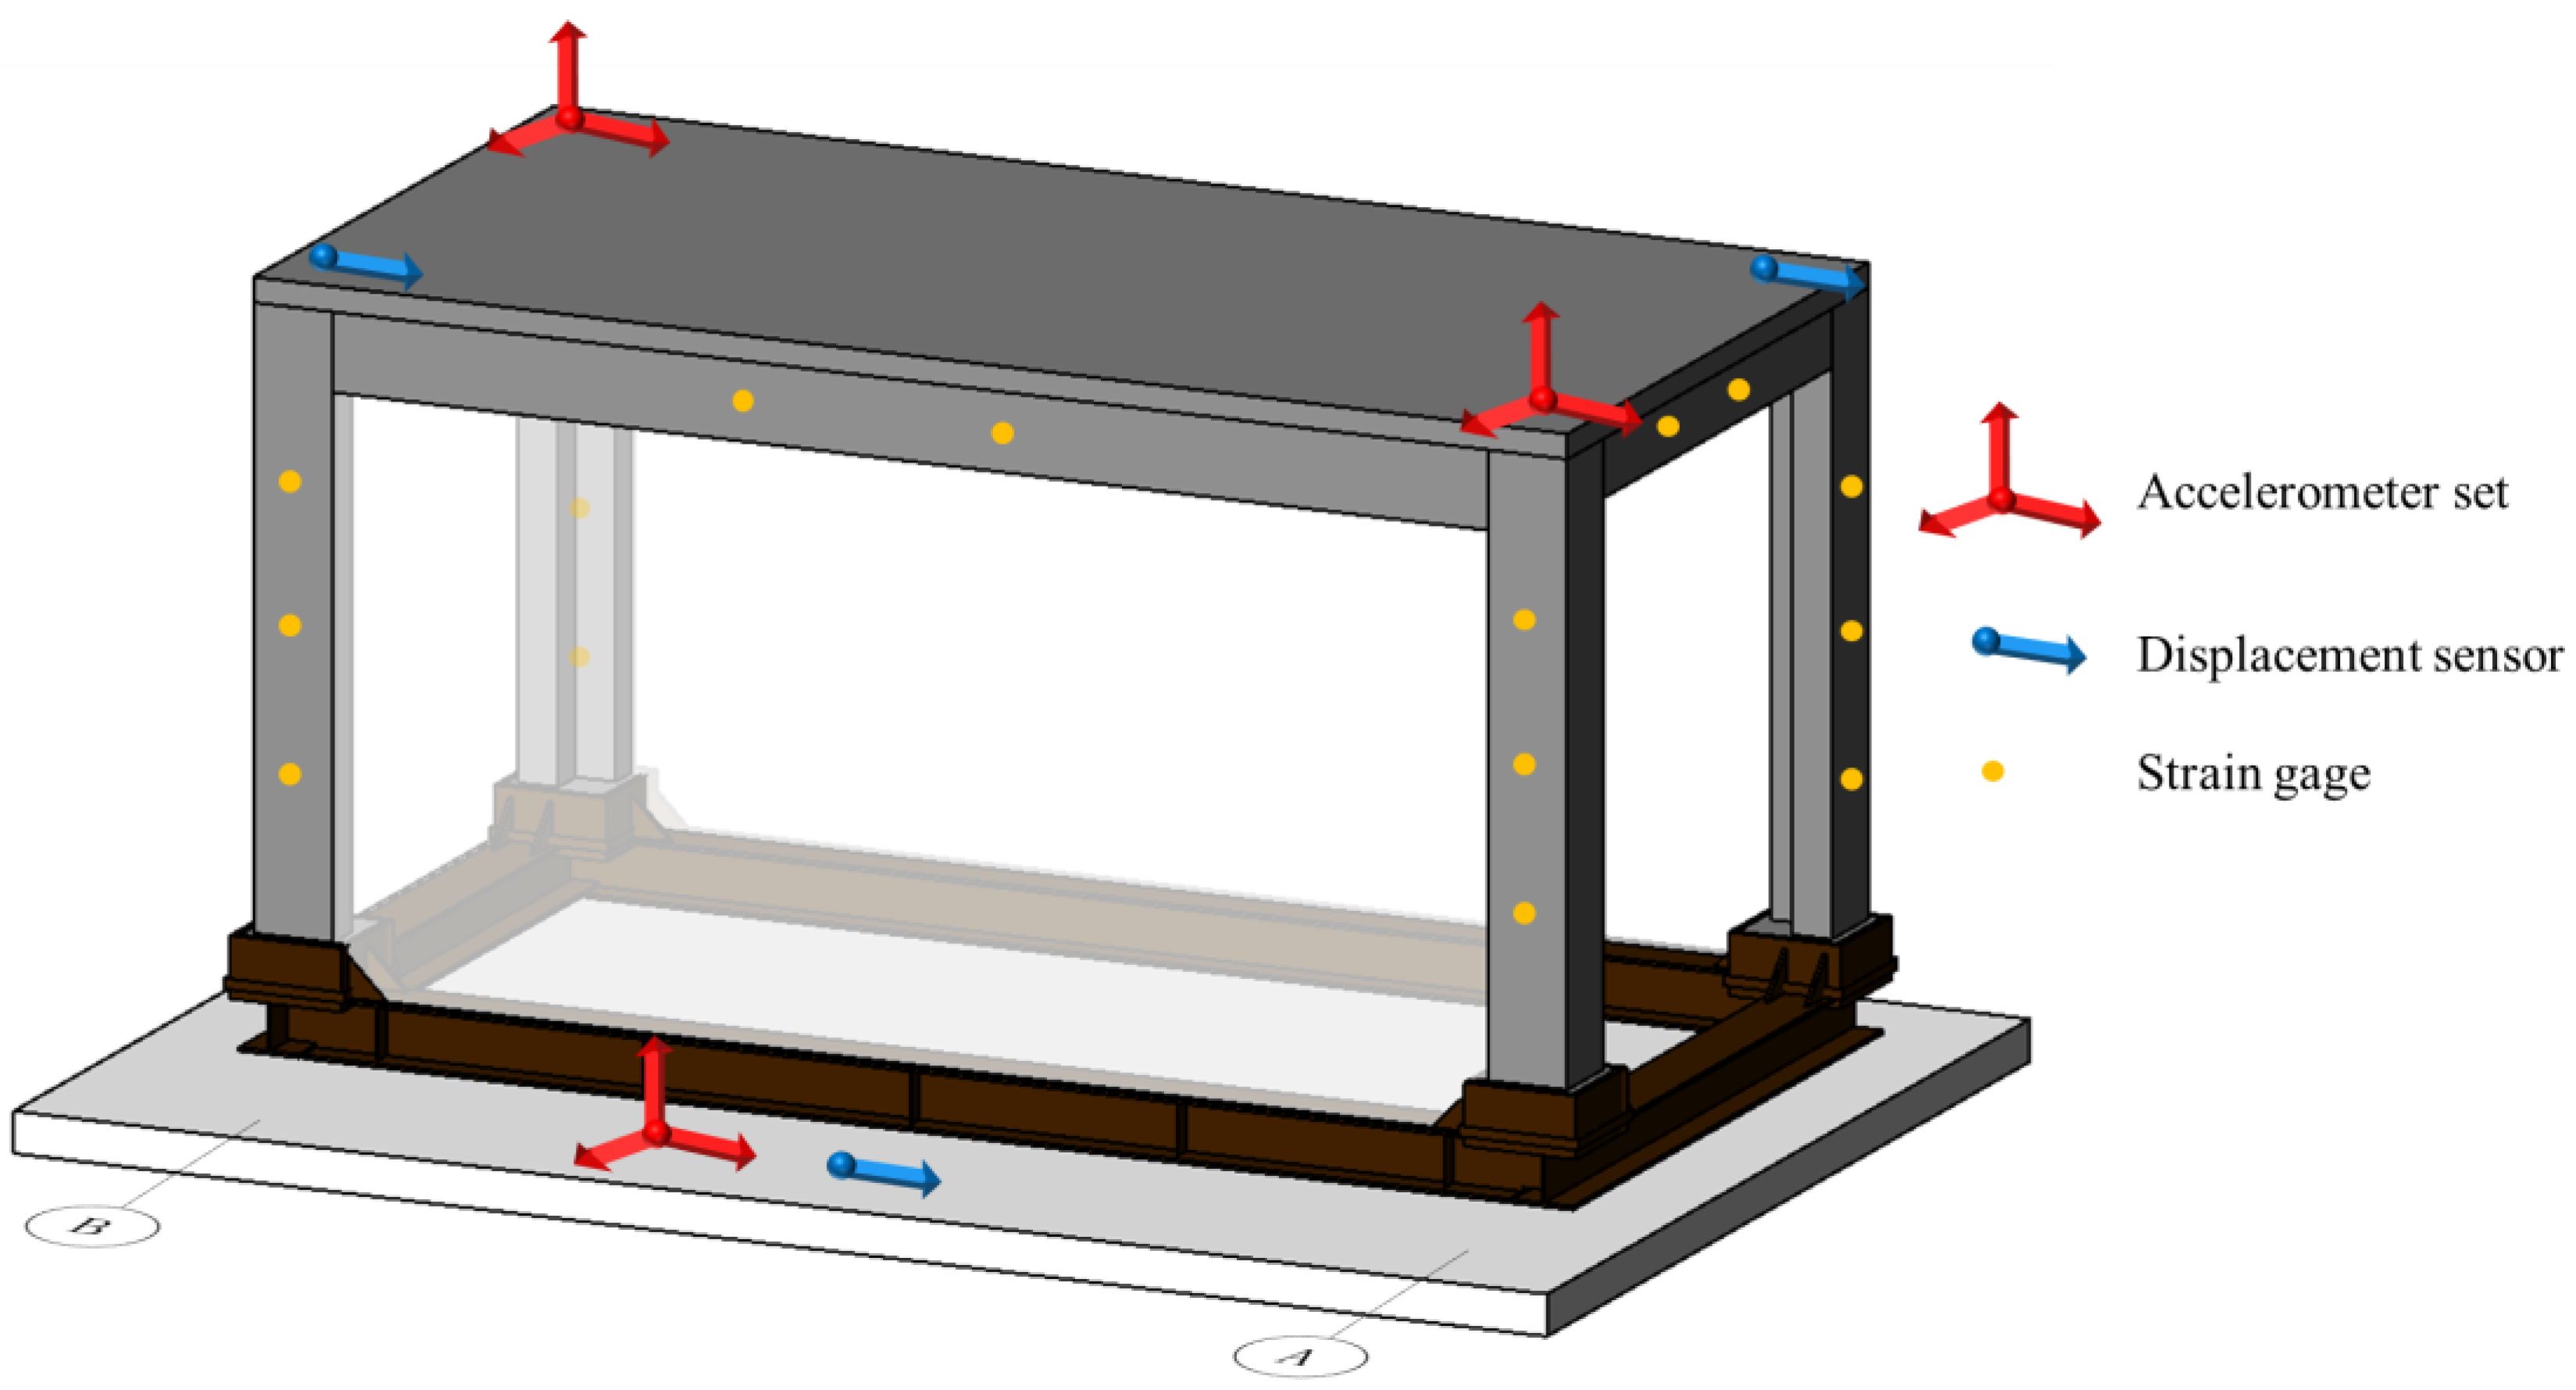
During loading, structural strain, displacement, and acceleration are collected. Longitudinal reinforcement strain measurement cross sections are arranged at the lower part of the column, and 3 strain gauges are set for each column, a total of 12. The longitudinal reinforcement strain measuring cross-section is arranged in the beam, and each beam is equipped with 2 strain gauges, for a total of 8 strain gauges. Two displacement sensors are arranged diagonally at the beam-column nodes 1/A and 2/B along the long axis of the frame to monitor the development of the frame’s lateral displacement when seismic waves are input. A displacement sensor is arranged on the shaking table surface to monitor the displacement of the table surface when the seismic wave is input. Two acceleration sensors are arranged diagonally on the beam-column nodes 1/B and 2/A in the direction of the long axis of the frame to monitor the dynamic response of the frame acceleration when the seismic wave is input. An acceleration sensor is arranged on the surface of the shaking table to monitor the acceleration of the table when a seismic wave is input. The location of the measuring points is shown in Figure 6, and the data are collected synchronously by the LMS dynamic data acquisition subsystem.
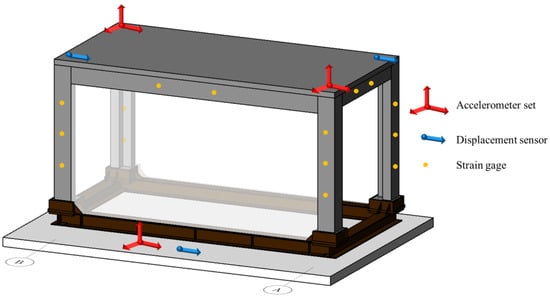
Figure 6.
Layout of measuring points.
2.2.3. Test Conditions
The specimens were input to the specimens in increments from small to large according to the seismic excitation corresponding to frequent seismic intensity and fortification seismic intensity, and unidirectional loading was carried out under each seismic wave. After the loading at the same level, the model was subjected to white noise sweeping processing to monitor the changes of structural dynamic performance indexes in real time. El Centro, Lanzhou Wave, and Taft were selected as seismic waves. The specific loading conditions are shown in Table 4, where ap is the peak acceleration. All these input levels (0.05 g, 0.10 g, and 0.15 g) meet the design basis and maximum considered seismic scenario defined in the seismic code, such as GB 50011 [17].
Table 4.
Test loading condition.
2.2.4. Experiment with Phenomena
During the S-1 phase, the structure experienced slight vibration, and no cracks were detected. In the S-2 stage, the vibration of the structure was enhanced, and no small cracks were found in the beams and columns. In the S-3 stage, the structure wobbles obviously, and a few small cracks appear. Throughout the entire process, the columns were intact, no concrete crushing occurred, the frame beams did not have cracks through the top and bottom of the beams, and the concrete frame beams were basically in an elastic state. It could be determined that the structure is still in the elastic state, and the good performance expected by the design has been achieved. The detailed experimental phenomena are recorded in Table 5.
Table 5.
Record of test phenomena.
2.3. Simulation
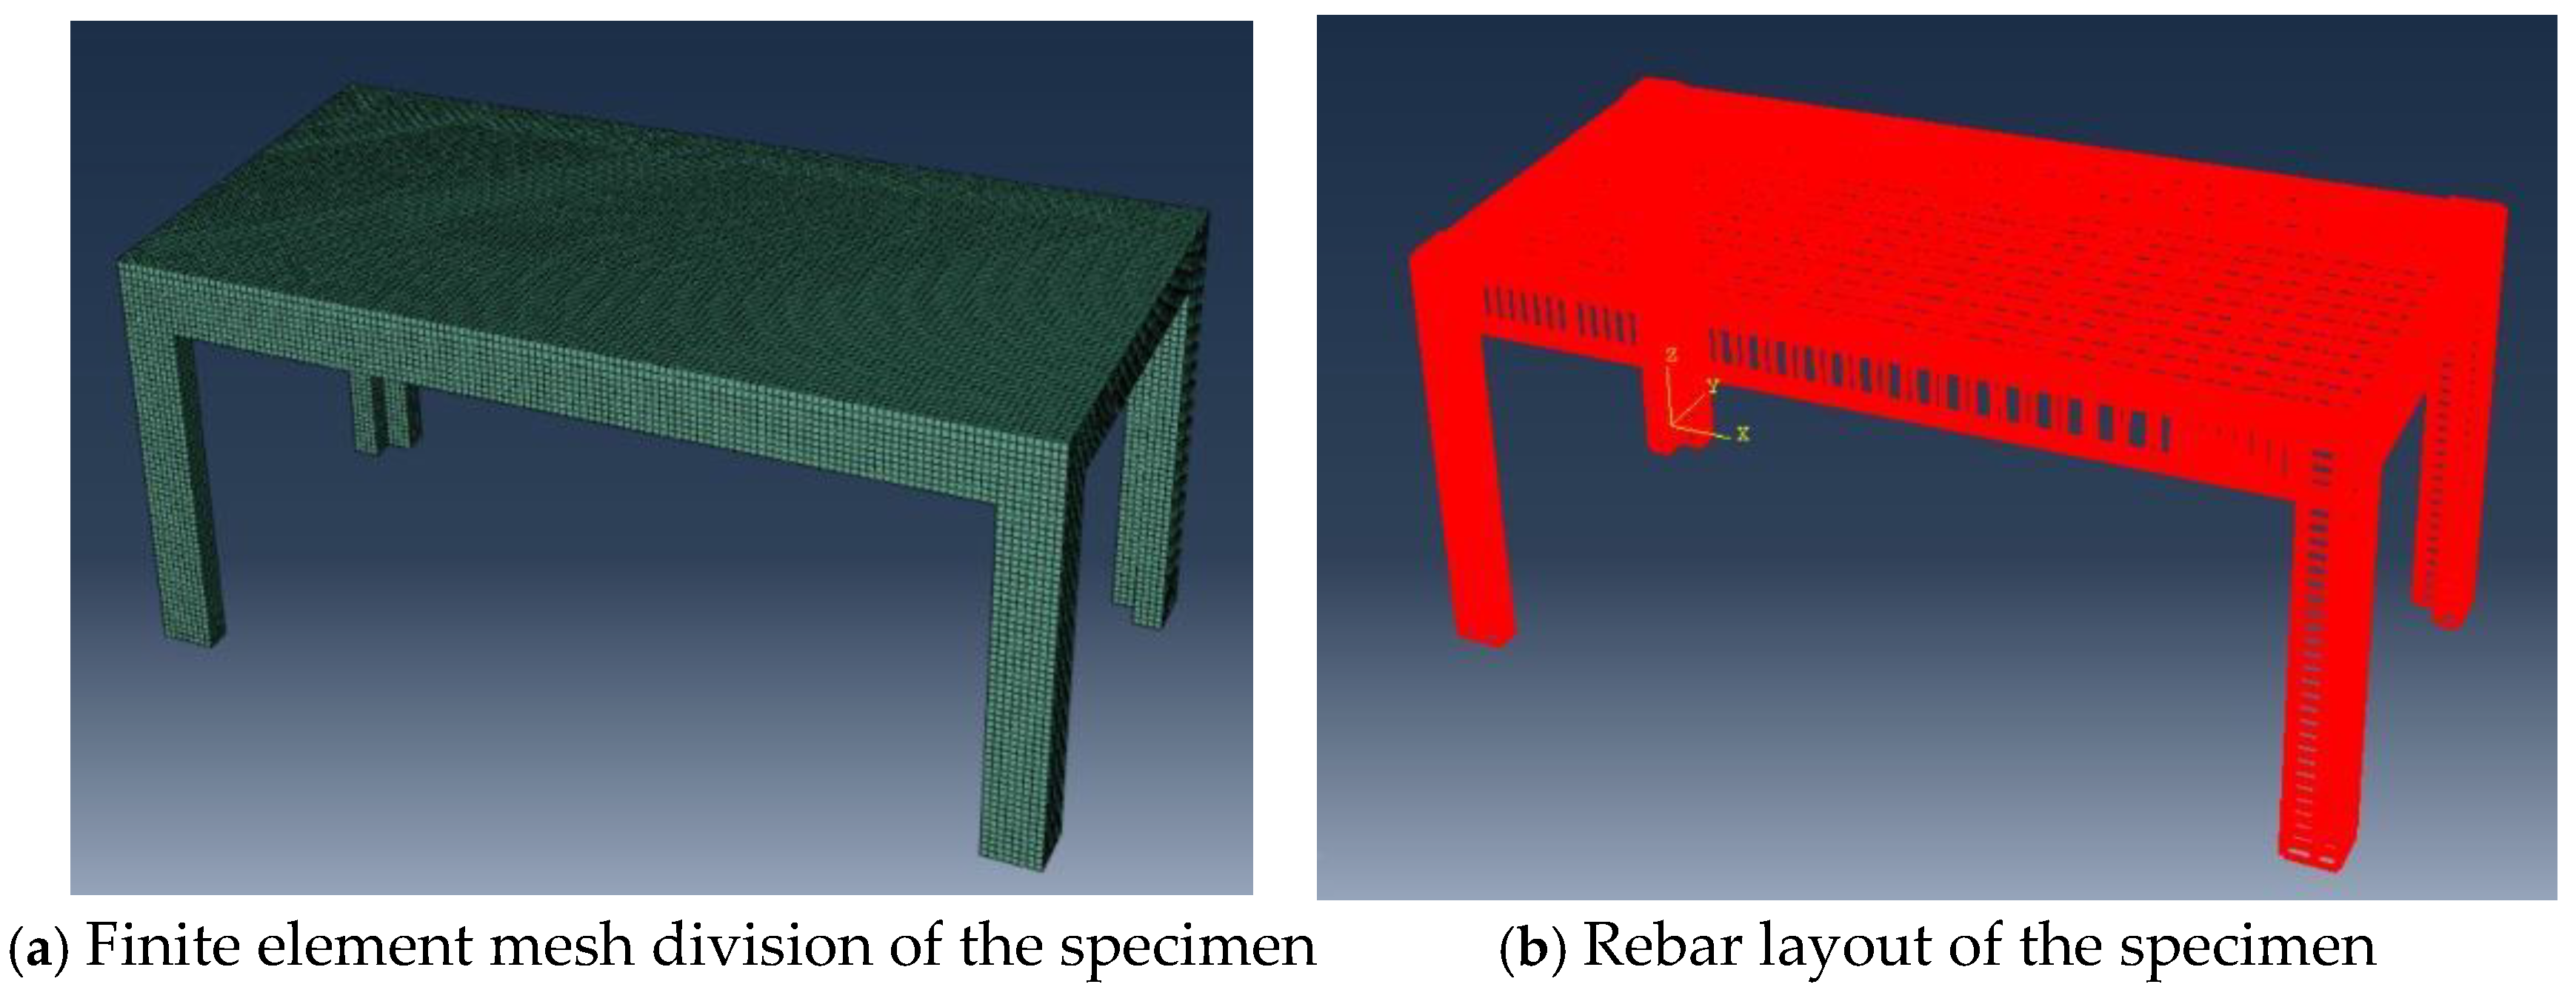
The three-dimensional model of the shaking table test was established in ABAQUS 2016, as shown in Figure 7a. In this study, the ABAQUS damage plastic constitutive model CDP (concrete damaged plastic) was used. The material constitutive model of reinforcement refers to the Giuffre–Menegotto–Pinto reinforcement hysteretic constitutive model proposed by Menegotto in 1973. Three-dimensional deformable entities are selected for concrete components to be modeled by stretching and sweeping, and longitudinal reinforcement and stirrup components are created by using three-dimensional deformable lines to define the relevant length. In order to improve the operation speed and convergence of the model and take into account the accuracy of the simulation results, three-dimensional deformable lines are selected for solid modeling. The concrete adopts the three-dimensional solid element c3d8r, the ordinary reinforcement adopts the space two node linear truss element t3d2, the reinforcement adopts the separated modeling method and the *embedded method to treat the ordinary reinforcement embedded in the concrete as a rigid connection, and the reinforcement and the concrete unit share the same node. The total number of nodes is 95,171; the total number of units is 68,789. Considering the slow operation speed of ABAQUS finite element software, the finite element model was simplified when modeling the framework to reduce unnecessary operations and improve the running speed and convergence of the model. The frame model is simplified as follows. By simplifying the force transmission of the joint connection section from the I-shaped steel socket head, steel connecting plate and bolt assembly to the integration of two I-shaped steel sockets, omitting bolts and connecting plate, unnecessary contact and a large number of bolt preload loads are reduced. The dynamic elastoplasticity of the structural test model during the test is simulated by the *amplitude command using the coupling method of reference point and loading surface. According to the calculation and analysis of the loading conditions of the shaking table test, different seismic waves are loaded step by step, and the finite element calculation and analysis are carried out. The finite element model of the specimen and the reinforcement layout in the calculation model are shown in Figure 7b.

Figure 7.
Finite element mesh diagram.
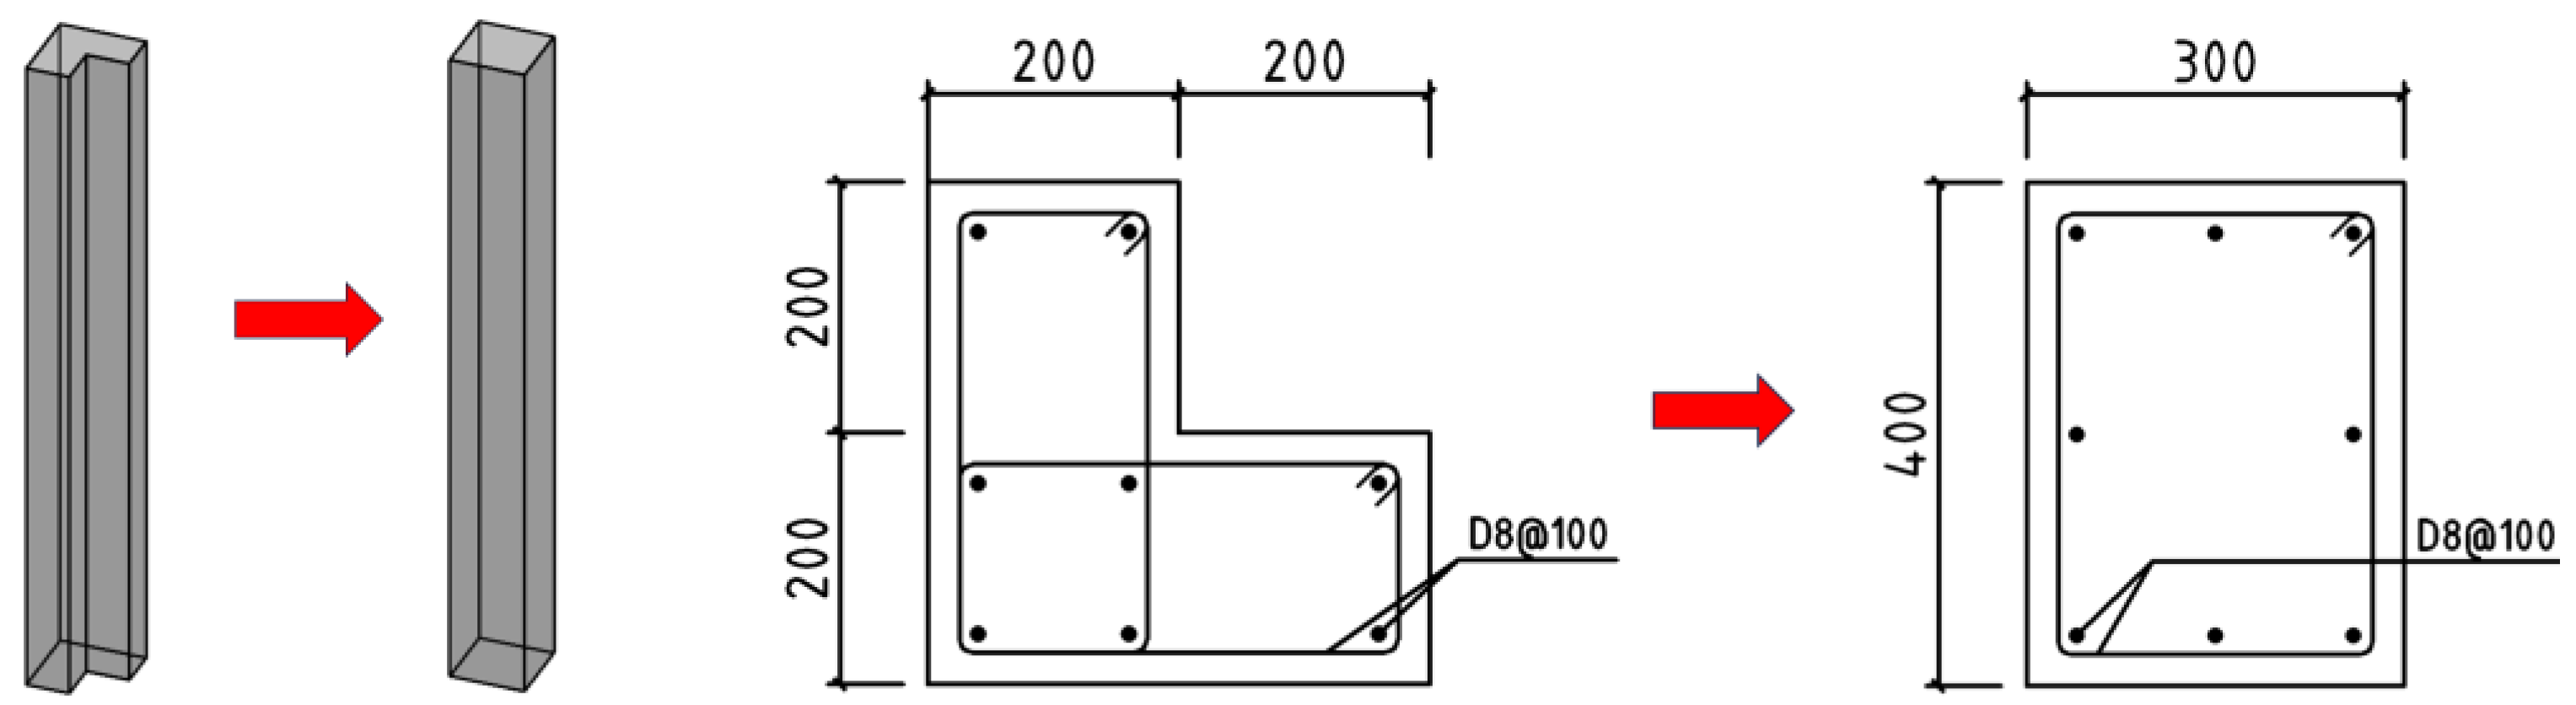
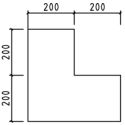
To further evaluate the seismic performance of L-shaped columns in unitized precast concrete structures, a rectangular column unitized precast concrete model was established with a rectangular cross-sectional area equal to the L-shaped column cross-sectional area and a cross-sectional size of 300 mm × 400 mm. The specific size changes can be seen in Figure 8. The earthquake level is increased to 9.
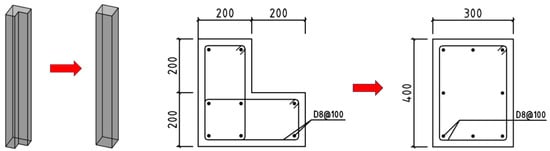
Figure 8.
L-shaped column and rectangular column.
3. Results
3.1. Test Result
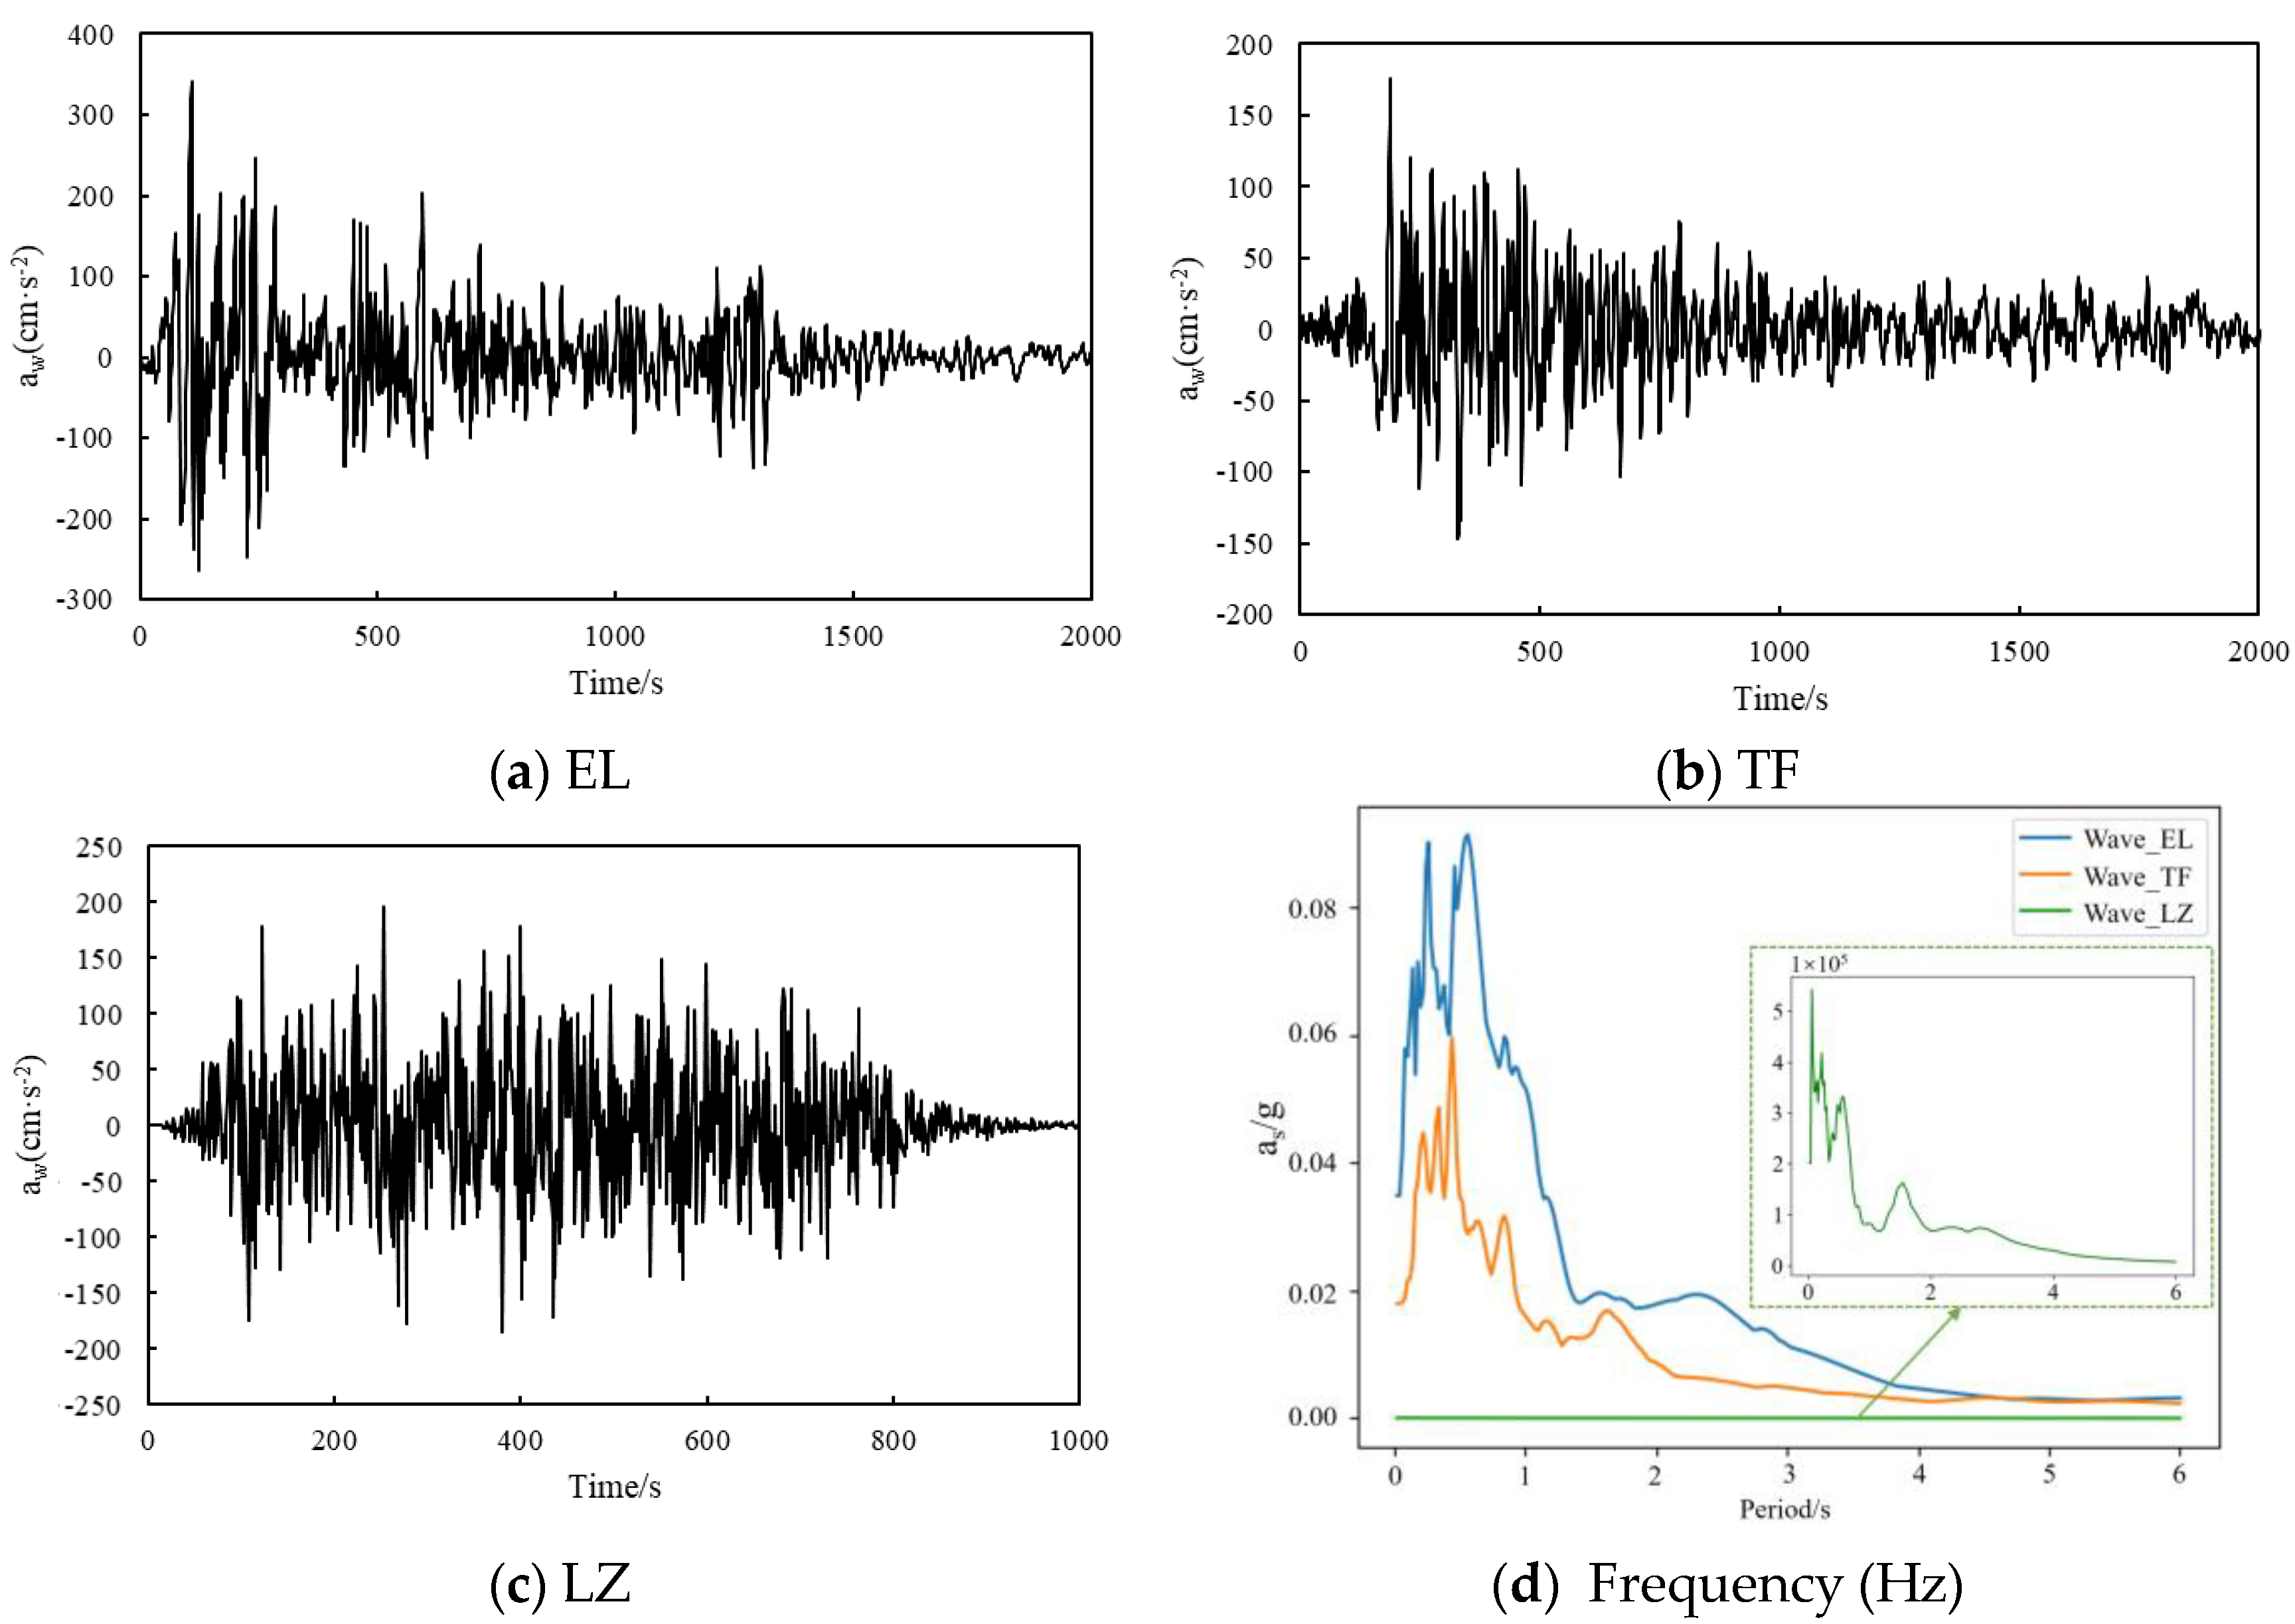
3.1.1. Acceleration Response
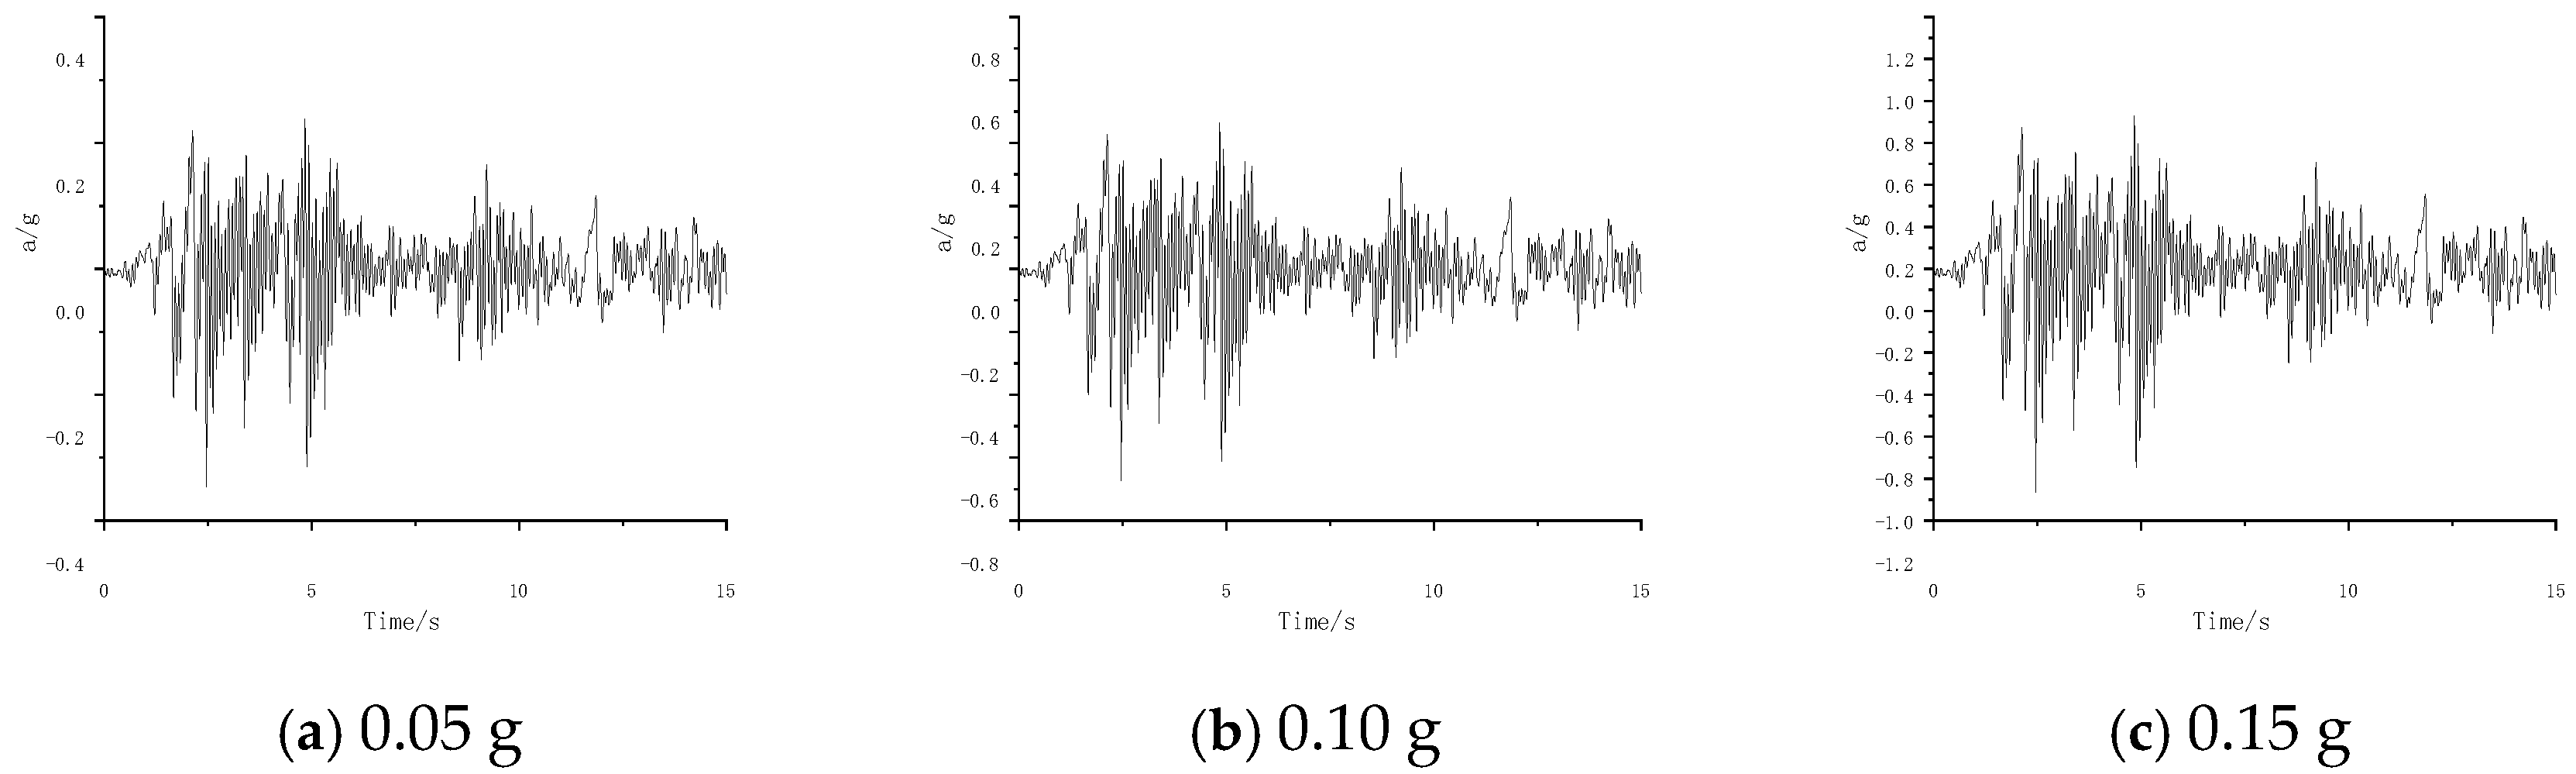
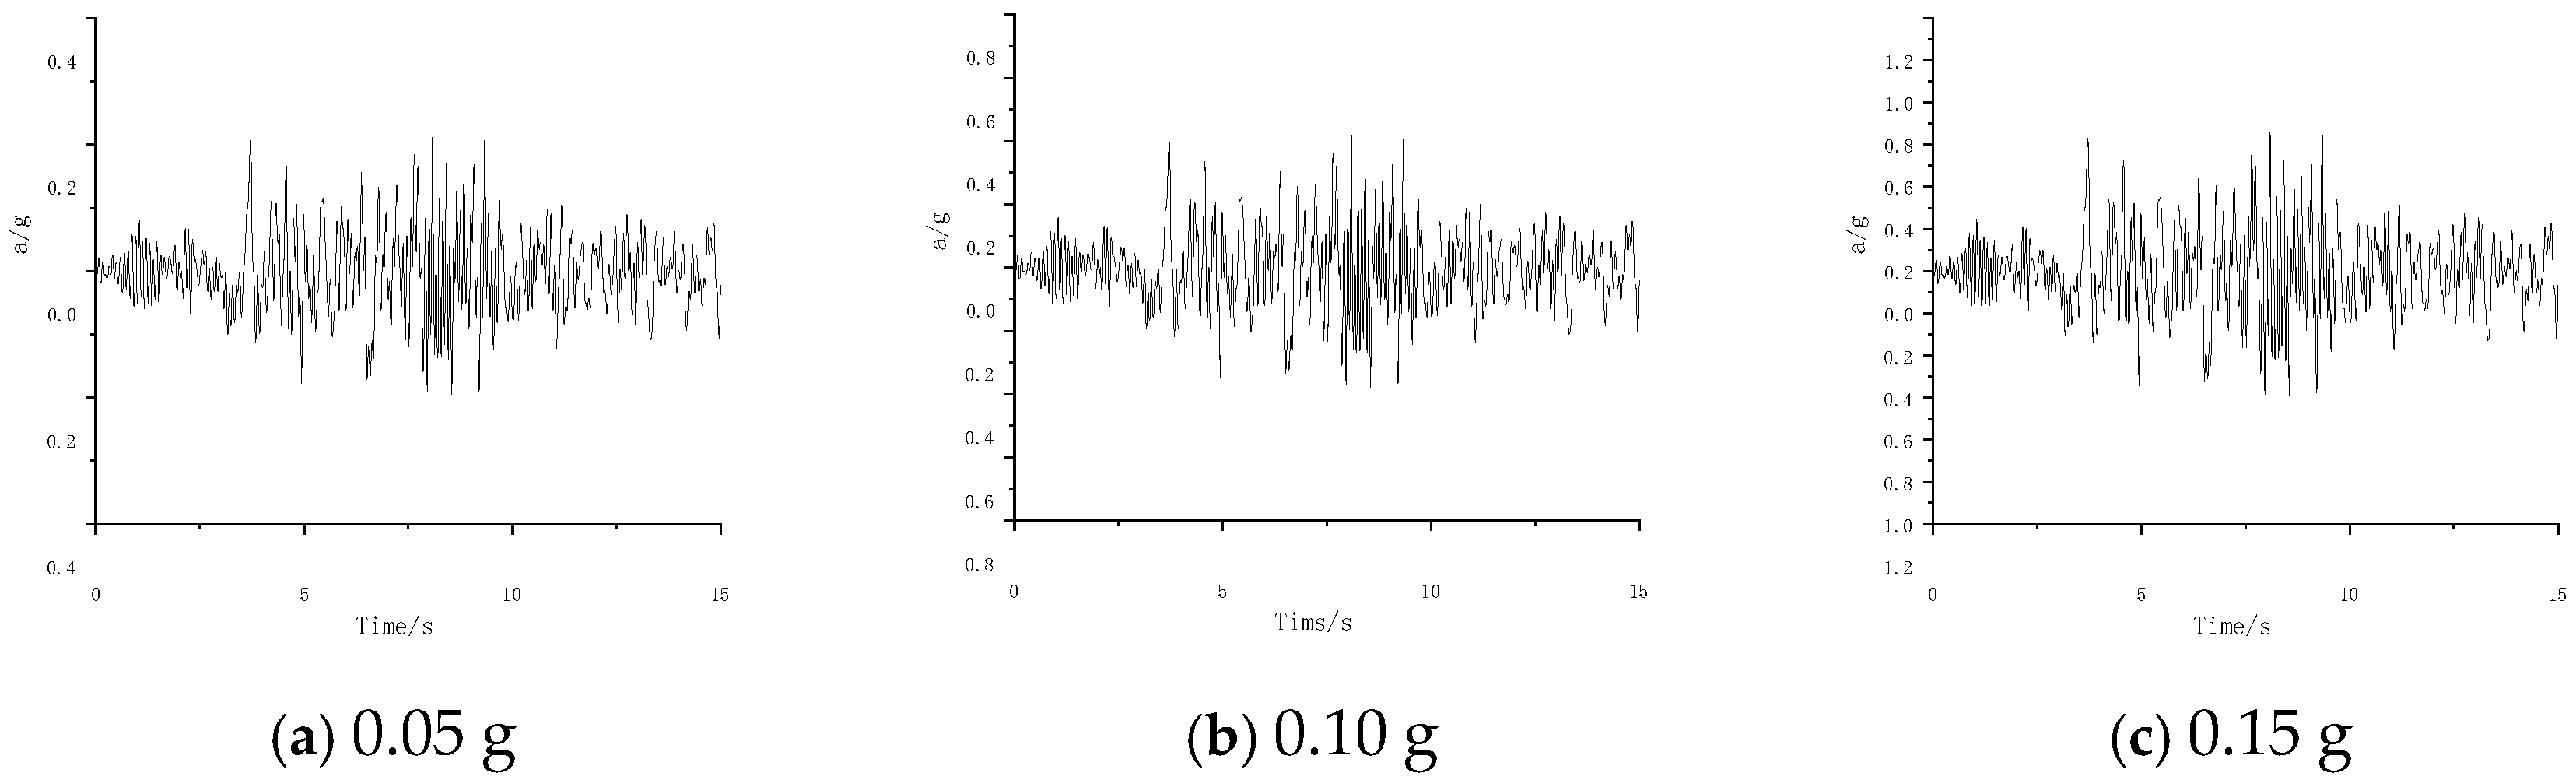
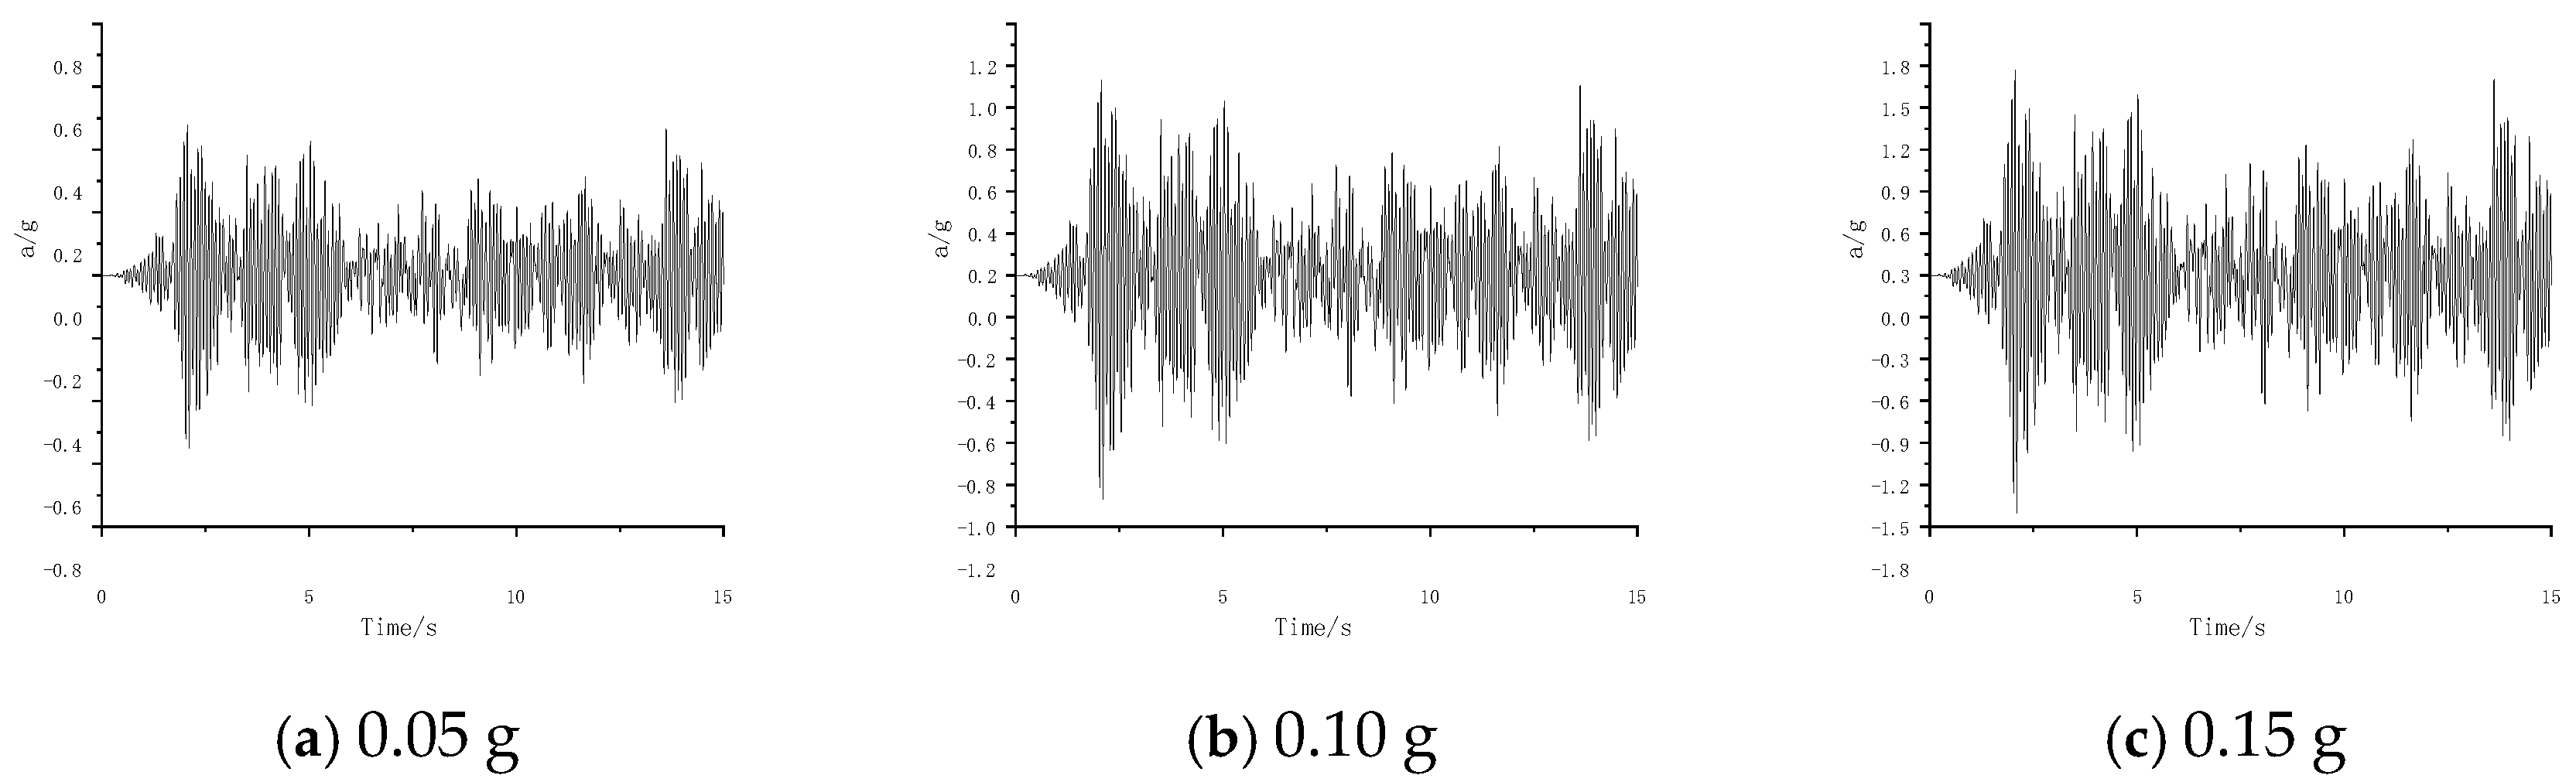
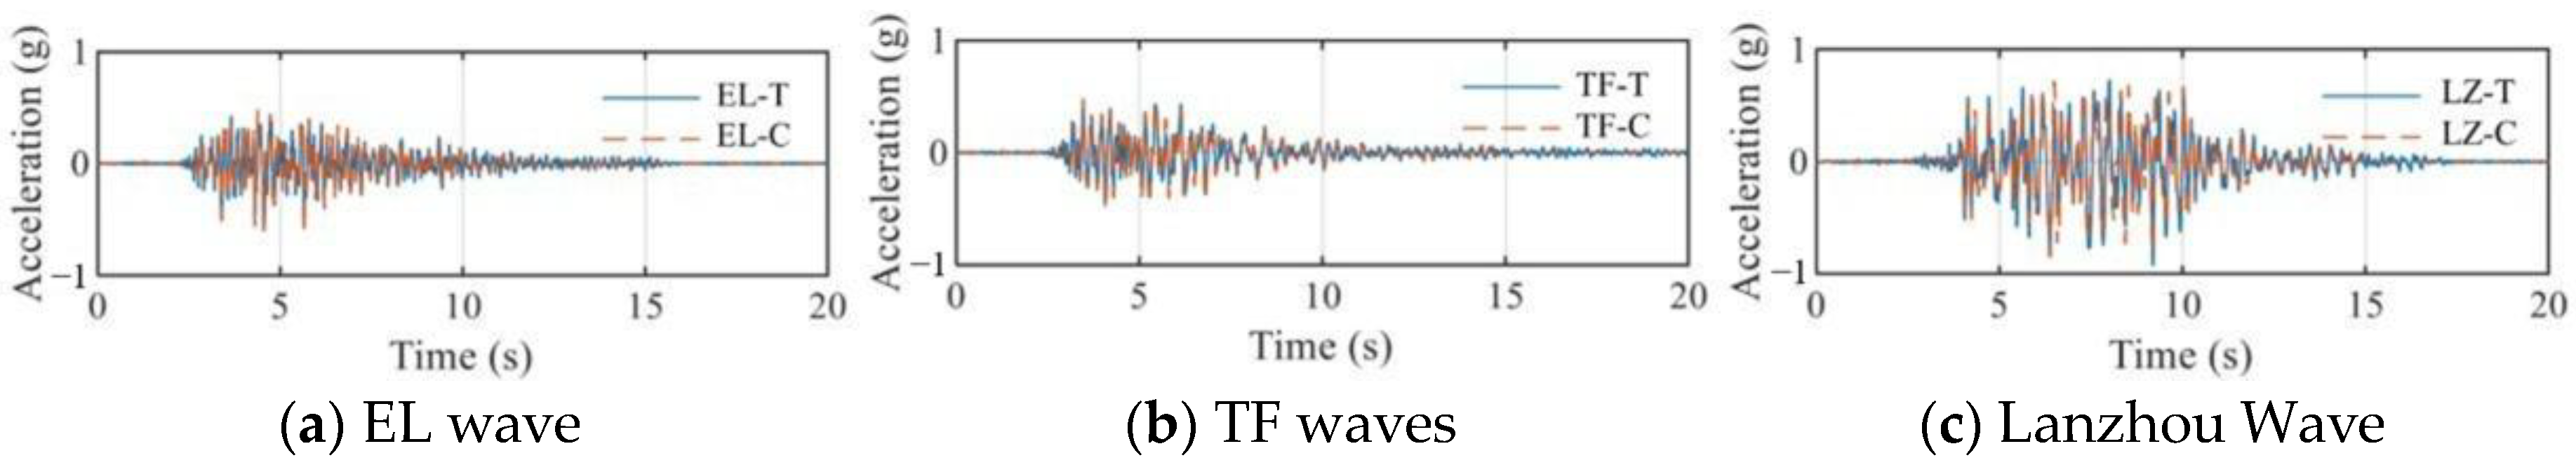
The shaking table test of the structure under the action of the El Centro wave, TF wave and Lanzhou wave was carried out, and the acceleration time history curve was obtained, as shown in Figure 9, Figure 10 and Figure 11. As can be seen from Figure 9, Figure 10 and Figure 11, under the action of different seismic waves, the intense range of the acceleration response of the model structure is basically the same as that of the input seismic wave, and all of them are concentrated near the peak value of the input acceleration. As the intensity of the seismic wave weakens, the response of the structure also gradually decreases.

Figure 9.
Time history curve of EL accelerogram acceleration.
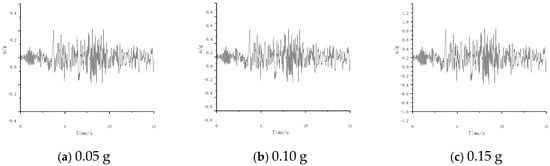
Figure 10.
Time history curve of TF accelerogram acceleration.
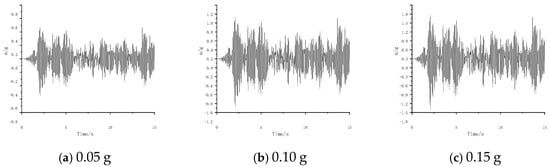
Figure 11.
Time history curve of LZ accelerogram acceleration.
3.1.2. Displacement Response
The stress of columns and beams in the structure increases with the increase of the input of seismic excitation and reaches the maximum value when the seismic fortification intensity is 0.15 g. The stress of the rebar increases linearly with the increase of seismic fortification intensity. As shown in Table 6, the maximum inter-story displacement angle of the structure under the excitation of each wave is 1/2541 (0.05 g), 1/1273 (0.10 g), and 1/947 (0.15 g) under the action of seismic fortification, respectively, which meets the requirement that the inter-story displacement angle is less than 1/550.
Table 6.
Response of interstory displacement angle.
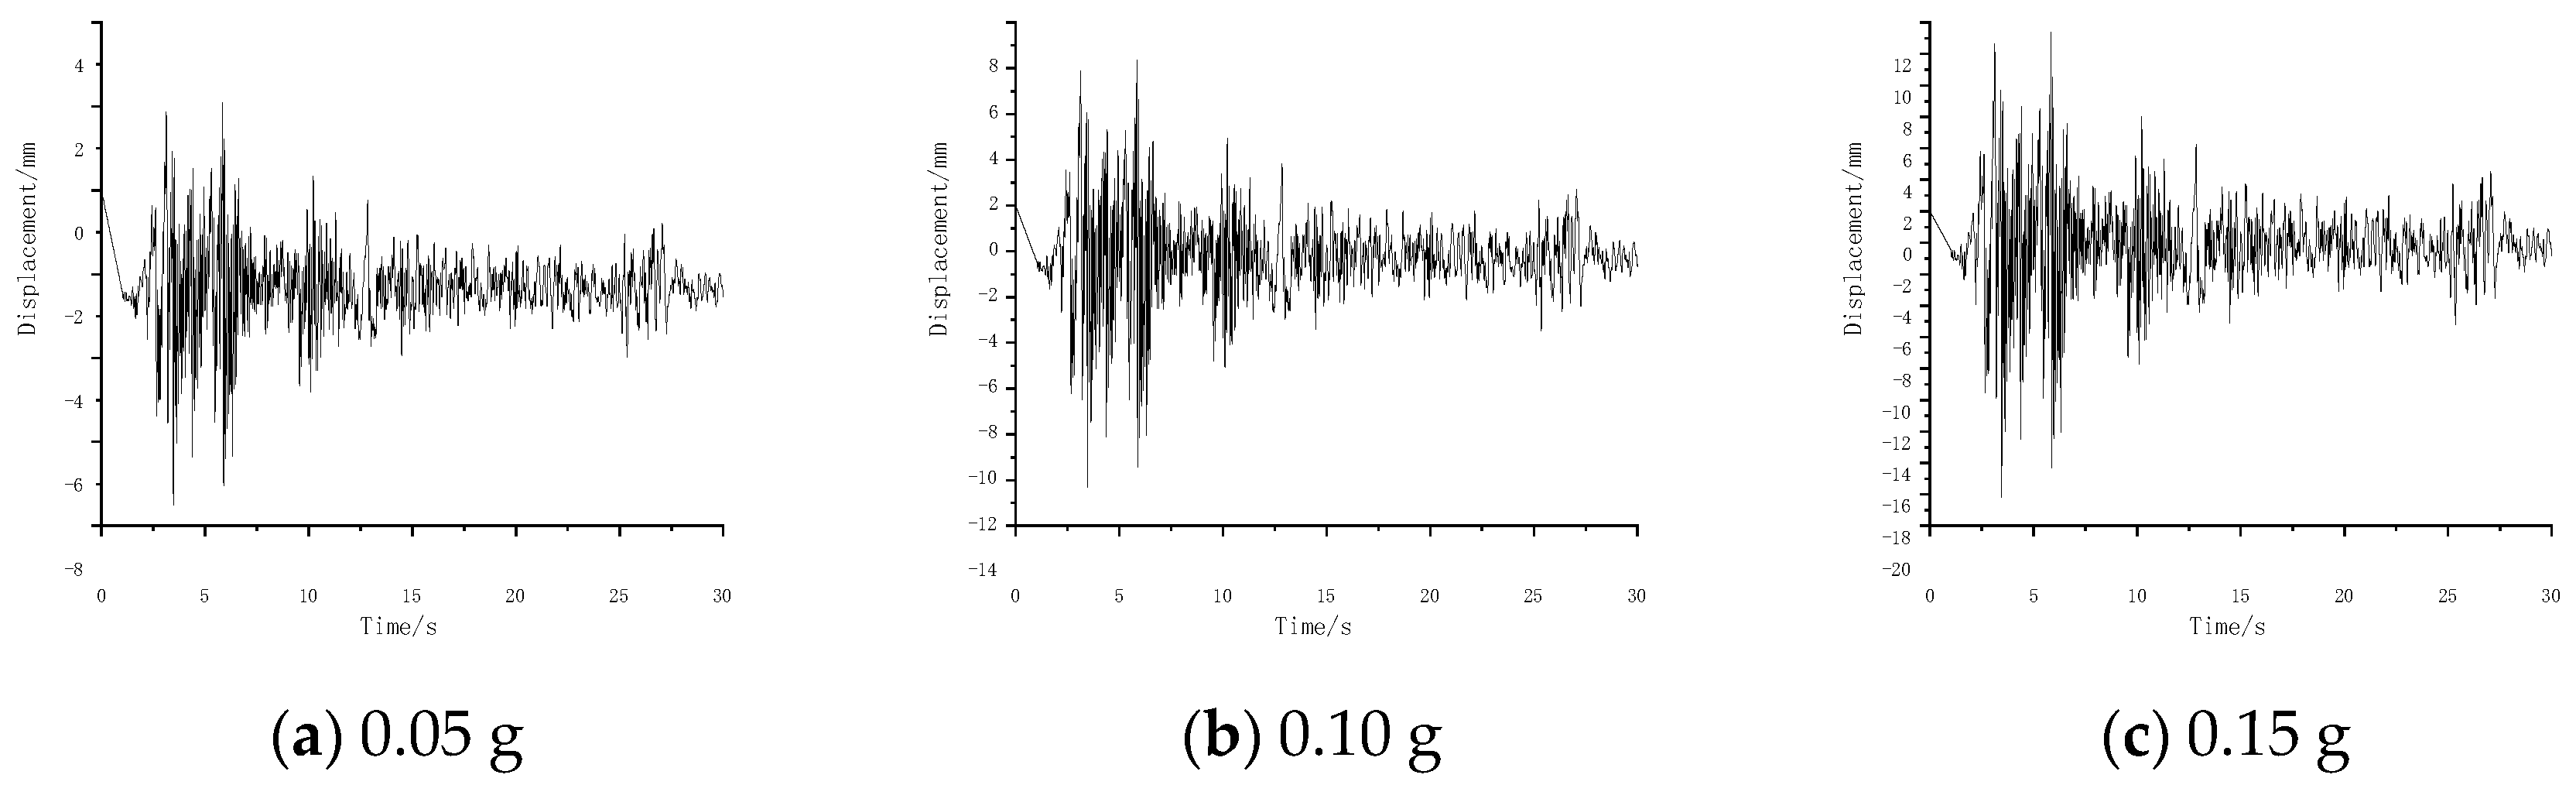
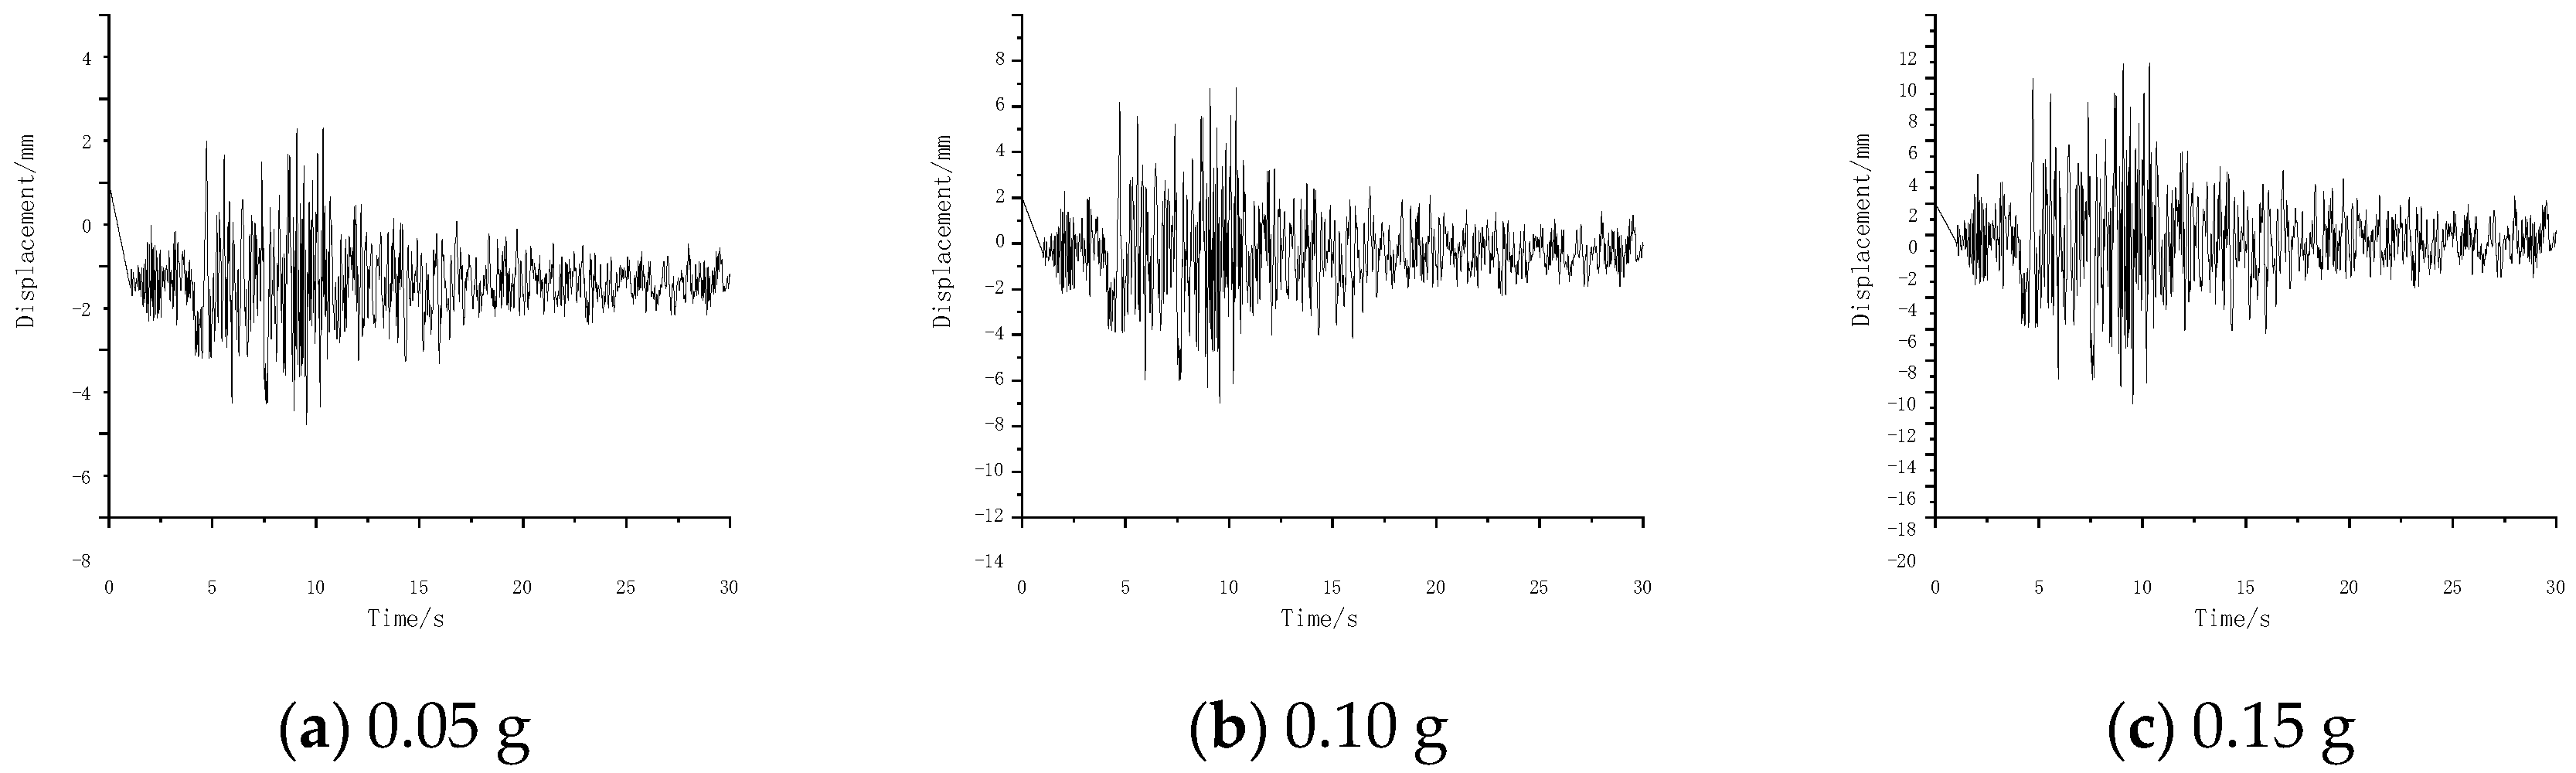
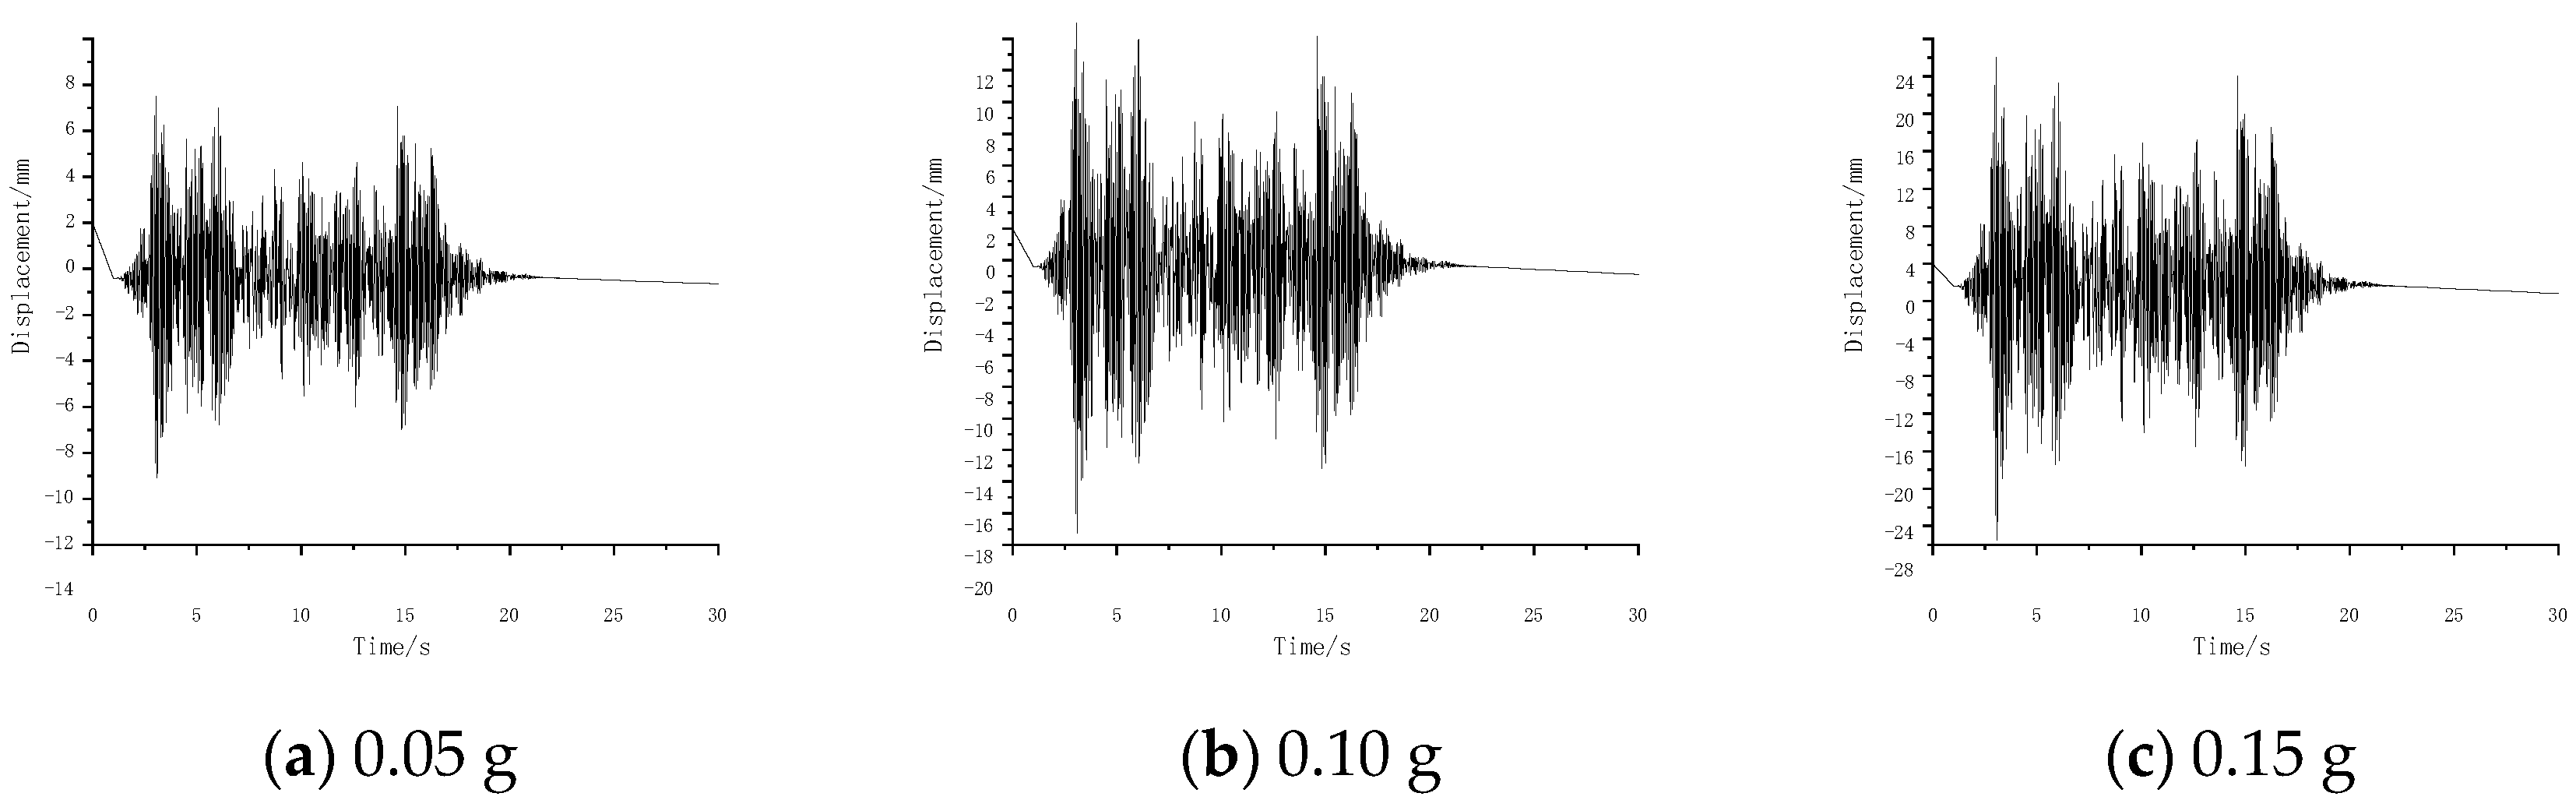
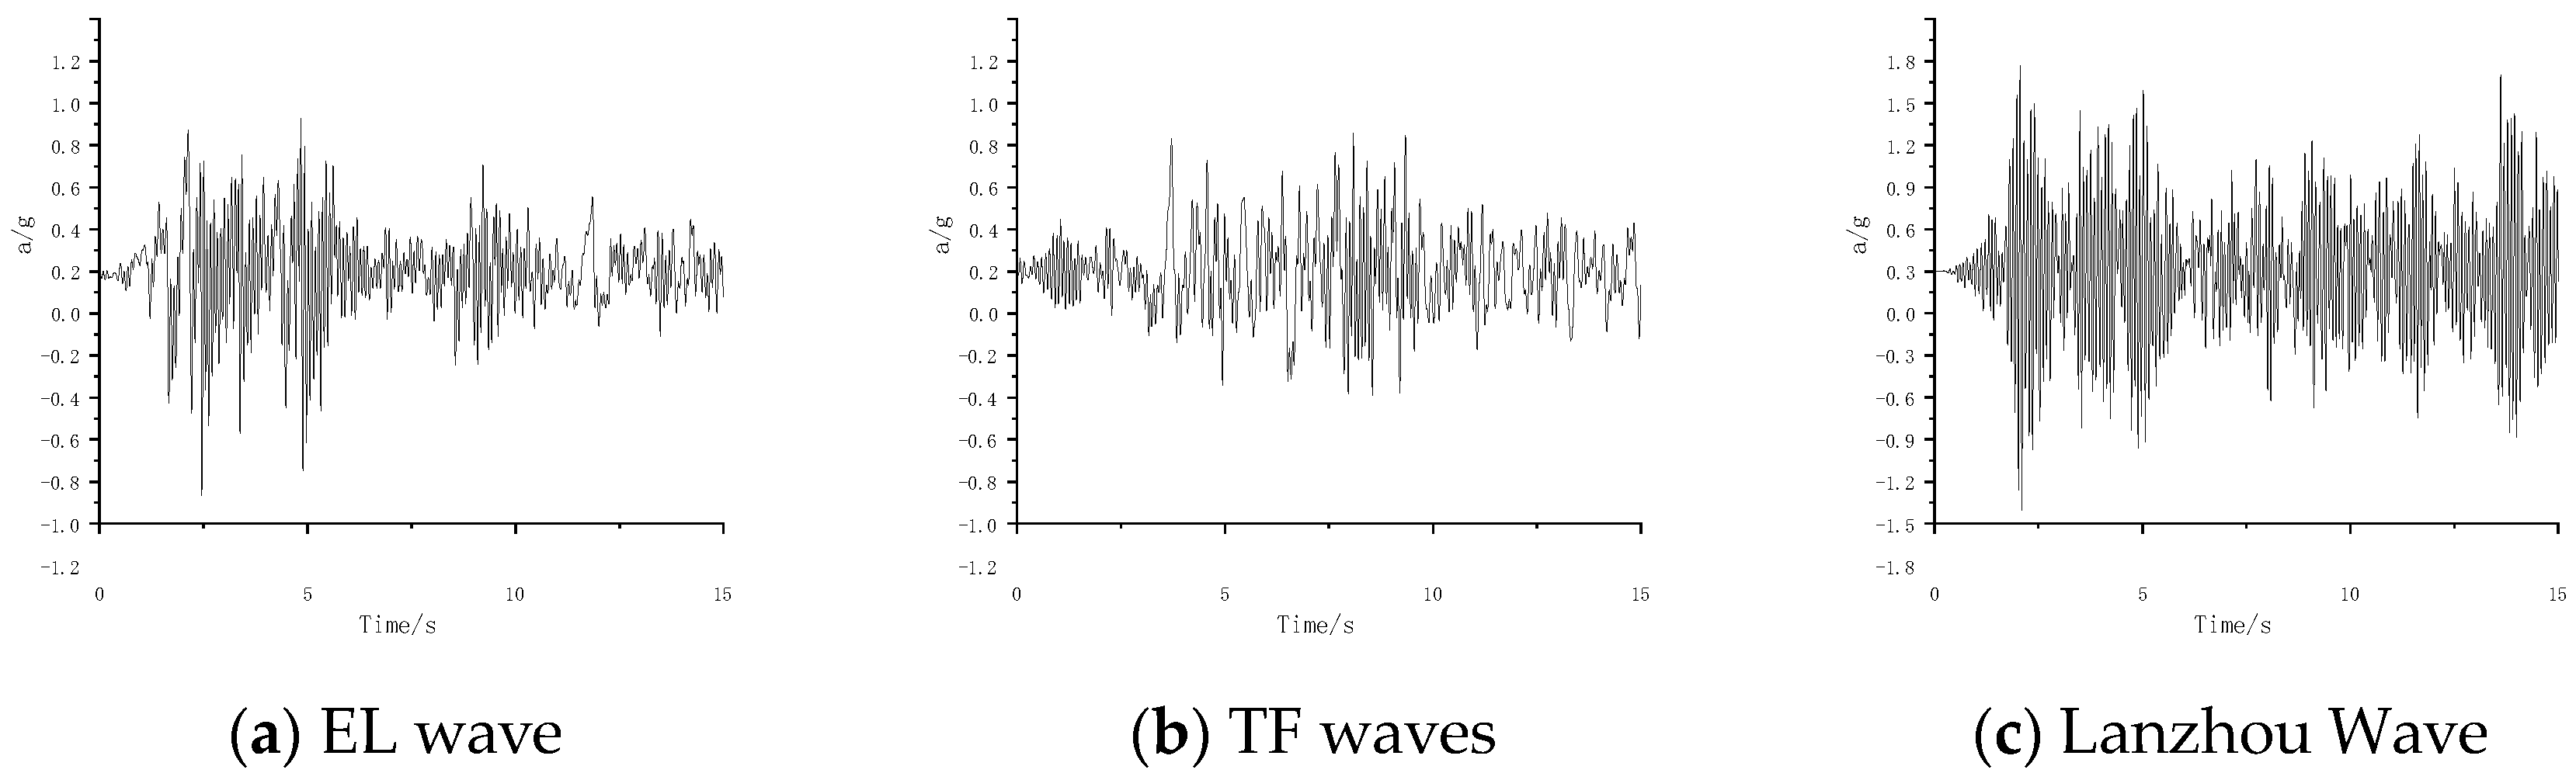
The displacement response of the model structure under different seismic waves was measured by displacement sensors arranged on the model structure, and the displacement time history curve at the top of the structure was obtained, as shown in Figure 12, Figure 13 and Figure 14. As can be seen from Figure 12, Figure 13 and Figure 14, the displacement response under seismic waves at all places in the test is large, among which the Lanzhou wave is the most obvious response to the model.

Figure 12.
EL wave displacement time history wave.

Figure 13.
TF wave displacement time history wave.
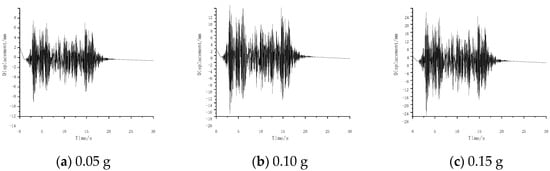
Figure 14.
Displacement time history curve of Lanzhou wave.
3.1.3. Frequency
The frequency sweep results of all levels of white noise are shown in Figure 15. It can be seen that the frequency of the first three orders of the structure has a small decrease before and after the earthquake, with more than 7 degrees, indicating that the model is in an elastic state.
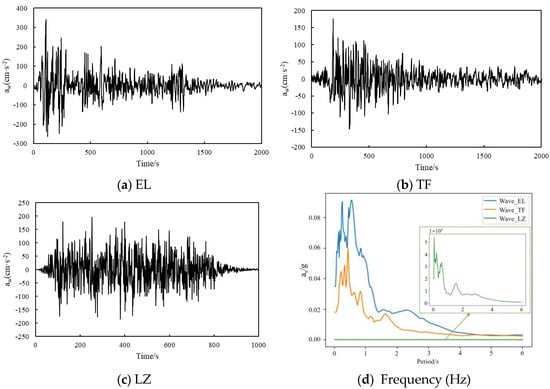
Figure 15.
The acceleration time history and corresponding Fourier spectrum.
3.2. Simulation Results
The peak acceleration measured by different accelerometers in the test is compared with the peak acceleration calculated by the finite element model at the same position. A total of 12 cases of small earthquakes, moderate earthquakes, and large earthquakes were compared. The comparison results show that the peak acceleration calculated by the finite element model is consistent with the experimental results, and the variation of acceleration along the height direction under different working conditions is consistent with the numerical results. In addition, Figure 15 compares the acceleration time history of the SW model under three working conditions to verify the rationality of the ABAQUS calculation model.
The first three order vibration modes of the ABAQUS model and the first three order frequencies of the finite element model are close to those of the test model, and the errors of the 1st, 2nd, and 3rd orders are 9.62%, 3.25%, and 0.19%, respectively. The order of vibration modes is X-direction translational, Y-direction translational, and torsional, and the order is reasonable. It can be seen from the third-order mode diagram that the structure has a large eccentricity, and the eccentricity is mainly distributed in the Y direction of the structure. In addition, compared with the experimental results, the error of the second and third order frequencies is small, and the error of the first order frequency is certain.
The comparison of the acceleration time history of the finite element and the test vertex under the action of the rare intensity of a level 7 earthquake is shown in Figure 16. As can be seen from Figure 16 (-T means the test value, -C means the analog value), the finite element results are similar to the test results, and the vibration trend is similar.
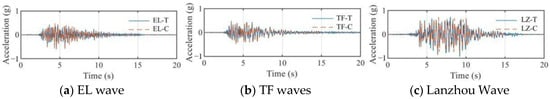
Figure 16.
Comparison of acceleration time history and corresponding spectral acceleration between simulation results and test results.
The cumulative plastic damage distribution of the structure of the finite element model of CV wave input along the direction at the rare intensity level of 7. The results show that when the earthquake is loaded to the rare intensity level of 7 (0.15 g), subtle cracks that are difficult to observe by the naked eye will occur inside the structure. When the earthquake is loaded to 8 degrees, the model begins to produce bending deformation in the two main axes. When the earthquake is loaded to the rare intensity level of 9, the structural damage intensifies, the stiffness decreases, the natural vibration frequency decreases, the damping increases, and the dynamic amplification coefficient decreases. Overall, shows that the structure can still maintain good integrity under the rare intensity of a level 8 earthquake. The acceleration time history curve and displacement time history curve under the rare 9-magnitude earthquake intensity are shown in Figure 17 and Figure 18.

Figure 17.
Acceleration time history curve under the rare intensity of level 9 earthquake (output).
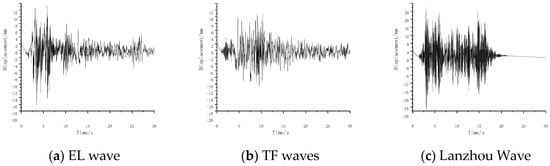
Figure 18.
Displacement time-history curve under 9.0-degree strong earthquake (output).
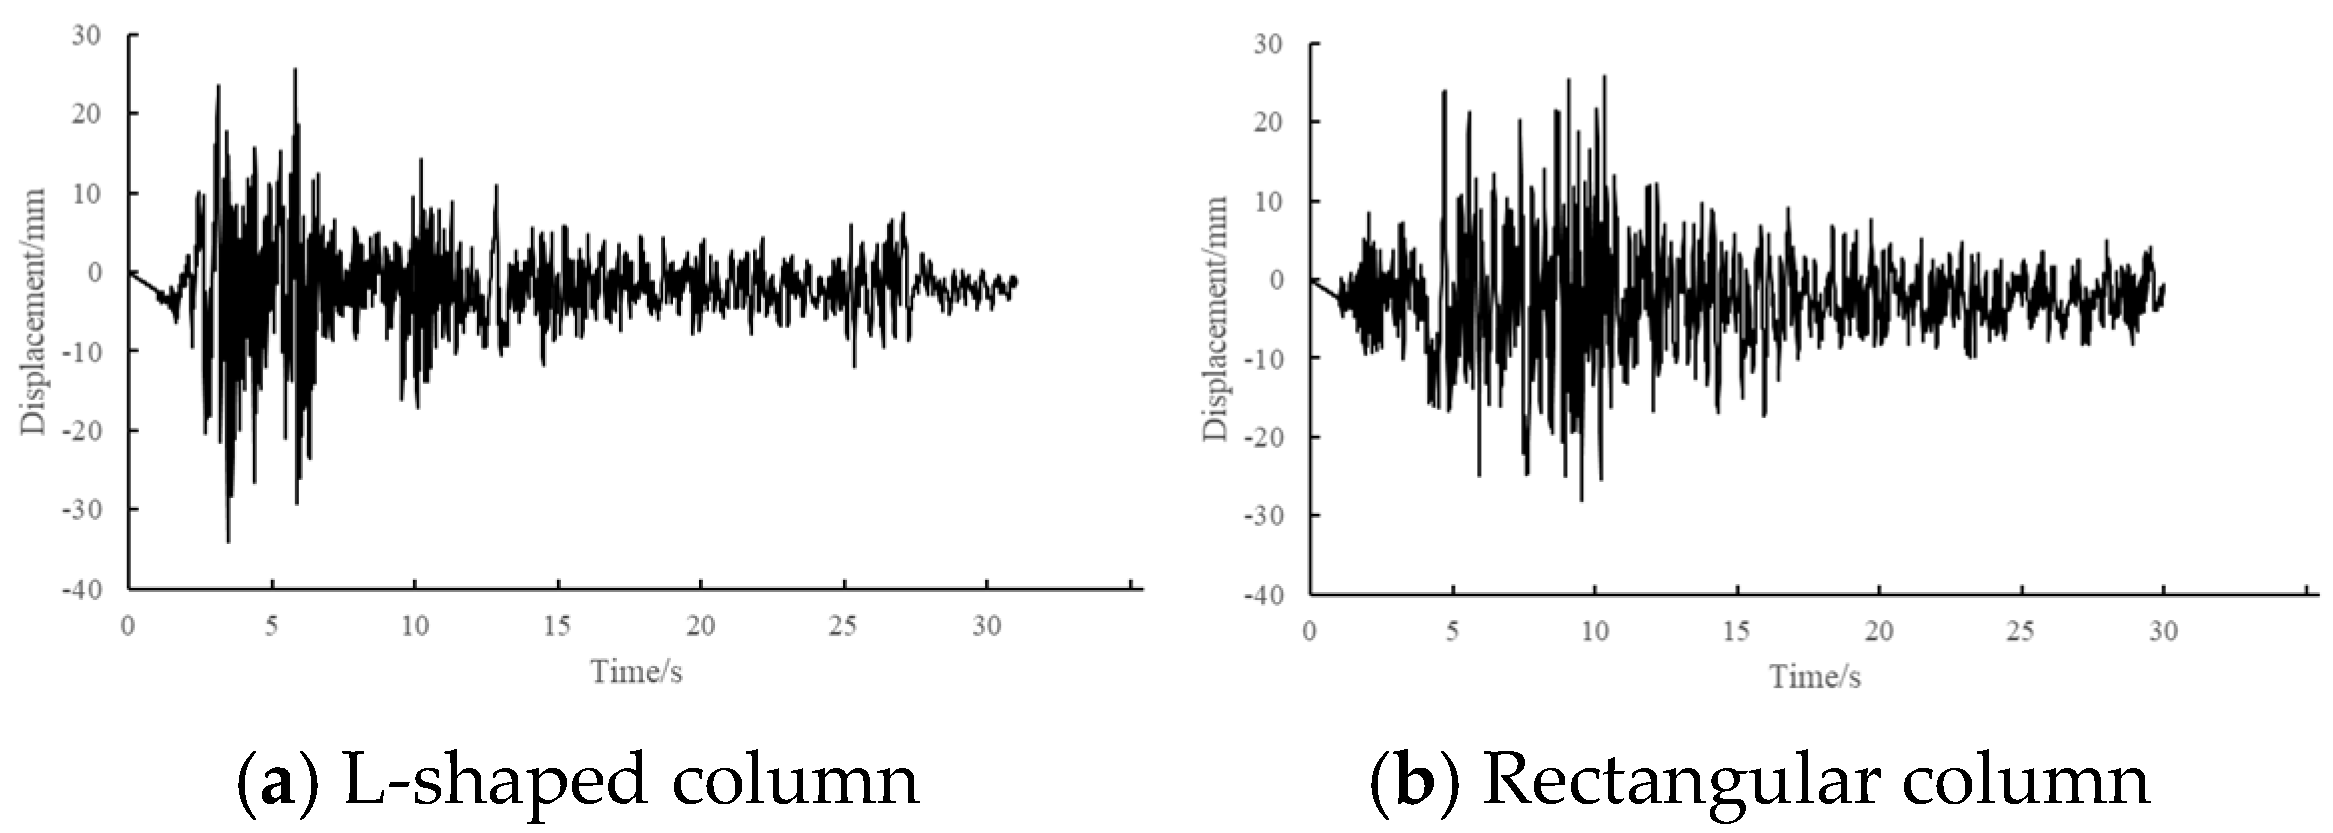
The displacement time history curves of the L-shaped column structure and rectangular column structure were compared under the action of an EL wave of an 8-degree earthquake, and the result is shown in Figure 19. It can be seen that L-shaped columns have better seismic performance than rectangular column structures.
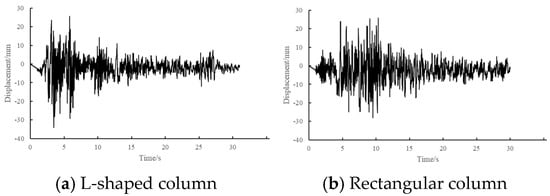
Figure 19.
Comparison of displacement time history curves between L-shaped and rectangular columns.
4. Conclusions
The acceleration, displacement, dynamic characteristics, and damage of precast special-shaped column concrete structures under earthquake are studied by shaking table test and comparison with finite element calculation. The results show that the maximum interstory displacement angle of the structure is 1/2541 (0.05 g), 1/1273 (0.10 g), and 1/947 (0.15 g) under the excitation of each seismic wave and under the action of fortification earthquakes. The interstory displacement basically increases linearly with the increase of earthquake fortification intensity.
The finite element model established using ABAQUS agrees well with the experimental model in terms of dynamic characteristics, acceleration, and displacement response. The simulation and experimental results of the unitized prefabricated irregular column concrete structure are consistent. The failure process of the structure under the action of strong earthquakes is further studied. The result shows that the structure is basically in an elastic state under the rare intensity of a level 7 earthquake, the model begins to bend and deform along the two main axes when the earthquake degree reaches 8, and the structure is completely destroyed when it is loaded to the rare intensity of a level 9 earthquake. On the whole, the precast special-shaped column concrete structure meets the requirements of the current code and has good seismic performance.
Through the finite element model analysis, the acceleration amplification coefficient of the structure decreases significantly with the increase of the peak acceleration of ground motion. Under the action of the rare intensity of a level 8 earthquake, the structure will bend and obviously deform in the middle of the column. Under the action of the rare intensity of a level earthquake, the longitudinal reinforcement of the special-shaped column will buckle, and the concrete will be seriously damaged. It is suggested that the longitudinal reinforcement of the special-shaped column should be strengthened during the structural design.
The existing standards for the design guidance of irregular prefabricated components are still incomplete. The relevant data of this study can provide data support for the standard revision and engineering practice of irregular prefabricated components, and assist in the promotion of prefabricated technology in high-intensity earthquake areas.
Author Contributions
Conceptualization, X.W.; Methodology, C.C.; Resources, X.W.; Data curation, C.C.; Writing – original draft, C.C.; Writing – review & editing, X.W.; Visualization, C.C.; Supervision, X.W.; Project administration, X.W.; Funding acquisition, X.W. All authors have read and agreed to the published version of the manuscript.
Funding
This research was funded by the Key Research and Development Program of Shaanxi Province (sponsored by the Shaanxi Provincial Department of Science and Technology, 2024SF-YBXM-624), and the Scientific Research and Development Project of the Department of Housing and Urban-Rural Development of Shaanxi Province (sponsored by the Department of Housing and Urban-Rural Development of Shaanxi Province, 2023-K46).
Data Availability Statement
The original contributions presented in the study are included in the article, further inquiries can be directed to the corresponding author.
Conflicts of Interest
The authors declare no conflict of interest.
References
- Cosenza, E.; Manfredi, G. The improvement of the seismic-resistant design for existing and new structures using damage concept. In Seismic Design Methodologies for the Next Generation of Codes; Routledge: London, UK, 2019; pp. 119–130. [Google Scholar]
- Xu, Q.; Liu, Y.; Wang, J. Seismic Performance of Cross-Shaped Partially Encased Steel–Concrete Composite Columns: Experimental and Numerical Investigations. Buildings 2024, 14, 1932. [Google Scholar] [CrossRef]
- Ji, J.; Li, J.; Jiang, L.; Ren, H.; Wang, Q.; Wang, X.; He, L.; Zhang, Z. Mechanical Behavior of Special-Shaped Reinforced Concrete Composite Columns Encased with GFRP Core Columns. Buildings 2022, 12, 1895. [Google Scholar] [CrossRef]
- Gawali, N.B.; Thakare, S.B.; Kambale, D.P. Optimizing Structural Performance: A Review Of Rcc, Steel, And Timber Combinations In Civil Engineering. Int. J. Innov. Stud. 2025, 9, 100–128. [Google Scholar] [CrossRef]
- Lei, C.; Wu, Y.; Yang, B.; Wang, B.; Han, J.; Fu, X. Experimental Study on Axial Compression of Bamboo Scrimber Cold-Formed Thin-Walled Steel Composite Special-Shaped Columns. Buildings 2024, 14, 3959. [Google Scholar] [CrossRef]
- Li, Q.; Liu, Z.; Zhou, X.; Wang, Z. Experimental Study and Finite Element Calculation of the Behavior of Special T-Shaped Composite Columns with Concrete-Filled Square Steel Tubulars under Eccentric Loads. Buildings 2022, 12, 1756. [Google Scholar] [CrossRef]
- Grigorian, M.; Grigorian, C.E. An Introduction to the Methodology of Earthquake Resistant Structures of Uniform Response. Buildings 2012, 2, 107–125. [Google Scholar] [CrossRef]
- Saoud, A.; Queiros-Conde, D.; Omar, A.; Michelitsch, T. Intelligent Anti-Seismic Foundation: The Role of Fractal Geometry. Buildings 2023, 13, 1891. [Google Scholar] [CrossRef]
- Salah, A.; Elsanadedy, H.; Abbas, H.; Almusallam, T.; Al-Salloum, Y. Behavior of axially loaded L-shaped RC columns strengthened using steel jacketing. J. Build. Eng. 2022, 47, 103870. [Google Scholar] [CrossRef]
- Xu, F.; Xuan, S.; Li, W.; Meng, X.; Gao, Y. Compressive performance of steel-timber composite L-shaped columns under concentric loading. J. Build. Eng. 2022, 48, 103967. [Google Scholar] [CrossRef]
- Zhao, B.; Wang, Q.; Lv, X. Research on seismic behavior of precast concrete walls with fully assembled horizontal joints. J. Build. Struct. 2018, 39, 48–55. [Google Scholar] [CrossRef]
- Cao, W.; Liu, Z.; Liu, Y.; Zhang, Z.; Wang, R. Experimental study on the joint working performance of prefabricated lightweight steel tube concrete frame composite wall. J. Build. Struct. 2019, 40, 12–22. [Google Scholar] [CrossRef]
- Gao, W.; Wen, X.; Zhao, B.; Lv, X.; Zhou, Y.; Bao, L. Shaking table test on tall building structures comprising a single-core tube with peripheral suspended floors. J. Build. Struct. 2024, 45, 30–41. [Google Scholar] [CrossRef]
- Wang, Y.; Guo, L.; Li, H. L-shaped steel-concrete composite columns under axial load: Experiment, simulations and design method. J. Constr. Steel Res. 2021, 185, 106871. [Google Scholar] [CrossRef]
- Palanci, M.; Senel, S.M. Earthquake damage assessment of 1-story precast industrial buildings using damage probability matrices. Bull. Earthq. Eng. 2019, 17, 5241–5263. [Google Scholar] [CrossRef]
- Wang, Z.; Feng, S.; Zhou, X.; Wen, T.; Liu, Z.; Zhang, Q. Research on seismic performance of a novel SS-CFSST column to H-beam connection. J. Constr. Steel Res. 2024, 215, 108549. [Google Scholar] [CrossRef]
- GB50011–2010; Code for Seismic Design of Buildings. China Architecture & Building Press: Beijing, China, 2010.


Disclaimer/Publisher’s Note: The statements, opinions and data contained in all publications are solely those of the individual author(s) and contributor(s) and not of MDPI and/or the editor(s). MDPI and/or the editor(s) disclaim responsibility for any injury to people or property resulting from any ideas, methods, instructions or products referred to in the content. |
© 2025 by the authors. Licensee MDPI, Basel, Switzerland. This article is an open access article distributed under the terms and conditions of the Creative Commons Attribution (CC BY) license (https://creativecommons.org/licenses/by/4.0/).