Article

Enhancing Energy Efficiency in Egyptian Middle-Income Housing: A Study of PV System Integration and Building Envelope Optimization in Sakan Masr

1
Architecture Department, Université Française d’Égypte, Al Shorouk City, Cairo 17054, Egypt
2
Smart and Future Cities Laboratory (SFCL), Urban Design and Planning Department, Faculty of Engineering, Ain Shams University, Cairo 11517, Egypt
3
Smart and Sustainable Cities Center, Architectural Engineering Department, College of Engineering, University of Business and Technology, Jeddah 23442, Saudi Arabia
4
Engineering Program, Physics School, NOVA University Lisbon, Cairo Branch, FCT, New Administrative Capital 11511, Egypt
*
Author to whom correspondence should be addressed.
Buildings 2025, 15(13), 2326; https://doi.org/10.3390/buildings15132326
Submission received: 8 May 2025 / Revised: 12 June 2025 / Accepted: 19 June 2025 / Published: 2 July 2025
(This article belongs to the Section Building Energy, Physics, Environment, and Systems)

Abstract

Facing rapid urbanization, rising temperatures, and a residential sector that accounted for 38% of Egypt’s electricity use in 2022, middle-income housing presents a critical yet underexplored opportunity for energy efficiency improvements. This study investigates how the integration of passive design strategies and rooftop photovoltaic (PV) systems can enhance energy performance in this segment, using the Sakan Masr housing project in New Cairo as a case study. Addressing a research gap—namely the limited analysis of combined strategies in Egypt’s middle-income housing—the study follows a four-phase methodology: identifying dominant building orientations; simulating electricity demand and thermal comfort using DesignBuilder; optimizing the building envelope with passive measures; and evaluating PV system performance across south-facing and east–west configurations using PV-SOL. Results reveal that passive strategies such as improved glazing and shading can enhance thermal comfort by up to 10% and reduce cooling loads. Also, east–west PV arrays outperform south-facing ones, producing over 14% more electricity, reducing costs by up to 50%, and avoiding up to 168 tons of CO2 emissions annually. The findings highlight that passive improvements with smart PV integration—offer a cost-effective pathway toward Net Zero Energy goals, with significant implications for national housing policy and Egypt’s renewable energy transition.

1. Introduction

Egypt’s accelerating population growth, which reached 118 million in January 2025 with an annual increase of 1.6% [1], has placed unprecedented pressure on the national housing sector. To address this, the Egyptian government launched large-scale residential developments in 21 new cities, including the Sakan Masr project, which targets middle- and upper-middle-income households [2]. While such initiatives aim to reduce housing shortages, they also introduce significant energy and environmental challenges, especially in the residential sector.
Globally, the building sector accounts for 36% of total energy use and 39% of CO2 emissions [3]. Egypt mirrors this trend, with buildings responsible for 26% of national energy consumption and 70% of CO2 emissions [4]. Within this sector, residential buildings are the most energy-intensive, consuming around 60% of total building energy [5], driven largely by electricity use, which makes up 62% of residential energy consumption. In 2022 alone, the residential sector accounted for 38% of Egypt’s electricity use [4,6]. As one of the largest energy consumers in Africa and the Middle East, Egypt relies heavily on non-renewable energy sources—mainly natural gas and oil—which together supply over 90% of the country’s electricity [7].
In response to rising energy demand and environmental concerns, Egypt set an ambitious renewable energy agenda to generate 42% of its electricity from renewable sources by 2035, with photovoltaics (PV) contributing 22% of that target [8,9]. Although the country enjoys high solar irradiance—between 5.4 and 7.1 kWh/m2/day—solar energy remains underutilized, contributing only 1.9% of national electricity production as of 2020. To address this, national strategies aim to expand PV capacity from 3.0 GW in 2022 to 31.75 GW by 2035 [9,10].
Despite this potential, PV integration in Egypt’s residential sector—especially in middle-income housing—remains limited and under-researched. Middle-income households, representing a large share of the urban population, face unique challenges. On the one hand, they increasingly aspire to higher thermal comfort levels (e.g., through air-conditioning); on the other, they are financially constrained—unable to afford the advanced technologies common in high-end housing, yet beyond the reach of low-income housing subsidies. Compounding this is the inefficiency of typical residential buildings in Egypt, which often feature uninsulated concrete walls, single-glazed windows, and minimal shading—design characteristics poorly suited to Egypt’s hot, semi-arid climate.
While previous research has explored passive design strategies—such as roof insulation, glazing improvements, and shading devices—as well as rooftop PV systems, these elements have often been studied separately or in different building types. There remains a critical gap in understanding the combined effect of passive strategies with PV systems on energy use, thermal comfort, and affordability in middle-income housing under Egypt’s climate.
This study addresses that mentioned gap. It evaluates the combined effect of passive envelope improvements and rooftop PV systems on a typical housing model from the Sakan Masr project. It also examines how building orientation impacts PV efficiency and cooling loads. In addition, it compares south-facing and East–West PV configurations in terms of electricity generation, cost savings, and CO2 emission reductions.
The analysis uses two simulation tools: DesignBuilder for thermal and energy performance and PV-SOL for PV system performance. The results offer practical, evidence-based recommendations for improving energy performance in Egypt’s middle-income housing sector.
Ultimately, the study contributes to Egypt’s national sustainability goals. It supports the 2035 renewable energy targets by promoting cost-effective, low-carbon, and energy-efficient housing solutions for the growing middle class.

2. Literature Review

2.1. Energy Efficiency in Residential Buildings: A Global and Local Perspective

Improving the energy performance of residential buildings has become a global priority, particularly in regions facing rapid urbanization and energy scarcity. (De Boeck et al., 2015) [11]. Globally, the building sector accounts for 36% of total energy use and 39% of CO2 emissions [3]. Egypt mirrors this trend, with buildings responsible for 26% of national energy consumption and 70% of CO2 emissions [4]. In comparison, residential buildings consume approximately 60% of total building energy, driven by cooling loads and the dominance of air-conditioning in response to the hot semi-arid climate.

2.2. Passive Design Strategies in Egypt’s Residential Sector

Several studies have explored passive design measures to reduce energy consumption and improve thermal comfort in Egyptian housing. Soliman et al. developed a solar thermal cooling system for middle-income housing in New Cairo, using TRNSYS to simulate energy performance. The study emphasized envelope improvements—such as double walls with insulation and Low-E glazing—which reduced energy use by up to 45%. The system supplied 83% of monthly electricity demand, with a payback period of 1.5 years [12]. Several studies have focused on optimizing building envelopes to improve energy efficiency in Egyptian housing. Zeinab et al. used DesignBuilder and ENVI-met to assess green roofs in a Sakan Masr building, finding a 12% reduction in energy use and temperature drops of up to 3 °C [13]. Abdollah et al., using IESVE, found that double walls with air gaps and insulation reduced cooling loads by 40% and CO2 emissions, with a maximum payback of 6.3 years [14]. Nafeaa et al. applied energy code-aligned measures to a high-rise, where shading, double glazing, and LED lighting reduced energy use by up to 26% [15]. El-Dessuky used DesignBuilder to align low-income housing in New Beni-Suef with the Egyptian energy code, proposing façade and roof insulation, rooftop farming, and shading solutions like blinds and louvers, which improved both comfort and economic performance [16]. Urban-scale approaches were explored by Antuña-Rozado et al., who proposed energy-efficient strategies for Nabta Smart Town, integrating PV, wind turbines, and passive measures to approach Net Zero Energy District goals [17]. Hegazy investigated housing forms in Al-Obour City, showing that attached units were more energy-efficient than detached ones due to reduced exposure [18].

2.3. Photovoltaic Systems in Residential Buildings: Global Lessons and Local Gaps

Photovoltaic (PV) systems have been widely recognized for their environmental benefits, offering a viable pathway to reduce carbon emissions and dependence on non-renewable energy sources [19]. Studies consistently demonstrate that residential PV systems contribute to decarbonization targets and support climate mitigation efforts by generating clean electricity at the point of use. However, the effectiveness of PV systems is influenced by factors such as user behavior, system efficiency, and initial investment costs.
Recent literature has also highlighted the importance of integrating photovoltaic (PV) systems into residential buildings as a vital component of Egypt’s sustainable energy future. In Egypt, the potential for PV deployment is considerable, given its high solar irradiance—over 250 days of sunshine annually—creating an ideal environment for solar energy generation [20]. Integrating PV systems into middle-income housing can significantly enhance energy efficiency and sustainability. Among the most effective strategies is the use of Building-Integrated Photovoltaics (BIPVs), which embed PV modules directly into building elements such as roofs and facades. This approach not only conserves land but also contributes to architectural aesthetics and energy performance, particularly in space-constrained urban environments [21,22].
In tandem with BIPVs, architectural optimization plays a key role in maximizing solar energy capture. Adapting building envelopes—such as incorporating PV panels on south-facing surfaces and using horizontal canopies—has been shown to reduce cooling loads and improve energy production. For example, Baghdadi & Abu Hussain (2025) found that such configurations enhance energy efficiency, while research on Egyptian government buildings supports the use of PV-integrated façades as an environmentally friendly solution [23,24].
Furthermore, Egypt’s national solar initiatives are providing momentum for broader adoption of PV technologies. The Egypt Solar Hybrid Initiative integrates PV with Concentrated Solar Power (CSP) to enhance grid reliability and energy output. Elkelawy et al. (2024) projected that this initiative will substantially contribute to Egypt’s goal of sourcing 42% of its electricity from renewables by 2030, directly supporting developments such as middle-income housing [25]. More information about energy policy framework in Egypt is provided in Supplementary Materials.

2.4. Income-Level Differences in Energy Needs and Design Requirements

The design requirements and energy needs of residential buildings in Egypt vary significantly across income groups. Low-income housing typically emphasizes cost-saving measures and basic envelope solutions, leading to minimal energy use. For instance, low-income households consume an average of 86 kWh per month, reflecting limited access to energy-intensive appliances and a focus on affordability. In contrast, high-income housing can afford advanced energy technologies and high-performance materials, resulting in higher energy consumption; these households average 1232 kWh per month [26].
Middle-income housing, which constitutes a substantial portion of Egypt’s urban housing stock, faces unique challenges. Occupants often aspire to higher comfort levels, such as increased use of air-conditioning, but are constrained by limited financial resources. These households consume approximately 398 kWh per month, indicating a balance between comfort aspirations and economic limitations [26]. Studies have shown that enhancing the energy efficiency of building envelopes in middle-income residential buildings can significantly reduce energy consumption. For example, implementing energy-efficient envelope designs can lead to substantial energy savings and improved thermal performance.
Therefore, solutions such as affordable photovoltaic (PV) integration combined with cost-effective passive design measures are essential for this sector. However, these strategies remain underexplored in both research and practice, highlighting the need for targeted studies and policy interventions to address the specific needs of middle-income housing in Egypt.

2.5. Regional Factors: Climate, Solar Potential, and Design Implications

Egypt’s climate—characterized by high solar irradiance (5.4–7.1 kWh/m2/day), long sunshine hours (up to 12 h in summer), and a semi-arid environment [10]—presents both opportunities and challenges for building energy design. While the solar resource is abundant, the hot climate imposes significant cooling demands, influencing the effectiveness of passive strategies. For example, roof insulation, shading devices, and glazing improvements are critical for reducing heat gains, while wall insulation shows limited impact in Egypt’s context. Similarly, PV system design must account for orientation optimization: although south-facing arrays are conventionally favored, this study demonstrates that East–west PV layouts can outperform south-facing systems by increasing panel density and total generation capacity.

2.6. Research Gap and Study Contribution

Despite growing interest in renewable energy and passive strategies, there remains a critical gap in the literature on the combined integration of PV systems and passive design measures in middle-income housing, particularly in Egypt. Existing studies tend to focus on single interventions or different housing segments, neglecting the unique energy demands, affordability constraints, and design needs of middle-income households. Moreover, there is limited research assessing PV orientation optimization in relation to passive envelope improvements under Egypt’s climatic conditions.
This study addresses these gaps by providing a comprehensive analysis of PV integration and passive design strategies for middle-income housing in Egypt, using Sakan Masr as a case study. By evaluating building orientation, envelope optimization, PV system configurations, and cost-benefit outcomes, this research offers practical insights for achieving energy-efficient, affordable, and sustainable housing—directly supporting Egypt’s national renewable energy and decarbonization goals.

3. Case Study Introduction

Cairo, Egypt, located in a semi-arid climate [13], receives high levels of solar radiation, with an average of 5.4–7.1 kWh/m2 per day of solar radiation, which is considered to be high [27] and 3050 sunlight hours annually [28]. The city’s solar radiation ranges from 2.92 kWh/m2 in December to 7.5 kWh/m2 in summer, with sunshine hours varying from 7 h in December to 12 h in July [29,30]. These conditions make Cairo an ideal location for solar energy generation, making it a strong case study for photovoltaic (PV) systems.
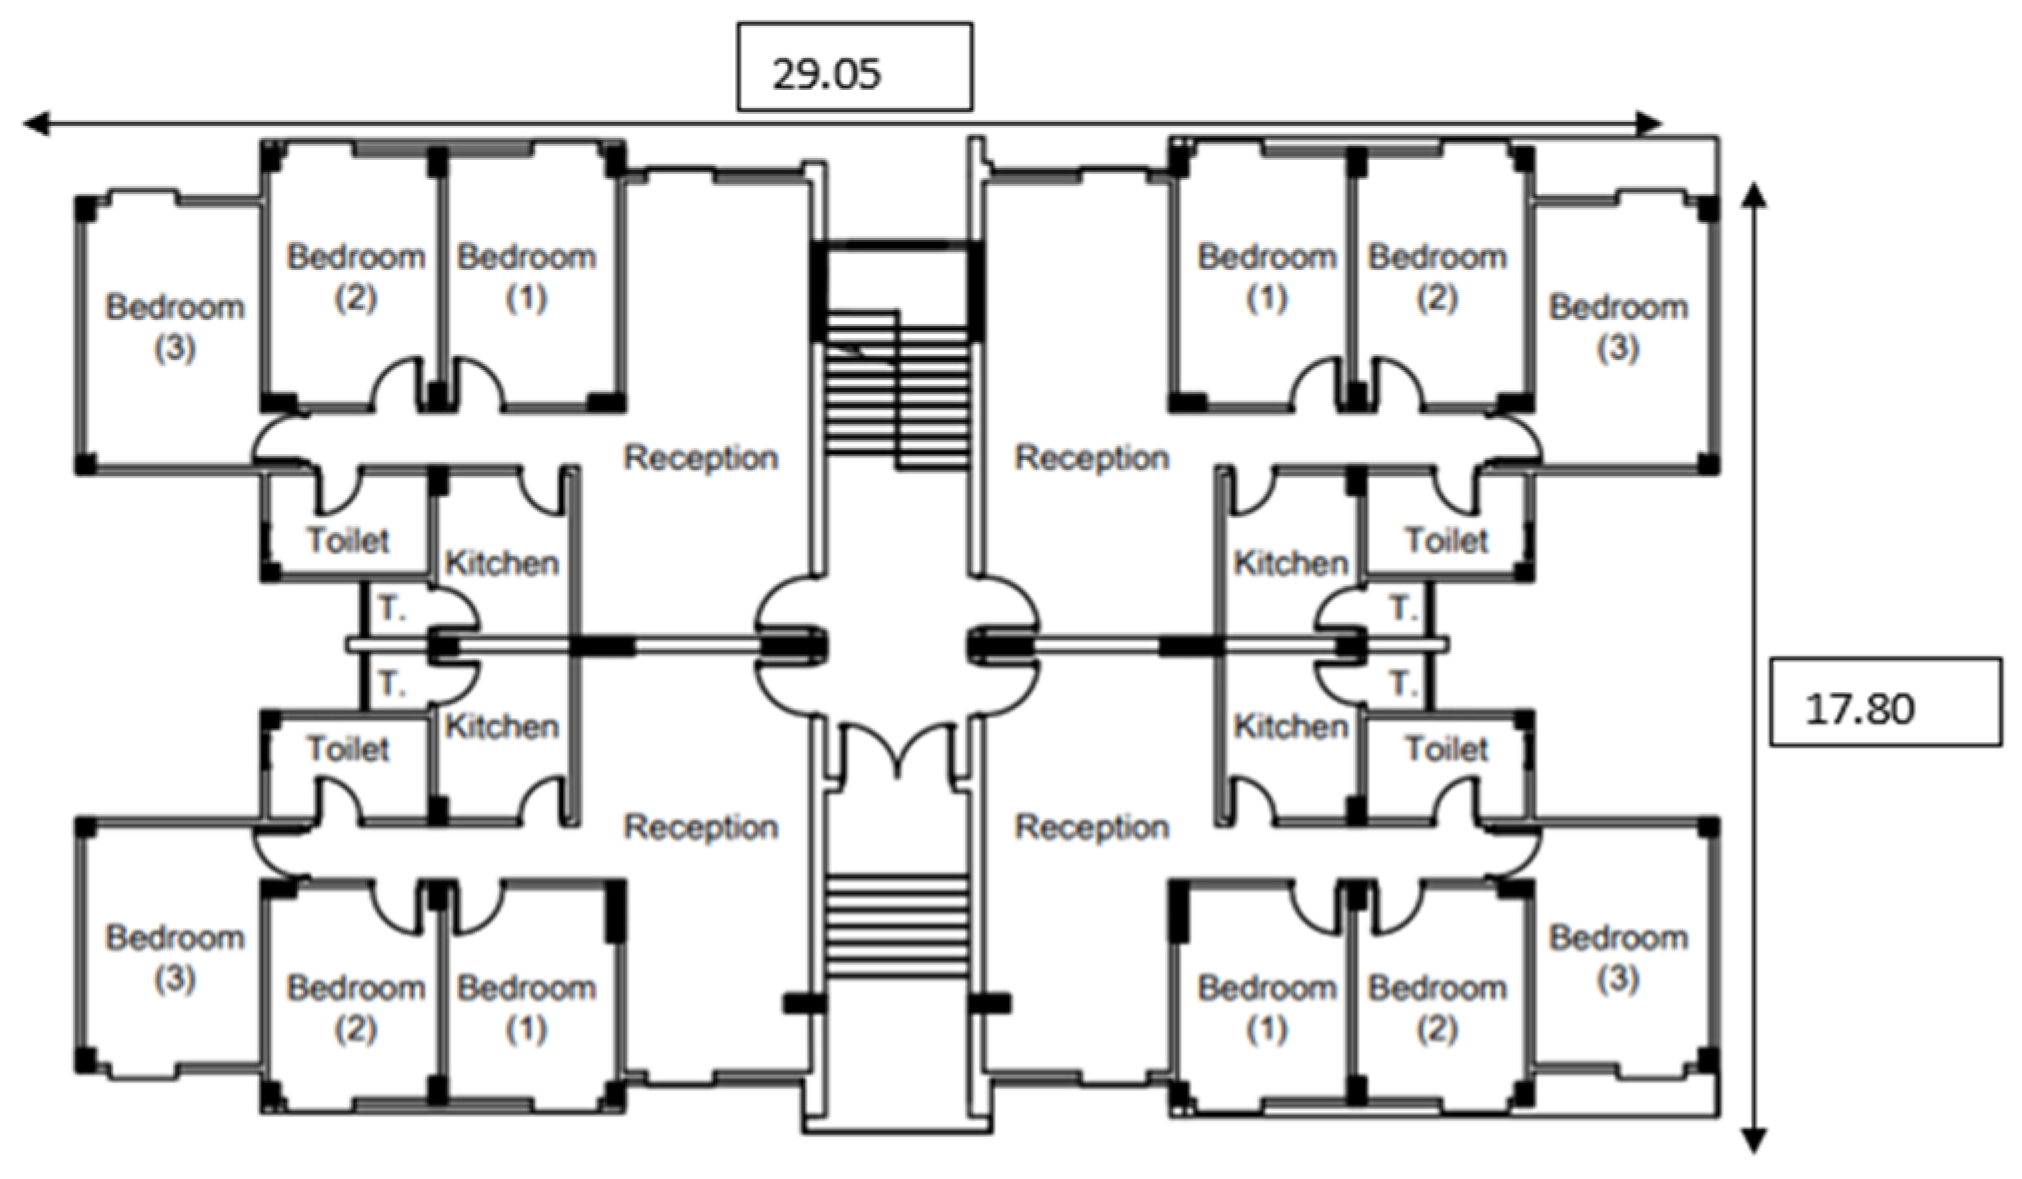
Cairo, with a population of 10 million in 2021, faces significant housing demand, particularly for the middle-income class [31]. To address this, the Egyptian government has developed various housing projects, including Sakan Masr, which is part of a larger initiative to build 900,000 affordable units across 21 new cities [32], was selected for this case study due to its relevance in addressing Cairo’s housing challenges and its potential for integrating solar energy solutions, given the city’s favorable climate conditions. Sakan Masr, consisting of 59,140 units, is located in several new cities, with New Cairo hosting the largest number of buildings, which is 721 buildings [33]. The project’s residential units are six-story buildings with four apartments per floor, each averaging 115 m2 [34]. The total gross area equals 2462 m2 (517 m2 per floor), and there are fourteen locations of the Sakan Masr at New Cairo, As shown in Figure 1 and Figure 2.

4. Research Methodology

This research employed a systematic methodology comprising four key phases: First, an initial assessment was conducted to analyze the primary building orientations within the Sakan Masr housing project in New Cairo by examining fourteen locations within the development to determine the optimal orientations for subsequent photovoltaic (PV) panel installation. Second, building energy performance simulations were performed using DesignBuilder software (Version 7.0.2.006) to quantify baseline electricity consumption and evaluate indoor thermal comfort levels according to the adaptive model in ASHRAE-55 within the buildings. Third, the building envelope was optimized to identify strategies for minimizing electricity consumption by comparatively analyzing scenarios employing both Heating, Ventilation, and Air Conditioning (HVAC) systems and natural ventilation (NV) approaches. Fourth, a comparative analysis of pure south-facing and east–west PV panel installation configurations was undertaken using PVSOL software (Premium R5 version) to model and calculate total electricity generation and cost savings for each configuration. The results are discussed through a comparative evaluation of these two techniques in terms of electricity generation, cost savings, environmental impact, and carbon dioxide emissions (Figure 3).

5. Results

5.1. Step 1: Analysis of Building Orientations in Sakan Masr, New Cairo

Building orientation significantly influences energy performance, affecting heating and cooling loads as well as the potential for photovoltaic (PV) electricity generation. This research aims to explore PV installation strategies for the Sakan Masr housing prototype to achieve Net Zero Energy Building (NZEB) targets.
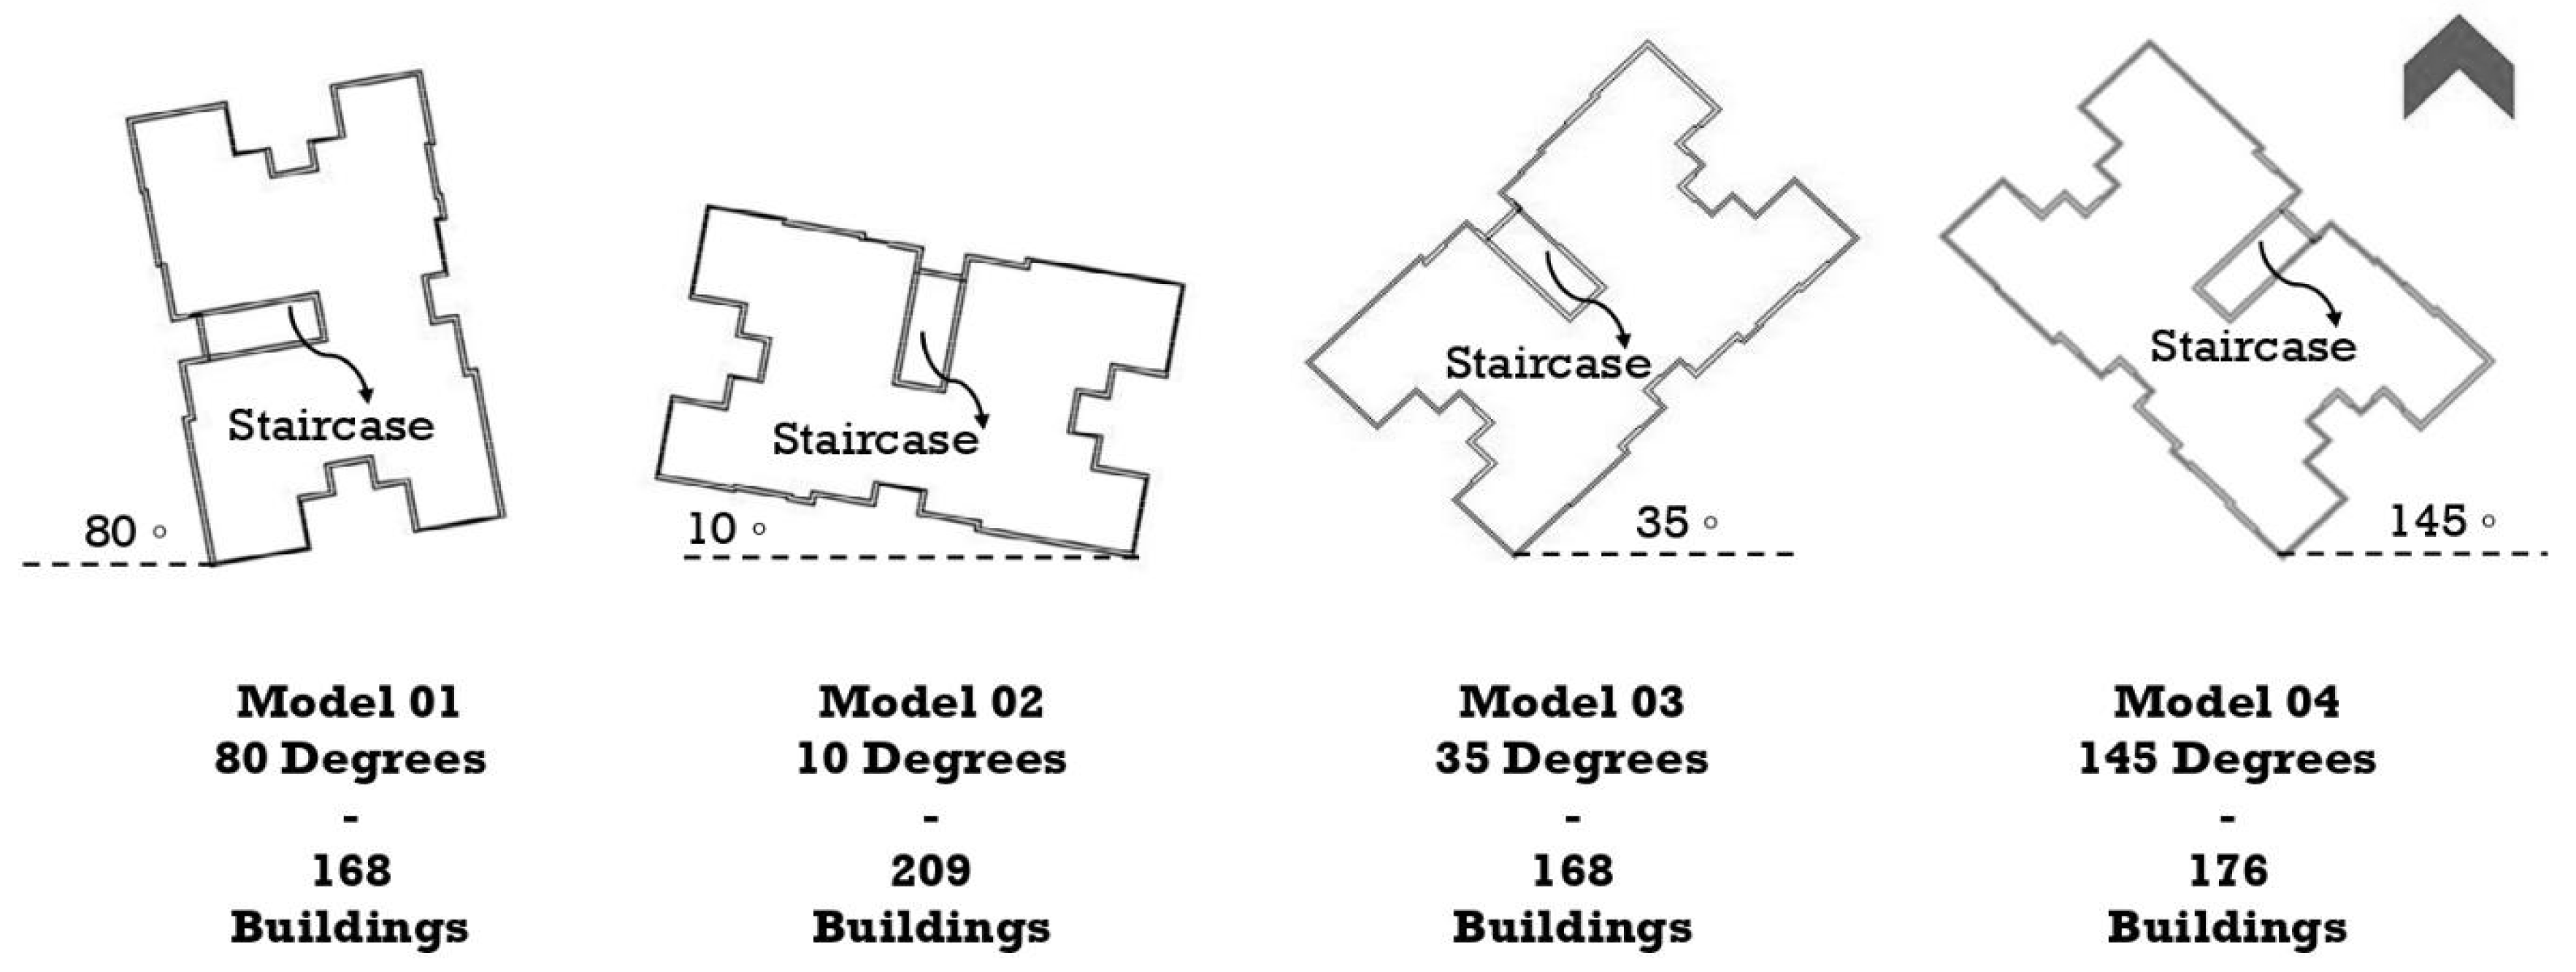
A survey was conducted across fourteen locations in Sakan Masr, New Cairo, to map the primary building orientations relative to the true north. Four dominant orientations were identified: 10°, 35°, 80°, and 145°, as illustrated in Figure 4. Minor variations (within ±5° to ±10°) were considered negligible due to their minimal impact on PV performance. Therefore, these four orientations were selected to represent the overall building directions in Sakan Masr for the subsequent analysis.
The survey also revealed that the distribution of four dominant building orientations across the Sakan Masr in the New Cairo area as follows:
  • Model 01: 168 buildings × 24 apartments = 4032 apartments
  • Model 02: 209 buildings × 24 apartments = 5016 apartments
  • Model 03: 168 buildings × 24 apartments = 4032 apartments
  • Model 04: 176 buildings × 24 apartments = 4224 apartments
These results indicate that all building models are significant and should be analyzed in terms of enhancing indoor thermal comfort and evaluating the potential for rooftop PV installation to generate electricity, reduce costs, and lower CO2 emissions in middle-income housing.

5.2. Step 2: Electricity Consumption and Indoor Thermal Comfort Analysis Using DesignBuilder

In this phase, DesignBuilder software was used to simulate electricity consumption (hourly over one year) and assess indoor thermal comfort according to ASHRAE-55 for the Sakan Masr residential prototype across the four main orientations.
As shown in Equation (1), The basic heat balance equation used by DesignBuilder software, which operates on the Energy Plus engine, is:
Q = Q c o n d u c t i o n   + Q c o n v e c t i o n + Q r a d i a t i o n + Q i n t e r n a l   g a i n s Q l o s s
  • Airflow and HVAC modeling based on mass and energy balance principles.
The simulation used the airport Cairo weather file (EPW) and the building envelope properties listed in Table 1. Building materials from the software library were assumed to have standard thermal properties.
The occupancy density was set at 0.19 (5 people/26 m2) [10]. For the occupancy schedule, it was considered that during weekdays, occupants would be away from 08:00 to 15:00. 25% of the occupants would return home between 15:00 and 17:00, then the home would be occupied by 50% between 17:00 and 19:00, and it would be occupied by 75% from 19:00 to 21:00. The home would be at full capacity from 21:00 until the next day. Friday and Saturday are weekends in Egypt, so the home would be occupied at full capacity. This occupancy schedule has been set for one year. Equipment schedules followed Table 2, and domestic hot water (DHW) was modeled as electric instantaneous heaters.
The input of the building energy simulation model was based on previous studies; however, some modifications have been made to the occupancy profile and the equipment schedule studies [35]. The infiltration rate was assumed to be 0.8 ACH, and it was set as a fixed schedule during the whole year. Buildings were initially modeled with natural ventilation, then with air conditioning (split units without fresh air) activated during July and August. The air conditioning schedule starts from 15:00 to 22:00 during the week, and it starts from 12:00 to 22:00 during the weekend. Cooling setpoints were 25 °C with a setback to 28 °C.
In addition, due to the availability of LED lighting systems nowadays, the lighting power density was calculated as 2.3 W/m2-100 LUX instead of 13 W/m2 as an average. Lighting power density was set at 2.3 W/m2, synchronized with occupancy patterns, while stairwells were lit from 18:00 to 07:00. This led to a reduction in the annual electricity consumption by 50,420 KWh (from 256,481.5 KWh to 206,061.5 KWh) for the whole building.
The annual electricity consumption equals 206,061.5 kWh for the building in one year. In addition, the average electricity consumption for one apartment per month is 715 kWh, accounting for equipment use, domestic hot water (DHW), and lighting. In scenarios using natural ventilation, this consumption remains constant across all models as the occupant profiles and equipment schedules are fixed. However, when an HVAC system (split unit) is installed—with an operational schedule limited to July and August from 15:00 to 22:00 on weekdays and from 12:00 to 22:00 on weekends—the total annual electricity consumption increases to 244,974 kWh in model 1, 242,361.6 kWh in model 2, 244,840.9 kWh in model 3, and 243,385 kWh in model 4. As a result, the average monthly electricity consumption per apartment rises to 850 kWh, reflecting the added energy demand for cooling.
The results of apartment electricity consumption are consistent with findings from previous studies. Moreover, the results emphasize the significant impact of HVAC system usage on overall electricity demand. Specifically, operating the HVAC system for just two months resulted in an average 18% increase in both the apartment’s monthly electricity consumption and the building’s total annual electricity use [13,36,37].

5.3. Step 3: Building Envelope Optimization

The building envelope optimization aimed to reduce CO2 emissions (as objective 1) and reduce the discomfort hours (as objective 2). There was no specific constraint. Regarding the design variables, the research proposes 20 alternatives to be discussed and evaluated, as shown in Table 3. These alternatives focused on passive design measures such as adding roof insulation, upgrading glazing systems, and installing shading devices, while wall insulation was also considered initially. All measures were selected based on previous research studies and were chosen for their feasibility to be applied in upcoming project phases without requiring major modifications to the existing Sakan Masr prototype design.
In DesignBuilder, the optimization process solves a multi-objective problem and uses a genetic algorithm to explore the potential solution optimization, which is typically framed as shown in the following Equations (2) and (3):
min f 1 x ,   f 2 x , . . f n x
Subject to:
X D e s i g n   S p a c e ,   g i X 0 ,      h j X = 0
where:
  • f 1 X = objective function 1 (e.g., CO2 emissions);
  • f 2 X = objective function 2 (e.g., thermal discomfort hours);
  • X = vector of decision variables (e.g., insulation thickness, window size, HVAC setpoints);
  • g i X ,   h j X = inequality/equality constraints.
In addition, the indoor thermal comfort was calculated according to the adaptive model in ASHRAE-55 based on Equation (4):
To calculate Upper 80% acceptability limit (°C):
T c o m f = 0.31   T o u t + 21.3
To calculate Lower 80% acceptability limit (°C):
T c o m f = 0.31   T o u t + 14.3
where:
  • T c o m f = indoor comfort temperature (°C);
  • T o u t = prevailing mean outdoor air temperature (°C), typically a running mean over the past 7 days.
The optimization process was carried out in two main stages. In the first stage, the optimization was carried out for the four main models without an HVAC system. As shown in Table 4, the passive design measures led to an improvement in thermal comfort, ranging from 2% to 4%. These results underscore the importance of applying passive design measures in the early design stages to improve comfort without relying on mechanical cooling.
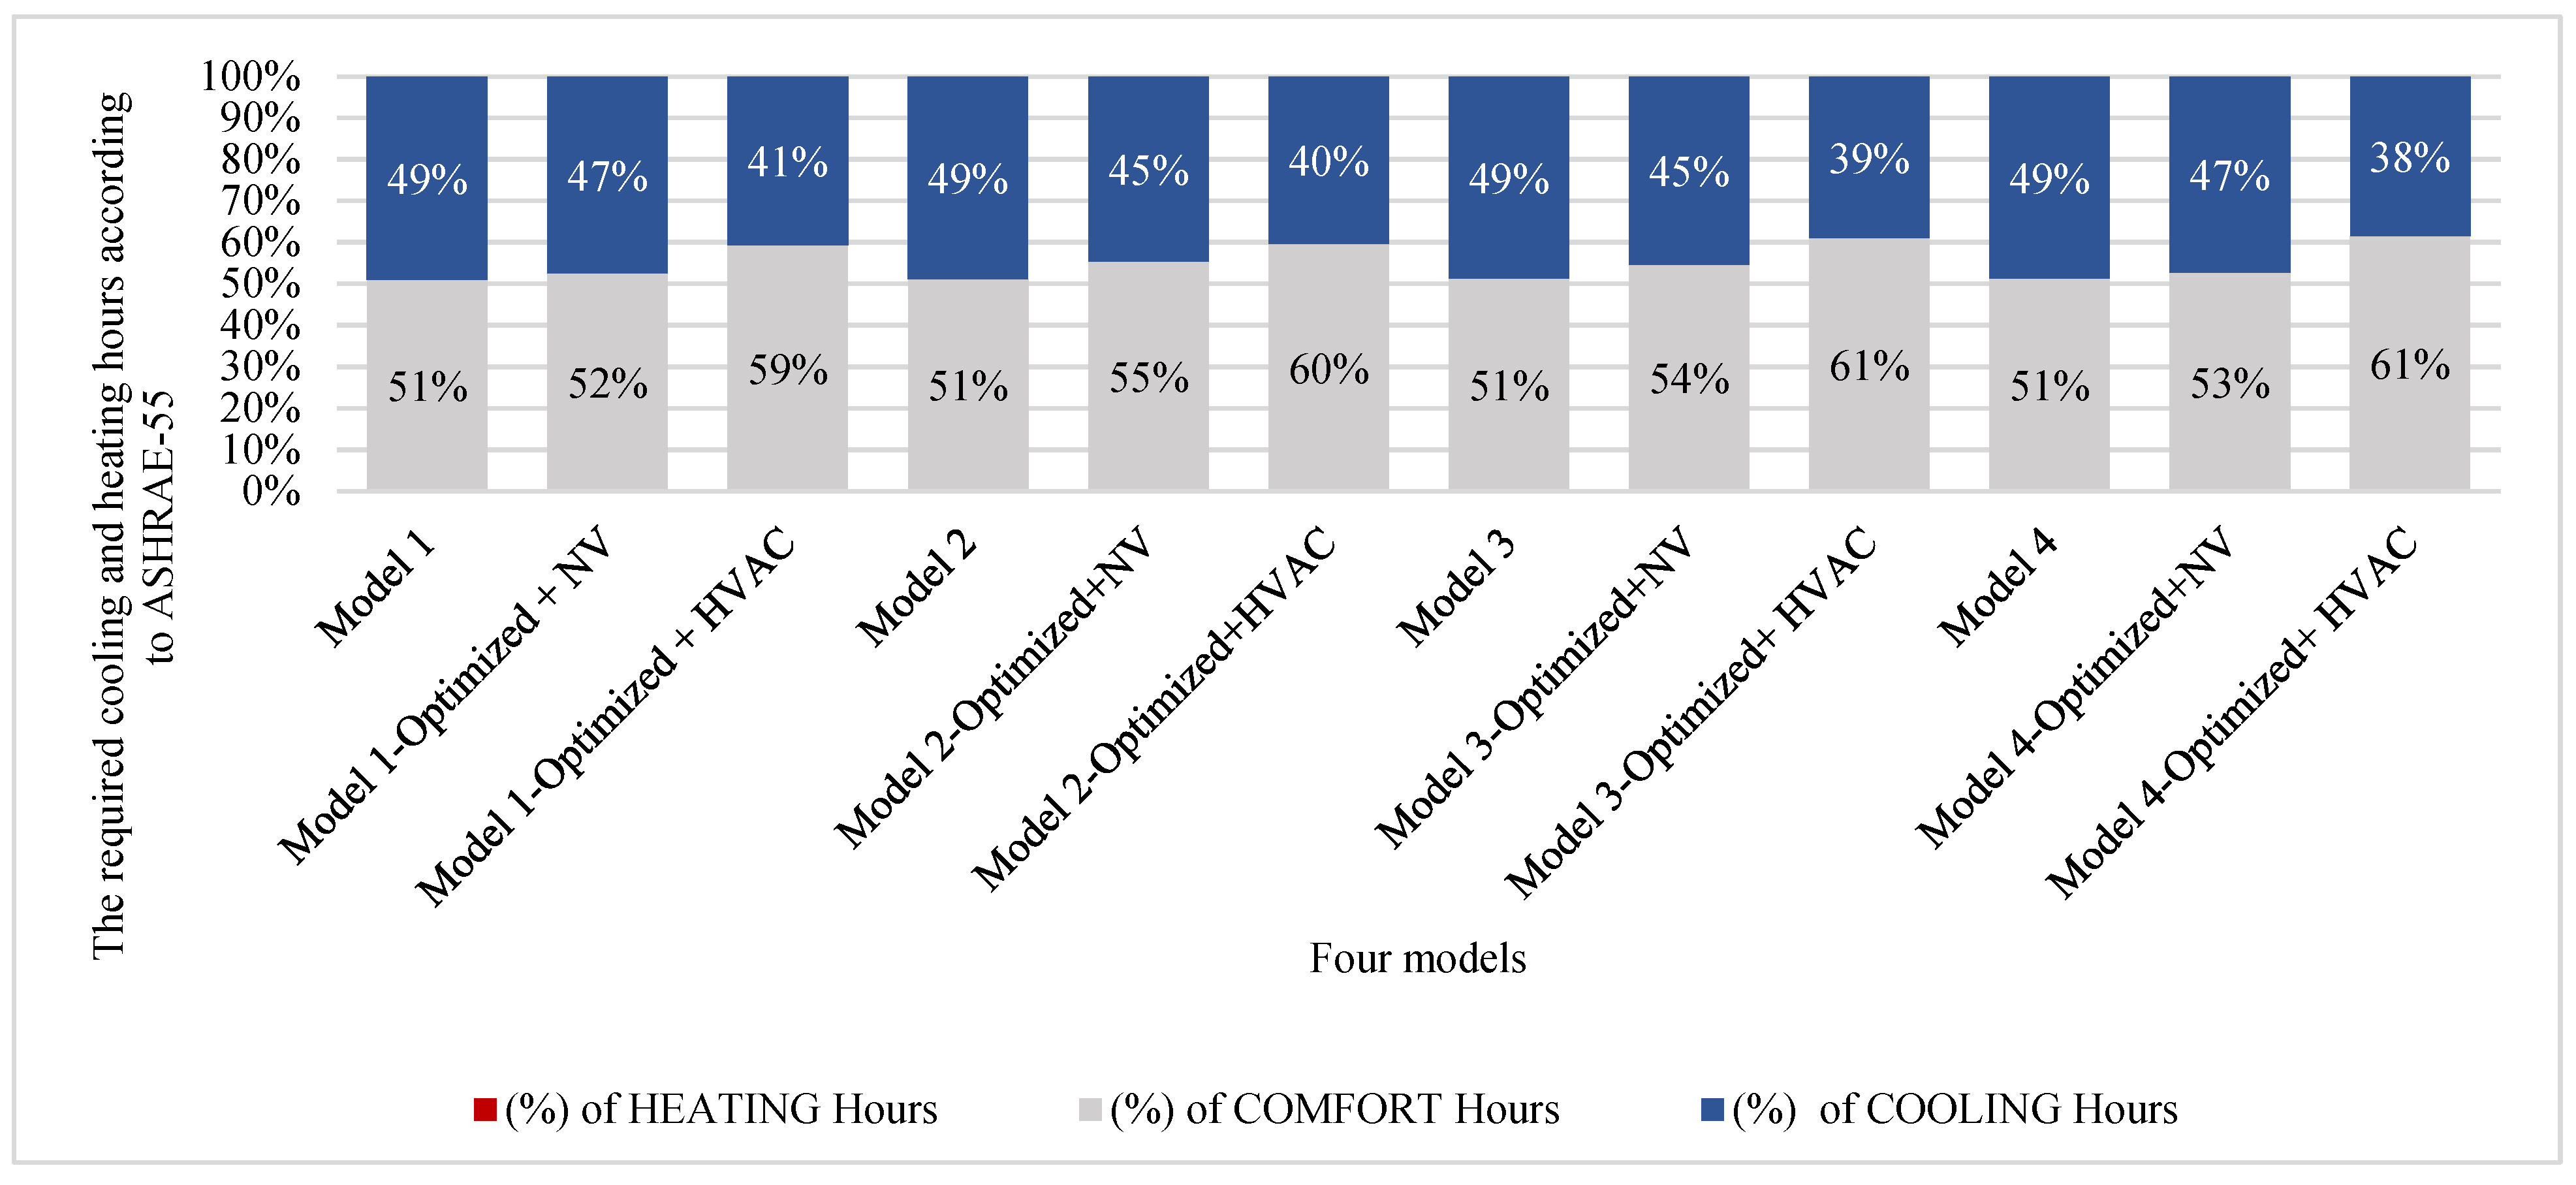
In the second stage (building with HVAC), the goal shifted to improving thermal comfort (as a first objective) while reducing electricity demand for cooling (as a second objective). No specific constraint was applied, and similar passive design strategies were employed. As shown in Table 5 and Figure 5, the optimization resulted in a more significant increase in thermal comfort—between 8% and 10%—alongside a noticeable decrease in cooling energy requirements.
To summarize the key findings from this step, it is important to highlight that incorporating passive design strategies at the early design stage significantly enhances indoor thermal comfort. In naturally ventilated cases, thermal comfort hours improved by 2–4%. This improvement increased to 8–10% when HVAC systems were used. Additionally, the application of the proposed passive design strategies led to a reduction in cooling load (electricity consumption) by 16, 8, 14, and 11 kWh per apartment per square meter per month for Models 1, 2, 3, and 4, respectively. Table 6, summarizes the total electricity consumption in first and second stages.
The most effective passive design strategies are roof insulation, shading devices with 0.5–1.0-m overhangs, and the use of double or reflective glazing. Meanwhile, Wall insulation, on the other hand, showed minimal impact under Cairo’s climatic conditions and was not recommended for further application.

5.4. Step 4: Photovoltaic System Installation Analysis and Results

In the final phase, photovoltaic (PV) systems were simulated using PV-SOL software to evaluate two installation techniques—pure south-facing and east–west orientations—on the rooftops of the Sakan Masr buildings. The PV system generation and PV energy output are based on Equations (5) and (6), respectively:
E P V    = P r a t e d × P S H × 365 × η s y s t e m
where:
  • Prated = Rated PV power (kW);
  • PSH = Peak sun hours (4.5 h/day for Cairo);
  • ηsystem = System efficiency (accounting for inverter losses, soiling, etc.).
E = A × G × η × P R
where:
  • E = energy output (kWh);
  • A = panel area (m2);
  • G = solar irradiance (kWh/m2/day);
  • η = panel efficiency;
  • PR = performance ratio (~0.75–0.85).
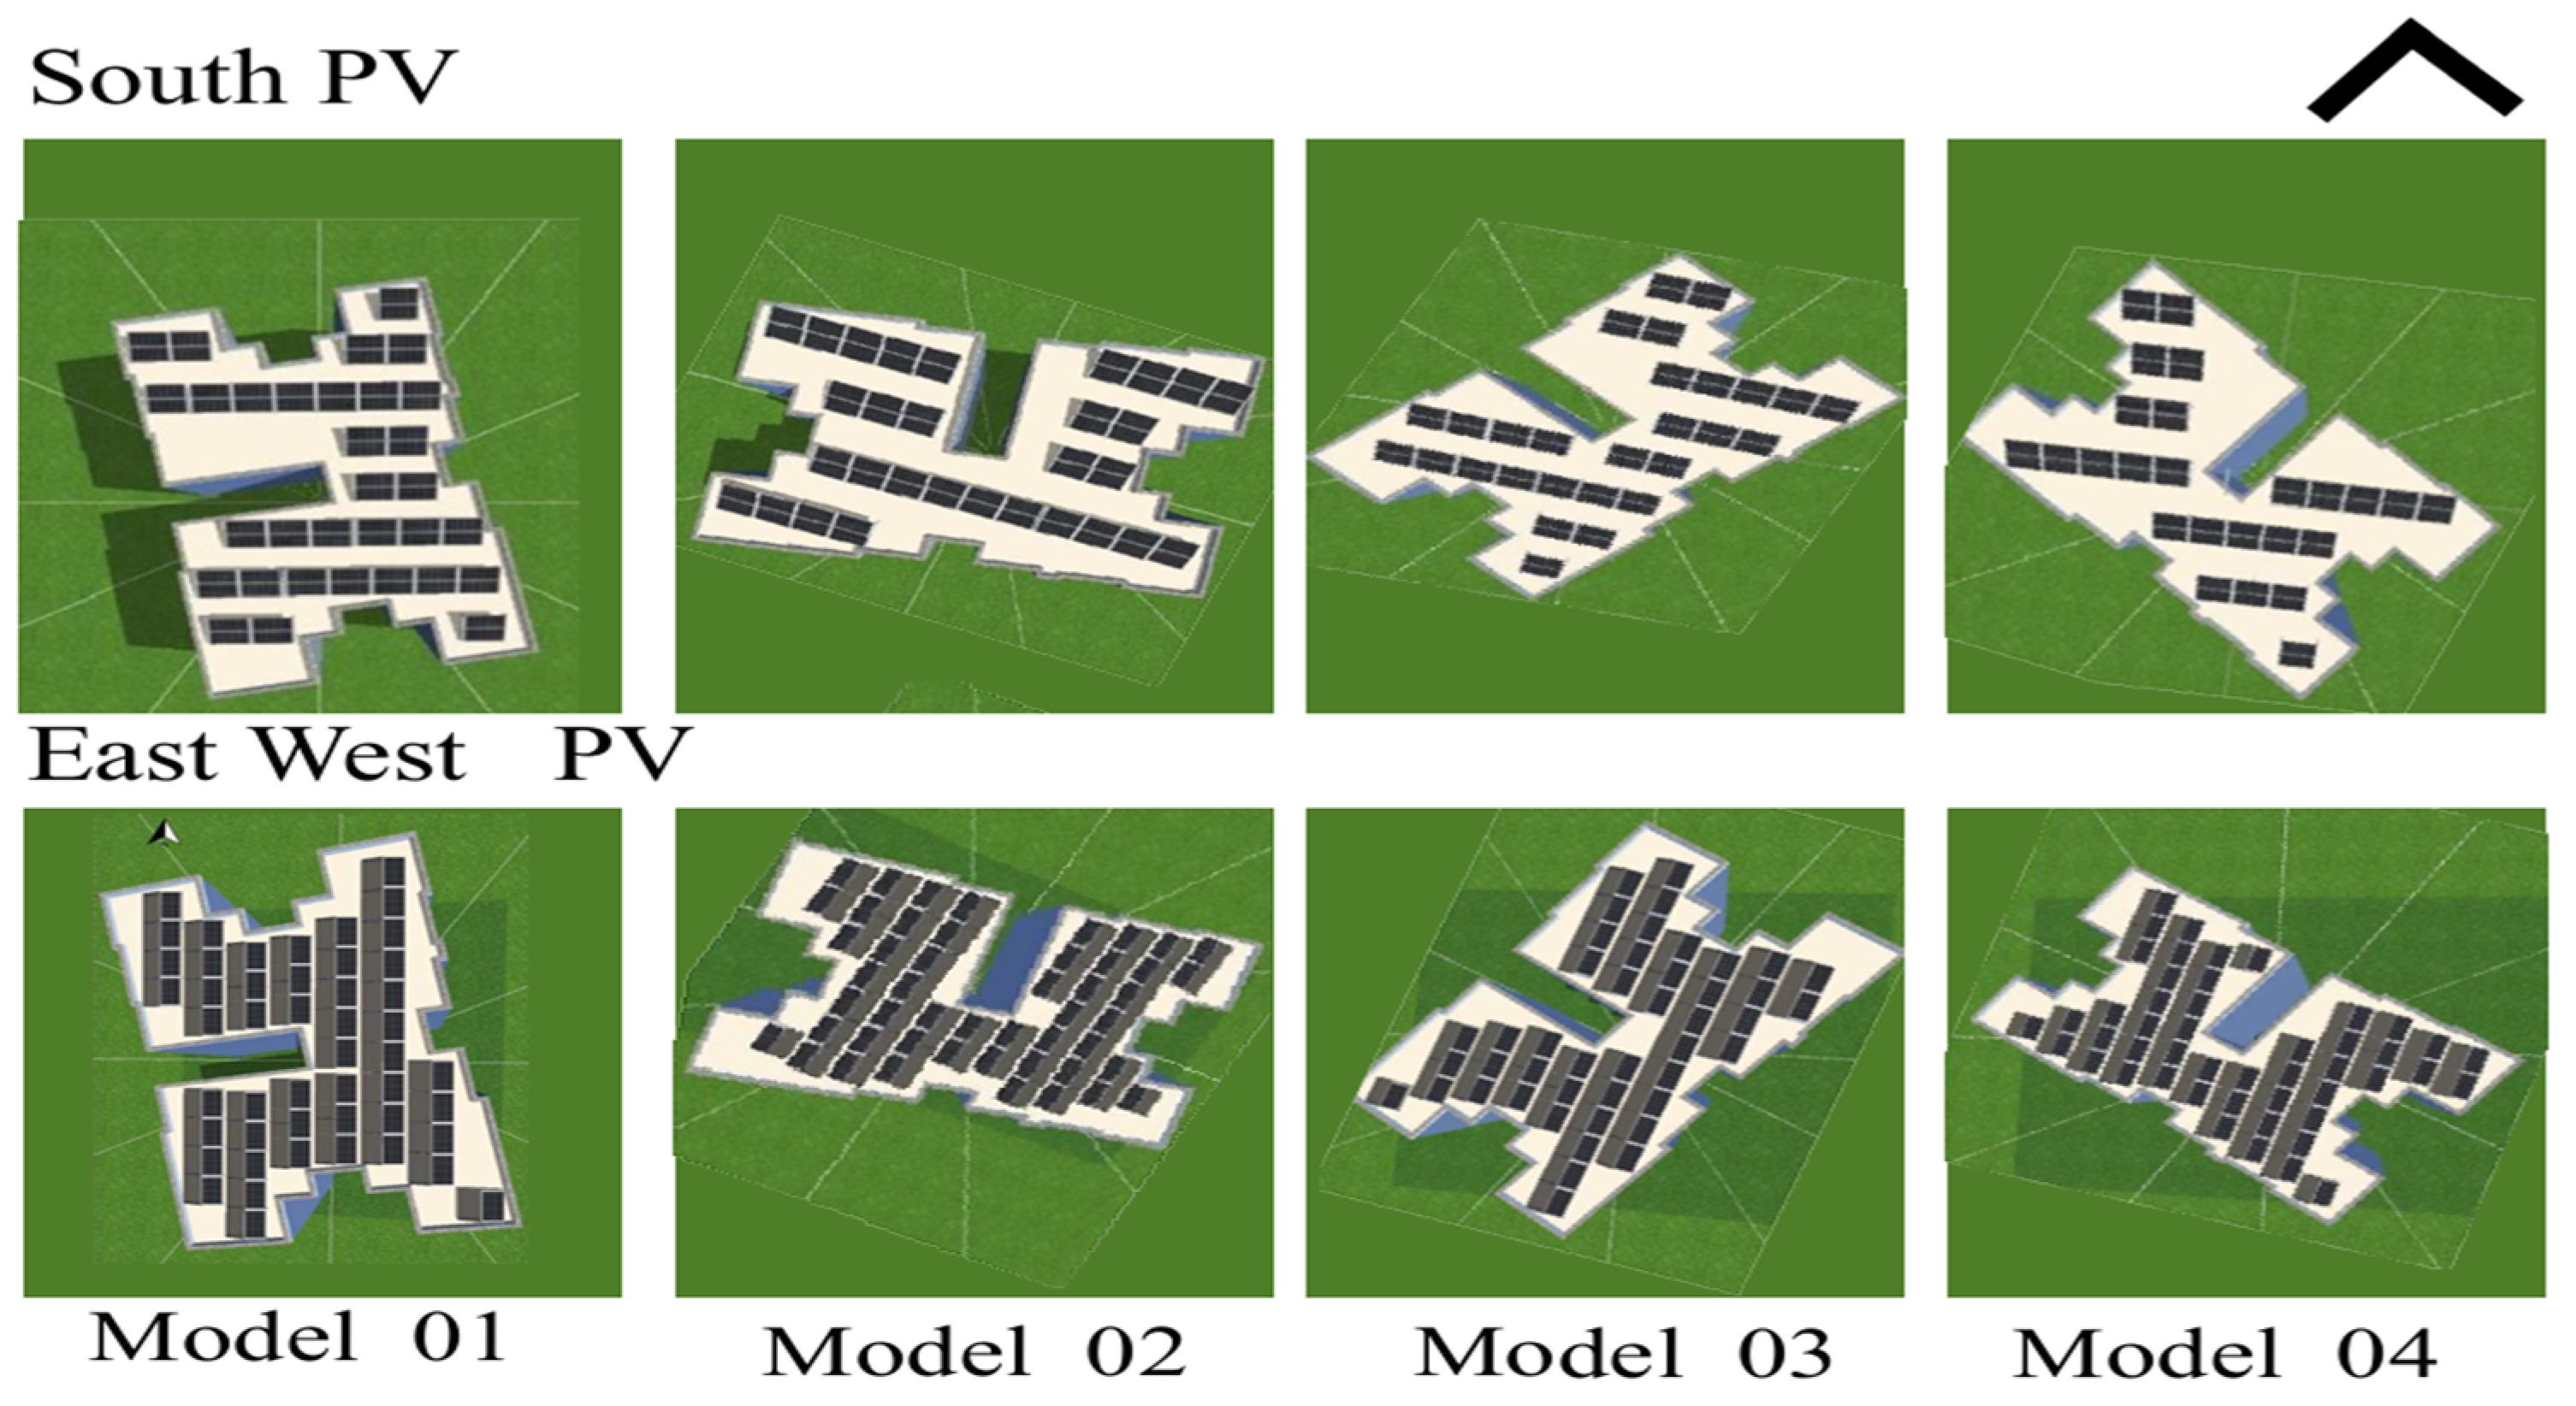
The systems were analyzed based on the PV type, orientation techniques, number of panels on the top of each building, and fixed inverter type, and then connected to the grid. High-efficiency 550 W Jinko Solar modules were used, with system designs optimized to Cairo’s conditions. More information about Jinko solar modules and system performance analysis are provided in Supplementary Materials. The pure south orientation employed 25 tilts and minimal shading, while the east–west orientation used +10° and −10° tilts to maximize rooftop coverage [38,39], as shown in Figure 6. The dimension of each PV panel is 2.27 m × 1.13 m, with a 2 m spacing between rows. The efficiency of the module is 21.29% at a Standard Temperature Condition (STC). The module weighs 27.5 kg, and the frame is made from anodized aluminum alloy.
The details regarding the number of panels and other PV design conditions are presented in Table 7 and Table 8. The climate data for Cairo was used from the PV-SOL database (EPW format). Simulation models used diffuse irradiation onto a horizontal plane based on the “Hofmann” model and irradiance onto tilted surfaces based on the “Hay & Davies” model. All PV models in the different orientation techniques used the inverter model SUN2000-30KTL-M3(380Vac)—(v2). The inverter model has an efficiency of 98.6%, an input voltage range of 160–1000 V, a maximum input current of 22 A per MPPT, and an output power of 30 kW, and the protection equals an IP65 rating.
The other boundary conditions can be described as follows: the study period is a 25-year lifecycle, the fixed electricity tariff equals (1.3 EGP/kWh), and the system maintenance is 1% of the initial cost annually.
Installing PV panels with pure south orientation limited rooftop capacity to 50–64 panels per building, impacting total energy generation and savings. Model 01 achieved the highest electricity generation at 57,816 kWh annually, corresponding to 28.06% energy savings, while Model 04 recorded the lowest at 45,169 kWh with 21.92% savings. Annual generation was calculated based on panel output, average peak sunshine hours (4.5 h/day), and 365 operating days.
In contrast, the east–west orientation significantly increased rooftop capacity, enabling the installation of 90–98 panels per building—an approximately 50% increase in Models 03 and 04 compared to the south orientation. This larger PV array resulted in higher energy generation, with the minimum recorded saving at 39.46% (Model 03), exceeding the maximum saving achievable with pure south installation.
The main findings of this step indicated that using East West orientation techniques enabled us to install large numbers of PV panels on the rooftop. This resulted in duplicating electricity generation, cost saving, and a reduction in CO2 emissions. This achievement is aligned with the Egyptian governmental target to generate 42% of the electricity using renewable energy sources by 2035.

6. Discussion

6.1. Cost Savings from PV Integration in Sakan Masr

As shown in Table 9 and Table 10, energy saving percentage and energy cost are calculated according to the following equations:
Energy Saving percentage = Electricity generation for the project (kWh) annually/Electricity consumption for the project kWh (Energy)
Energy saving cost L.E. (1.3 L.E/kWh 3rd unit) annually = Electricity generation for the project (kWh) annually × 1.3 L.E.
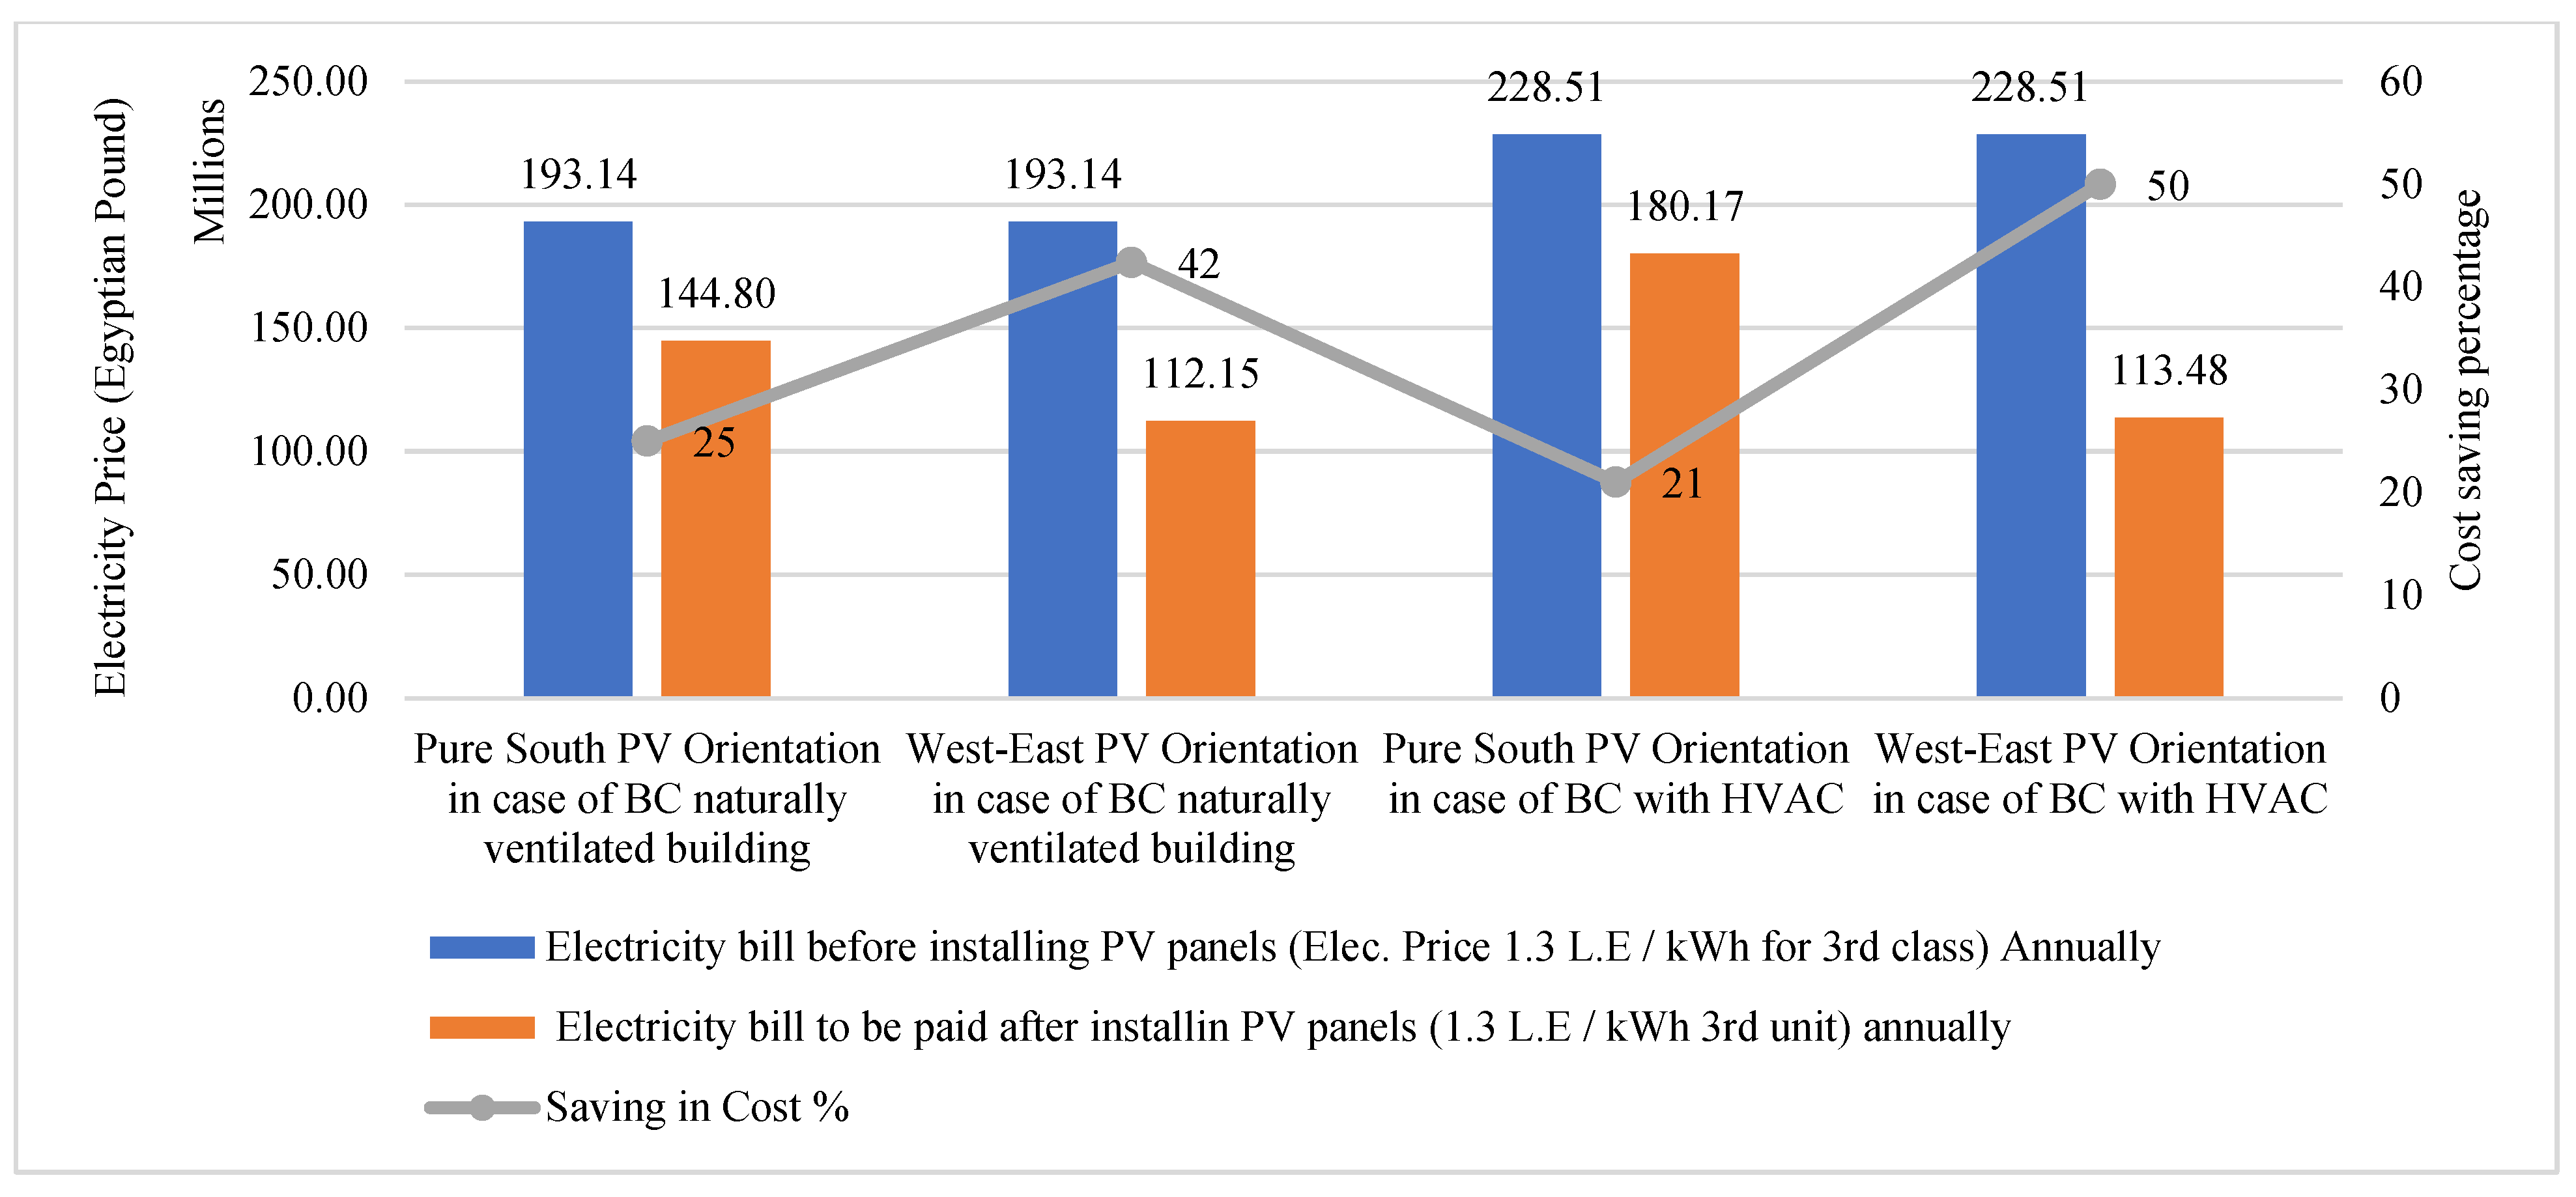
For the entire Sakan Masr project (721 buildings), the annual electricity cost without PV systems is estimated at 193 million Egyptian Pounds (L.E). Installing PV systems significantly reduces this cost. With the pure south orientation, annual costs drop to 144 million L.E, saving up to 25% in naturally ventilated buildings and 21% with HVAC.
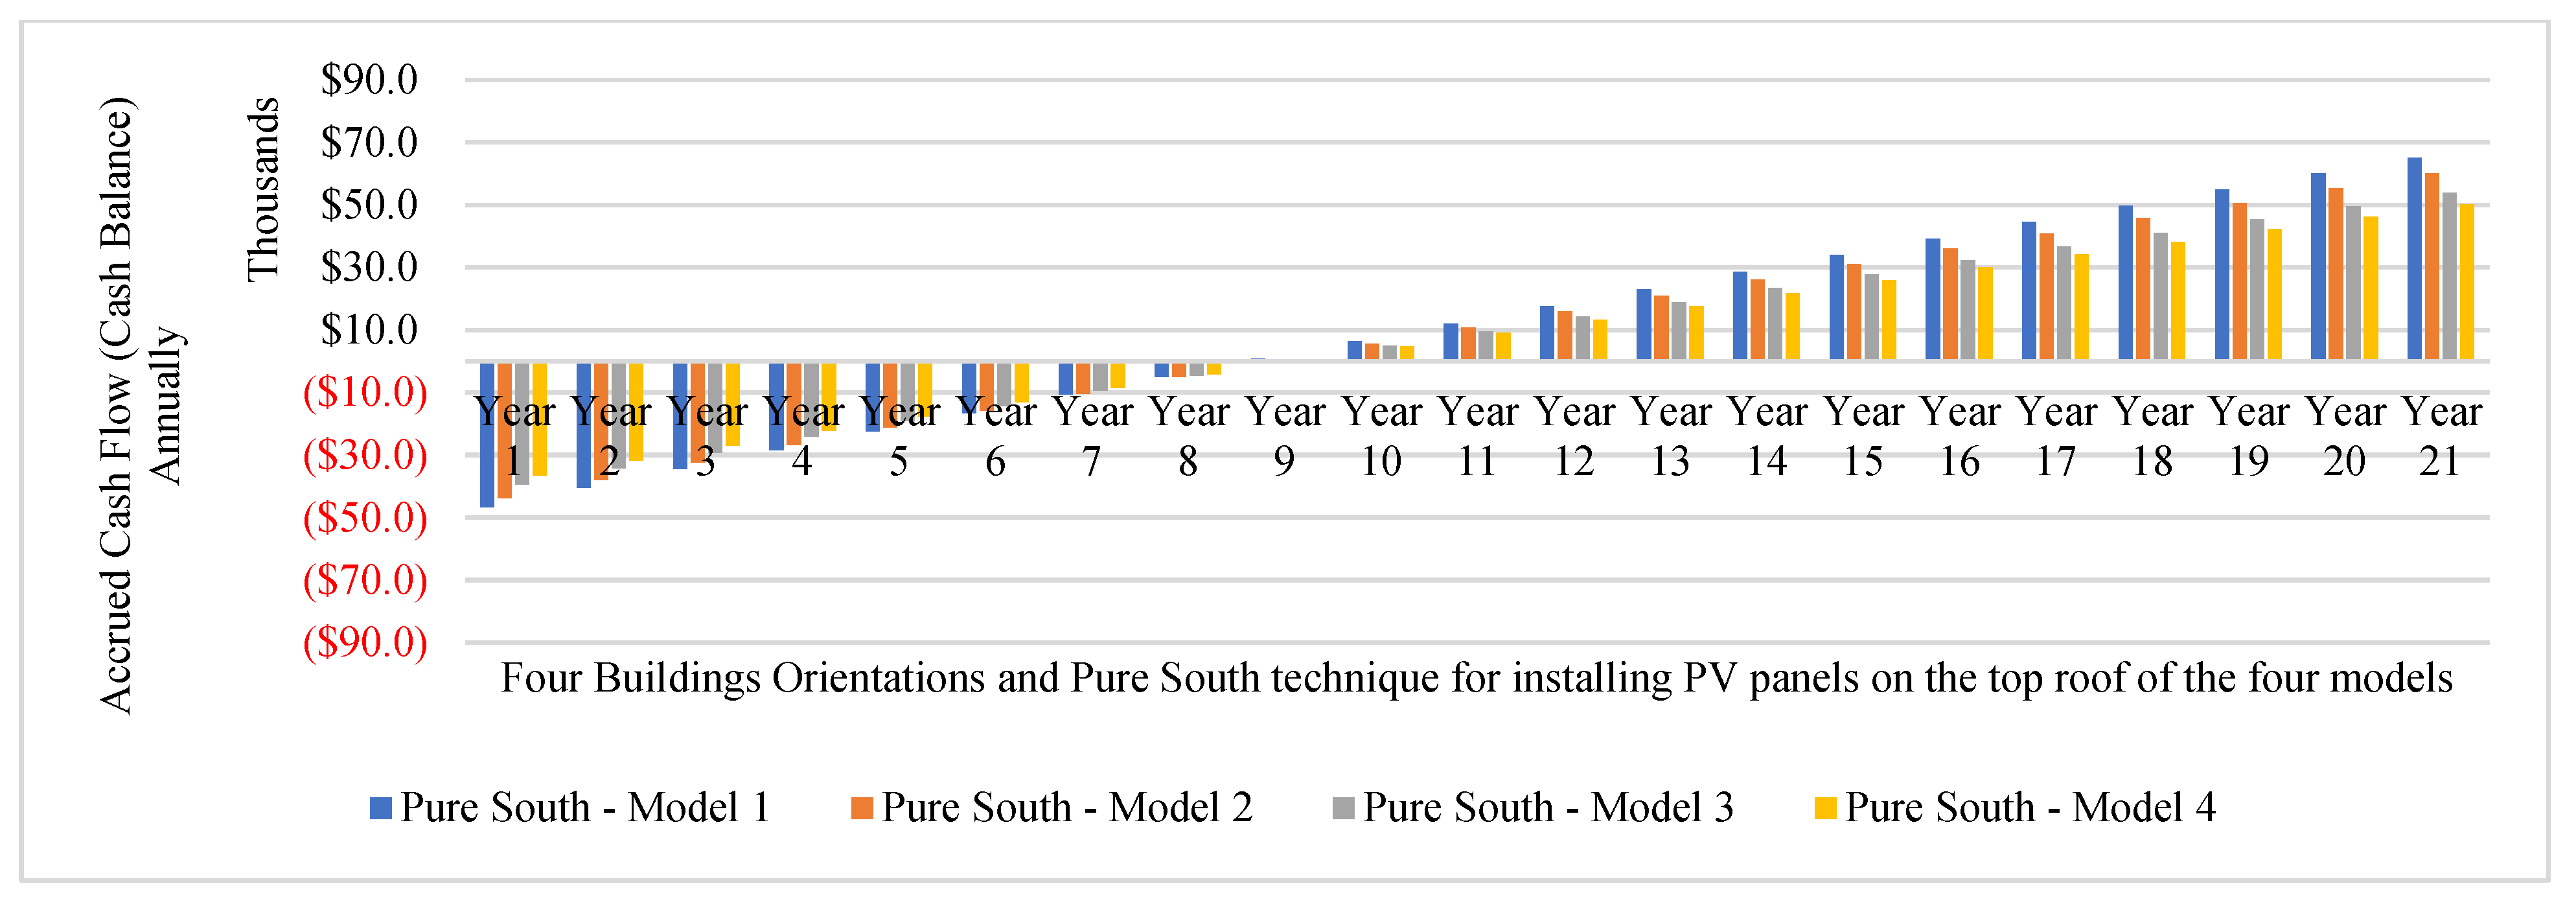
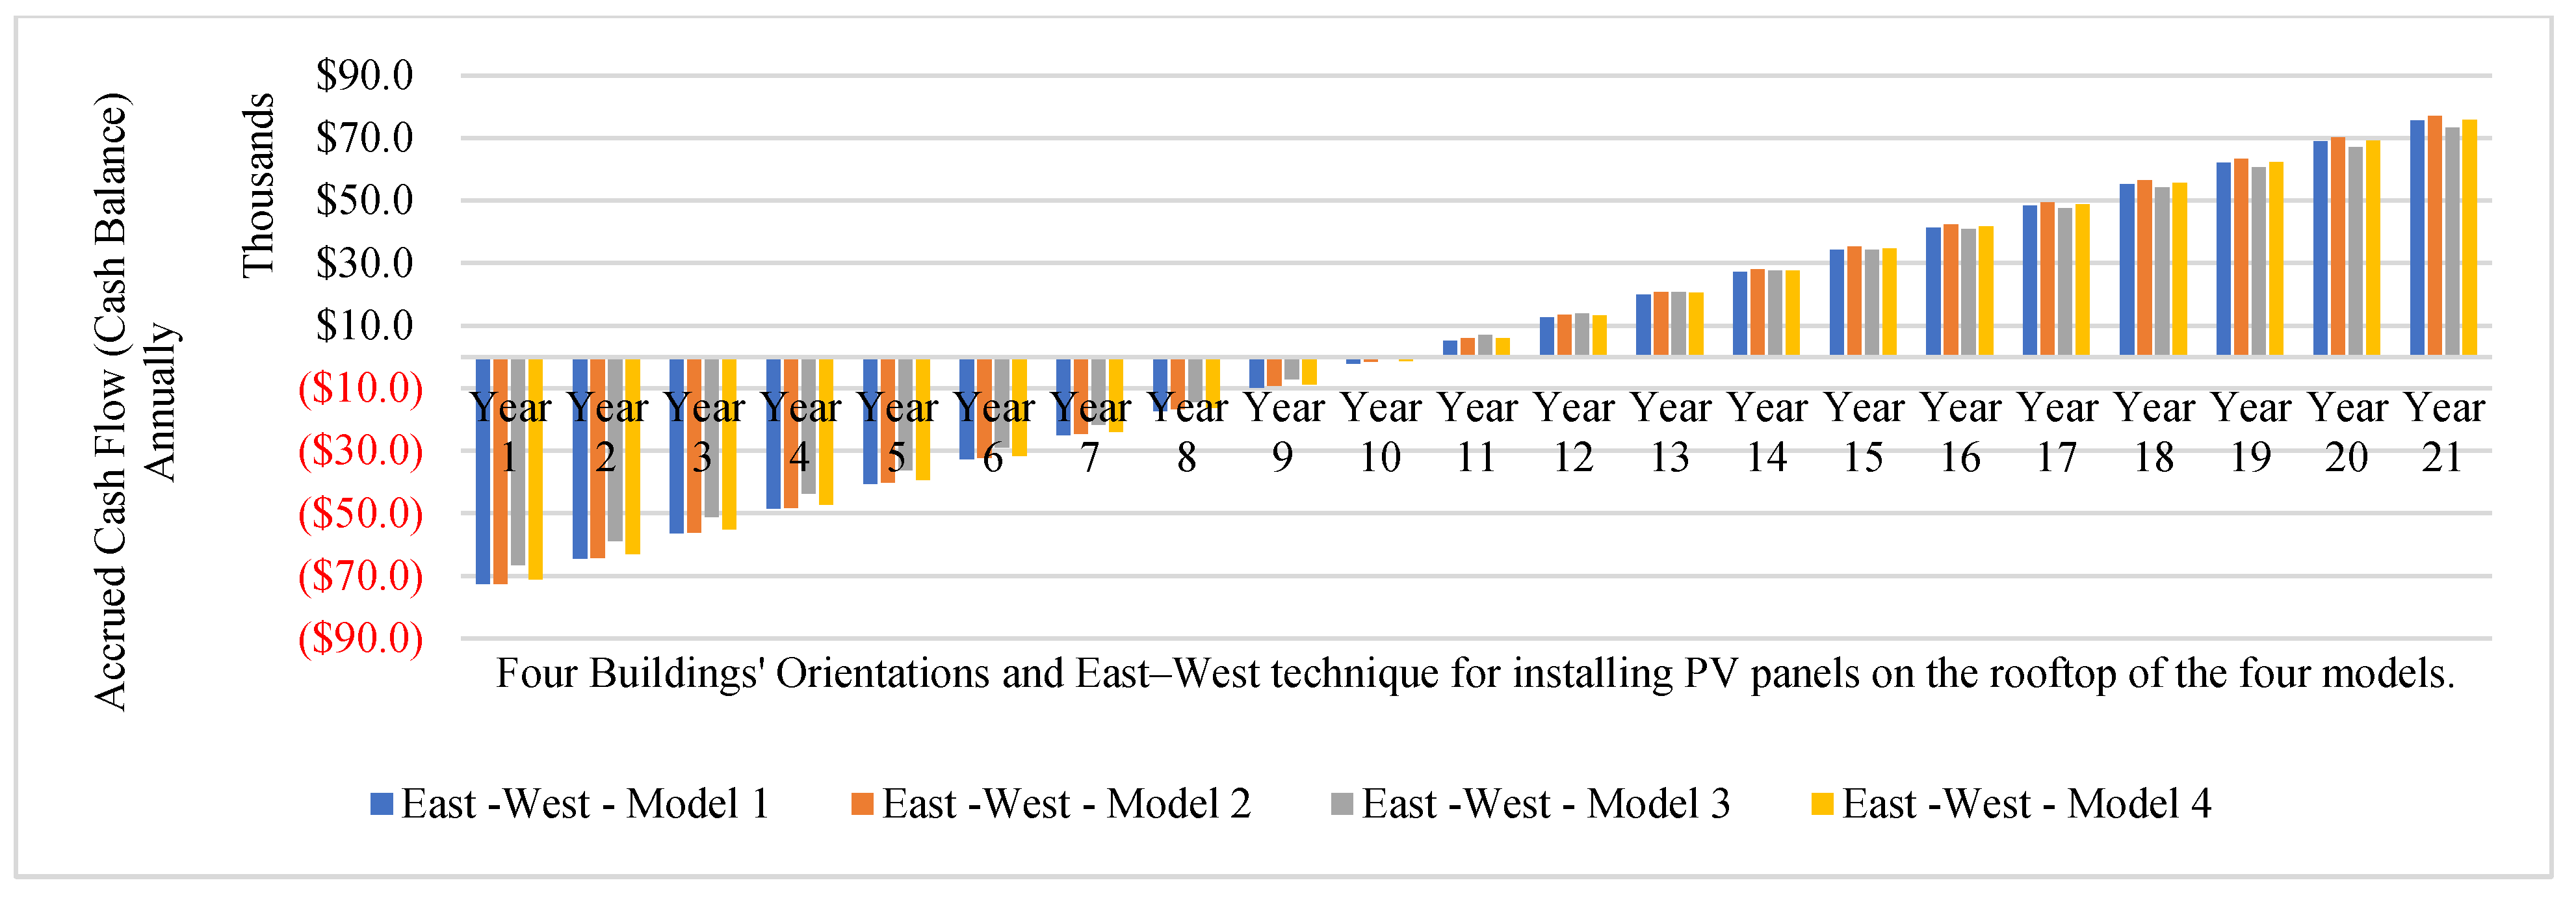
The east–west orientation, which allows for more rooftop panels (90–98 panels per building vs. 50–64 per building in case of pure south), lowers costs further to 112 million L.E, achieving 42% savings in naturally ventilated scenarios and 50% with HVAC systems as shown in Figure 7. Although this option involves 60% higher upfront costs (Cost of system installation = electricity generation * PV system cost: 8000–10,000 L.E/kWp installed. As show in Table 9; In pure south = electricity generation in all models * 10,000 L.E = 371,865,290 L.E). In east–west = electricity generation for all models * 10,000 L.E = 622,985,470 L.E), it generates greater long-term savings of up to 36% and 42% in the case of buildings without HVAC and HVAC, respectively, as shown in Table 9 and Table 10. It is important to indicate that installing HVAC increases the total electricity consumption in BC and the total cost of bills, as shown in Figure 8. Cash flow analysis shows a payback period of eight years for the south-oriented system and ten years for the east–west setup. Despite the longer return period, the east–west orientation delivers superior financial benefits over time, as shown in Figure 9 and Figure 10.
The economic viability of the proposed system significantly outperforms established benchmarks across various regions. While typical payback periods range from 6 to 14 years, according to studies from IRENA Egypt (2022), IEA Egypt, World Bank MENA, UAE Residential, Jordan Middle-Income, and Morocco Social Housing, the current system demonstrates a consistent payback period of just 4.2–4.3 years. This performance translates to a substantial improvement, with the system being 40% to 69% better than typical benchmarks, highlighting its strong economic feasibility [40,41]. More information about economic aspects is provided in Supplementary Materials.

6.2. Environmental Impact and CO2 Emission Reduction

Installing PV systems significantly reduces CO2 emissions by replacing grid electricity generated from fossil fuels. The CO2 emissions avoided are calculated according to the following equation:
C O 2   A v o i d e d = A n n u a l   P V   G e n e r a t i o n   ( k W h )   ×   G r i d   E m i s s i o n   F a c t o r   ( k g   C O 2 / k W h )
where the grid emission factor for Egypt should be around 0.55–0.7 kg CO2/kWh based on the country’s fossil fuel-dominated grid.
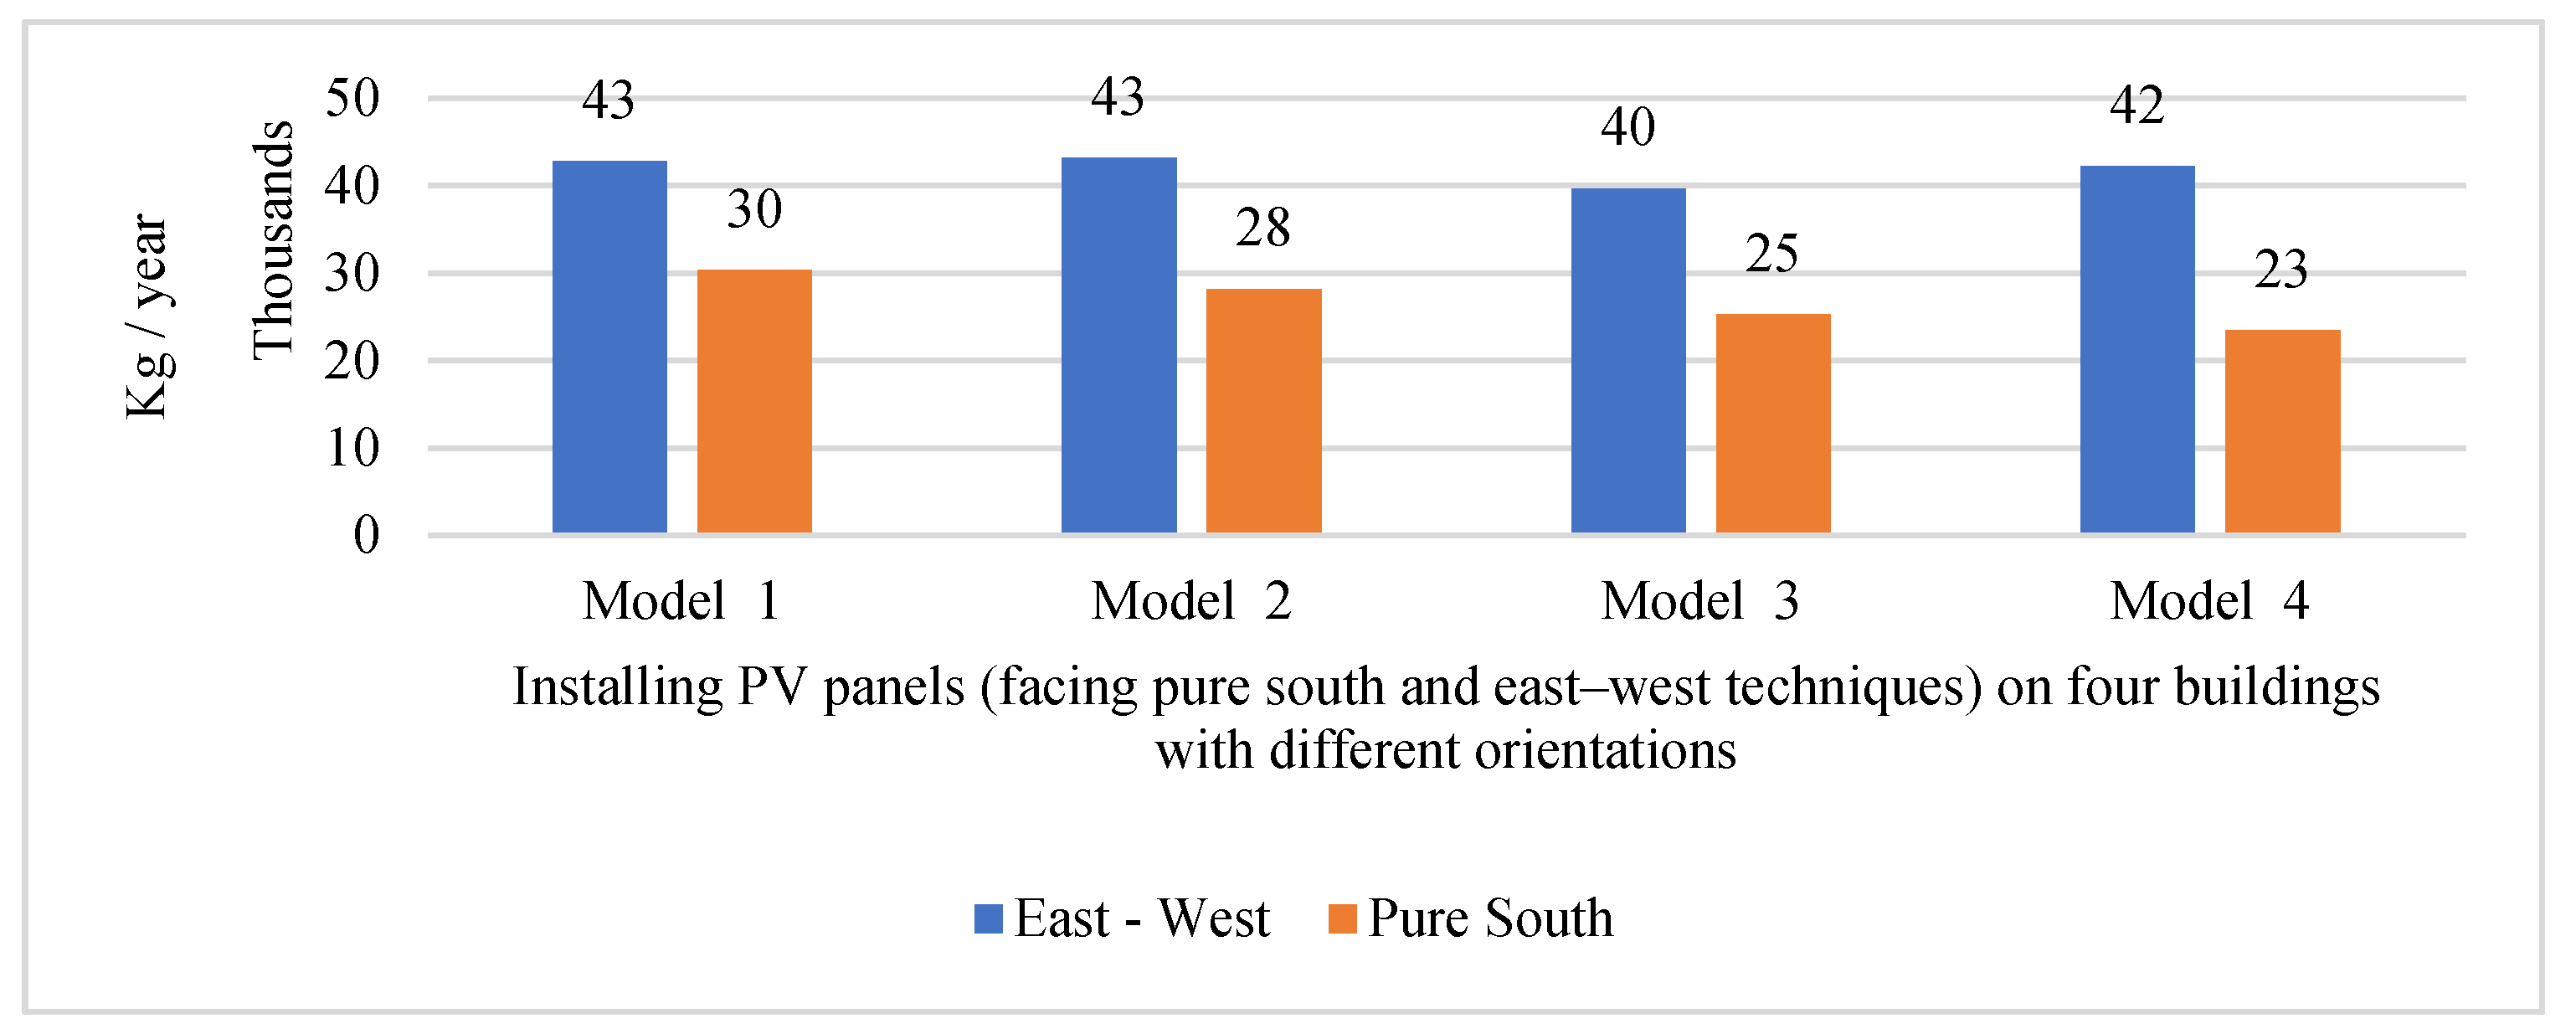
The pure South orientation avoids approximately 107 tons of CO2 annually, while the east–west orientation achieves up to 168 tons due to higher energy output, as shown in Figure 11. These reductions support Egypt’s decarbonization goals and highlight the environmental value of maximizing rooftop PV capacity.

6.3. Model Validation

The validation of this model is done through the following three steps:
  • In this study, PV panels from Jinko called “Solar 550 W” were used. A comparison has been made between the model specifications extracted from the Jinko datasheet and the PV-SOL database. Table 11 shows that the model specifications in both cases are almost identical.
2.
In the second step, a comparison between the simulation results and the rated power based on Jinko has been conducted. Table 12 shows the maximum performance ratio, and Table 13 shows the performance ratio for each module in each orientation.
3.
In the third step, validation was done by comparing our results (energy consumption) with those of previous studies.
The baseline electricity demand established for the current Sakan Masr middle-income prototype in New Cairo (with HVAC) is 10,207 kWh per apartment per year, equivalent to 88.8 kWh/m2/year. This value reflects a realistic consumption scenario where split-unit air conditioning is used only during peak summer months (July and August). Compared to other national studies addressing similar residential typologies, this figure represents a notably efficient baseline.
In the study titled, The Southern Walls as an Environmental Determinant: A Case Study—Sakan Misr Project, the authors researched the same housing typology but focused on south-oriented units; however, in terms of the environmental area in the Cairo region, the total baseline energy consumption was 13,705.72 kWh/year per unit. This included 11,192.04 kWh/year for cooling and 2513.68 kWh/year for heating. The study highlights the significant thermal impact of unshaded southern façades in Cairo’s hot climate, particularly prior to the application of any shading systems or code-based design modifications [36].
A second reference study, Using Green Roofs for Social Housing to Improve Energy Consumption in New Cities, evaluated the impact of roof treatments in the Sakan Masr project located in New Cairo, Cairo Governorate. For the traditional building case, baseline consumption totaled 10,446.23 kWh/year per apartment, comprising 8367.32 kWh/year for cooling and 2078.91 kWh/year for heating. Although this is slightly higher than the baseline in the present study, the difference becomes more pronounced in later scenarios when roof greening measures are introduced [13].
A third study, Towards a Strategy for Designing Sustainable Zero-Energy Buildings Using Building Information Modeling (BIM), analyzed the Sakan Masr worker housing unit of 118 m2 in the New Administrative Capital. The unmodified baseline energy use across all orientations was estimated at 13,334 kWh/year per unit (based on an average of 113 kWh/m2/year). The most energy-intensive orientation—the south-facing unit—reached 14,772 kWh/year. This high consumption was attributed to conventional construction techniques, lack of envelope optimization, and assumed continuous occupancy [37].
Taken together, these comparative cases serve to cross-validate the findings of the present study. The relatively lower baseline energy use modeled for the Sakan Masr prototype aligns with its updated assumptions regarding lighting, occupancy, and HVAC scheduling. The consistency of this figure—despite differing study methods and site conditions—reinforces the credibility of the simulation results and supports their use as a benchmark for evaluating the impact of photovoltaic integration and passive design strategies in similar residential settings.

6.4. General Discussion

This study demonstrates the significant potential for enhancing the energy performance of middle-income housing in Egypt through a combination of passive design strategies and strategic PV system integration. By focusing on realistic occupancy patterns and updated technological assumptions, the research produced more accurate projections of electricity demand, a step often overlooked in previous modeling efforts.
The optimization of the building envelope, although yielding moderate improvements in thermal comfort, underscores the challenge of achieving substantial indoor comfort gains through passive means alone under Cairo’s hot semi-arid climate. Roof insulation and enhanced glazing were effective in reducing cooling demand, but wall insulation was found unnecessary, suggesting that optimization strategies must be selectively applied based on climatic realities rather than generalized standards.
The analysis of PV installation techniques revealed that system design—particularly panel orientation and rooftop utilization—is more critical than the nominal efficiency of the panels themselves. East–west-oriented systems, despite a slight tilt disadvantage, allowed greater panel density and thus higher annual energy production and cost savings. This finding challenges the conventional assumption that South-facing installations are universally optimal and points to a need for context-specific PV deployment strategies, especially in urban developments where roof space is at a premium.
Moreover, the environmental benefits extend beyond energy savings. The avoided CO2 emissions associated with widespread PV adoption in projects like Sakan Masr are substantial, supporting Egypt’s renewable energy targets for 2035. However, the study also illustrates that passive measures and PV systems must be integrated thoughtfully. For instance, reliance on air conditioning systems significantly raises baseline electricity use, thereby diluting the proportional impact of PV-generated electricity and emphasizing the necessity of reducing demand before investing heavily in supply-side solutions.
Potential sources of error include the use of EPW weather data files, which may not accurately represent the specific microclimate conditions of New Cairo. Additionally, uncertainties may arise from variations in occupancy schedules and appliance load assumptions, which could result in an estimated ±5% deviation in annual energy consumption predictions.
A key limitation of this study lies in the economic evaluation, which assumed static electricity prices and did not account for potential future decreases in PV system costs or increases in energy tariffs. Similarly, broader urban-scale factors—such as grid integration challenges, policy incentives, and maintenance infrastructure—were beyond the scope of this research but will be critical for actual implementation.
There are currently no previous studies focused on Sakan Masr in New Cairo that allow for a direct comparison of the energy consumption results. Moreover, this study adopted a specific methodology that examined two techniques using a particular type of PV module. Other module types and orientation strategies were beyond the scope of this research but can be explored in future studies.
Future research should also explore dynamic energy pricing models, the incorporation of battery storage solutions, and alternative PV technologies such as bifacial modules or sun-tracking systems. Investigating district-scale energy-sharing mechanisms, such as microgrids, could also maximize the benefits of PV integration across larger housing developments.
In summary, while envelope optimization can marginally reduce cooling loads, the real gains in achieving near-net-zero performance in Egyptian residential housing will come from maximizing rooftop PV potential through smart system design, supported by targeted passive interventions to moderate energy demand.

7. Conclusions

This research demonstrates that integrating rooftop PV systems and passive design measures improvements can significantly enhance the energy efficiency of Egyptian middle-income housing, as exemplified by the Sakan Masr prototype.
While passive measures such as roof insulation and glazing upgrades improved thermal comfort (to 2–4% and 8–10% without using HVAC and with HVAC) and reduced cooling demand (by 16, 8, 14, and 11 kWh per apartment per square meter per month for Models 1, 2, 3, and 4, respectively.), their overall impact was moderate, reaffirming the limitations of passive strategies alone under hot semi-arid conditions. In contrast, PV system design had a profound effect: shifting from pure South-facing to East-West-oriented arrays increased electricity generation by over 14%, enabled higher rooftop panel densities, and achieved greater cost savings and carbon emission reductions.
Implementing East-West PV systems could save up to 50% of electricity costs annually in buildings with HVAC systems, while also avoiding up to 167.9 tons of CO2 emissions per year. These results directly support Egypt’s national renewable energy targets and underline the importance of adopting flexible, context-specific PV deployment strategies in future residential projects.
Ultimately, a combined approach that prioritizes both demand reduction and smart renewable energy integration is essential for moving towards sustainable and resilient urban housing models in Egypt.

Supplementary Materials

The following supporting information can be downloaded at: https://www.mdpi.com/article/10.3390/buildings15132326/s1.

Author Contributions

Conceptualization, E.R.; Methodology, E.R.; Software, E.R. and R.A.; Formal analysis, E.R. and R.A.; Resources, E.R. and S.E.; Writing—original draft, E.R.; Writing—review & editing, E.R. and S.E. All authors have read and agreed to the published version of the manuscript.

Funding

This research received no external funding.

Data Availability Statement

The data will be available upon your request.

Acknowledgments

The authors would like to express their sincere gratitude to Rana Elshafei, Research Assistant at the Smart and Future Cities Lab, for her valuable contributions to this research. Her work in organizing and arranging the data, preparing diagrams, and supporting the overall presentation of the findings greatly enriched the quality and clarity of the study. The authors also thank the Smart and Future Cities Lab for providing a collaborative research environment that made this work possible.

Conflicts of Interest

The authors declare that they have no known competing financial interests or personal relationships that could have appeared to influence the work reported in this paper.

References

  1. The World Bank 2024, The World Bank Website. Available online: https://data.worldbank.org/indicator/SP.POP.GROW?locations=EG (accessed on 5 February 2024).
  2. Shalaby, H.; Ahmed, N.; Elshanwany, H. The role of housing projects in Egypt toward solving the low-income housing problem. Egypt. Int. J. Eng. Sci. Technol. 2022, 40, 71–82. [Google Scholar] [CrossRef]
  3. Santamouris, M.; Vasilakopoulou, K. Present and future energy consumption of buildings: Challenges and opportunities towards decarbonisation. e-Prime-Adv. Electr. Eng. Electron. Energy 2021, 1, 100002. [Google Scholar] [CrossRef]
  4. Abdelsalam, G.M.; Razzaz, Z.E.L.M.; Elnekhaily, F. Effectiveness of High Energy Efficiency to Minimize Energy Consumption for Residential Buildings in Egypt. Eng. Res. J. 2020, 165, 78–95. [Google Scholar] [CrossRef]
  5. Alsaadani, S. A statistical review of a decade of residential energy research in Egypt. Energy Rep. 2022, 8, 95–102. [Google Scholar] [CrossRef]
  6. New & Renewable Energy Authorities in Egypt. Annual Report 2022. 2022. Available online: http://nrea.gov.eg/Content/reports/Annual%20Report%202022%20Eng.pdf (accessed on 10 June 2025).
  7. Almasri, R.A.; Alshitawi, M.S. Electricity consumption indicators and energy efficiency in residential buildings in GCC countries: Extensive review. Energy and Building. 2022, 255, 111664. [Google Scholar] [CrossRef]
  8. Gibson, A. Long-term Energy System Modelling for a Clean Energy Transition in Egypt’s Energy Sector. Energies 2024, 17, 2397. [Google Scholar] [CrossRef]
  9. Moharram, N.A.; Tarek, A.; Gaber, M.; Bayoumi, S. Brief review on Egypt’s renewable energy current status and future vision. Energy Rep. 2022, 8, 165–172. [Google Scholar] [CrossRef]
  10. Salah, S.I.; Eltaweel, M.; Abeykoon, C. Towards a sustainable energy future for Egypt: A systematic review of renewable energy sources, technologies, challenges, and recommendations. Clean. Eng. Technol. 2022, 8, 100497. [Google Scholar] [CrossRef]
  11. De Boeck, L.; Verbeke, S.; Audenaert, A.; De Mesmaeker, L. Improving the energy performance of residential buildings: A literature review. Renew. Sustain. Energy Rev. 2015, 52, 960–975. [Google Scholar] [CrossRef]
  12. Soliman, M.H. Environmental Economic Design of Medium Class Housing Building Models. J. Asian Sci. Res. 2020, 10, 70–87. [Google Scholar] [CrossRef]
  13. Goda, Z.M.A.; Foda, M.A.M.; Elsayyad, N.A.E. Using Green Roofs for Social Housing to Improve Energy Consumption in New Cities. (An Applied Study of Social Housing in Egypt’s New Cairo City). Future Cities Environ. 2023, 9, 1–11. [Google Scholar] [CrossRef]
  14. Abdollah, M.A.F.; Scoccia, R.; Filippini, G.; Motta, M. Cooling energy use reduction in residential buildings in Egypt accounting for global warming effects. Climate 2021, 9, 45. [Google Scholar] [CrossRef]
  15. Nafeaa, S.; Mohamed, A.; Fatouh, M.; Ahmed, M.F. Assessment of energy saving in residential buildings using energy efficiency measures under Cairo climatic conditions. Eng. Res. J. 2020, 166, 320–349. [Google Scholar] [CrossRef]
  16. Hamed, R.E.-D. Transforming Low-Income Communities through improving the Efficiency of Architectural Energy Saving Design. J. Urban. Res. 2017, 24, 135–156. [Google Scholar] [CrossRef]
  17. Antuña-Rozado, C.; García-Navarro, J.; Reda, F. Early energy assessment at the neighborhood level to promote greater energy efficiency. The case of Nabta Smart Town in Egypt. Habitat. Int. 2023, 136, 102782. [Google Scholar] [CrossRef]
  18. Hegazy, R. Toward efficient energy consumption in middle income housing buildings in Egypt. Int. J. Low-Carbon Technol. 2020, 15, 180–189. [Google Scholar] [CrossRef]
  19. Petcuț-Lasc, A.-A.; Bălaş, V.E.; Petcuț, F.-M. Analysis of a residential photovoltaic system. In Proceedings of the XIV International Conference on Industrial Engineering and Environmental Protection IIZS 2024 Technical Faculty “Mihajlo Pupin” Zrenjanin, Zrenjanin, Serbia, 3–4 October 2024; pp. 198–205. [Google Scholar] [CrossRef]
  20. Samir, H.; Samir, H.; Ali, N.A. Applying Building-integrated Photovoltaics (BIPV) in Existing Buildings, Opportunities and Constrains in Egypt. Procedia Environ. Sci. 2017, 37, 614–625. [Google Scholar] [CrossRef]
  21. Rodrigues, A.; Oliveira, A.C.; Palmero-Marrero, A.I. Integration of PV Systems into the Urban Environment: A Review of Their Effects and Energy Models. Urban Sci. 2024, 8, 215. [Google Scholar] [CrossRef]
  22. Cekić, N. Integrated Photovoltaic Systems in Ecorubarchitecture. Des. Art. Ind. 2024, 11, 23–31. [Google Scholar] [CrossRef]
  23. Baghdadi, A.; Abuhussain, M. In-Depth Analysis of Photovoltaic-Integrated Shading Systems’ Performance in Residential Buildings: A Prospective of Numerical Techniques Toward Net-Zero Energy Buildings. Buildings 2025, 15, 222. [Google Scholar] [CrossRef]
  24. Abdel-Wahab, A.M.; Abdel-Gawad, A.K.; El-Shenawy, E.; El-Alfy, A.H. Architectural solution by saving energy using photovoltaic panels as an environmentally friendly solution: Existing Egyptian government buildings. ARPN J. Eng. Appl. Sci. 2024, 19, 1336–1352. [Google Scholar] [CrossRef]
  25. Elkelawy, M.; Saeed, A.; Seleem, H. Egypt’s Solar Revolution: A Dual Approach to Clean Energy with CSP and PV Technologies. Pharos Eng. Sci. J. 2024, 1, 39–50. [Google Scholar] [CrossRef]
  26. Caponigro, M.; Manoloudis, A.; Papadopoulos, A.M. Developing a strategy for energy efficiency in the Egyptian building sector. IOP Conf. Ser. Earth Environ. Sci. 2020, 410, 012076. [Google Scholar] [CrossRef]
  27. Abdulhady, H.A.; Metwally, H.M.; Fattah, T.A.A. Review of the Factors Affecting the Solar Energy Yield in Egypt. 2020. Available online: https://eijest.journals.ekb.eg/article_97330.html (accessed on 4 July 2023).
  28. Gamaleldine, M.; Corvacho, H. Compliance with Building Energy Code for the Residential Sector in Egyptian Hot-Arid Climate: Potential Impact, Difficulties, and Further Improvements. Sustainability 2022, 14, 3936. [Google Scholar] [CrossRef]
  29. Eladawy, M.L.; Basset, H.A.; Morsy, M.; Korany, M.H. Study of trend and fluctuations of global solar radiation over Egypt. NRIAG J. Astron. Geophys. 2021, 10, 372–386. [Google Scholar] [CrossRef]
  30. Ragab, A.; Abdelrady, A. Impact of green roofs on energy demand for cooling in egyptian buildings. Sustainability 2020, 12, 5729. [Google Scholar] [CrossRef]
  31. Central Agency for Public Mobilization and Statistics (CAPMAS). The Annual Bulletin of Births and Deaths Statistics 2021. 2021. Available online: https://censusinfo.capmas.gov.eg/Metadata-ar-v4.2/index.php/catalog/1823 (accessed on 10 June 2025).
  32. Adel, R.; Kamel, B.; Amin, A.; El-Feki, S.; Nasreldin, R. Middle-income residential compounds towards resilience through risk management: Experts’ point of view. Ain Shams Eng. J. 2022, 13, 101797. [Google Scholar] [CrossRef]
  33. New Urban Communities Authority 2024. New Urban Communities Authority Website. Available online: http://www.newcities.gov.eg/Default.aspx (accessed on 5 July 2023).
  34. Elgohary, S.M.; Abdin, A.R.; Mohamed, R.M. Performative driven form finding in the early design stage. J. Eng. Appl. Sci. 2023, 70, 73. [Google Scholar] [CrossRef]
  35. Attia, S.; Evrard, A.; Gratia, E. Development of benchmark models for the Egyptian residential buildings sector. Appl. Energy 2012, 94, 270–284. [Google Scholar] [CrossRef]
  36. El-essawy, M.A.F.A. The southern walls as an environmental design determinant a case study: Sakan misr project. J. Urban Res. 2024, 48, 88–110. [Google Scholar]
  37. Mohamed, A.K.A.M.; Mohammed, A.B.; Elattar, S.M.S. Towards a Strategy for Designing Sustainable Zero-Energy Buildings Using Building Information Modeling (BIM). Int. J. 2023, 10, 1007–1021. [Google Scholar]
  38. Tashtoush, B.; Alalul, K.; Najjar, K. Designing sustainable Living: Optimizing on/off-Grid PV systems for Carbon-Reduced residential buildings in Jordan. Energy and Buildings. 2023, 297, 113441. [Google Scholar] [CrossRef]
  39. Emeara, M.S.; Abdelgawad, A.F.; El Abgay, A. Orientation-Optimization Simulation for Solar Photovoltaic Plant of Cairo International Airport. 2021. Available online: https://journals.ekb.eg/article_153972.html (accessed on 10 June 2025).
  40. IEA. Egypt: Energy System Overview. 2023. Available online: https://www.iea.org/countries/egypt (accessed on 10 June 2025).
  41. IRENA. Renewable Energy Market Analysis: Africa and Its Regions. Available online: https://www.irena.org/publications/2022/Jan/Renewable-Energy-Market-Analysis-Africa (accessed on 10 June 2025).
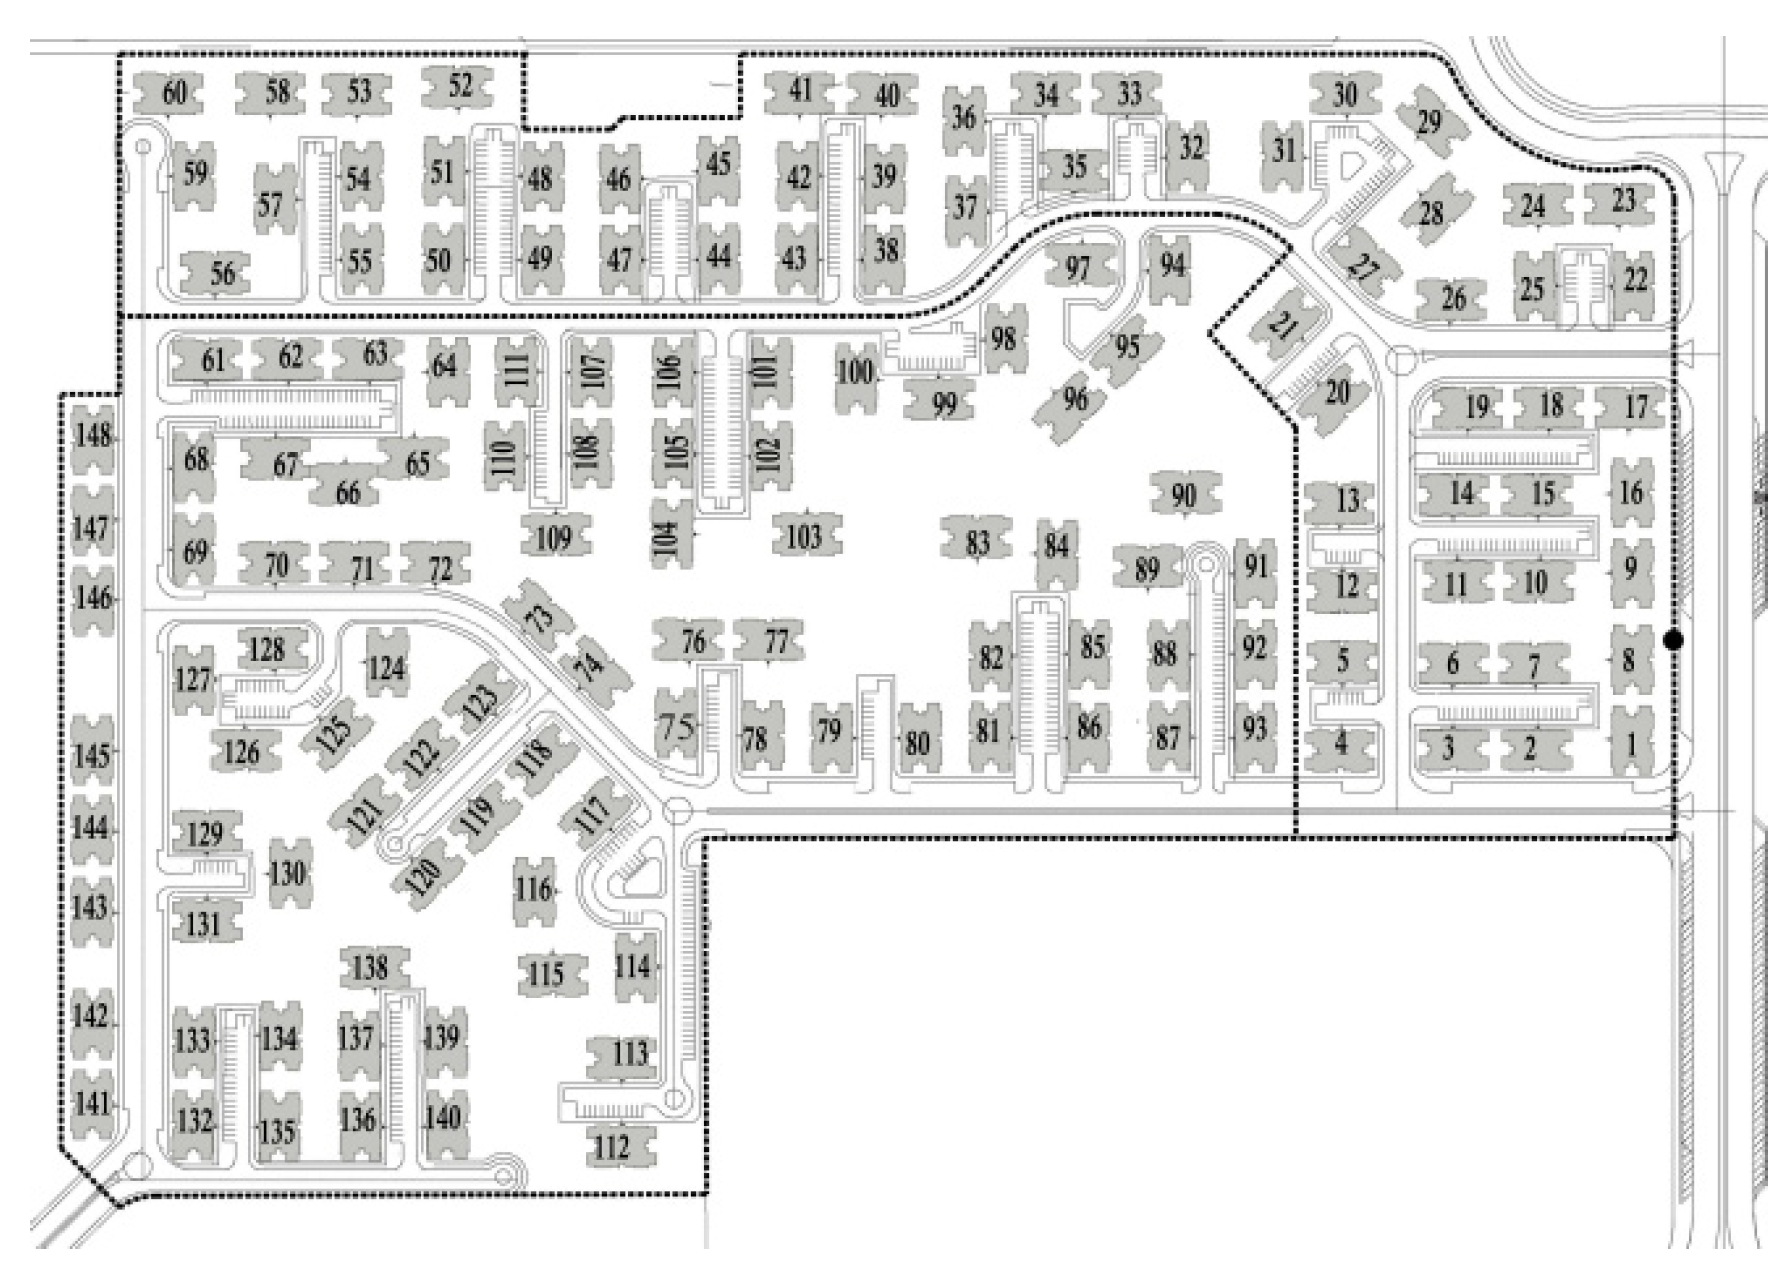
Figure 1. Example for Building orientations in Area no. 1 (Ministry of housing utilities & urban communities).
Buildings 15 02326 g001
Figure 2. Ground Floor Plan for Sakan Masr [26].
Buildings 15 02326 g002
Figure 3. Research methodology flow.
Buildings 15 02326 g003
Figure 4. Main building orientations in 14 areas of the Sakan Masr project, New Cairo.
Buildings 15 02326 g004
Figure 5. The percentage of required cooling and heating hours compared to the available comfort hours, according to ASHRAE-55, for one year in the Sakan Masr project before and after applying the optimization tool. This chart shows these percentages in twelve cases: (4 cases) that represent thermal comfort in BC in each building orientation and (four cases) after using optimizing tools and using only natural ventilation in the buildings, and (four cases) after using the optimizing tool and using HVAC systems split unit in the building. In the chart, blue color represents the percentage of required cooling hours, and gray represents the available comfort hours. There is a legend to the required heating hours but there are no required heating hours in all cases.
Buildings 15 02326 g005
Figure 6. PV panels oriented towards pure south (First PV panels’ orientation technique) and east–west (Second PV panels’ orientation technique) considering the four main orientations for the buildings in Sakan Masr.
Buildings 15 02326 g006
Figure 7. Annual total electricity consumption & total electricity generation in (kWh) using two installation techniques for the PV panels (Pure South, East–West Orientations) for the 721 buildings in the Sakan Masr housing project.
Buildings 15 02326 g007
Figure 8. Electricity price before and after installing PV panels in both orientations in BC with NV and BC after installing HVAC.
Buildings 15 02326 g008
Figure 9. The PV system cumulative cash flow of all models using the pure south technique to install the PV panels on the rooftop of the Sakan Masr Project in the New Cairo area.
Buildings 15 02326 g009
Figure 10. The PV system cumulative cash flow of all models using the east–west technique to install the PV panels on the rooftop of the Sakan Masr project in the New Cairo area.
Buildings 15 02326 g010
Figure 11. Avoided CO2 emissions Kg/year by installing PV panels in the Sakan Masr Project.
Buildings 15 02326 g011
Table 1. Material characteristics of the building envelope used as input in DesignBuilder.
Building EnvelopeMaterialThickness (m)Conductivity
(W/m·K)
Specific Heat (J/kg·K)Density (kg/m3)U-Value
(W/m2·K)
External WallsCement plaster0.020.7284017601.746
Brick0.250.728401920
Cement plaster0.020.728401760
Internal WallsCement plaster0.020.7284017602.074
Brick0.1250.728401920
Cement plaster0.020.728401760
Roofconcrete tiles0.021.5100021002.002
Mortar0.020.728401760
Sand and gravel0.042.010451950
Roof screed0.070.418401200
Bituminous felt0.020.510001700
Reinforced concrete with 2% steel0.152.510002400
Cement plaster0.020.728401760
Ground FloorCeramic tiles0.021.384023002.382
Floor screed0.030.418401200
Sand & gravel0.032.010451950
Concrete0.121.1310002000
Typical ceiling/floorCeramic tiles0.021.384023000.741
Floor screed0.030.418401200
Sand & gravel0.052.010451950
Concrete0.150.16840500
Cement plaster0.020.728401760
Windows Single clear glass 3 mm 5.894
Table 2. Equipment schedule according to typical apartments of five family members in Egypt.
ApplianceWDaily Operating Hours
Exhaust fan15024
Mobile charger524
Refrigerator38024
Television36
Phone charger33
PC or laptop602
Satellite decoder30.2
Washing machine5120.2
Fan881800 h annual average in Cairo (1800/8760 = 0.2)
Collective water pump3000.1
Electric iron11000.1
Vacuum cleaner6300.1
Kettle18000.1
Stereo1000.1
Table 3. Design Alternatives for the optimization process.
Building Envelope Insulation Thickness [cm]U Value [W/m2.K]
12.5 cm Brick-Insulation—12.5 cm Brick 5 cm air cavity1.465
10 cm air cavity1.384
5 cm expanded polystyrene 0.549
Roof + Thermal insulation 3 cm expanded polystyrene0.8
5 cm expanded polystyrene0.572
7 cm expanded polystyrene0.445
Glazing Single glass 6 mm5.778
Low—E glass 6 mm3.779
Single reflected (A.H.) Clear 6 mm4.975
Double 3 mm/6 mm Air 3.159
Double 3 mm/13 mm Air2.716
Double 6 mm/6 mm Air3.094
Double 6–13 mm Air2.665
Double 3 mm/13mm Argon2.556
Double 6–13 mm Argon2.511
Double LoE clear 3 mm/13 mm Air1.786
Double LoE clear 3 mm/13 mm Argon1.512
BIPV1.96
Shading Overhang 0.5 -
Projected 1.0-
Table 4. The effect of applying optimization tool on discomfort hours results in all cases without installing HVAC in the four buildings’ orientation.
Building OrientationTotal Discomfort Hours for the Building WITHOUT an HVAC System in One Year According to the ASHRAE-55 Adaptive Model
BC Before Optimizing Building EnvelopC1 After Optimizing Building EnvelopOptimization Results (Reduce Both Discomfort Hours and CO2 Emission)
Model 01—80 degrees4529.54453.1External wall in BC;
Using double glazing 6 mm/6 mm air;
Adding 1.0 m overhang;
5 cm expanded polystyrene will be added as thermal insulation for the roof.
Model 02—10 degrees4464.8484414.703External wall in BC;
Sgl Ref-A-H Clr 6 mm;
1.0 m overhang;
5 cm expanded polystyrene as a thermal insulation for the roof.
Model 03—35 degrees4531.144445.417External wall in BC;
Using single reflected clear glass 6 mm;
Adding 0.5 m overhang;
3 cm expanded polystyrene as a thermal insulation for the roof.
Model 04—145 degrees4487.8784436.4External wall in BC;
Using double glazing 3 mm/13 mm with argon gap;
Adding 1.0 m overhang;
3 cm expanded polystyrene as a thermal insulation for the roof.
Table 5. The effect of applying optimization tool on discomfort hours results in all cases when installing HVAC in the four buildings’ orientation.
Building OrientationTotal Discomfort Hours for the Building WITH HVAC System in One Year According to ASHRAE-55
BC Before Optimizing Building EnvelopC1, After Optimizing the Building EnvelopOptimization Results (Reduce Both Discomfort Hours and Electricity Consumption for Cooling)
Model 01—80 degreesDiscomfort hours = 4731.061 h
Electricity for Cooling = 38,912.49 KWh
Discomfort hours = 4608.83 h
Electricity for Cooling = 34,290.7 KWh
Using the double wall with a 5 cm air cavity;
Using single reflected and clear glazing 6 mm (Sgl Ref-A-H Clr 6 mm);
Adding 0.5 m overhang;
5 cm expanded polystyrene as a thermal insulation for the roof.
Model 02—10 degreesDiscomfort hours = 4657.306 h
Electricity for Cooling = 36,300.17 KWh
Discomfort hours = 4557.8 h
Electricity for Cooling = 33,945.3 KWh
External Wall in BC;
double clear glazing with LoE 3 mm/13 mm Arg;
(Dbl LoE (e2 = 0.1) Clr 3 mm/13 mm Arg);
1.0 m overhang;
5 cm expanded polystyrene as a thermal insulation for the roof.
Model 03—35 degreesDiscomfort hours = 4735.28 h
Electricity for Cooling = 38,779.41 KWh
Discomfort hours = 4527 h
Electricity for Cooling = 34,636.5 KWh
External Wall in BC;
Sgl Ref-A-H Clr 6 mm;
0.5 m overhang;
Adding 7 cm expanded polystyrene as an insulation layer to the roof.
Model 04—145 degreesDiscomfort hours = 4684.848 h
Electricity for Cooling = 37,323.55 KWh
Discomfort hours = 4493.125 h
Electricity for Cooling = 34,147.91 KWh
External Wall in BC;
Single clear reflected glass 6 mm (Sgl Ref-A-H Clr 6 mm);
0.5 m overhang;
Adding 5 cm expanded polystyrene as a thermal insultation for the roof.
Table 6. Electricity consumption in BC in four models without installing HVAC and with installing HVAC. Then, electricity consumption for all models after optimizing the building envelope without installing HVAC and with installing HVAC.
Building Orientation Total Electricity Consumption (kWh) for the Building WITHOUT Installing Air Conditioning Split UnitTotal Electricity Consumption (kWh) for the Building WITH Installing Air Conditioning Split Unit
Base Case (BC) Before Optimizing Building EnvelopCase One (C1) After Optimizing Building Envelop Base Case (BC) Before Optimizing Building EnvelopCase One (C1) After Optimizing Building Envelop
Model 1—80 degree 206,061.5206,061.5 (1)244,974 (2)240,340.4 (3)
Model 2—10 degrees 206,061.520,6061.5 242,361.6 240,006.9
Model 3—35 degrees 206,061.5206,061.5 244,840.9240,698
Model 4—145 degrees 206,061.5206,061.5243,385 240,209.4
(1) There is no change in the electricity consumption between the models because the number of equipment and lighting are the same, as well as there is no change in the operational schedule. (2) Installing split unit with the operational schedule in July and August- set points 21 to 25 °C, (3) the effect of changing the thermal comfort level is clear in this case because it led to a decrease in the electricity consumption needed for the cooling.
Table 7. PV design conditions used in PVSOL in a pure-south orientation.
PV Design ConditionsPure South
Model 1Model 2Model 3Model 4
Inclination 25°25°25°25°
Orientation of PV South 179°South 179°South 185°South 180°
PV Generator Surface 165.0 m2154.7 m2139.3 m2128.9 m2
Number of PV Modules6460 5450
Number of Inverters1111
PV Generator Energy (AC grid) 464.6 kWh60.0 kWh53.8 kWh49.9 kWh
Performance Ratio (PR)90.1%89.2%88.9%89.1%
Yield Reduction due to ShadingNot calculated1.0%/Year1.3%/Year1.0%/Year
Spec. Annual Yield (kWh/kWp)1836.61818.71813.31817.0
CO2 Emissions avoided30.3 kg/year28.2 kg/year25.3 kg/year23.4 kg/year
4 This number is extracted from PV-SOL software, considering that the average peak sunshine hours in Cairo are 5.034.
Table 8. PV design conditions used in PVSOL in east–west Orientation.
PV Design Conditions East West
Model 1Model 2 Model 3 Model 4
Inclination 10°10°10°10°
Orientation of PVEast 89°West 269°East 105°East 104°
PV Generator Surface 252.7 m2252.7 m2232.1 m2247.6 m2
Number of PV Modules98989096
Number of Inverters4 4 6 4
PV Generator Energy (AC grid)91.1 kWh91.9 kWh84.6 kWh89.8 kWh
Performance Ratio (PR)89.3%90.0%90.1%89.9%
Yield Reduction due to Shading0.8%/YearNot calculatedNot calculatedNot calculated
Spec. Annual Yield (kWh/kWp)1690.11705.11706.21701.8
CO2 Emissions avoided42.8 kg/year43.1 kg/year39.6 kg/year42.2 kg/year
Table 9. Results of electricity generation from installing PV panels (The case of building in BC with natural ventilation).
Sakan Misr-New CairoPV Panels Orientations Different Orientation
Model 01—168
Building
Model 02—209 BuildingModel 03—168 BuildingModel 04—176 Building
Electricity consumption 1Pure south206,061.5206,061.520,6061.5206,061.5
East–west
Total Electricity consumption 2Pure south34,618,33243,066,85434,618,33236,266,824
East–west
No. of PV panels 3Pure south64605450
East–west98989096
Rated PV power for the building, kW Pure south35.23329.727.5
East–west53.953.949.553
Electricity generation 4Pure south57,81654,20348,78245,169
East–west88,530.7588,530.7581,303.75 86,724
Total Electricity generation 5Pure south9,713,08811,328,3238,195,4187,949,700
East–west14,873,16618,502,92713,659,03015,263,424
Net consumption 6Pure south24,905,244.0031,738,531.0026,422,914.0028,317,124.00
East–west19,745,16624,563,92720,959,30221,003,400
Energy Saving % 7Pure south28.06%26.30%23.67%21.92%
East–west42.96%42.96%39.46%42.09%
Energy saving cost 8Pure south12,627,01414,726,81910,654,04310,334,610
East–west19,335,11624,053,80517,756,73919,842,451
PV generator surface (m2) 9Pure south165154.7139.3128.9
East–west252.7252.7232.1248
1 Electricity consumption for one building annually kWh (Energy) Calculated by DesignBuilder; 2 Electricity consumption for the project kWh (Energy) = No of buildings × Electricity consumption for one building annually kWh (Energy); 3 No. of installed PV panels on the roof calculated by PV-SOL Software; 4 Electricity generation for the building (kWh) annually Calculated by Rated PV power for the building, kW × 4.5 h × 365 Days; 5 Electricity generation for the project (kWh) annually Calculated by Electricity generation for the building (kWh) annually × No. of the buildings; 6 Net consumption from grid kWh (annually) = Electricity generation for the project (kWh) annually − Electricity consumption for the project kWh (Energy); 7 Energy Saving percentage = Electricity generation for the project (kWh) annually/Electricity consumption for the project kWh (Energy); 8 Energy saving cost L.E. (1.3 L.E/kWh 3rd unit) annually= Electricity generation for the project (kWh) annually × 1.3 L.E.; 9 PV generator surface (m2) calculated by PV-SOL.
Table 10. Results of electricity generation from Installing PV panels (The case of building in BC with HVAC).
Sakan Misr-New CairoPV Panels OrientationsDifferent Orientation
Model 01—168 BuildingModel 02—209 BuildingModel 03—168 BuildingModel 04—176 Building
Electricity consumption for one building annually kWh Pure south 244,974242,361.6244,840.9243,385
East–west
Electricity consumption for the project kWh Pure south 41,155,632.0050,653,574.4041,133,271.2042,835,760.00
East–west
No. installed PV panels on the roof Pure south 64605450
East–west 98989096
Rated PV power/building KWPure south 35.23329.727.5
East–west 53.953.949.553
Electricity generation for the building (kWh) annuallyPure south 57,816 54,20348,78245,169
East–west 88,530.7588,530.7581,303.75 86,724
Total Electricity generation (kWh) annuallyPure south 9,713,08811,328,3238,195,4187,949,700
East–west 14,873,16618,502,92713,659,03015,263,424
Net consumption from grid kWh (annually)Pure south 31,442,544.0039,325,251.9032,937,853.2034,886,060.00
East–west26,282,46632,150,64827,474,24127,572,336
Energy Saving percentagePure south 23.60%22.36%19.92%18.56%
East–west 36.14%36.53%33.21%35.63%
Energy saving cost (1.3 L.E/kWh 3rd unit) annuallyPure south 12,627,01414,726,81910,654,04310,334,610
East–west 19,335,11624,053,80517,756,73919,842,451
PV generator surface (m2)Pure south 165154.7139.3128.9
East–west 252.7252.7232.1248
Table 11. Comparison between PV module specification from Jinko datasheet and PV-SOL database.
ParameterPV-SOL Report ValuesOfficial Jinko DatasheetValidation Status
Rated Power (Pmax)550 W550 WValidated
Module Efficiency21.29%21.29%Validated
Maximum Power Voltage (Vmp)41.60 V41.58 VValidated (0.05% difference)
Maximum Power Current (Imp)13.23 A13.23 AValidated
Open Circuit Voltage (Voc)49.60 V50.27 VMinor Difference (−1.3%)
Short Circuit Current (Isc)14.09 A14.01 AValidated (0.6% difference)
Temperature Coefficient (Pmax)−0.35%/°C−0.30%/°CConservative Estimate
Panel Dimensions2.27 × 1.13 m2.278 × 1.134 mValidated
Panel Area2.57 m22.58 m2Validated (0.4% difference)
Weight27.5 kg32 kgUnderestimated (−14%)
Overall Validation Accuracy--95% Accuracy
Table 12. System performance parameters according to PV-SOL.
ParameterValueUnit
PV Generation Yield (Pure South)1644kWh/kWp/year
PV Generation Yield (East–West)1580–1590kWh/kWp/year
Peak Sun Hours4.5hours/day
Solar Irradiation5.4–7.1kWh/m2/day
Inverter Efficiency98.6%
DC Cable Losses2%
AC Cable Losses1%
Soiling Losses5%
Mismatch Losses2%
Overall System Efficiency88.5%
Table 13. Performance ratio based on comparison between simulation results and Jinko configuration.
ModelOrientationPanelsRated Power (kWp)Annual Generation (kWh)Specific Yield (kWh/kWp)Datasheet Max Generation (kWh)Performance Ratio (%)
1Pure South6435.257,869164477,06475.1
1East–West9853.985,1621580103,89682.0
2Pure South6033.054,252164472,07275.3
2East–West9853.985,1621580103,89682.0
3Pure South5429.748,708164064,90875.0
3East–West9049.578,458158595,43682.2
4Pure South5027.546,200168060,06076.9
4East–West9652.883,9521590101,83682.4
Disclaimer/Publisher’s Note: The statements, opinions and data contained in all publications are solely those of the individual author(s) and contributor(s) and not of MDPI and/or the editor(s). MDPI and/or the editor(s) disclaim responsibility for any injury to people or property resulting from any ideas, methods, instructions or products referred to in the content.