Article

Experimental Study on the Force Mechanism of Internal Composite Connectors in Steel–Concrete Composite Sections of Bridge Towers

1
School of Traffic Engineering, Guangzhou Vocational College of Technology & Business, Guangzhou 511442, China
2
School of Civil Engineering and Transportation, South China University of Technology, Guangzhou 510630, China
3
Poly Changda Engineering Co., Ltd. Guangzhou 510630, China
*
Author to whom correspondence should be addressed.
Buildings 2025, 15(13), 2284; https://doi.org/10.3390/buildings15132284
Submission received: 25 May 2025 / Revised: 21 June 2025 / Accepted: 24 June 2025 / Published: 29 June 2025
(This article belongs to the Section Building Structures)

Abstract

Current research on the stress mechanisms of composite connectors within steel–concrete structures of bridge towers is sparse, and there is a lack of established experimental methods and finite element modeling techniques for studying these mechanisms. This study focuses on a specific type of composite shear connector within the steel–concrete section of the Shunde Bridge tower. By employing proposed experimental methods and finite element model analysis, this research examines the load–slip curves and stress distribution of these shear connectors. It aims to elucidate the stress mechanisms and mechanical relationships between the composite connectors and the individual perforated plate connectors and shear stud connectors that comprise them. The results demonstrate that the proposed experimental methods and finite element modeling approaches effectively analyze the stress mechanisms of composite connectors, revealing that the ultimate load-bearing capacity and elastic stiffness of the composite connectors are approximately the sum of those of the individual connectors configured in parallel; The mechanical performance of the composite connectors in the steel–concrete section of the bridge tower is approximately the additive sum of the mechanical performances of the individual connectors comprising them. By comparing the experimentally measured load–slip curves with those calculated from the finite element models, it validates the modeling approach of the finite element model, and the material parameters established through material characteristic tests and literature review are reasonable.

1. Introduction

In recent years, as the spans of cable-stayed bridges have progressively increased, addressing the insufficient stiffness of multi-tower cable-stayed bridges using steel–concrete composite tower structures has become a pressing issue. Li [1] investigated the high-low tower cable-stayed bridge of the Xijiang Grand Bridge along the newly constructed Guangzhou Nansha Port Railway through finite element simulation. This study focused on the mechanical behavior of high-low tower cable-stayed bridges and the dynamic interaction between vehicles and bridges, concluding that the enhanced stiffness of the bridge tower significantly reduces structural deflection. Nie et al. [2], Liu et al. [3], and Sham and Wyatt [4] introducted the steel–concrete composite bridges and demonstrated that steel–concrete composite bridge towers are well-suited for constructing future long-span cable-stayed bridges and possess broad application potential. Wang [5] conducted experimental analyses on the mechanical performance of steel and composite bridge towers, finding that composite bridge towers represent a novel type of structure developed from steel–concrete composites. These towers integrate the advantages of both steel and concrete bridge towers, offering promising applications in modern bridge engineering. To ensure the overall stiffness of the composite tower columns, it is essential to facilitate cooperative load-bearing between steel and concrete, fully leveraging the superior properties of each material. This necessitates addressing the challenges associated with the configuration of connectors at the steel–concrete interface. Varma et al. [6,7] and Nie et al. [8,9] conducted research demonstrating the superior ductility and load-bearing capacity of steel plate–concrete composite columns under complex loading conditions, such as compression and torsion. Furthermore, their studies highlight that the design and performance of connectors, which facilitate the interaction between steel and concrete components, play a critical role in determining the overall load-bearing capacity. For steel plate–concrete composite columns, it is necessary to employ perforated plate connectors or shear studs to integrate the inner side of the steel plate with the concrete, thus meeting the requirements for interface connection and steel plate stiffening. Vianna et al. [10] investigated the shear performance of perforated plate connectors and proposed a calculation formula for their shear-bearing capacity. Kim et al. [11] applied perforated plate connectors in pile caps to strengthen the interaction between pile foundations and structures. Cândido-Martins et al. [12], through push-out tests, demonstrated that reinforcement significantly enhances the load-bearing capacity and ductility of PBL connectors, making them suitable for plastic design. The mechanical behavior of shear connectors plays a critical role in the load-carrying capacity and ductility of steel–concrete composite structures [13,14,15,16]. Currently, steel–concrete composite tower columns are seldom used in large-span cable-stayed bridge structures. Chen et al. [17] conducted experimental research on the shear resistance of internal shear studs in steel tube concrete, identifying four stages in the load-bearing capacity of the specimens: elastic, elastoplastic, load decline, and residual load stages. Yosri et al. [18] conducted push-out tests on bolt shear connectors and trained three machine learning models using the test data to predict the shear strength of bolt shear connectors. Maliji et al. [19] developed the finite element model of the bolted shear connector and investigated the residual strength and load–slip curve under high temperature of the shear connector. Qi et al. [20] proposed a load–slip curve that takes into account the contributions of the bolt shank and concrete wedge blocks, thereby endowing the predictive model with mechanical significance. Xiao et al. [21,22] carried out push-out tests on perforated plate connectors, considering the effects of concrete strength, the strength of the reinforcing bars passing through, and the influence of stirrups and perforated plate thickness. They derived a formula for calculating the load-bearing capacity of perforated plate connectors. Wang et al. [23] aimed to determine a design calculation method for the shear resistance of large-sized welded stud connectors used in composite bridges, conducting model tests on these connectors and analyzing variables such as the strength of concrete, tensile strength of the studs, length, and diameter to identify the factors influencing the shear resistance of welded stud connectors. Shim et al. [24], through experimental research, established a tri-linear load–slip curve for shear stud connectors, consisting of linear, nonlinear ascending, and descending phases. Prates et al. [25] analyzed large openings and lateral constraints and proposed a new shear strength formula. In steel–concrete bridge structures of high-speed railways and highways, perforated plate connectors or shear stud connectors are also commonly used [26,27,28]. Most existing studies focus predominantly on experimental or theoretical research into the shear resistance of individual perforated plate connectors or shear stud connectors; research into the combined use of these two types of connectors is less common, and there is a notable lack of studies on the stress characteristics of their individual components.

2. Engineering Background and Selection of Composite Connectors

The steel–concrete joint section of the under-construction Shunde Bridge (the world’s first eight-lane large-span steel shell concrete high and low tower hybrid beam cable-stayed bridge with a main span of 626 m) pylon served as the research background. Based on its actual dimensions, a uniform and rational multi-layer segmentation was performed. The segmentation criteria included ensuring that each individual connector after division possessed sufficient dimensions for specimen fabrication and maintaining consistent sizes for the four shear stud connectors located in the middle of each layer. In this study, the principle for selecting the size was defined as the distance from the stud to either side being half of the spacing between two adjacent studs. This approach ensured that the dimensions and arrangement of shear connectors in each layer were identical, as illustrated in Figure 1. By adopting the single-layer composite connector configuration shown in Figure 1 and employing the push-out test method outlined in Eurocode-4 [29], a total of 18 specimens, grouped in sets of three, were designed. Based on the analysis of experimental and finite element calculation results, the mechanical relationship and force transmission mechanism between the single-layer composite connectors and their constituent individual connectors in the steel–concrete composite section of the bridge tower were systematically elucidated. This provides a powerful tool for the structural optimization design of steel–concrete composite sections in subsequent bridge towers of this type.

3. Experimental Design for Single-Layer Composite Connectors

3.1. Overview of the Experiment

This study aims to propose an experimental method for studying the mechanical properties of single-layer composite connectors and the individual connectors that constitute them. Based on the structural characteristics of the single-layer composite connectors, three different specimen formats were established according to specific criteria, as shown in Figure 2, Figure 3 and Figure 4.
The material properties of the concrete were determined by testing in accordance with relevant standards. Under standard curing conditions, the cubic compressive strength of the concrete is 50.6 MPa, and the axial compressive strength is 32.9 MPa.
The perforated plate connectors and the composite connectors’ perforated steel plates and bearing plates are made of Q420qD steel, with a thickness of 30 mm and a hole diameter of 60 mm. The reinforcing bars passing through are made of HRB400E, with a diameter of 25 mm and a length of 750 mm, based on actual construction and finite element analysis of stress distribution in the reinforcing bars.
The steel plate material and thickness for the shear stud connectors are the same as those used in the perforated plate connectors and composite connectors. The material for the shear studs is ML15AL, with a cap diameter of 37 mm, stud diameter of 22 mm, cap height of 12 mm, and body height of 138 mm. Detailed material properties of the steel are shown in Table 1 (the material properties were determined by testing in accordance with relevant standards).
In Table 1, fy and fu represent the yield strength and ultimate strength of the steel grades, respectively; Eg denotes the elastic modulus of the steel.

3.2. Loading and Measurement Scheme

The specimens, including perforated plate connectors, shear stud connectors, and composite connectors, were subjected to a designed push-out test method. This method involves applying a uniform thrust load to the bearing steel plate, ensuring that the reinforcing bars and shear studs experience a pure shear stress state. This setup is crucial for accurately determining the load–slip curve of the specimens, as illustrated in Figure 5. To ensure uniform stress distribution across the bearing plate of the specimens, a high-strength, quick-drying thin gypsum leveling layer is applied at the top. All specimens were loaded using a 500-ton press, as depicted in Figure 5.
During the loading process, based on the mechanical properties of the specimens and the focus of this study, two loading control methods were utilized: load control and displacement control (control using a dial gauge). Initially, during the elastic stage, the load was increased in increments of 5 to 15 kN at a rate not exceeding 3 kN/s. As the specimens entered the elastic-plastic stage, loading continued at increments of 2 to 5 kN, with a rate not exceeding 1 kN/s. Finally, in the plastic stage, the control shifted to displacement increments of 0.1 mm per stage. The detailed loading gradations for the perforated plate connectors, shear stud connectors, and composite connectors were adjusted based on the actual measured results of the initial specimens. The primary measurements taken in this experiment were the compressive slip of the bearing plate and the corresponding loading force. These measurements were used to analyze the relationship between the load-bearing capacities of individual connectors and their assemblies in composite connectors. The relative slip between the steel plate and the concrete of the specimens was measured using a high-precision dial gauge with a resolution of 0.01 mm and a range from 0 to 50 mm. The loading forces during the experiment could be directly read from the digital display of the press. After obtaining the data on slip and loading force during the loading process, the load–slip curves for the three types of shear connectors were plotted. This allowed for a detailed analysis of the mechanical performance parameters of both individual and composite connectors.
In the experimental setup for the perforated plate connectors, shear stud connectors, and composite connectors, the arrangement of the pressure plate of the press, the concrete blocks of the specimens, and the dial gauge (as shown in Figure 6, they are placed on the longitudinal sides of the specimen, and their purpose is to control the displacement of the pressure plate of the press), as well as the positioning of the measurement points for the relative slip between the steel plate and concrete, are shown in Figure 6.

4. Failure Modes and Results Analysis of Specimens

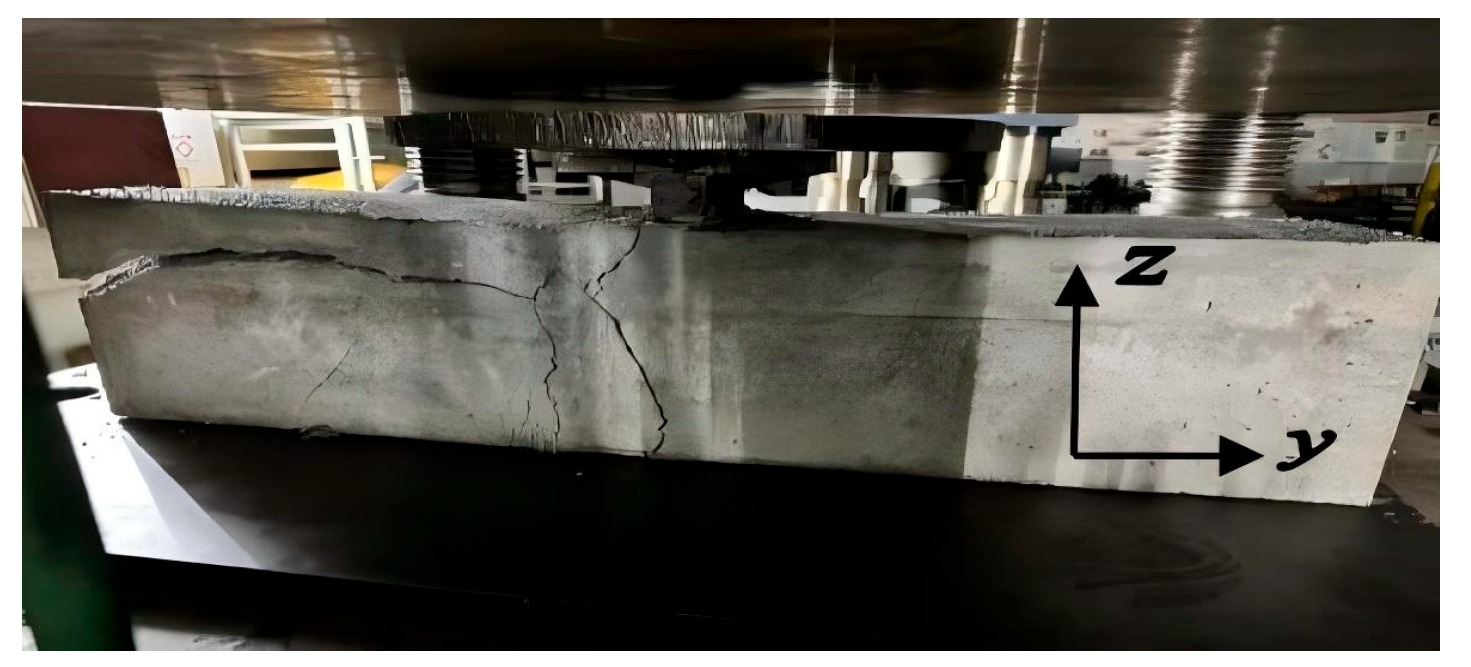
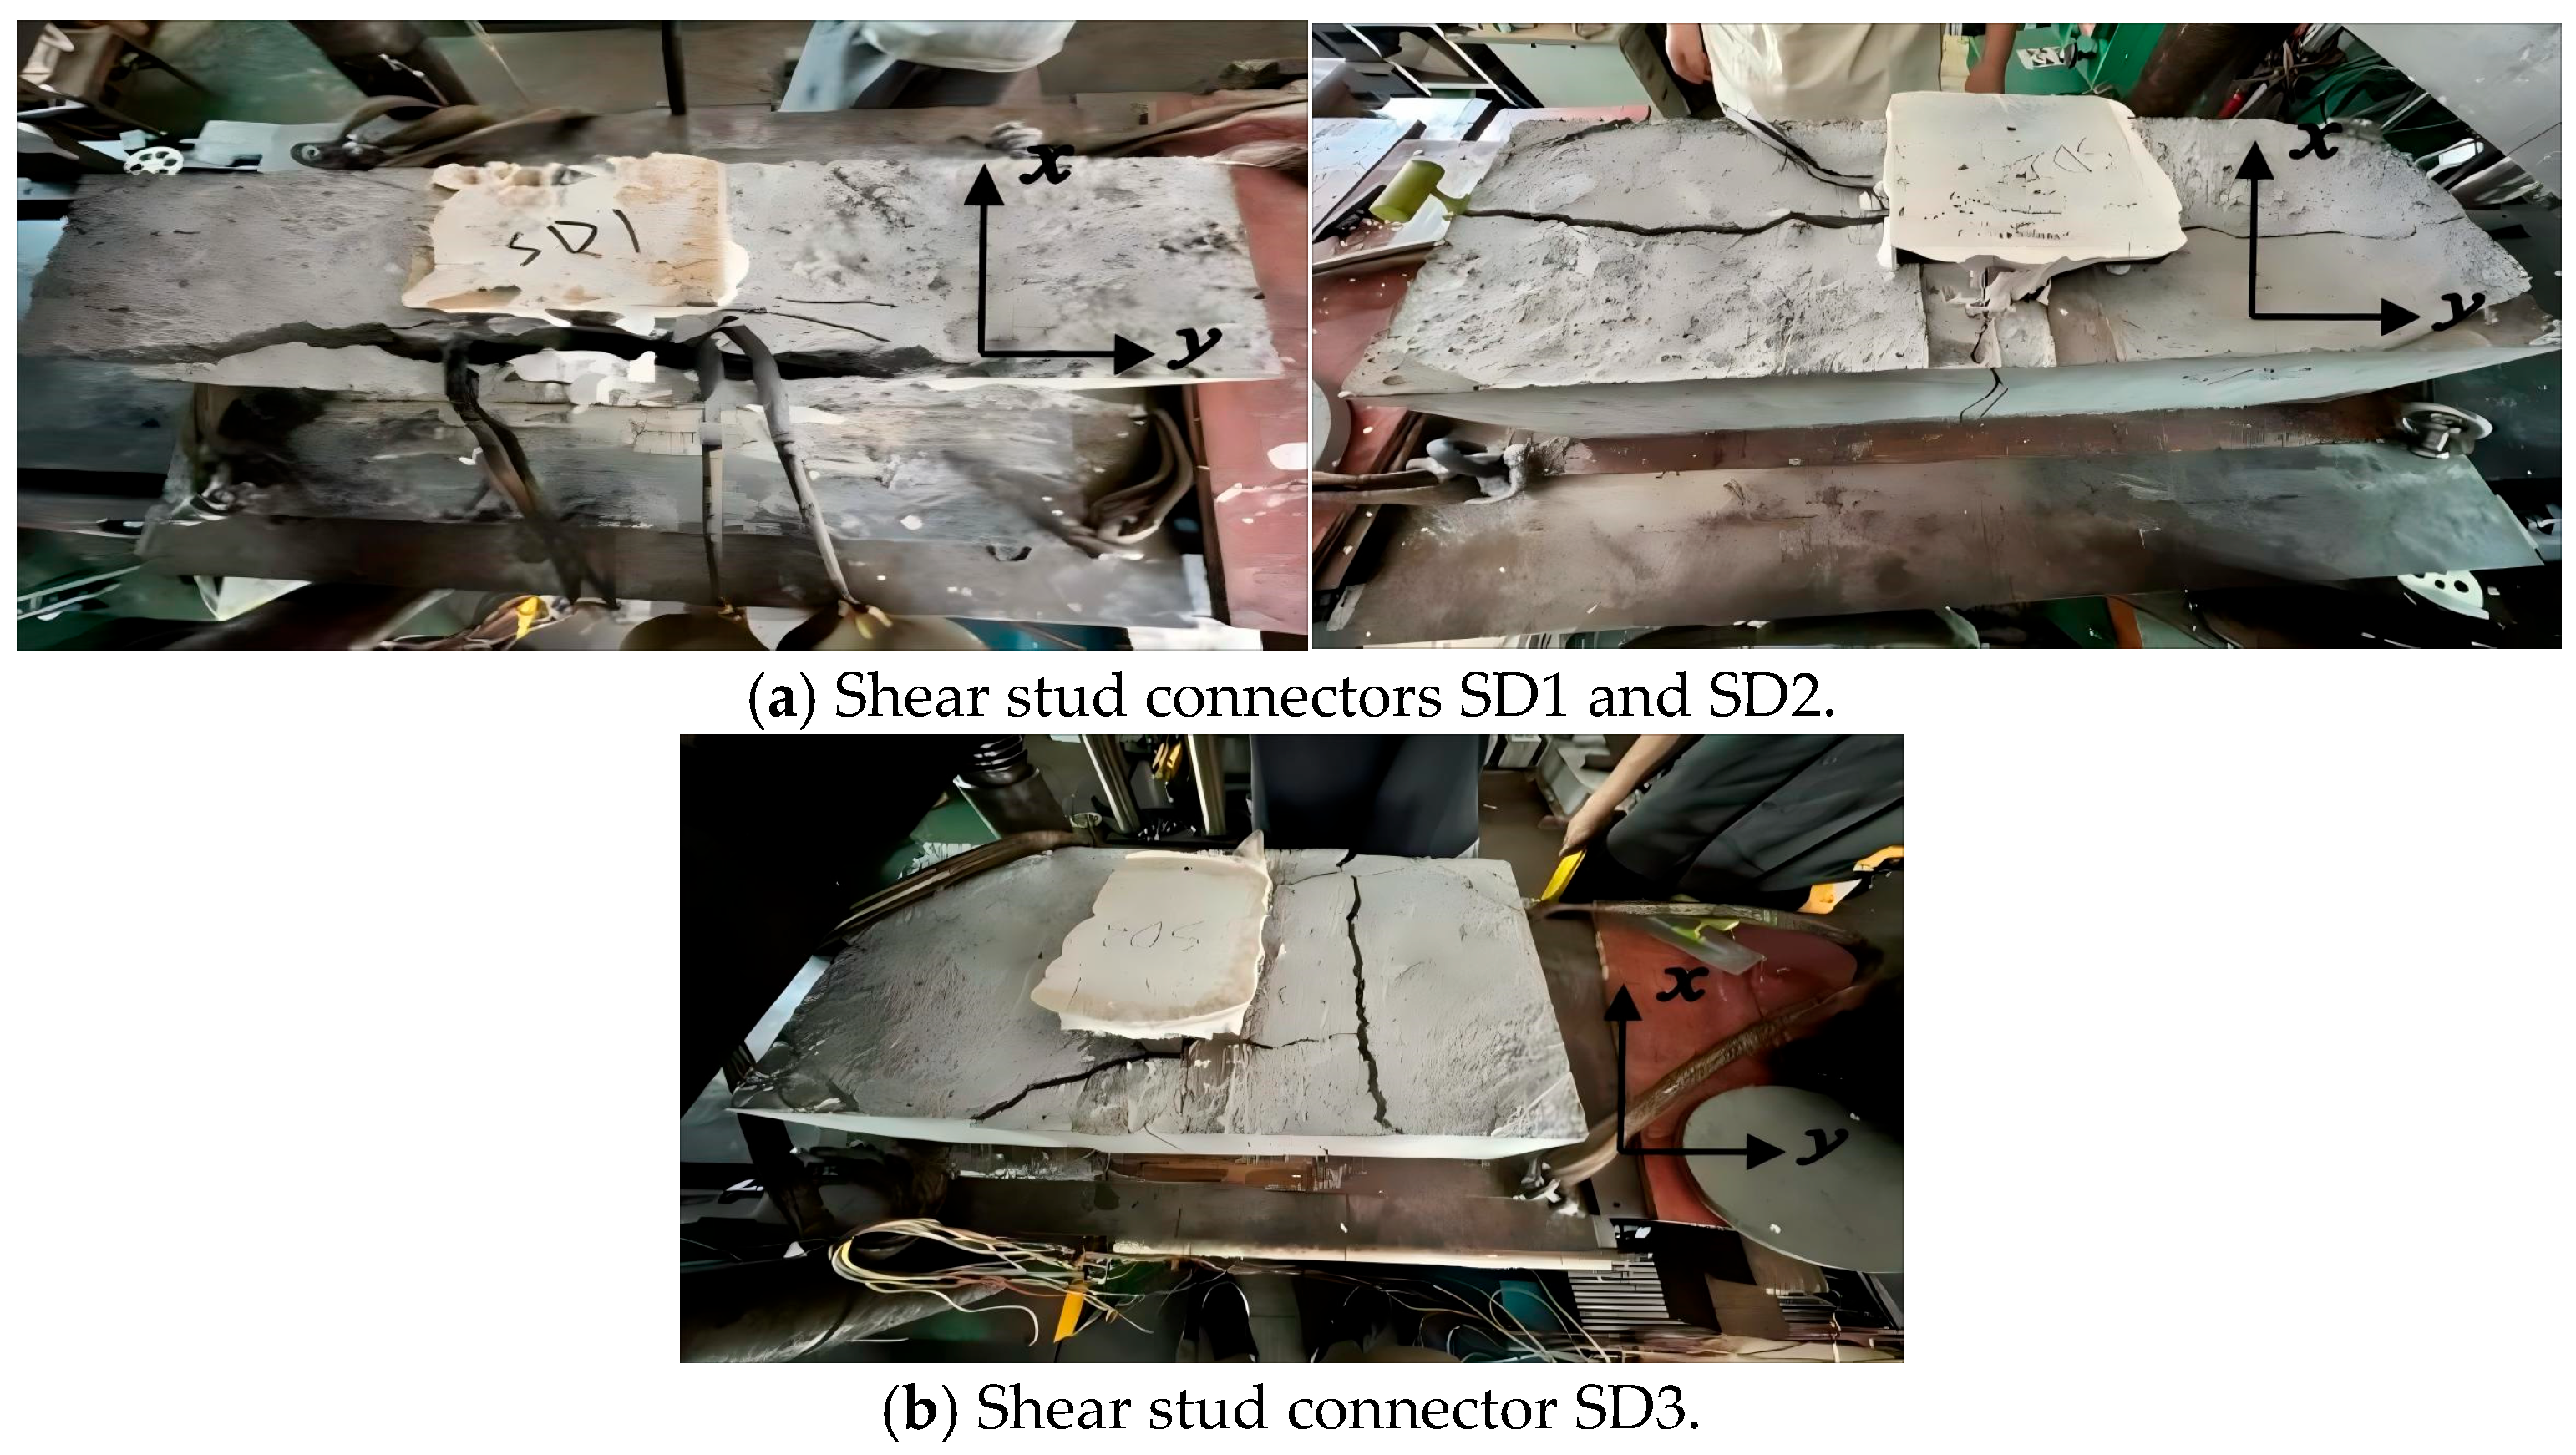
4.1. Failure Modes of Specimens

These figures (Figure 7, Figure 8 and Figure 9) illustrate the post-failure conditions of each specimen; the x, y, and z axes correspond to the longitudinal, transverse, and vertical directions of the specimens, respectively. As shown in Figure 7, a typical crack pattern was selected in the perforated plate connectors, indicating that the initiation of the crack occurs horizontally in the middle of the concrete section, precisely where the perforated steel plate is positioned within the concrete. Some specimens exhibited not only vertical cracks but also tensile failure cracks parallel to the direction of the reinforcing bars. As illustrated in Figure 8, in the case of shear stud connectors, no cracks appeared at the initial loading stage. However, with increasing load, a significant slip occurred between the steel plate and the concrete block. When the load reached 60% to 70% of the ultimate bearing capacity, horizontal cracks progressively developed from the base of the shear stud along its direction in the concrete block. As the load continued to increase, the slip between the steel plate and the concrete intensified, exacerbating the horizontal cracking of the concrete block. Upon reaching the ultimate load, the cracks in the concrete block propagated completely or shattered and slipped, leading to a rapid drop in load, rendering the load–slip curve unrecordable. Figure 9 depicts the crack distribution after loading for two types of composite connectors, with the timing and pattern of crack appearance during the loading process being similar to those observed in perforated plate connectors and shear stud connectors.

4.2. Experimental Results

To minimize the impact of variations in concrete strength on the experimental results, three parallel experiments were conducted for each group of specimens. Following the data processing methods of Su and Wang [30] and Zhu [31], the load–slip curves for each group of specimens were averaged. This process involved first normalizing the ultimate slip of each curve to the mean ultimate slip, and then calculating the average load at the same slip across all three curves for each type of specimen, resulting in the load–slip curves as shown in Figure 10, Figure 11 and Figure 12. The ultimate slip was defined as the slip corresponding to an 85% reduction of the peak load [31].

4.3. Analysis of Experimental Results

The load–slip curves of the perforated plate connectors, shear stud connectors, and composite connectors were analyzed, with a particular focus on fitting the results from the elastic loading stage. It was found that the single connectors and their combinations in shear stud connector SD3 and composite connectors ZH1 and ZH2 not only exhibit a near superposition in terms of ultimate load-bearing capacity but also demonstrate a corresponding superposition in initial stiffness during the elastic loading phase, as illustrated in Figure 13.

5. Finite Element Numerical Analysis of Specimens

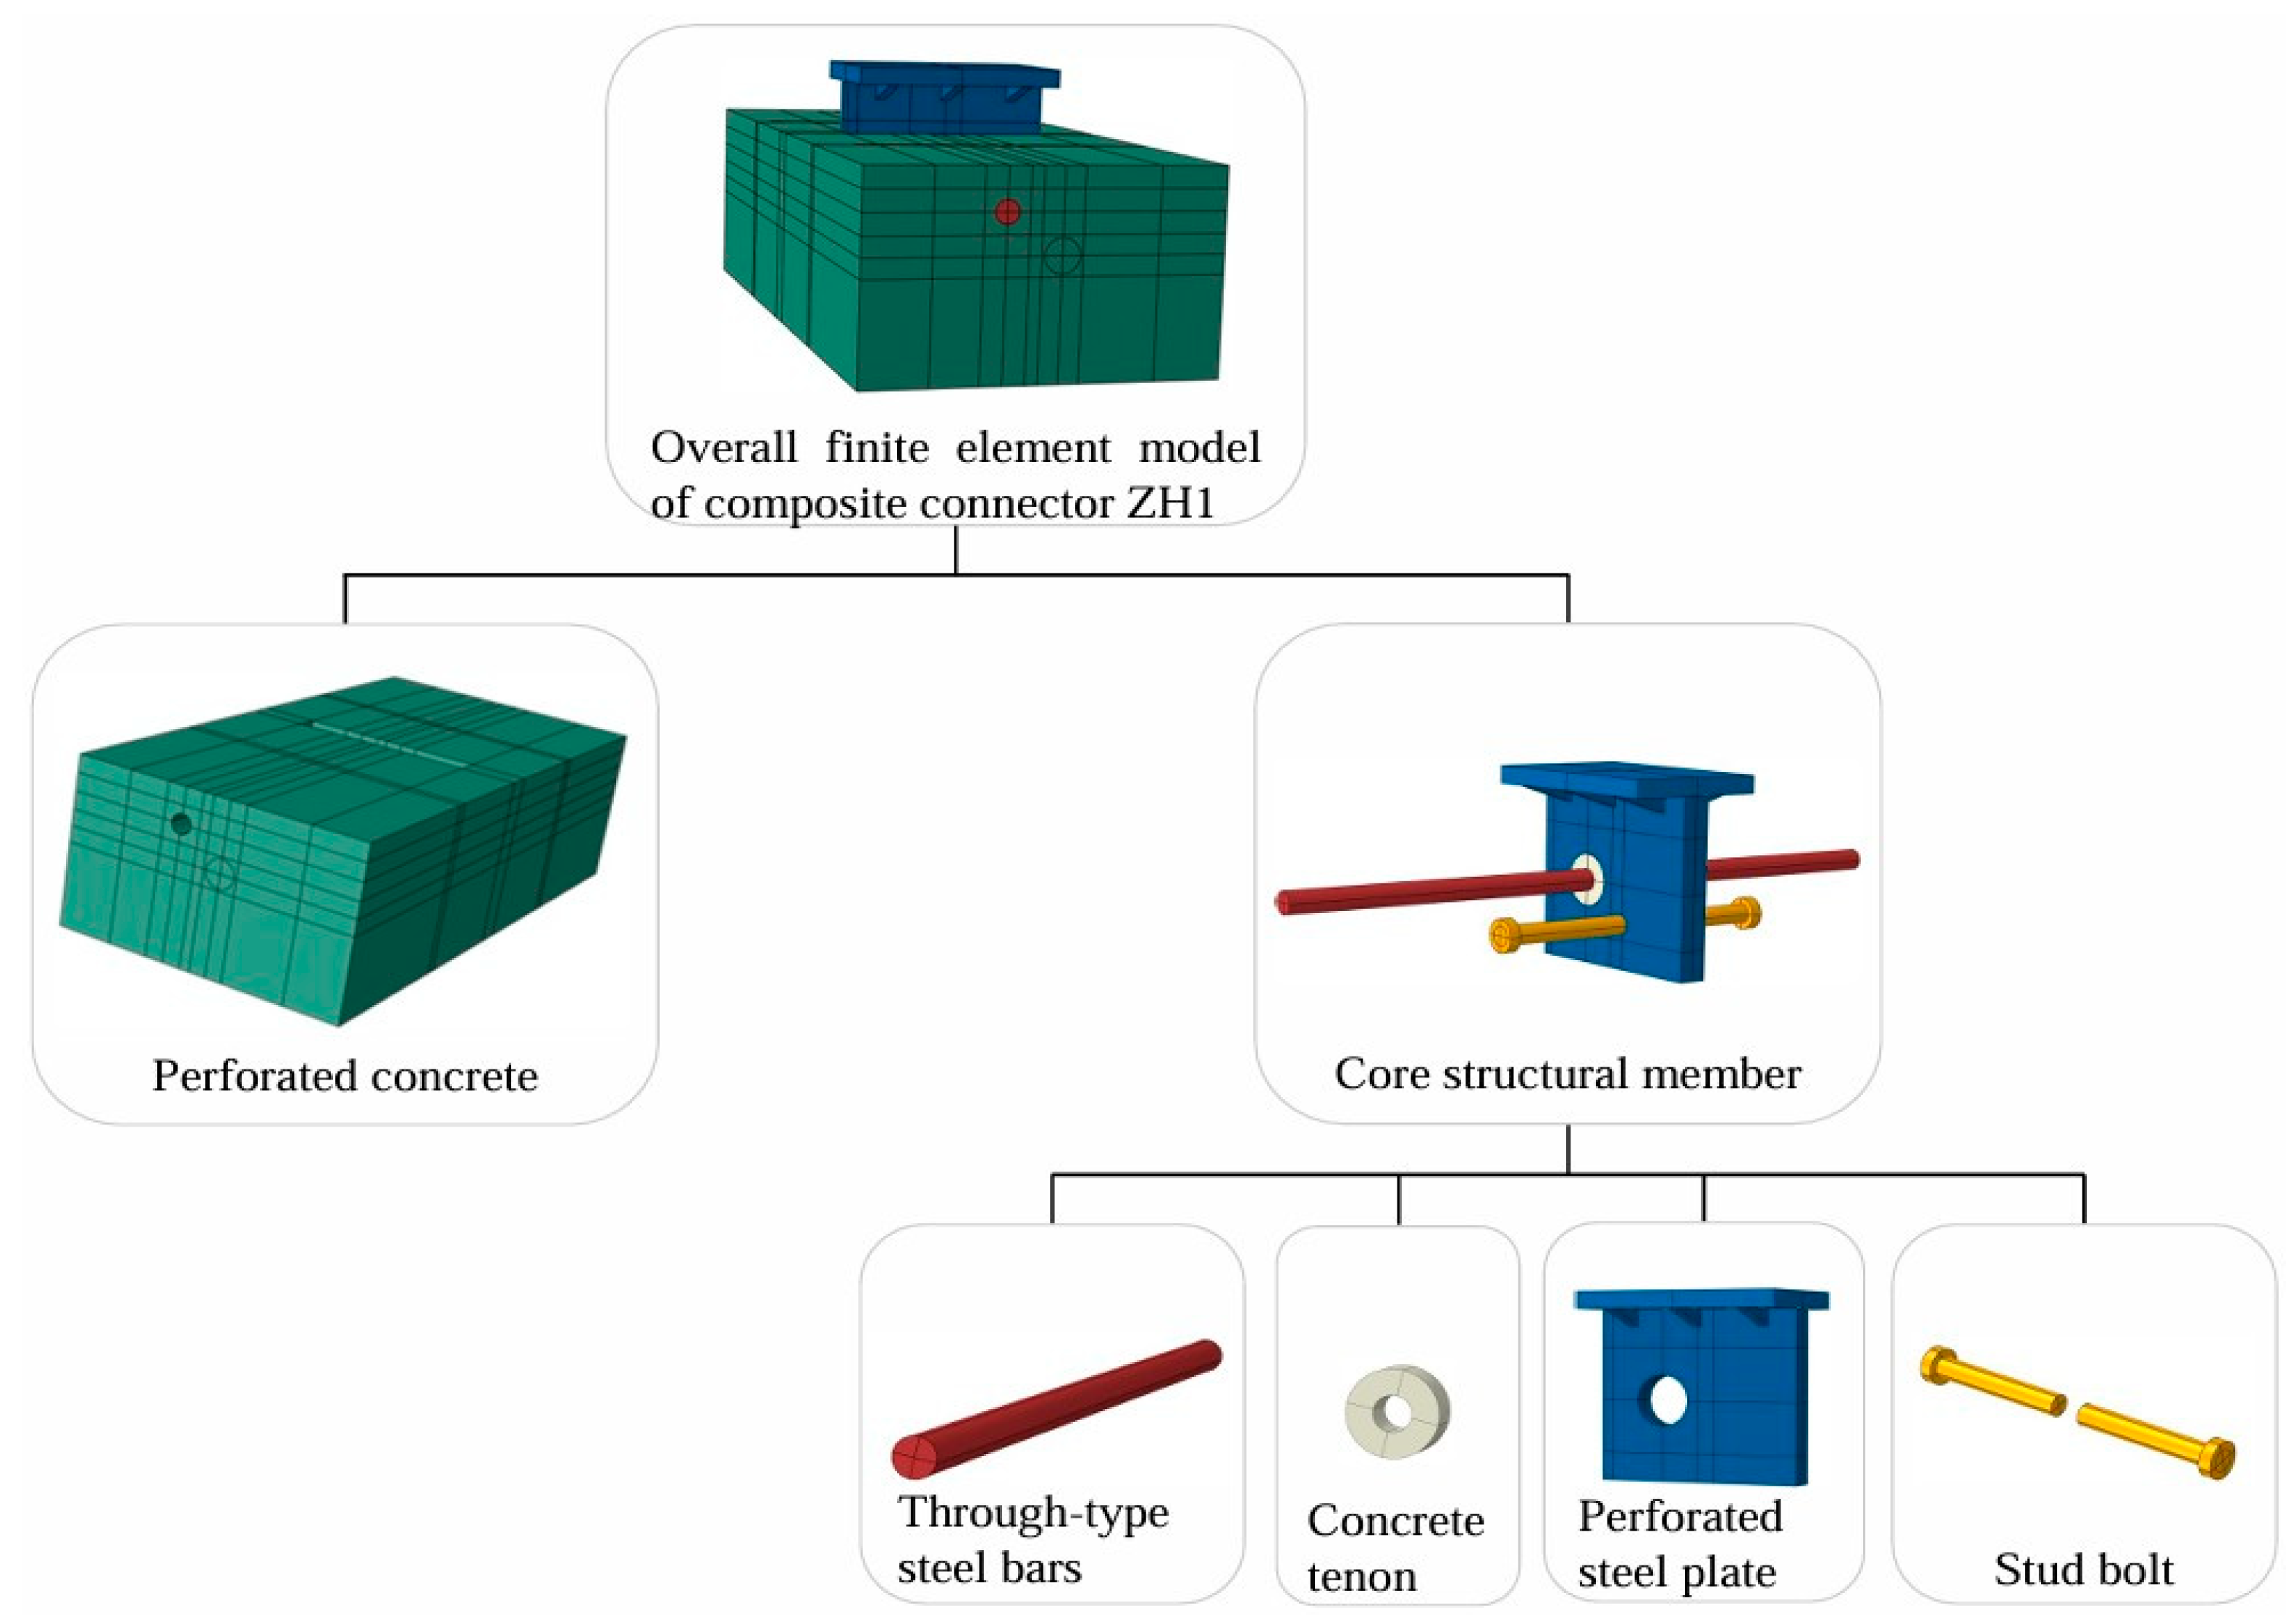
5.1. Finite Element Modeling Approach

Finite element models were developed on a 1:1 scale in accordance with the actual dimensions of the specimens. Following the descriptions of failure modes in Section 4.1, different components were modeled with a differentiated meshing strategy to facilitate the examination of the stress characteristics of various components. The detailed finite element model of the composite connectors comprises the concrete matrix (perforated concrete), perforated steel plates, concrete dowels, through-going rebars, and shear studs. The model utilizes reduced integration solid elements (C3D8R) for all components, allowing for accurate simulation of the structural behavior. Figure 14 displays the finite element model decomposition of composite connector ZH1, which includes parts of the perforated plate connector and the shear stud connector, covering all modeling aspects of the single connectors. This model serves as the standard for explaining the modeling approaches and material properties of all specimens.
In Figure 14, the perforated concrete, which acts as a subsidiary structural component of the specimen, provides out-of-plane constraints for the perforated steel plate, allowing inward contraction while preventing outward expansion. It also serves as an anchorage for the through-going rebars and shear studs. The pre-designated holes are aligned with the positions of these rebars and studs. For this section, a mesh size of 15 mm was chosen to mitigate the impact of hourglass effects in reduced integration elements. The core load-bearing elements of the connector include through-going rebars, concrete dowels, the perforated steel plate, and shear studs. The design of these elements directly influences the load-bearing capacity, stiffness, and ductility of the entire connector. Consequently, a fine division of mesh sizes was necessary: 6 mm for the through-going rebars and concrete dowels, 10 mm for the perforated steel plate, and 6 mm for the shear studs. All component meshes passed the mesh analysis check in the ABAQUS/CAE 2020 software, which confirmed the absence of mesh distortions, thus ensuring the convergence and accuracy of the numerical results.
In the actual specimens, the perforated concrete and concrete dowels were cast simultaneously. Therefore, face-to-face binding constraints were employed in the refined finite element model to integrate all concrete components within the connector into a cohesive unit. Since grease was applied to the surface of the perforated steel plate, the friction coefficient between the steel and concrete was set to zero. During the numerical analysis, contact properties were selected using the penalty function friction formula provided by ABAQUS: a friction coefficient of 0.5 for Contact Property 1 and 0 for Contact Property 2 [32]. The through-going rebars and shear studs utilized Contact Property 1 for face-to-face contact with the perforated concrete and concrete dowels. Perforated concrete employed Contact Property 2 for face-to-face contact with the perforated steel plate, while the concrete dowels and the circular holes of the perforated steel plate used Contact Property 1. The shear studs were bound face-to-face with the steel plate. The boundary conditions at the base of the perforated concrete were fully consolidated, which helped avoid numerical singularities such as stress concentration in other components, as shown in Figure 15, ensuring that the finite element model’s constraints matched the actual conditions. The top plane of the perforated steel plate was coupled at point RP-1, and the loading method combined experimental slip data to apply controlled displacement incrementally at point RP-1. The analysis was carried out using the general static mode in ABAQUS/CAE 2020.

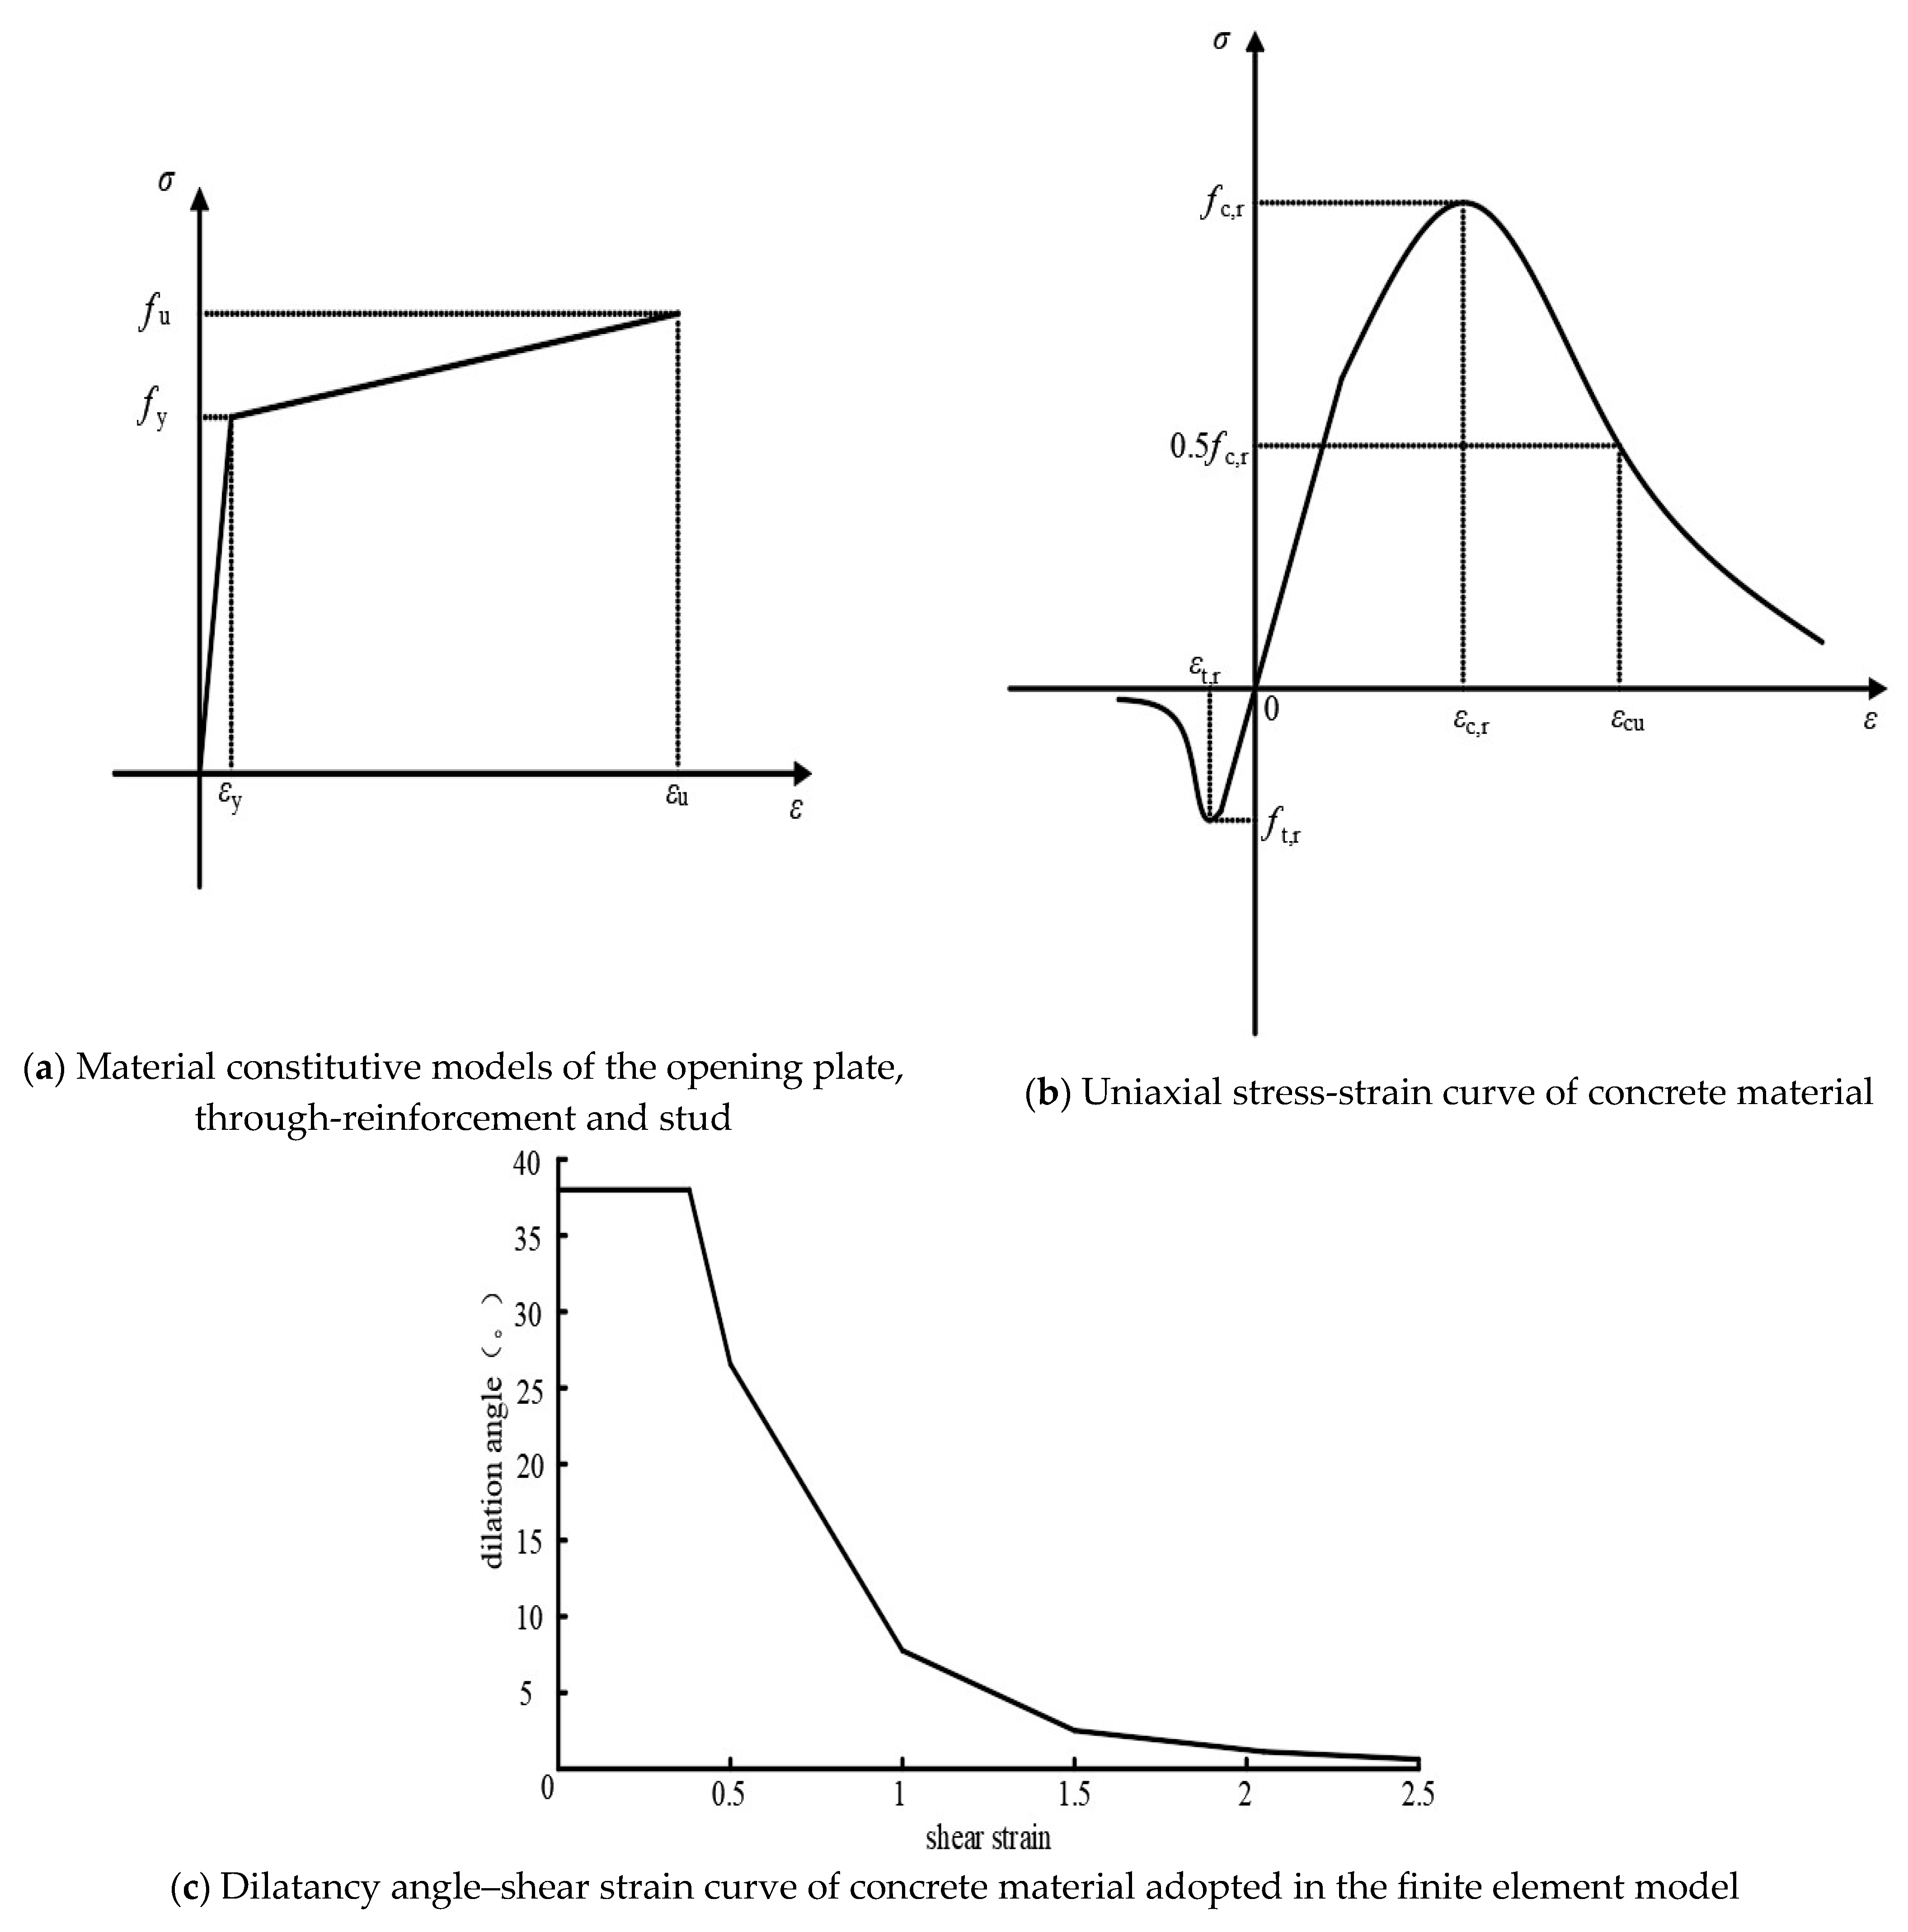
5.2. Material Properties

In defining the material properties of the steel structure within the finite element software ABAQUS/CAE 2020, both elastic and plastic characteristics were employed. The definition included the yield strength (fy), the yield strain (εy), and the ultimate strain (εu), with the ultimate strength (fu) also considered. The initial linear portion corresponds to the elastic stage, while the subsequent polyline after the inflection point represents the yielding and hardening phases, as shown in Figure 16a. Material characteristic values for steel were determined based on experimental tests. The properties identified for Q420qD steel plate included a Poisson’s ratio (μ) of 0.3, an elastic modulus (Eg) of 2.06×10⁵ MPa, a yield strength (fy) of 455 MPa, and an ultimate strength (fu) of 572 MPa. For HRB400E grade rebar, the elastic modulus (Ej) was 2×10⁵ MPa, with a Poisson’s ratio (μ) of 0.3, a yield strength (fy) of 433 MPa, and an ultimate strength (fu) of 598 MPa. ML15AL grade shear studs had an elastic modulus (Ed) of 2.06×10⁵ MPa, a Poisson’s ratio (μ) of 0.3, a yield strength (fy) of 402 MPa, and an ultimate strength (fu) of 479 MPa. Given the discrepancy between the actual strength of structural concrete and that of cubic specimen concrete, and guided by previous experience, data analysis, and national standards [33], the axial compressive strength (fcm) of concrete was chosen for the numerical simulation. The concrete model employs the built-in plastic-damage model in ABAQUS, considering the cumulative damage effects during loading. The uniaxial compression and tension stress-strain curves for concrete are illustrated in Figure 16b. Results from concrete material tests discussed in Section 3 indicated that the finite element model should utilize an axial compressive strength (fcm) of 32.9 MPa, a Poisson’s ratio (μ) of 0.2, and an elastic modulus (Eh) of 3.47×10⁴ MPa. Additionally, through multiple parameter analyses, it was determined that setting the initial dilation angle at 38° in ABAQUS achieved a high degree of concordance with experimental results, as shown in Figure 16c.

5.3. Validation of Finite Element Model

Following the results from push-out tests on specimens as detailed in Section 3, the finite element model was subjected to verification and validation. The validation of the finite element analysis primarily involved comparisons across several dimensions, including the failure patterns of the specimens, their load–slip curves, and their mechanical properties.

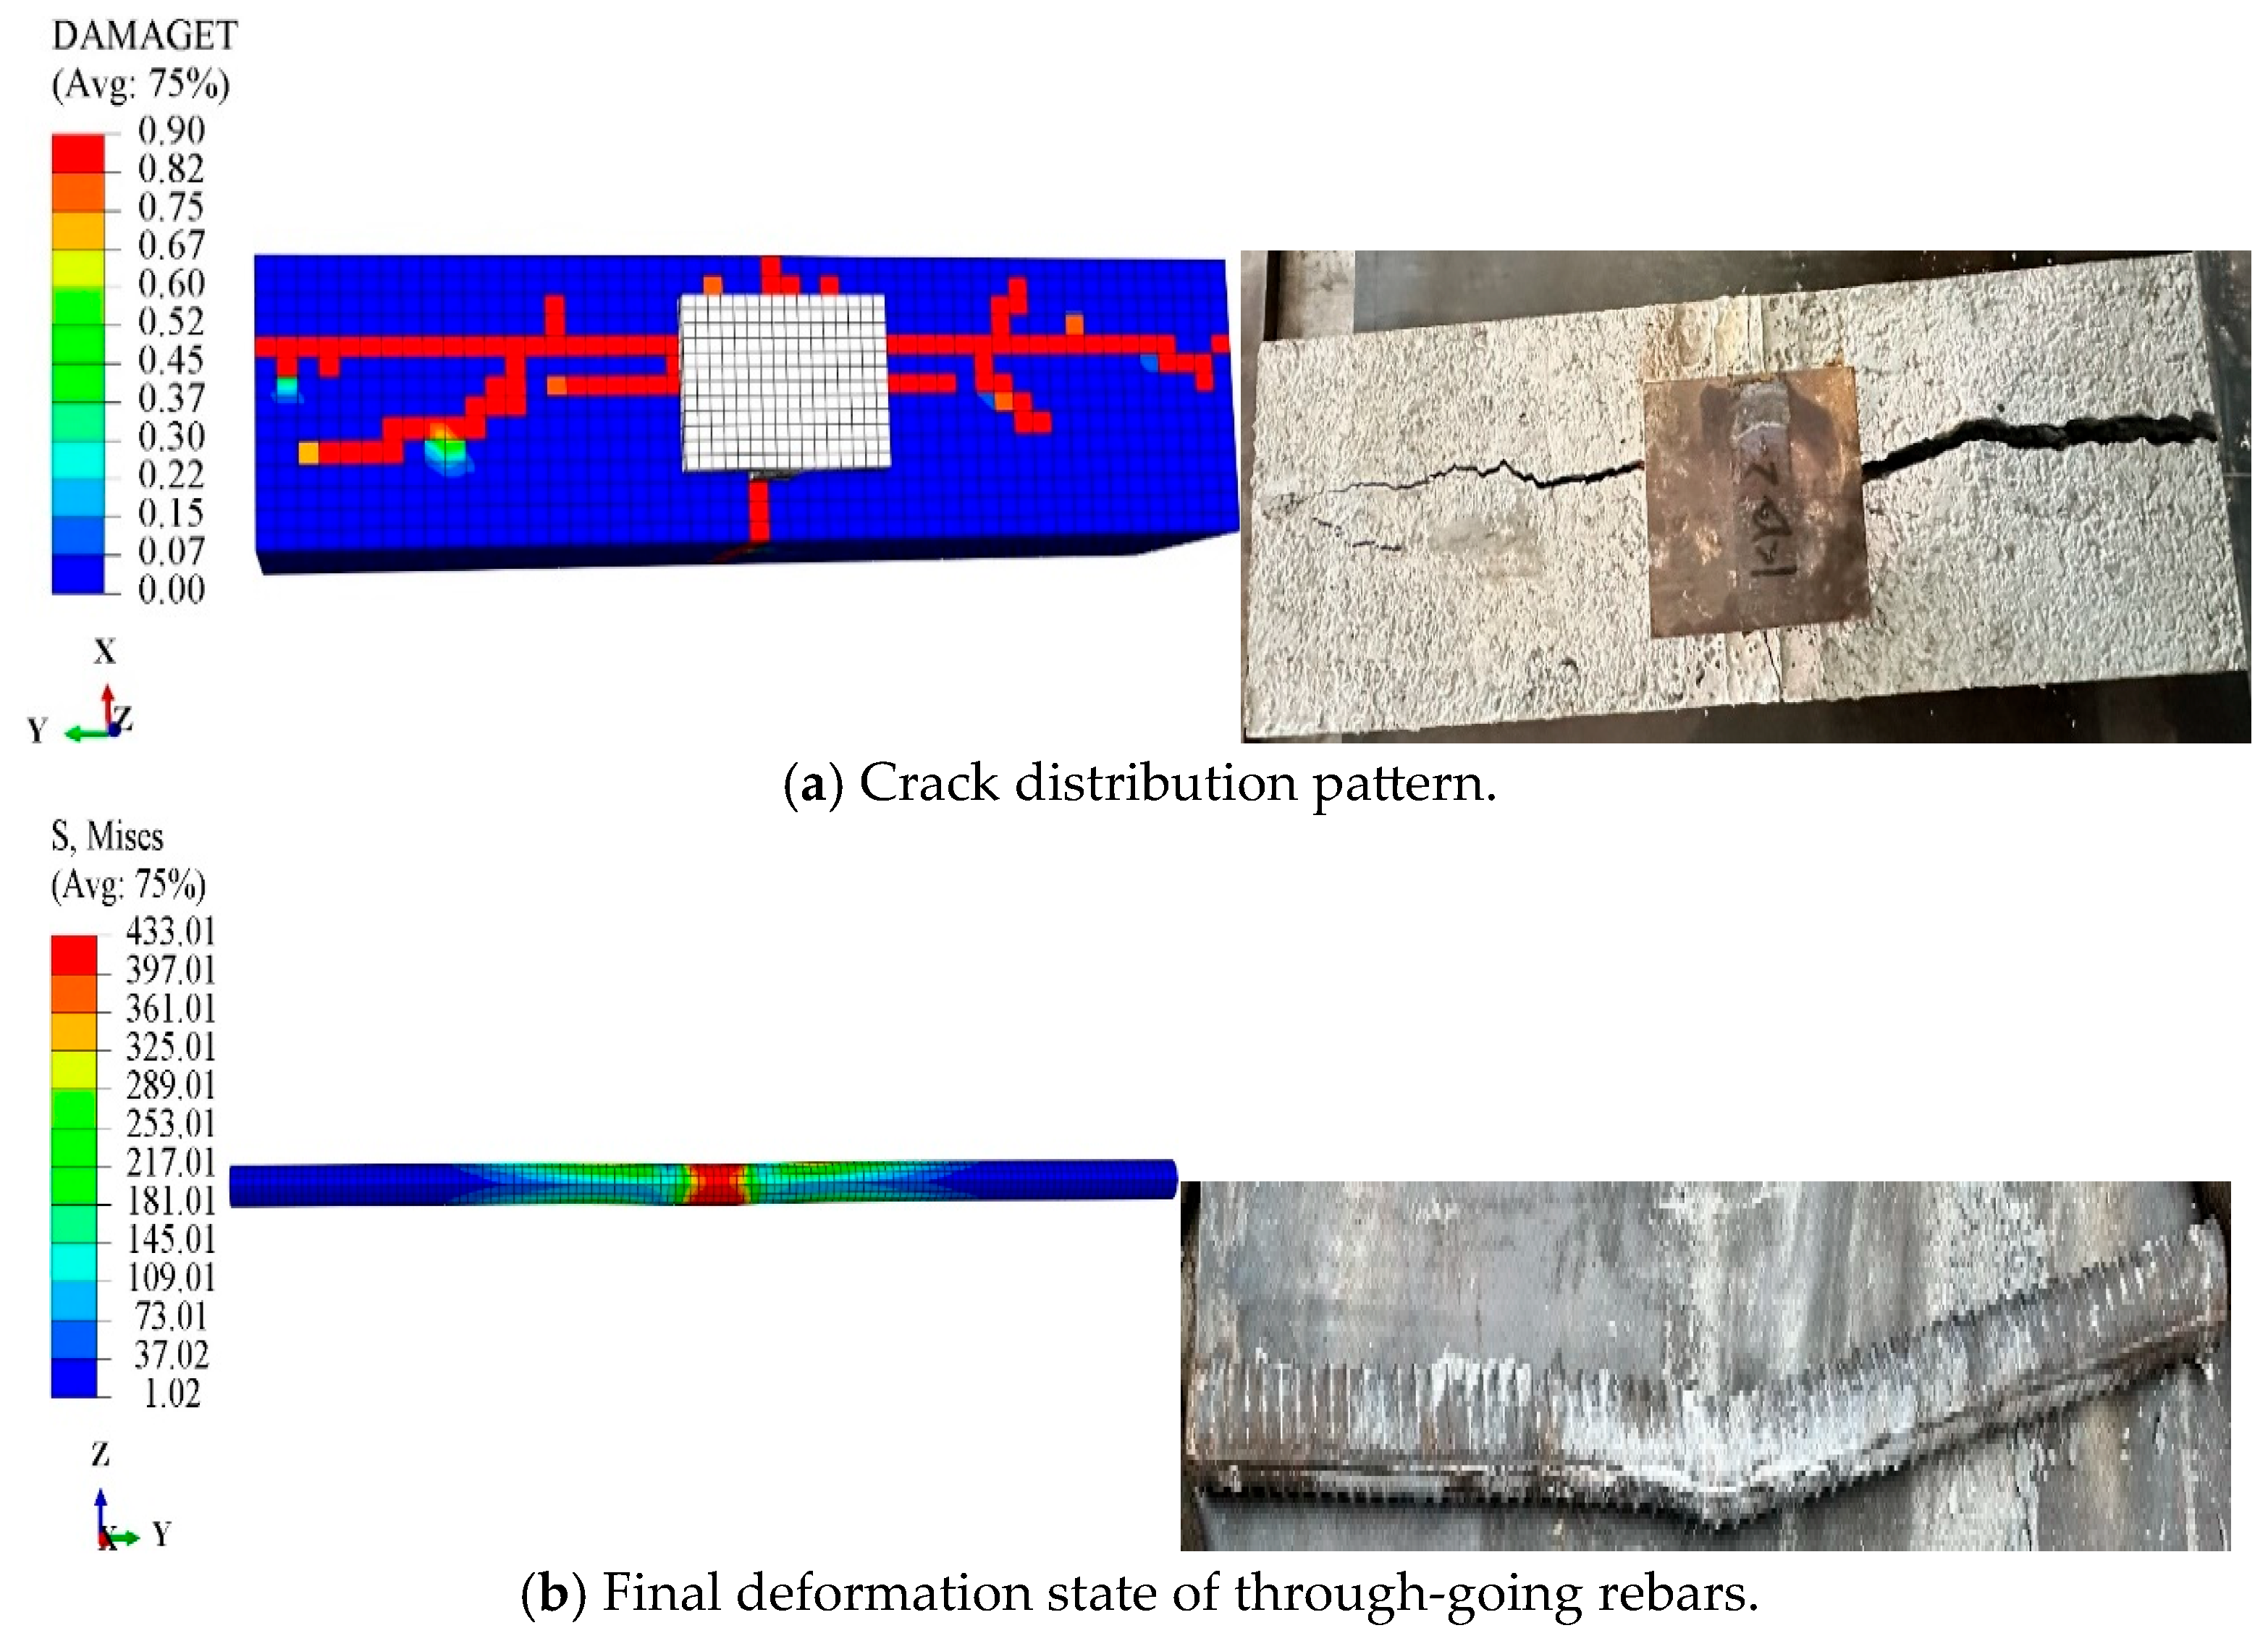
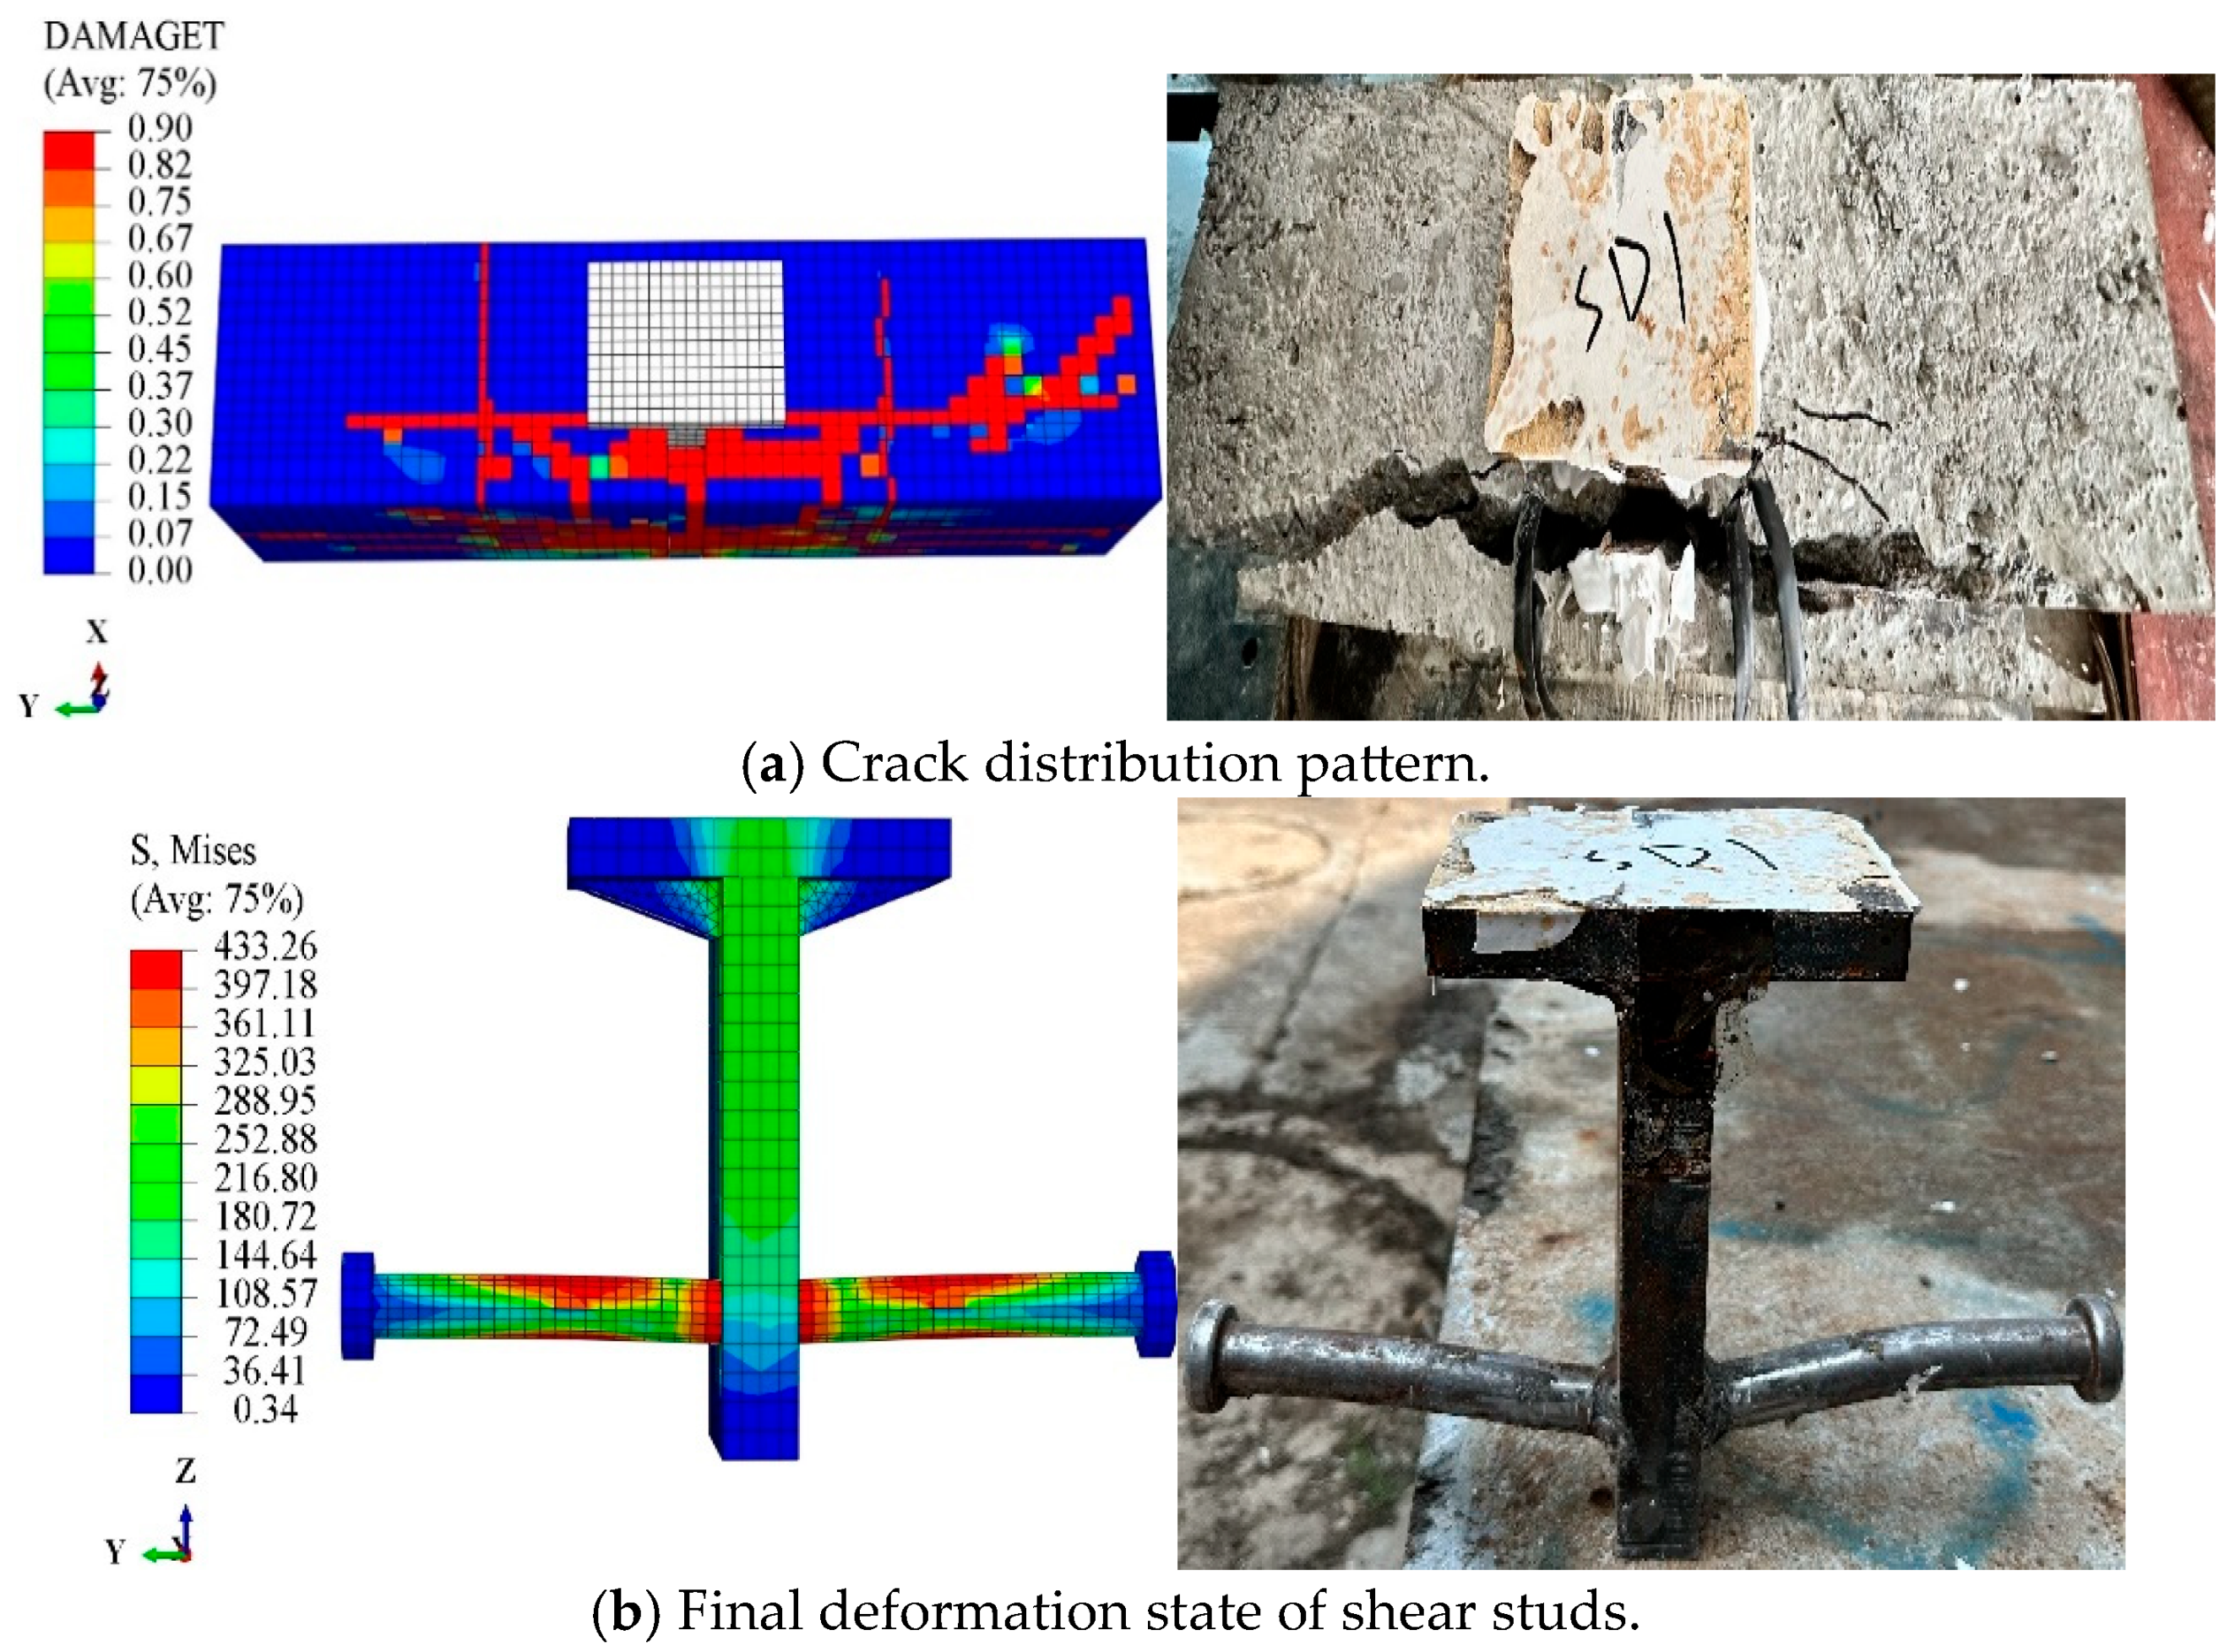
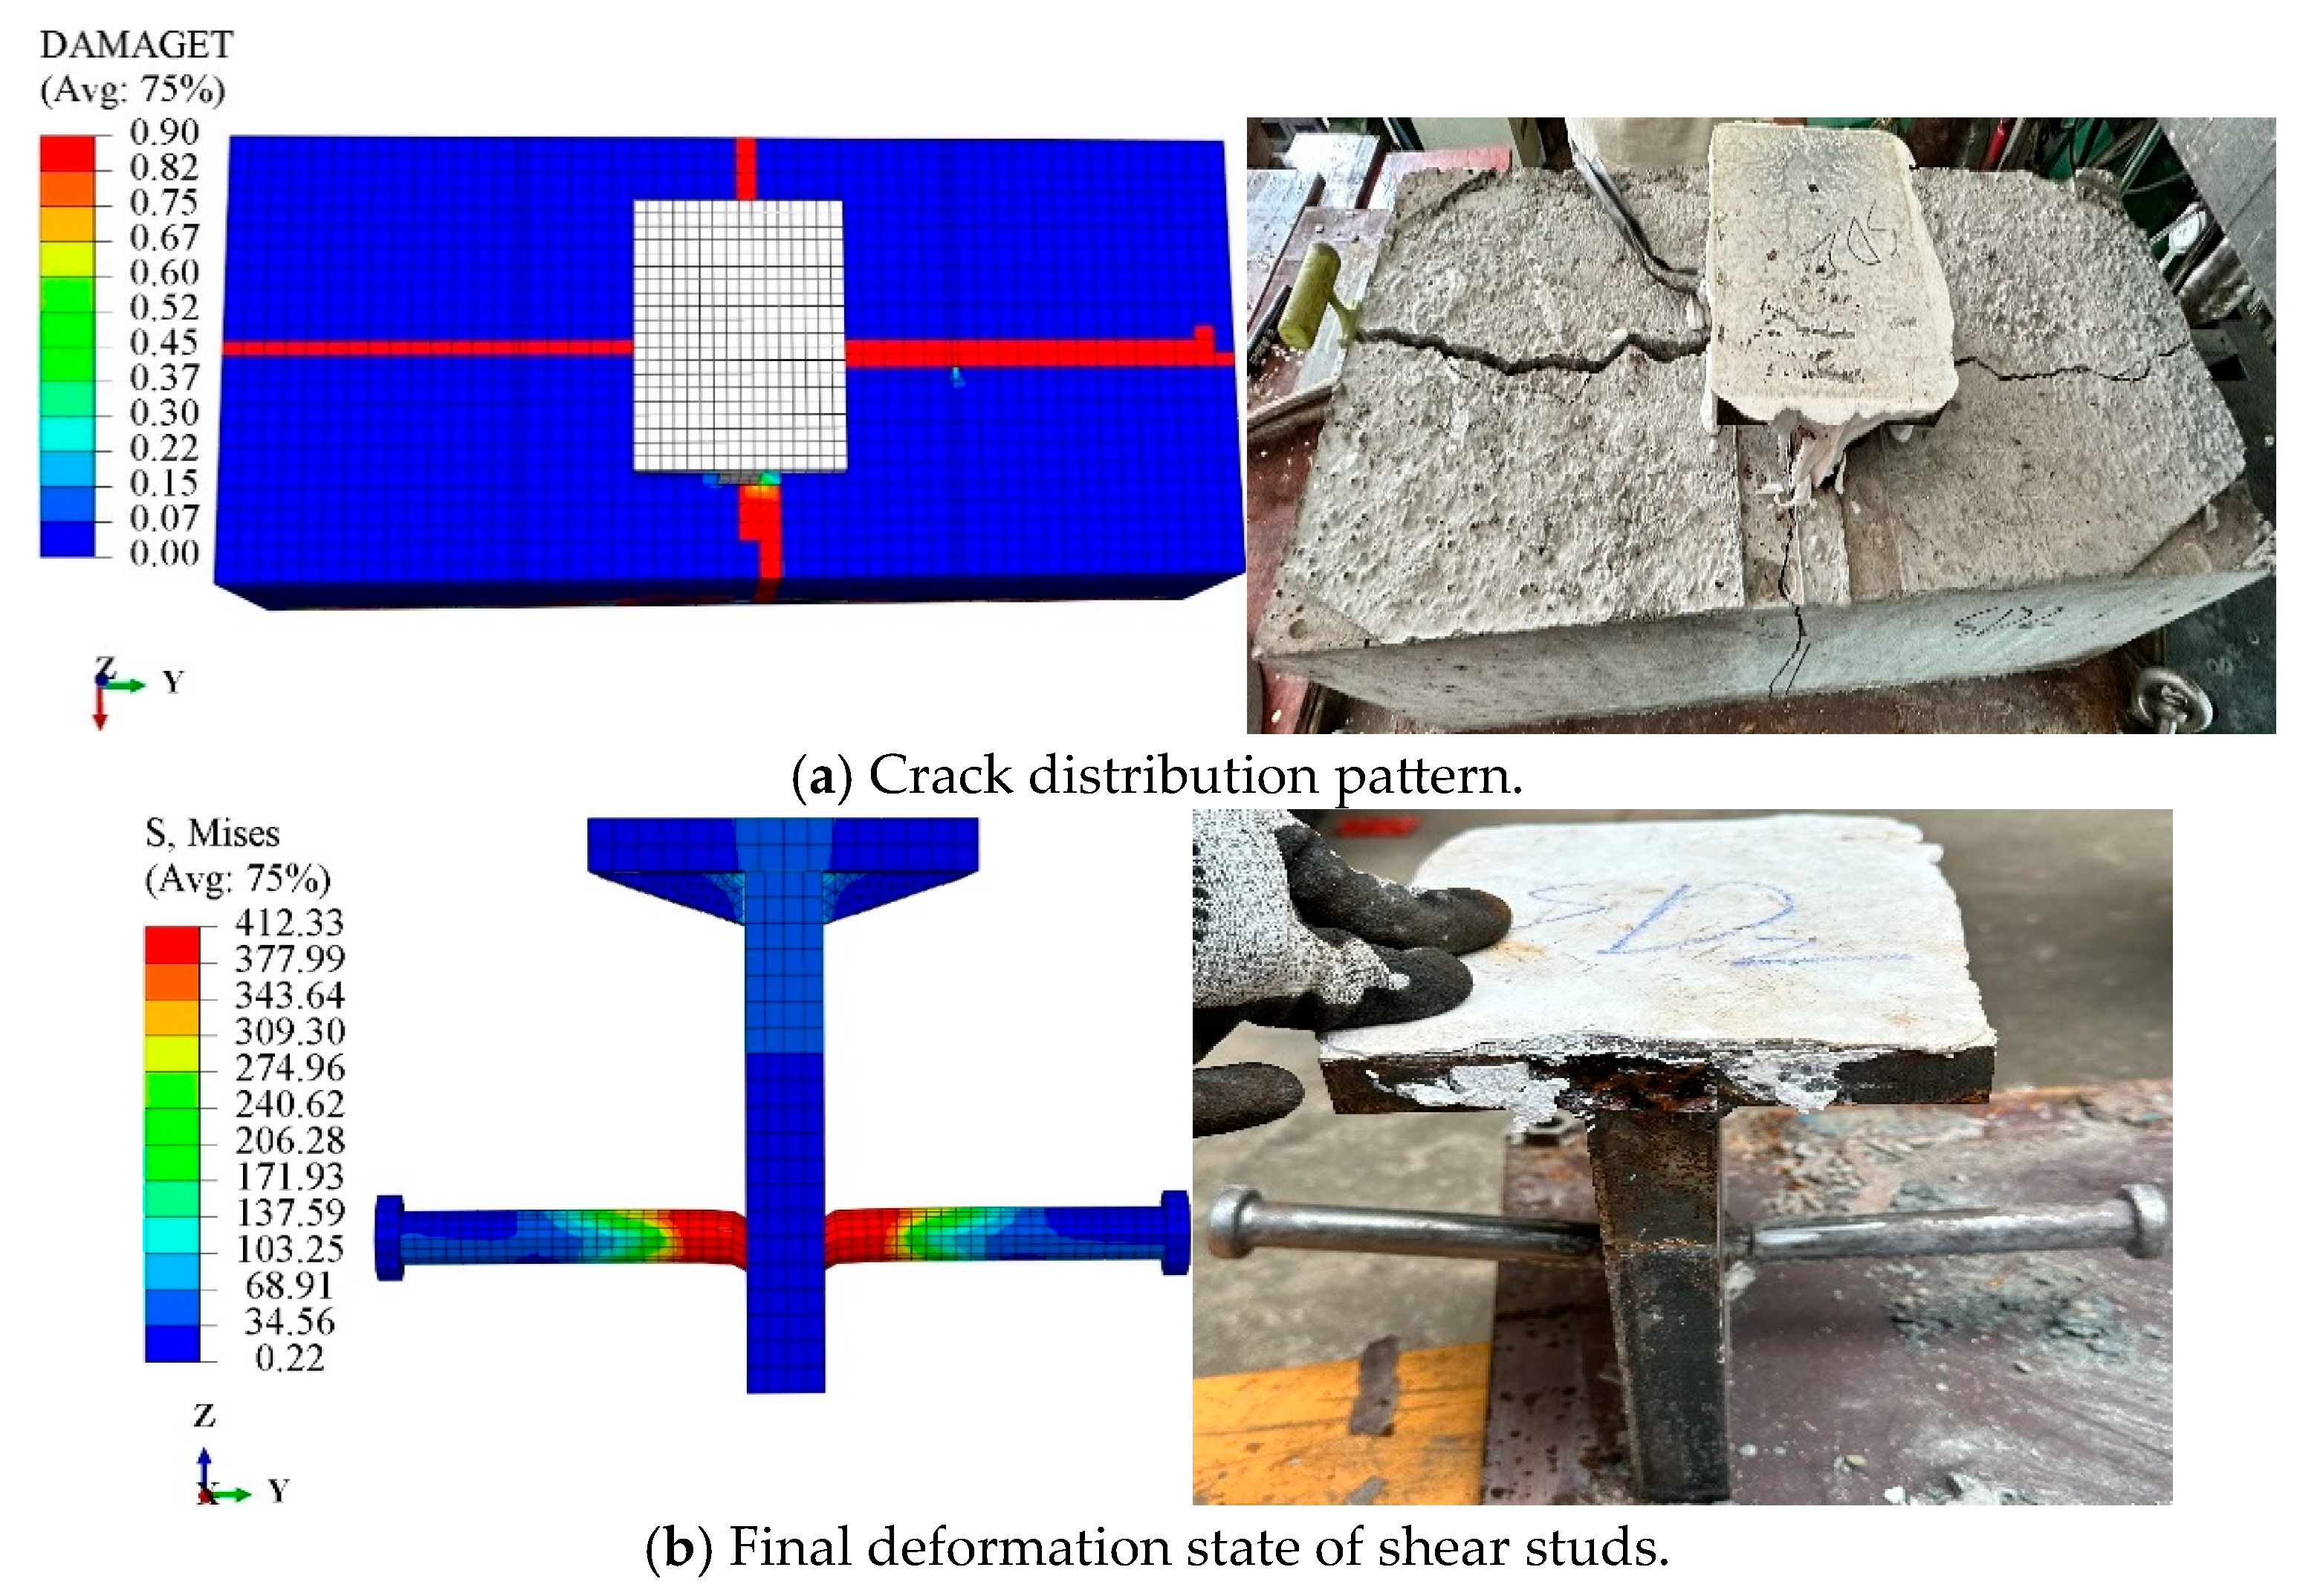
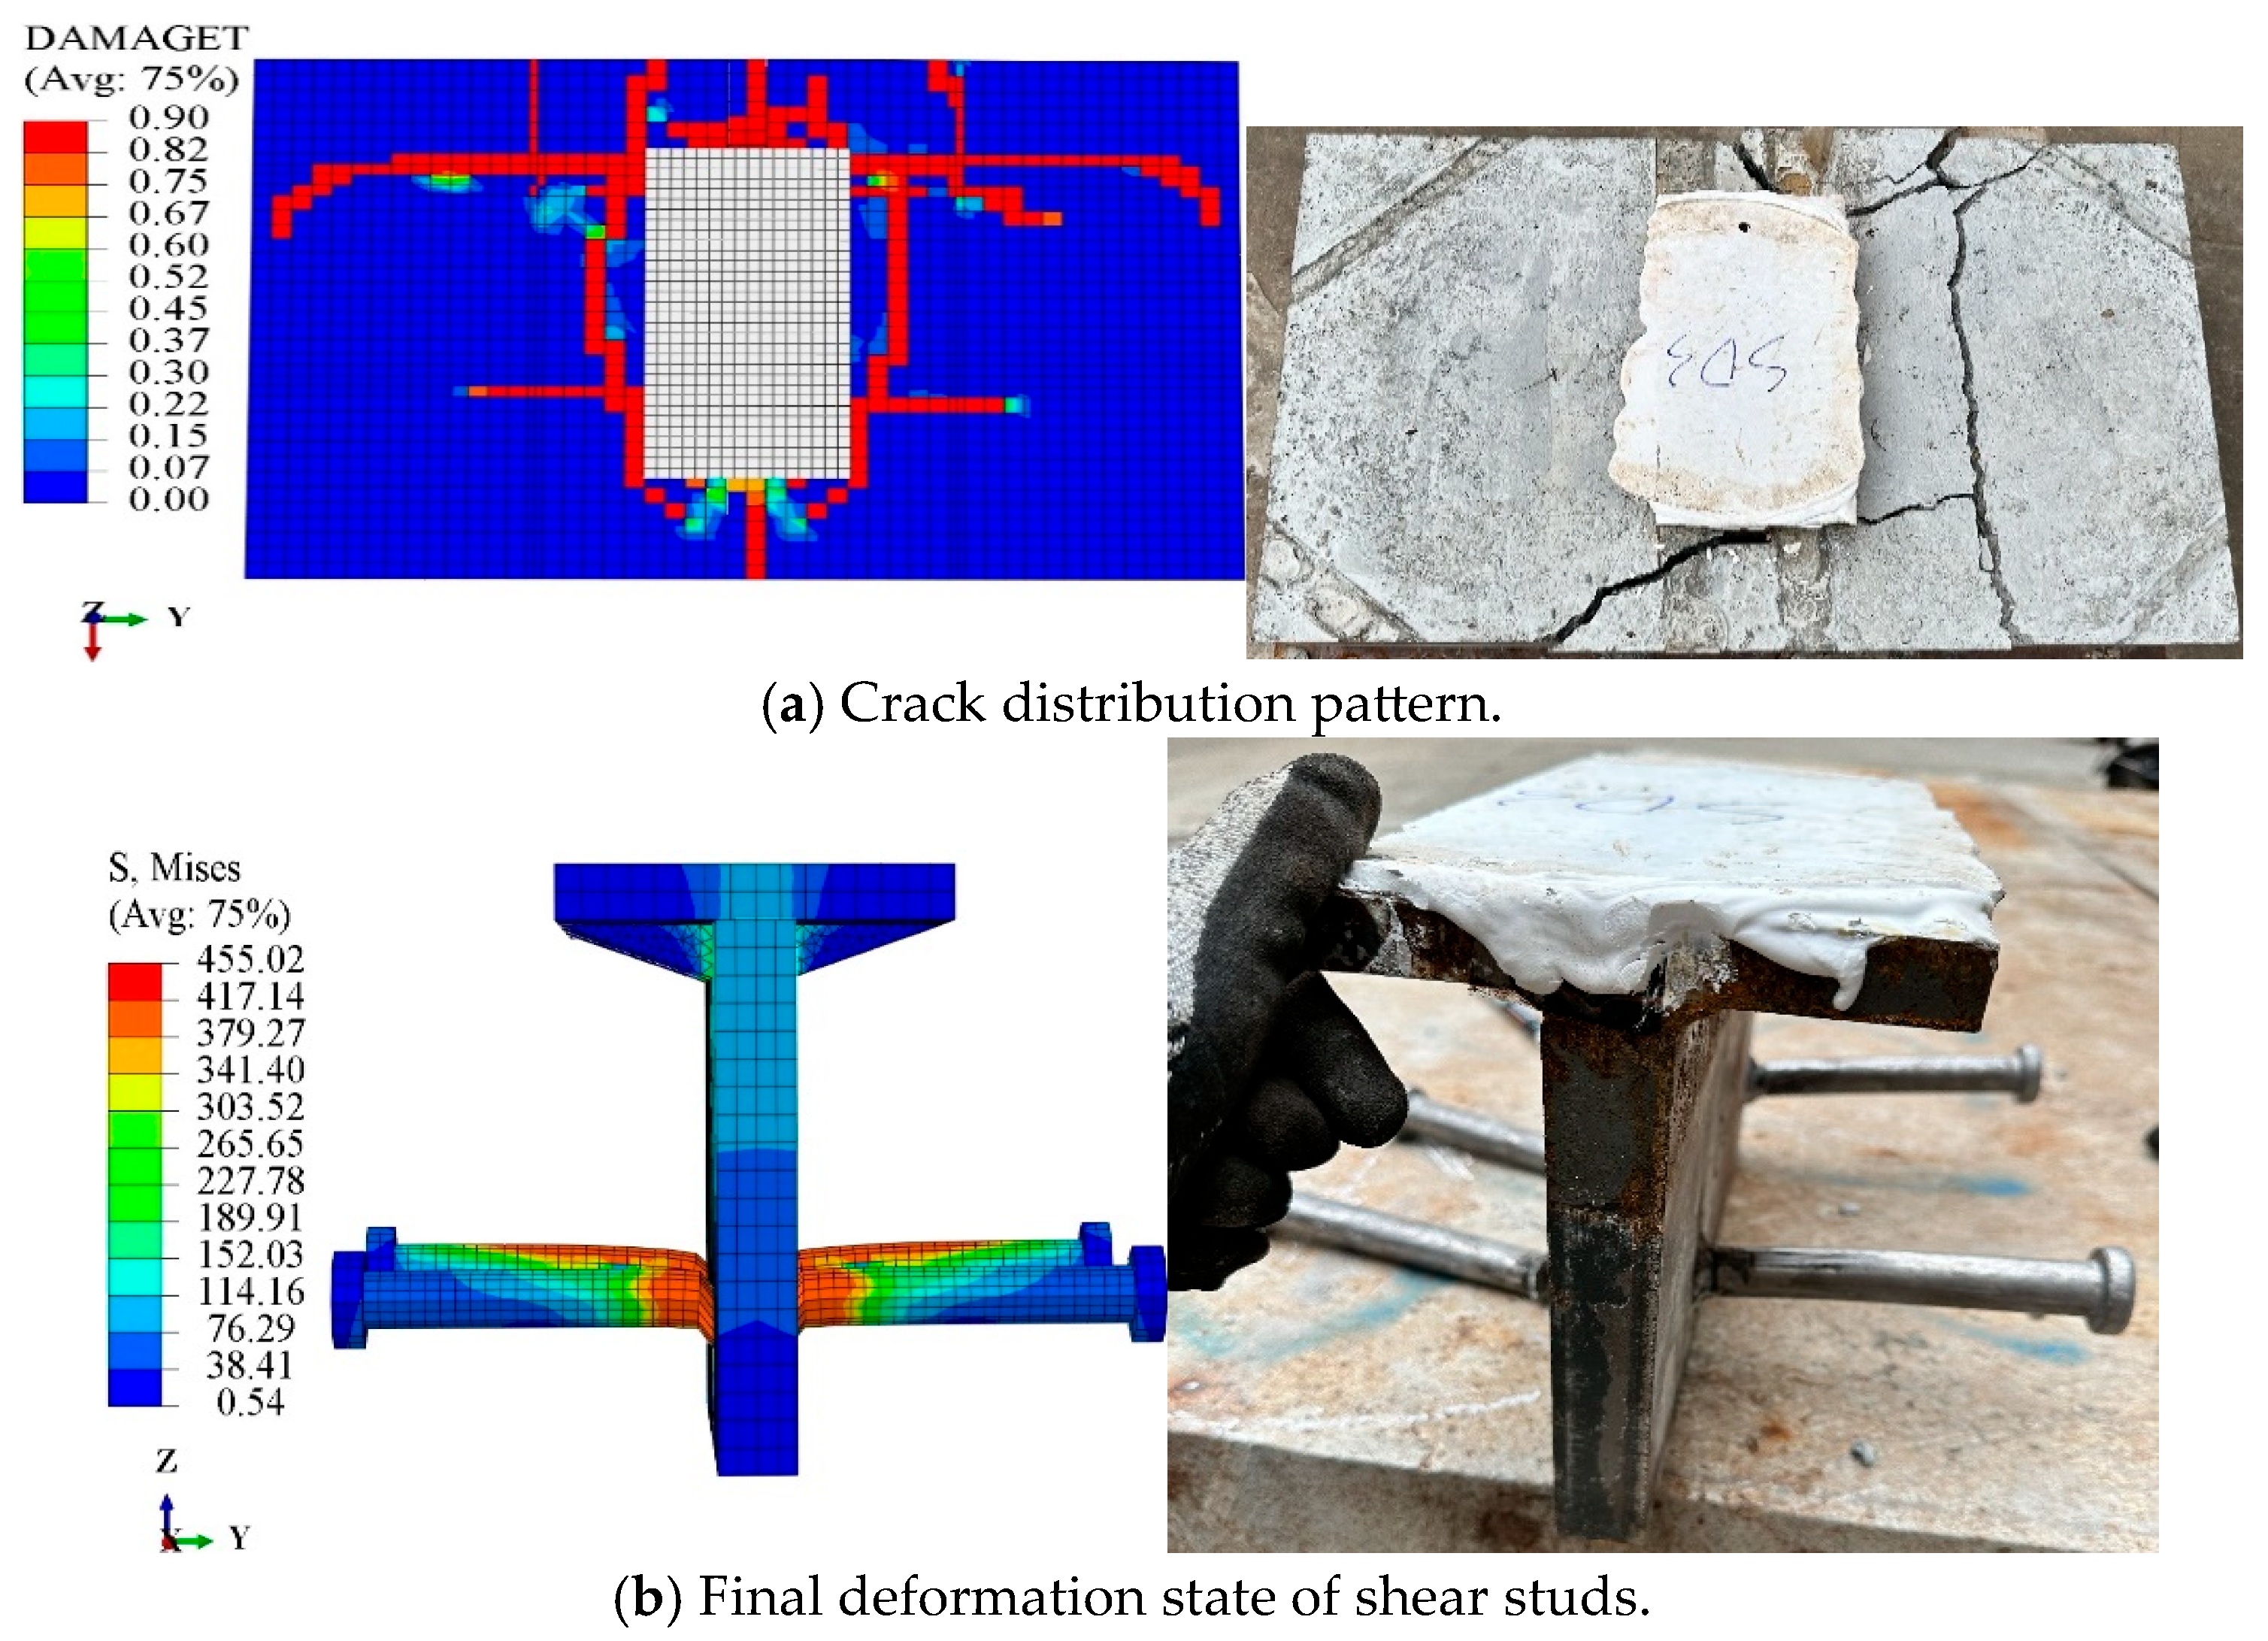
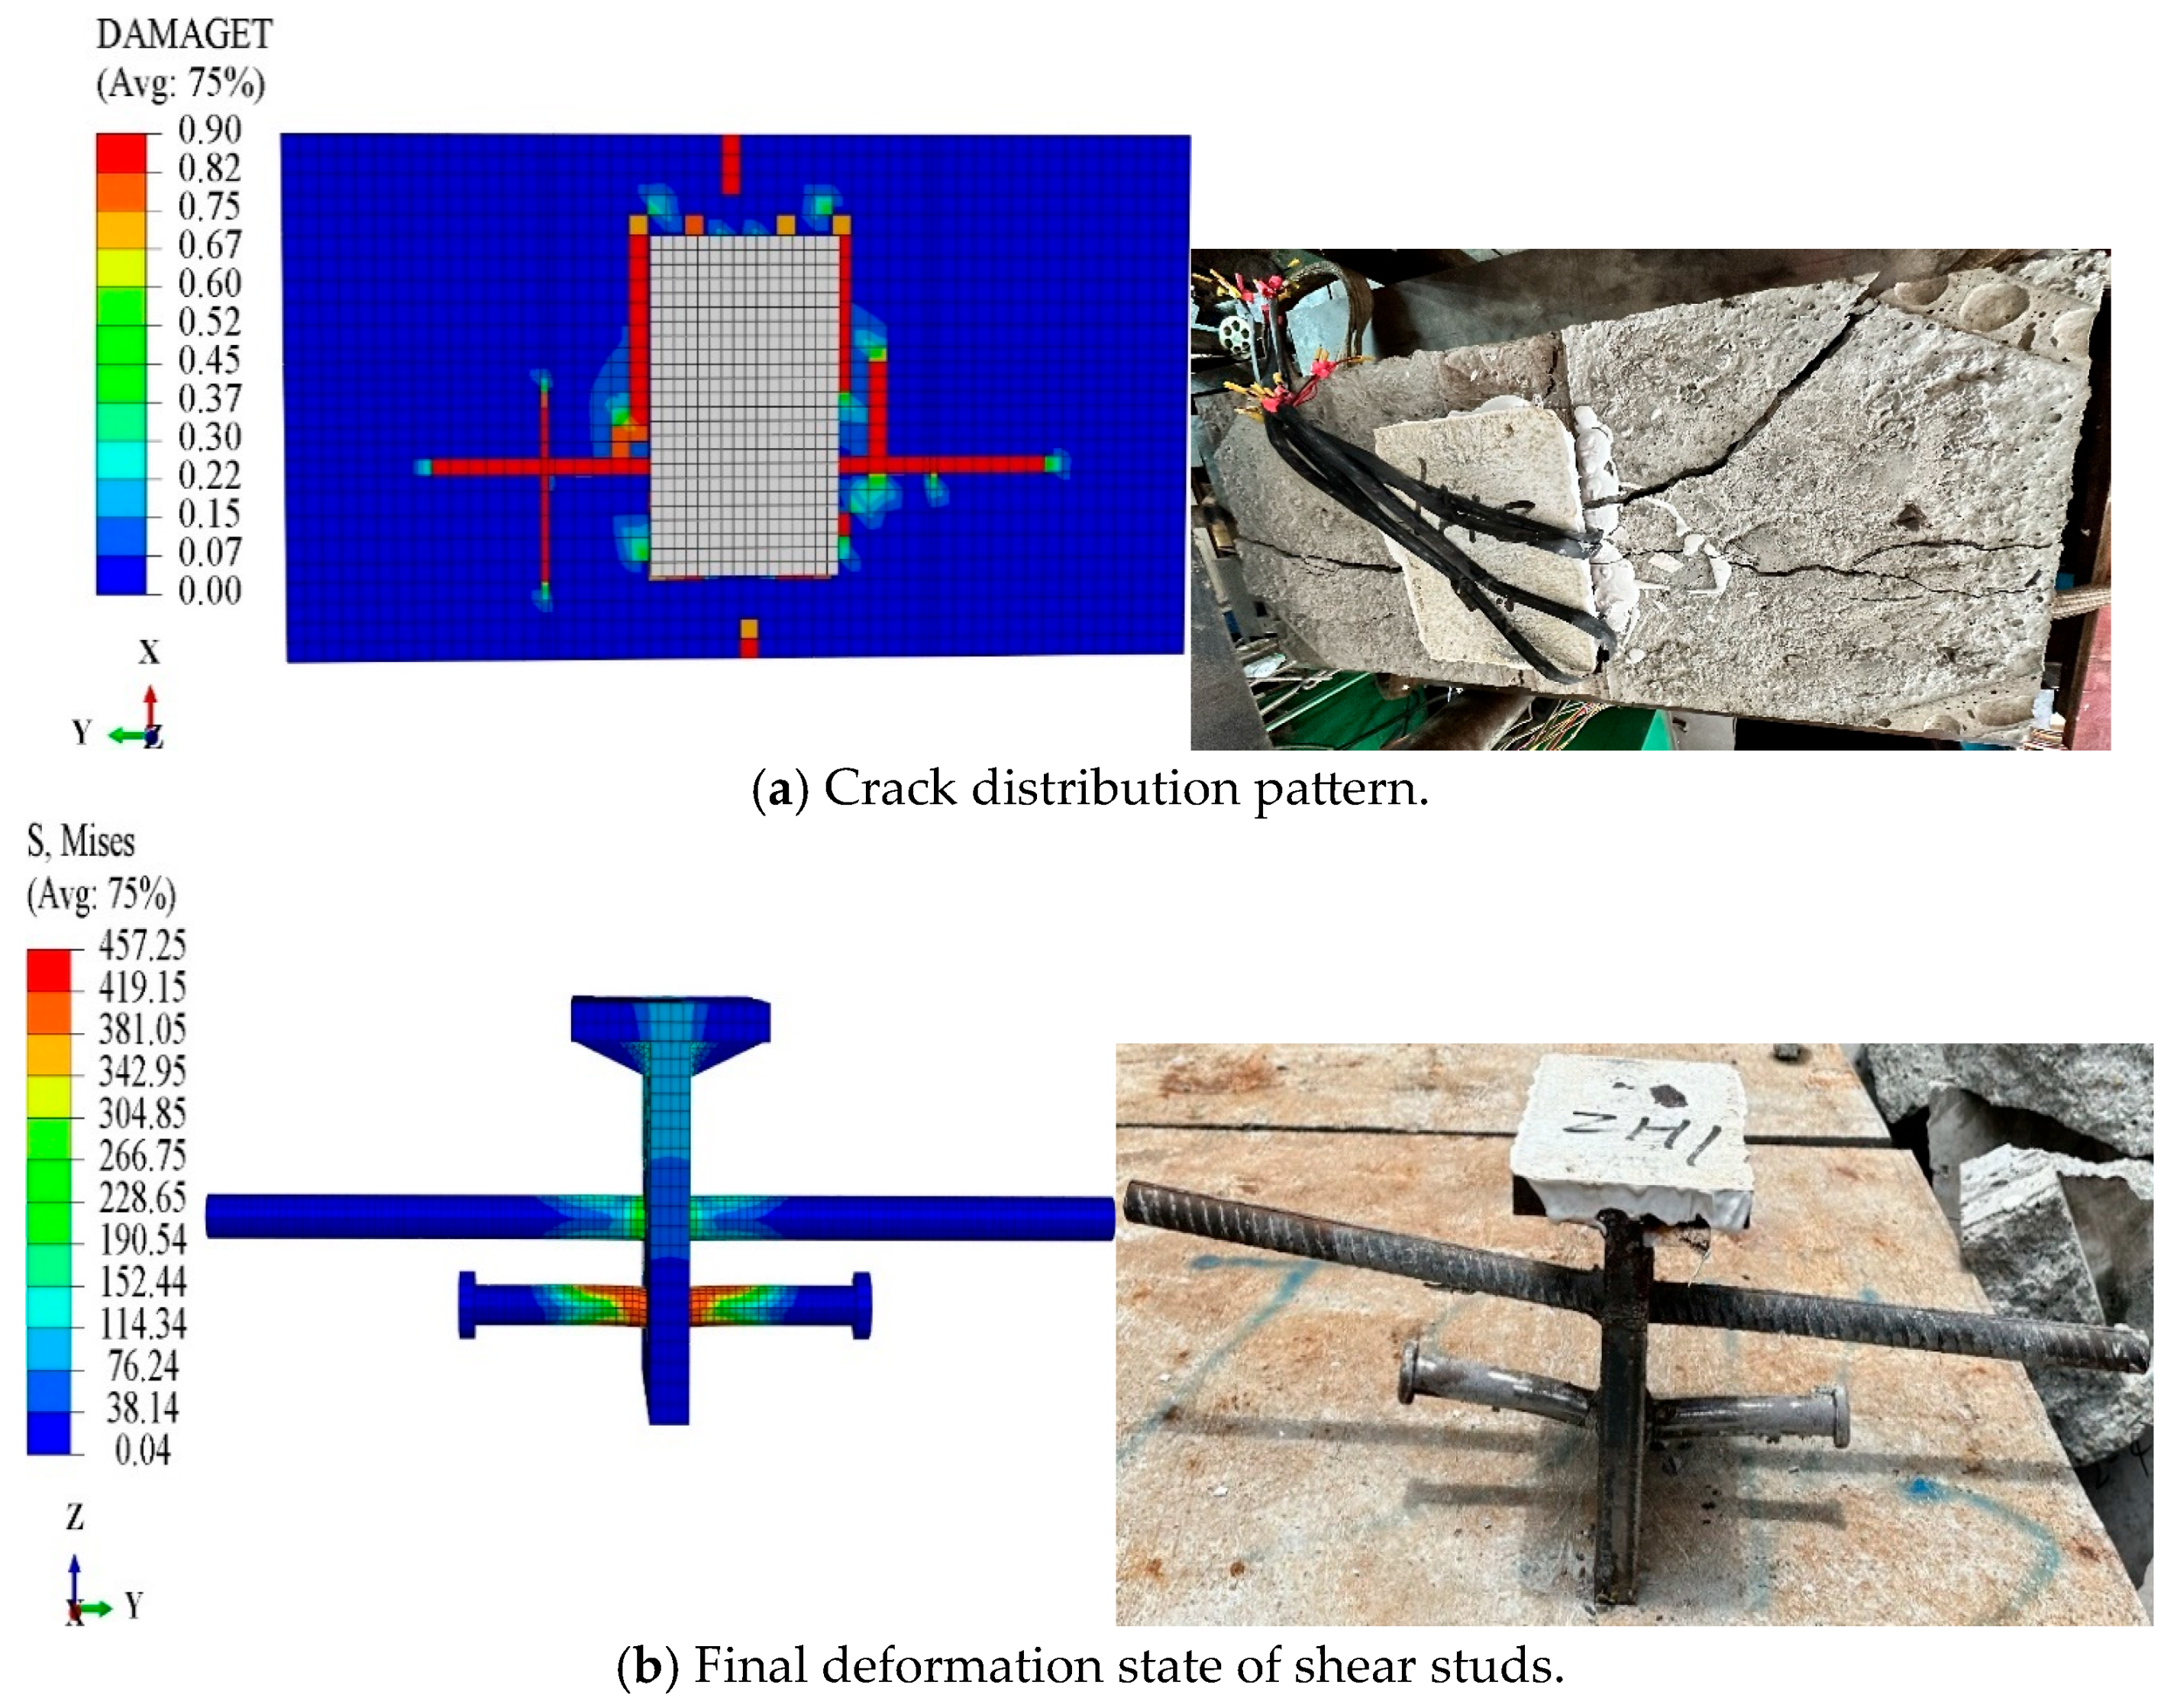
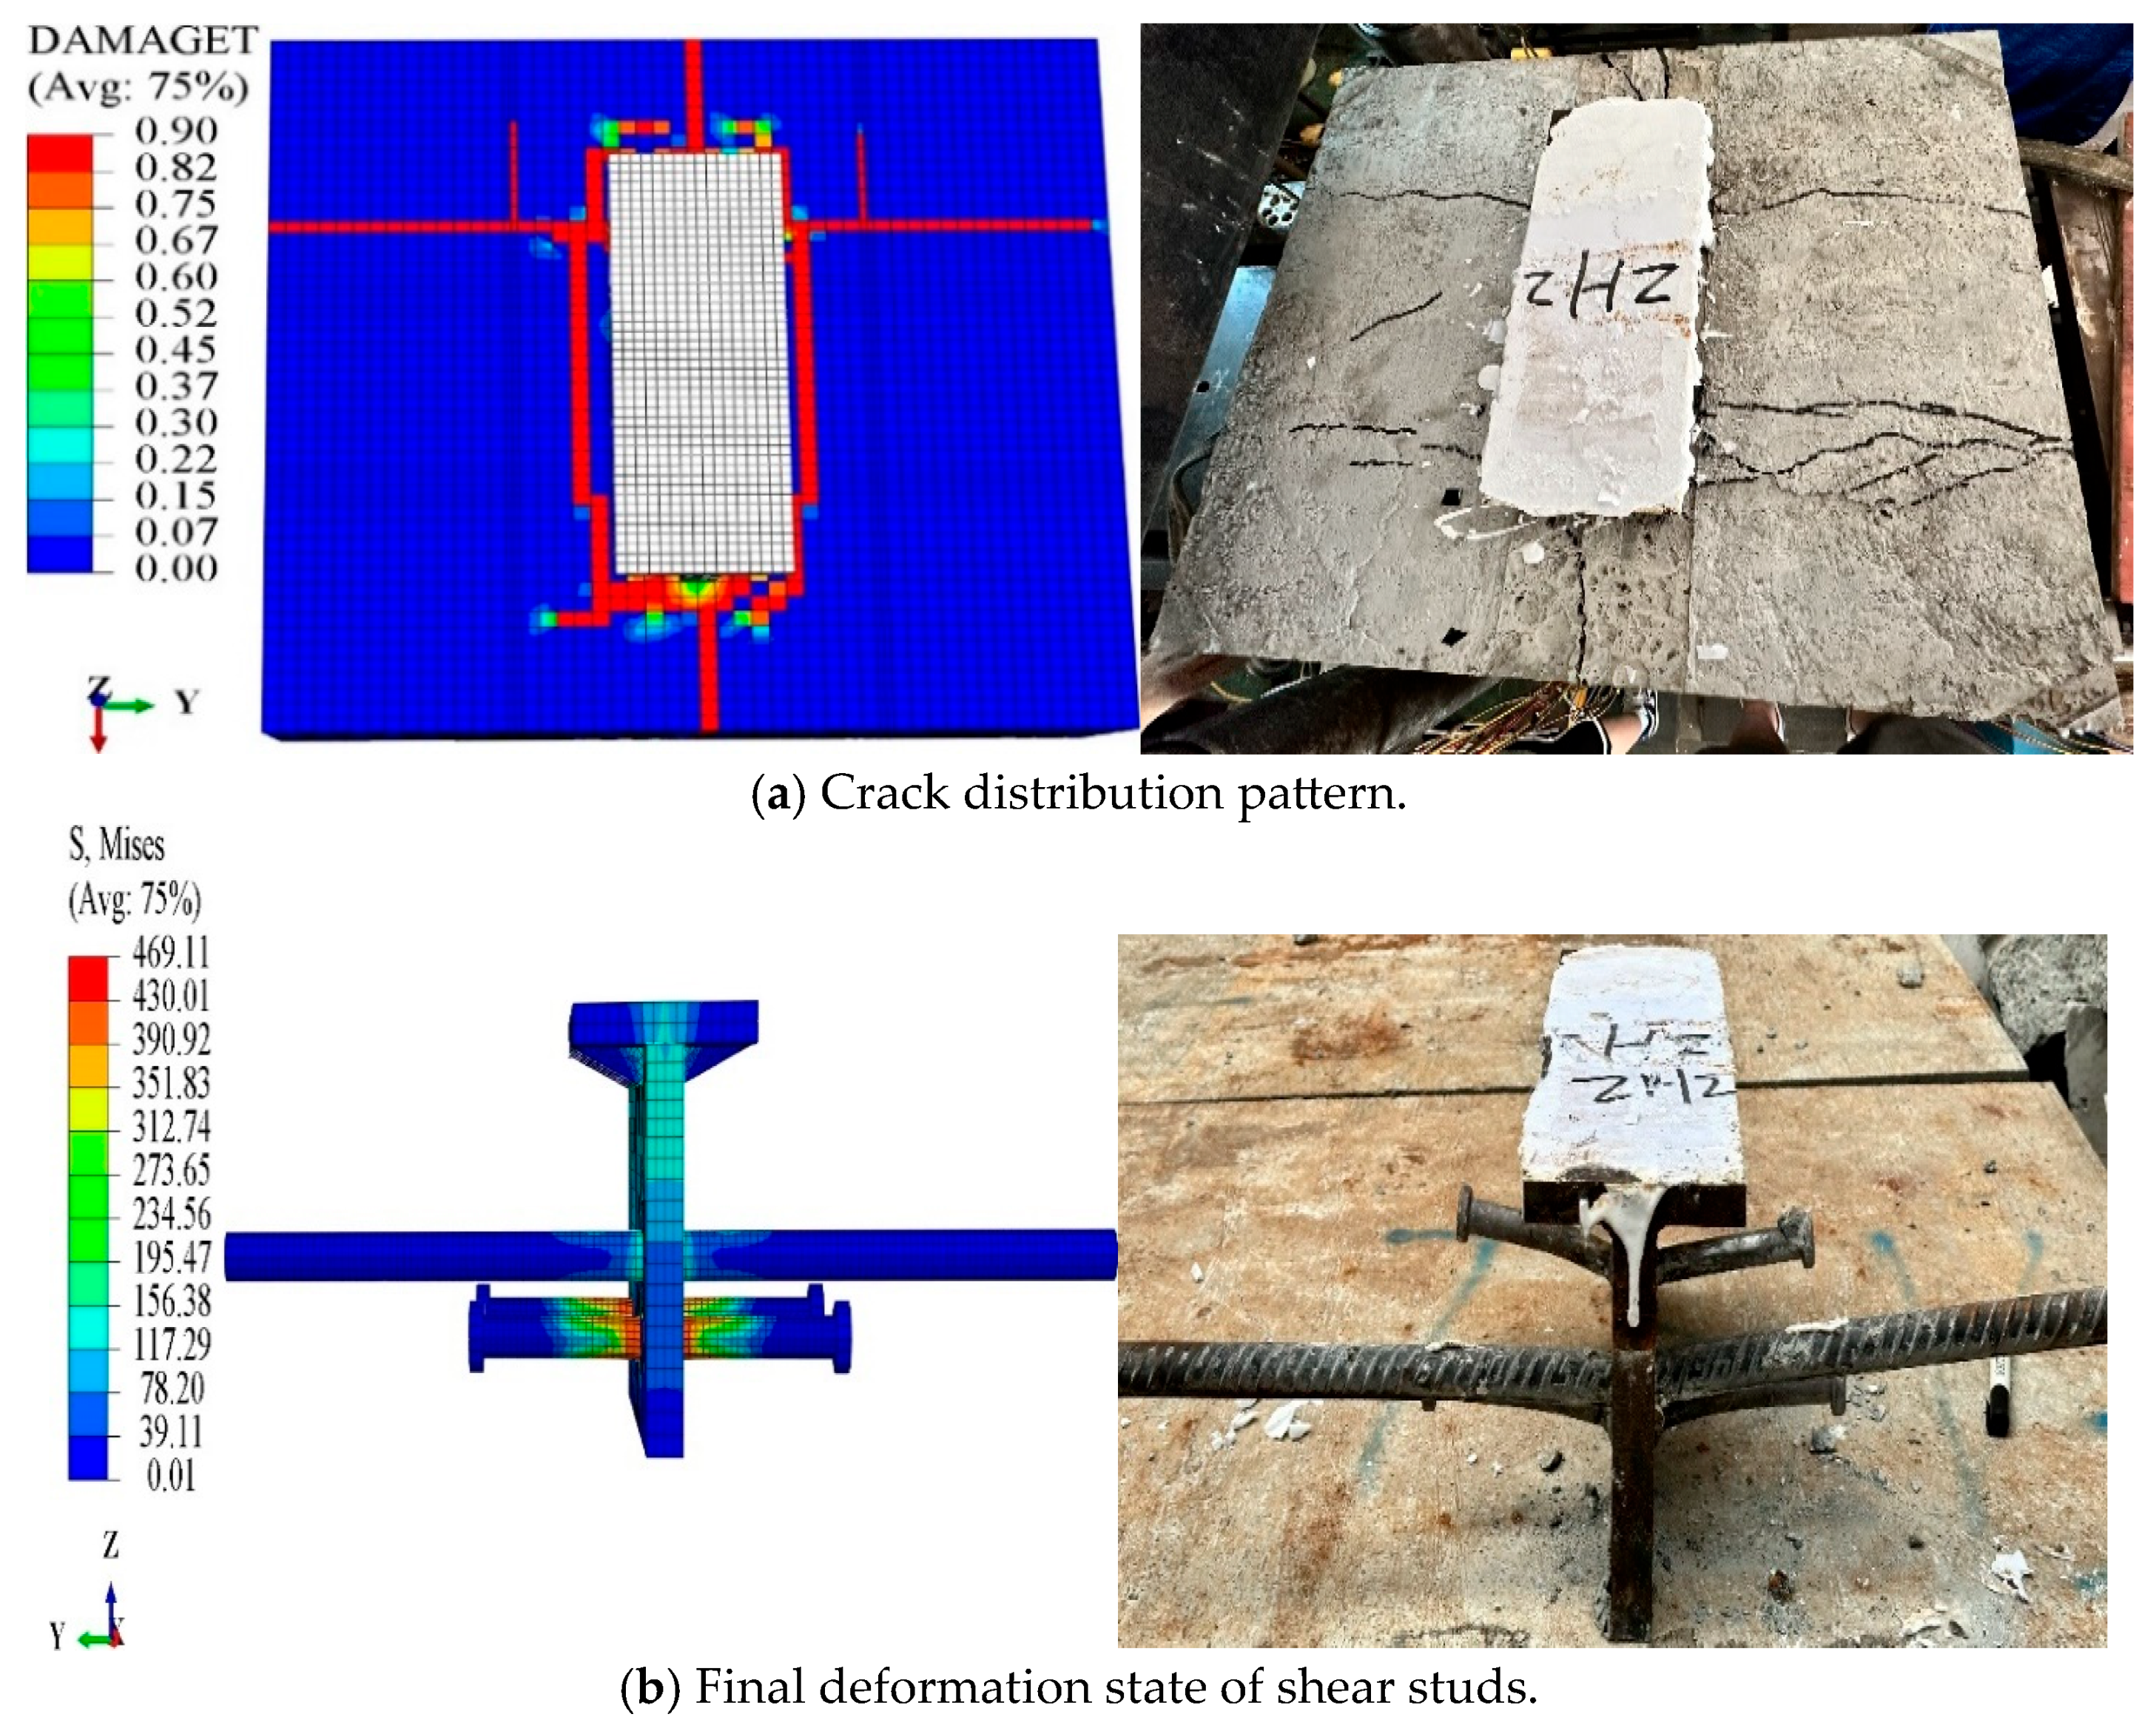
5.3.1. Failure Patterns

Comparisons were conducted between the experimental results and the finite element model predictions concerning the distribution of concrete cracks and the deformation states of components in various connectors. The distribution of concrete cracks and the deformation state of the through-going rebars were compared as shown in Figure 17, Figure 18, Figure 19, Figure 20, Figure 21 and Figure 22.
Figure 17a shows that the finite element results are in basic agreement with the experimental outcomes; transverse cracks were observed near the positions of the through-going rebars, and longitudinal cracks were also present near the perforated plates. The stress contour plots derived from the finite element analysis, displayed in Figure 17b, utilize color intensity and area to indicate stress distribution. The darker and broader the red area, the higher the stress concentration and the corresponding deformation. As indicated in Figure 17b, the final deformation state of the through-going rebars in the perforated plate connectors closely matches the specimen results, with varying degrees of shear deformation occurring near the shear planes of the rebars.
From Figure 18a, Figure 19a and Figure 20a, the distribution of concrete cracks around the shear stud connectors can be observed. The finite element analysis results align closely with the experimental outcomes, showing transverse cracks near the locations of the shear studs and longitudinal cracks adjacent to the vertical steel plates. The extent and overall distribution of these cracks in the concrete blocks also vary depending on the spacing of the shear studs relative to the steel plates. Figure 18b, Figure 19b and Figure 20b display stress contour maps extracted from the finite element calculations, which reveal that the maximum stress concentrations in the three types of shear stud connectors are located near the base of the studs. Additionally, the shear studs themselves exhibit various degrees of warping deformation, consistent with the experimental findings.
From Figure 21a and Figure 22a, it is evident that the finite element results for the two types of composite connectors match well with the experimental data. The concrete blocks exhibit transverse cracks along the direction of the reinforcing bars and shear studs, and longitudinal cracks are also present near the perforated steel plates. The stress contour maps extracted in Figure 21b and Figure 22b indicate that the internal deformation of the reinforcing bars and shear studs within the composite connectors is consistent with what was observed experimentally. Notably, the reinforcing bars exhibit higher stress near the shear planes, and the bases of the shear studs also show significant stress concentrations, with both components undergoing warping deformation.

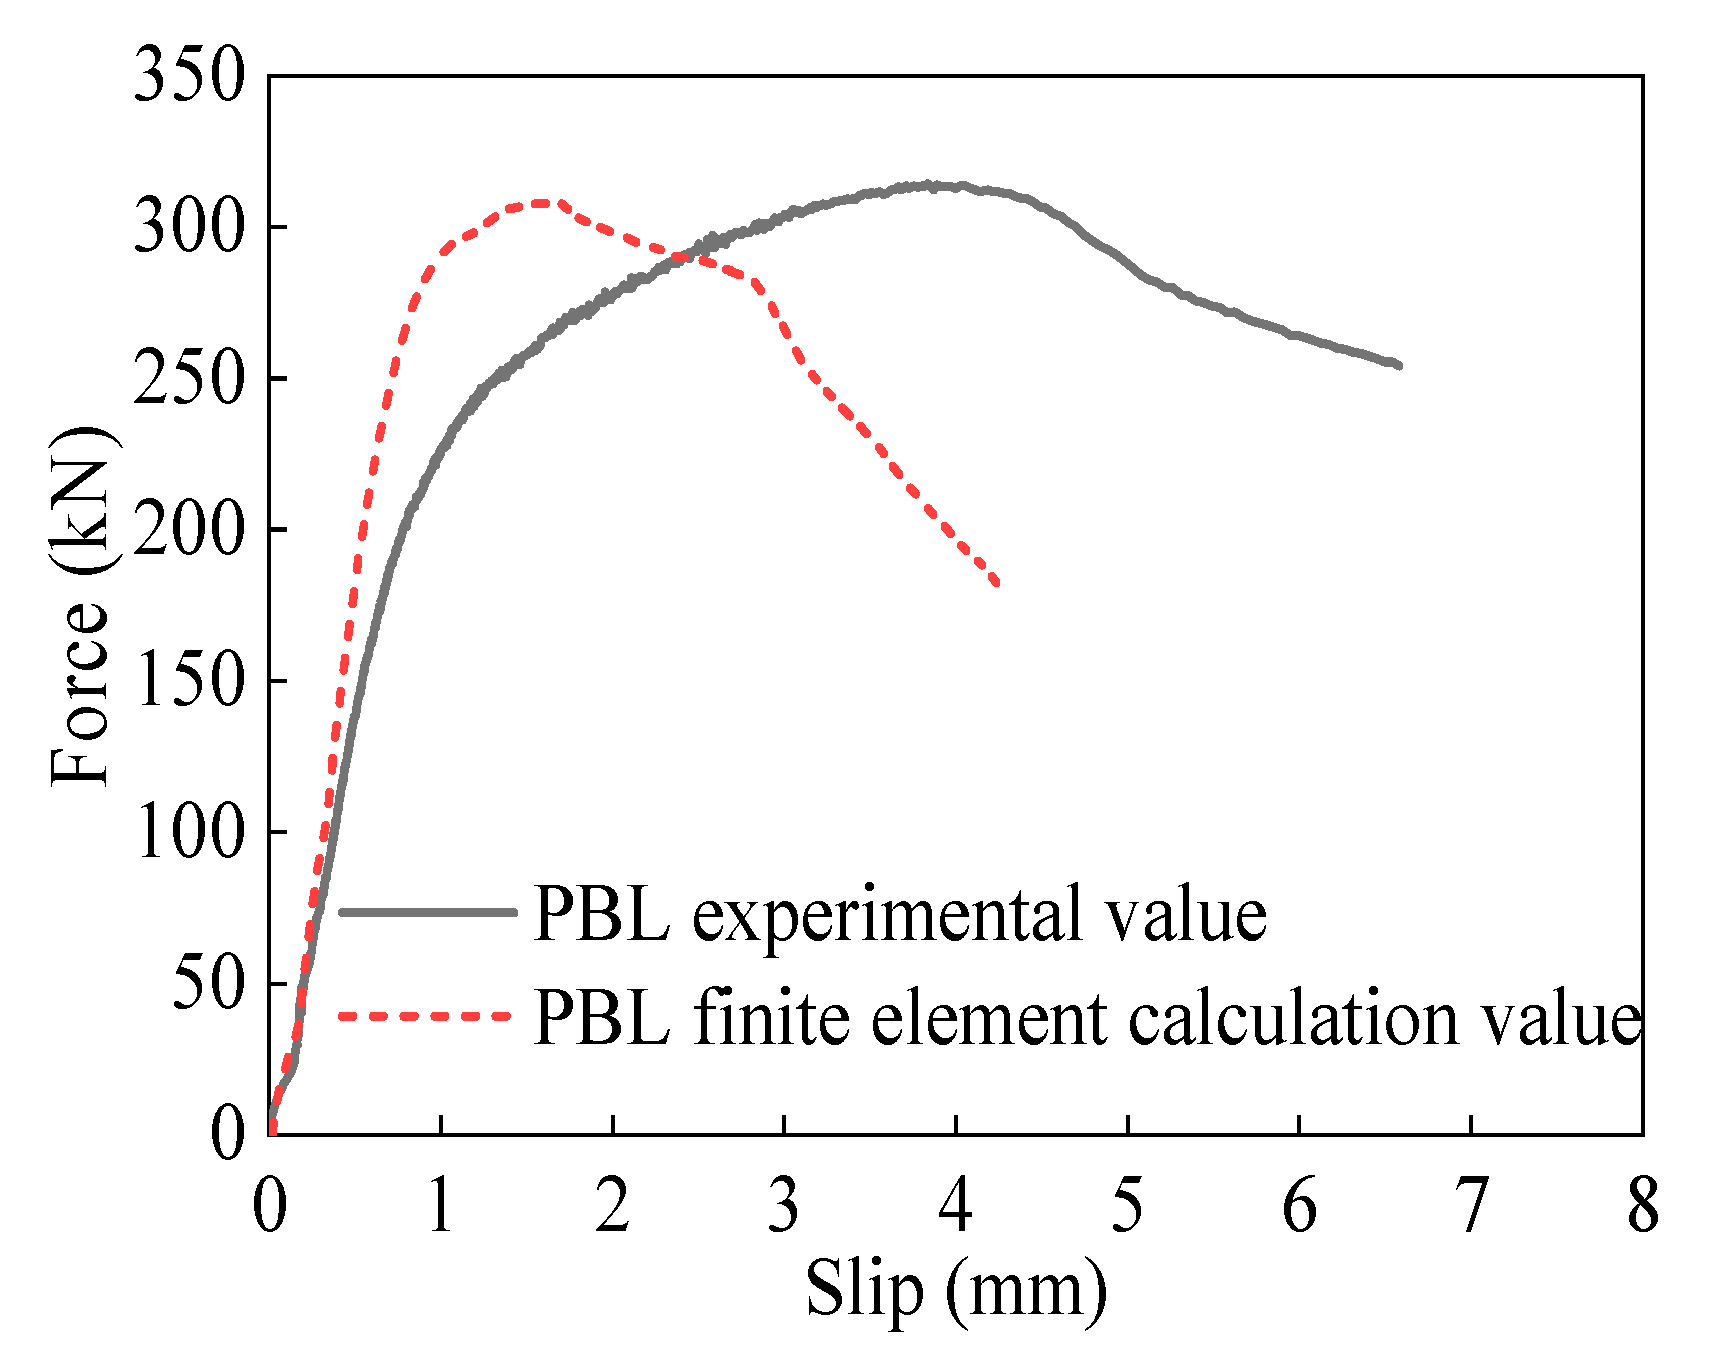
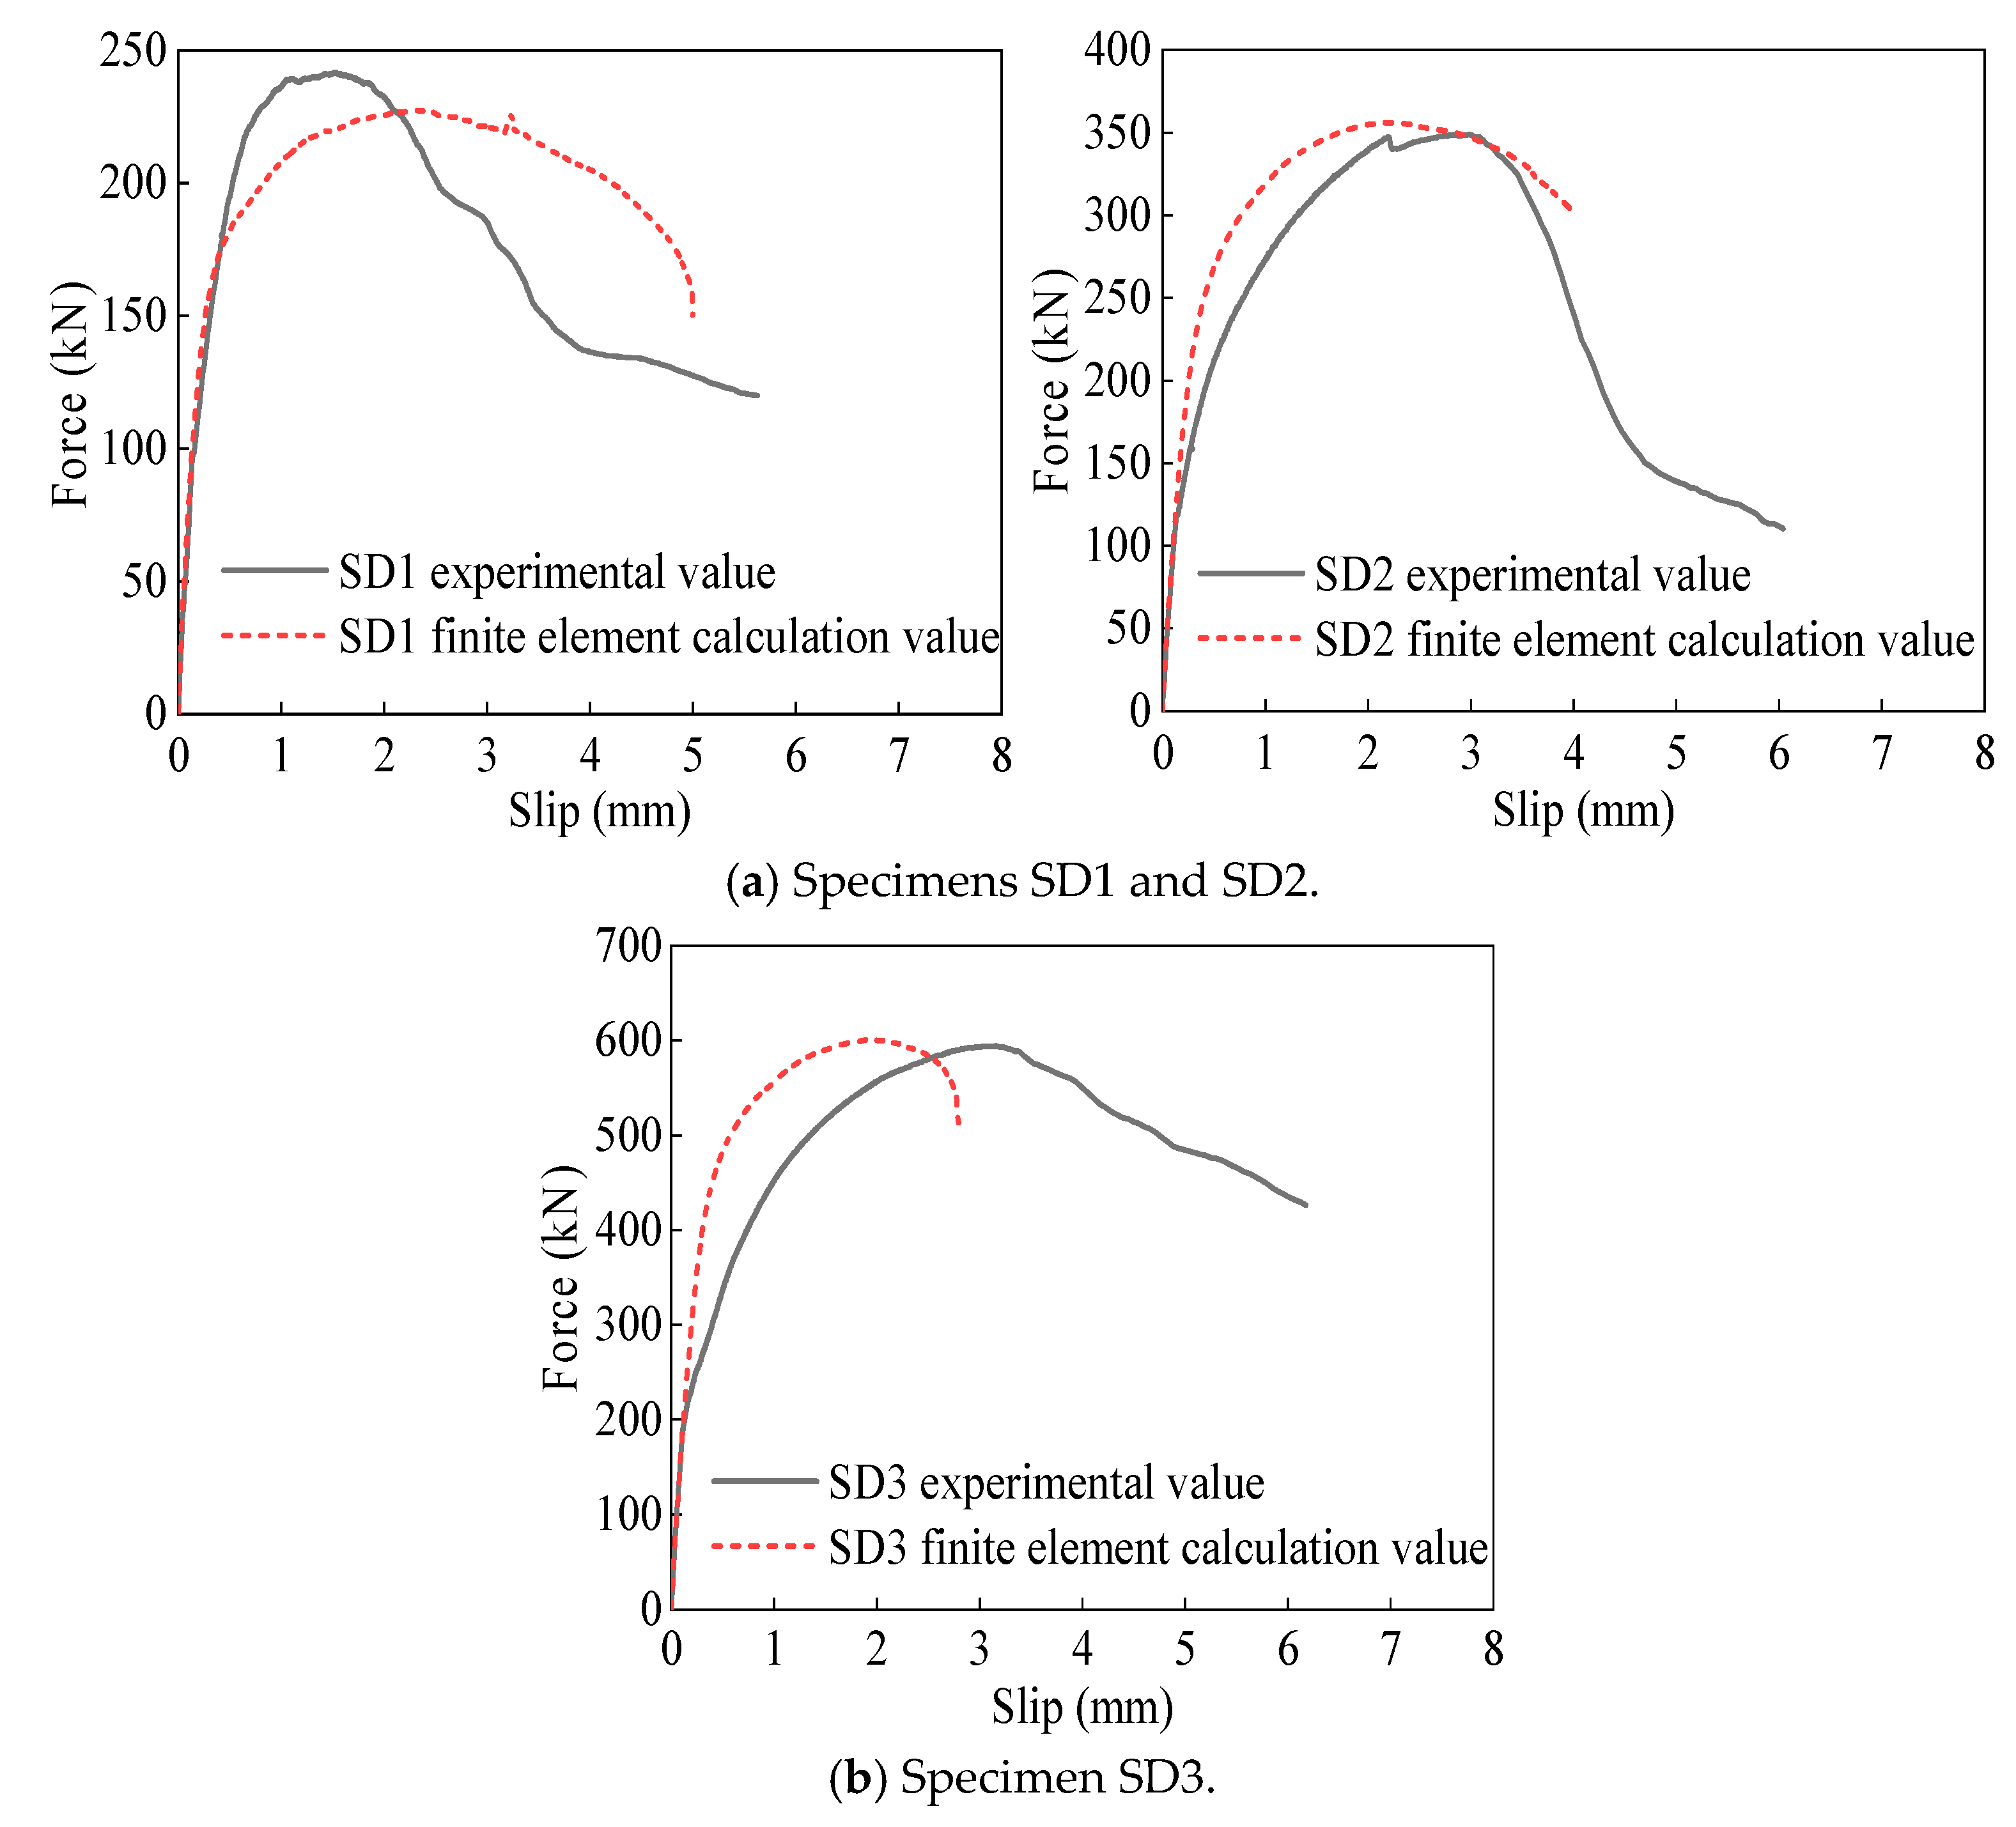
5.3.2. Comparison of Load–Slip Curves

As illustrated in Figure 23, Figure 24 and Figure 25, the load–slip curves derived from the finite element model calculations align closely with the experimental results.
From Figure 23, it is apparent that the load–slip curves for the perforated plate connectors exhibit a high degree of correlation in terms of load capacity. However, discrepancies in slip behavior are observed due to differences between the material properties of concrete in the finite element model and actual concrete damage characteristics, which affects the simulation accuracy of the progressive crushing of the concrete dowels in the finite element software. Additionally, variations are noted in the cracking patterns of the concrete blocks; the finite element model depicts cracks that gradually deepen throughout the computational process, whereas in the experimental setting, cracks form slowly at the initial stages of loading and subsequently expand rapidly as the load increases. Consequently, the peak loads calculated in the finite element analysis are generally higher than those measured experimentally.
As shown in Figure 24, the load–slip curves for the three types of shear stud connectors correlate well in terms of load-bearing capacity. The finite element results also reflect an additive relationship between specimens SD3 and specimens SD1 and SD2, consistent with experimental observations. However, some differences in slip behavior between the finite element calculations and experimental results are noted. These discrepancies arise primarily from two factors: the difference between the concrete damage model in the finite element simulation and the actual rate of concrete cracking during the experimental loading, and the continued slow increase in bearing capacity after yielding in the finite element model, contrasted with potential rapid shearing off of the shear stud bases due to differences in welding strength to the steel plate observed in the experiments.
Figure 25 illustrates that the load–slip curves for two types of composite connectors align well prior to the yielding phase. However, as the specimens enter the yielding phase, discrepancies emerge due to the positioning of the shear studs and reinforcing bars at different vertical heights, with the shear studs located near the bottom of the steel plates. In the finite element model, this leads to computational non-convergence due to excessive concrete damage, resulting in element distortion at certain displacements. Consequently, it is challenging to compute a complete load–slip curve for the composite connectors. Moreover, the peak load values calculated for the finite element model of composite connector ZH1 almost satisfy the additive relationship of the peak load values calculated for the perforated plate connector and shear stud connector SD1, and similarly for composite connector ZH2, which matches the additive peak load values of composite connector ZH1 and shear stud connector SD2.

6. Conclusions

This study, based on the actual dimensions of the steel–concrete composite section of the bridge tower in an under-construction steel shell concrete high-low tower hybrid beam cable-stayed bridge, involved a uniform and rational multi-layer segmentation. Selected single-layer composite connectors from the segmented layers were utilized to design a total of 18 specimens in six groups to investigate their shear mechanical properties and stress mechanisms. The experimental results were analyzed to validate the feasibility of the proposed experimental methodology and finite element modeling approach, and to elucidate the stress mechanism of the single-layer composite connectors within the steel–concrete composite section of the bridge tower.
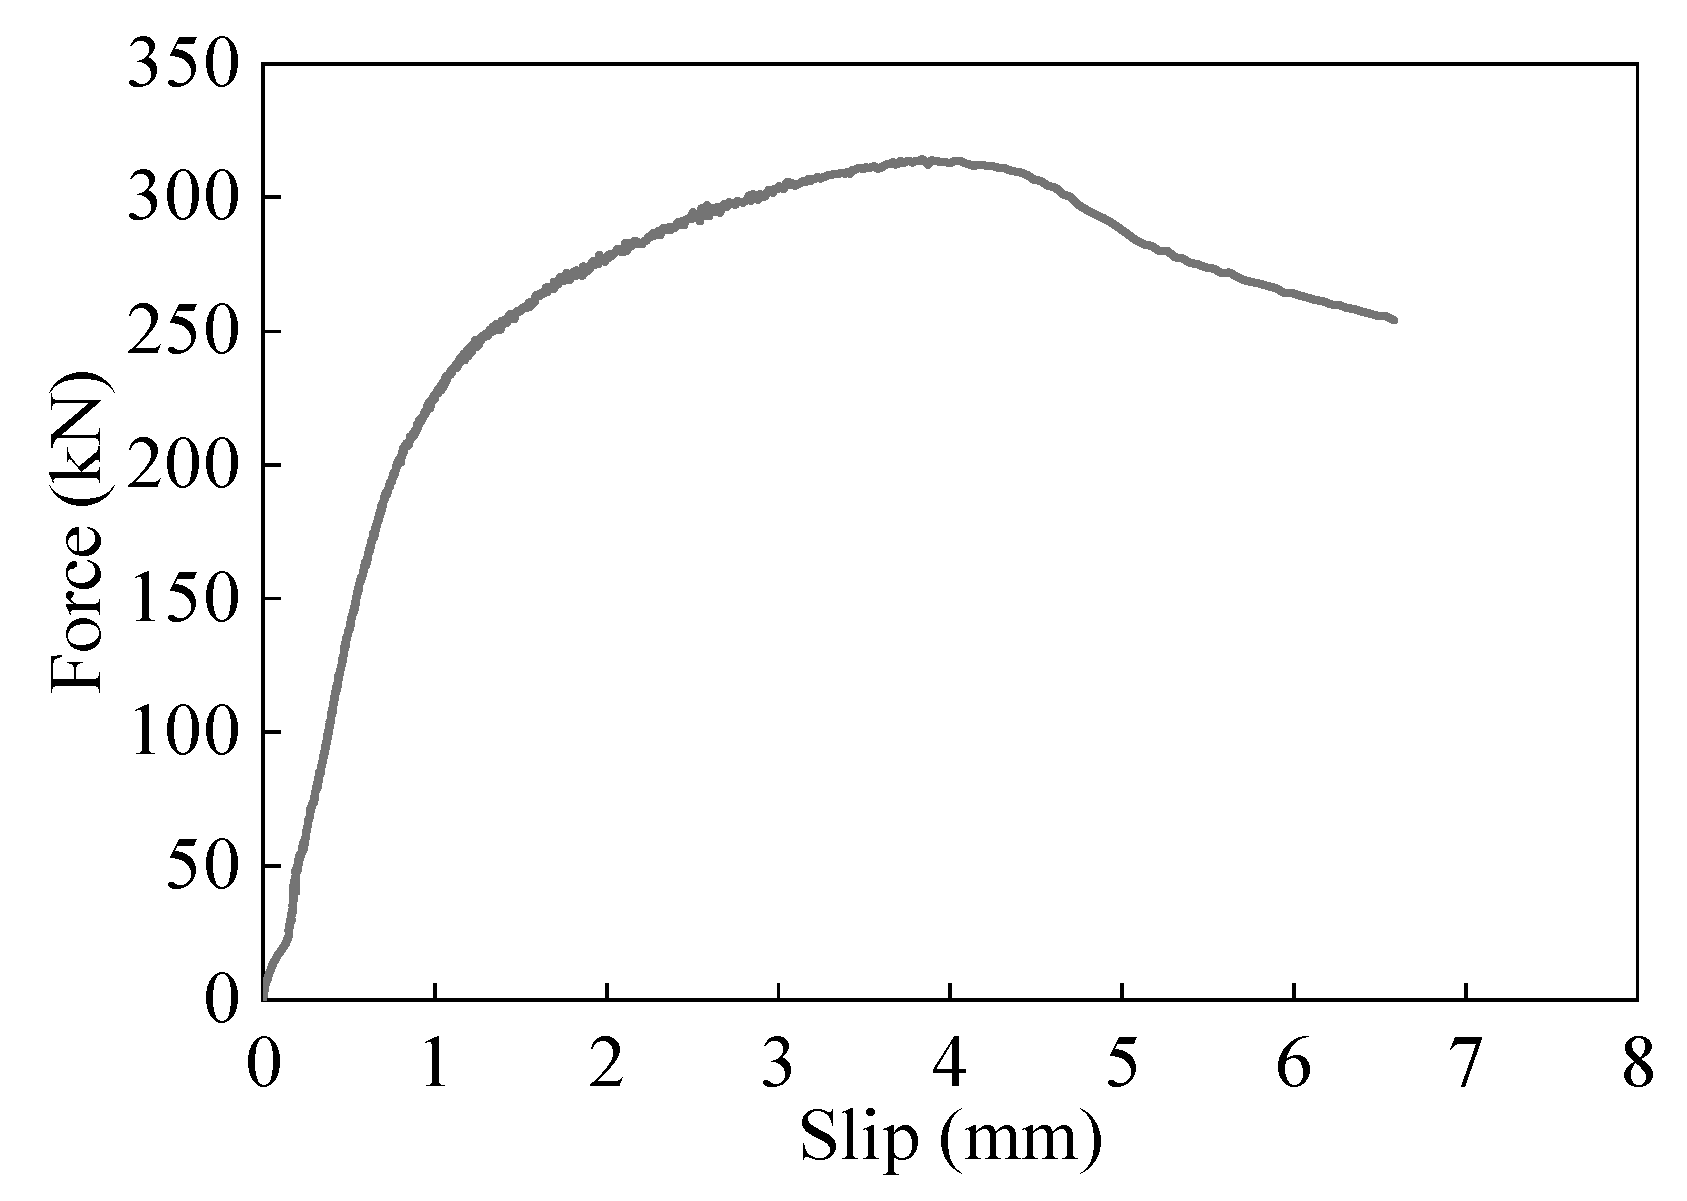
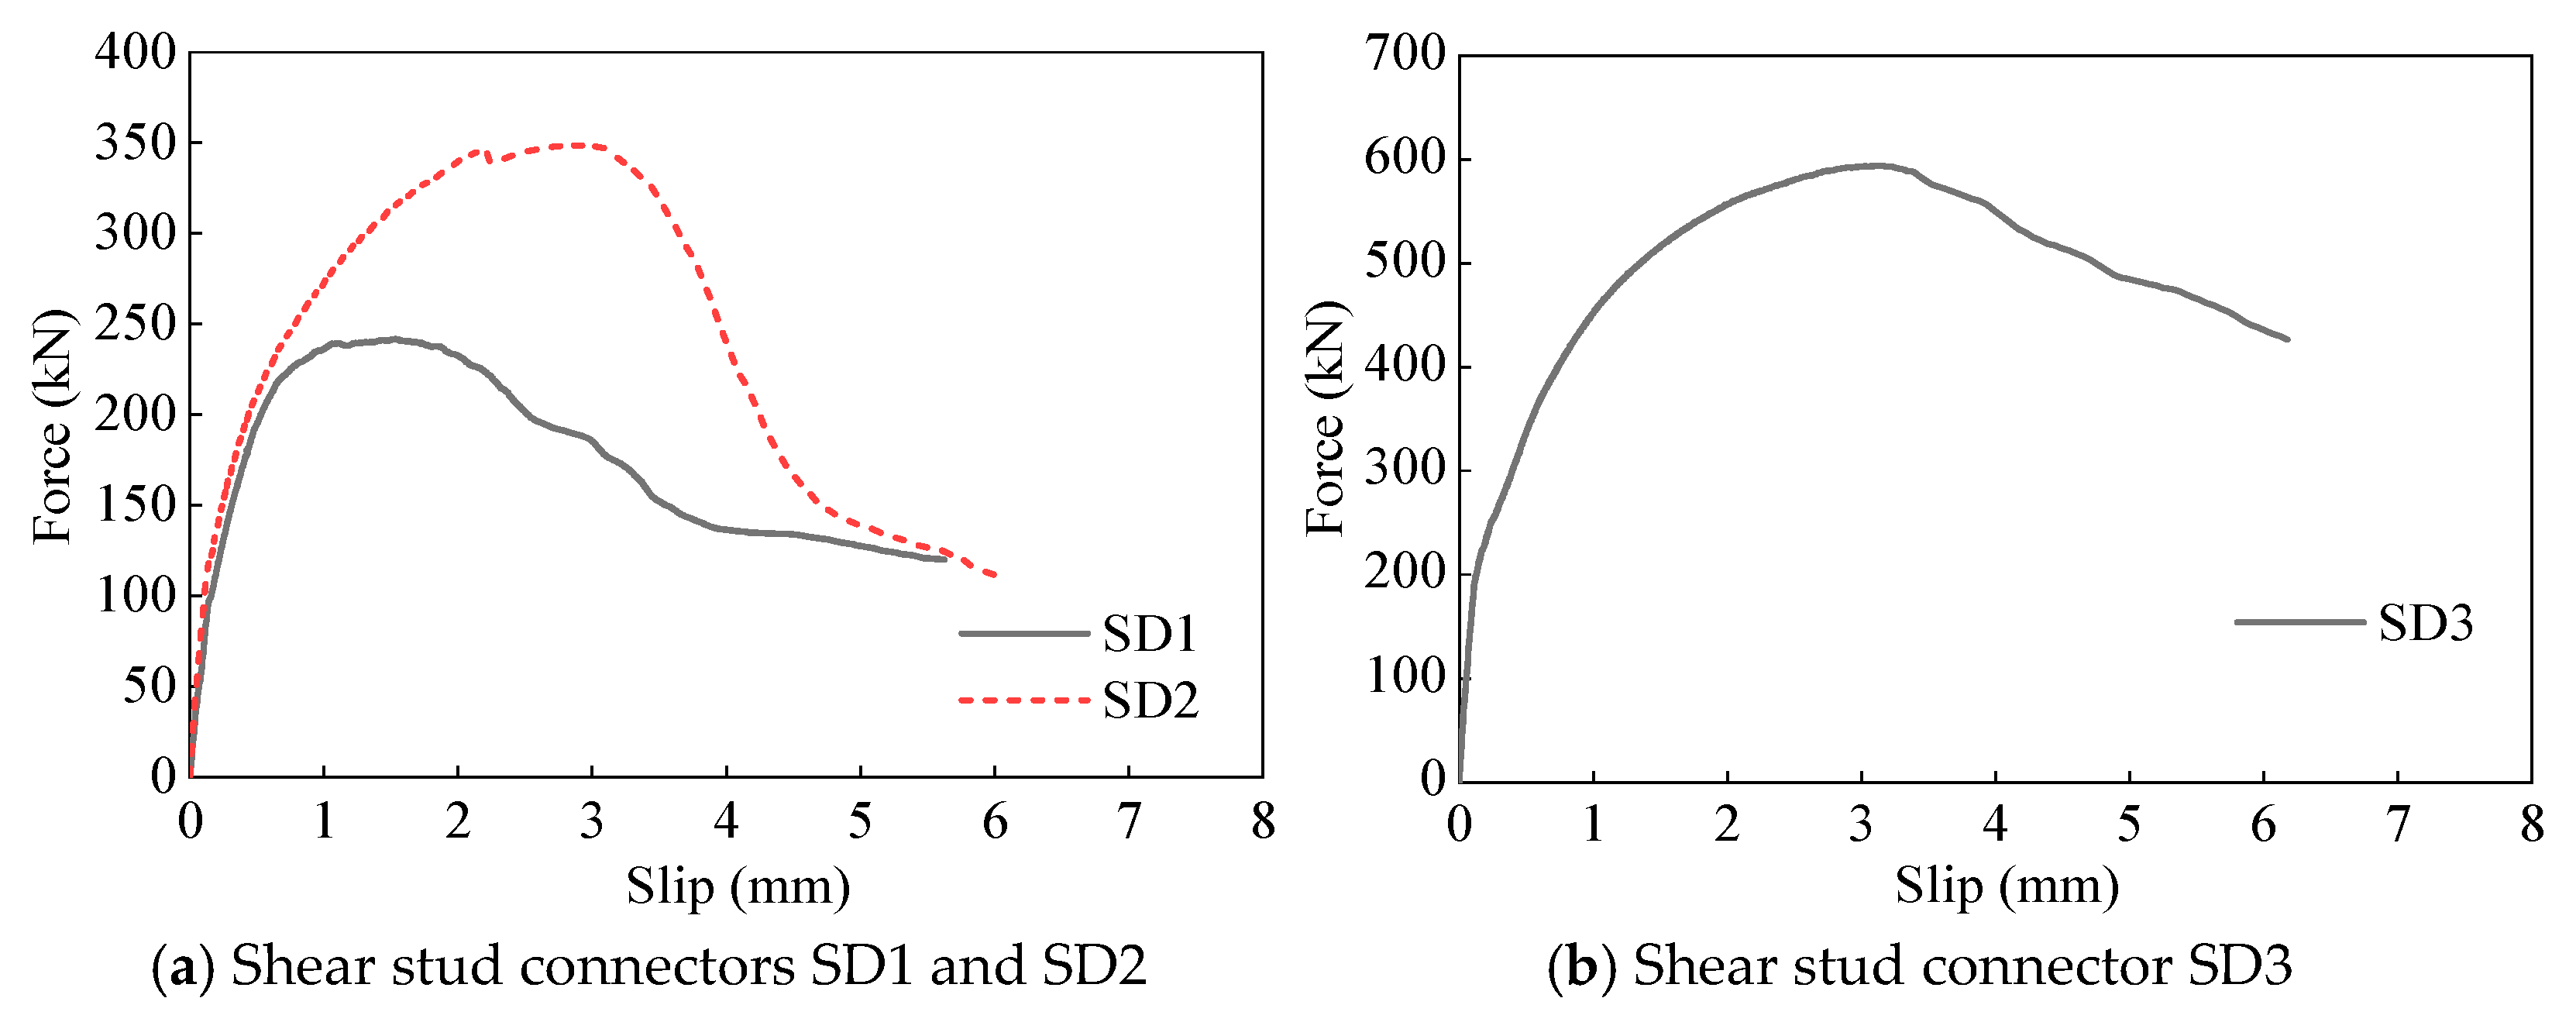
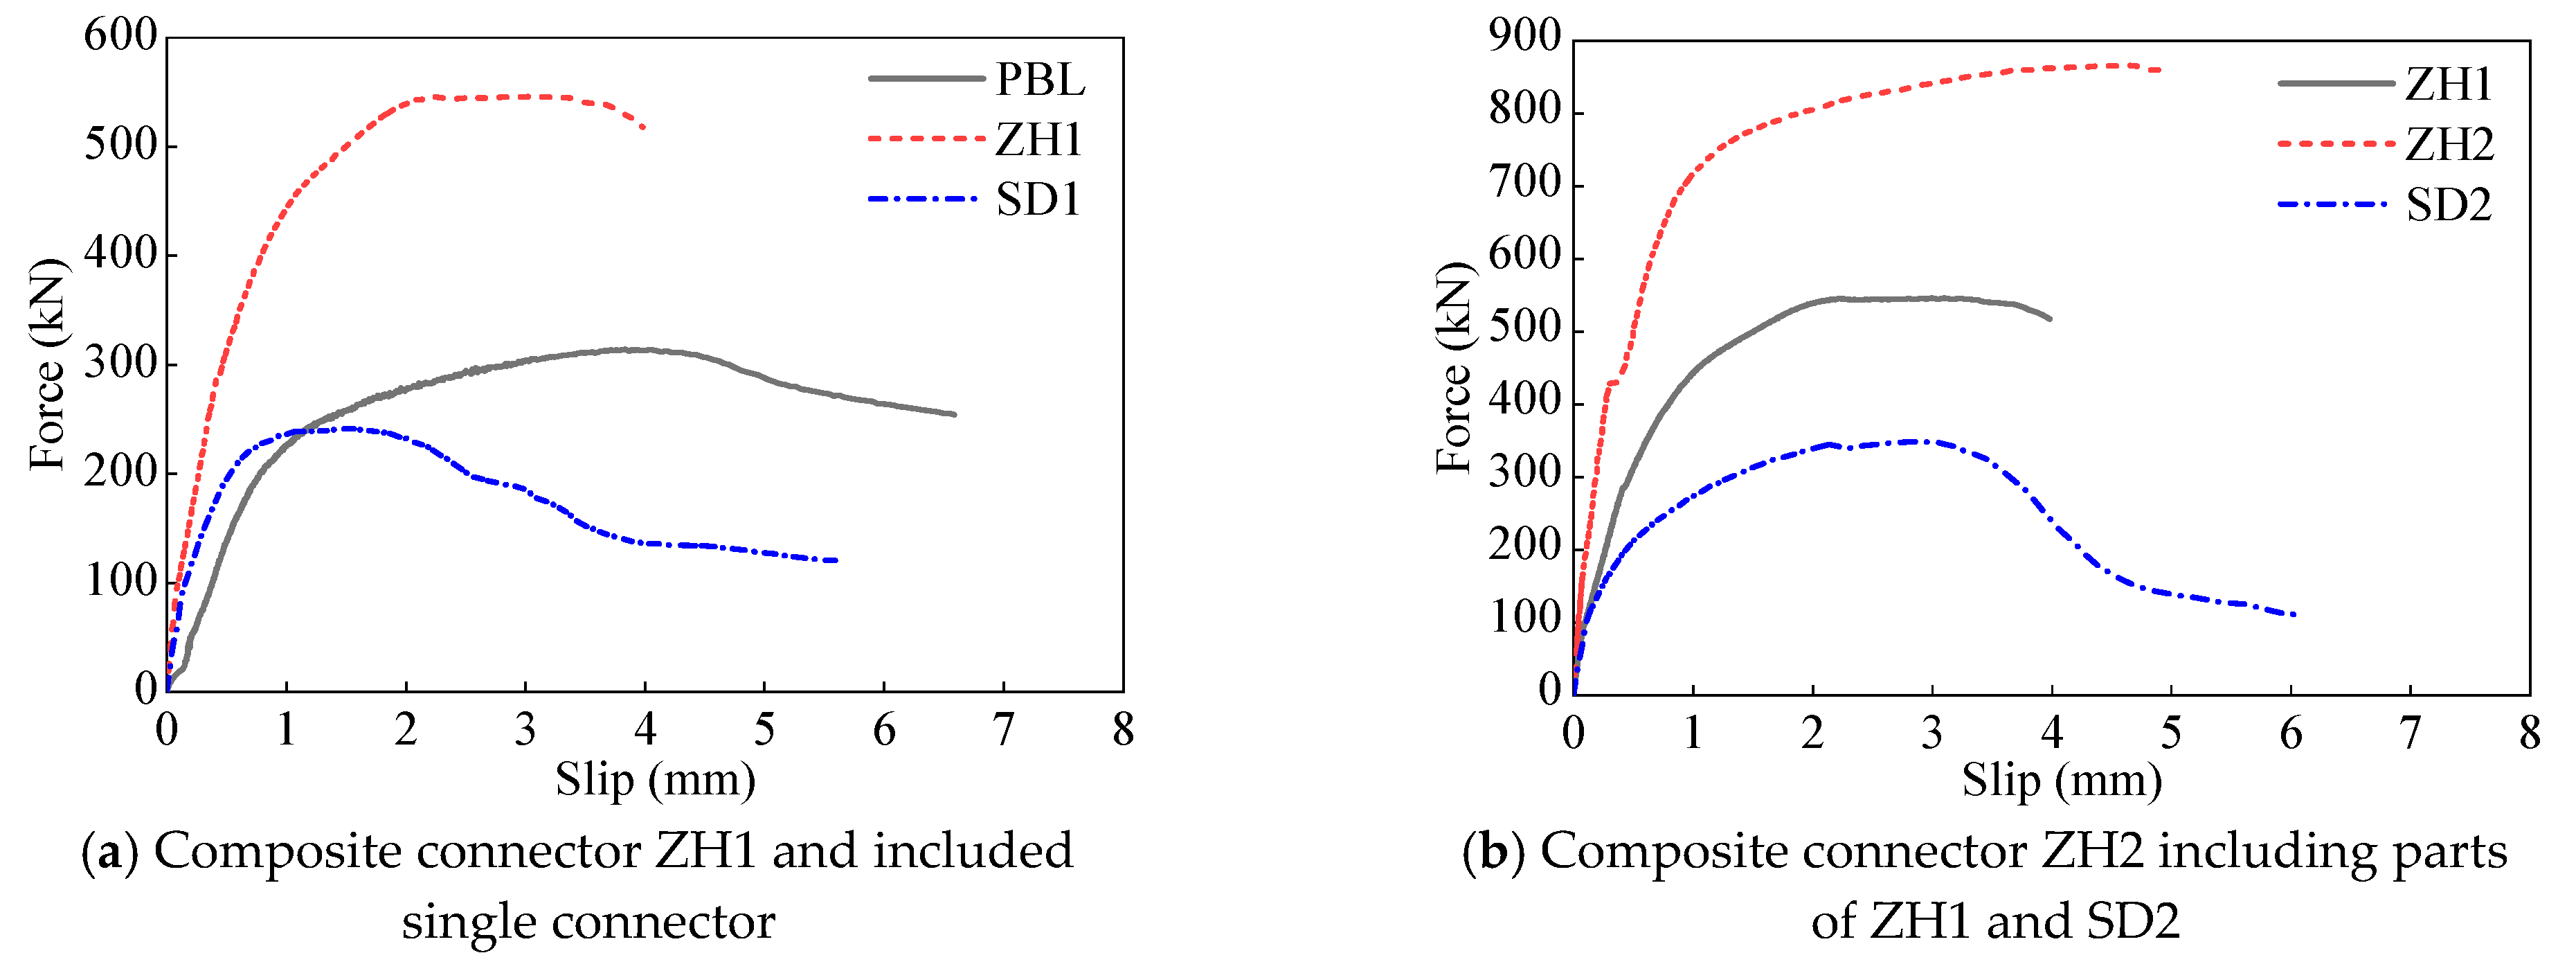
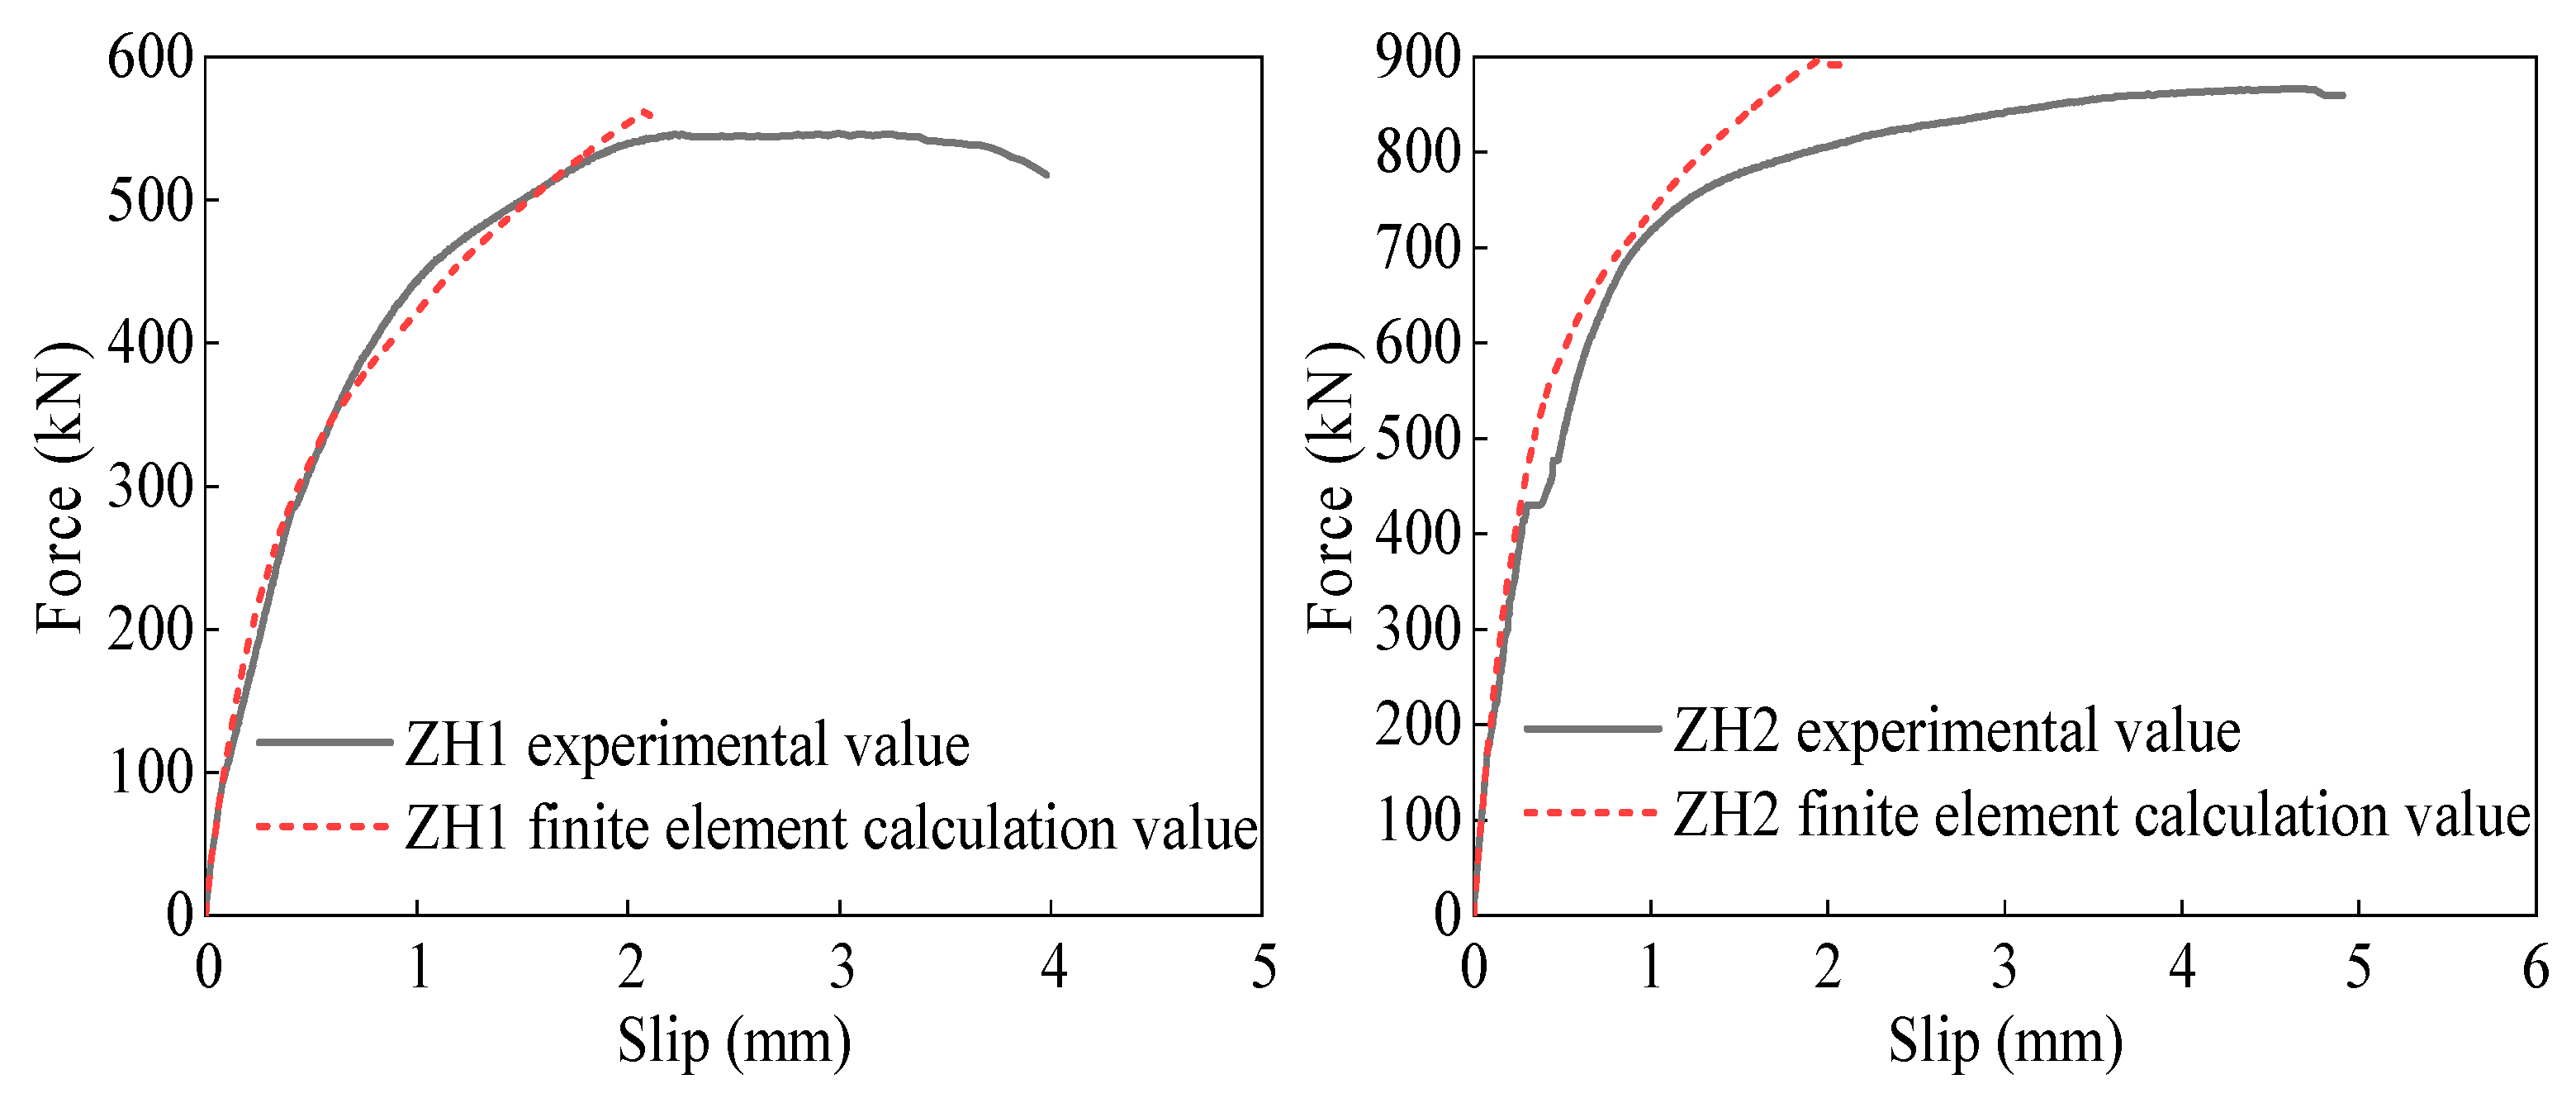
  • The loading process of the composite connectors within the steel–concrete composite section of the bridge tower is divided into three stages: the elastic stage, the elastic-plastic stage, and the declining stage. Based on the comparison of the load–slip curves of the three types of specimens (Figure 23, Figure 24 and Figure 25) and the delineation of ductility as the deformation capacity of the specimen without a marked decrease in bearing capacity, it can be inferred that the combined connection constituted by parallel single connection components possesses better bearing capacity and ductility than the single connection component, and is capable of fulfilling the application requirements of steel shell concrete bridge towers.
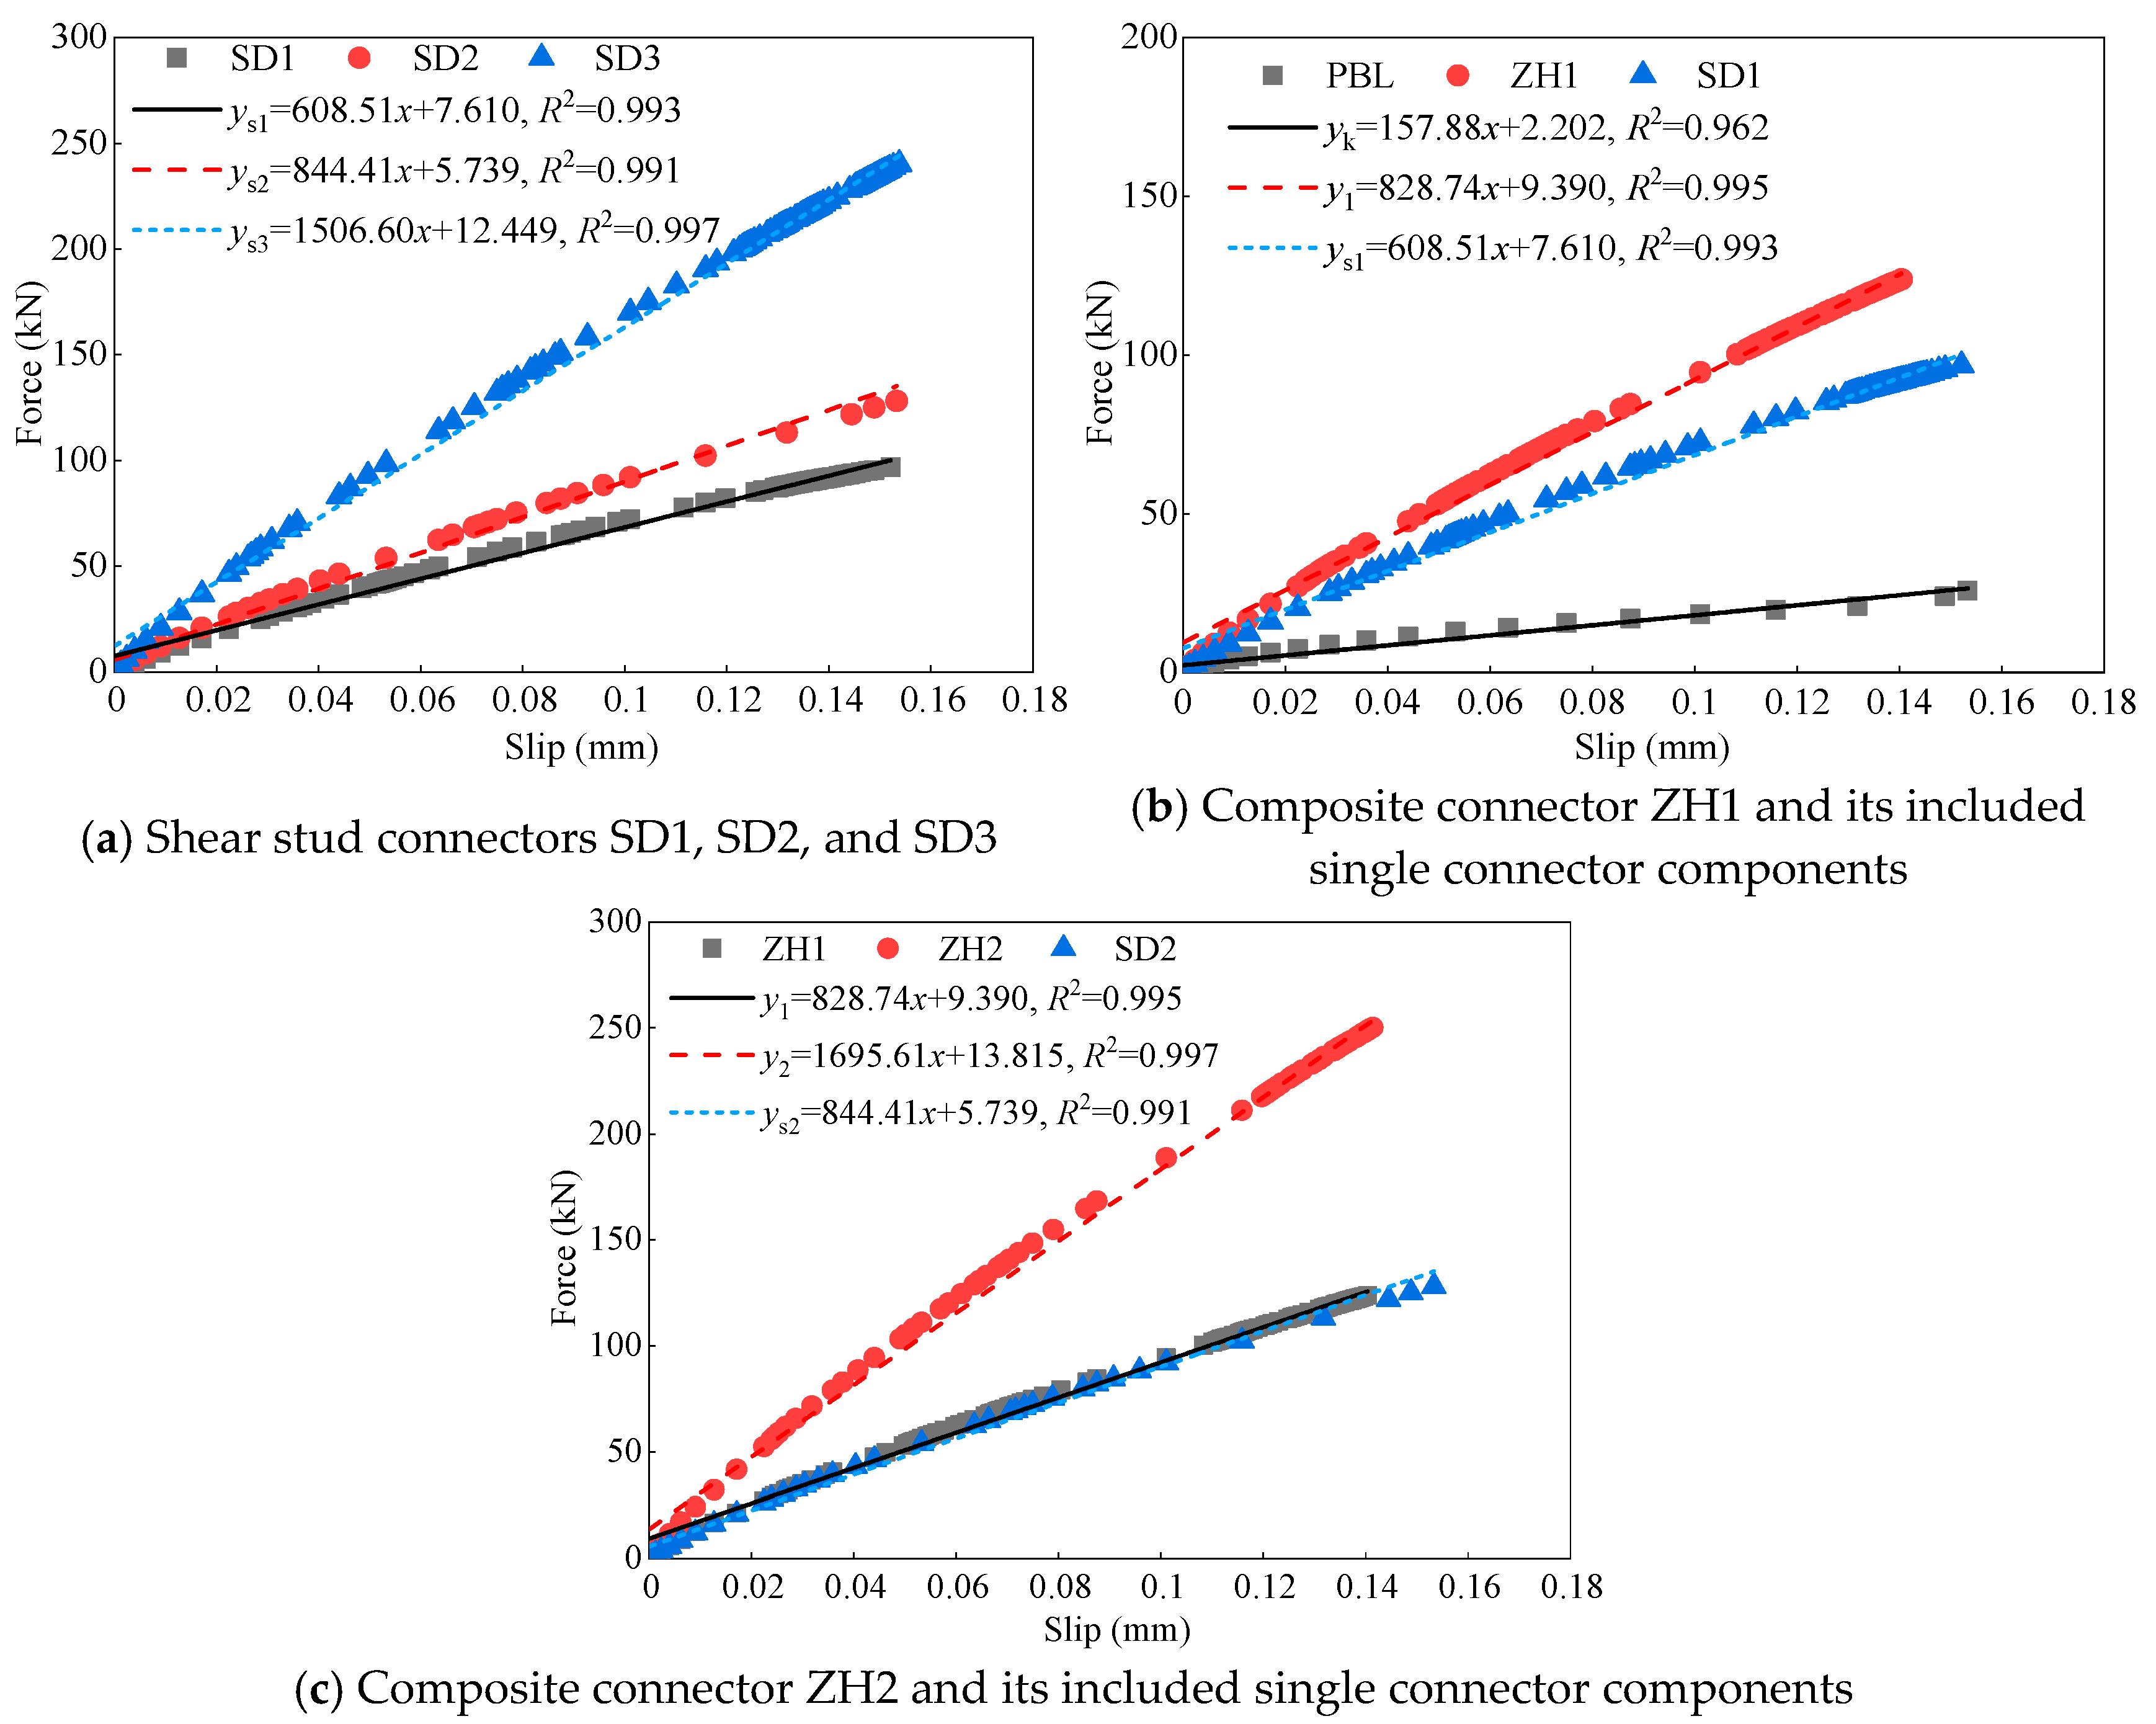
  • The study identified a superposition relationship between the ultimate load-bearing capacity and elastic stiffness of individual connectors and their failure modes in the composite connectors. It was determined that deconstructing the composite connectors into parallel individual connectors for studying their mechanical properties and stress mechanisms is feasible. This further supports that the mechanical performance of the composite connectors in the steel–concrete section of the bridge tower is approximately the additive sum of the mechanical performances of the individual connectors comprising them.
  • The finite element models of the specimens accurately predicted the distribution of concrete cracks and the deformation locations of the reinforcing bars and shear studs, aligning well with the experimental findings. This validates the modeling approach of the finite element model and the material parameters established through material characteristic tests and literature review.
  • By comparing the experimentally measured load–slip curves with those calculated from the finite element models, it was found that the load–slip curves during the elastic loading phase of the specimens were almost identical, with a generally consistent pattern throughout the entire curve.
  • Based on the combined connection components used in the steel–concrete composite sections of bridge towers in actual engineering, a testing method is proposed for studying their force mechanism, providing a powerful tool for subsequent optimization design at the structural level for this type of bridge tower composite sections.

Author Contributions

Conceptualization, Y.D. and Z.Y.; methodology, Y.D.; software, Y.D.; validation, Y.D., Y.C. and N.M.; formal analysis, Y.D.; investigation, Y.D. and Y.C.; resources, N.M. and R.W.; data curation, Y.D. and Y.C.; writing—original draft preparation, Y.D.; writing—review and editing, Y.D. and Z.Y.; visualization, Y.D.; supervision, N.M. and R.W.; project administration, N.M.; funding acquisition, RonghuiWang and N.M. All authors have read and agreed to the published version of the manuscript.

Funding

This research was funded by the National Natural Science Foundation of China grant number 51878295. And The APC was funded by Yunwei Du.

Data Availability Statement

The original contributions presented in this study are included in the article. Further inquiries can be directed to the corresponding author(s).

Conflicts of Interest

Author Zhenqing Yu was employed by the company Poly Changda Engineering Co., Ltd. The remaining authors declare that the research was conducted in the absence of any commercial or financial relationships that could be construed as a potential conflict of interest.

References

  1. Li, H. Study on the Stress Characteristics of Railway Tall and Low Tower Cable-Stayed Bridges. China Railw. Sci. 2019, 40, 54–59. [Google Scholar] [CrossRef]
  2. Nie, J.G.; Tao, M.X.; Wu, L.L.; Nie, X.; Li, F.X.; Lei, F.L. Advances of Research on Steel-Concrete Composite Bridges. China Civ. Eng. J. 2012, 45, 110–122. [Google Scholar] [CrossRef]
  3. Liu, Y.J.; Sun, L.P.; Zhou, H.X.; Xian, J.P.; Zhang, N.; Li, H. Progress in the Application of Research on Concrete-filled Steel Tubular Bridge Towers. China J. Highw. Transp. 2022, 35, 1–21. [Google Scholar] [CrossRef]
  4. Sham, S.H.R.; Wyatt, T.A. Construction aerodynamics of cable-stayed bridges for record spans: Stonecutters bridge. Structures. 2016, 8, 94–110. [Google Scholar] [CrossRef]
  5. Wang, Q. Experimental Study on the Force Performance of Steel Bridge Tower and Combined Bridge Tower. Ph.D. Thesis, Chang’an University, Xi’an, China, 2008. [Google Scholar]
  6. Varma, A.H.; Ricles, J.M.; Sause, R.; Lu, L.W. Experimental behavior of High Strength Square Concrete-Filled Steel Tube Beam-Columns. J. Struct. Eng. 2002, 128, 309–318. [Google Scholar] [CrossRef]
  7. Varma, A.H.; Ricles, J.M.; Sause, R.; Lu, L.W. Seismic behavior and modeling of high-strength composite concrete-filled steel tube (CFT) beam-columns. J. Constr. Steel Res. 2002, 58, 725–758. [Google Scholar] [CrossRef]
  8. Nie, J.G.; Tan, Y.; Wang, H.Q. Strength of stud shear connectors in composite steel HC beams. J. Tsinghua Univ. (Nat. Sci. Ed.) 1999, 39, 94–97. [Google Scholar] [CrossRef]
  9. Nie, J.G. Steel-Concrete Composite Structure Bridges; China Communication Press: Beijing, China, 2011. [Google Scholar]
  10. Vianna, J.D.C.; Costa-Neves, L.F.; Vellasco, P.D.S.; De Andrade, S.A.L. Experimental assessment of Perfobond and T-Perfobond shear connectors’ structural response. J. Constr. Steel Res. 2009, 65, 408–421. [Google Scholar] [CrossRef]
  11. Kim, Y.H.; Kang, J.Y.; Kim, S.H.; Kim, D.J. Structural Performance of Steel Pile Caps Strengthened with Perfobond Shear Connectors under Lateral Loading. Appl. Sci. 2016, 6, 317. [Google Scholar] [CrossRef]
  12. Cândido-Martins, J.P.S.; Costa-Neves, L.F.; Vellasco, P.D.S. Experimental evaluation of the structural response of Perfobond shear connectors. Eng. Struc. 2010, 32, 1976–1985. [Google Scholar] [CrossRef]
  13. Mia, M.M.; Bhowmick, A.K. A finite element based approach for fatigue life prediction of headed shear studs. Structures 2019, 19, 161–172. [Google Scholar] [CrossRef]
  14. Bielak, J. On the role of dowel action in shear transfer of CFRP textile-reinforced concrete slabs. Compos. Struct. 2023, 311, 116812. [Google Scholar] [CrossRef]
  15. Pardeshi, R.T.; Patil, Y.D. Review of various shear connectors in composite structures. Adv. Steel Constr. 2021, 17, 394–402. [Google Scholar] [CrossRef]
  16. Luo, Y.B.; Yan, J.B. Developments of prefabricated steel-concrete composite beams with novel steel-yielding demountable bolt connectors. J. Constr. Steel Res. 2022, 190, 107123. [Google Scholar] [CrossRef]
  17. Chen, B.C.; Chen, J.K. Experimental Studies on Shear-Bearing Capacity of Headed Stud in Concrete-Filled Steel Tube. Eng. Mech. 2016, 33, 66–73. [Google Scholar]
  18. Yosri, A.M.; Farouk, A.I.B.; Haruna, S.I.; Deifalla, A.F.; Shaaban, W.M. Sensitivity and robustness analysis of adaptive neuro-fuzzy inference system (ANFIS) for shear strength prediction of stud connectors in concrete. Case Stud. Constr. Mater. 2023, 18, e02096. [Google Scholar] [CrossRef]
  19. Maliji, E.; Yousefpour, H. Postfire strength of channel-type shear connectors. J. Struct. Eng. 2023, 149, 04023141. [Google Scholar] [CrossRef]
  20. Qi, J.; Hu, Y.; Wang, J.; Li, W. Behavior and strength of headed stud shear connectors in ultra-high performance concrete of composite bridges. Front. Struct. Civ. Eng. 2019, 13, 1138–1149. [Google Scholar] [CrossRef]
  21. Xiao, L. Study of static and fatigue properties of PBL shear keys in steel-mixed composite structures. Ph.D. Thesis, Southwest Jiaotong University, Chengdu, China, 2012. [Google Scholar]
  22. Xiao, L.; Qiang, S.Z.; Li, X.Z.; Wei, X. Research on Mechanical Performance of PBL Shear Connectors Considering the Perforated Plate’s Thickness. Eng. Mech. 2012, 29, 282–288. [Google Scholar]
  23. Wang, Q.; Liu, Y.Q. Experimental Study of Shear Capacity of Stud Connector. J. Tongji Univ. (Nat. Sci. Ed.) 2013, 41, 659–663. [Google Scholar] [CrossRef]
  24. Shim, C.S.; Lee, P.G.; Yoon, T.Y. Static behavior of large stud shear connectors. Eng. Struct. 2004, 26, 1853–1860. [Google Scholar] [CrossRef]
  25. Prates Aguiar, O.; Barreto Caldas, R. Circular openings with transverse rebar as steel-concrete shear connection (part 1/2): Analytical model for strength and slip capacity. Eng. Fail. Anal. 2022, 133, 106007. [Google Scholar] [CrossRef]
  26. Xia, H.; Zhang, N.; Guo, W. Dynamic Interaction of Train-Bridge Systems in High-Speed Railways; Advances in High-Speed Rail Technology; Springer: Berlin/Heidelberg, Germany, 2018. [Google Scholar] [CrossRef]
  27. Li, S.Z.; Li, H.; Zhou, X.H.; Wang, Y.H.; Li, X.H.; Gan, D.; Zhu, R.H. Damage detection of flange bolts in wind turbine towers using dynamic strain responses. J. Civ. Struct. Health Monit. 2023, 13, 67–81. [Google Scholar] [CrossRef]
  28. Chen, E.L.; Zhang, X.; Wang, G.L. Rigid-flexible coupled dynamic response of steel-concrete bridges on expressways considering vehicle-road-bridge interaction. Adv. Struct. Eng. 2020, 23, 160–173. [Google Scholar] [CrossRef]
  29. EN 1994-1-1; Eurocode 4: Design of Composite Steel and Concrete Structures—Part 1-1: General Rules and Rules for Buildings. CEN: Brussels, Belgium, 1994.
  30. Su, Q.T.; Wang, W. Influence of Transverse Bar Position in Hole on Mechanical Behavior of Petfood Rib Connectors. J. Tongji Univ. (Nat. Sci. Ed.) 2011, 39, 1746–1752. [Google Scholar] [CrossRef]
  31. Zhu, Y.Y. Research on Force mechanism and design method of bridge tower of steel plate-concrete combination structure. Ph.D. Thesis, Tsinghua University, Beijing, China, 2020. [Google Scholar] [CrossRef]
  32. Zou, Y. Study on Mechanical Properties and Calculation Method of Confined Perfobond Connectors. Ph.D. Thesis, Chongqing University, Chongqing, China, 2018. [Google Scholar]
  33. GB 50010-2010; Code for the Design of Concrete Structures. Architecture & Building Press: Beijing, China, 2015.
Figure 1. Steel–concrete composite section of the bridge tower and the single-layer composite connectors.
Buildings 15 02284 g001
Figure 2. Dimensions of the specimens for the perforated plate connector (PBL).
Buildings 15 02284 g002
Figure 3. Dimensions of the shear stud connector specimens.
Buildings 15 02284 g003
Figure 4. Dimensions of the composite connectors ZH1 and ZH2.
Buildings 15 02284 g004
Figure 5. Schematic of the loading method for the push-out test.
Buildings 15 02284 g005
Figure 6. Arrangement of measurement points for relative slip between the steel plate and concrete in the experiment.
Buildings 15 02284 g006
Figure 7. Post-failure state of the perforated plate connector.
Buildings 15 02284 g007
Figure 8. Post-failure state of the shear stud connector.
Buildings 15 02284 g008
Figure 9. Post-failure state of the composite connectors ZH1 and ZH2.
Buildings 15 02284 g009
Figure 10. Load–slip curve of the perforated plate connector.
Buildings 15 02284 g010
Figure 11. Load–slip curve of the shear stud connector.
Buildings 15 02284 g011
Figure 12. Load–slip curve of the composite connector and its constituent single connectors.
Buildings 15 02284 g012
Figure 13. Fitting of the load–slip curves during the elastic loading phase for specimens with parallel relationships.
Buildings 15 02284 g013
Figure 14. Detailed finite element model decomposition of composite connector ZH1.
Buildings 15 02284 g014
Figure 15. Boundary conditions for the refined finite element model of the composite connector labeled ZH1.
Buildings 15 02284 g015
Figure 16. Material properties and constitutive relations.
Buildings 15 02284 g016
Figure 17. Comparison of failure patterns between the push-out test and finite element analysis for perforated plate connectors.
Buildings 15 02284 g017
Figure 18. Comparison of failure patterns between push-out test SD1 and finite element analysis for shear stud connectors.
Buildings 15 02284 g018
Figure 19. Comparison of failure patterns between push-out test SD2 and finite element analysis for shear stud connectors.
Buildings 15 02284 g019
Figure 20. Comparison of failure patterns between push-out test SD3 and finite element analysis for shear stud connectors.
Buildings 15 02284 g020
Figure 21. Comparison of failure patterns between the push-out test and finite element analysis for composite connector ZH1.
Buildings 15 02284 g021
Figure 22. Comparison of failure patterns between the push-out test and finite element analysis for composite connector ZH2.
Buildings 15 02284 g022
Figure 23. Comparison of load–slip curves between the push-out test and finite element analysis for the perforated plate connector.
Buildings 15 02284 g023
Figure 24. Comparison of load–slip curves between the push-out test and finite element analysis for shear stud connectors.
Buildings 15 02284 g024
Figure 25. Comparison of load–slip curves between the push-out test and finite element analysis for composite connectors ZH1 and ZH2.
Buildings 15 02284 g025
Table 1. Material properties of steel.
Material Namefy (MPa)fu (MPa)Eg (GPa)
Q420qD455572206
HRB400E433598200
ML15AL402479206
Disclaimer/Publisher’s Note: The statements, opinions and data contained in all publications are solely those of the individual author(s) and contributor(s) and not of MDPI and/or the editor(s). MDPI and/or the editor(s) disclaim responsibility for any injury to people or property resulting from any ideas, methods, instructions or products referred to in the content.

