
Mechanical Performance and Interfacial Bonding Mechanism of High-Performance ECC in Steel-Concrete Composite Link Slab in Simply Supported Bridges


Abstract
1. Introduction
2. Test Plan and Specimen Preparation
2.1. ECC Raw Materials and Mixing Ratio Design
2.2. Preparation of Mechanical Properties Specimen
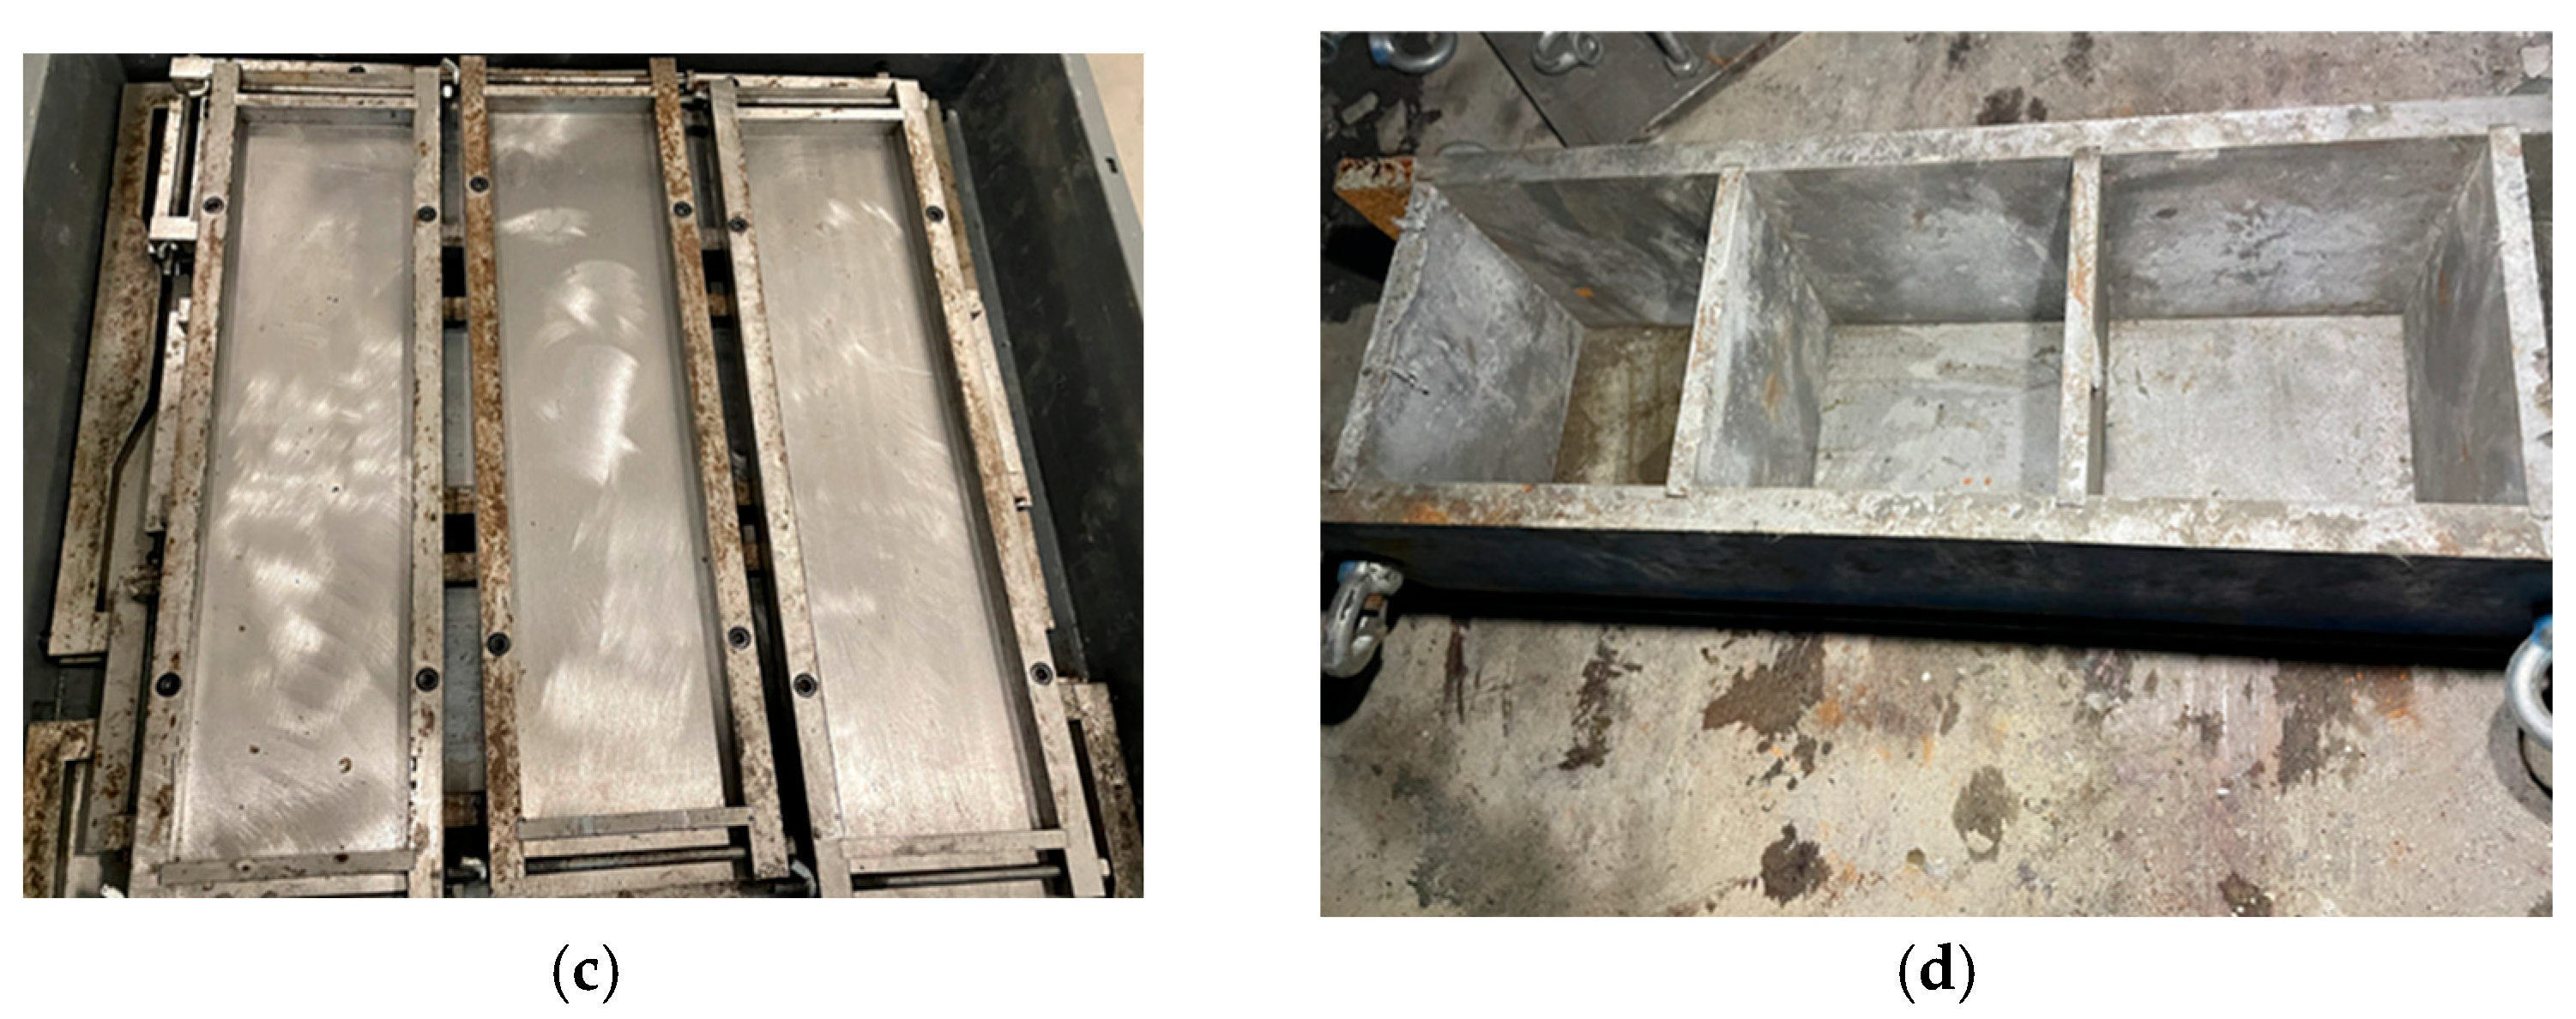
2.3. Preparation of Center Pull-Out Specimens
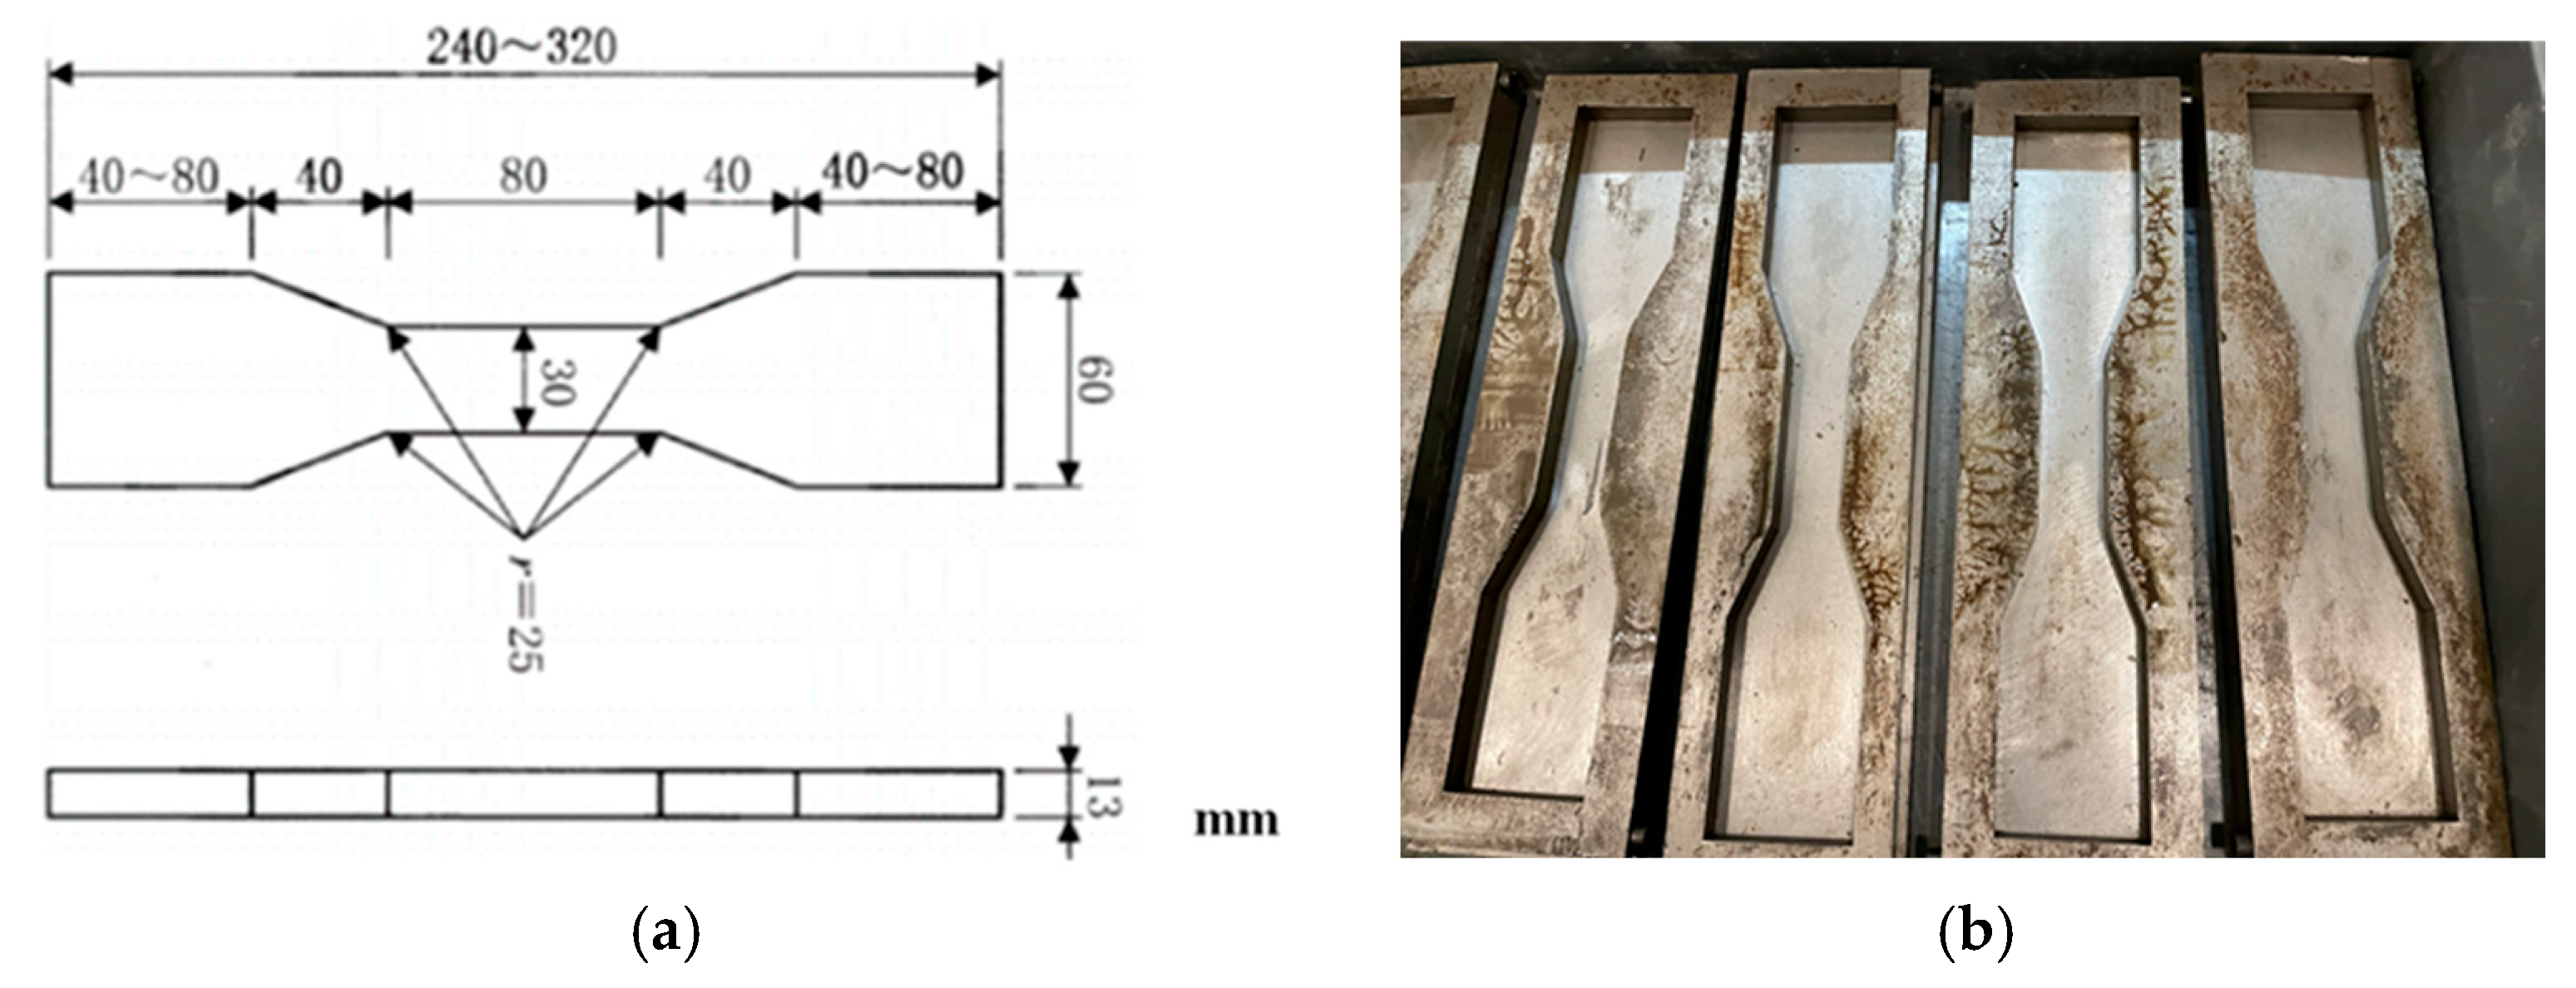
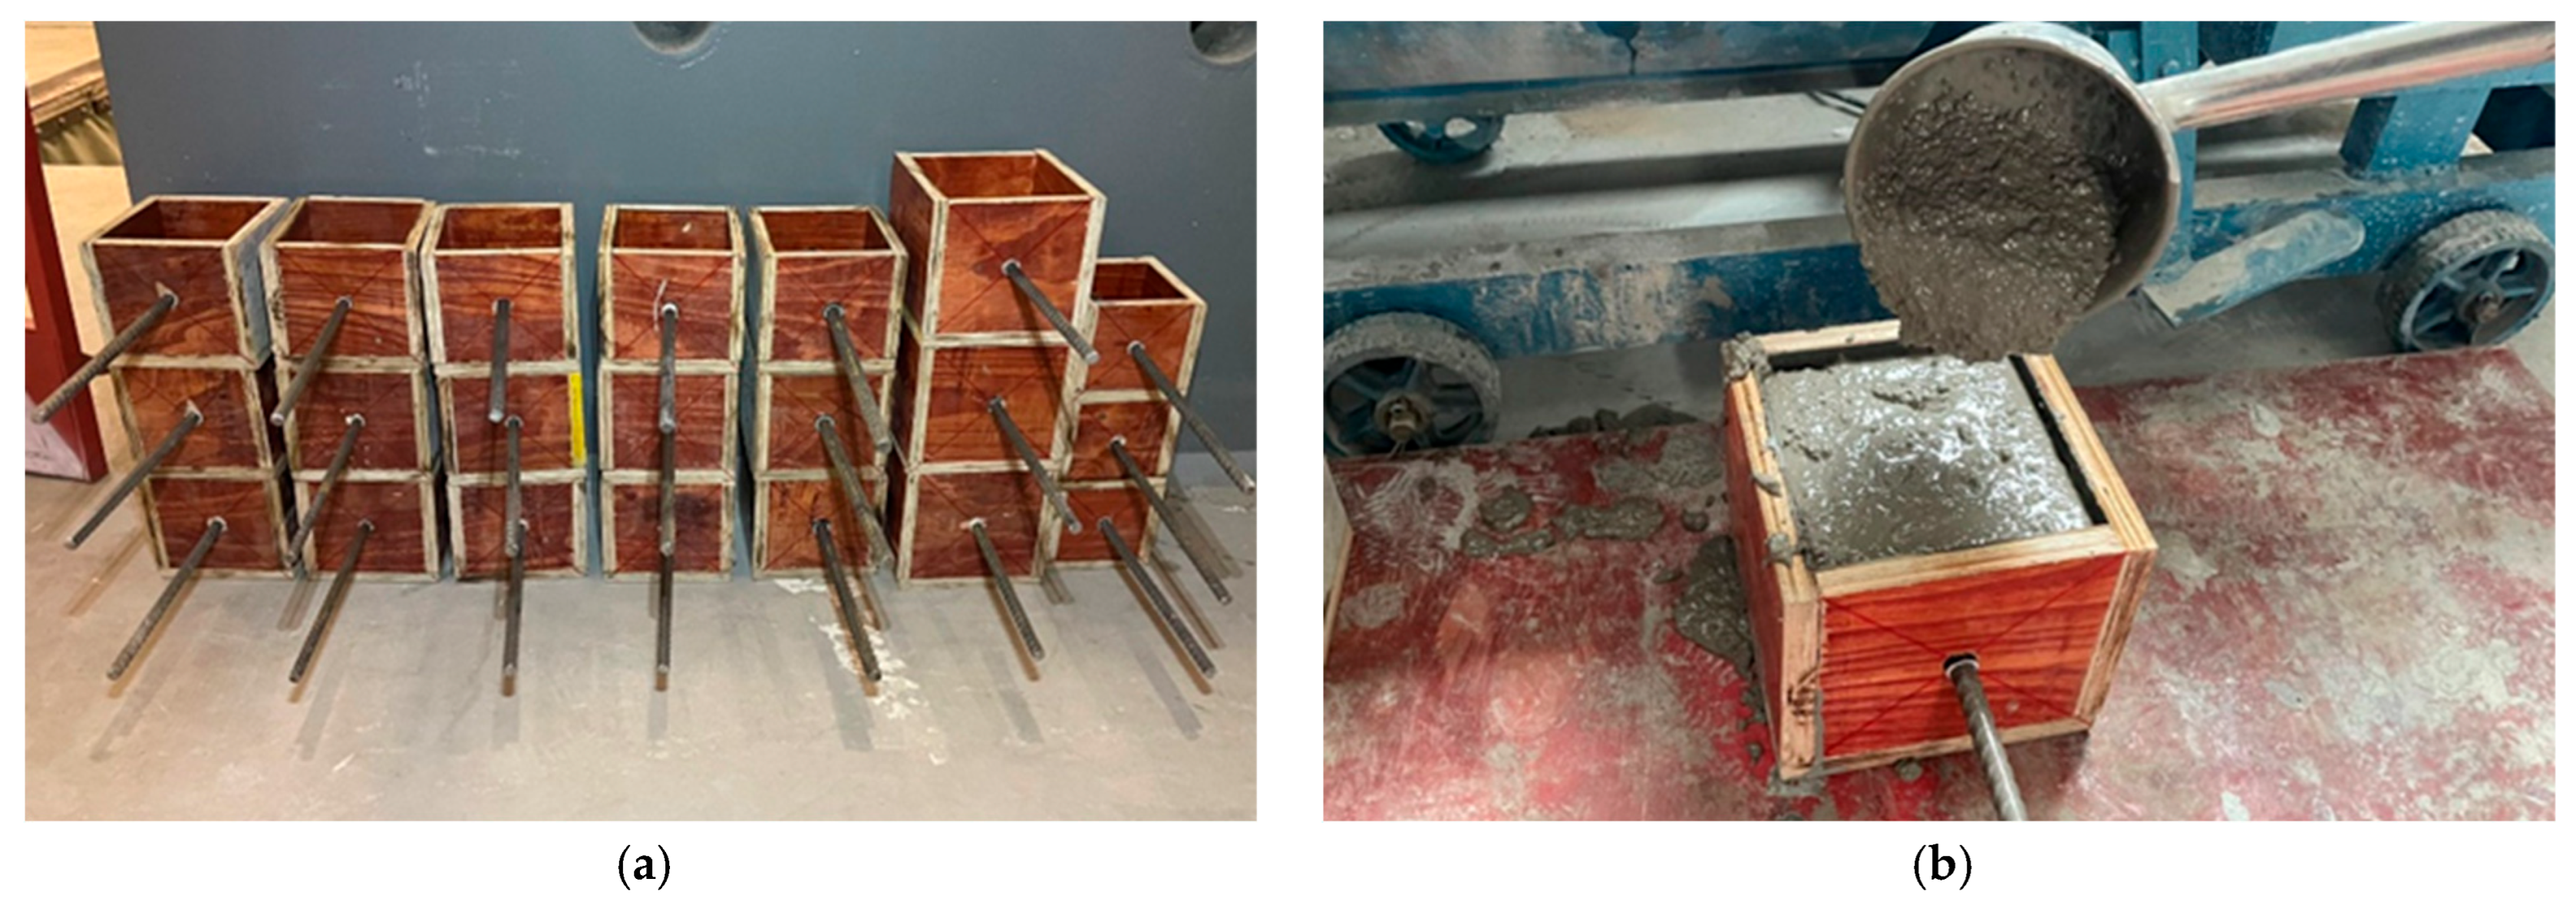
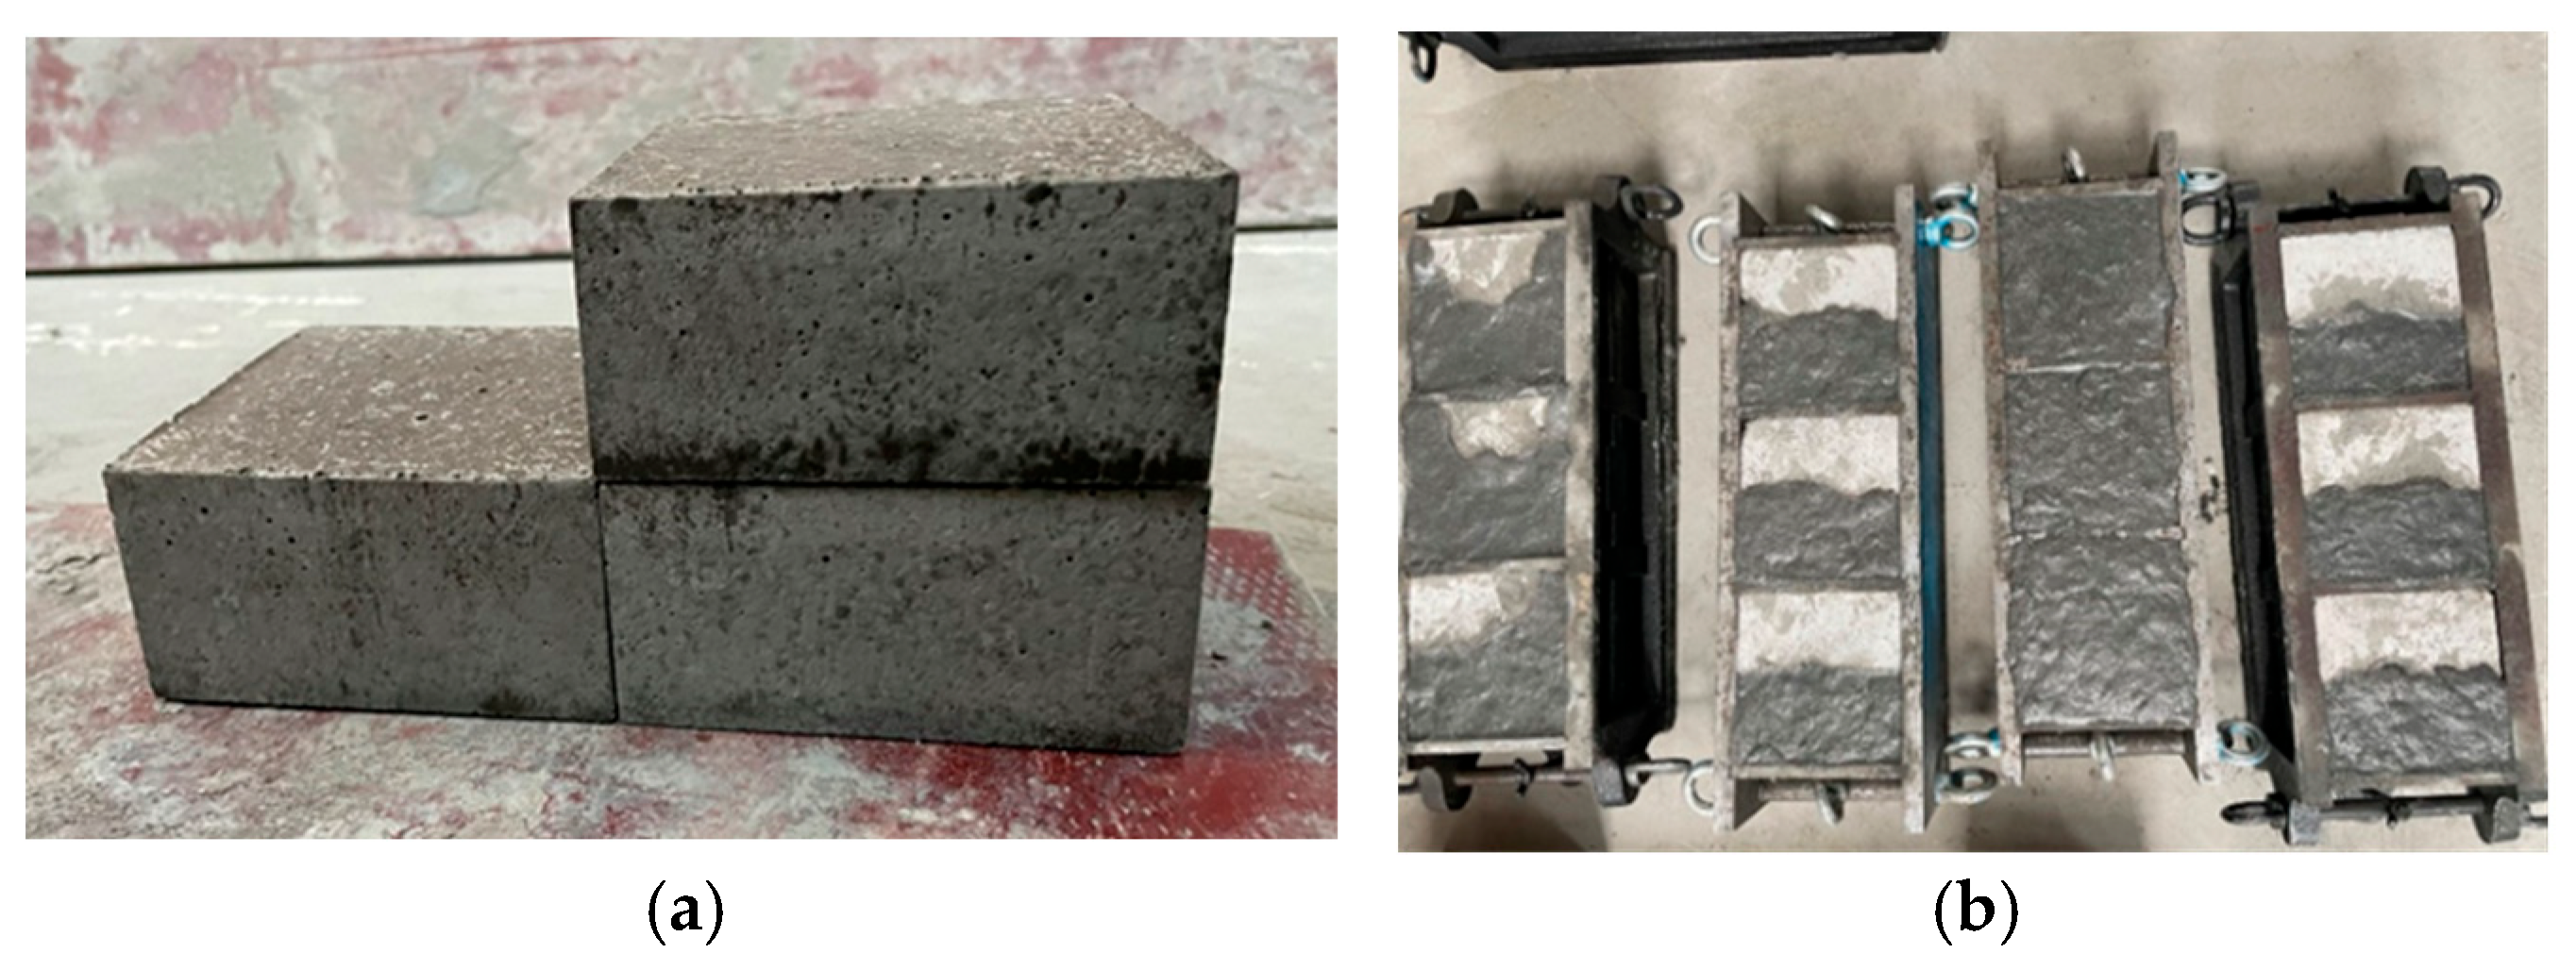
2.4. Preparation of Split Tensile Specimen
3. Experimental Process
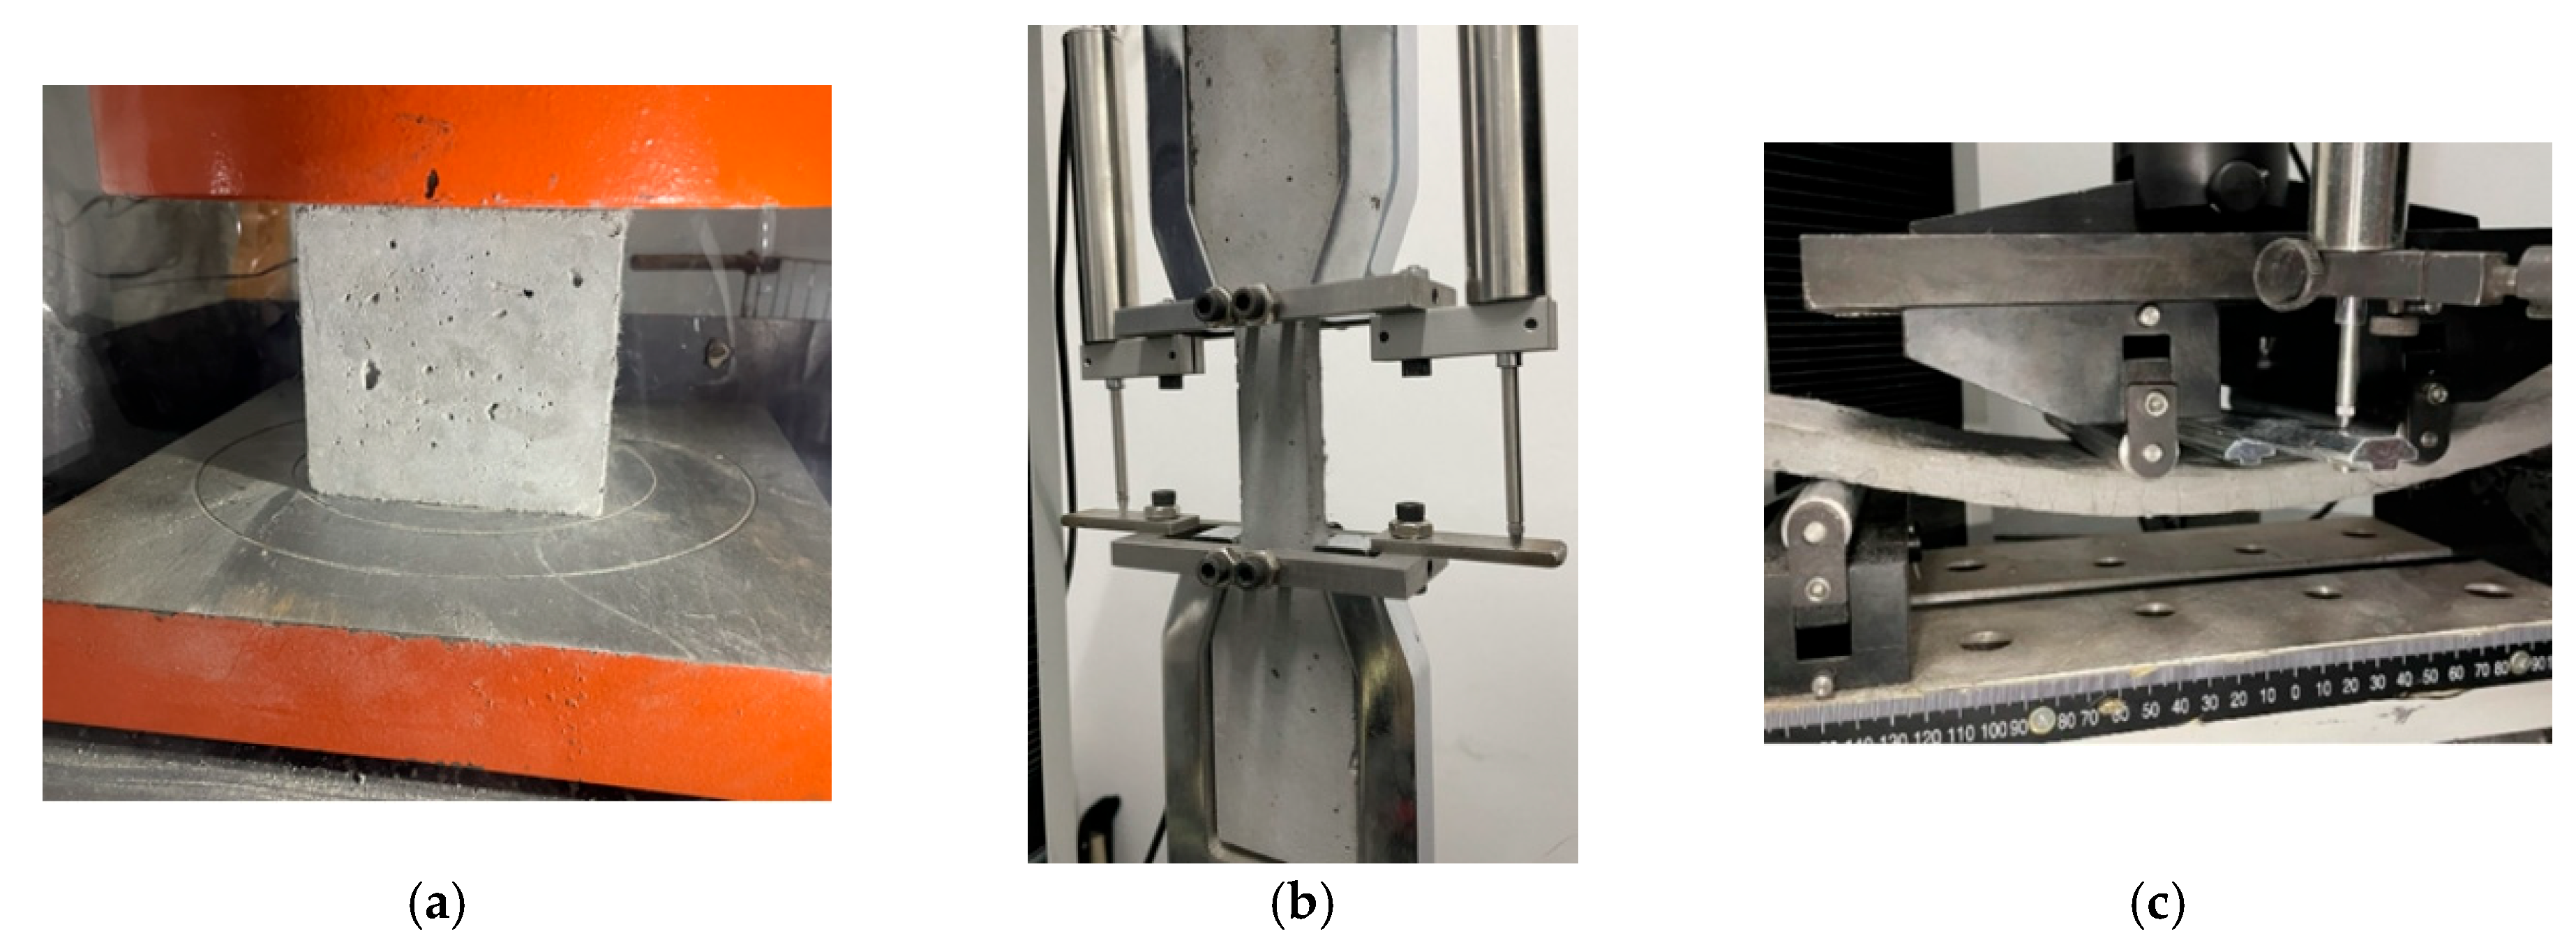
3.1. Mechanical Property Test
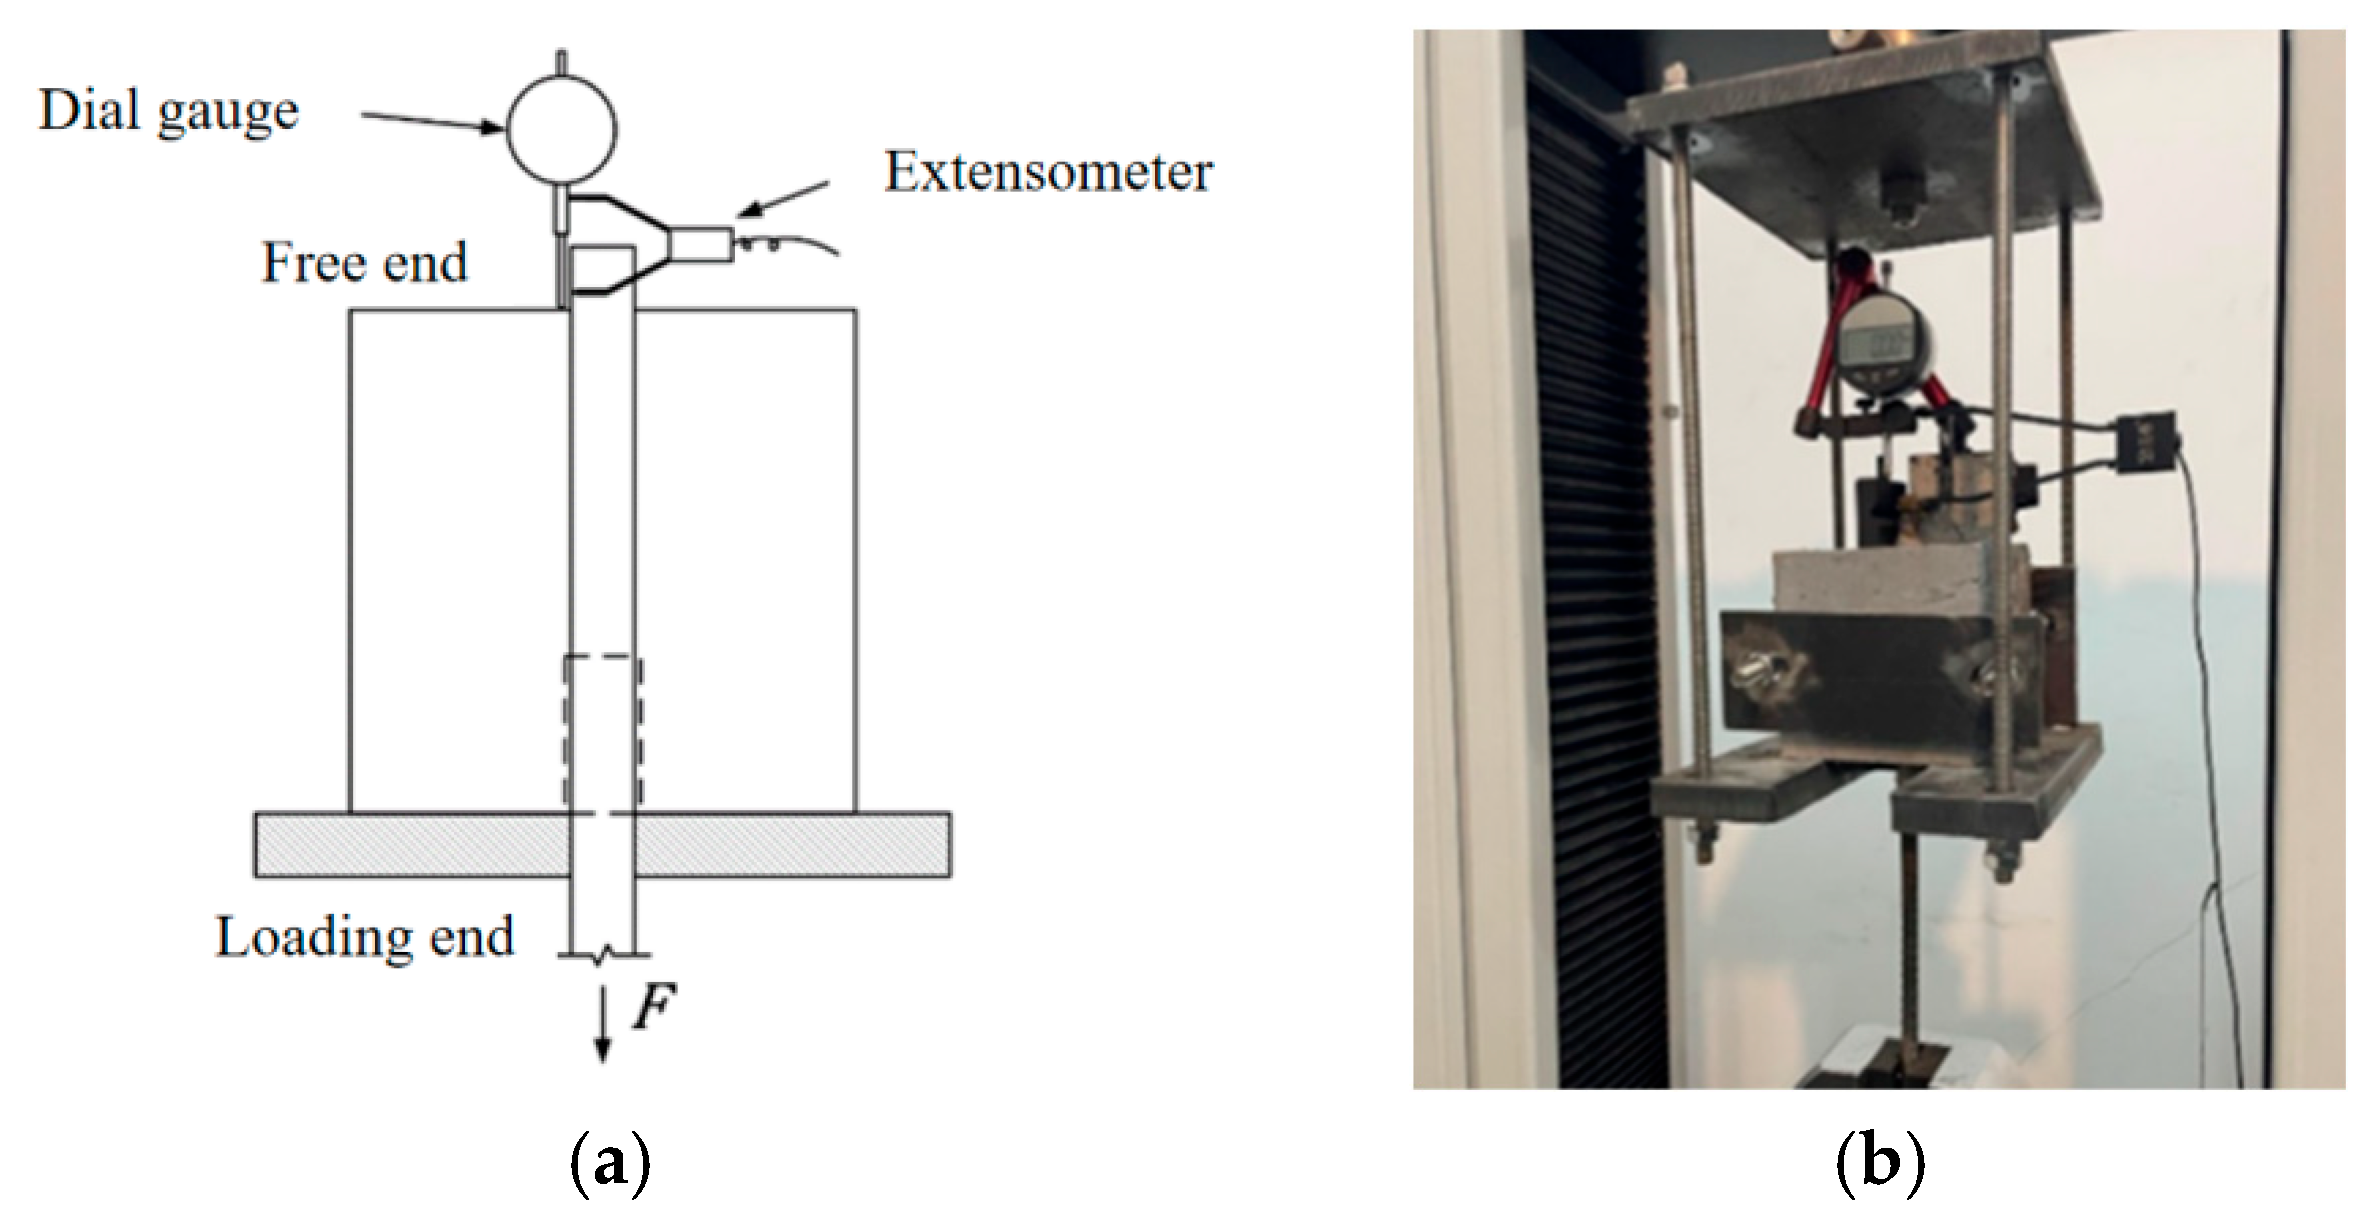
3.2. Center Pull-Out Test
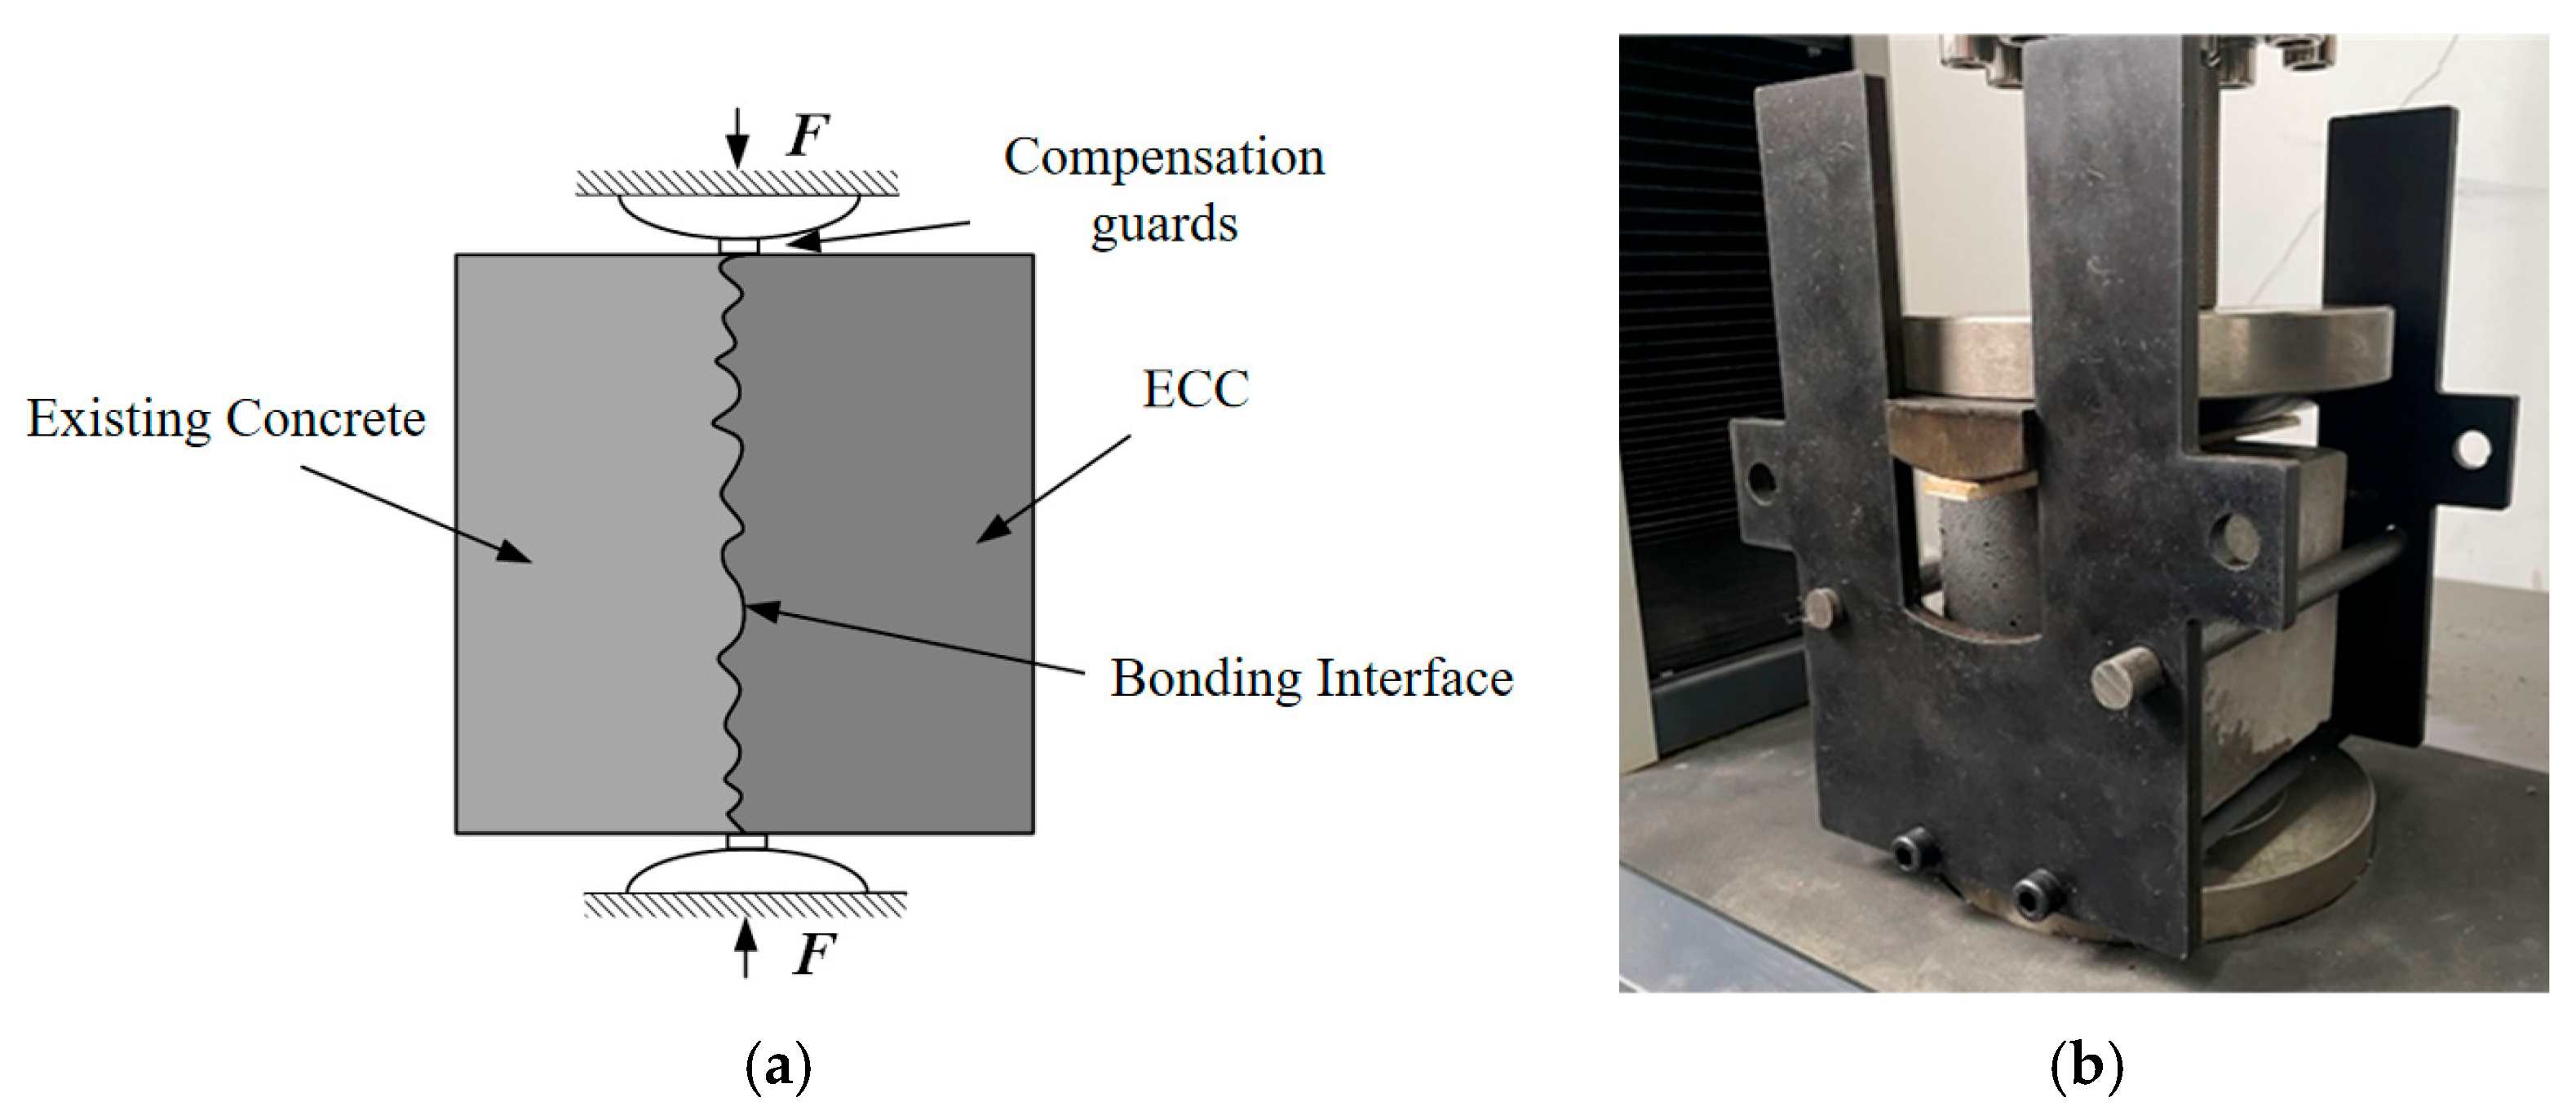
3.3. Split Tensile Test
4. Test Results and Analysis
4.1. Mechanical Performance Test Results and Analysis
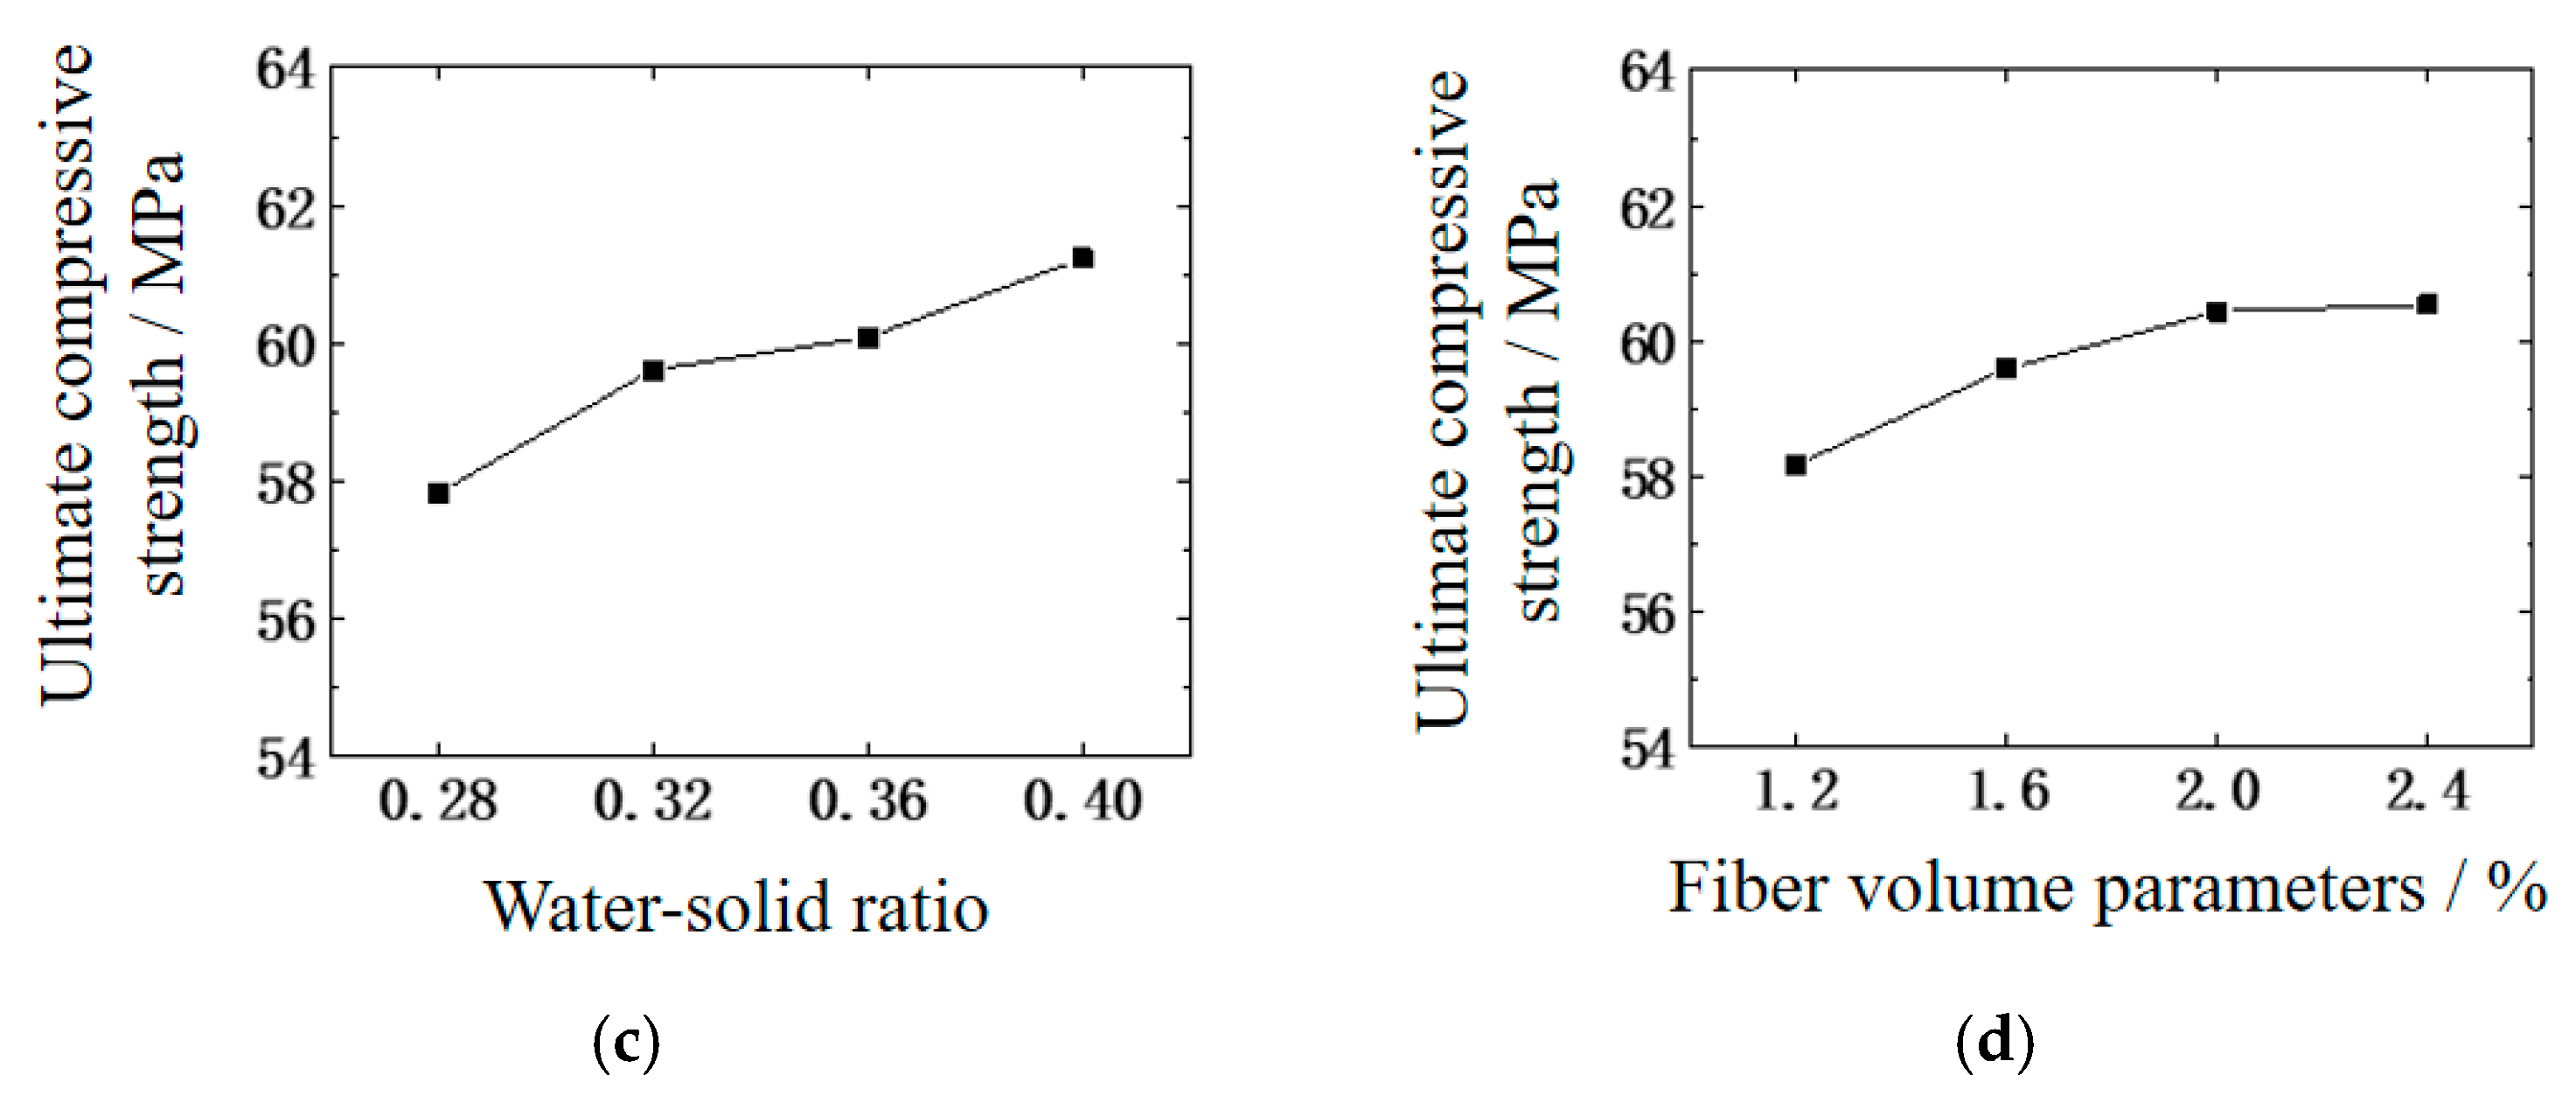
4.1.1. Compressive Property
4.1.2. Tensile Property
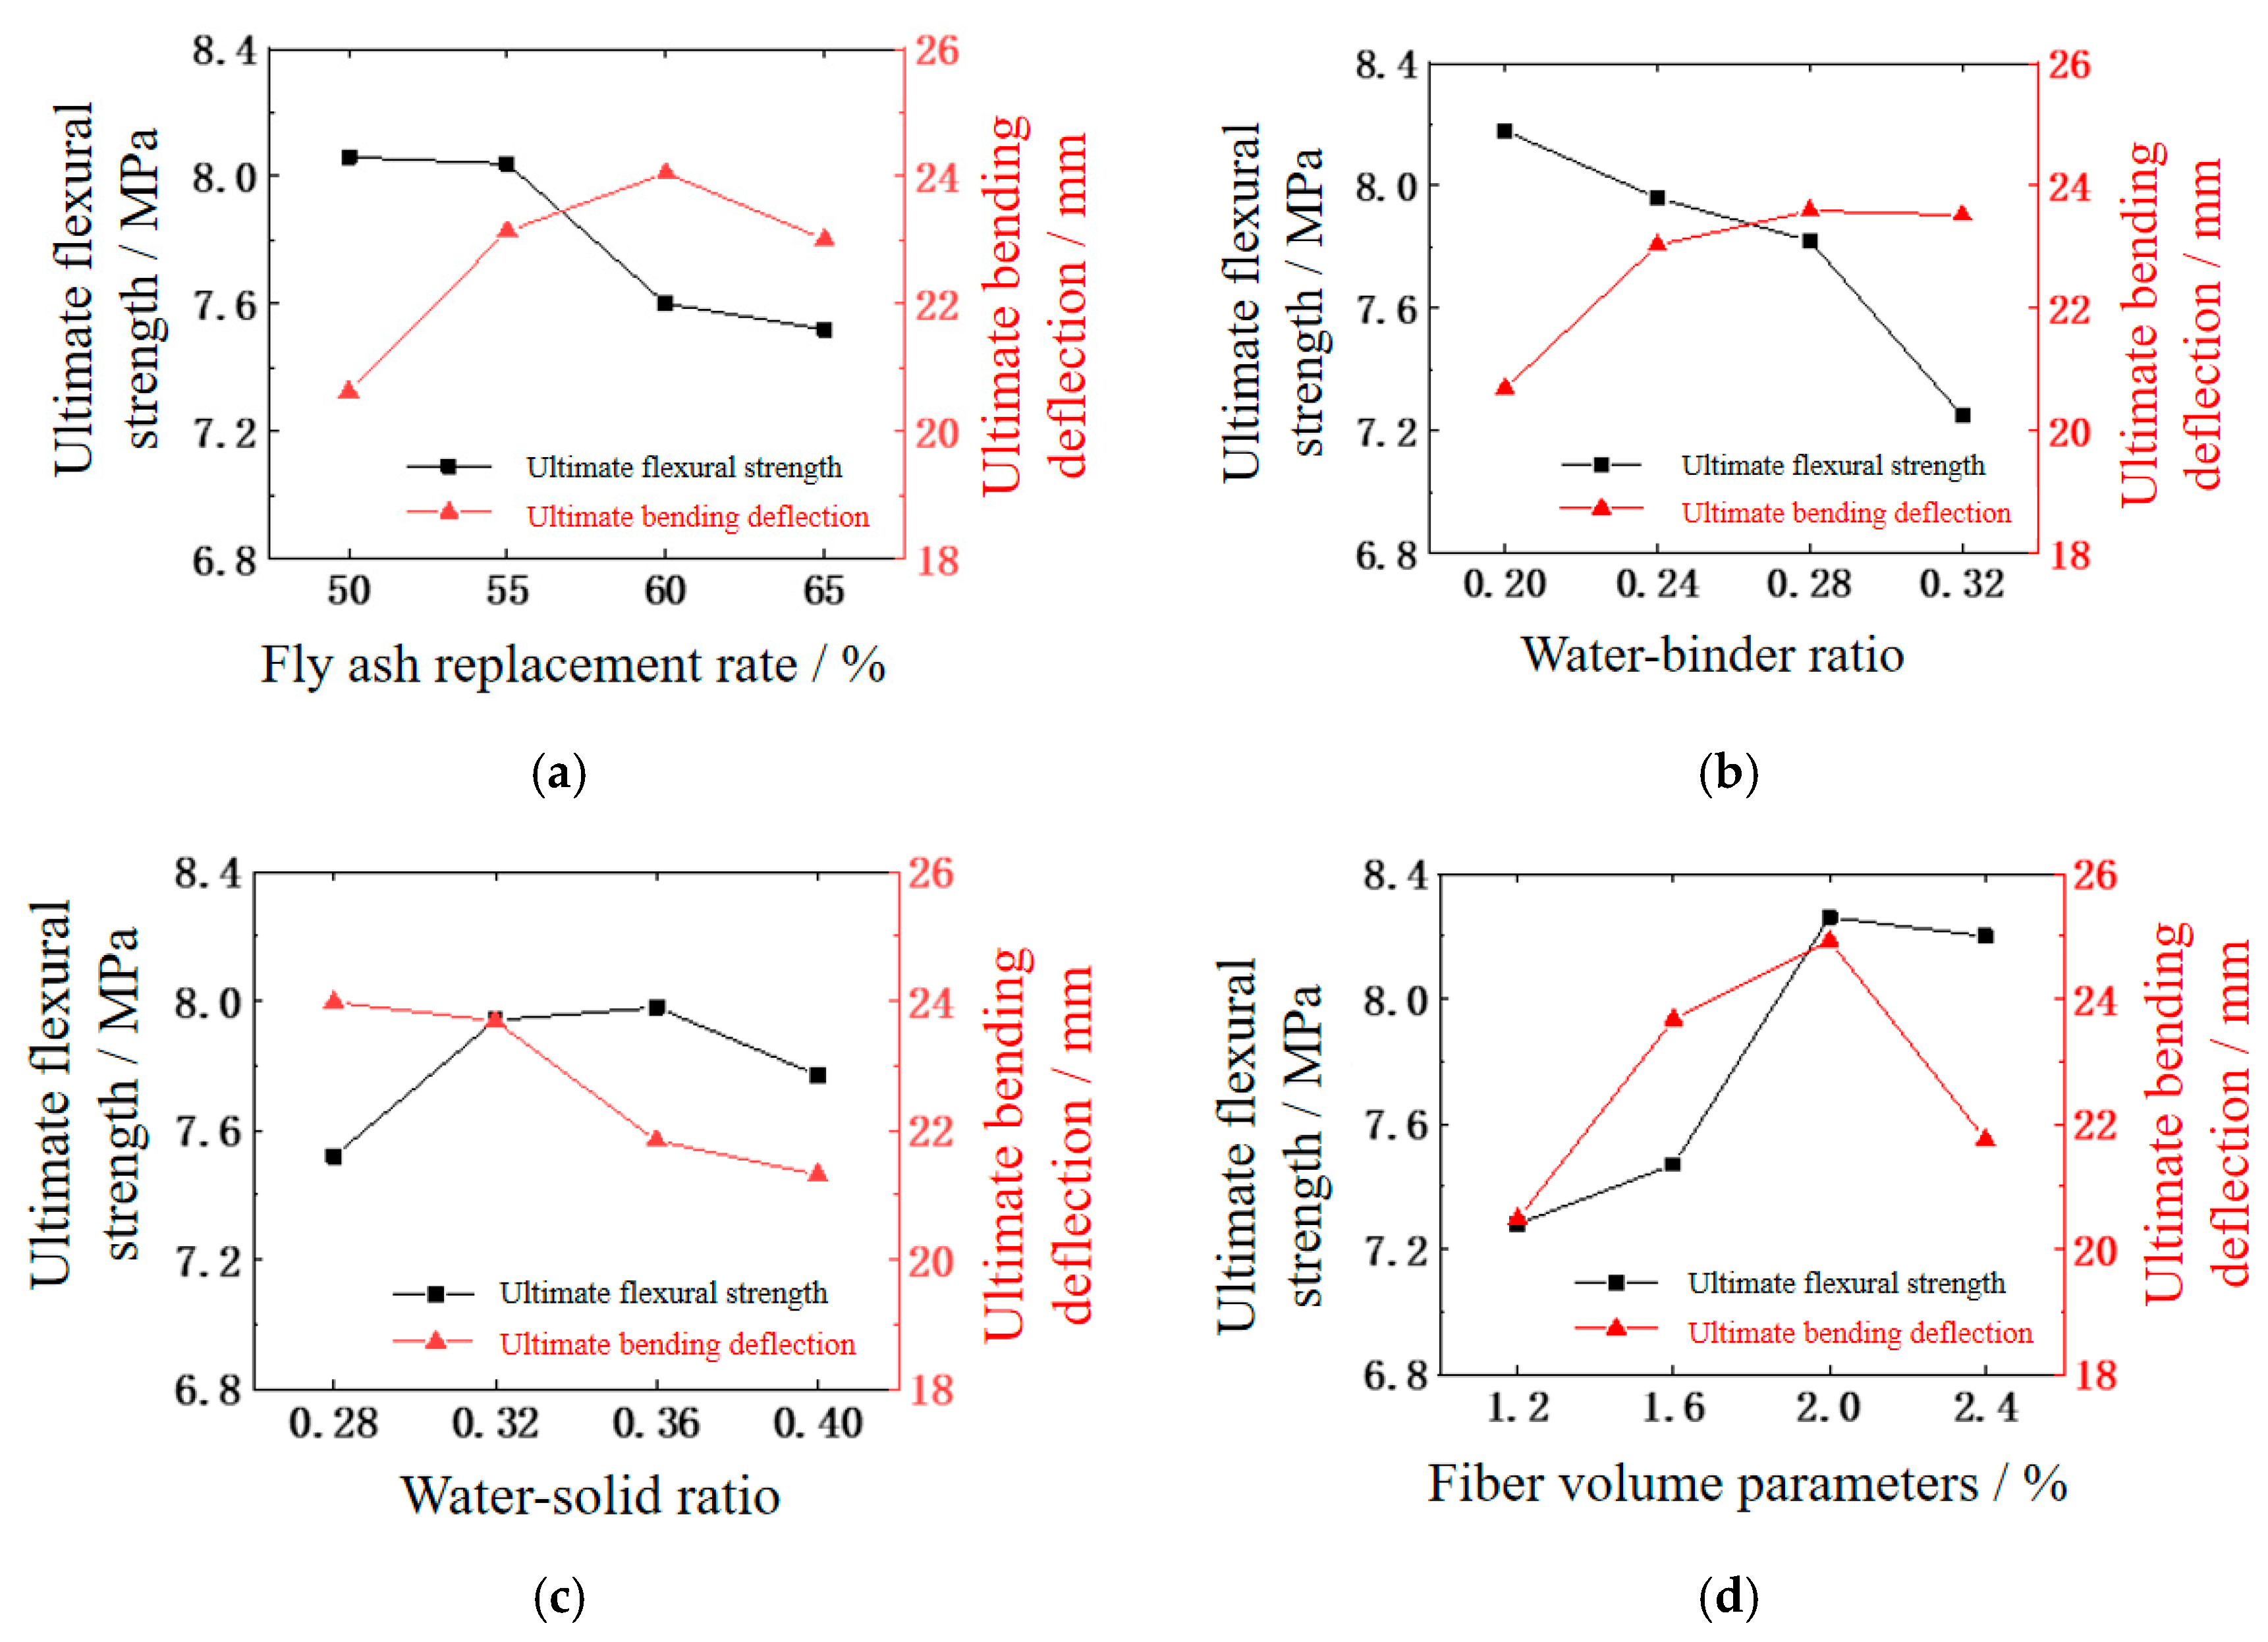
4.1.3. Flexural Performance
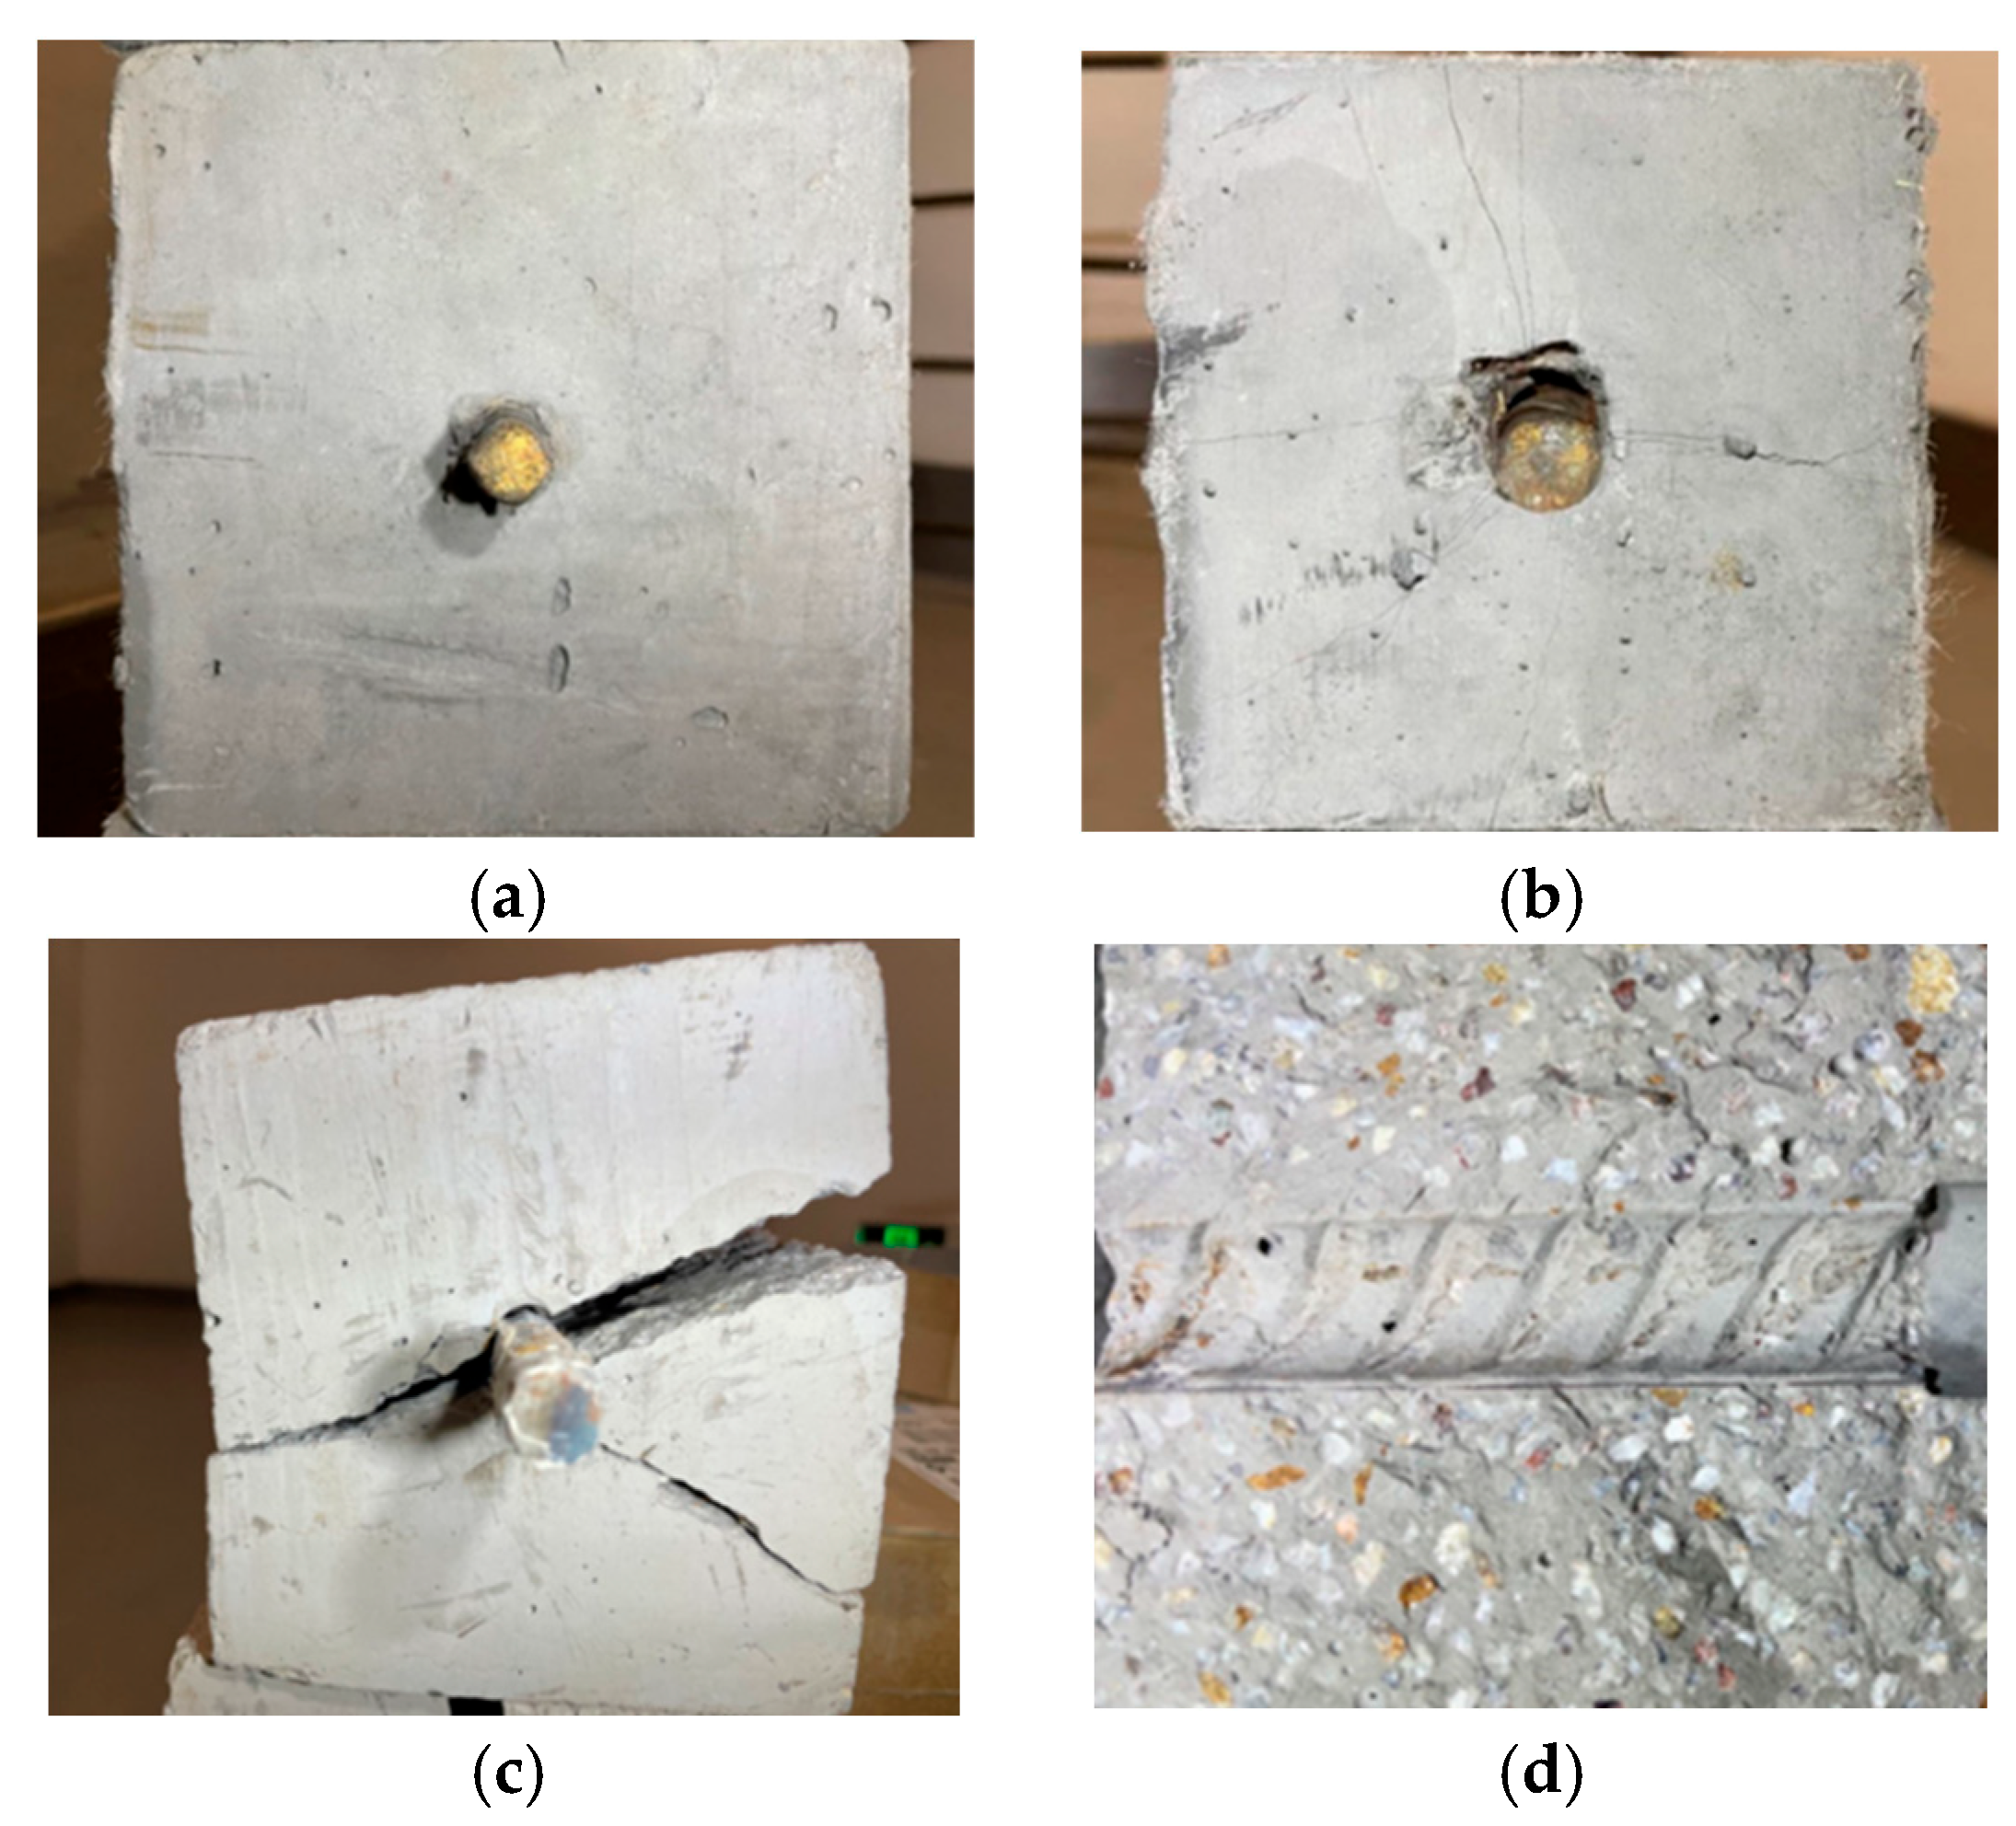
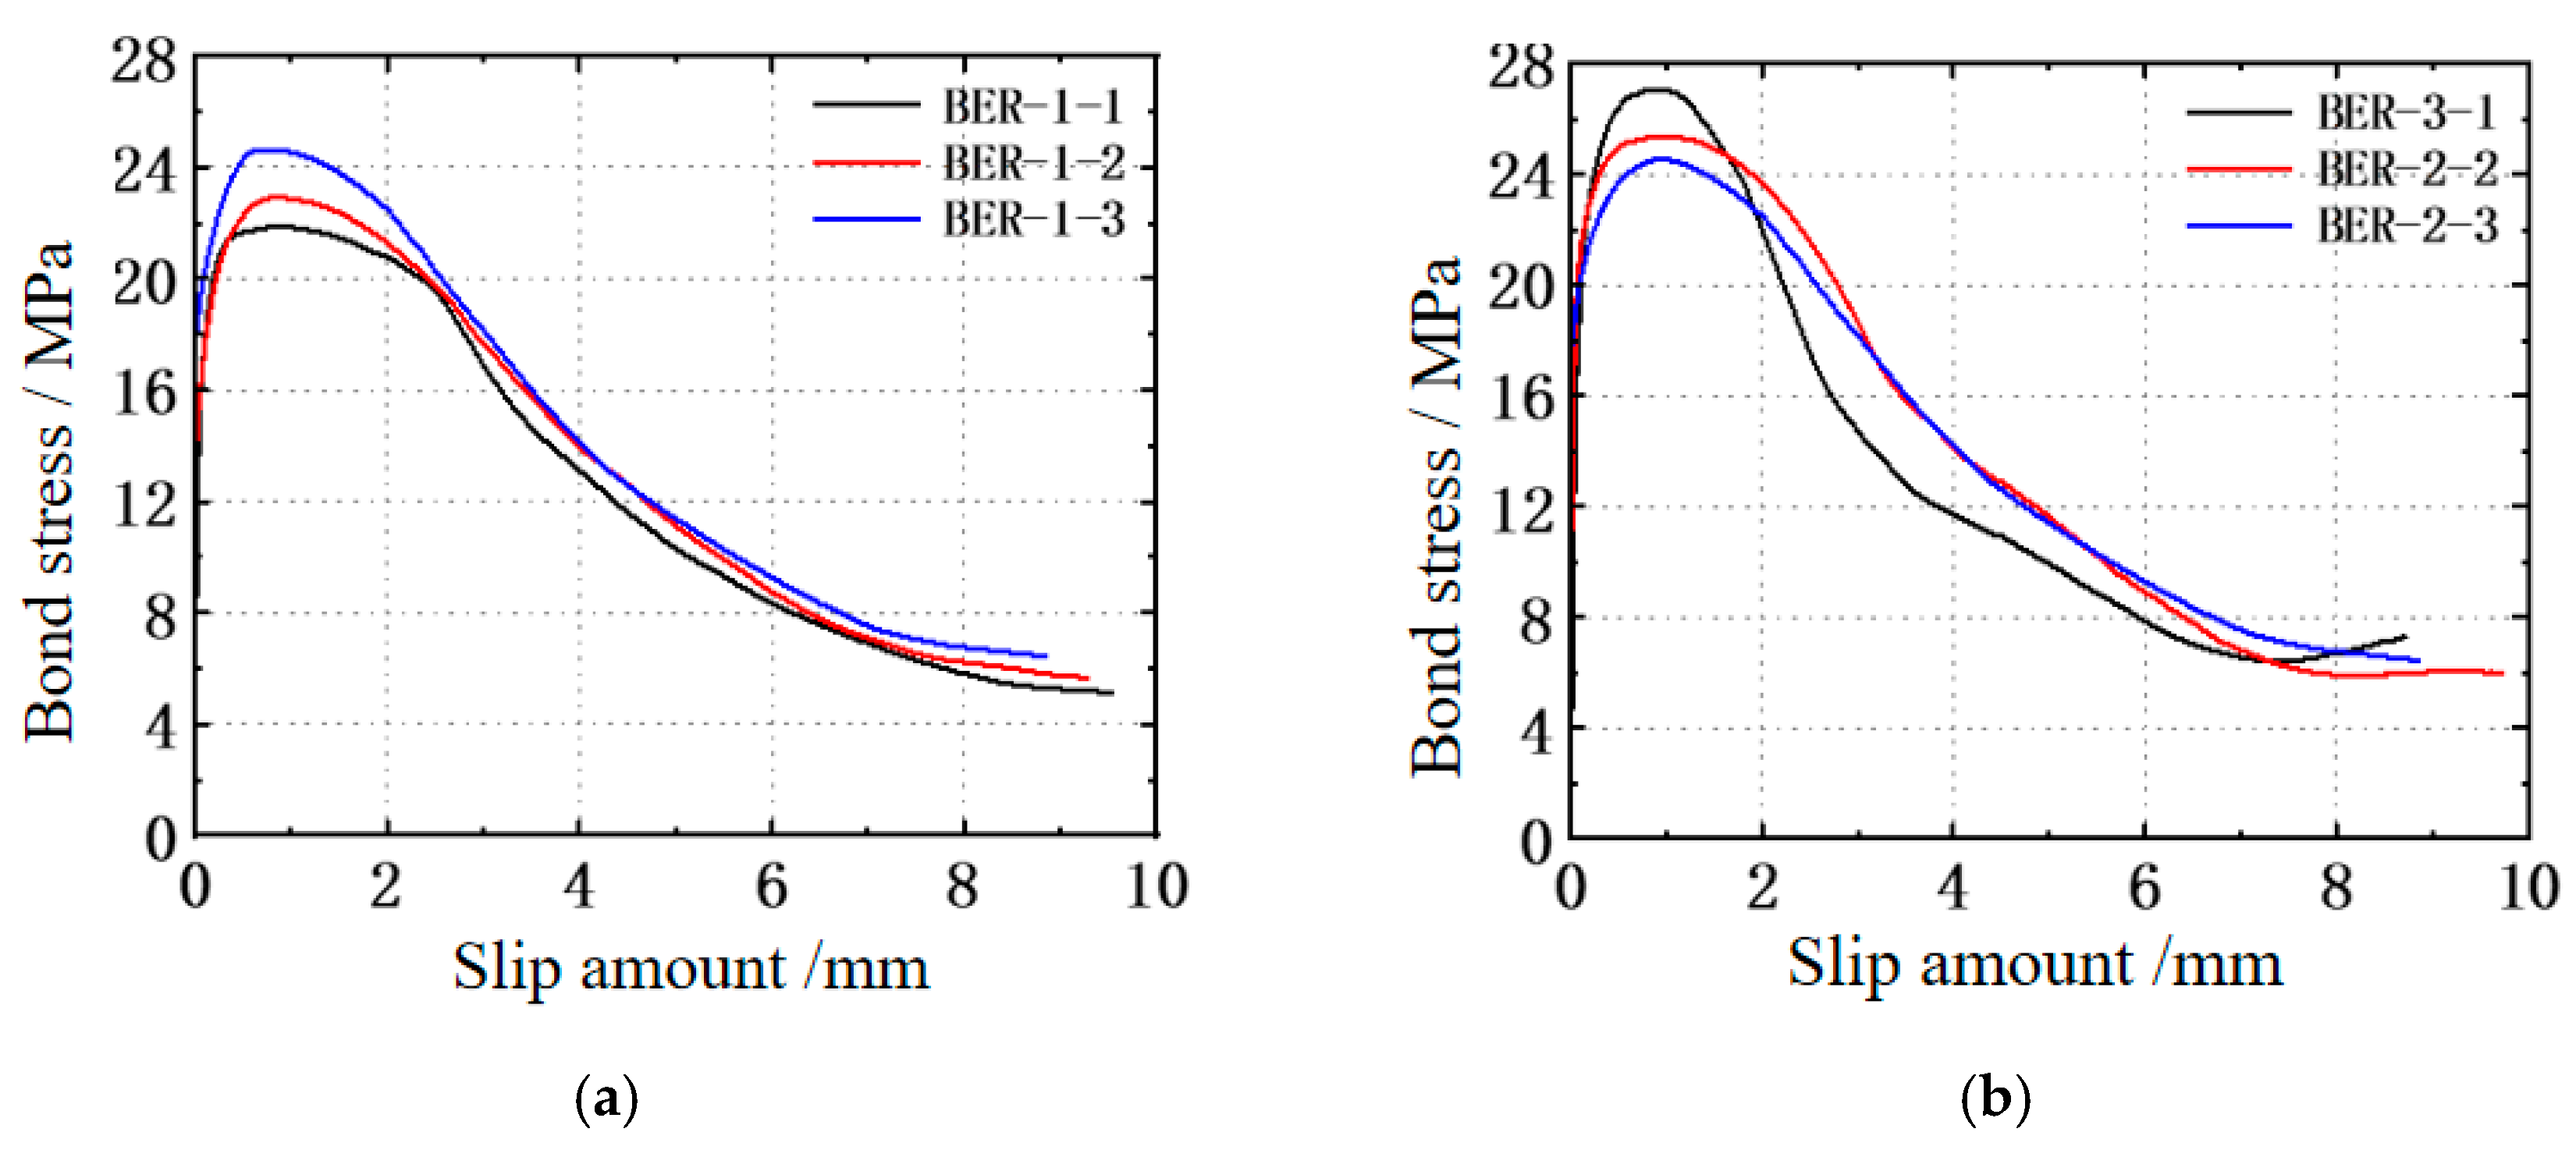
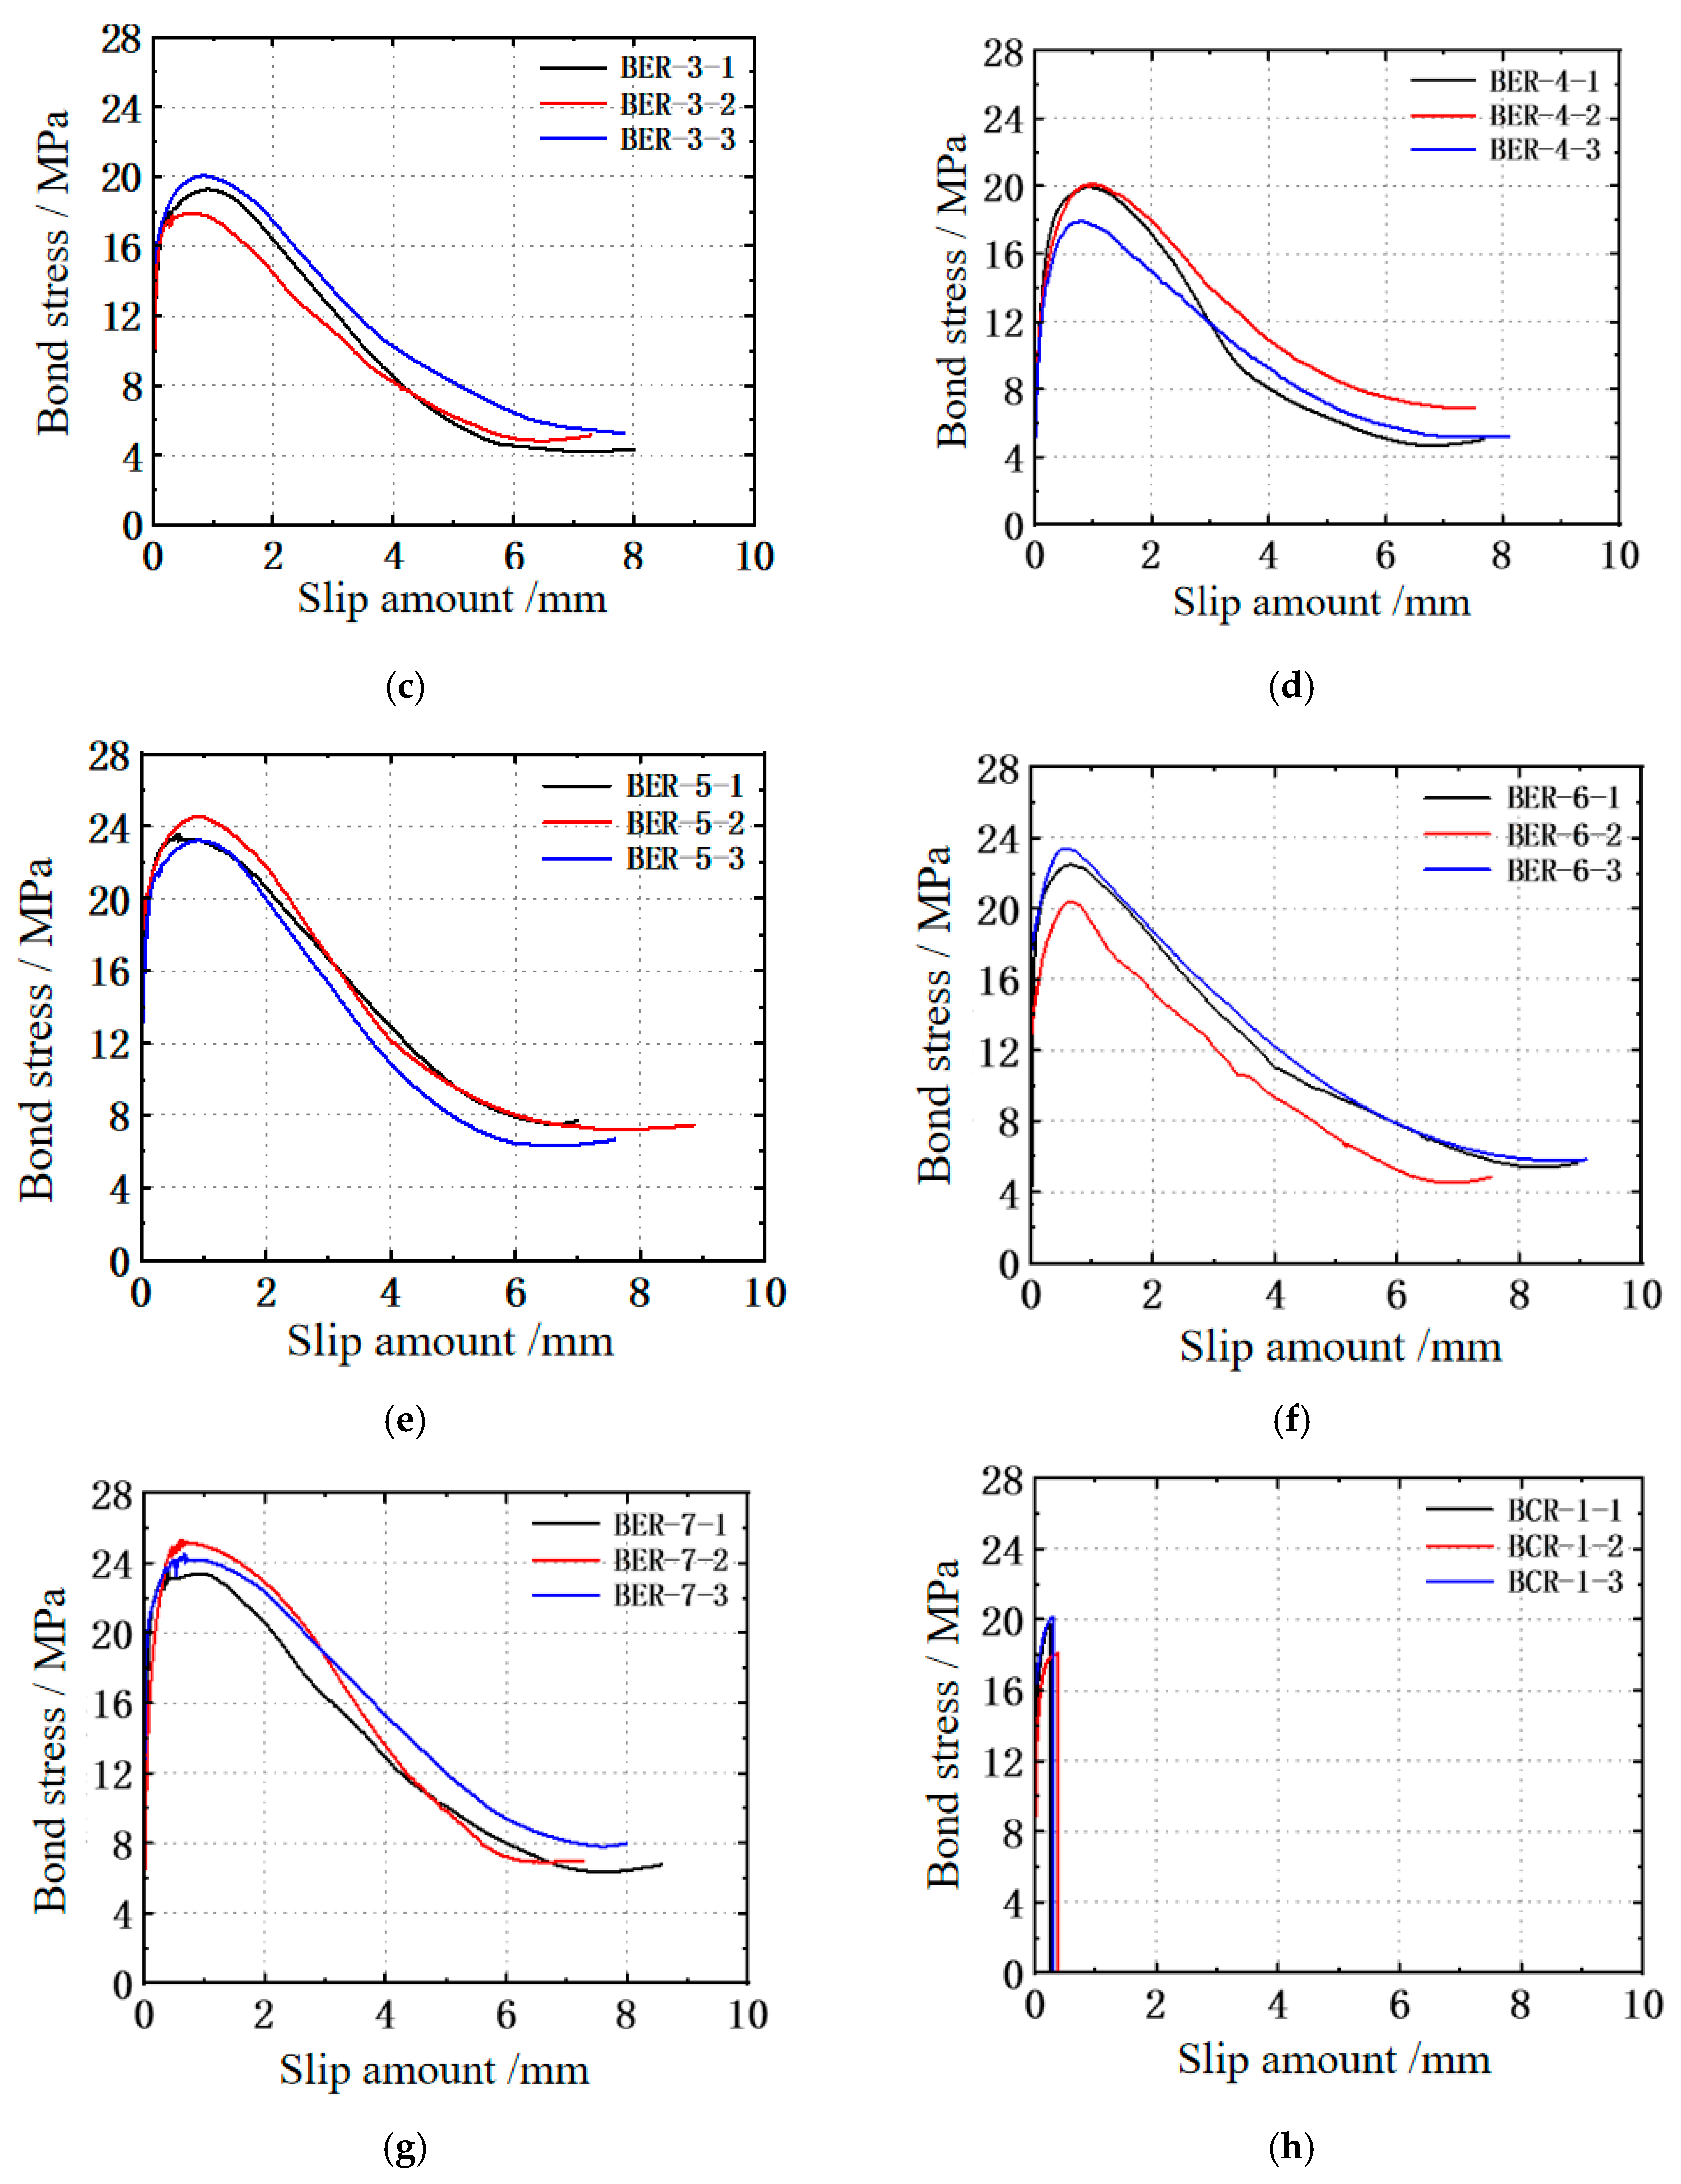
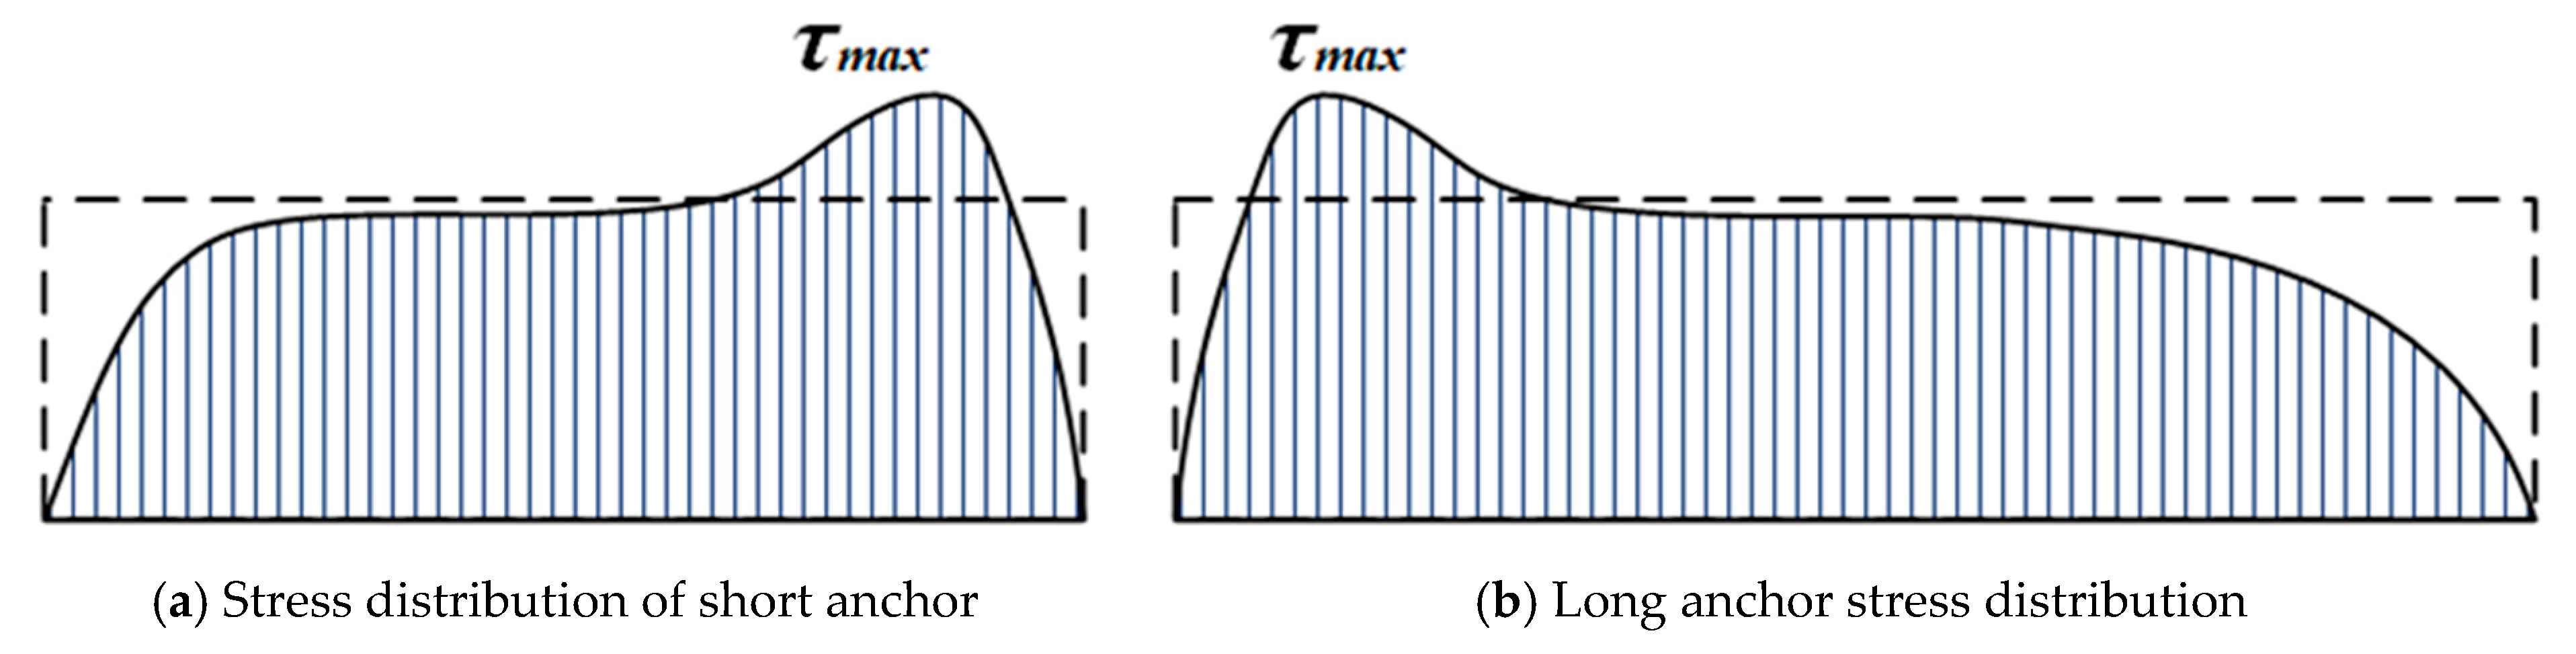
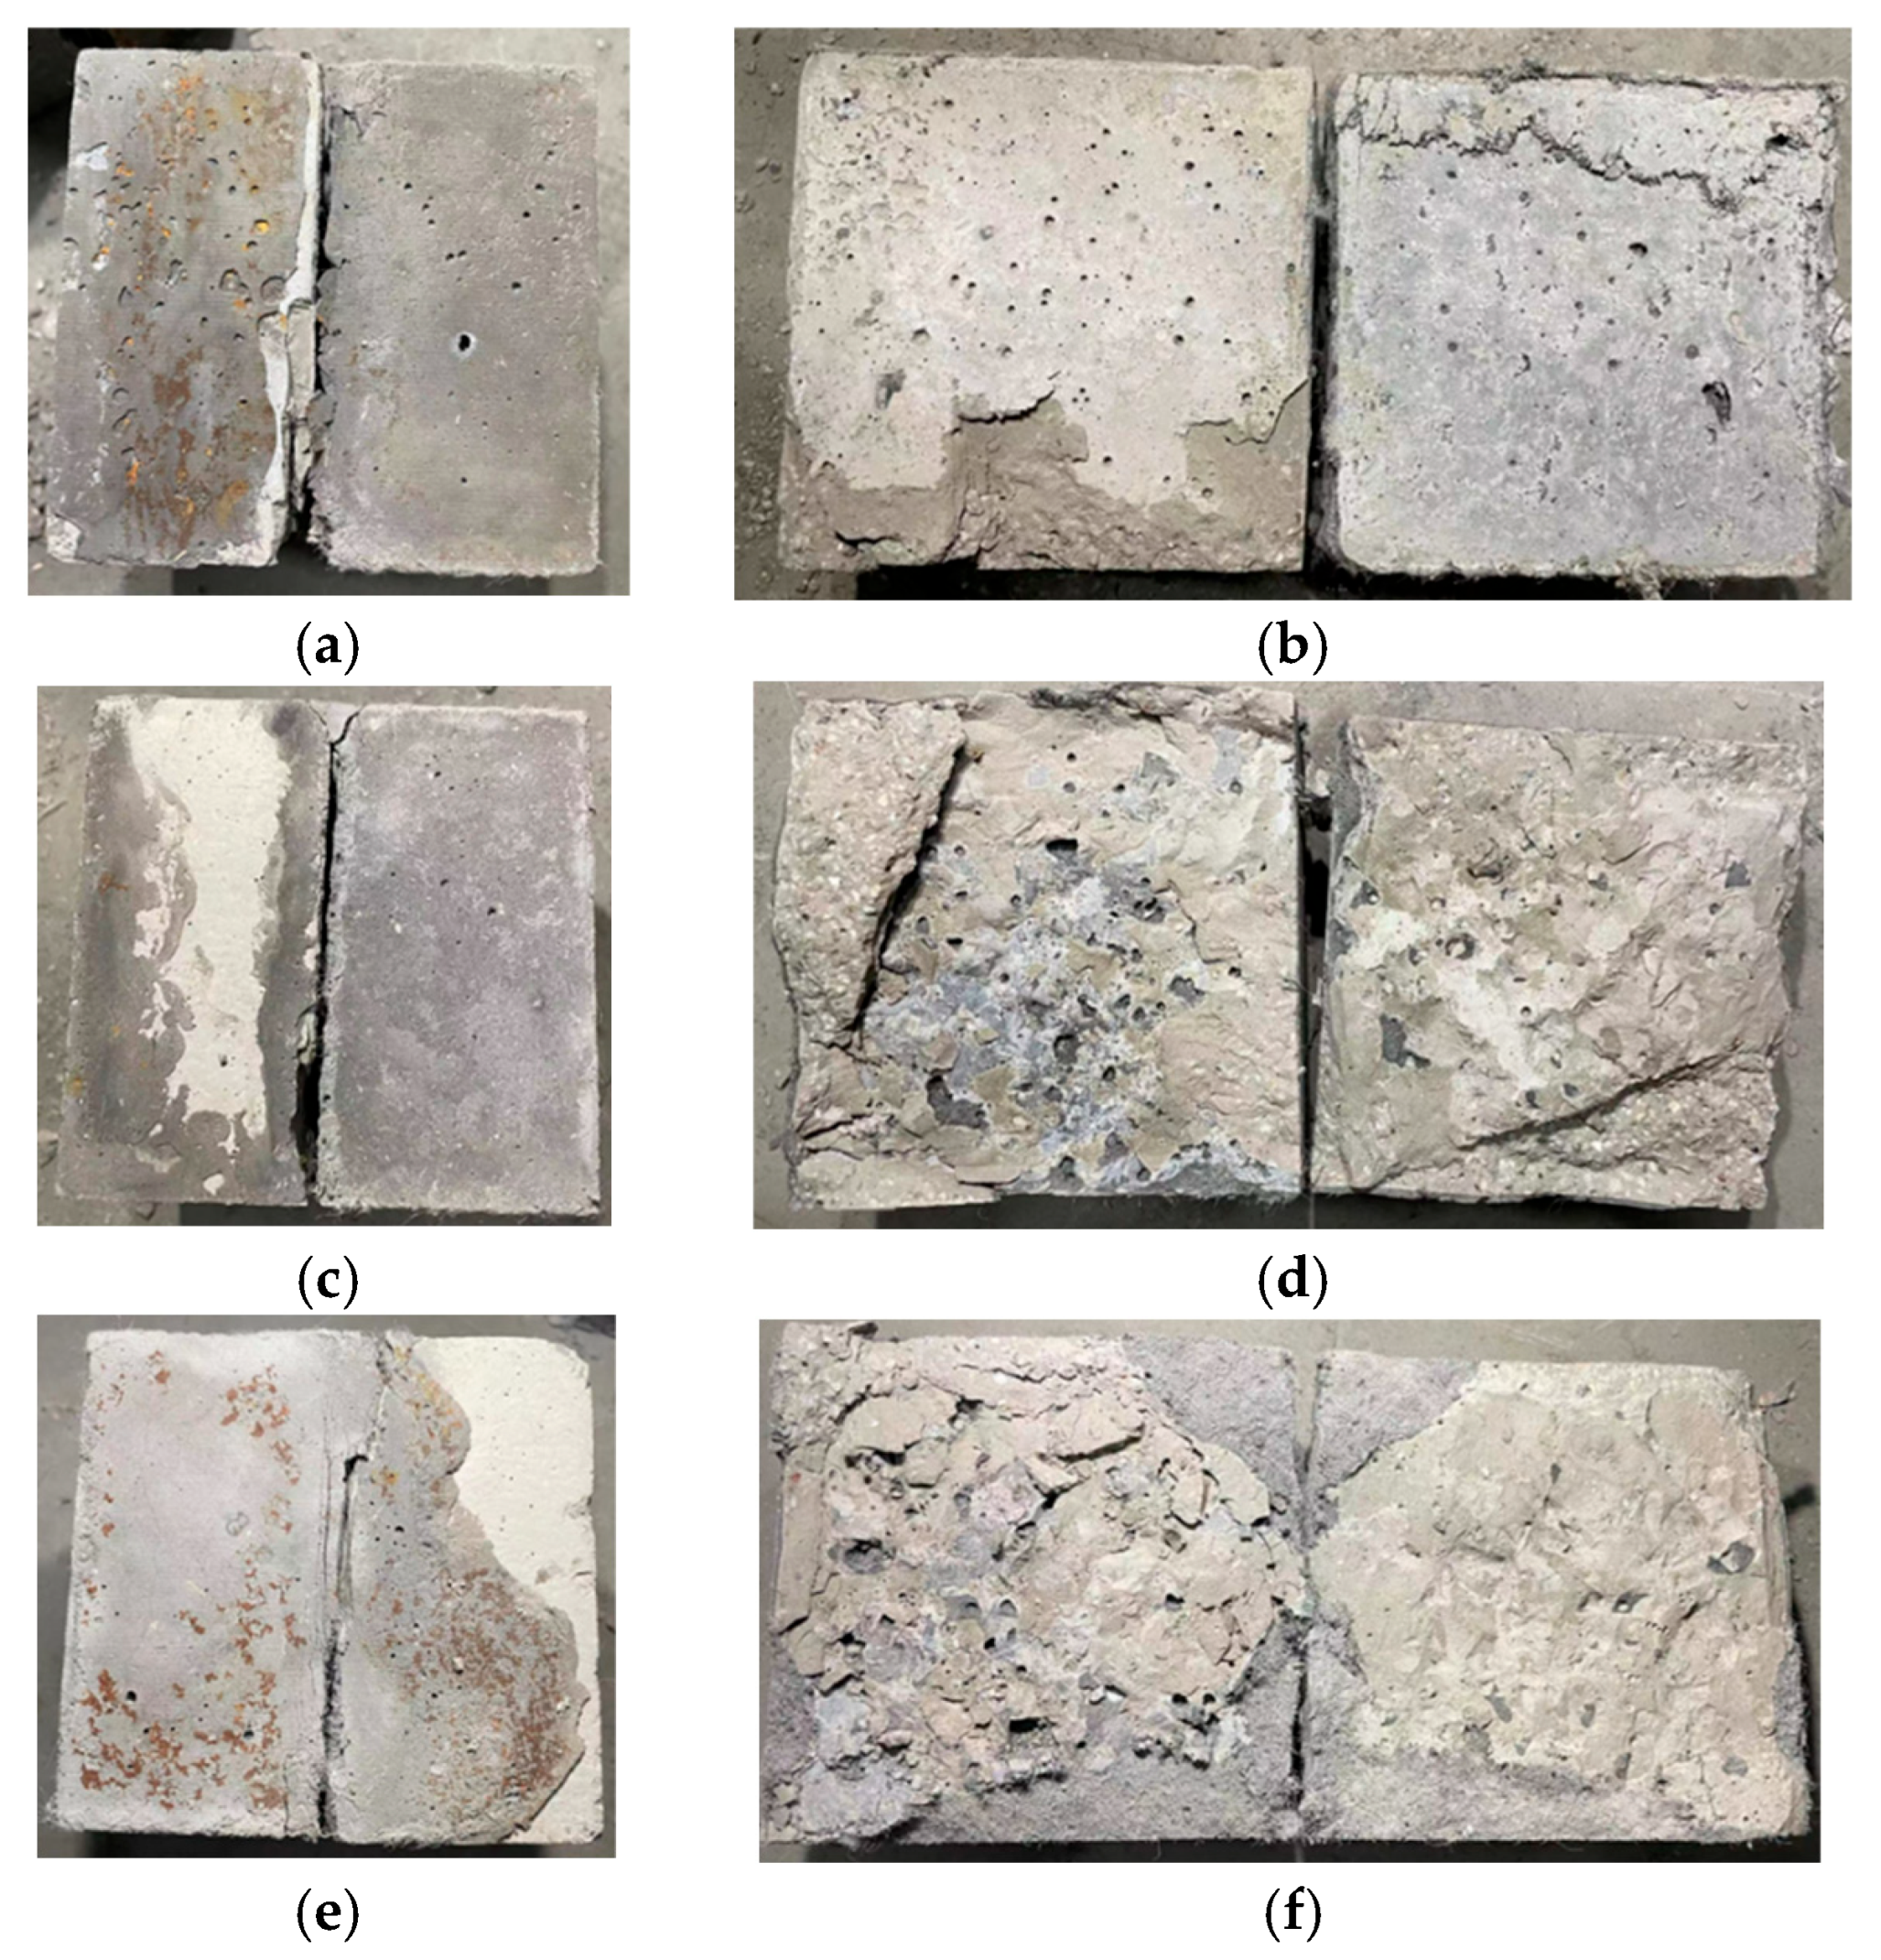
4.2. Bond Stress–Slip Relationship and Failure Mechanism
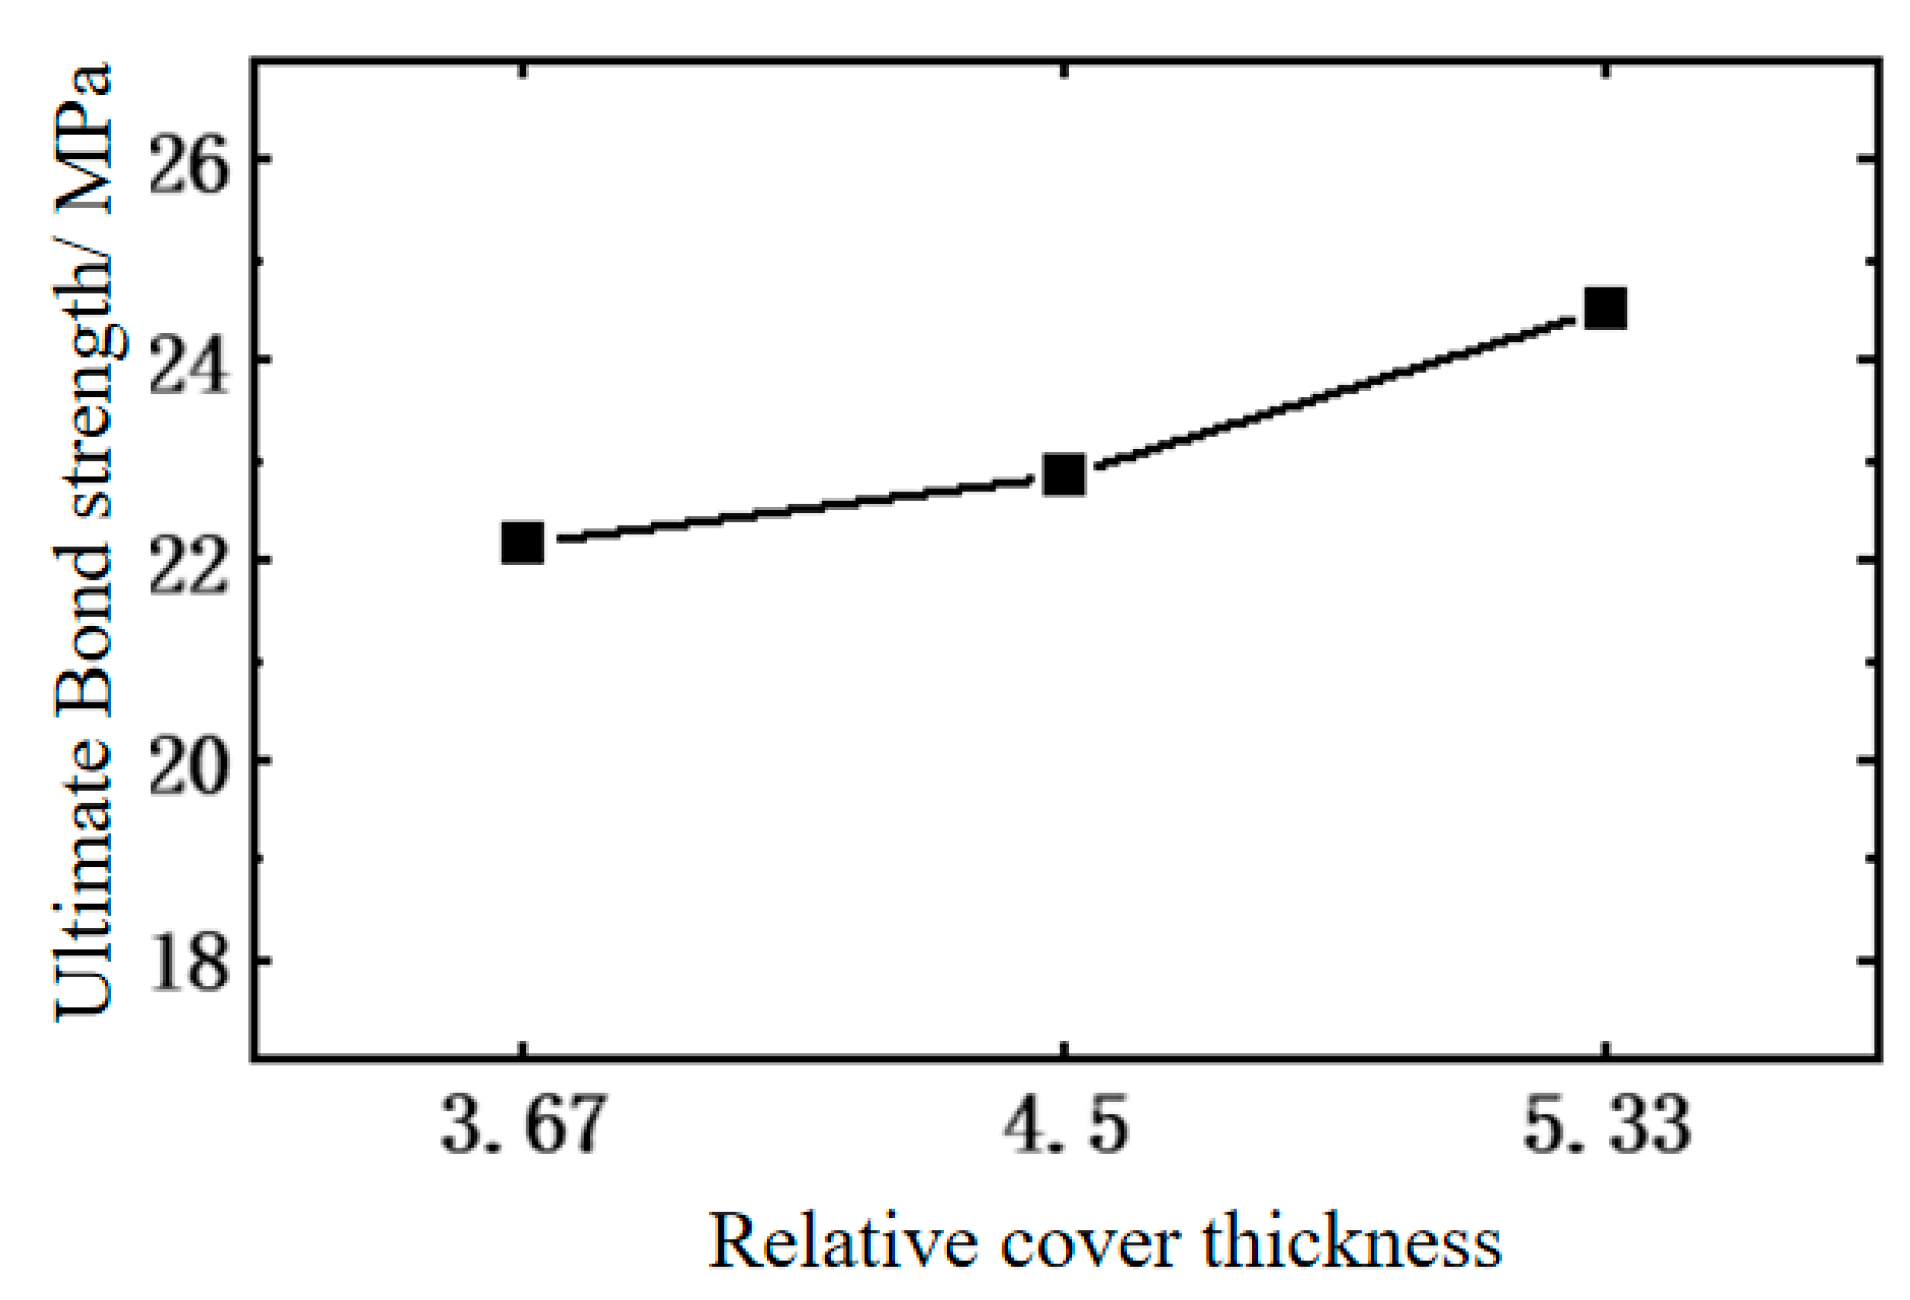
4.3. Influence of Parameters on Bonding Properties
4.4. Study of Bonding Properties of ECC to Existing Concrete
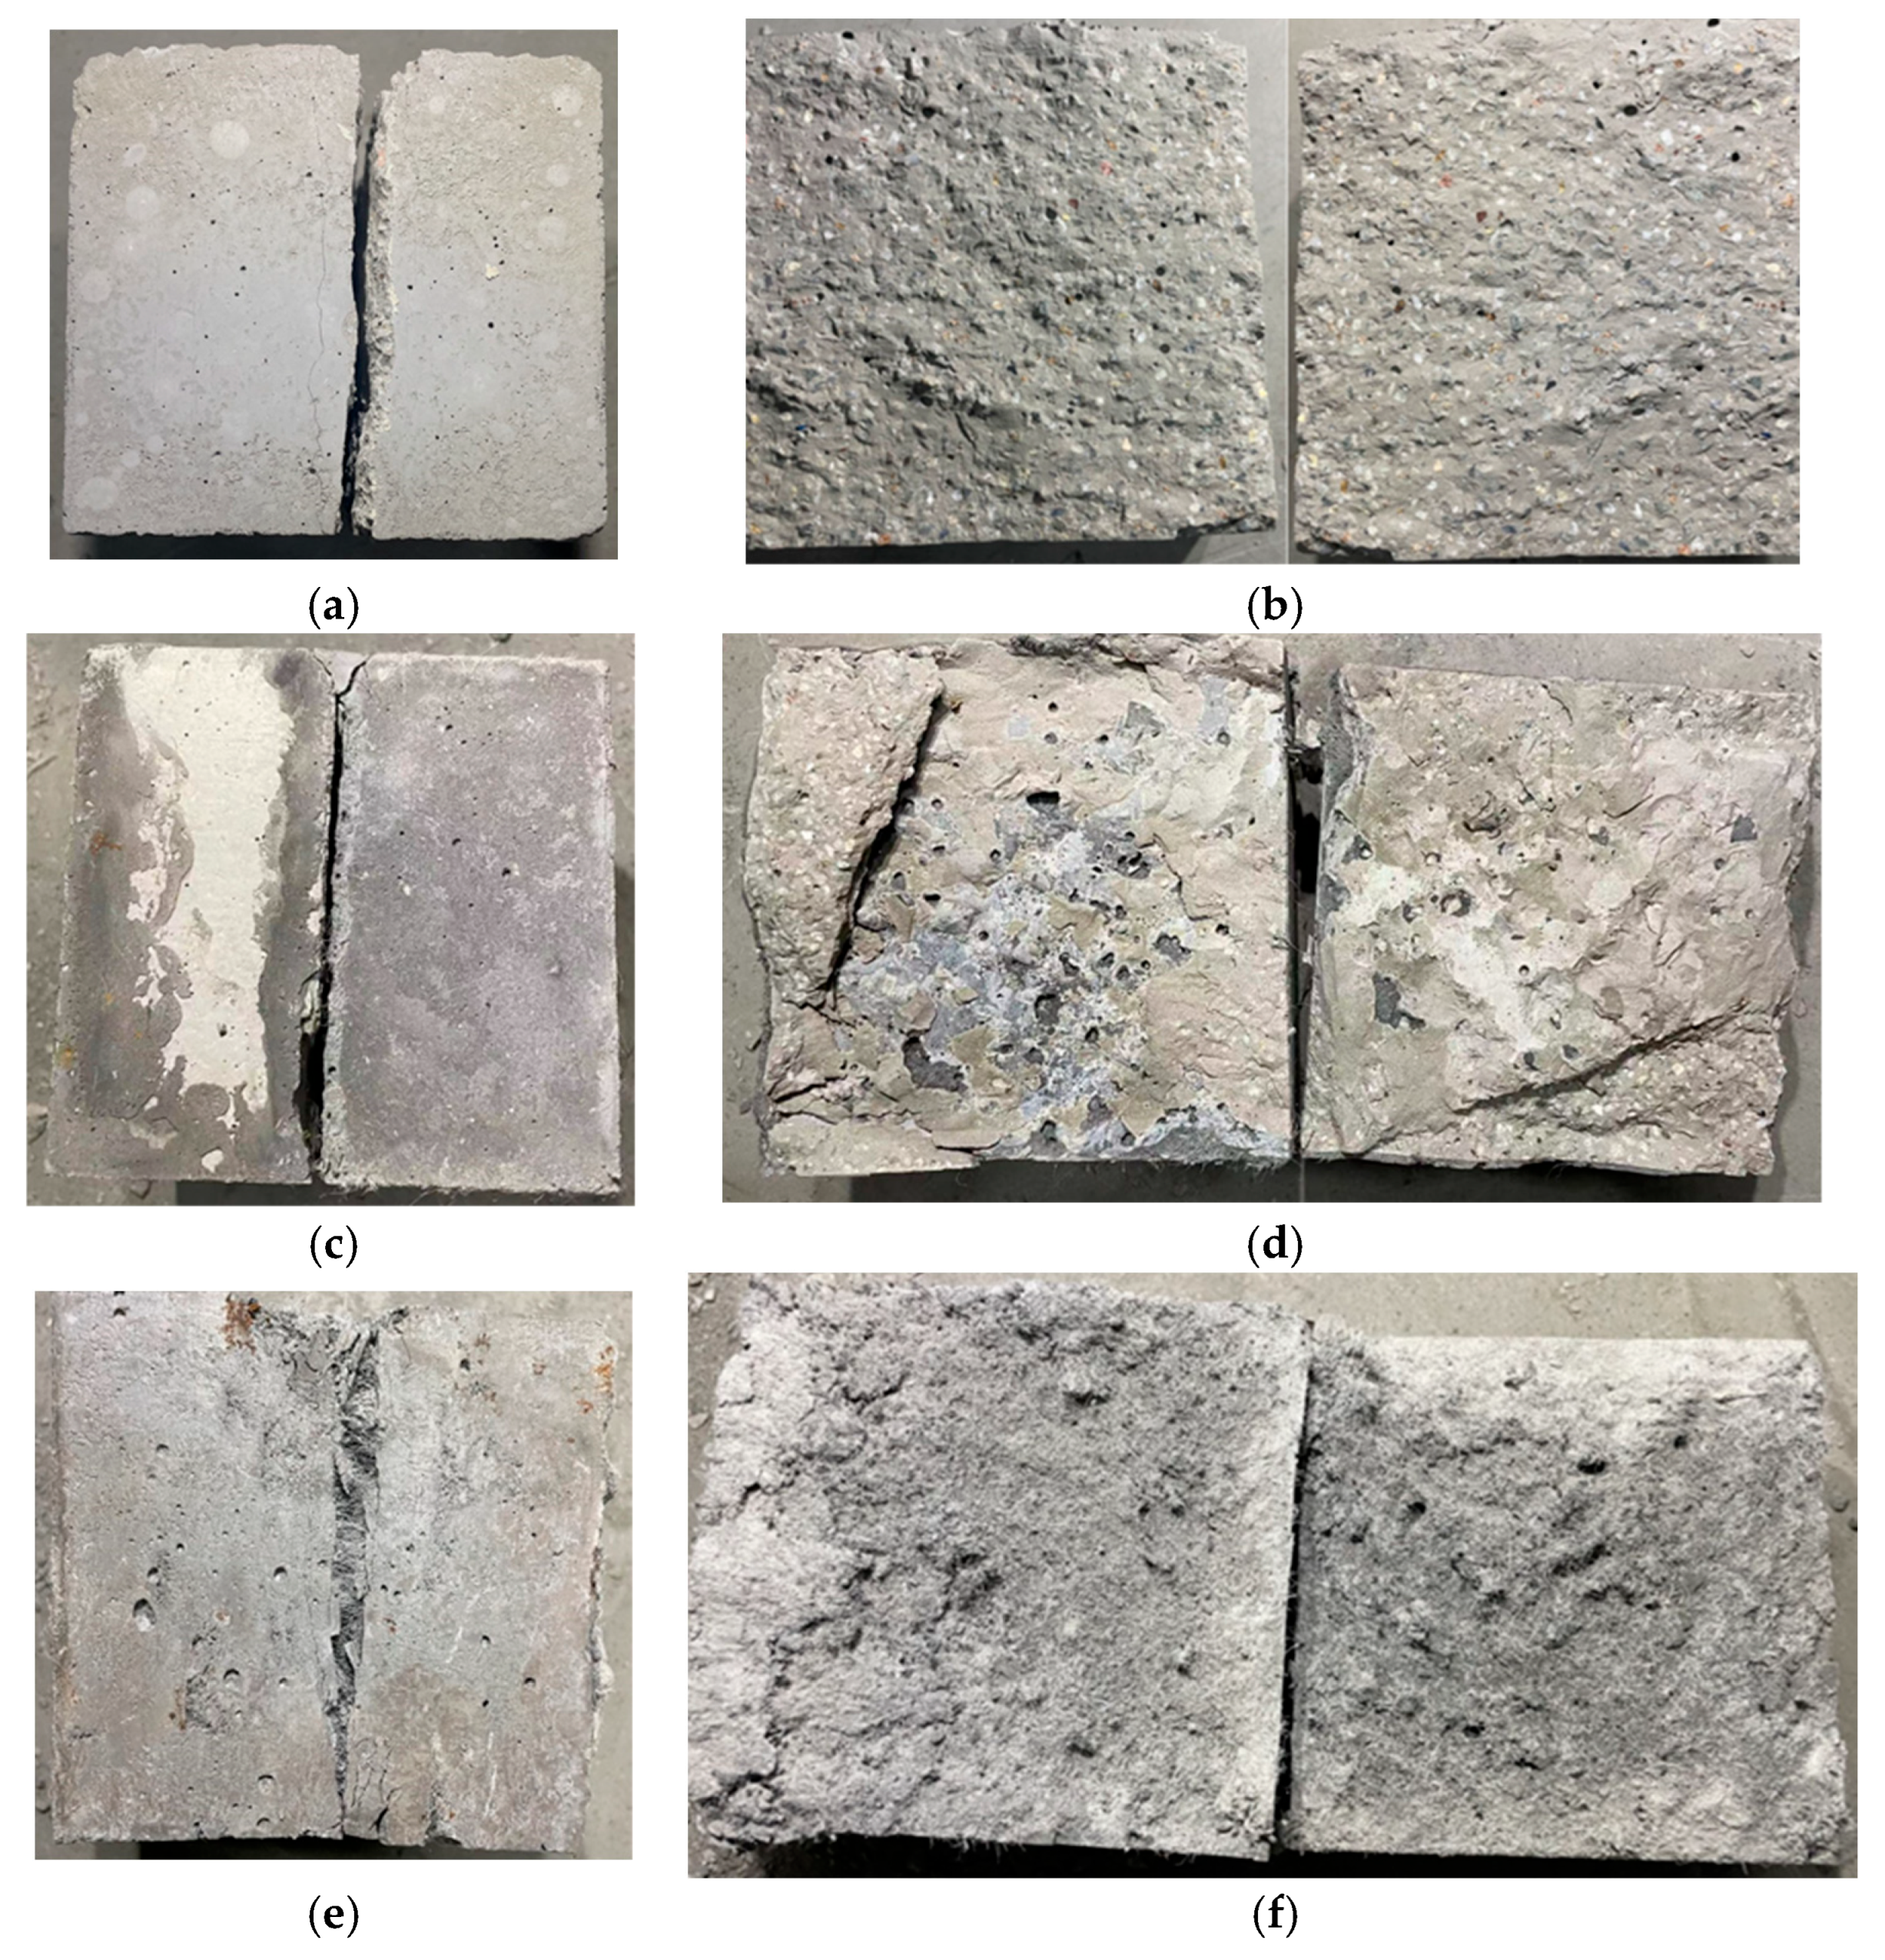
4.4.1. Influence of Interface Roughness and Interfacial Agent
4.4.2. Comparative Analysis with Monolithic Cast Specimens
5. Bridge Deck Continuous Test Validation
6. Conclusions
Author Contributions
Funding
Data Availability Statement
Acknowledgments
Conflicts of Interest
References
- Hu, B.W.; Yang, J.X.; Sun, Q.S.; Zhang, C. Experimental Study on Real Bridge Before and After Simply Supported-Continuous Reinforced Concrete Hollow Slab. Civ. Eng. J. Staveb. Obzor. 2023, 32, 188–202. [Google Scholar] [CrossRef]
- Hu, K.X.; Hou, M.J.; Yu, J.T.; Dong, S.W. Experimental Study of Fatigue Behavior of Ultra-High Toughness Concrete Used for Bridge Continuous Decks. J. Tongji Univ. (Nat. Sci.) 2018, 46, 776–783. [Google Scholar]
- Yang, Y. Research of Rapid Repair Materials for Bridge Expansion Joints Rehabilitation. Master’s Thesis, Chongqing Jiaotong University, Chongqing, China, 2017. [Google Scholar]
- Yang, C. Damage Analysis of Bridge Expansion Joint and Selection of Applications. Master’s Thesis, South China University of Technology, Guangzhou, China, 2014. [Google Scholar]
- Zhu, W.Z.; Liu, J.X. Review of Research Status on Anti-Unseating Systems for Highway Bridges. J. Guangzhou Univ. (Nat. Sci. Ed.) 2005, 4, 347–356. [Google Scholar]
- Fan, L.C.; Li, J.Z. Analysis of Bridge Damage in the Wenchuan Earthquake and Seismic Design Countermeasures. Highway 2009, 5, 122–128. [Google Scholar]
- Fu, J.H. Control Measures for Typical Diseases of Bridges with Small and Medium-Sized Span on National and Provincial Roads. Eng. Constr. Des. 2020, 23, 115–117. [Google Scholar]
- Kou, S.S. Analysis of Common Defects and Construction Treatment Techniques for Municipal Road and Bridge Engineering. Constr. Budget. 2021, 4, 83–85. [Google Scholar]
- Lima, J.M.; de Brito, J. Inspection Survey of 150 Expansion Joints in Road Bridges. Eng. Struct. 2009, 31, 1077–1084. [Google Scholar] [CrossRef]
- Saber, A.; Aleti, A.R. Behavior of FRP Link Slabs in Jointless Bridge Decks. Adv. Civ. Eng. 2012, 2012, 140–148. [Google Scholar] [CrossRef]
- Liu, L. Study on the Continuous Deck’s Behavior of Simply Supported Prestressed Concrete Beam Bridge. Master’s Thesis, Southwest Jiaotong University, Chengdu, China, 2014. [Google Scholar]
- Zhou, Y.D.; Shao, X.D.; Cao, J.H. Experimental Study and Parameter Analysis on Flexural Behavior of Continuous Decks in Steel Simply Supported Girder Bridge. Highw. Eng. 2019, 44, 80–92. [Google Scholar]
- Wang, Y.C.; Hou, M.J.; Yu, J.T.; Xu, S.L.; Yu, K.Q.; Zhang, Z.G. Experimental Study on Mechanical Properties of Ultra-High Ductile Cementitious Composites. Mater. Rep. 2018, 32, 3535–3540. [Google Scholar]
- Li, V.C.; Kanda, T. Engineered Cementitious Composites for Structural Applications. J. Mater. Civ. Eng. 1998, 10, 66–69. [Google Scholar] [CrossRef]
- Li, V.C.; Leung, C.K.Y. Steady-State and Multiple Cracking of Short Random Fiber Composites. J. Eng. Mech. 1992, 118, 2246–2264. [Google Scholar] [CrossRef]
- Li, V.C.; Mishra, D.K.; Naaman, A.E.; Wight, J.K.; LaFave, J.M.; Wu, H.-C.; Inada, Y. On the Shear Behavior of Engineered Cementitious Composites. Adv. Cem. Based Mater. 1994, 1, 142–149. [Google Scholar] [CrossRef]
- Li, V.C.; Obla, K.H. Effect of Fiber Length Variation on Tensile Properties of Carbon-Fiber Cement Composites. Compos. Eng. 1994, 4, 947–964. [Google Scholar] [CrossRef]
- Xu, S.L.; Cai, X.R.; Zhang, Y.H. Experimental Determination and Analysis of the Axial Compressive Stress-Strain Curve of Ultra-High Toughness Cementitious Composites. China Civ. Eng. J. 2009, 42, 79–85. [Google Scholar]
- Xu, S.L.; Li, H.D. A Review on the Development of Research and Application of Ultra High Toughness Cementitious Composites. China Civ. Eng. J. 2008, 6, 45–60. [Google Scholar]
- Zhang, J.; Gong, C.X.; Ju, X.C. Characteristics and Applications of High-Toughness Low-Shrinkage Fiber-Reinforced Cement-Based Composites. J. Hydraul. Eng. 2011, 42, 1452–1461. [Google Scholar]
- Li, Q.H.; Xu, S.L. Performance and Application of Ultra High Toughness Cementitious Composite: A Review. Eng. Mech. 2009, 26, 23–67. [Google Scholar]
- Gong, C.X.; Zhang, J. Tensile Properties of High-Toughness Fiber-Reinforced Cement-Based Composites. J. Hydraul. Eng. 2008, 3, 361–366. [Google Scholar]
- Sun, R.; Hu, X.; Ling, Y.; Zuo, Z.; Zhuang, P.; Wang, F. Chloride Diffusion Behavior of Engineered Cementitious Composite Under Dry-Wet Cycles. Constr. Build. Mater. 2020, 260, 119943. [Google Scholar] [CrossRef]
- Yuan, F.; Chen, M.; Pan, J. Experimental Study on Seismic Behaviours of Hybrid FRP-Steel-Reinforced ECC-Concrete Composite Columns. Compos. Part B Eng. 2019, 176, 10. [Google Scholar] [CrossRef]
- Cao, H.M. Causes and Countermeasures of Concrete Cracks in Road and Bridge Construction. Urban Constr. Theory Res. (Electron. Ed.) 2023, 20, 148–150. [Google Scholar]
- Yun, H. Review on Bonding Performance of the Interface Between New and Old Concrete. China Water Transp. 2022, 22, 159–160. [Google Scholar]
- Wu, G.Y.; Dong, Z.L.; Yu, Z.J.; Zheng, G.F.; Zhang, X.F. Influencing Factors of Bond Strength of New and Old RCC. J. Water Resour. Archit. Eng. 2023, 21, 136–142. [Google Scholar]
- Yang, P.S. Experimental Research on Mechanical Properties of New-to-old Concrete Interface Under Direct Shear Condition. Ind. Constr. 2022, 52, 200–204. [Google Scholar]
- Xu, Y.S. Experimental Study on the Shear Resistance of Grooving and Rebar Planting at the Bonding Interface Between New and Old Concrete. Shanxi J. Transp. Sci. Technol. 2021, 6, 22–25. [Google Scholar]
- Tschegg, E.K.; Stanzi, S.E. Adhesive Power Measurements of Bonds Between Old and New Concrete. J. Mater. Sci. 1991, 26, 5189–5194. [Google Scholar] [CrossRef]
- Cui, T.; He, H.X.; Yan, W.M.; Qian, Z.Z.; Zhou, D.X. Shear Resistance Property of ECC-Existing Concrete Interface. J. Build. Mater. 2020, 23, 1030–1037. [Google Scholar]
- Wang, Z.L.; Lin, Y.J.; Qian, Y.J. Experimental Research on Shear Properties of New-to-Old Concrete Interface. J. Southwest Jiaotong Univ. 2005, 5, 600–604. [Google Scholar]
- Wei, P.; Zhou, M.Y. Shear Performance of the Bonding Interface Between ECC and Existing Concrete. J. Zhongyuan Univ. Technol. 2019, 30, 49–54. [Google Scholar]
- Cao, H.L.; Shi, C.C.; Guo, X.D.; Xu, C.G.; Li, L.H. Experimental Study on Bond Split Strength of the Second Stage Old Concrete to New Concrete. J. Water Resour. Archit. Eng. 2016, 14, 102–106. [Google Scholar]
- Sahraran, M.; Yucel, H.E.; Yildirim, G.; Al-Enam, M.; Lachemi, M. Investigation of the Bond Between Concrete Substrate and ECC Overlays. J. Mater. Civ. Eng. 2014, 26, 167–174. [Google Scholar] [CrossRef]
- Zeng, J.-J.; Zhang, W.-B.; Yan, Y.-Y.; Yu, Q.-Q.; Wang, W.-Q. Flexural Behavior of FRP Grid Reinforced Ultra-High-Performance Concrete Composite Plates with Different Types of Fibers. Eng. Struct. 2022, 272, 115020. [Google Scholar] [CrossRef]
- Zeng, J.-J.; Lin, C.-X.; Feng, Z.-S.; Liu, J.-L.; Wu, G. Experimental Investigations on Tensile and Shear Behavior of the Interface Between UHP-ECC and Concrete. Int. J. Concr. Struct. Mater. 2024, 18, 50. [Google Scholar] [CrossRef]
- Li, A.N.; Li, Q.; Zhang, X.Y.; Ou, L.; Lu, C.; Hu, Z.J. Statistical Analysis of Factors Affecting the Splitting Tensile Strength of New to Old Concrete. Build. Struct. 2022, 52, 1446–1449. [Google Scholar]


| Specific Surface Area (m2/kg) | SO3 (%) | MgO (%) | Cl− (%) | Content of Gypsum (%) | Additive for Grinding (%) | Loss on Ignition (%) | 3d Flexural Resistance (MPa) | 3D Compression Resistance (MPa) |
|---|---|---|---|---|---|---|---|---|
| 358 | 2.2 | 3 | 0.04 | 6 | 0.2 | 4 | 5.5 | 27.2 |
| Specific Surface Area (m2/kg) | SO3 (%) | Fe2O3 (%) | CaO (%) | MgO (%) | Al2O3 (%) | SiO2 (%) | K2O (%) | TiO2 (%) | Loss on Ignition (%) | Water Demand (%) |
|---|---|---|---|---|---|---|---|---|---|---|
| 420 | 0.65 | 4.01 | 1.47 | 1.36 | 26.83 | 54.07 | 1.541 | 1.657 | 4.5 | 94.5 |
| Diameter (mm) | Length (mm) | Density (g/cm3) | Tensile Strength (MPa) | Elastic Modulus (GPa) | Ultimate Tensile Ratio (%) |
|---|---|---|---|---|---|
| 0.024 | 12 | 0.97~0.98 | 3000 | 116 | 6 |
| Test No. | A Fly Ash Replacement Ratio | B Water-Binder Ratio | C Sand-Binder Ratio | D Fiber Volume Content | Empty Column | ||||
|---|---|---|---|---|---|---|---|---|---|
| Level | Replacement Rate/% | Level | Ratio | Level | Ratio | Level | Dosage/% | Level | |
| 1 | 1 | 50 | 1 | 0.20 | 1 | 0.28 | 1 | 1.2 | 1 |
| 2 | 1 | 50 | 2 | 0.24 | 2 | 0.32 | 2 | 1.6 | 2 |
| 3 | 1 | 50 | 3 | 0.28 | 3 | 0.36 | 3 | 2.0 | 3 |
| 4 | 1 | 50 | 4 | 0.32 | 4 | 0.4 | 4 | 2.4 | 4 |
| 5 | 2 | 55 | 1 | 0.20 | 2 | 0.32 | 3 | 2.0 | 4 |
| 6 | 2 | 55 | 2 | 0.24 | 1 | 0.28 | 4 | 2.4 | 3 |
| 7 | 2 | 55 | 3 | 0.28 | 4 | 0.4 | 1 | 1.2 | 2 |
| 8 | 2 | 55 | 4 | 0.32 | 3 | 0.36 | 2 | 1.6 | 1 |
| 9 | 3 | 60 | 1 | 0.20 | 3 | 0.36 | 4 | 2.4 | 2 |
| 10 | 3 | 60 | 2 | 0.24 | 4 | 0.4 | 3 | 2.0 | 1 |
| 11 | 3 | 60 | 3 | 0.28 | 1 | 0.28 | 2 | 1.6 | 4 |
| 12 | 3 | 60 | 4 | 0.32 | 2 | 0.32 | 1 | 1.2 | 3 |
| 13 | 4 | 70 | 1 | 0.20 | 4 | 0.4 | 2 | 1.6 | 3 |
| 14 | 4 | 70 | 2 | 0.24 | 3 | 0.36 | 1 | 1.2 | 4 |
| 15 | 4 | 70 | 3 | 0.28 | 2 | 0.32 | 4 | 2.4 | 1 |
| 16 | 4 | 70 | 4 | 0.32 | 1 | 0.28 | 3 | 2.0 | 2 |
| Specimen No. | Research Variables | Anchorage Length/mm | Bar Diameter/mm | Side Length of Specimen/mm | Protective Layer Thickness/mm |
|---|---|---|---|---|---|
| BER-1 | Control group | 60 (5 d) | 12 | 120 | 54 |
| BER-2 | Anchorage length | 36 (3 d) | 12 | 120 | 54 |
| BER-3 | 72 (7 d) | 12 | 120 | 54 | |
| BER-4 | Bar Diameter | 50 (5 d) | 10 | 120 | 55 |
| BER-5 | 70 (5 d) | 14 | 120 | 53 | |
| BER-6 | Protective layer thickness | 60 (5 d) | 12 | 100 | 44 |
| BER-7 | 60 (5 d) | 12 | 140 | 64 | |
| BCR-1 | Conventional concrete | 60 (5 d) | 12 | 120 | 54 |
| Specimen No. | Research Variables | Roughness | Adhesion Agent |
|---|---|---|---|
| BEC-1 | Control group | II | Water-wetting |
| BEC-2 | Roughness | I | Water-wetting |
| BEC-3 | III | Water-wetting | |
| BEC-4 | Adhesion agent | II | No treatment |
| BEC-5 | II | Cement paste | |
| BCC-1 | Comparison with concrete | — | — |
| BEE-1 | Comparison with ECC | — | — |
| No. | Compressive Strength /MPa | Tensile Strength/MPa | Ultimate Tensile Strain/% | Bending Strength/MPa | Ultimate Bending Deflection/mm |
|---|---|---|---|---|---|
| 1 | 60.72 | 4.09 | 2.40 | 7.72 | 17.60 |
| 2 | 63.67 | 4.43 | 4.09 | 7.96 | 23.04 |
| 3 | 60.33 | 4.83 | 4.25 | 8.77 | 22.41 |
| 4 | 59.48 | 4.51 | 3.36 | 7.79 | 19.43 |
| 5 | 64.48 | 4.71 | 4.13 | 8.92 | 24.69 |
| 6 | 61.76 | 4.64 | 4.23 | 8.36 | 23.34 |
| 7 | 59.92 | 4.27 | 3.18 | 7.44 | 20.55 |
| 8 | 57.31 | 4.21 | 4.30 | 7.42 | 24.00 |
| 9 | 64.90 | 4.73 | 3.90 | 8.49 | 20.35 |
| 10 | 64.12 | 4.95 | 4.58 | 8.28 | 25.14 |
| 11 | 56.00 | 4.14 | 4.38 | 6.92 | 27.52 |
| 12 | 54.28 | 3.84 | 3.13 | 6.73 | 23.18 |
| 13 | 61.42 | 4.18 | 3.11 | 7.58 | 20.12 |
| 14 | 57.81 | 3.93 | 2.84 | 7.24 | 20.59 |
| 15 | 56.03 | 4.23 | 4.17 | 8.17 | 23.87 |
| 16 | 52.83 | 3.78 | 3.98 | 7.08 | 27.46 |
| Factor | Squares of Deviations | Degree of Freedom | Mean Square | F Value | p Value | Contribution Rate (%) | Significance |
|---|---|---|---|---|---|---|---|
| Fly ash | 41.517 | 3 | 13.839 | 18.887 | 0.003 | 18.2 | * |
| Water-binder ratio | 124.923 | 3 | 41.641 | 56.829 | <0.001 | 67.3 | ** |
| Water-solid ratio | 24.095 | 3 | 8.032 | 10.961 | 0.015 | 10.5 | * |
| Fiber volume parameters | 14.269 | 3 | 4.756 | 6.491 | 0.120 | 6.5 | (*) |
| Empty column | 2.198 | 3 | 0.733 | — | — | — | — |
| Analysis Process | Ultimate Tensile Strength/MPa | Ultimate Tensile Strain/% | ||||||||
|---|---|---|---|---|---|---|---|---|---|---|
| A | B | C | D | E | A | B | C | D | E | |
| K1 | 17.85 | 17.71 | 16.65 | 16.13 | 17.47 | 14.11 | 13.54 | 14.99 | 11.55 | 15.45 |
| K2 | 17.82 | 17.95 | 17.21 | 16.97 | 17.22 | 15.84 | 15.74 | 15.52 | 15.87 | 15.15 |
| K3 | 17.67 | 17.47 | 17.70 | 18.26 | 17.49 | 15.99 | 15.98 | 15.29 | 16.95 | 14.71 |
| K4 | 16.12 | 16.34 | 17.91 | 18.11 | 17.29 | 14.10 | 14.77 | 14.23 | 15.67 | 14.71 |
| k1 | 4.46 | 4.43 | 4.16 | 4.03 | 4.37 | 3.53 | 3.38 | 3.75 | 2.89 | 3.86 |
| k2 | 4.46 | 4.49 | 4.30 | 4.24 | 4.30 | 3.96 | 3.93 | 3.88 | 3.97 | 3.79 |
| k3 | 4.42 | 4.37 | 4.43 | 4.56 | 4.37 | 4.00 | 4.00 | 3.82 | 4.24 | 3.68 |
| k4 | 4.03 | 4.08 | 4.48 | 4.53 | 4.32 | 3.53 | 3.69 | 3.56 | 3.92 | 3.68 |
| R | 0.43 | 0.40 | 0.31 | 0.53 | 0.07 | 0.47 | 0.61 | 0.32 | 1.35 | 0.18 |
| Performance Index | Factor | Squares of Deviations | Degree of Freedom | Mean Square | F Value | F Critical Value | Significance |
|---|---|---|---|---|---|---|---|
| Tensile strength | Fly ash | 0.520 | 3 | 0.173 | 37.754 | F0.01(3,3) = 29.457 F0.05(3,3) = 9.277 F0.1(3,3) = 5.391 | ** |
| Water-binder ratio | 0.381 | 3 | 0.127 | 27.709 | * | ||
| Water-solid ratio | 0.235 | 3 | 0.078 | 17.085 | * | ||
| Fiber volume parameters | 0.757 | 3 | 0.252 | 55.014 | ** | ||
| Empty column | 0.014 | 3 | 0.005 | — | |||
| Tension strain | Fly ash | 0.820 | 3 | 0.273 | 8.411 | (*) | |
| Water-binder ratio | 0.925 | 3 | 0.308 | 9.490 | * | ||
| Water-solid ratio | 0.238 | 3 | 0.079 | 2.439 | — | ||
| Fiber volume parameters | 4.234 | 3 | 1.411 | 43.422 | ** | ||
| Fly ash | 0.098 | 3 | 0.033 | — |
| Performance Index | Factor | Squares of Deviations | Degree of Freedom | Mean Square | F Value | F Critical Value | Significance |
|---|---|---|---|---|---|---|---|
| Bending strength | Fly ash | 0.962 | 3 | 0.321 | 10.534 | F0.01(3,3) = 29.457 F0.05(3,3) = 9.277 F0.1(3,3) = 5.391 | * |
| Water-binder ratio | 1.868 | 3 | 0.623 | 20.448 | * | ||
| Water-solid ratio | 0.531 | 3 | 0.177 | 5.815 | (*) | ||
| Fiber volume parameters | 3.009 | 3 | 1.003 | 32.940 | ** | ||
| Empty column | 0.091 | 3 | 0.030 | — | |||
| Bending deflection | Fly ash | 25.711 | 3 | 8.570 | 18.745 | * | |
| Water-binder ratio | 22.423 | 3 | 7.474 | 16.348 | * | ||
| Water-solid ratio | 21.227 | 3 | 7.076 | 15.475 | * | ||
| Fiber volume parameters | 46.900 | 3 | 15.633 | 34.192 | ** | ||
| Empty column | 1.372 | 3 | 0.457 | — |
| Ultimate Bond Strength/MPa | |
|---|---|
| 0.157 (φ10) | 19.34 |
| 0.165 (φ12) | 22.84 |
| 0.171 (φ14) | 24.08 |
| Ultimate Bond Strength /MPa | |
|---|---|
| 3 | 25.70 |
| 5 | 22.84 |
| 7 | 19.13 |
| Ultimate Bond Strength/MPa | |
|---|---|
| 3.67 | 22.16 |
| 4.50 | 22.84 |
| 5.33 | 24.50 |
| Specimen No. | Splitting Load/kN | Splitting Tensile Strength/MPa | Average Strength/MPa | ||||
|---|---|---|---|---|---|---|---|
| 1 | 2 | 3 | 1 | 2 | 3 | ||
| BEC-1 | 47.12 | 43.06 | 49.88 | 3.00 | 2.74 | 3.18 | 2.97 |
| BEC-2 | 37.09 | 43.06 | 36.30 | 2.36 | 2.74 | 2.31 | 2.47 |
| BEC-3 | 57.05 | 59.20 | 52.39 | 3.63 | 3.77 | 3.34 | 3.58 |
| BEC-4 | 48.62 | 42.00 | 41.53 | 3.10 | 2.68 | 2.65 | 2.81 |
| BEC-5 | 40.29 | 44.38 | 42.41 | 2.57 | 2.83 | 2.70 | 2.70 |
| BCC-1 | 41.39 | 38.64 | 37.49 | 2.64 | 2.46 | 2.39 | 2.50 |
| BEE-1 | 66.42 | 62.66 | 68.01 | 4.23 | 3.99 | 4.33 | 4.18 |
| Material | Compressive Strength/MPa | Average Strength/MPa |
|---|---|---|
| Concrete | 45.43 | 43.97 |
| 42.16 | ||
| 44.37 | ||
| ECC | 61.11 | 61.20 |
| 63.65 | ||
| 58.85 |
| Interface Roughness | Splitting Tensile Strength/MPa |
|---|---|
| I (No treatment available) | 2.47 |
| II (Chipping 2~3 mm) | 2.97 |
| III (Chipping 4~5 mm) | 3.58 |
| Type of Interface Agents | Splitting Tensile Strength/MPa |
|---|---|
| No treatment available | 2.81 |
| Water | 2.97 |
| Cement paste | 2.70 |
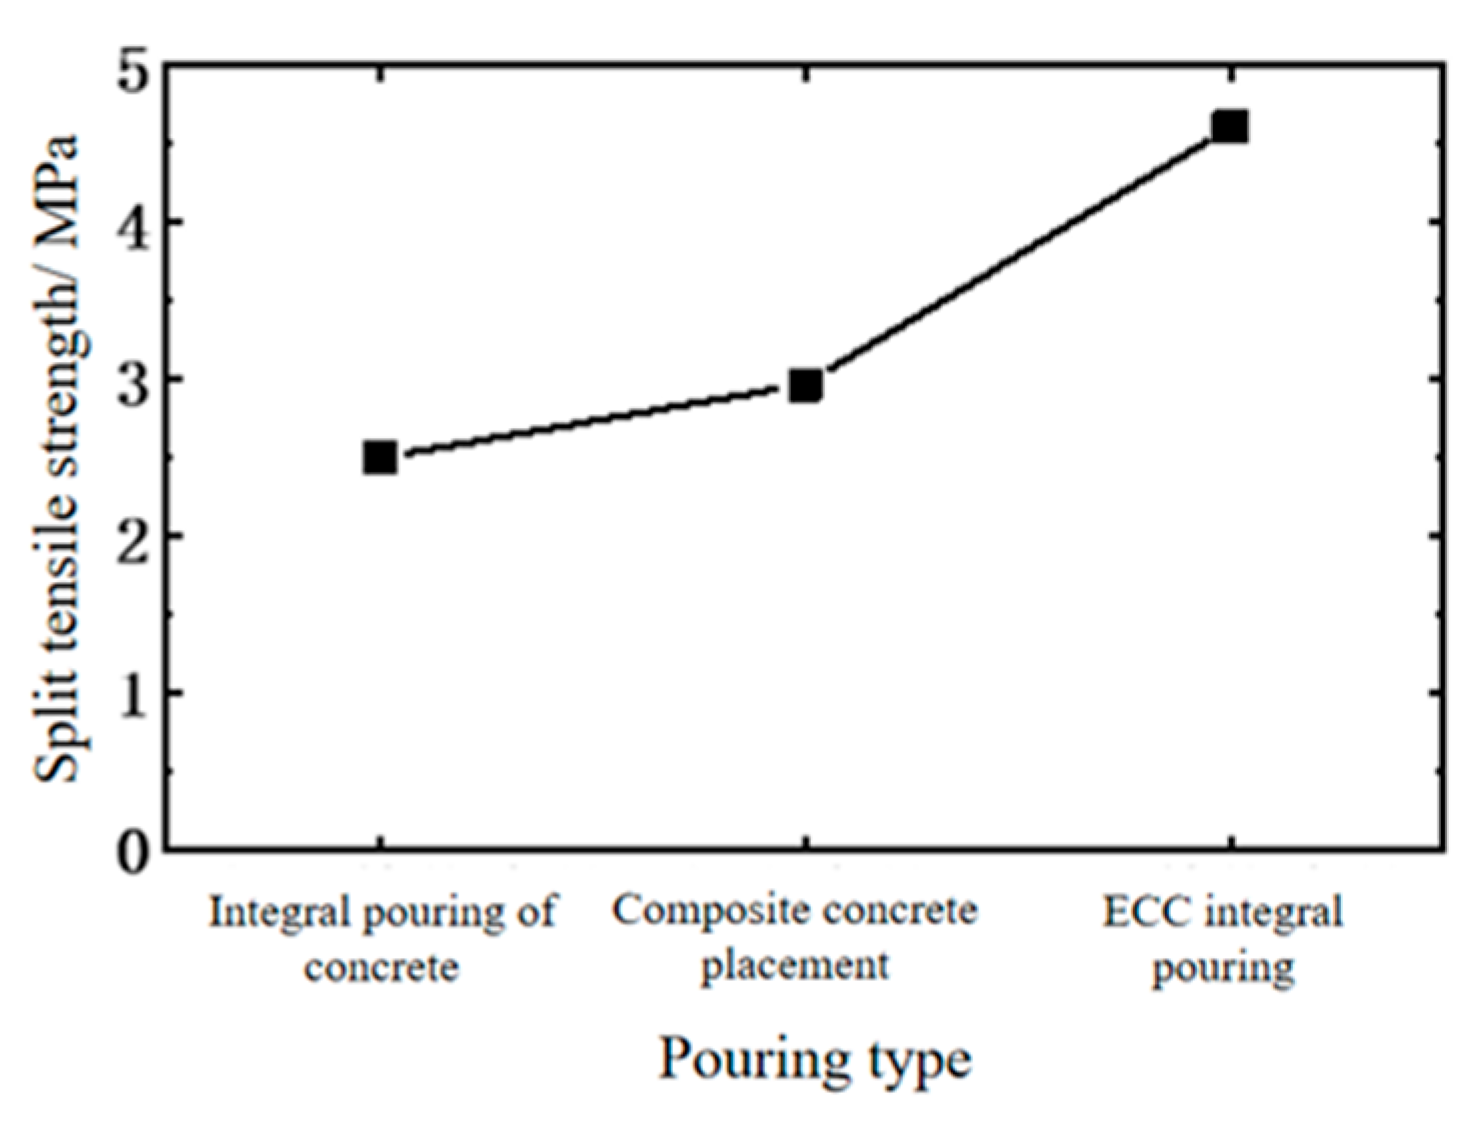
| Pouring Type | Splitting Tensile Strength/MPa |
|---|---|
| Integral concrete pouring | 2.50 |
| Composite pouring | 2.97 |
| ECC monolithic pouring | 4.18 |
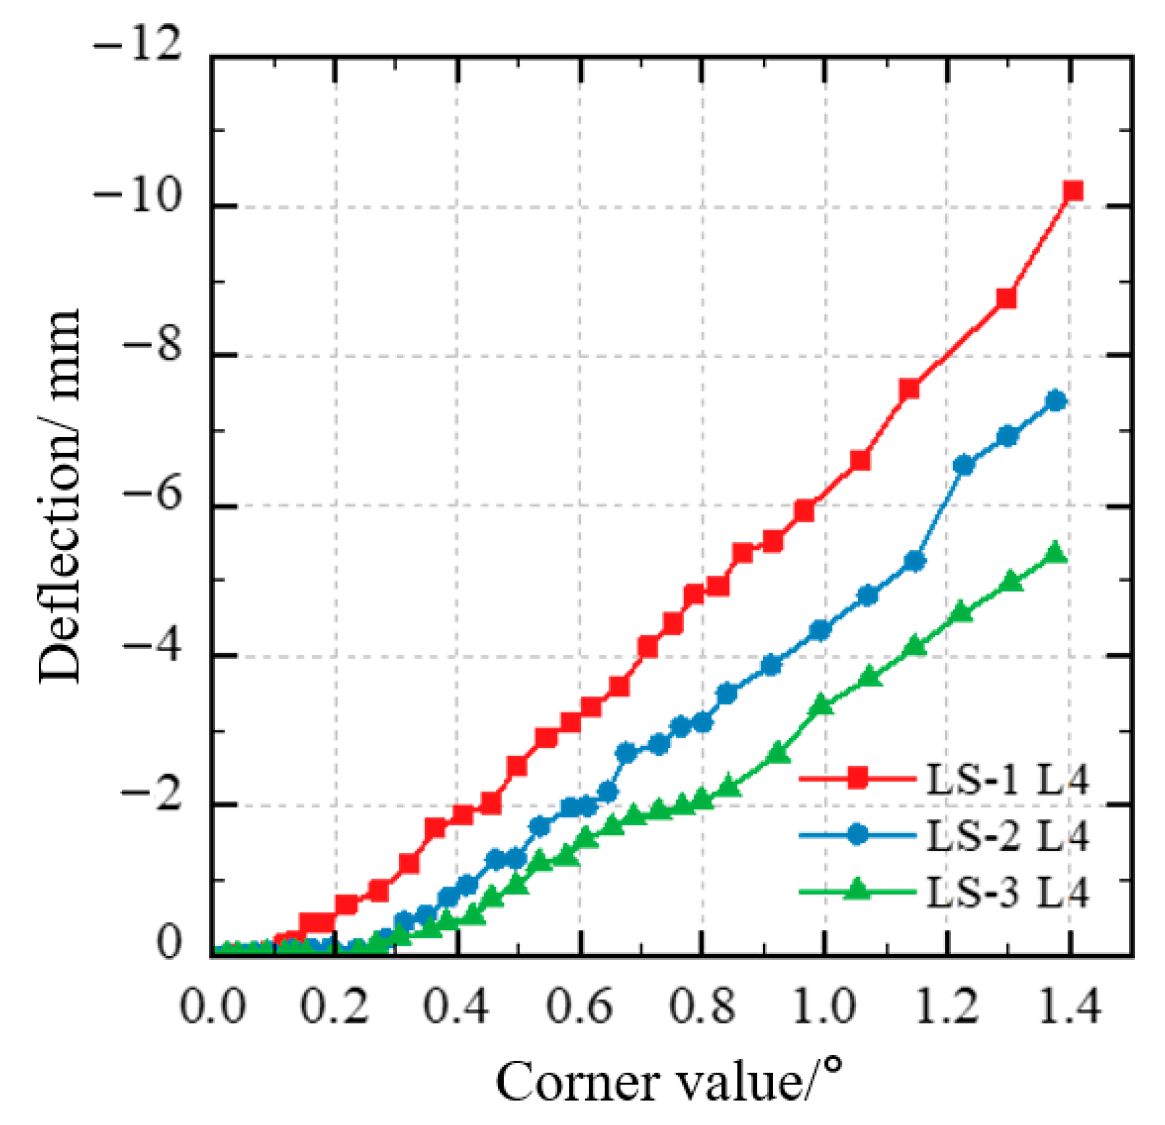
| Performance Index | LS-1 | LS-2 | LS-3 (ECC) | Regulatory Limits |
|---|---|---|---|---|
| Cracking load (°) | 0.183 | 0.194 | 0.267 | - |
| Design load crack width (mm) | 0.28 | 0.23 | 0.07 | ≤0.2 |
| 1.5 times load crack depth (mm) | 110 | 100 | 70 | ≤120 |
| Maximum deflection (mm) | 10.217 | 7.406 | 5.345 | L/600 = 8.3 |
| Maximum strain of reinforcement (με) | 2000 | 1200 | 950 | 2300 (Yield) |
Disclaimer/Publisher’s Note: The statements, opinions and data contained in all publications are solely those of the individual author(s) and contributor(s) and not of MDPI and/or the editor(s). MDPI and/or the editor(s) disclaim responsibility for any injury to people or property resulting from any ideas, methods, instructions or products referred to in the content. |
© 2025 by the authors. Licensee MDPI, Basel, Switzerland. This article is an open access article distributed under the terms and conditions of the Creative Commons Attribution (CC BY) license (https://creativecommons.org/licenses/by/4.0/).
Share and Cite
Wang, C.; Liu, R.; Wang, K.; Liang, Y.; Ning, Y. Mechanical Performance and Interfacial Bonding Mechanism of High-Performance ECC in Steel-Concrete Composite Link Slab in Simply Supported Bridges. Buildings 2025, 15, 2277. https://doi.org/10.3390/buildings15132277
Wang C, Liu R, Wang K, Liang Y, Ning Y. Mechanical Performance and Interfacial Bonding Mechanism of High-Performance ECC in Steel-Concrete Composite Link Slab in Simply Supported Bridges. Buildings. 2025; 15(13):2277. https://doi.org/10.3390/buildings15132277
Chicago/Turabian StyleWang, Chengquan, Rongyang Liu, Kangyu Wang, Yuhan Liang, and Yingjie Ning. 2025. "Mechanical Performance and Interfacial Bonding Mechanism of High-Performance ECC in Steel-Concrete Composite Link Slab in Simply Supported Bridges" Buildings 15, no. 13: 2277. https://doi.org/10.3390/buildings15132277
APA StyleWang, C., Liu, R., Wang, K., Liang, Y., & Ning, Y. (2025). Mechanical Performance and Interfacial Bonding Mechanism of High-Performance ECC in Steel-Concrete Composite Link Slab in Simply Supported Bridges. Buildings, 15(13), 2277. https://doi.org/10.3390/buildings15132277