Article

Risk Management in the Analysis of Failures of Protective Coatings in Municipal Sewage Treatment Plant Tanks

1
SIKA Poland Sp. z o. o., ul. Karczunkowska 89, 02-871 Warszawa, Poland
2
Faculty of Civil Engineering, Wroclaw University of Science and Technology, Wybrzeże Wyspiańskiego 27, 50-370 Wrocław, Poland
*
Author to whom correspondence should be addressed.
Buildings 2025, 15(13), 2254; https://doi.org/10.3390/buildings15132254
Submission received: 22 May 2025 / Revised: 15 June 2025 / Accepted: 23 June 2025 / Published: 26 June 2025

Abstract

Polyurea failures in reinforced concrete tanks, such as swimming pools and sewage treatment plants, require a thorough analysis of the causes of failures during renovation. Urban agglomerations are increasingly relying on these facilities for maintaining city functioning, and the increasing concentration of pollutants in these facilities necessitates urgent repairs due to frequent failures. More thorough analysis should be given to repeated failures on the same object or “twin” objects within a short period, causing high renovation costs and long shutdowns. The causes of failures can be found not only as a result of insufficient knowledge but also in a limited analysis of the entire project from the assumption phase to completion. The article analyzed water and sewage tanks on which failures of applied polyurea coatings occurred many times. The posteriori uses of the risk management analysis with the assessment of the impact and probability of occurrence of the planned activities that failed allows it to be applied a priori and treated as a necessary analysis. For this purpose, in selected repairs, those activities that had the greatest impact on failure and a relatively high probability of occurrence during implementation were distinguished from the entire project. Based on the risk management analysis, it was shown that the basic cause of the failure was the poor knowledge and insufficient experience of the entities performing the repairs, and the errors that occurred could be minimized by conducting good diagnostics of the facility, selecting professional designers and contractors, and constant monitoring of each important activity.

1. Introduction

According to [1,2], in the European Union, 26,523 wastewater treatment plants in Europe process wastewater from 447 million inhabitants and small industries that discharge into public sewers. This wastewater includes pharmaceutical residues, pesticides, nutrients, organic matter, microplastics, and hazardous substances. The researchers suggest that it is essential to figure out why, after decades of government action, the environmental condition of European streams is not meeting the needs of the European Water Framework Directive (WFD). In 1995, 1220 municipal sewage treatment plants were registered in Poland; the number at the end of 2022 was 3260 [3]. Considering that sewage treatment plants in large cities have even a dozen or so large tanks of each type, and correlating this with the total number of sewage treatment plants in Poland, this amounts to several dozen thousand tanks, each of which must be renovated cyclically every few years. Many publications [3,4,5,6] address the problems of urgently solving the growing demand for efficient sewage treatment plant infrastructure. Long-term water flows through sewage systems, pipelines, and tanks have a destructive effect, and failures due to wear and tear on the water and sewage infrastructure sometimes result in severe consequences. To prevent such situations, water and sewage infrastructure must be maintained in good technical condition. This involves cyclical renovations and restoring the original condition by reconstructing the defects in the concrete structure tissue and securing it by covering it with protective coatings. Maintenance procedures are costly, and the time of decommissioning of a given tank as part of the entire installation may disrupt the possibility of carrying out the statutory activities of waterworks. Therefore, the quality of works and the quality of materials used for the renovation of these structures should be selected in such a way as to ensure the most extended possible period of safe use until the next renovation. During the implementation of this type of investment, three different types of risks occur: cost overruns, extension of the renovation time, and reduction of the renovation quality [7,8]. The surfaces of concrete walls and bottoms of tanks for water, liquids, oils, etc., require increasingly better protection due to the increasing content of chemically aggressive substances in high concentrations. During the renovation of reinforced concrete tanks, failures of applied protective coatings occur. There is a clear connection between failures and negligence on the part of the people responsible for preparing the renovation of tanks. One of the reasons for this is the insufficient preparation of the planned renovation at the design level. One of the tools supporting the initial analysis of the renovation is risk management [7,9].

2. Positive Properties Expected from Polyurea Protective Coatings

Polyurea [10,11,12] extends the durability of the structure by protecting it from the increasing risk of corrosion [13]. Polyurea protects concrete and steel from broadly understood degradation, strengthens the surfaces of elements against static and dynamic loads, impact, abrasion, aging, shrinkage, scratching, the effect of harmful substances, long-term water exposure, as well as low and high and long-term and short-term temperature jumps, and is applied to almost every type and shape of surface [14]. It has high tensile and tear strength; it is flexible and simultaneously rigid, waterproof, and rough and yet appropriately smooth, friendly for the environment, used in cases of required hygiene, and accepted by living organisms from small to large. It is resistant to UV radiation, relatively cheap, and can be applied in various colors. It covers large substrate areas without caverns, gaps, discontinuities, etc.
The substrate prepared for application should generally be stable, clean, dry, evenly smooth, homogeneous, and free from substances that weaken adhesion, i.e., oil or grease, loose particles, dust, chlorides, and cement paste layers, with appropriate resistance to exposure conditions and having the proper temperature and humidity [15]. The substrate should be characterized by low scratching, low share of dust fractions in the grain size, demonstrated adhesion capacity, appropriate roughness, a minimum degree of carbonation and corrosion of concrete and steel, and chemical resistance [16,17]. Polyurea that is not adequately applied or used is at risk of losing its mechanical properties, such as tightness, continuity, adhesion to the substrate, resistance to static and dynamic mechanical, chemical, and thermal loads, and aesthetic values [18,19].
Flaking, peeling, detachment, blistering, perforation, color change, cracks, and microcavities on the surface are visible elements of polyurea degradation, indicating a decrease in the expected resistance to external factors.
The most common causes of damage to polyurea coatings from the substrate are the excessive presence of water in the concrete base; too high a share of dusty aggregate in the concrete; improperly prepared substrate for application, e.g., with many caverns, etc.; the polyurea type not adapted to external impacts; poor conditions during application regarding temperature, humidity, dust, and lighting; and execution errors during the application itself, such as malfunctioning technical equipment or unqualified technical personnel [10,11].
However, one of the primary sources of poor results of repair projects is the selection of an inappropriate contractor [7] due to simplified criteria for selecting offers for the lowest price, which can result in inadequate work [12]. This increases the number of complaints and court disputes [20]. The criteria for selecting an appropriate contractor [21] include, among others, such requirements as recognition of the financial situation, technical and equipment capabilities, the company’s experience in implementing investments of a given type, the length of the company’s activity, recommendations, company management skills, and technical staff.

3. Design Activities Subject to the Possibility of Errors During Renovation Work

In the search for perfect project management models [22], those that practically enable risk assessment are selected. Among the many activities determining the cost, time, and quality of polyurea application works, those listed in Table 1 were subjected to risk management analysis.
The case of renovation of concrete surfaces of liquid tanks in sewage treatment plants with repeated failure of protective coatings was considered. The project’s duration, the repair’s total cost, and the final renovation’s quality create a “triangle” of essential parameters in the planned investment, i.e., time, cost, and quality [23]. This “triangle” can be extended to include other elements, such as the scope of planned works completed at the end of the construction works and the resources used to perform the repair works. Then, the model would increase from a three-stage to a five-stage model, which would complicate the calculations included in risk management.
The activities arranged in the order of occurrence during the project are designated A1, A2, A3, A4, A5, A6, A7, A8, A9, A10, and A11 in Table 1. The designation with a capital letter and the index a, b, c, etc., e.g., “A1a”, includes remedial activities that reduce the risk of failure during subsequent repairs. The following part of the article references the factors listed in the activity. For the proper interpretation of the risk assessment during the implementation of a given project, the activities were considered according to two parameters, i.e., the impact “I” of errors in a given activity and the probability “P” of its occurrence in the entire project. For each of these factors, the impact matrices “I” of the probability “P” were prepared, and the total impact “P” and “I” were calculated, i.e., “P/I”, indicating more precisely the degree of risk occurrence [7,8,24]. The relevant analyses concerning risk management are presented in Section 5.

4. Examples of Failures in Tank Renovation Using Polyurea Coatings

Many publications describe cases of detachment of the polyurea coating from the substrate [10,11,25,26,27,28]. Polyurea applications to the bottom and walls of repaired sewage tanks sometimes fail. There are many reasons for the failure of protective coatings; this article presents some of them, linking them to the most important activities performed during the entire repair, from diagnosis to successful facility commissioning. These activities, numbered from (Table 1), occurred as significant in the described failures, and for them, a risk management analysis was carried out, which should be applied to each described case. The analysis results are also repeated later in the article and included in Tables 7–9.

4.1. Reinforced Concrete Tank in a Sewage Treatment Plant of a Large City

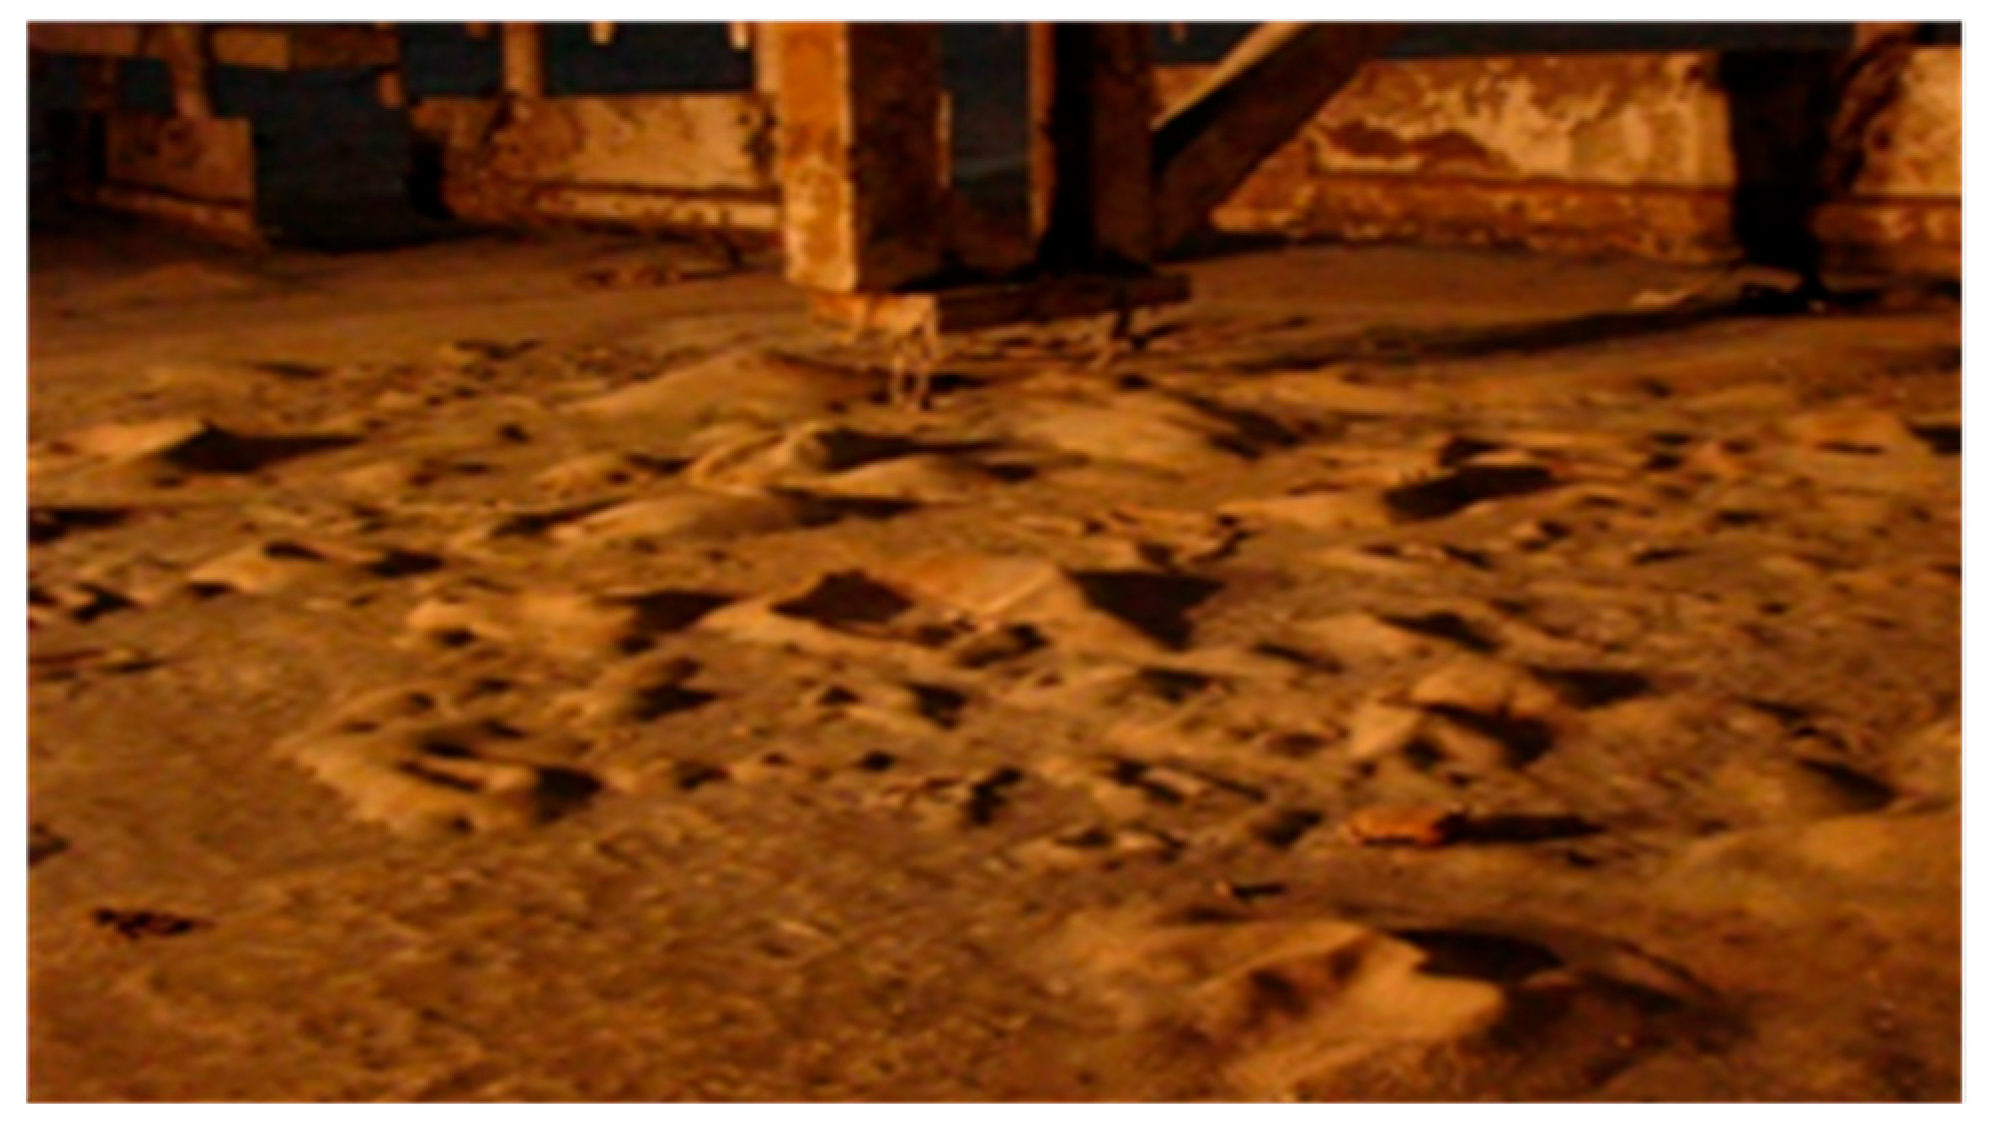
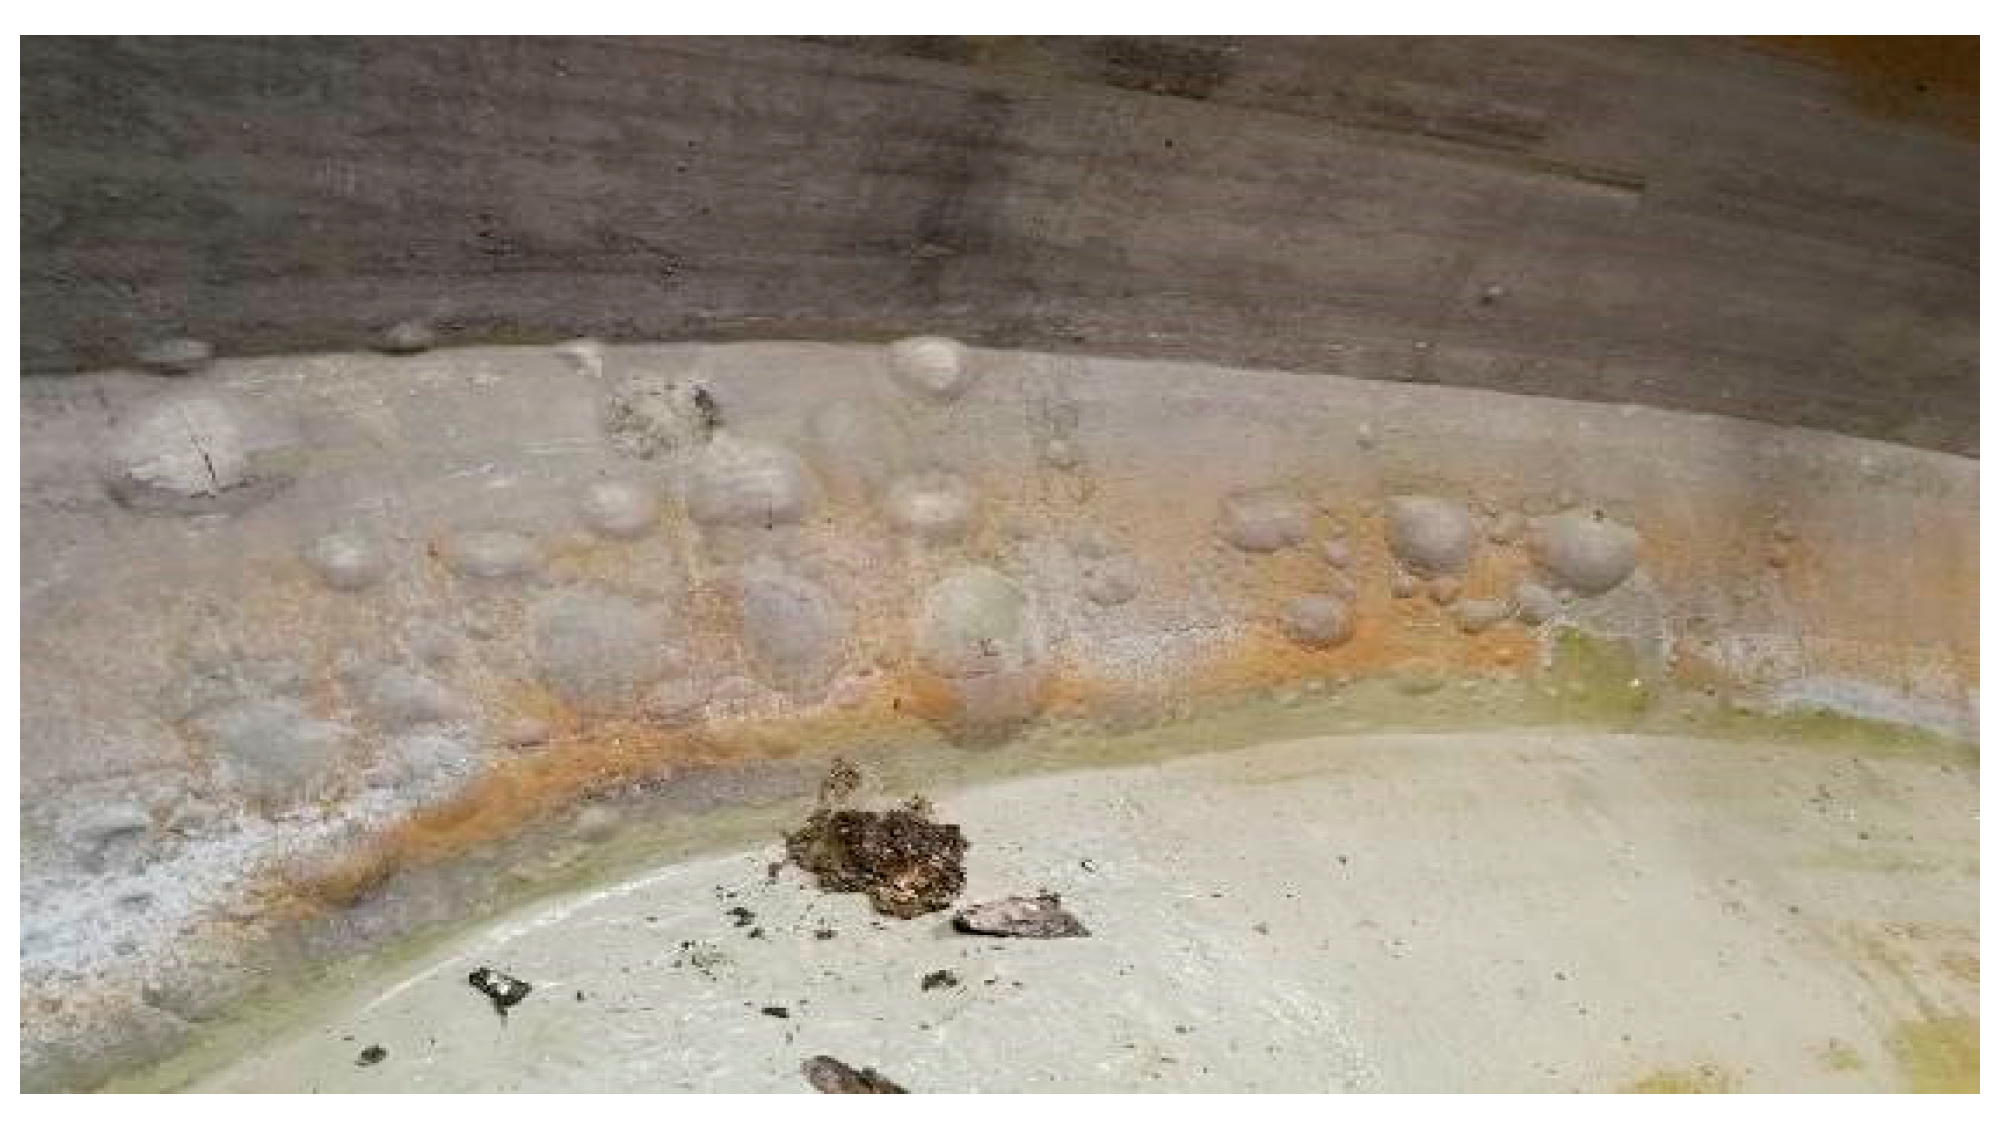
Coatings applied to substrates exposed to chemical attack are susceptible to corrosion [29,30]. The municipal sewage tank in a large city in Poland shown in Figure 1 was repaired three times. The leading cause of failure was the formation of osmotic and diffusion bubbles on the entire inner surface of the bottom and vertical walls of the tank due to excessive moisture accumulated on them (Figure 2). In the discussed case, all activities took place, contributing to increased costs “C”, extended repair time “T”, and reduced quality “Q”. The repairs performed several times had their epilogue in court, where the owner of the facility demanded reimbursement of the incurred costs from the contractor. The description of defects in the project implementation refer to the activity, the numbering of which is included in Table 1.
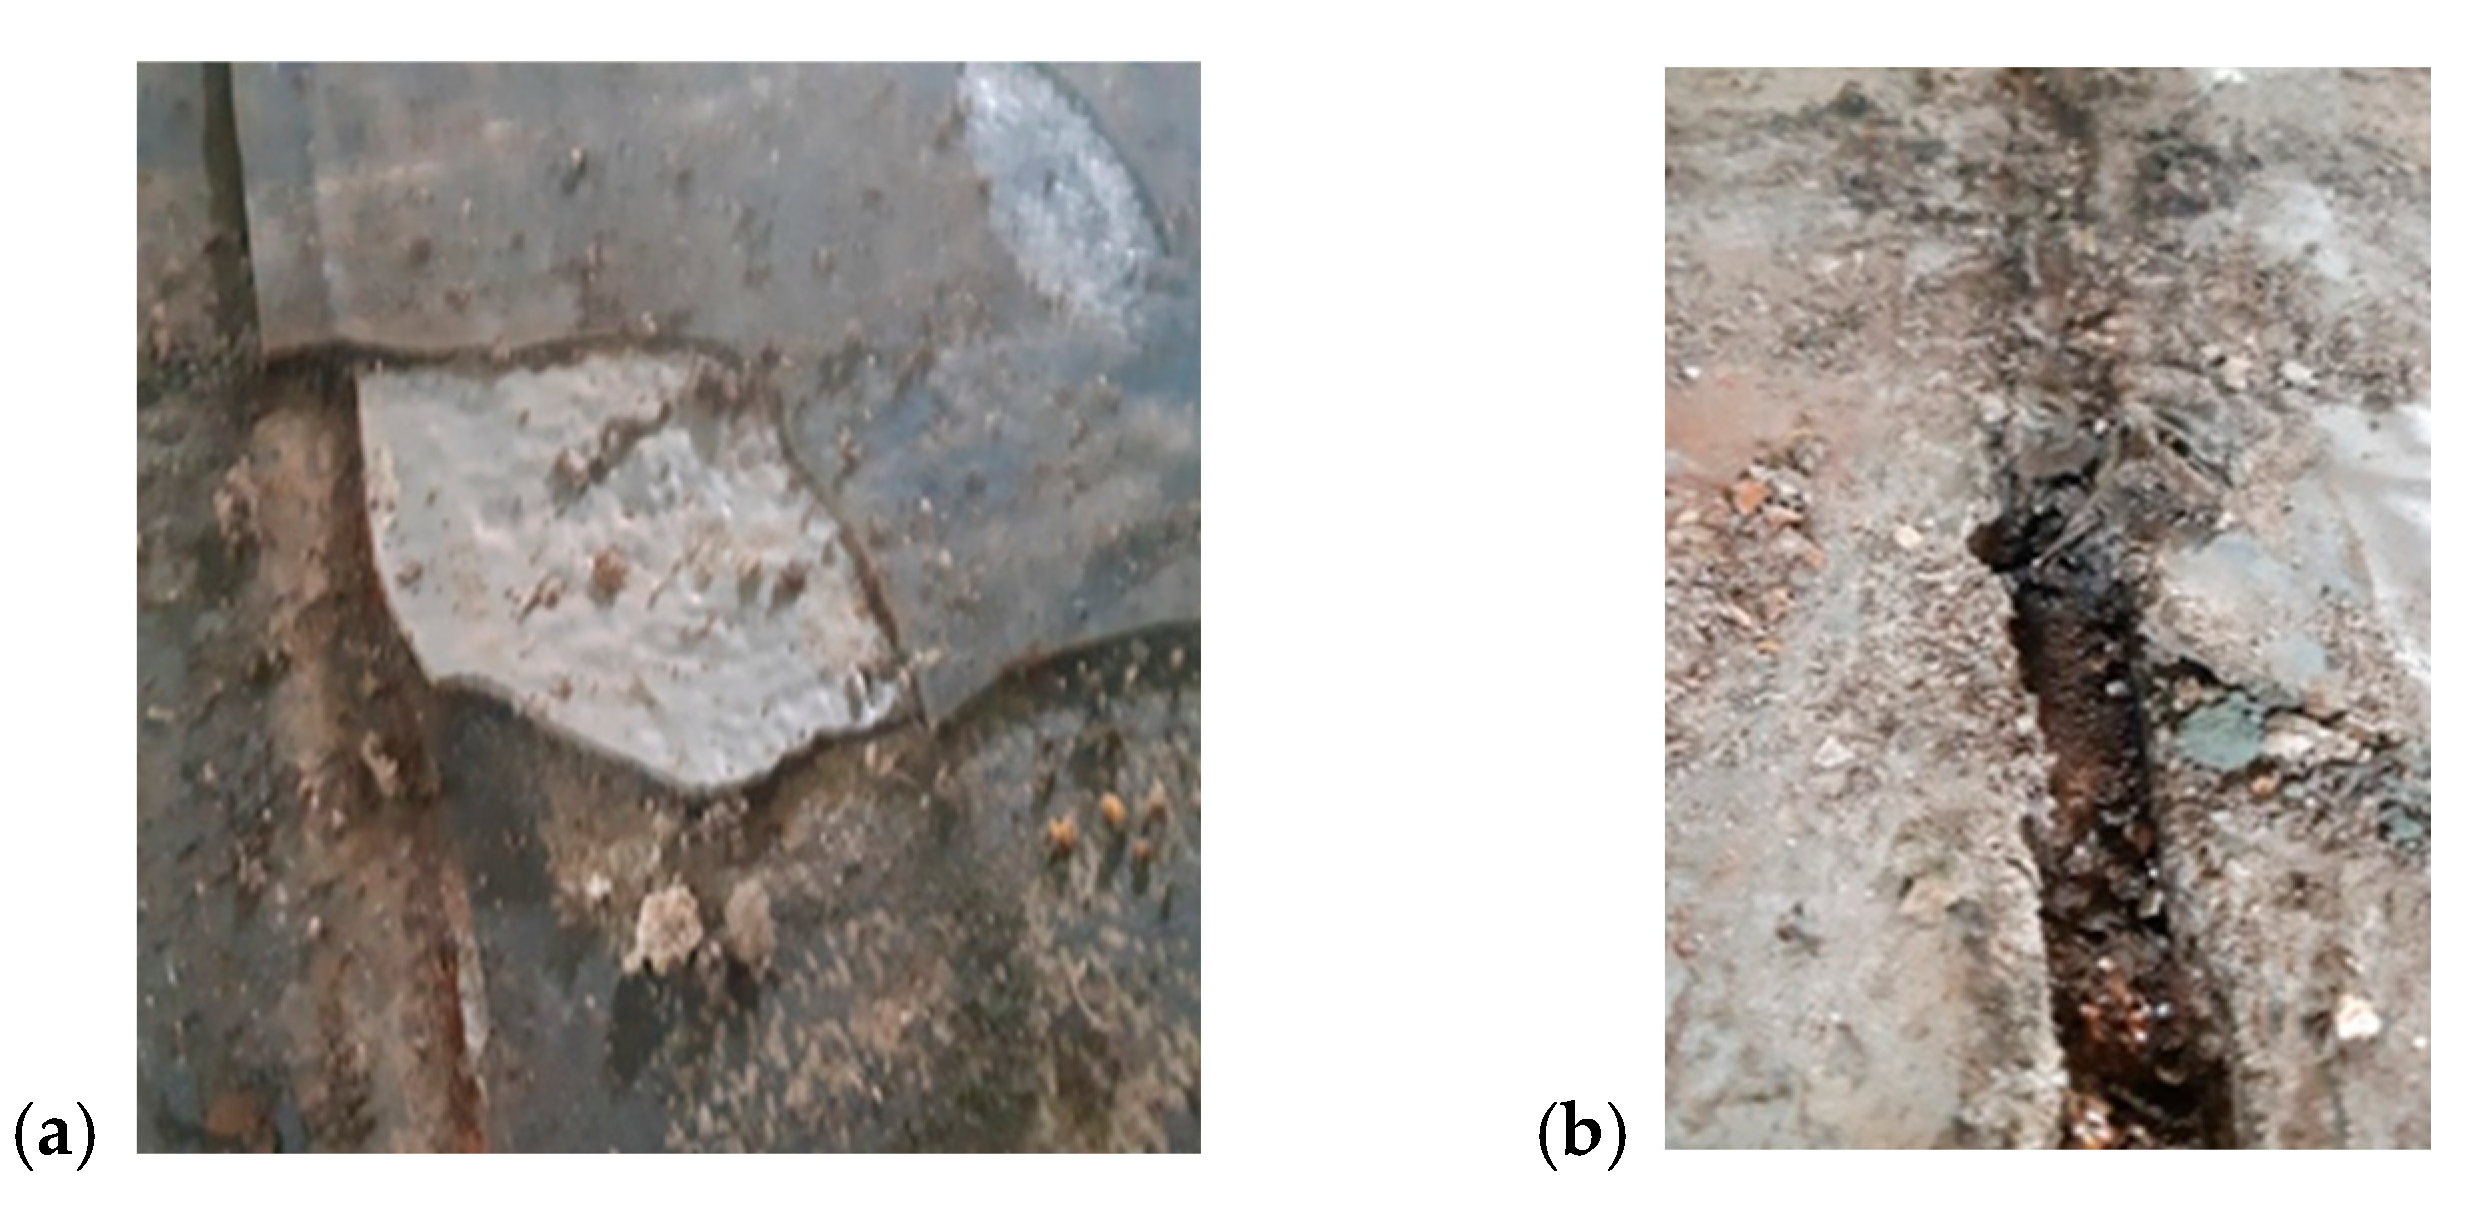
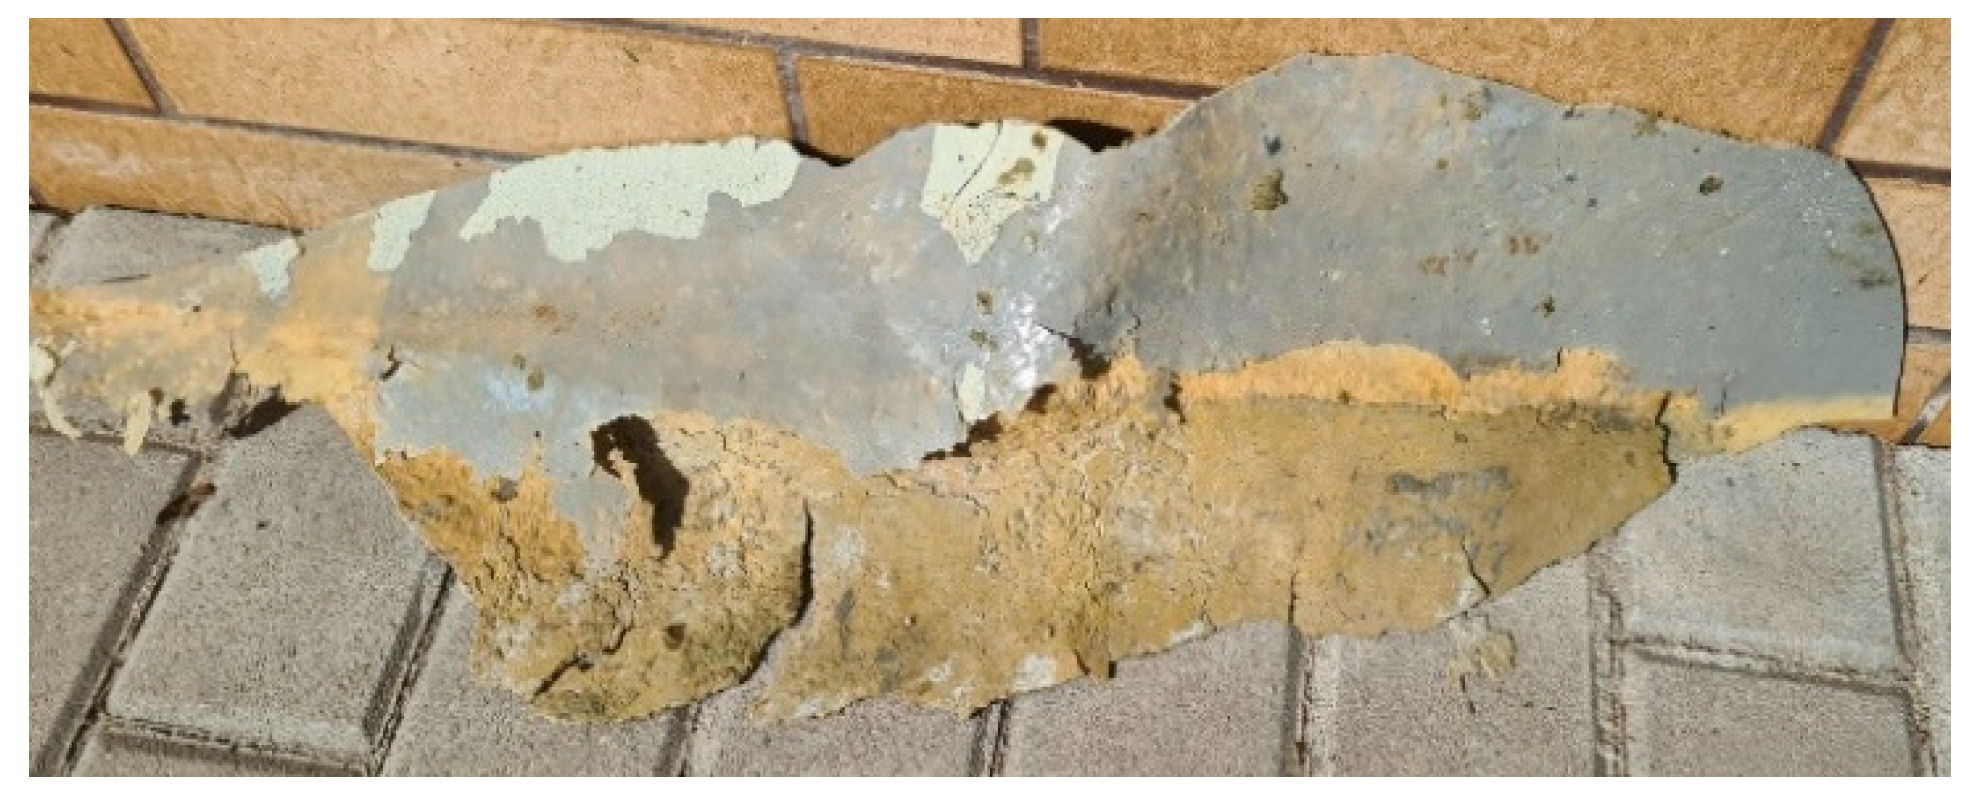
The repair works were not preceded by a thorough tank diagnostic (A1). Lack of constant investor supervision (A11), errors in assumptions at the planning and creation stage (PFU) (A3), selection of an inappropriate contractor (A9) performing renovation works according to a poorly prepared project (A3, A6), preparation by an incomplete designer (A5), and incorrect adoption renovation method (A7) resulted in many defects. The concrete substrate for polyurea application was not well prepared, and the surface was uneven, with protruding aggregate grains and numerous places covered with cement laitance. The expansion joints in the bottom of the tank were fabricated carelessly, the concrete was constantly wet, and groundwater filtered through the expansion joints and structural cracks in the bottom and walls due to the lack of waterproofing under the bottom slab (Figure 3b). The concrete had low compressive and tear-off strength; it contained too large a fraction of the dusty part in the aggregate. During the application of the polyurea coating, the air was too rich in dust (chlorides) and moisture, the coating had variable thickness, in many places it was semi-permeable, and the type of polyurea used did not meet the chemical and mechanical requirements. The subsequent coating was applied several times to the blisters that appeared after a few days (Figure 3a). The mineral base used for polyurea became a semi-permeable membrane, which, together with the high dust deposited on the base and with the tight polyurea coating, was the initiator of osmosis and diffusion. There was repeated separation of the primer from the substrate and polyurea from the primer. (Figure 4). The contractor did not have the appropriate experience in applying polyurea (A9), prepared the surface incorrectly, used uncalibrated technical equipment, and ignored the conditions of coating conditions, dust, and temperature. He was limited in time during the repair (A2) and did not perform all the design activities. The selected repair technology and the chosen polyurea coating, primer, and filler to level the cover were substandard for the application (A6, A3). After the first repair and the appearance of osmotic and diffusion bubbles, the contractor tried to repair the surface by removing the bubbles and re-applying polyurea with better chemical strength parameters (Figure 3a).
However, after this repair, osmotic bubbles appeared again. Inactive and inexperienced investor supervision (A11), which did not respond to subsequent failures of the polyurea, caused the coating to separate from the substrate twice and led to the main mixer breaking off in the sludge tank (Figure 1 and Figure 2). As a result, the renovation work was extended by over 6 months (A10). The renovation costs doubled (A4). At each stage of the listed activities A1–A11, it was possible to intervene in the repair project, but no appropriate risk assessment analysis was carried out.
Only the final repair, in which ongoing control and monitoring of all activities A1–A11 were applied, a specialist contractor was hired, an active initial diagnostic was performed, and the Xolutec® repair technology was used, was completed successfully.

4.2. Municipal Sewage Tank in the District Town

In the municipal sewage tank shown in Figure 4, the polyurea layer became detached due to the appearance of osmotic bubbles. The tank was often repaired using flexible and rigid protective coatings through local and large-scale coating replacements.
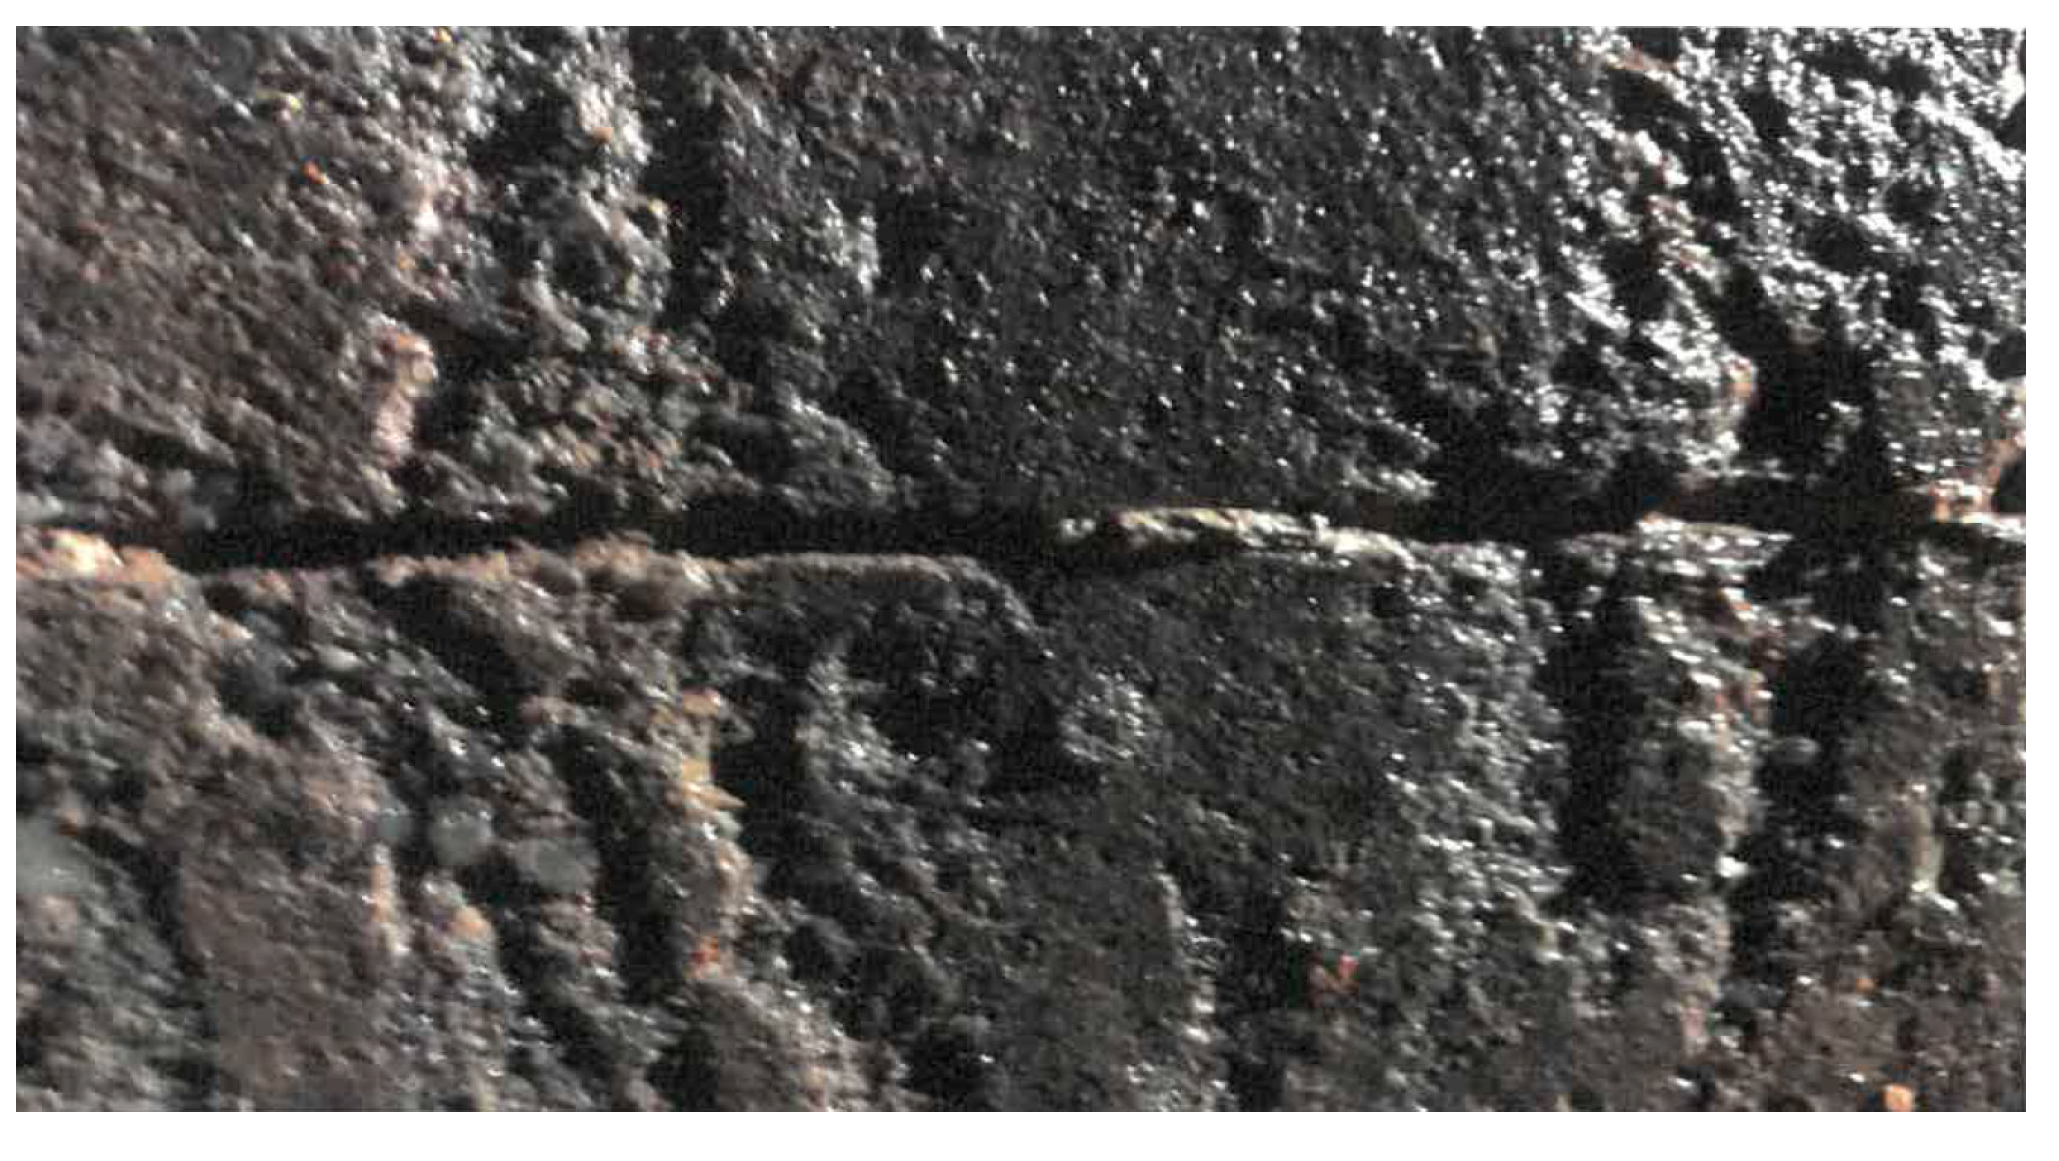
The leading cause of coating failure was the excessive moisture of the walls and bottom of the tanks, unrecognized in the diagnoses and technological designs (A1, A3, A5), caused by the penetration of the tank by rainwater and groundwater through cracks and fissures in the bottom and walls (Figure 5), which were without external waterproofing. Osmotic bubbles appeared not only under the polyurea layer itself but also between the polyurea and the bonding layer and between the bonding layer and the repair putty applied to the concrete cover (Figure 6). The execution errors were the same as in the case described earlier. In this case, a critical element that made the renovation difficult was the short allocated time (A8), which was only possible during technological breaks. Another vital mistake was the selection of a contractor (A9), who offered to complete the work quickly and minimize costs. During the renovation, the technical conditions for construction work were difficult. The tank chamber was insignificant; excessive chloride dust and excessively high air humidity in the tank caused tiny drops of concentrated liquid to settle under the polyurea, which contributed to the initiation of osmosis. Due to the lack of required experience in the application of polyurea by subsequent contractors (A9), the same repair errors repeated many times did not make the user think twice about subjecting the tank to a thorough diagnosis by trained specialists (A11, A5). Also, no risk management analysis was conducted, which would have allowed for earlier correction of assumptions. Only the increase in the chemical concentration of sewage forced the user to use a complete the repair project prepared by an experienced designer and to establish constant monitoring by an authorized and skilled investor to supervise all repair activities.

5. Risk Management

5.1. Probability Matrix and Impact Matrix on Cost, Time, and Quality

There is a close relationship between risk management and successful investment implementation [31]. Risk management systems for large projects and risk mitigation methods generate large-scale savings [32]. Despite the considerable impact that risk management has on investment efficiency and the implementation of a system or process, they are not widely used in the construction industry.
KPMG, in its study [33], showed that over 50% of all investors reported one or more projects underperforming in the analyzed accounting period. In the public sector, a surprisingly high project failure rate of as much as 90% was noted [32]. One of the primary sources of poor project performance is the selection of an inappropriate contractor due to simplified bid selection criteria limited to the lowest price. This means the commonly used contractor selection processes are largely ineffective [9,12]. The selection of an inappropriate contractor results in delays in the planned investment and cost overruns, and it multiplies the problems associated with additional complaints, litigation, etc. [34,35].

5.2. The Most Important Types of Risk

According to KPMG [33], over 25% of all projects were completed in a time exceeding the initially assumed duration, by 10%. According to [32], cost overruns are rampant, and only 1/3 of projects are completed within the planned costs. A significant risk factor is the reduced quality of the work performed.
The risk [7] of reduced quality should be treated as an independent variable in relation to exceeding the budget as well as in relation to extending the investment implementation time, because its effects can be observed regardless of the occurrence of the other one variables. However, on the other hand, these aspects are closely related, and very often, implementing remedial actions aimed at counteracting the threat of reduced quality affects both the increase in investment costs and delays in handing over the facility for use. When designing the entire course of the investment process, several activities that significantly impact the implementation time, implementation costs, and quality of the investment in question are analyzed. Time, cost, and quality form a “triangle” of necessary probes in planning and carrying out investment works; sometimes, an additional distinguishing feature is the planned scope of construction works.

5.3. Correlation Between Risk Factors and Their Individual Types—Risk Assessment

Each of the design activities in the perspective of their impact on investments, and in particular on cost “C”, time “T”, and quality “Q”, has a more minor or more significant impact and also a different probability of occurrence in the entire design process. In particular, the consequences of the impact and the probability of occurrence of activities performed incorrectly are considered. The degree or scope of such impact “I” on the investment and the probability “P” of occurrence of each of the eleven factors mentioned can be described verbally and assigned numerical values in the form of a single-column matrix “I” and “P” as presented in Table 2 and Table 3, developed by [31]. However, the numerical values of both single-column vectors, impact and probability, can be chosen according to one’s own experience. It is assumed that the usually considered impact of an incorrectly performed activity and the probability of its occurrence are independent variables, with the “P” and “I” representing them. This product is the “P/I” matrix. For the proper interpretation of the risk assessment during the implementation of a given project, the probability of occurrence and the impact of defective activities on cost, time, and quality can be considered separately but also together.
The elements of the probability vector of the occurrence of an incorrect action separately for costs C p   ( i = 1.5 ) , for time T p   ( i = 1.5 ) , and for quality Q p   ( i = 1.5 ) take values from the set [0.1; 0.3; 0.5; 0.7; 0.9] (Table 2).
The elements of the impact vector of the occurrence of an incorrect action separately for C i   ( i = 1.5 ) , T i   ( i = 1.5 ) , and Q i   ( j = 1.5 ) take values from the set [0.05; 0.1; 0.2; 0.4; 0.8] (Table 3) or each incorrectly performed action, A1 to A11 (Table 1); numbers were assigned from the probability vector and from the impact vector, which estimate its share in the entire project.
These above values are placed later in this article in Table 7 Summary where from Table 2 and Table 3 are shown columns corresponding to actions and rows concerning the probability or impact for each reference to cost, time, and quality. These numbers refer to the situation from the first repair, where high risks were estimated. The last, effective repair was estimated at a lower level of probability and impact. Several remedial actions were taken before the second repair, which was also ineffective, estimated as average values.
These two-number—(parameter) vectors related to probability and impact are marked by adding the index “p” for the project and the index “i” for the impact and so on for the cost C p C i T , for the time T p T i T , and for the quality Q p Q i T . The product of these two vectors, e.g., C p j ;   j = 1.5 ) and C i j ;   j = 1.5 ) , being their conjunction, is the composition of “P/I” of two probability and impact vectors and can be written in the form for costs C p i i , j = C p ( i ) × C i j T , for time T p i i , j = T p ( i ) × T i j T , and for quality Q i , j = Q p ( i ) × Q i j T , where i, j = 1.5. This matrix is presented in Table 4. The matrix term values in Table 4 are compared with the limit values according to Table 5.
The presented calculations concern the risk assessment for individual activities separately for cost, time, and quality.
It is possible to link together the collected information on the negative impact of the activity in question on cost, time, and quality and use one number representing the overall risk level, combining the exceedance of cost, time, and quality.
Table 6 classifies the failure risk levels and indicates the need for remedial work.
Therefore, to obtain an overall assessment of the threat from a given factor, it is necessary to perform the “composition of costs, time, and quality” and calculate the algebraic sums of the vectors for the individual factors. The total Composition of Critical to Quality (CTQ) is expressed as
Σ C T Q p ;   Σ C T Q i T = [ C p ;   C i T + T p ;   T i T + Q p ;   Q i T ]
which simplifies to
C p + T p + Q p T ;   C i + T i + Q i T
Subsequently, the resultant value, denoted as the Composition (CTQ), is calculated using the following formula:
C o m p o s i t i o n C T Q = ( Σ p r o b a b i l i t y ) 2 + ( Σ i m p a c t ) 2
Then,
C o C T Q = C o m p o s i t i o n C T Q = ( Σ C T Q p ) 2 + ( Σ C T Q i ) 2
It is also possible to calculate an average for all the Co(CTQ) calculated in this way for each activity from A1 to A11 and compare these averages at each stage of improving the planned component activities. The values of these numbers related to “P/I” for the considered failures are presented in Table 7 in the row marked “P/I” and repeated in Table 8.
High values of these numbers for the matrices C p i   ( i , j ) , T p i i , j , and Q p i   ( i , j ) for each of the activities A 1 t o A 11 having negative effects on the project indicate the level of risk and should be classified according to Table 7, and appropriate steps should be taken to improve the situation if necessary.
These calculations were performed for the failures in question and are presented in Table 9, where the final values of the failure index are presented in the Co(CTQ) columns, for maximum and average values for “P” and “I”. The last column of Table 10 presents the values of Co(CTQ) index for the minimum values for “P” and “I”.
The results of the calculations of this parameter can be compared according to Table 9, and the degree of risk for a given activity can be assessed.
For each of the studied cost, time, and quality parameters characterizing the repair projects (including the application of new protective coatings) of concrete bottom and wall surfaces, a common matrix “P/I” is calculated for the probability “P” and for the impact “I”, as shown in Table 7 and Table 8.
For example, in the event of a delay—an extension of the time of tank repair work—the risk assessment may increase costs to a level requiring a decision to perform additional diagnostics. Delays in the execution of work and increased costs may result in decreased quality. Therefore, in a situation where an increase in risk is expected, ongoing monitoring of the activities performed should be intensified.
The summary of the overall risk assessments for all factors considered before implementing the risk management program and after implementing corrective actions against these actions can be compared in detail or in general, e.g., by calculating the average of all Composition (CTQ) numbers for A1 to A11.
Table 7 contains the numerical values of the impact “I” and probability “P” and the numerical values of the probability/impact “P/I”. These are assigned to activities A1–A11 (Table 1) separately for cost, time, and quality. These numbers are consistent with the estimation related to the state of the sewage tank in three phases, from the most significant errors, through the average resulting from the implementation of remedial actions, to their elimination, when the complete monitoring of each activity was implemented, which finally proved effective.
The corresponding calculations are shown in Table 7, Table 8 and Table 9, e.g., for activity A1, for costs the impact factor is C i = 0.4 , for probability it is C p = 0.5 , for time the impact factor is T i = 0.8 , for probability of occurrence it is T p = 0.7 , for quality the impact factor is Q i = 0.8 , and for probability it is Q p = 0.9 . The simultaneity factor “P/I” is, for costs C p i = 0.2 , for time T p i = 0.56 , and for quality Q p i = 0.72 . These values exceed the limits of Table 5. The total average risk index is C o m p o s i t i o n C T Q = 2.9 .
The third repair, during which all the countermeasures described in Table 1 in rows marked A 1 c , A 2 b , A 3 b , etc., were implemented, resulted in a decrease in the values of the impact and probability coefficients, and so C i = 0.1, C p = 0.1, T i = 0, T p = 0.3, Q i = 0.1, Q p = 0.1, C p i = 0.03, T p i = 0.03, and Q p i = 0.01 The total average risk index is C o m p o s i t i o n ( C T Q ) = 1.04.
It is also possible to compare the average of all Composition values (CTQ), and so their values decrease by applying remedial actions successively from “average Co(CTQ)” = 3.10; 1.72; 1.02.
The calculations presented in Table 7 and Table 8 show that without the application of risk management principles, each of the analyzed factors poses a high risk to the final result of the investment process, but when these principles are considered and applied in almost every case, this risk is reduced to low.
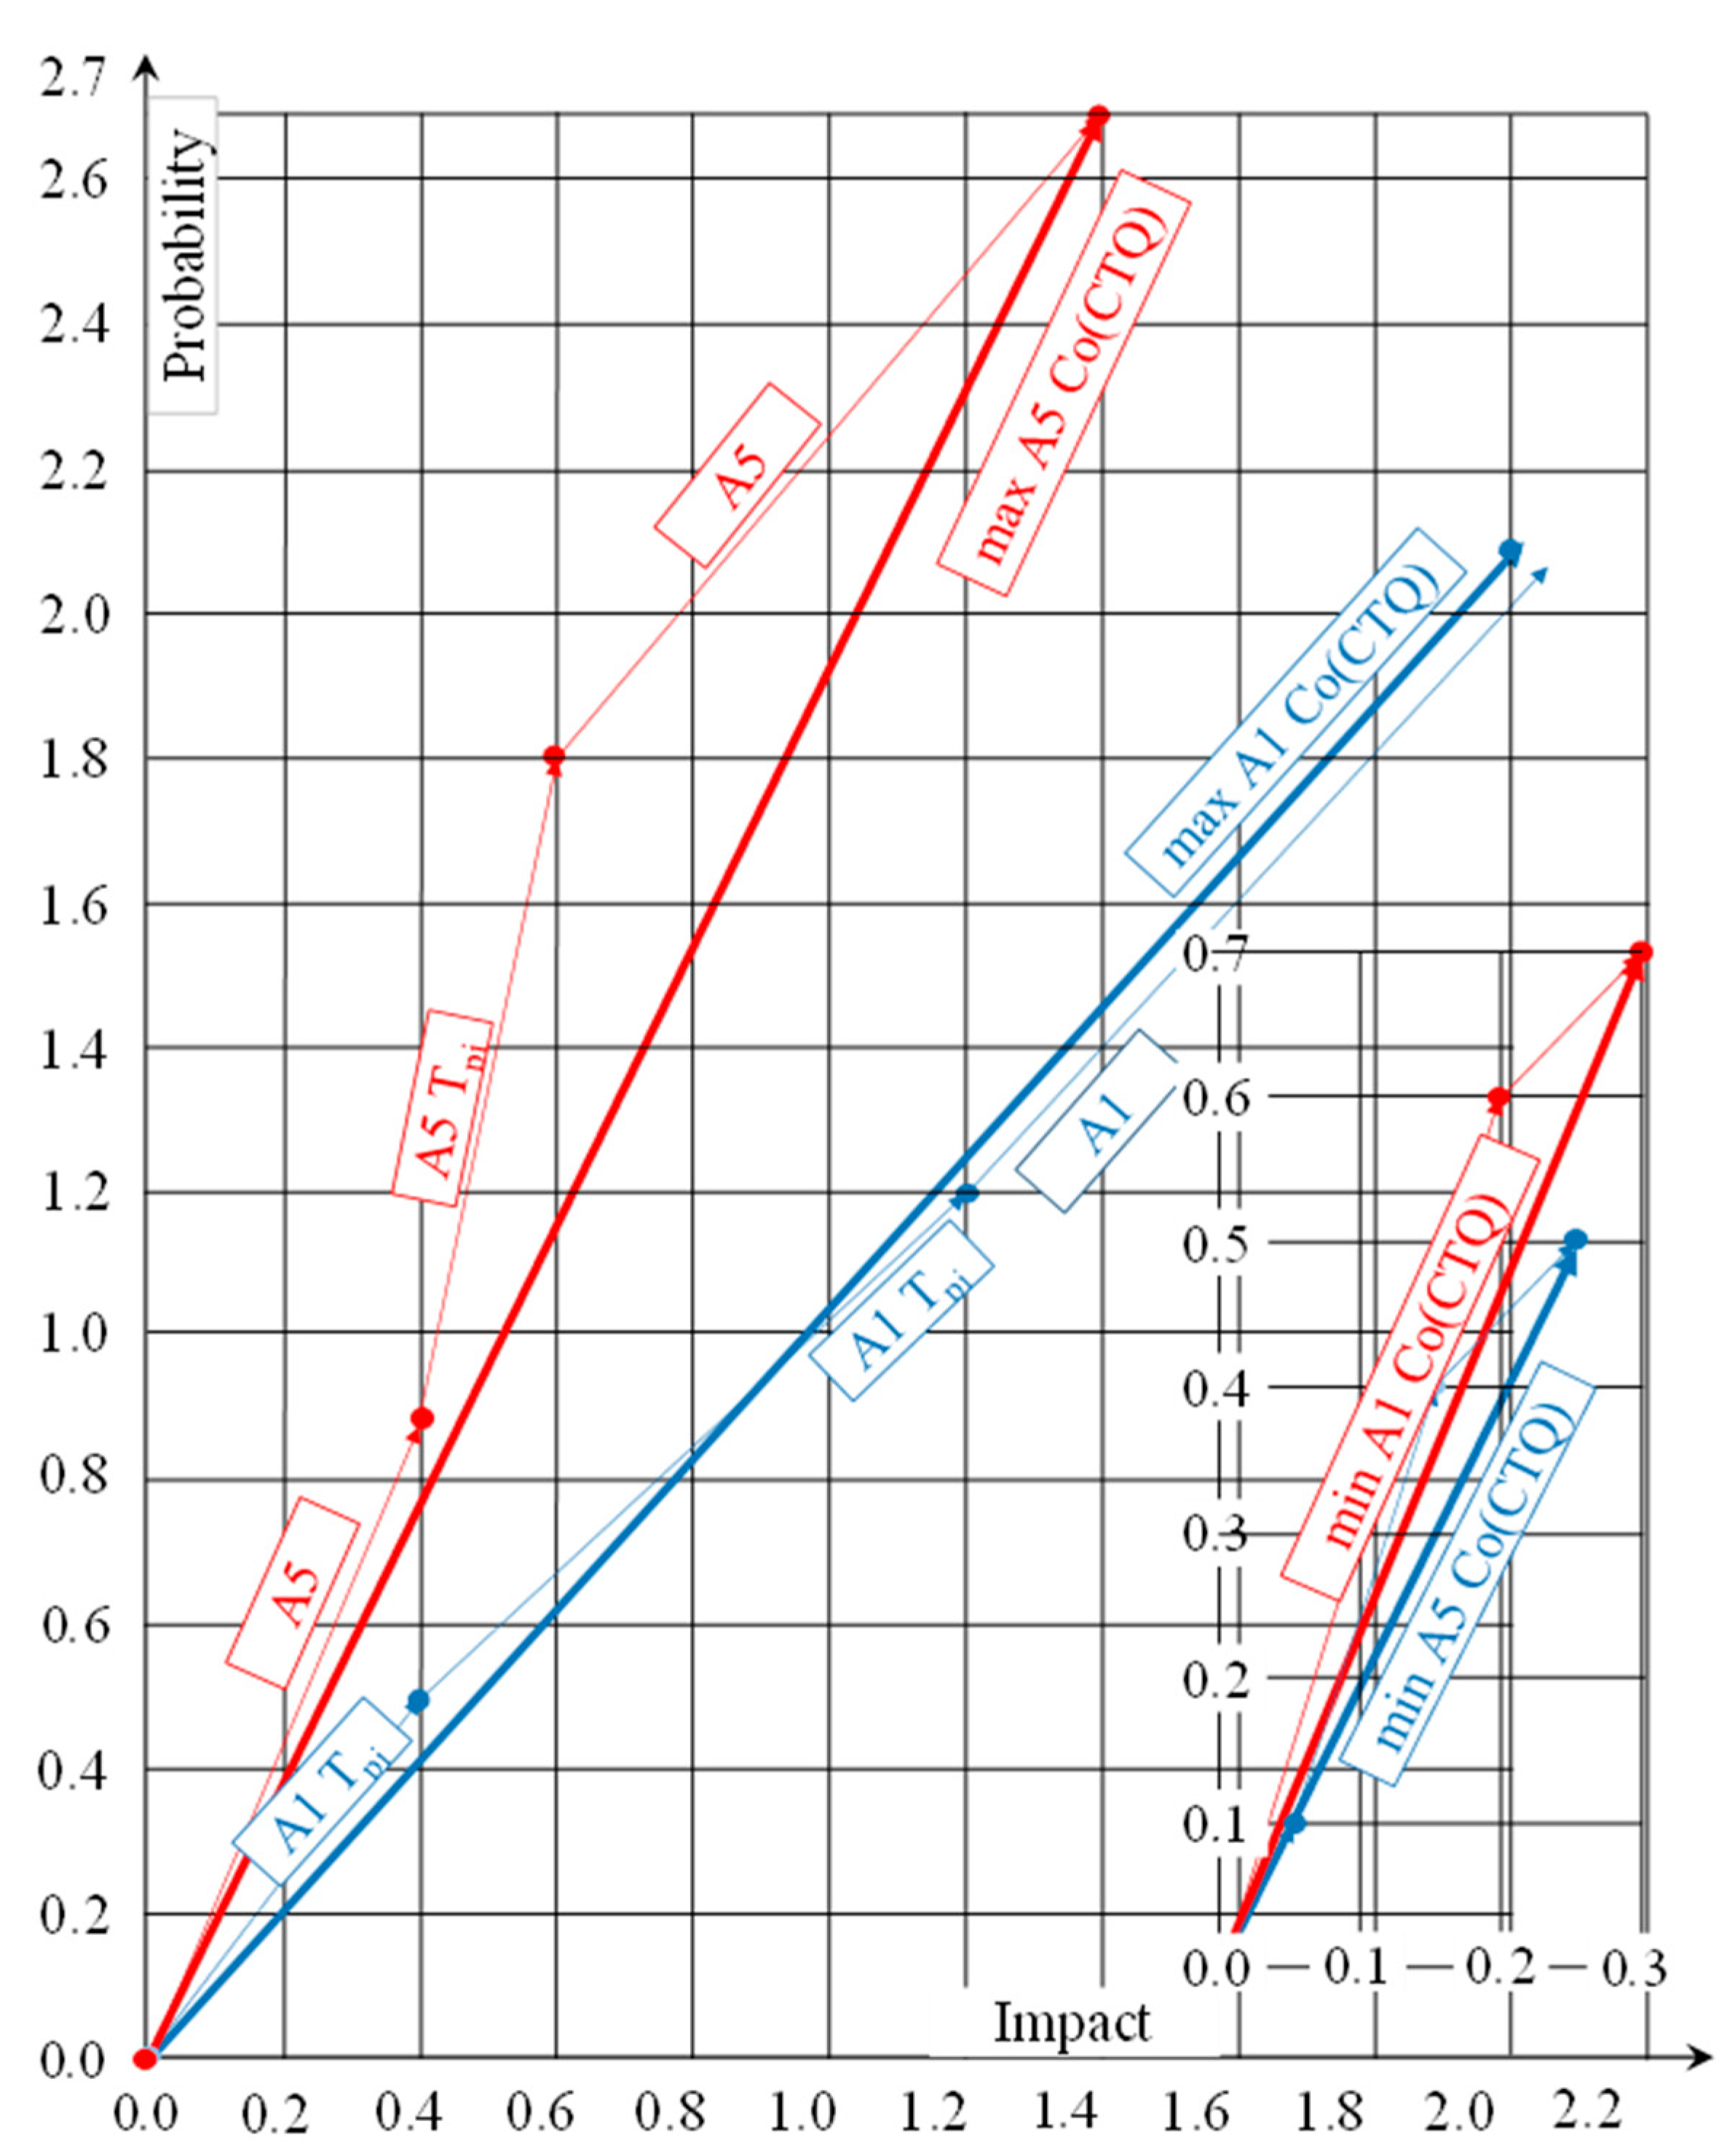
Thanks to the analysis conducted at the level of “P/I” vectors for cost, time, and quality and the Composition (CTQ) index for the overall total risk assessment, it is possible to apply this, already at the project level, in order to provide detail to the design assumptions. As it results from the descriptive nature of the degree of impact and the probability of occurrence of defective actions during renovation, experience and knowledge of the subject of analysis are essential when qualifying these actions on the risk scale (Table 2 and Table 3). Comparison of the impacts and probabilities of errors in selecting an inappropriate designer and the lack of good diagnostics with regard to the risk of project realization under the situation of removing these errors, as presented in Table 9 (row related to A1 and A5), is illustrated in Figure 7.

6. Summary

When applying the risk level calculation principles as presented in Section 6 according to the principles of risk management in construction, when carrying out specialist works in the renovation of concrete tanks in sewage treatment plants, the probability of failure and the failure of these projects can be effectively reduced. By preparing impact and probability matrices and assigning them to individual activities necessary for tank renovation, it is possible to analyze the contribution of these activities to reducing or increasing the risk of the implemented project.
Using the example of multiple failures of a municipal sewage tank subjected to crisis management accounting, it is possible to correlate the value of the final coefficient of the total risk assessment with individual activities burdened with errors.
A thorough and detailed analysis of all risk factors that occur in the presented investment processes allowed us to establish many common points for each subsequent failure of this type. Although each case should be considered individually when renovating tanks, using the experience of applying the principles of crisis management, it is possible to predict the project’s weak points in advance. The efforts undertaken in connection with the presented analysis are fully justified because the dimension of this issue is significant on three significant levels: cost, time, and quality of repair work. Finances are crucial because the number of tanks requiring cyclical renovation, as presented in the Introduction, is enormous, and maintaining them in good condition lowers costs. These costs are covered by public funds, which means that each of us (taxpayers) pays for these repairs. On the other hand, good-quality tanks ensure public safety for a long time, which is related to meeting the basic living needs of the population. The third dimension, the quality of the repairs performed, is associated with protecting the natural environment, which, in the present times, requires our care and attention more than ever.
Using “probability/impact” or “P/I” tables with assigned meanings for subsequent levels of measurable assessment values in the form of a scale of quantitative and qualitative assessments, specifies the scale of the level of risk incurred in the design of tank renovation. It therefore allows for the evaluation of the accuracy of decisions of subsequent steps related to the implementation of adequate remedial actions to eliminate the impact of a given factor on the designated goal; therefore, the use of such assessment tables, which contain, in addition to the numerical assessment value, their quantitative and qualitative descriptions, is most appropriate.
The analysis of the collected conclusions and recommendations shows that for the actual effectiveness of the risk management program, the planning phase is a critical stage of the investment process. At this stage, appropriate actions related to reducing threats should be initiated by introducing remedial actions in the project implementation phase. This will prevent the negative effects of the impact of various factors within the “magic triangle” [31] (cost, time, and quality). By introducing adequate actions to counteract the decrease in quality, the negative effects will be transferred to the cost and time plane, or conversely, by making decisions to limit the extended time, the risk related to quality and costs is transferred. Only at the planning stage can specific threats be effectively eliminated in a holistic manner.

7. Conclusions

Predicting the degree of risk taken during the implementation of some of the listed failures of polyurea coatings is possible with a fairly high degree of confidence. For this purpose, procedures for assessing credibility should be introduced at each stage of the repair project. These include reliable diagnostics commissioned to an experienced designer, selection of a proven contractor according to the procedure of multilateral assessment of experience in this type of specialist repair, technical capabilities and financial condition of the contractor, as well as constant monitoring of individual stages of the repair. The parameter of assessing the possibility of full or partial completion of the task should also be introduced into the risk analysis. In this case, in addition to cost, time, quality, the parameter of the scope of planned repairs would also be included

Author Contributions

Conceptualization, J.B.; methodology, M.M.; software, A.H.M.; validation, M.M.; formal analysis, J.B.; investigation, J.B. and M.M.; resources, J.B.; data curation, A.H.M.; writing—original draft preparation, J.B., M.M., and A.H.M.; writing—review and editing, M.M.; visualization, M.M.; supervision, M.M.; project administration, J.B.; funding acquisition, J.B. All authors have read and agreed to the published version of the manuscript.

Funding

This research received no external funding.

Data Availability Statement

All data used for the analysis are available form the corresponding author on request.

Conflicts of Interest

Author Janusz Banera was employed by the company SIKA Poland Sp. z o. o. The remaining authors declare that the research was conducted in the absence of any commercial or financial relationships that could be construed as a potential conflict of interest.

References

  1. Directive (Eu) 2024/3019 of the European Parliament and of the Council of 27 November 2024, Concerning Urban Wastewater Treatment. 2024. Available online: https://eur-lex.europa.eu/eli/dir/2024/3019/oj/eng (accessed on 5 June 2025).
  2. Büttner, O.; Jawitz, J.W.; Birk, S.; Borchardt, D. Why Wastewater Treatment Fails to Protect Stream Ecosystems in Europe. Water Res. 2022, 217, 118382. [Google Scholar] [CrossRef]
  3. Gradziuk, P.; Gradziuk, B. Gospodarka Niskoemisyjna—Nowe Wyzwanie Dla Gmin Wiejskich. Wieś I Rol. 2016, 1, 105–126. [Google Scholar] [CrossRef]
  4. European Funds for Infrastructure, Climate, Environment 2021–2027, European Ministry for Infrastructure, Climate, Environment 2012–2027. Available online: https://www.feniks.gov.pl/ (accessed on 5 June 2025).
  5. Lipińska, D. Environmental Engineering Fundamentals; University of Lodz Publishing House: Łódź, Poland, 2016; pp. 117–150. [Google Scholar]
  6. Sewage Management—Ministry of Infrastructure—Gov.pl Portal. Ministry of Infrastructure. Available online: https://www.gov.pl/web/infrastruktura/gospodarka-sciekowa (accessed on 5 June 2025).
  7. Gajewska, E.; Ropel, M. Risk Management Practices in a Construction Project—A Case Study. Master’s Thesis, Chalmers University of Technology, Göteborg, Sweden, 2011. [Google Scholar]
  8. Acebes, F.; González-Varona, J.M.; López-Paredes, A.; Pajares, J. Beyond Probability-impact Matrices in Project Risk Management: A Quantitative Methodology for Risk Prioritisation. Humanit. Soc. Sci. Commun. 2024, 11, 670. [Google Scholar] [CrossRef]
  9. Rane, S.B.; Potdar, P.R.; Rane, S. Development of Project Risk Management Framework Based on Industry 4.0 Technologies. Benchmarking Int. J. 2019, 28, 1451–1481. [Google Scholar] [CrossRef]
  10. Banera, J.; Maj, M. Reasons for lack of adhesion of polyurea coatings to concrete substrates in chemically aggressive water tanks. Mater. Bud. 2024, 1, 25–31. [Google Scholar] [CrossRef]
  11. Maj, M.; Ubysz, A. The reasons for the loss of polyurea coatings adhesion to the concrete substrate in chemically aggressive water tanks. Eng. Fail. Anal. 2022, 142, 106774. [Google Scholar] [CrossRef]
  12. Hatush, Z.; Skitmore, M. Contractor selection using multicriteria utility theory: An additive model. Build. Environ. 1998, 33, 105–115. [Google Scholar] [CrossRef]
  13. Logoń, D.; Maj, M.; Rybak, J.; Ubysz, A.; Wojtowicz, A. Chemical hazards in construction industry. E3S Web Conf. 2019, 97, 03032. [Google Scholar] [CrossRef]
  14. Aguirre-Guerrero, A.M.; Robayo-Salazar, R.A.; de Gutiérrez, R.M. A novel geopolymer application: Coatings to protect reinforced concrete against corrosion. Appl. Clay Sci. 2017, 135, 437–446. [Google Scholar] [CrossRef]
  15. Guo, Y.; Shen, A.; Sun, X. Exploring Polymer-Modified Concrete and Cementitious Coating with High-Durability for Roadside Structures in Xinjiang, China. Adv. Mater. Sci. Eng. 2017, 2017, 9425361. [Google Scholar] [CrossRef]
  16. Garbowski, T.; Pawlak, T.G.; Szymczak-Graczyk, A. Efficient Load-Bearing Capacity Assessment of a Degraded Concrete Manhole Using Sectional Homogenization. Materials 2024, 17, 5883. [Google Scholar] [CrossRef]
  17. Jiang, G.; Keller, J.; Bond, P.L.; Yuan, Z. Predicting concrete corrosion of sewers using artificial neural network. Water Res. 2016, 92, 52–60. [Google Scholar] [CrossRef] [PubMed]
  18. Pawlak, T.G.; Szymczak-Graczyk, A.; Garbowski, T. Three-layer Repair Coating System for Manholes, Pump Stations, and Tanks in Aggressive Sulfate Environment. Civ. Environ. Eng. Rep. 2025, 35, 1–19. [Google Scholar] [CrossRef]
  19. Parniani, S.; Toutanji, H. Monotonic and fatigue performance of RC beams strengthened with a polyurea coating system. Constr. Build. Mater. 2015, 101, 22–29. [Google Scholar] [CrossRef]
  20. Hatush, Z.; Skitmore, M. Criteria for contactor selection. Constr. Manag. Econ. 1997, 15, 19–38. [Google Scholar] [CrossRef]
  21. Kasprowicz, T. Inżynieria Przedsięwzięć Budowlanych Rekomendowane Metody i Techniki; PAN: Warszawa, Poland, 2015; pp. 47–74. [Google Scholar]
  22. Westerveld, E. The Project Excellence Model®: Linking success criteria and critical success factors. Int. J. Proj. Manag. 2003, 21, 411–418. [Google Scholar] [CrossRef]
  23. Marleni, N.; Gray, S.; Sharma, A.; Burn, S.; Muttil, N. Impact of Water Source Management Practices in Residential Areas on Sewer Networks—A Review. Water Sci. Technol. 2012, 65, 624–642. [Google Scholar] [CrossRef]
  24. Macek, D.; Vitásek, S. Risk Analysis in Building Renovations: Strategies for Investors. Buildings 2024, 14, 2219. [Google Scholar] [CrossRef]
  25. Machen, J.D. Common Causes of Blistering and Bubbling in Industrial Coatings. KTA-Tator, 12 July 2016. Available online: https://kta.com/kta-university/blistering-bubbling-coatings (accessed on 5 June 2025).
  26. Finch, G.; Hubbs, B.; Bambino, R. Osmosis and the Blistering of Polyurethane Waterproofing Membranes. In Proceedings of the 12th Canadian Conference on Building Science and Technology, Montreal, QC, Canada, 6 May 2009; Available online: www.brikbase.org/sites/default/files/best2_hubbs_finch.pdf (accessed on 5 June 2025).
  27. Finch, G.; Hubbs, B.; Bambino, R. Osmosis and the Blistering of Liquid Applied Polyurethane Roof Membranes; PE RDH Building Engineering Ltd.: Vancouver, BC, Canada, 2010. [Google Scholar]
  28. Aguirre-Guerrero, A.M.; Mejía de Gutiérrez, R. Alkali-activated protective coatings for reinforced concrete exposed to chlorides. Constr. Build. Mater. 2021, 268, 121098. [Google Scholar] [CrossRef]
  29. Maj, M.; Ubysz, A.; Tamrazyan, A. Durability of polyurethane—Cement floors. MATEC Web Conf. 2018, 251, 02026. [Google Scholar] [CrossRef]
  30. Maj, M.; Ubysz, A. Polyurea as a material to reinforce the surface and increase the waterproofing of concrete. In Proceedings of the FIB 2018—Proceedings for the 2018 fib Congress: Better, Smarter, Stronger, Melbourne, Australia, 7–11 October 2018; pp. 1933–1947. [Google Scholar]
  31. PMI (Project Management Institute). A Guide to the Project Management Body of Knowledge, 3rd ed.; PMI: Newtown Square, PA, USA, 2004. [Google Scholar]
  32. Klemetti, A. Risk Management in Construction Project Networks; Report 2006/2; Helsinki University of Technology, Laboratory of Industrial Management: Espoo, Finland, 2006. [Google Scholar]
  33. KPMG International. Global Construction Survey, Climbing the Curve; KPMG International: Amstelveen, The Netherlands, 2015. [Google Scholar]
  34. Herbsman, Z.; Ellis, R. Multiparameter bidding system innovation in contract administration. J. Constr. Eng. Manag. 1992, 118, 1436. [Google Scholar] [CrossRef]
  35. Demir, S.; Bryde, D.; Fearon, D.; Ochieng, E.G. A tool for integrating time, cost and quality perspectives in Probability Impact (P-I) Tables. Int. J. Proj. Organ. Manag. 2014, 6, 303–318. [Google Scholar] [CrossRef]
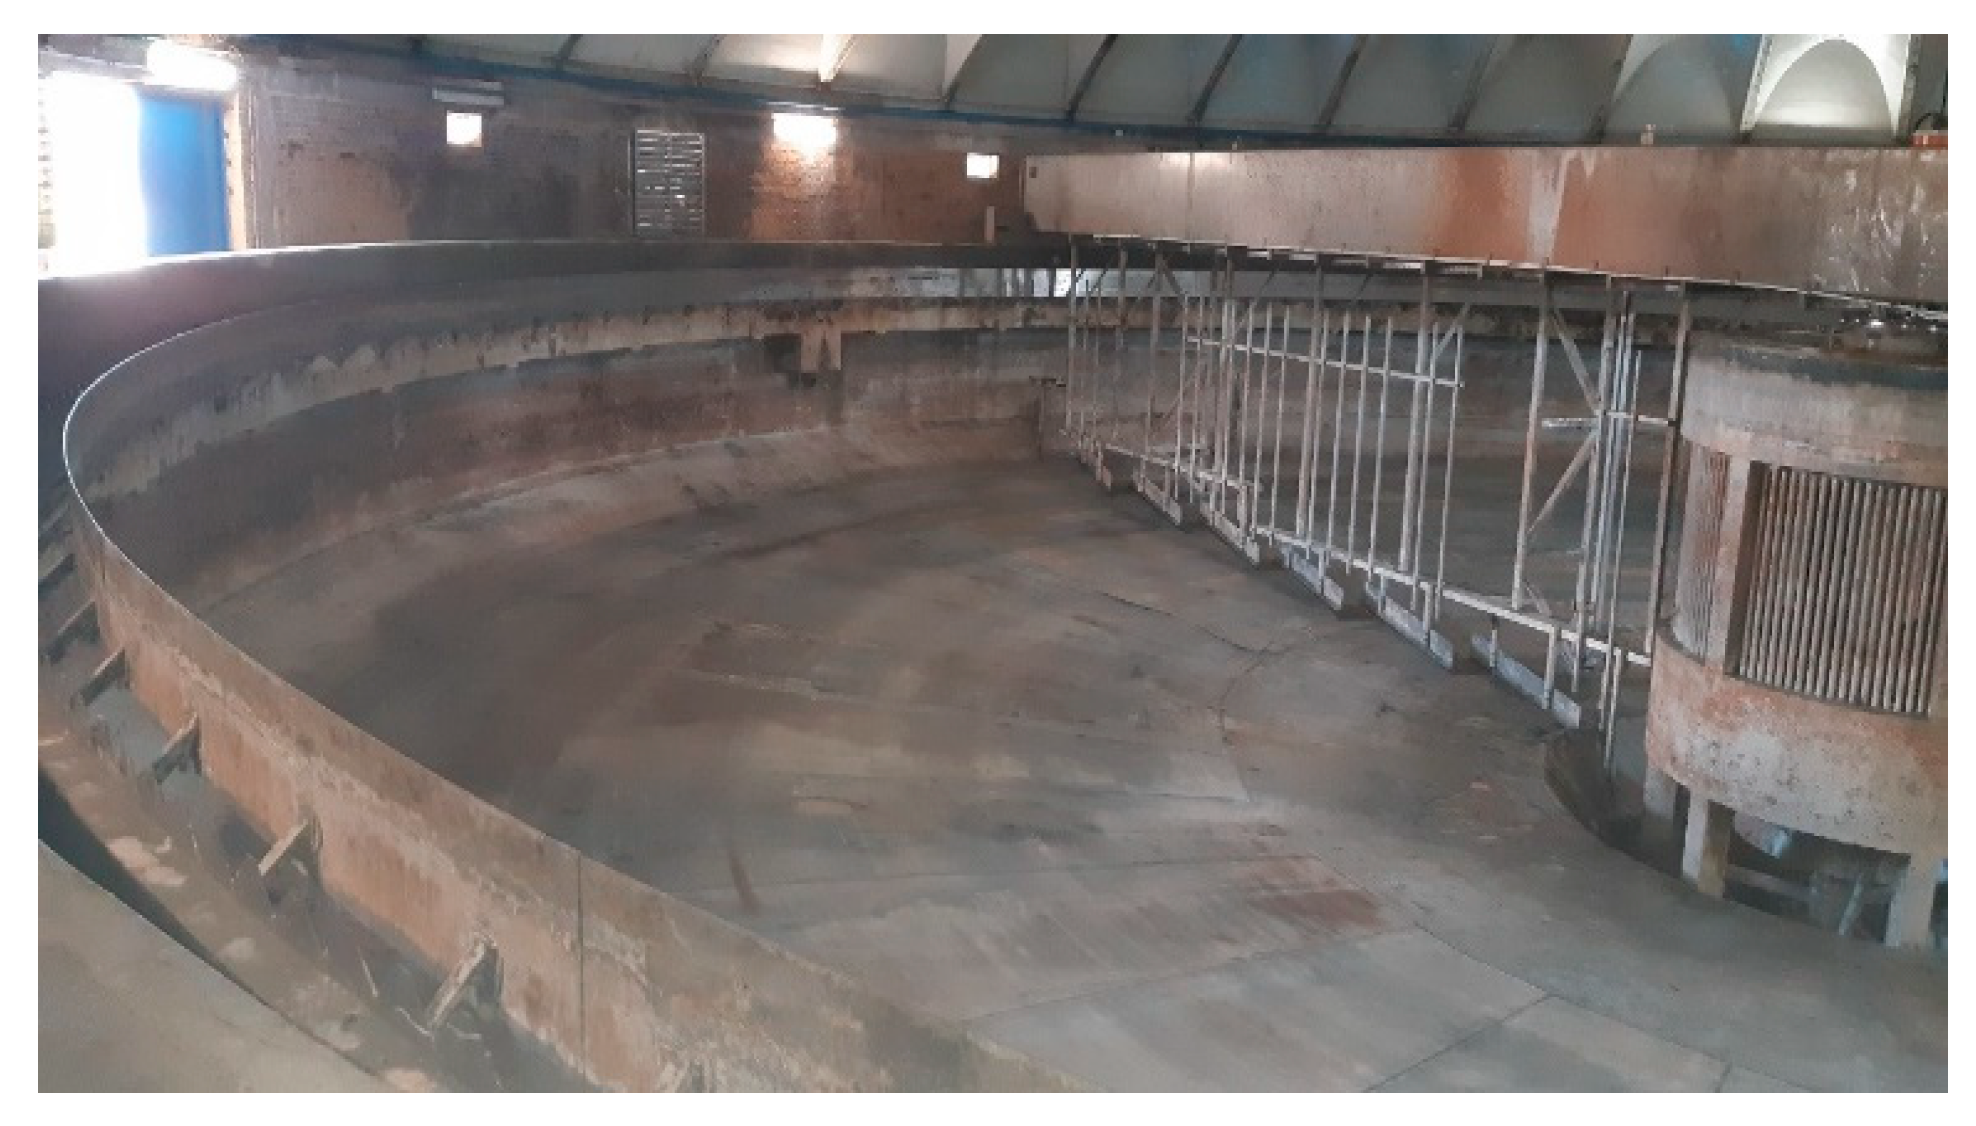
Figure 1. Municipal sewage tank during the third repair of the protective coating.
Buildings 15 02254 g001
Figure 2. Osmotic bubbles in the bottom plate of the tank; in the background, the failed stirrer.
Buildings 15 02254 g002
Figure 3. (a) Many layers of polyurea and a carelessly made concrete substrate. (b) A carelessly made expansion joint at the technological break in the bottom of the tank.
Buildings 15 02254 g003
Figure 4. The monitoring of vibrations in warehouse facilities.
Buildings 15 02254 g004
Figure 5. Crack in the tank wall through which water penetrated from the ground.
Buildings 15 02254 g005
Figure 6. Clear separation of polyurea from concrete surface; separation of primer from concrete base and polyurea from primer.
Buildings 15 02254 g006
Figure 7. Comparison of Co(CTQ) vectors for maximum and minimum impact and probability estimates of errors A1 and A5.
Buildings 15 02254 g007
Table 1. List of activities resulting in failures and appropriate remedies.
Title 1Title 2
A1The lack of diagnostics of the tank’s technical condition, the impact of this factor before the investment process begins, and the probability of this factor occurring in the event of the investment being implemented without prior expert opinion or technical assessment (diagnostics) were estimated to be quite high.
A1aRemedies: delegating diagnostics to a designer who does not have sufficient competencies increases the impact of this factor on the risk and increases the probability of this factor occurring.
A1bRemedies: delegating diagnostics to a designer with the required skills.
A1cRemedial measures: additionally, commissioning monitoring works and additional research in preparation for the investment under the supervision of an experienced designer who is at constant disposal.
A2Delay in the start of work for up to 6 months. With this delay no major threats or complications should be expected. However, the longer the break, the more serious the effects may be, and the probability of their occurrence will increase.
A2aDelay of more than 6 months and even up to 24 months; with this delay the effects of this factor’s influence and the probability of occurrence increase to high values.
A2bDelay of more than 24 months; with this delay the effects of this factor’s influence and the probability of occurrence increase to high values.
A2cDelay with a break of 24 months or more, but after repeated diagnostics, updating of design documentation, and implementation of remedial actions, the risk is minimized to low.
A3Deficiencies or errors in the assumptions at the planning and creation stage of the Utility Operation Program (PHU).
A3aRemedy: correction of deficiencies or errors in the assumptions in planning and design, removal of insufficiently precisely described deadlines for the execution of works in the plans and schedules, and specification of technical data concerning the materials used for renovation.
A4A faulty costing method used as a basis for establishing a budget for tank renovation may have a high impact on the deviation from the actual investment costs. It will probably have a medium impact on time and a high impact on costs, but it may have a very high impact on quality.
A4aRemedy: taking into account constantly changing current input prices, product prices, etc.
A4bOngoing control and monitoring of works.
A5Choosing the wrong designer is a high-risk factor.
A5aRemedy: apply increased criteria in selecting a design.
A6Choosing the wrong technology; choosing the right protective coating technology at the lowest price.
A6aRemedy: selection of technology that meets all the criteria for selecting polyurea for the substrate and fluid requirements.
A7Errors in the assumptions regarding the choice of method for performing individual tasks. Widely accepted and practiced methods are adopted without going into a separate case.
A7aRemedy: this activity can be reduced by performing prior tests on selected test fields of the application being performed.
A8Remedy: monitoring the selection of appropriate construction materials, the control of deliveries, and checking the state of the contractor’s machinery, etc.
A8aRemedy: monitoring the selection of construction materials, control of the contractor’s technical equipment, etc.
A9Choosing the wrong contractor: A contractor without knowledge of the specific case of polyurea application is a threat to the implementation of the investment.
A9aRemedy: the selection of the wrong contractor can be minimized by constant control carried out by the Investor Supervision Inspector.
A9bThe remedy introducing the obligation of daily control measurements of the works performed.
A9cRemedy: dynamic and analytical selection of offers submitted by contractors, thorough monitoring of offers, and preliminary detailed talks with contractors.
A10Incorrect choice of investment implementation date, e.g., winter, seasonal work, etc.
A10aRemedy: include in the contract provisions excluding work during non-conforming periods.
A11Inadequately prepared technical supervision without required competences.
A11aRemedy: include provisions in the contract regarding professional technical supervision and selective selection through, for example, a tender.
Table 2. Probability of risk occurrence based on [32].
ProbabilityRisk
QualitativeQuantitative ScaleLinear Result
Very low1–19%0.1
Low20–39%0.3
Medium40–59%0.5
High60–79%0.7
Very high>79%0.9
Table 3. The scale of the impact of various risk factors on individual risk types based on [31,35].
Assessment of the Impact of the Lack of Diagnostics of the Technical Condition of the Tank Before Starting the Investment Process
CostTimeQualityQualitative ScaleMeasurable Result
Negligible cost increaseInsignificant timeoutSlightly noticeable reduction
in quality
Very low0.05
Cost increase < 10%Timeout < 5%This only applies to very demanding
applications
Low0.1
Cost increase by 10–20%Timeout by 5–10%Decreasing the quality requires
the investor’s approval
Medium0.2
Cost increase by 20–40%Timeout by 0–20%Decreasing in the quality unacceptable
to the investor
High0.4
Cost increase by >40%Timeout by 20%Decreasing in the quality that makes
the object unusable
Very high0.8
Table 4. Assessment of the probability of occurrence and impact P/I of individual factors for a given type of risk (based on [7,12], for the cost of C p i i , j = C p ( i ) T × C i ( j ) , for the time T p i i , j = T p ( i ) T × T i ( j ) , and for the quality Q p i i , j = Q p ( i ) T × Q i ( j ) .
Table “P/I” for Cost C p i i , j ,   Time   T p i i , j , and   Quality   Q p i i , j
Impact of risk  C i i ,
T i i , and  Q i i
Probability of Risk  C p j , Time  T p j ,   and Quality  Q p j
0.1000.3000.5000.7000.900i = 1
0.050 0.005 0.015 0.025 0.035 0.045 2
0.100 0.010 0.030 0.050 0.070 0.090 3
0.200 0.020 0.060 0.100 0.140 0.180 4
0.400 0.030 0.100 0.160 0.220 0.290 5
0.8000.0800,2400.4000.5600.7206
j = 123456
Table 5. Classification of failure risk for matrices C p i i , j , T p i i , j , and Q p i i , j .
Numerical   Value   for   C p i i , j ,
T p i i , j ,   and   Q p i i , j
Risk Assessment
Lower than 0.05Low impact on investment implementation
From 0.06 to 0.15Warning binding on investor’s attention
Greater than 0.15Signal, corrective actions should be taken
Table 6. Failure risk classification for integral Composition (CTQ).
Composition (CTQ)Risk Assessment
Lower than 0.86Low risk level, monitoring recommended
From 0.86 to 1.7Medium risk level, corrective decision making
Greater than 1.7High risk level, implementation of remedial actions
Table 7. Summary of risk assessment values for identified factors according to the specification in Table 1.
ParametersCTQ A 1 A 1 a A 1 b A 1 c A 2 A 2 a A 2 b A 3 A 3 a A 4 A 4 a A 4 b A 5 A 5 a
I
Factors of Impact
Cost C i 0.400.100.100.100.100.400.100.800.050.400.200.100.400.05
Time T i 0.800.200.200.100.200.800.200.800.100.200.200.050.200.10
Quality Q i 0.800.400.400.100.100.800.100.800.100.800.400.050.800.10
P
Probability of occurrence
Cost C p 0.500.300.500.300.100.900.300.900.300.900.500.100.900.10
Time T p 0.700.300.500.300.100.900.500.900.100.500.300.100.900.30
Quality Q p 0.900.500.700.100.100.900.100.900.100.700.300.100.900.10
P/I
Matrix of Prob./Impact
Cost C p i 0.200.030.050.030.010.360.030.720.020.360.100.010.360.01
Time T p i 0.560.060.100.030.020.720.100.720.010.100.060.010.180.03
Quality Q p i 0.720.020.280.010.010.720.010.720.010.560.120.010.720.01
ParametersCTQA6A6aA7A7aA8A8aA9A9aA9bA9cA10A10aA11A11a
I
Factors of Impact
Cost C i 0.400.100.400.100.400.200.800.400.100.050.400.100.400.05
Time T i 0.200.050.400.200.800.100.800.800.200.100.400.100.800.05
Quality Q i 0.800.100.800.100.800.100.800.200.100.050.800.200.800.05
P
Probability of occurrence
Cost C p 0.700.100.900.100.500.100.900.500.300.100.700.300.700.10
Time T p 0.500.300.900.100.900.100.900.700.100.300.900.300.500.30
Quality Q p 0.900.100.900.100.700.300.900.500.300.100.900.100.900.10
P/I
Matrix of Prob./Impact
Cost C p i 0.280.010.360.010.200.020.720.200.030.010.280.030.280.01
Time T p i 0.100.020.360.020.720.010.720.560.020.030.360.030.400.02
Quality Q p i 0.720.010.720.010.560.030.720.100.030.010.720.020.720.01
Table 8. Summary of extremely high and extremely low risk assessment values for identified factors P/I.
Extremely High-Risk Assessment ValuesAverage Risk Assessment
Values
Extremely Low-Risk Assessment Values
C p i T p i Q p i C p i T p i Q p i C p i T p i Q p i
CostTimeQualityCostTimeQualityCostTimeQuality
A10.200.560.720.050.100.280.030.030.01
A20.360.720.720.060.200.200.030.030.01
A30.720.720.720.280.100.720.000.000.01
A40.360.100.560.140.060.200.010.010.01
A50.360.180.720.000.000.000.010.030.01
A60.280.100.720.000.000.000.010.020.01
A70.360.360.720.020.010.030.010.020.01
A80.200.720.560.100.090.070.020.010.03
A90.720.720.720.640.720.720.010.030.01
A100.280.360.720.030.030.020.030.030.02
A110.280.400.720.280.400.720.010.020.01
Table 9. Summary of overall risk assessments for individual factors before and after implementation of the risk management program. Values for C o C T Q for maximum and average values of “P” and “I”.
Risk   Assessment   Extremely   High   Assessment   Value   Probability / Impact :   C o C T Q = ( P ) 2 + ( Σ I ) 2 Risk   Assessment   Average   Assessment   Value   Probability / Impact :   C o C T Q = ( P ) 2 + ( Σ I ) 2
A i I C i T i Q i Σ ( C i + T i + Q i ) C o ( C T Q ) C i T i Q i Σ ( C i + T i + Q i ) C o ( C T Q )
P C p T p Q p Σ ( C p + T p + Q p ) C p T p Q p Σ ( C p + T p + Q p )
A 1 I 0.400.800.802.002.900.100.200.400.701.84
P 0.500.700.902.100.500.500.701.70
A 2 I 0.400.800.802.003.360.200.400.401.001.64
P 0.900.900.902.700.300.500.501.30
A 3 I 0.800.800.802.403.480.400.200.801.402.52
P 0.900.900.902.700.700.500.902.10
A 4 I 0.400.200.801.402.690.200.200.400.801.70
P 0.900.500.702.100.700.300.501.50
A 5 I 0.400.200.801.403.180.000.000.000.000.25
P 0.900.900.902.700.050.100.100.25
A 6 I 0.400.200.901.502.720.100.050.100.250.25
P 0.700.500.902.100.000.000.000.00
A 7 I 0.500.400.801.703.270.200.100.100.400.64
P 0.900.900.902.700.100.100.300.50
A 8 I 0.400.800.802.002.900.200.100.100.402.14
P 0.500.900.702.100.500.900.702.10
A 9 I 0.800.800.802.403.400.800.800.802.403.54
P 0.800.900.902.600.800.900.902.60
A 10 I 0.400.400.801.603.070.100.100.200.400.81
P 0.700.900.902.500.300.300.100.70
A 11 I 0.400.800.802.002.900.400.800.802.002.90
P 0.700.500.902.100.700.500.902.10
a v e r a g e   C o C T Q = 3.10 a v e r a g e   C o C T Q = 1.53
Table 10. Summary of overall risk assessments for individual factors before and after the implementation of the risk management program. Values for C o C T Q for minimum values of “P” and “I”.
Risk   Assessment   Extremely   Low   Assessment   Value   Probability / Impact   C o C T Q = ( P ) 2 + ( Σ I ) 2
A i I C i T i Q i Σ ( C i + T i + Q i ) C o ( C T Q )
P C p T p Q p Σ ( C p + T p + Q p )
A 1 I 0.100.100.100.301.04
P 0.300.300.100.70
A 2 I 0.100.200.100.401.27
P 0.300.500.100.90
A 3 I 0.050.100.100.250.87
P 0.300.100.100.50
A 4 I 0.100.050.050.200.70
P 0.100.100.100.30
A 5 I 0.050.100.100.250.87
P 0.100.300.100.50
A 6 I 0.100.050.100.250.87
P 0.100.300.100.50
A 7 I 0.100.200.100.400.94
P 0.100.100.100.30
A 8 I 0.200.100.100.401.02
P 0.100.100.300.50
A 9 I 0.050.100.050.200.81
P 0.100.300.100.50
A 10 I 0.100.100.200.401.14
P 0.300.300.100.70
A 11 I 0.050.050.050.150.74
P 0.100.300.100.50
a v e r a g e   C o ( C T Q ) =0.95
Disclaimer/Publisher’s Note: The statements, opinions and data contained in all publications are solely those of the individual author(s) and contributor(s) and not of MDPI and/or the editor(s). MDPI and/or the editor(s) disclaim responsibility for any injury to people or property resulting from any ideas, methods, instructions or products referred to in the content.