
Risk Management in the Analysis of Failures of Protective Coatings in Municipal Sewage Treatment Plant Tanks


Abstract
1. Introduction
2. Positive Properties Expected from Polyurea Protective Coatings
3. Design Activities Subject to the Possibility of Errors During Renovation Work
4. Examples of Failures in Tank Renovation Using Polyurea Coatings
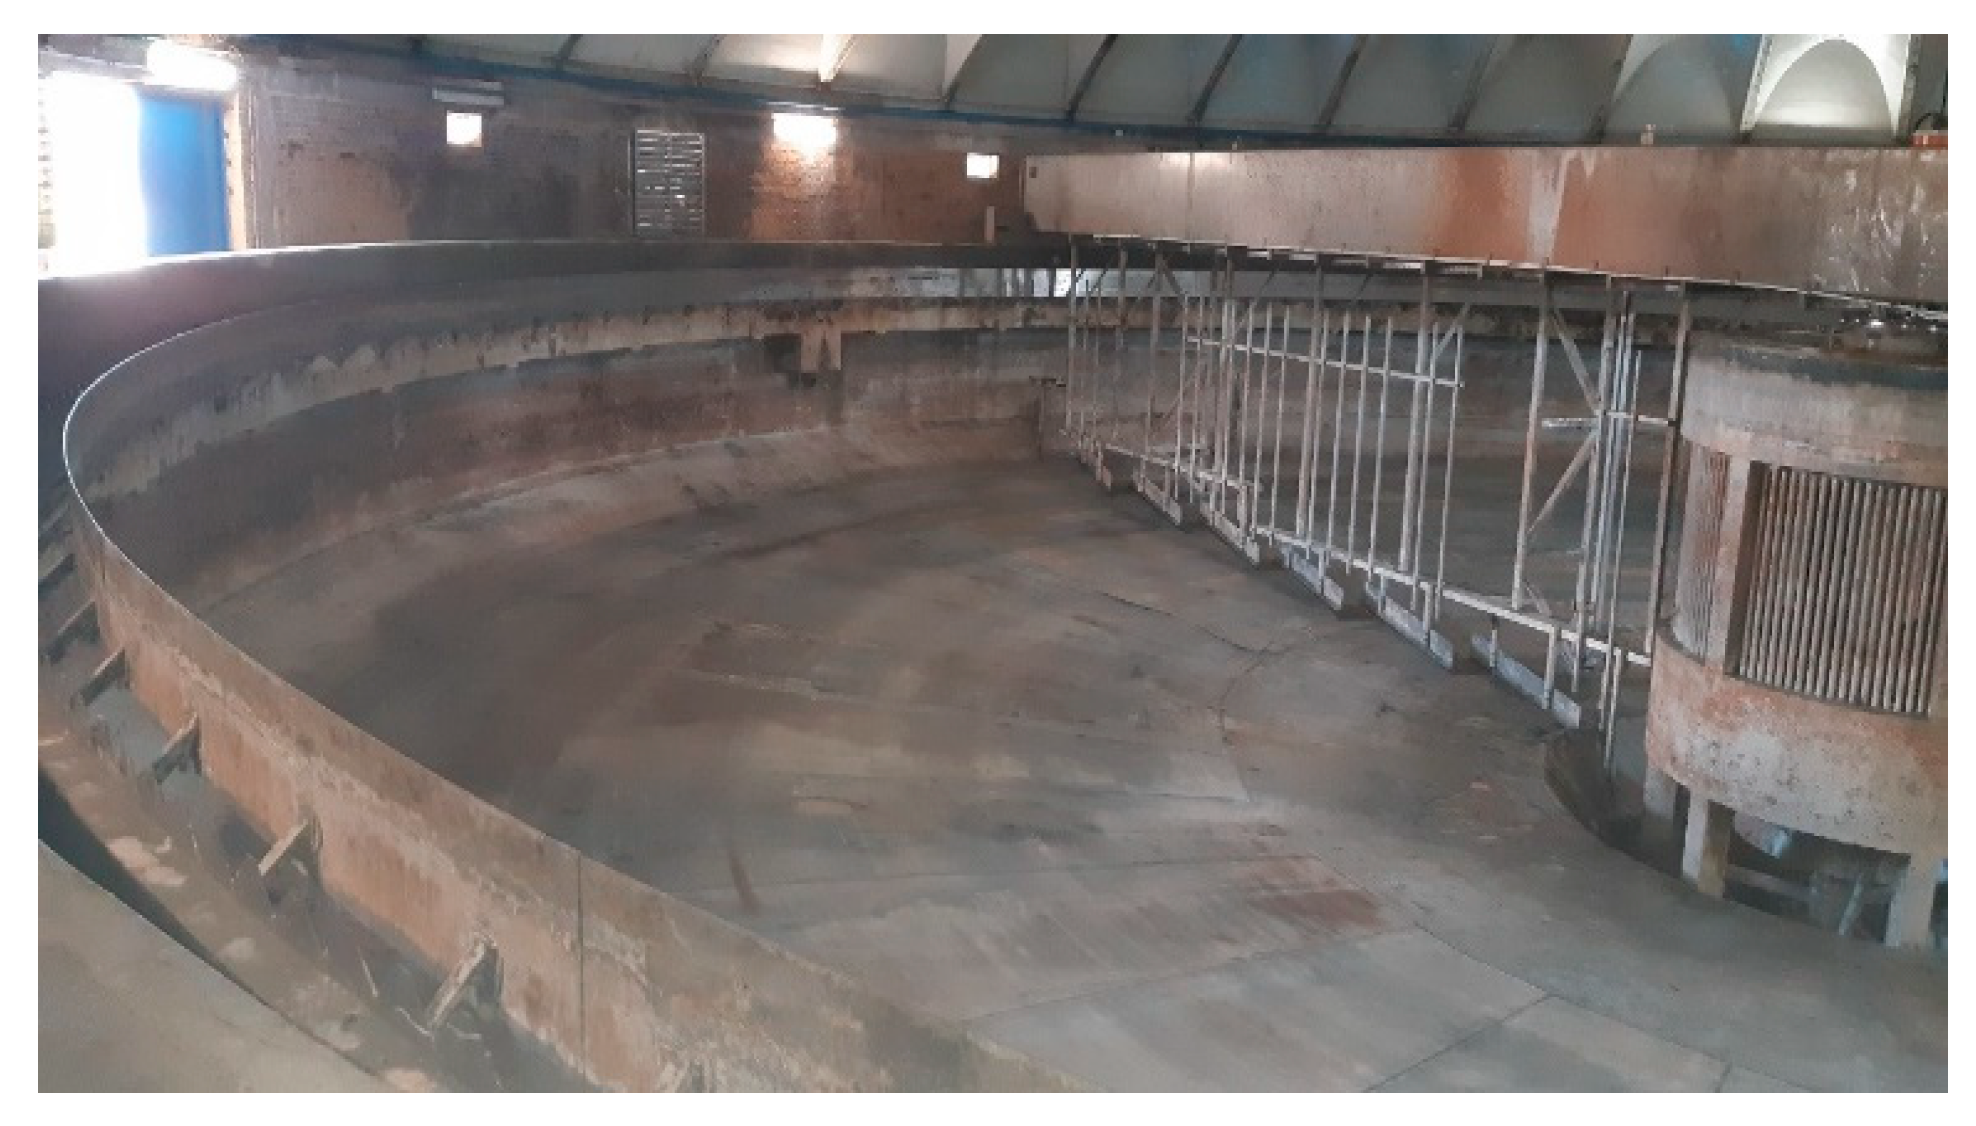
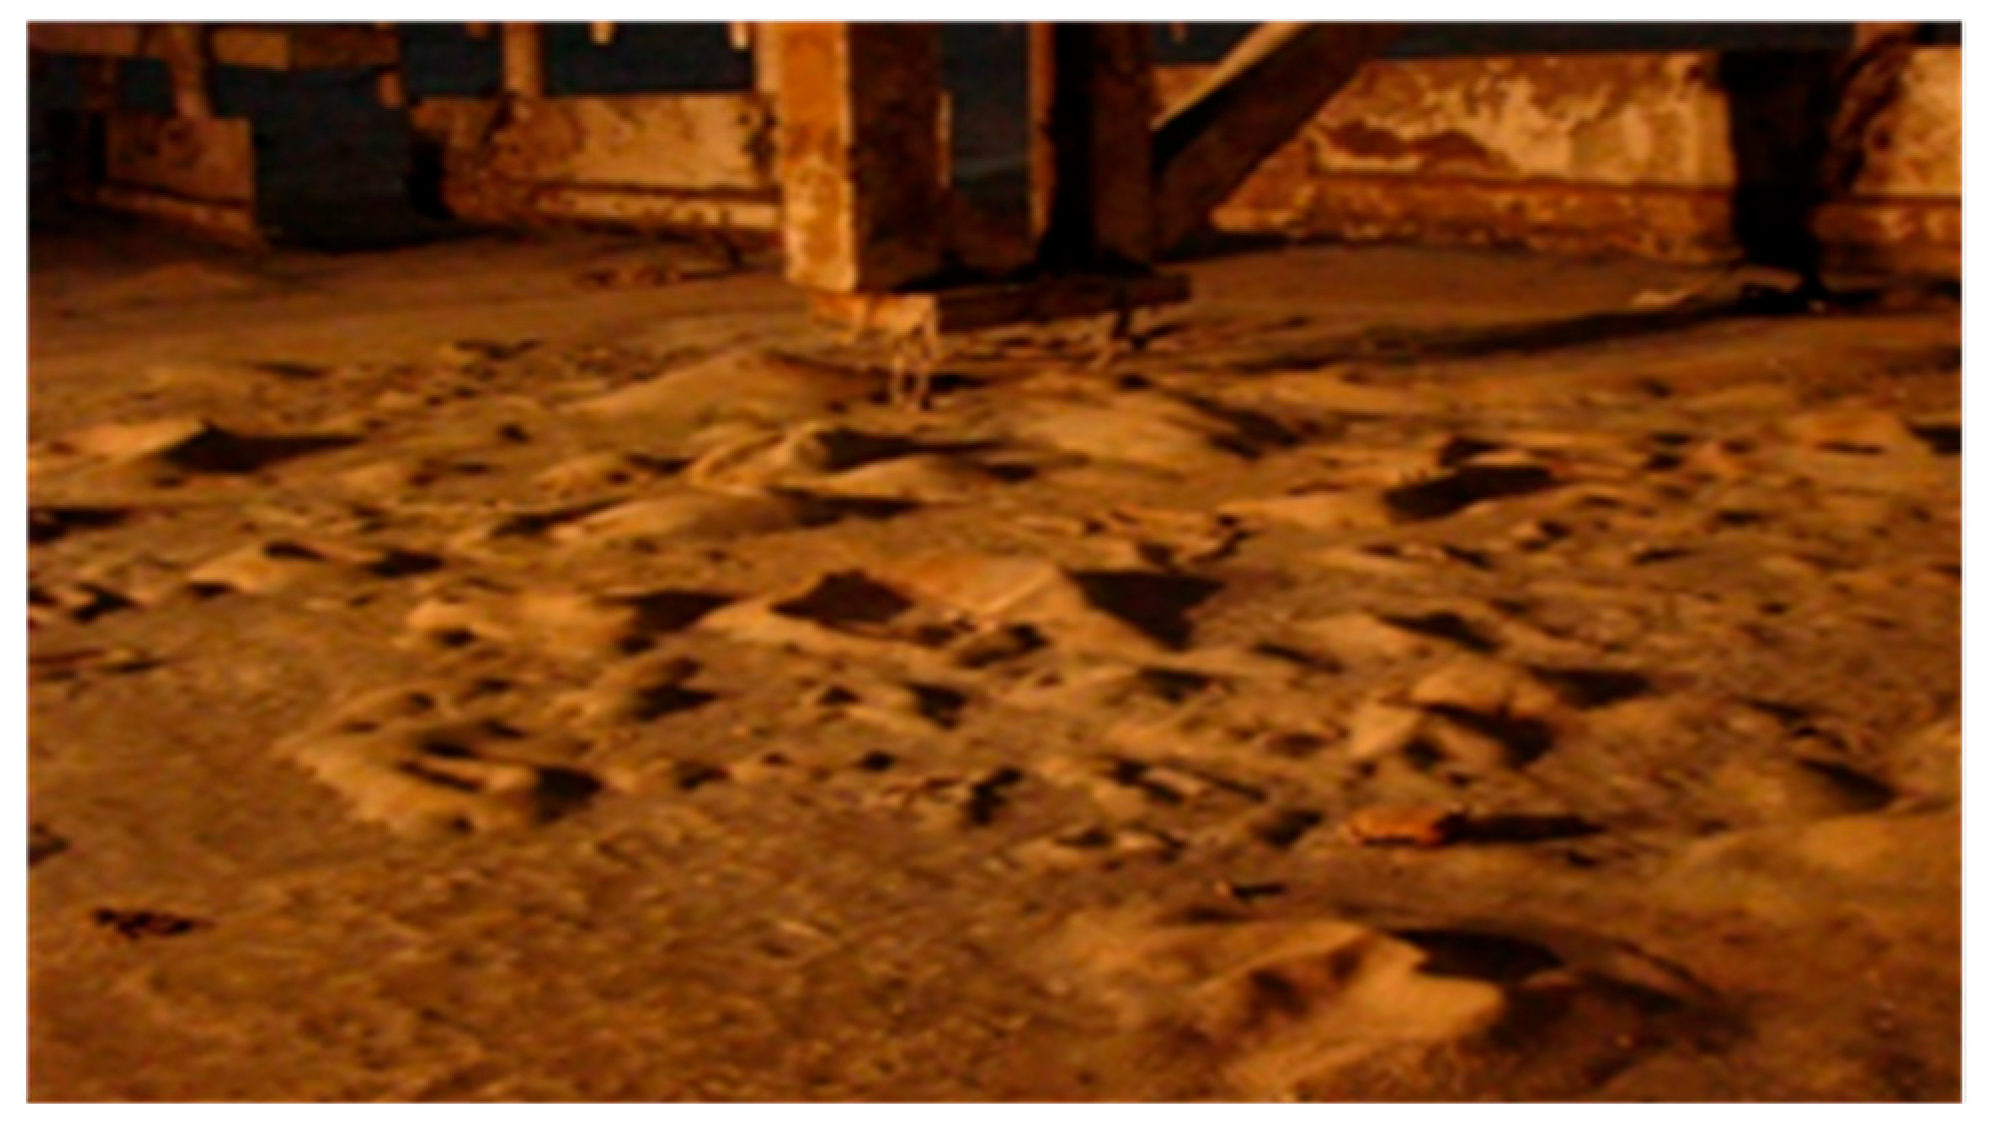
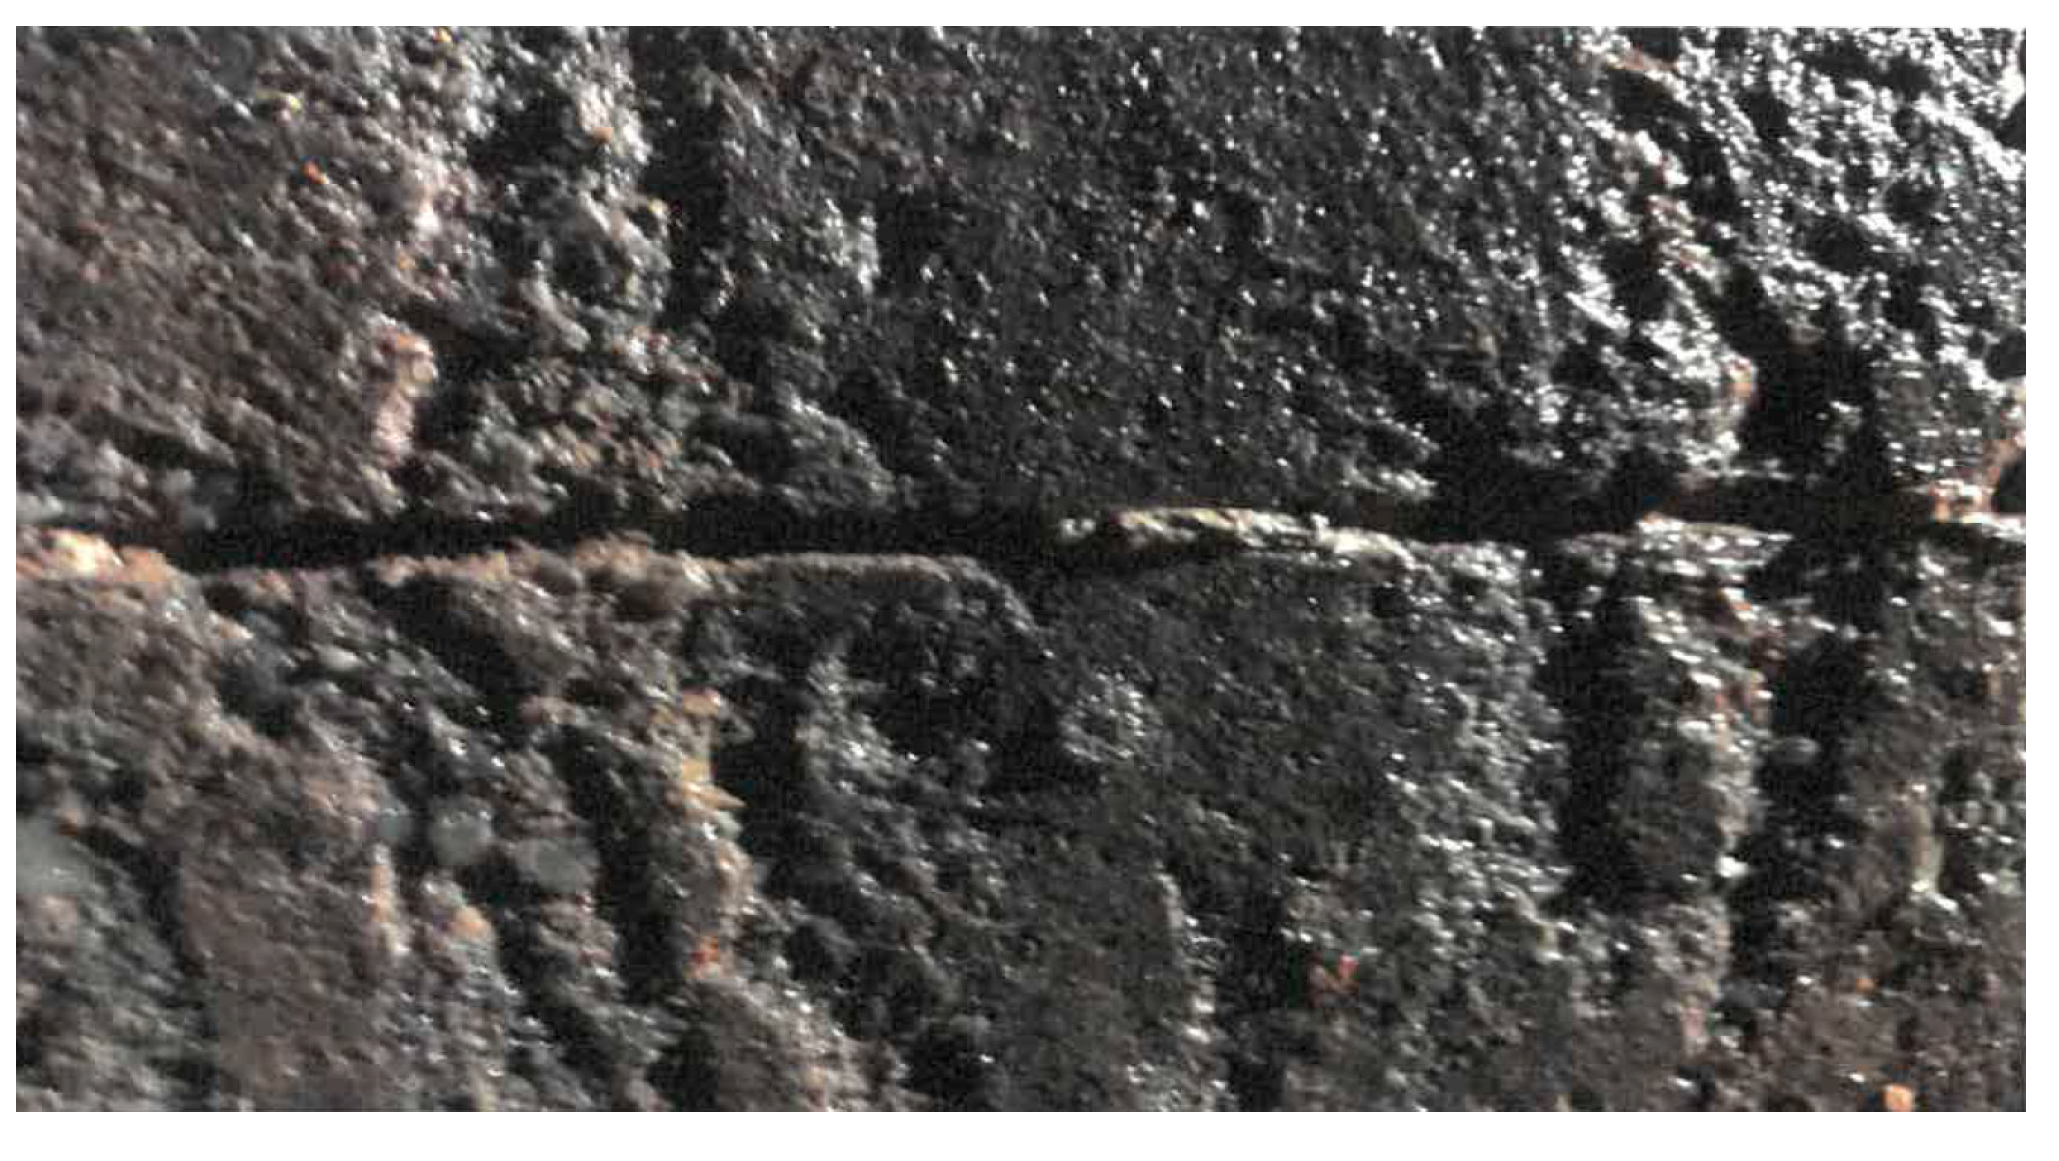
4.1. Reinforced Concrete Tank in a Sewage Treatment Plant of a Large City
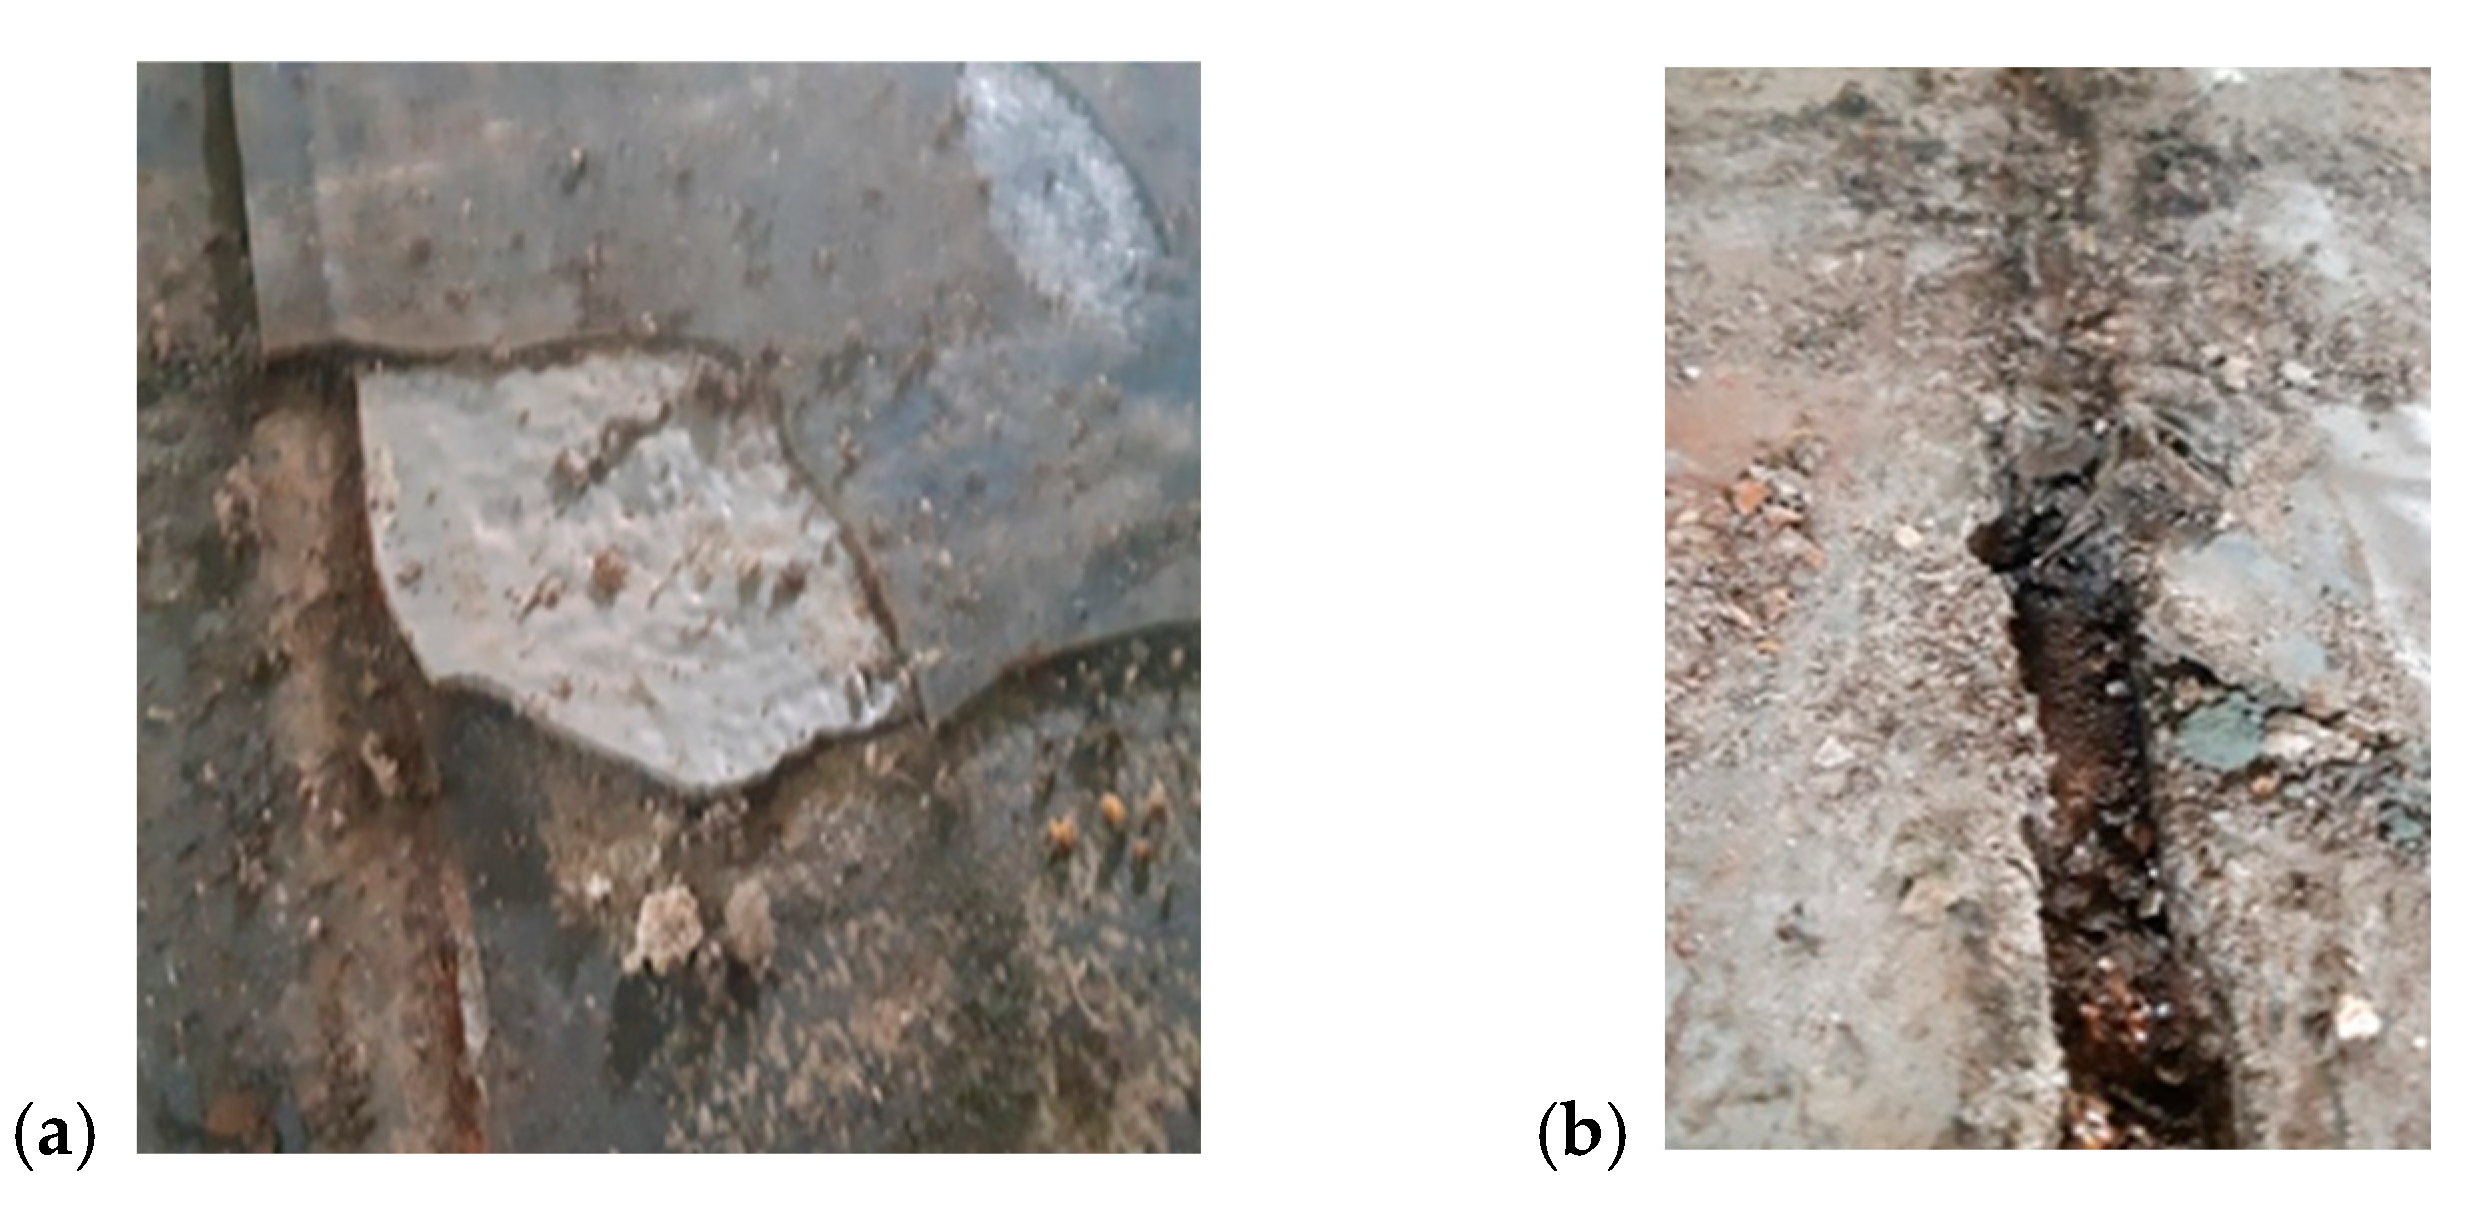
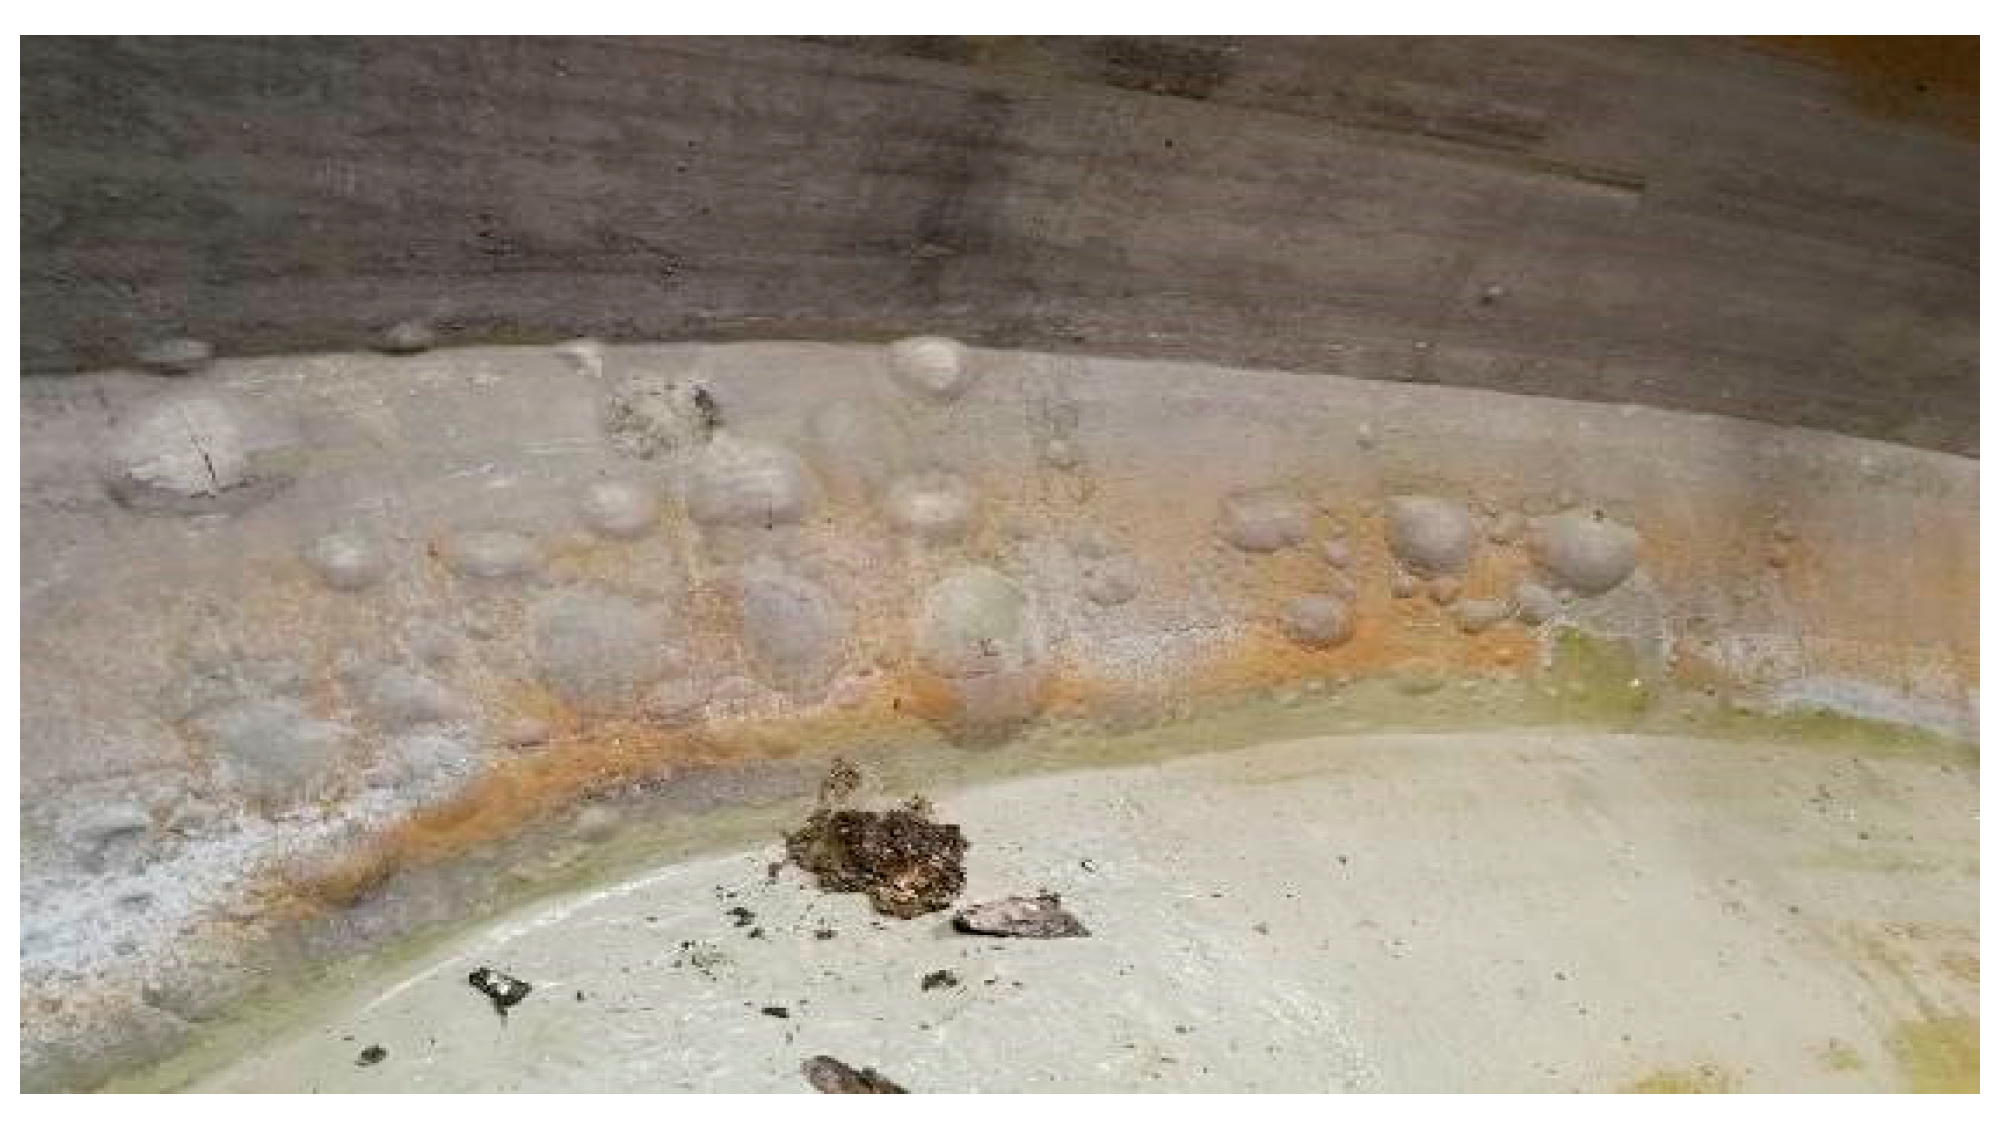
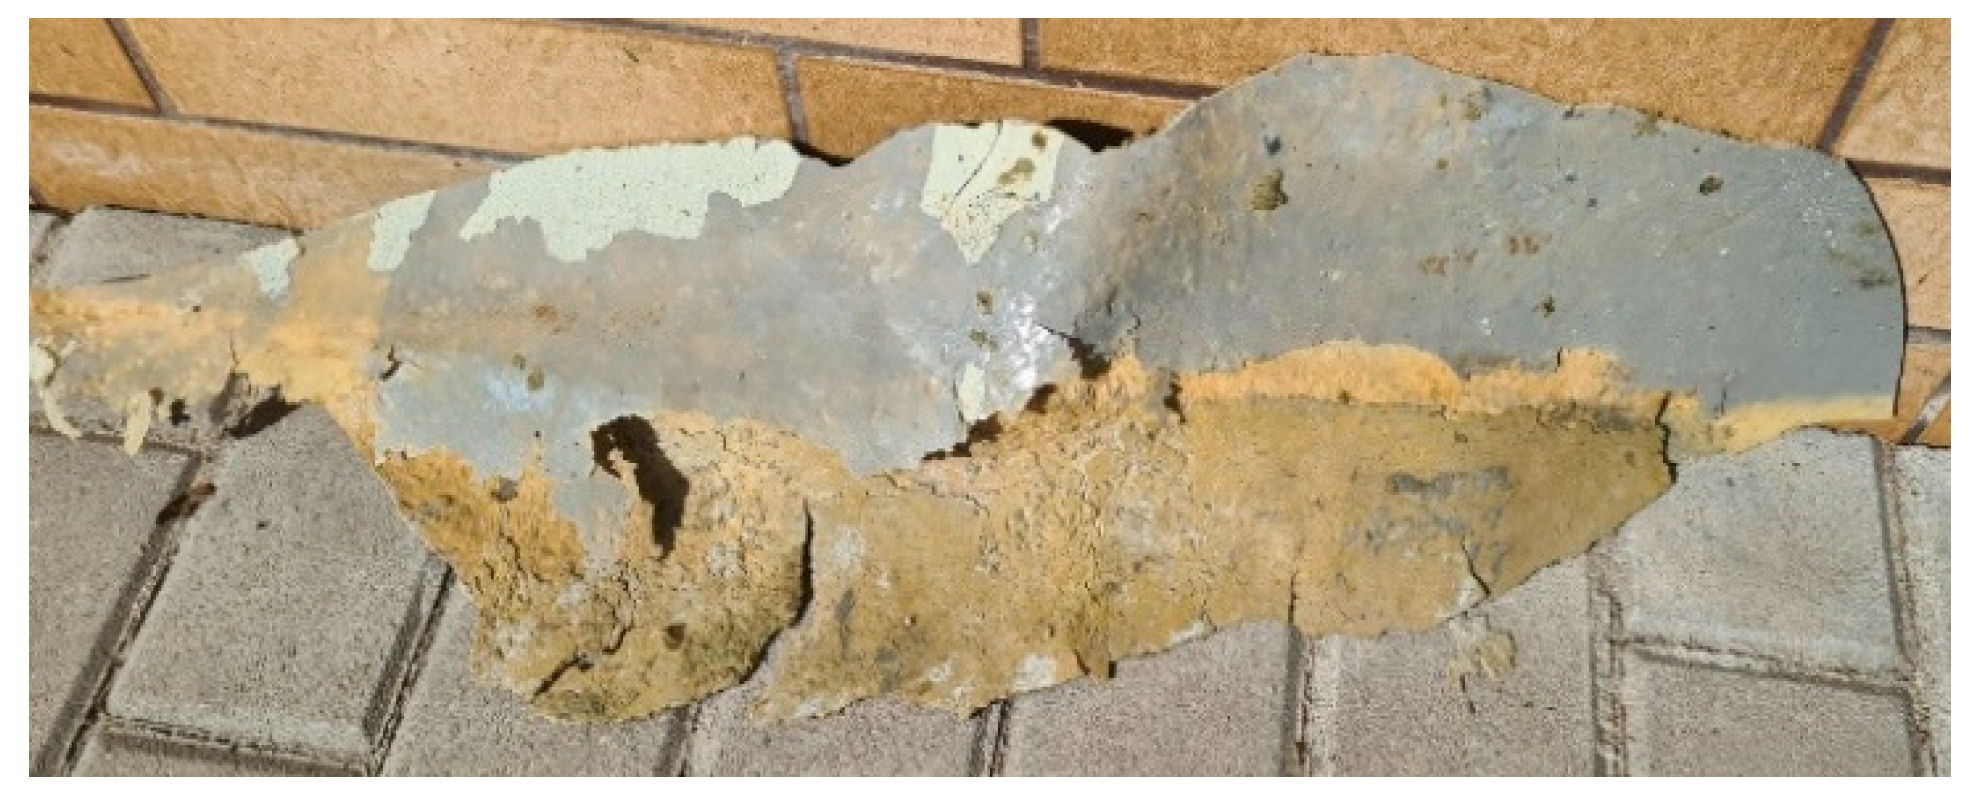
4.2. Municipal Sewage Tank in the District Town
5. Risk Management
5.1. Probability Matrix and Impact Matrix on Cost, Time, and Quality
5.2. The Most Important Types of Risk
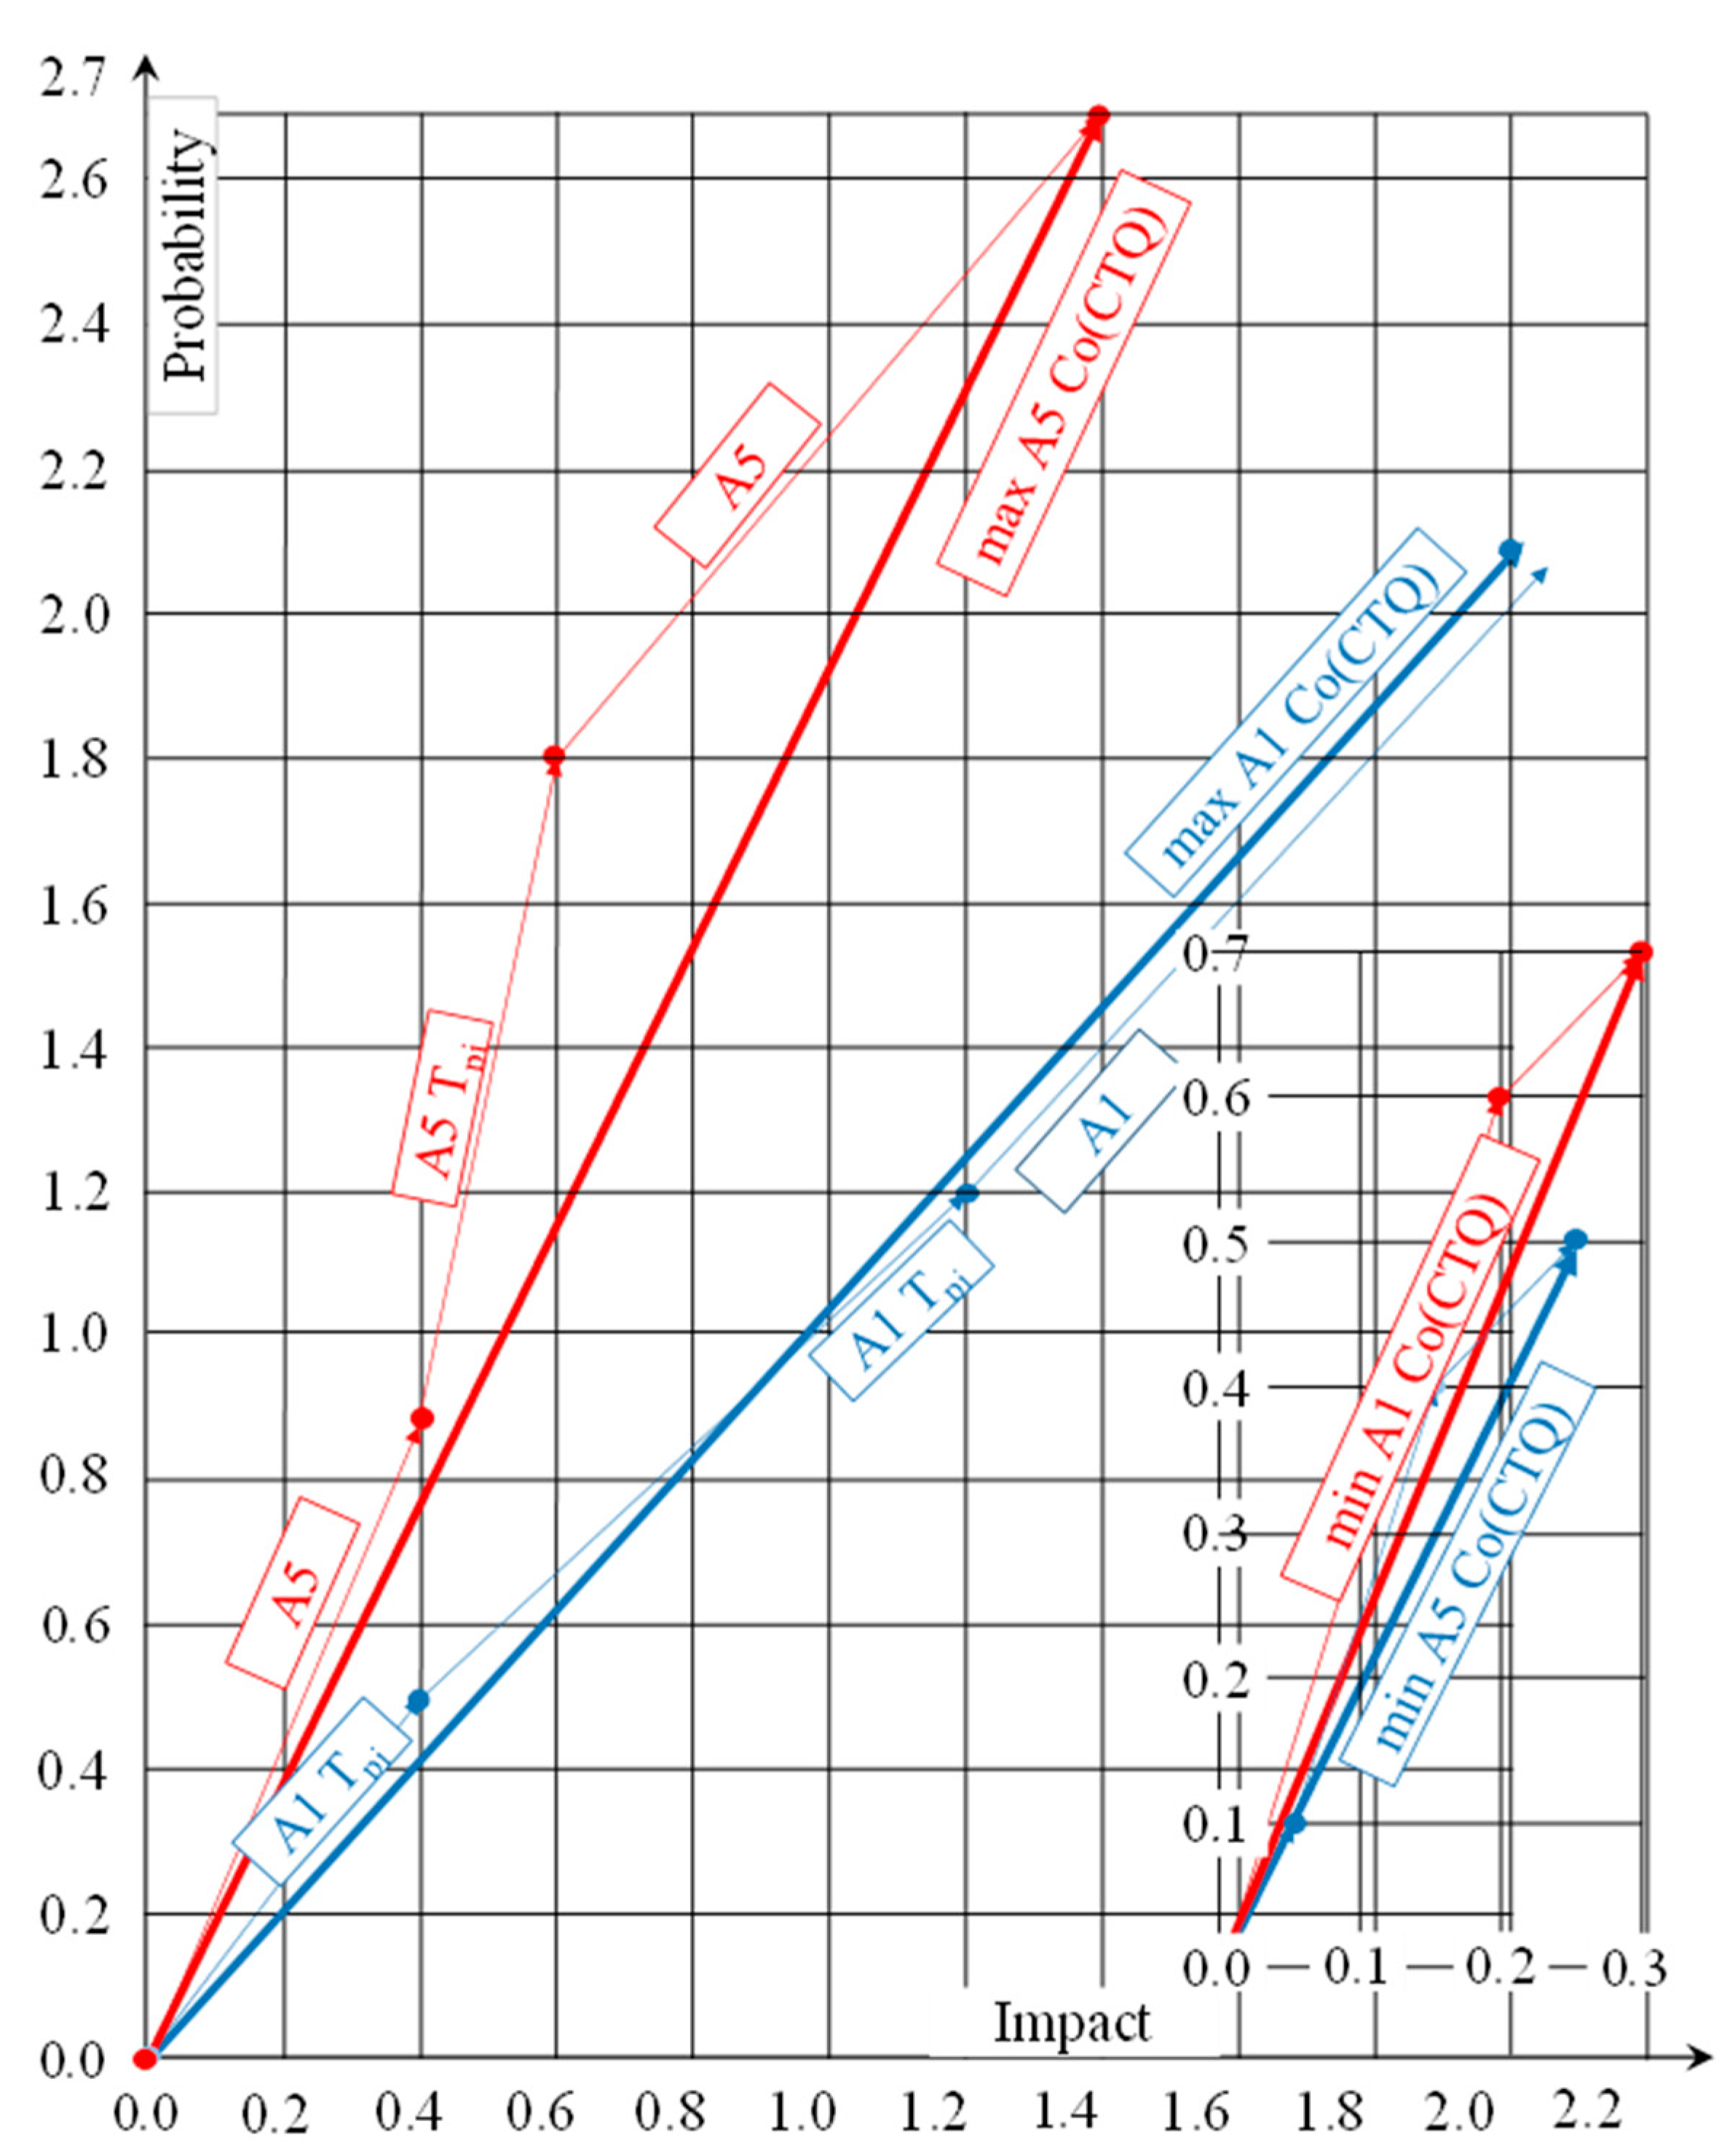
5.3. Correlation Between Risk Factors and Their Individual Types—Risk Assessment
6. Summary
7. Conclusions
Author Contributions
Funding
Data Availability Statement
Conflicts of Interest
References
- Directive (Eu) 2024/3019 of the European Parliament and of the Council of 27 November 2024, Concerning Urban Wastewater Treatment. 2024. Available online: https://eur-lex.europa.eu/eli/dir/2024/3019/oj/eng (accessed on 5 June 2025).
- Büttner, O.; Jawitz, J.W.; Birk, S.; Borchardt, D. Why Wastewater Treatment Fails to Protect Stream Ecosystems in Europe. Water Res. 2022, 217, 118382. [Google Scholar] [CrossRef]
- Gradziuk, P.; Gradziuk, B. Gospodarka Niskoemisyjna—Nowe Wyzwanie Dla Gmin Wiejskich. Wieś I Rol. 2016, 1, 105–126. [Google Scholar] [CrossRef]
- European Funds for Infrastructure, Climate, Environment 2021–2027, European Ministry for Infrastructure, Climate, Environment 2012–2027. Available online: https://www.feniks.gov.pl/ (accessed on 5 June 2025).
- Lipińska, D. Environmental Engineering Fundamentals; University of Lodz Publishing House: Łódź, Poland, 2016; pp. 117–150. [Google Scholar]
- Sewage Management—Ministry of Infrastructure—Gov.pl Portal. Ministry of Infrastructure. Available online: https://www.gov.pl/web/infrastruktura/gospodarka-sciekowa (accessed on 5 June 2025).
- Gajewska, E.; Ropel, M. Risk Management Practices in a Construction Project—A Case Study. Master’s Thesis, Chalmers University of Technology, Göteborg, Sweden, 2011. [Google Scholar]
- Acebes, F.; González-Varona, J.M.; López-Paredes, A.; Pajares, J. Beyond Probability-impact Matrices in Project Risk Management: A Quantitative Methodology for Risk Prioritisation. Humanit. Soc. Sci. Commun. 2024, 11, 670. [Google Scholar] [CrossRef]
- Rane, S.B.; Potdar, P.R.; Rane, S. Development of Project Risk Management Framework Based on Industry 4.0 Technologies. Benchmarking Int. J. 2019, 28, 1451–1481. [Google Scholar] [CrossRef]
- Banera, J.; Maj, M. Reasons for lack of adhesion of polyurea coatings to concrete substrates in chemically aggressive water tanks. Mater. Bud. 2024, 1, 25–31. [Google Scholar] [CrossRef]
- Maj, M.; Ubysz, A. The reasons for the loss of polyurea coatings adhesion to the concrete substrate in chemically aggressive water tanks. Eng. Fail. Anal. 2022, 142, 106774. [Google Scholar] [CrossRef]
- Hatush, Z.; Skitmore, M. Contractor selection using multicriteria utility theory: An additive model. Build. Environ. 1998, 33, 105–115. [Google Scholar] [CrossRef]
- Logoń, D.; Maj, M.; Rybak, J.; Ubysz, A.; Wojtowicz, A. Chemical hazards in construction industry. E3S Web Conf. 2019, 97, 03032. [Google Scholar] [CrossRef]
- Aguirre-Guerrero, A.M.; Robayo-Salazar, R.A.; de Gutiérrez, R.M. A novel geopolymer application: Coatings to protect reinforced concrete against corrosion. Appl. Clay Sci. 2017, 135, 437–446. [Google Scholar] [CrossRef]
- Guo, Y.; Shen, A.; Sun, X. Exploring Polymer-Modified Concrete and Cementitious Coating with High-Durability for Roadside Structures in Xinjiang, China. Adv. Mater. Sci. Eng. 2017, 2017, 9425361. [Google Scholar] [CrossRef]
- Garbowski, T.; Pawlak, T.G.; Szymczak-Graczyk, A. Efficient Load-Bearing Capacity Assessment of a Degraded Concrete Manhole Using Sectional Homogenization. Materials 2024, 17, 5883. [Google Scholar] [CrossRef]
- Jiang, G.; Keller, J.; Bond, P.L.; Yuan, Z. Predicting concrete corrosion of sewers using artificial neural network. Water Res. 2016, 92, 52–60. [Google Scholar] [CrossRef] [PubMed]
- Pawlak, T.G.; Szymczak-Graczyk, A.; Garbowski, T. Three-layer Repair Coating System for Manholes, Pump Stations, and Tanks in Aggressive Sulfate Environment. Civ. Environ. Eng. Rep. 2025, 35, 1–19. [Google Scholar] [CrossRef]
- Parniani, S.; Toutanji, H. Monotonic and fatigue performance of RC beams strengthened with a polyurea coating system. Constr. Build. Mater. 2015, 101, 22–29. [Google Scholar] [CrossRef]
- Hatush, Z.; Skitmore, M. Criteria for contactor selection. Constr. Manag. Econ. 1997, 15, 19–38. [Google Scholar] [CrossRef]
- Kasprowicz, T. Inżynieria Przedsięwzięć Budowlanych Rekomendowane Metody i Techniki; PAN: Warszawa, Poland, 2015; pp. 47–74. [Google Scholar]
- Westerveld, E. The Project Excellence Model®: Linking success criteria and critical success factors. Int. J. Proj. Manag. 2003, 21, 411–418. [Google Scholar] [CrossRef]
- Marleni, N.; Gray, S.; Sharma, A.; Burn, S.; Muttil, N. Impact of Water Source Management Practices in Residential Areas on Sewer Networks—A Review. Water Sci. Technol. 2012, 65, 624–642. [Google Scholar] [CrossRef]
- Macek, D.; Vitásek, S. Risk Analysis in Building Renovations: Strategies for Investors. Buildings 2024, 14, 2219. [Google Scholar] [CrossRef]
- Machen, J.D. Common Causes of Blistering and Bubbling in Industrial Coatings. KTA-Tator, 12 July 2016. Available online: https://kta.com/kta-university/blistering-bubbling-coatings (accessed on 5 June 2025).
- Finch, G.; Hubbs, B.; Bambino, R. Osmosis and the Blistering of Polyurethane Waterproofing Membranes. In Proceedings of the 12th Canadian Conference on Building Science and Technology, Montreal, QC, Canada, 6 May 2009; Available online: www.brikbase.org/sites/default/files/best2_hubbs_finch.pdf (accessed on 5 June 2025).
- Finch, G.; Hubbs, B.; Bambino, R. Osmosis and the Blistering of Liquid Applied Polyurethane Roof Membranes; PE RDH Building Engineering Ltd.: Vancouver, BC, Canada, 2010. [Google Scholar]
- Aguirre-Guerrero, A.M.; Mejía de Gutiérrez, R. Alkali-activated protective coatings for reinforced concrete exposed to chlorides. Constr. Build. Mater. 2021, 268, 121098. [Google Scholar] [CrossRef]
- Maj, M.; Ubysz, A.; Tamrazyan, A. Durability of polyurethane—Cement floors. MATEC Web Conf. 2018, 251, 02026. [Google Scholar] [CrossRef]
- Maj, M.; Ubysz, A. Polyurea as a material to reinforce the surface and increase the waterproofing of concrete. In Proceedings of the FIB 2018—Proceedings for the 2018 fib Congress: Better, Smarter, Stronger, Melbourne, Australia, 7–11 October 2018; pp. 1933–1947. [Google Scholar]
- PMI (Project Management Institute). A Guide to the Project Management Body of Knowledge, 3rd ed.; PMI: Newtown Square, PA, USA, 2004. [Google Scholar]
- Klemetti, A. Risk Management in Construction Project Networks; Report 2006/2; Helsinki University of Technology, Laboratory of Industrial Management: Espoo, Finland, 2006. [Google Scholar]
- KPMG International. Global Construction Survey, Climbing the Curve; KPMG International: Amstelveen, The Netherlands, 2015. [Google Scholar]
- Herbsman, Z.; Ellis, R. Multiparameter bidding system innovation in contract administration. J. Constr. Eng. Manag. 1992, 118, 1436. [Google Scholar] [CrossRef]
- Demir, S.; Bryde, D.; Fearon, D.; Ochieng, E.G. A tool for integrating time, cost and quality perspectives in Probability Impact (P-I) Tables. Int. J. Proj. Organ. Manag. 2014, 6, 303–318. [Google Scholar] [CrossRef]

| Title 1 | Title 2 |
|---|---|
| A1 | The lack of diagnostics of the tank’s technical condition, the impact of this factor before the investment process begins, and the probability of this factor occurring in the event of the investment being implemented without prior expert opinion or technical assessment (diagnostics) were estimated to be quite high. |
| A1a | Remedies: delegating diagnostics to a designer who does not have sufficient competencies increases the impact of this factor on the risk and increases the probability of this factor occurring. |
| A1b | Remedies: delegating diagnostics to a designer with the required skills. |
| A1c | Remedial measures: additionally, commissioning monitoring works and additional research in preparation for the investment under the supervision of an experienced designer who is at constant disposal. |
| A2 | Delay in the start of work for up to 6 months. With this delay no major threats or complications should be expected. However, the longer the break, the more serious the effects may be, and the probability of their occurrence will increase. |
| A2a | Delay of more than 6 months and even up to 24 months; with this delay the effects of this factor’s influence and the probability of occurrence increase to high values. |
| A2b | Delay of more than 24 months; with this delay the effects of this factor’s influence and the probability of occurrence increase to high values. |
| A2c | Delay with a break of 24 months or more, but after repeated diagnostics, updating of design documentation, and implementation of remedial actions, the risk is minimized to low. |
| A3 | Deficiencies or errors in the assumptions at the planning and creation stage of the Utility Operation Program (PHU). |
| A3a | Remedy: correction of deficiencies or errors in the assumptions in planning and design, removal of insufficiently precisely described deadlines for the execution of works in the plans and schedules, and specification of technical data concerning the materials used for renovation. |
| A4 | A faulty costing method used as a basis for establishing a budget for tank renovation may have a high impact on the deviation from the actual investment costs. It will probably have a medium impact on time and a high impact on costs, but it may have a very high impact on quality. |
| A4a | Remedy: taking into account constantly changing current input prices, product prices, etc. |
| A4b | Ongoing control and monitoring of works. |
| A5 | Choosing the wrong designer is a high-risk factor. |
| A5a | Remedy: apply increased criteria in selecting a design. |
| A6 | Choosing the wrong technology; choosing the right protective coating technology at the lowest price. |
| A6a | Remedy: selection of technology that meets all the criteria for selecting polyurea for the substrate and fluid requirements. |
| A7 | Errors in the assumptions regarding the choice of method for performing individual tasks. Widely accepted and practiced methods are adopted without going into a separate case. |
| A7a | Remedy: this activity can be reduced by performing prior tests on selected test fields of the application being performed. |
| A8 | Remedy: monitoring the selection of appropriate construction materials, the control of deliveries, and checking the state of the contractor’s machinery, etc. |
| A8a | Remedy: monitoring the selection of construction materials, control of the contractor’s technical equipment, etc. |
| A9 | Choosing the wrong contractor: A contractor without knowledge of the specific case of polyurea application is a threat to the implementation of the investment. |
| A9a | Remedy: the selection of the wrong contractor can be minimized by constant control carried out by the Investor Supervision Inspector. |
| A9b | The remedy introducing the obligation of daily control measurements of the works performed. |
| A9c | Remedy: dynamic and analytical selection of offers submitted by contractors, thorough monitoring of offers, and preliminary detailed talks with contractors. |
| A10 | Incorrect choice of investment implementation date, e.g., winter, seasonal work, etc. |
| A10a | Remedy: include in the contract provisions excluding work during non-conforming periods. |
| A11 | Inadequately prepared technical supervision without required competences. |
| A11a | Remedy: include provisions in the contract regarding professional technical supervision and selective selection through, for example, a tender. |
| Probability | Risk | |
|---|---|---|
| Qualitative | Quantitative Scale | Linear Result |
| Very low | 1–19% | 0.1 |
| Low | 20–39% | 0.3 |
| Medium | 40–59% | 0.5 |
| High | 60–79% | 0.7 |
| Very high | >79% | 0.9 |
| Assessment of the Impact of the Lack of Diagnostics of the Technical Condition of the Tank Before Starting the Investment Process | ||||
|---|---|---|---|---|
| Cost | Time | Quality | Qualitative Scale | Measurable Result |
| Negligible cost increase | Insignificant timeout | Slightly noticeable reduction in quality | Very low | 0.05 |
| Cost increase < 10% | Timeout < 5% | This only applies to very demanding applications | Low | 0.1 |
| Cost increase by 10–20% | Timeout by 5–10% | Decreasing the quality requires the investor’s approval | Medium | 0.2 |
| Cost increase by 20–40% | Timeout by 0–20% | Decreasing in the quality unacceptable to the investor | High | 0.4 |
| Cost increase by >40% | Timeout by 20% | Decreasing in the quality that makes the object unusable | Very high | 0.8 |
| Table “P/I” for Cost | |||||||
|---|---|---|---|---|---|---|---|
| Impact of risk
, , and | Probability of Risk , Time and Quality | ||||||
| 0.100 | 0.300 | 0.500 | 0.700 | 0.900 | i = 1 | ||
| 0.050 | 0.005 | 0.015 | 0.025 | 0.035 | 0.045 | 2 | |
| 0.100 | 0.010 | 0.030 | 0.050 | 0.070 | 0.090 | 3 | |
| 0.200 | 0.020 | 0.060 | 0.100 | 0.140 | 0.180 | 4 | |
| 0.400 | 0.030 | 0.100 | 0.160 | 0.220 | 0.290 | 5 | |
| 0.800 | 0.080 | 0,240 | 0.400 | 0.560 | 0.720 | 6 | |
| j = 1 | 2 | 3 | 4 | 5 | 6 | ||
| , | Risk Assessment |
|---|---|
| Lower than 0.05 | Low impact on investment implementation |
| From 0.06 to 0.15 | Warning binding on investor’s attention |
| Greater than 0.15 | Signal, corrective actions should be taken |
| Composition (CTQ) | Risk Assessment |
|---|---|
| Lower than 0.86 | Low risk level, monitoring recommended |
| From 0.86 to 1.7 | Medium risk level, corrective decision making |
| Greater than 1.7 | High risk level, implementation of remedial actions |
| Parameters | CTQ | |||||||||||||||
| I Factors of Impact | Cost | 0.40 | 0.10 | 0.10 | 0.10 | 0.10 | 0.40 | 0.10 | 0.80 | 0.05 | 0.40 | 0.20 | 0.10 | 0.40 | 0.05 | |
| Time | 0.80 | 0.20 | 0.20 | 0.10 | 0.20 | 0.80 | 0.20 | 0.80 | 0.10 | 0.20 | 0.20 | 0.05 | 0.20 | 0.10 | ||
| Quality | 0.80 | 0.40 | 0.40 | 0.10 | 0.10 | 0.80 | 0.10 | 0.80 | 0.10 | 0.80 | 0.40 | 0.05 | 0.80 | 0.10 | ||
| P Probability of occurrence | Cost | 0.50 | 0.30 | 0.50 | 0.30 | 0.10 | 0.90 | 0.30 | 0.90 | 0.30 | 0.90 | 0.50 | 0.10 | 0.90 | 0.10 | |
| Time | 0.70 | 0.30 | 0.50 | 0.30 | 0.10 | 0.90 | 0.50 | 0.90 | 0.10 | 0.50 | 0.30 | 0.10 | 0.90 | 0.30 | ||
| Quality | 0.90 | 0.50 | 0.70 | 0.10 | 0.10 | 0.90 | 0.10 | 0.90 | 0.10 | 0.70 | 0.30 | 0.10 | 0.90 | 0.10 | ||
| P/I Matrix of Prob./Impact | Cost | 0.20 | 0.03 | 0.05 | 0.03 | 0.01 | 0.36 | 0.03 | 0.72 | 0.02 | 0.36 | 0.10 | 0.01 | 0.36 | 0.01 | |
| Time | 0.56 | 0.06 | 0.10 | 0.03 | 0.02 | 0.72 | 0.10 | 0.72 | 0.01 | 0.10 | 0.06 | 0.01 | 0.18 | 0.03 | ||
| Quality | 0.72 | 0.02 | 0.28 | 0.01 | 0.01 | 0.72 | 0.01 | 0.72 | 0.01 | 0.56 | 0.12 | 0.01 | 0.72 | 0.01 | ||
| Parameters | CTQ | A6 | A6a | A7 | A7a | A8 | A8a | A9 | A9a | A9b | A9c | A10 | A10a | A11 | A11a | |
| I Factors of Impact | Cost | 0.40 | 0.10 | 0.40 | 0.10 | 0.40 | 0.20 | 0.80 | 0.40 | 0.10 | 0.05 | 0.40 | 0.10 | 0.40 | 0.05 | |
| Time | 0.20 | 0.05 | 0.40 | 0.20 | 0.80 | 0.10 | 0.80 | 0.80 | 0.20 | 0.10 | 0.40 | 0.10 | 0.80 | 0.05 | ||
| Quality | 0.80 | 0.10 | 0.80 | 0.10 | 0.80 | 0.10 | 0.80 | 0.20 | 0.10 | 0.05 | 0.80 | 0.20 | 0.80 | 0.05 | ||
| P Probability of occurrence | Cost | 0.70 | 0.10 | 0.90 | 0.10 | 0.50 | 0.10 | 0.90 | 0.50 | 0.30 | 0.10 | 0.70 | 0.30 | 0.70 | 0.10 | |
| Time | 0.50 | 0.30 | 0.90 | 0.10 | 0.90 | 0.10 | 0.90 | 0.70 | 0.10 | 0.30 | 0.90 | 0.30 | 0.50 | 0.30 | ||
| Quality | 0.90 | 0.10 | 0.90 | 0.10 | 0.70 | 0.30 | 0.90 | 0.50 | 0.30 | 0.10 | 0.90 | 0.10 | 0.90 | 0.10 | ||
| P/I Matrix of Prob./Impact | Cost | 0.28 | 0.01 | 0.36 | 0.01 | 0.20 | 0.02 | 0.72 | 0.20 | 0.03 | 0.01 | 0.28 | 0.03 | 0.28 | 0.01 | |
| Time | 0.10 | 0.02 | 0.36 | 0.02 | 0.72 | 0.01 | 0.72 | 0.56 | 0.02 | 0.03 | 0.36 | 0.03 | 0.40 | 0.02 | ||
| Quality | 0.72 | 0.01 | 0.72 | 0.01 | 0.56 | 0.03 | 0.72 | 0.10 | 0.03 | 0.01 | 0.72 | 0.02 | 0.72 | 0.01 | ||
| Extremely High-Risk Assessment Values | Average Risk Assessment Values | Extremely Low-Risk Assessment Values | |||||||
|---|---|---|---|---|---|---|---|---|---|
| Cost | Time | Quality | Cost | Time | Quality | Cost | Time | Quality | |
| A1 | 0.20 | 0.56 | 0.72 | 0.05 | 0.10 | 0.28 | 0.03 | 0.03 | 0.01 |
| A2 | 0.36 | 0.72 | 0.72 | 0.06 | 0.20 | 0.20 | 0.03 | 0.03 | 0.01 |
| A3 | 0.72 | 0.72 | 0.72 | 0.28 | 0.10 | 0.72 | 0.00 | 0.00 | 0.01 |
| A4 | 0.36 | 0.10 | 0.56 | 0.14 | 0.06 | 0.20 | 0.01 | 0.01 | 0.01 |
| A5 | 0.36 | 0.18 | 0.72 | 0.00 | 0.00 | 0.00 | 0.01 | 0.03 | 0.01 |
| A6 | 0.28 | 0.10 | 0.72 | 0.00 | 0.00 | 0.00 | 0.01 | 0.02 | 0.01 |
| A7 | 0.36 | 0.36 | 0.72 | 0.02 | 0.01 | 0.03 | 0.01 | 0.02 | 0.01 |
| A8 | 0.20 | 0.72 | 0.56 | 0.10 | 0.09 | 0.07 | 0.02 | 0.01 | 0.03 |
| A9 | 0.72 | 0.72 | 0.72 | 0.64 | 0.72 | 0.72 | 0.01 | 0.03 | 0.01 |
| A10 | 0.28 | 0.36 | 0.72 | 0.03 | 0.03 | 0.02 | 0.03 | 0.03 | 0.02 |
| A11 | 0.28 | 0.40 | 0.72 | 0.28 | 0.40 | 0.72 | 0.01 | 0.02 | 0.01 |
| 0.40 | 0.80 | 0.80 | 2.00 | 2.90 | 0.10 | 0.20 | 0.40 | 0.70 | 1.84 | ||
| 0.50 | 0.70 | 0.90 | 2.10 | 0.50 | 0.50 | 0.70 | 1.70 | ||||
| 0.40 | 0.80 | 0.80 | 2.00 | 3.36 | 0.20 | 0.40 | 0.40 | 1.00 | 1.64 | ||
| 0.90 | 0.90 | 0.90 | 2.70 | 0.30 | 0.50 | 0.50 | 1.30 | ||||
| 0.80 | 0.80 | 0.80 | 2.40 | 3.48 | 0.40 | 0.20 | 0.80 | 1.40 | 2.52 | ||
| 0.90 | 0.90 | 0.90 | 2.70 | 0.70 | 0.50 | 0.90 | 2.10 | ||||
| 0.40 | 0.20 | 0.80 | 1.40 | 2.69 | 0.20 | 0.20 | 0.40 | 0.80 | 1.70 | ||
| 0.90 | 0.50 | 0.70 | 2.10 | 0.70 | 0.30 | 0.50 | 1.50 | ||||
| 0.40 | 0.20 | 0.80 | 1.40 | 3.18 | 0.00 | 0.00 | 0.00 | 0.00 | 0.25 | ||
| 0.90 | 0.90 | 0.90 | 2.70 | 0.05 | 0.10 | 0.10 | 0.25 | ||||
| 0.40 | 0.20 | 0.90 | 1.50 | 2.72 | 0.10 | 0.05 | 0.10 | 0.25 | 0.25 | ||
| 0.70 | 0.50 | 0.90 | 2.10 | 0.00 | 0.00 | 0.00 | 0.00 | ||||
| 0.50 | 0.40 | 0.80 | 1.70 | 3.27 | 0.20 | 0.10 | 0.10 | 0.40 | 0.64 | ||
| 0.90 | 0.90 | 0.90 | 2.70 | 0.10 | 0.10 | 0.30 | 0.50 | ||||
| 0.40 | 0.80 | 0.80 | 2.00 | 2.90 | 0.20 | 0.10 | 0.10 | 0.40 | 2.14 | ||
| 0.50 | 0.90 | 0.70 | 2.10 | 0.50 | 0.90 | 0.70 | 2.10 | ||||
| 0.80 | 0.80 | 0.80 | 2.40 | 3.40 | 0.80 | 0.80 | 0.80 | 2.40 | 3.54 | ||
| 0.80 | 0.90 | 0.90 | 2.60 | 0.80 | 0.90 | 0.90 | 2.60 | ||||
| 0.40 | 0.40 | 0.80 | 1.60 | 3.07 | 0.10 | 0.10 | 0.20 | 0.40 | 0.81 | ||
| 0.70 | 0.90 | 0.90 | 2.50 | 0.30 | 0.30 | 0.10 | 0.70 | ||||
| 0.40 | 0.80 | 0.80 | 2.00 | 2.90 | 0.40 | 0.80 | 0.80 | 2.00 | 2.90 | ||
| 0.70 | 0.50 | 0.90 | 2.10 | 0.70 | 0.50 | 0.90 | 2.10 | ||||
| 3.10 | 1.53 | ||||||||||
| 0.10 | 0.10 | 0.10 | 0.30 | 1.04 | ||
| 0.30 | 0.30 | 0.10 | 0.70 | |||
| 0.10 | 0.20 | 0.10 | 0.40 | 1.27 | ||
| 0.30 | 0.50 | 0.10 | 0.90 | |||
| 0.05 | 0.10 | 0.10 | 0.25 | 0.87 | ||
| 0.30 | 0.10 | 0.10 | 0.50 | |||
| 0.10 | 0.05 | 0.05 | 0.20 | 0.70 | ||
| 0.10 | 0.10 | 0.10 | 0.30 | |||
| 0.05 | 0.10 | 0.10 | 0.25 | 0.87 | ||
| 0.10 | 0.30 | 0.10 | 0.50 | |||
| 0.10 | 0.05 | 0.10 | 0.25 | 0.87 | ||
| 0.10 | 0.30 | 0.10 | 0.50 | |||
| 0.10 | 0.20 | 0.10 | 0.40 | 0.94 | ||
| 0.10 | 0.10 | 0.10 | 0.30 | |||
| 0.20 | 0.10 | 0.10 | 0.40 | 1.02 | ||
| 0.10 | 0.10 | 0.30 | 0.50 | |||
| 0.05 | 0.10 | 0.05 | 0.20 | 0.81 | ||
| 0.10 | 0.30 | 0.10 | 0.50 | |||
| 0.10 | 0.10 | 0.20 | 0.40 | 1.14 | ||
| 0.30 | 0.30 | 0.10 | 0.70 | |||
| 0.05 | 0.05 | 0.05 | 0.15 | 0.74 | ||
| 0.10 | 0.30 | 0.10 | 0.50 | |||
| = | 0.95 | |||||
Disclaimer/Publisher’s Note: The statements, opinions and data contained in all publications are solely those of the individual author(s) and contributor(s) and not of MDPI and/or the editor(s). MDPI and/or the editor(s) disclaim responsibility for any injury to people or property resulting from any ideas, methods, instructions or products referred to in the content. |
© 2025 by the authors. Licensee MDPI, Basel, Switzerland. This article is an open access article distributed under the terms and conditions of the Creative Commons Attribution (CC BY) license (https://creativecommons.org/licenses/by/4.0/).
Share and Cite
Banera, J.; Maj, M.; Musa, A.H. Risk Management in the Analysis of Failures of Protective Coatings in Municipal Sewage Treatment Plant Tanks. Buildings 2025, 15, 2254. https://doi.org/10.3390/buildings15132254
Banera J, Maj M, Musa AH. Risk Management in the Analysis of Failures of Protective Coatings in Municipal Sewage Treatment Plant Tanks. Buildings. 2025; 15(13):2254. https://doi.org/10.3390/buildings15132254
Chicago/Turabian StyleBanera, Janusz, Marek Maj, and Ahmad H. Musa. 2025. "Risk Management in the Analysis of Failures of Protective Coatings in Municipal Sewage Treatment Plant Tanks" Buildings 15, no. 13: 2254. https://doi.org/10.3390/buildings15132254
APA StyleBanera, J., Maj, M., & Musa, A. H. (2025). Risk Management in the Analysis of Failures of Protective Coatings in Municipal Sewage Treatment Plant Tanks. Buildings, 15(13), 2254. https://doi.org/10.3390/buildings15132254