Review

A Review of the Potential of Drone-Based Approaches for Integrated Building Envelope Assessment

1
Department of Sustainable Resources Management, State University of New York College of Environmental Science and Forestry, Syracuse, NY 13210, USA
2
Department of Mechanical and Aerospace Engineering, Syracuse University, Syracuse, NY 13244, USA
3
Amazon, Arlington, VA 20148, USA
*
Author to whom correspondence should be addressed.
Buildings 2025, 15(13), 2230; https://doi.org/10.3390/buildings15132230
Submission received: 9 May 2025 / Revised: 16 June 2025 / Accepted: 23 June 2025 / Published: 25 June 2025

Abstract

The urgent need for affordable and scalable building retrofit solutions has intensified due to stringent clean energy targets. Traditional building energy audits, which are essential in assessing energy performance, are often time-consuming and costly because of the extensive field analysis required. There has been a gradual shift towards the public use of drones, which present opportunities for effective remote procedures that could disrupt a variety of built environment disciplines. Drone-based approaches to data collection offer a great opportunity for the analysis and inspection of existing building stocks, enabling architects, engineers, energy auditors, and owners to document building performance, visualize heat transfer using infrared thermography, and create digital models using 3D photogrammetry. This study provides a review of the potential of a drone-based approach to integrated building envelope assessment, aiming to streamline the process. By evaluating various scanning techniques and their integration with drones, this research explores how drones can enhance data collection for defect identification, as well as digital model creation. A proposed drone-based workflow is tested through a case study in Syracuse, New York, demonstrating its feasibility and effectiveness in creating 3D models and conducting energy simulations. The study also discusses various challenges associated with drone-based approaches, including data accuracy, environmental conditions, operator training, and regulatory compliance, offering practical solutions and highlighting areas for further research. A discussion of the findings underscores the potential of drone technology to revolutionize building inspections, making them more efficient, accurate, and scalable, thus supporting the development of sustainable and energy-efficient buildings.

1. Introduction

Buildings account for approximately 40% of the annual greenhouse gas emissions in the United States. In New York State (NYS), approximately 80% of all residential and commercial buildings were constructed before the energy codes emerged in the 1970s [1]. Therefore, there is a significant need for affordable and scalable building retrofit solutions with low embodied emissions to meet the targets in the NYS Climate Leadership and Community Protection Act of 2019. A building energy audit is the initial step to quantify a building’s energy performance and reveal its energy-saving potential [2]. However, performing a high-level energy audit requires detailed field analysis and is often time-consuming and expensive. Therefore, there is a need for digital solutions to make different parts of the building assessment process affordable, efficient, and scalable [3]. The overarching goal of this work is to provide an overview and evaluation of building envelope scanning techniques and their use in the collection of inputs for building energy models; we also investigate the benefits of using a drone-based approach for data collection from building exteriors, the challenges involved, and how these approaches can be more effective. In sum, this research is focused on developing a drone-based approach and identifying sensor configurations for effective data collection, which is required to create digital building models, assess the condition, and identify envelope defects [4]. The related research questions are as follows:
  • Which type of data is needed for building inspection, as the initial step for building energy retrofit design, and what are the benefits of a drone-based approach to inspecting building envelopes?
  • Which sensors can be integrated with drones for effective data collection towards creating 3D point clouds and assessing building defects?
  • Which flight path conditions and parameters are appropriate for the effective capture of data from an existing building?
  • What are the regulations and other challenges for the operation of drones to collect data from built environments?

2. Building Inspection

The initial step of the retrofitting process is conducting building inspections and energy audits. There are several standards and guidelines for building envelope inspection, either as part of a whole building inspection or as an independent envelope assessment. For example, the American Society of Heating, Refrigerating and Air-Conditioning Engineers (ASHRAE) Standard 211 establishes consistent procedures required to perform energy audits, defining the procedures required for three levels of energy audit, including level (1) walkthrough, level (2) energy survey and analysis, and level (3) detailed survey and analysis [5]. The gross area, the level of insulation of building components (e.g., roof, walls, fenestration, floors, and underground walls), and the overall enclosure airtightness are among the vital and required information to be collected in the energy audit process [6]. Additionally, it is necessary to determine inputs to create an energy model baseline (existing building condition). Moreover, retrocommissioning standards (e.g., procedural standards for the retrocommissioning of existing buildings) lead to deep, lasting energy savings for owners and managers of existing buildings by taking a holistic approach to energy efficiency. This covers building systems, energy-using equipment, and operating schedules and optimizes how these elements perform together.
Several organizations in NYS (e.g., New York State Energy Research and Development Authority (NYSERDA)) are adopting integrated physical needs assessment (IPNA), which merges building ASHRAE energy audits with conventional American Society for Testing and Materials (ASTM) physical needs assessments and health assessments to reduce the effort required and reach economies of scale for building inspections [7]. The New York City Building Department has also outlined standard practices for energy audits and the retrocommissioning of base building systems as required by Local Law 87 [8]. Additional standards, such as ASTM E2841-19 [9] and ASTM E2270-14 [10], address unsafe conditions related to façades, while historic structures necessitate an extra layer of review under the International Property Maintenance Code (IPMC). The New York City (NYC) façade inspection program also defines the process and requirements for the periodic inspection of the exterior walls and appurtenances of buildings [11]. Despite these established standards, they primarily cater to regular maintenance rather than retrofitting design. Building assessment services (e.g., IPNA) mainly collect information related to existing buildings’ performance (including structural, mechanical, and envelope systems). These data categories are related to the building’s performance, and they are already defined in the literature in a standardized way. While the standard practices for building inspections often include creating a building energy model baseline, they rarely include creating a digital model of the building (3D point cloud or building information model (BIM)). However, the creation of these semantically rich, as-built digital models is usually required to design and fabricate building energy retrofit solutions. Additionally, it is important to understand how technological innovations can be used in the building inspection process and help to achieve these goals.
The term “as-built BIMs” refers to models reflecting a facility in its constructed conditions [12]. However, for most existing buildings, BIMs are unavailable or outdated due to ongoing renovations [13]. Although creating accurate as-built BIMs is challenging, it is essential in designing and fabricating building energy retrofit solutions. Although BIMs were introduced in the 1970s, gaps in technology and knowledge prevented the construction industry from equipping facilities with as-built BIMs until recently, when some projects and studies proposed approaches in this regard. Recent advancements in the 3D reconstruction field, particularly in computer vision, have bridged technological gaps by offering tools for the generation of 3D models. Architectural, structural, mechanical, plumbing, and control systems; electrical power and lighting; fire protection; and special equipment are some examples of the components that a building owner should expect to receive as part of the as-built modeling package [14]. Various data requirements for assets, as outlined in [14], should adhere to recommended principles, including standardized naming conventions (building number, year, discipline designations), essential asset properties (the properties of the manufacturer, description, model, and serial number), and accompanying documentation (appropriate spec sheets, installation manuals, and O&M manuals). All assets should be dimensionally accurate; assets not directly bound within a room will be captured via the nearest room’s area boundary.
A BIM serves as a facilitator for reliable prefabrication, aiding in early issue detection, material tracking, and computer-aided manufacturing. The constraints for retrofits include information (lack and uncertainty of existing data); time (acute pressure for time to market of product); space (space congestion, access and work sequencing); the environment (working with hazardous or toxic materials, noise and vibration); maintaining optimum production levels; the demolition and disposal of hazardous materials; the maintenance of environmental/health/safety (EHS) requirements; access for production workers; the removal or protection of existing equipment; the reuse of existing equipment; experimental studies of uncertainties in design; and late changes in retrofit design [15]. A previous study conducted interviews and identified BIM-related interruptions as follows: inconsistencies in BIM and existing site conditions (23%); rework on prefabricated assemblies (23%); clashes onsite (28%); waiting for communication (13%); a lack of technology use (8%); and out-of-sequence work (5%) [15]. In this context, determining model requirements is crucial considering the trade-off between cost and data density. The level of detail (LOD), building elements, and non-geometric attributes emerge as vital categories. It is essential to identify the LOD of the model because higher modeling accuracy improves the reliability of the as-built BIM for use in retrofit design and fabrication applications. However, the higher the LOD, the higher the cost [16]. Scan data quality attributes, such as accuracy, space resolution, coverage, and others (e.g., location, angular resolution, etc.), play a crucial role. The as-built model’s creation is based on the points in the building category to identify building elements for the BIM with LOD300 (useful for building design development that can be used in the construction stage). The LOD measures the reliability and completeness of building elements’ geometry and information from LOD100 (predesign) to LOD500 (as built). From a BIM point of view, LOD300 might be appropriate for the creation of building models for retrofit design purposes. It should be noted that the acceptable accuracy is important for two separate purposes of retrofitting design and fabrication, in addition to energy assessment. It should also be noted that, for retrofitting, the level of accuracy might be application-dependent, and the mentioned level might be the minimum requirement. However, for energy model development, additional simplifications might be needed, because this level may represent the geometry and features (e.g., overhangs) that might not be needed for the geometry input and considering thermal zoning setup. Additionally, the level of accuracy (LOA) is a metric that enables professionals in the architectural, engineering, construction, owner (AECO) industry to specify and articulate the accuracy and means by which existing conditions are represented and documented (specifically for the accuracy of scan data) [17]. In particular, LOA30 and -40 (with standard deviations of 5–15 mm and 1–5 mm, respectively) are preferred for use in retrofit design and fabrication. Balancing these considerations is essential to optimize the reliability of the as-built BIM for retrofit design and fabrication applications.

3. Building Envelope Scanning

Various building scanning techniques have been designed to capture the required data for building envelope assessment quickly and accurately. Some of these techniques include infrared thermography (IRT), laser scanning (or light detection and ranging (LiDAR)), ultrasound, through-wall imaging radar (TWIR), close-range photogrammetry (CRP), and ground-penetrating radar (GPR) [18]. To enable a preliminary evaluation of various techniques, the building energy model input categories include 3D reconstruction and geometry information; building envelope thermal characteristic and defect identification; occupancy information; heating, ventilation, and air conditioning (HVAC) performance; and air leakage locations and tightness characteristics [19]. The following subsections provide a summary of each building envelope scanning technique and some of their relevant use cases. IRT is reviewed in more detail since its use cases are important as initial steps in terms of building envelope thermal anomaly detection and setting up the research framework.

3.1. Laser Scanning

This technique represents the use of a laser beam to measure the distance between the device and the object of interest. This technique uses repeated measurements along an entire field of view to create point clouds of physical objects [20]. Laser scanners are generally categorized as terrestrial and mobile scanners. Mobile scanners are handheld devices that offer more flexibility and ease for data collection, but generally lower accuracy (corresponding to less uniformity and density in the point cloud). However, using a terrestrial scanner consumes more time, but the accuracy and overall data quality are much higher [21]. Grussenmeyer et al. [22] compared 3D faces on a photogrammetric wireframe, as well as automatically extracted planes, to the laser scanner’s point cloud for a medieval castle. They showed small differences in the deviations between the models (model precision) and found that they could be applied equivalently for regular-shaped objects. However, the time and effort required for laser scanning are much higher compared to other techniques. Some other applications of this technique include feature extraction [23]; differentiation between windows and walls, using a combination of LiDAR data and digital map data with spatial and density analysis [24]; and assessing cracks in structures [25]. Some laser scanners are also equipped with thermal sensors, so the collected data can be used to identify thermal defects but not necessarily to identify envelope thermal properties.

3.2. Close-Range Photogrammetry

This technique uses a wide range of cameras, from metric to semi-metric cameras, to construct a 3D model by analyzing 2D images. It has found diverse applications in the fields of industry, biomechanics, chemistry, biology, archaeology, architecture, automotives, and aerospace, as well as accident reconstruction. The main application of CRP, which is within the scope of this review, is in crack and defect identification [26].

3.3. Ultrasound

This technique represents the use of short wavelengths that enable a detailed assessment of building components [18]. Its applications include identifying physical defects, material depth detection, and duct localization [27]. Various material properties, such as the resistance capacity and deterioration, have also been explored using this technique in wood structures [28]. Shah and Ribakov [29] showed its applicability in detecting microcracking in materials.

3.4. Through-Wall Imaging Radar

This approach utilizes electromagnetic waves to capture objects in buildings. It also extracts the physical properties of objects and records through-wall microwave scattering to form scenes [18]. In addition to detecting wall properties, Ren et al. [30] investigated TWIR’s application in identifying gaps in multilayered walls. Sévigny and Fournier [31] showed its application for material composition identification in multilayered assemblies. In addition, they explored its use for thickness detection and material characterization for front walls in tandem with LiDAR technology for feature extraction. Masri and Rakha [18] reviewed non-destructive testing (NDT) techniques. They identified the detection of cracks in concrete structures and the identification of potential defects in multilayered assemblies as benefits of this approach.

3.5. Ground-Penetrating Radar

Ground-penetrating radar utilizes electromagnetic waves to inspect the subsurfaces of objects regarding their thickness and the properties of material layers [32]. Giunta and Calloni [33] implemented this approach to collect information about different wall elements and assemblies in the preservation of St. Peter’s Basilica in the Vatican. According to [18], other advantages include identifying discontinuities between materials and recording them due to the different dielectric properties of each material, detecting chlorides and the moisture penetration depth, and measuring the electromagnetic sensitivity of materials.

3.6. Infrared Thermography

This technique measures the reflected and emitted radiation from a surface and shows the image as a spectrum [34]. It has the potential to be used in detecting envelope thermal anomalies [35], tracking moisture-related problems, assessing air leakage locations and HVAC performance [36], identifying cracks [37], monitoring room occupancy [38,39], and reconstructing 3D models [40]. However, it might not be efficient for subsurface component identification [18]. Although it is useful for leakage identification, no literature has been found related to the use of IRT in determining the overall airtightness of building enclosures.

IRT for Building Envelope Assessment

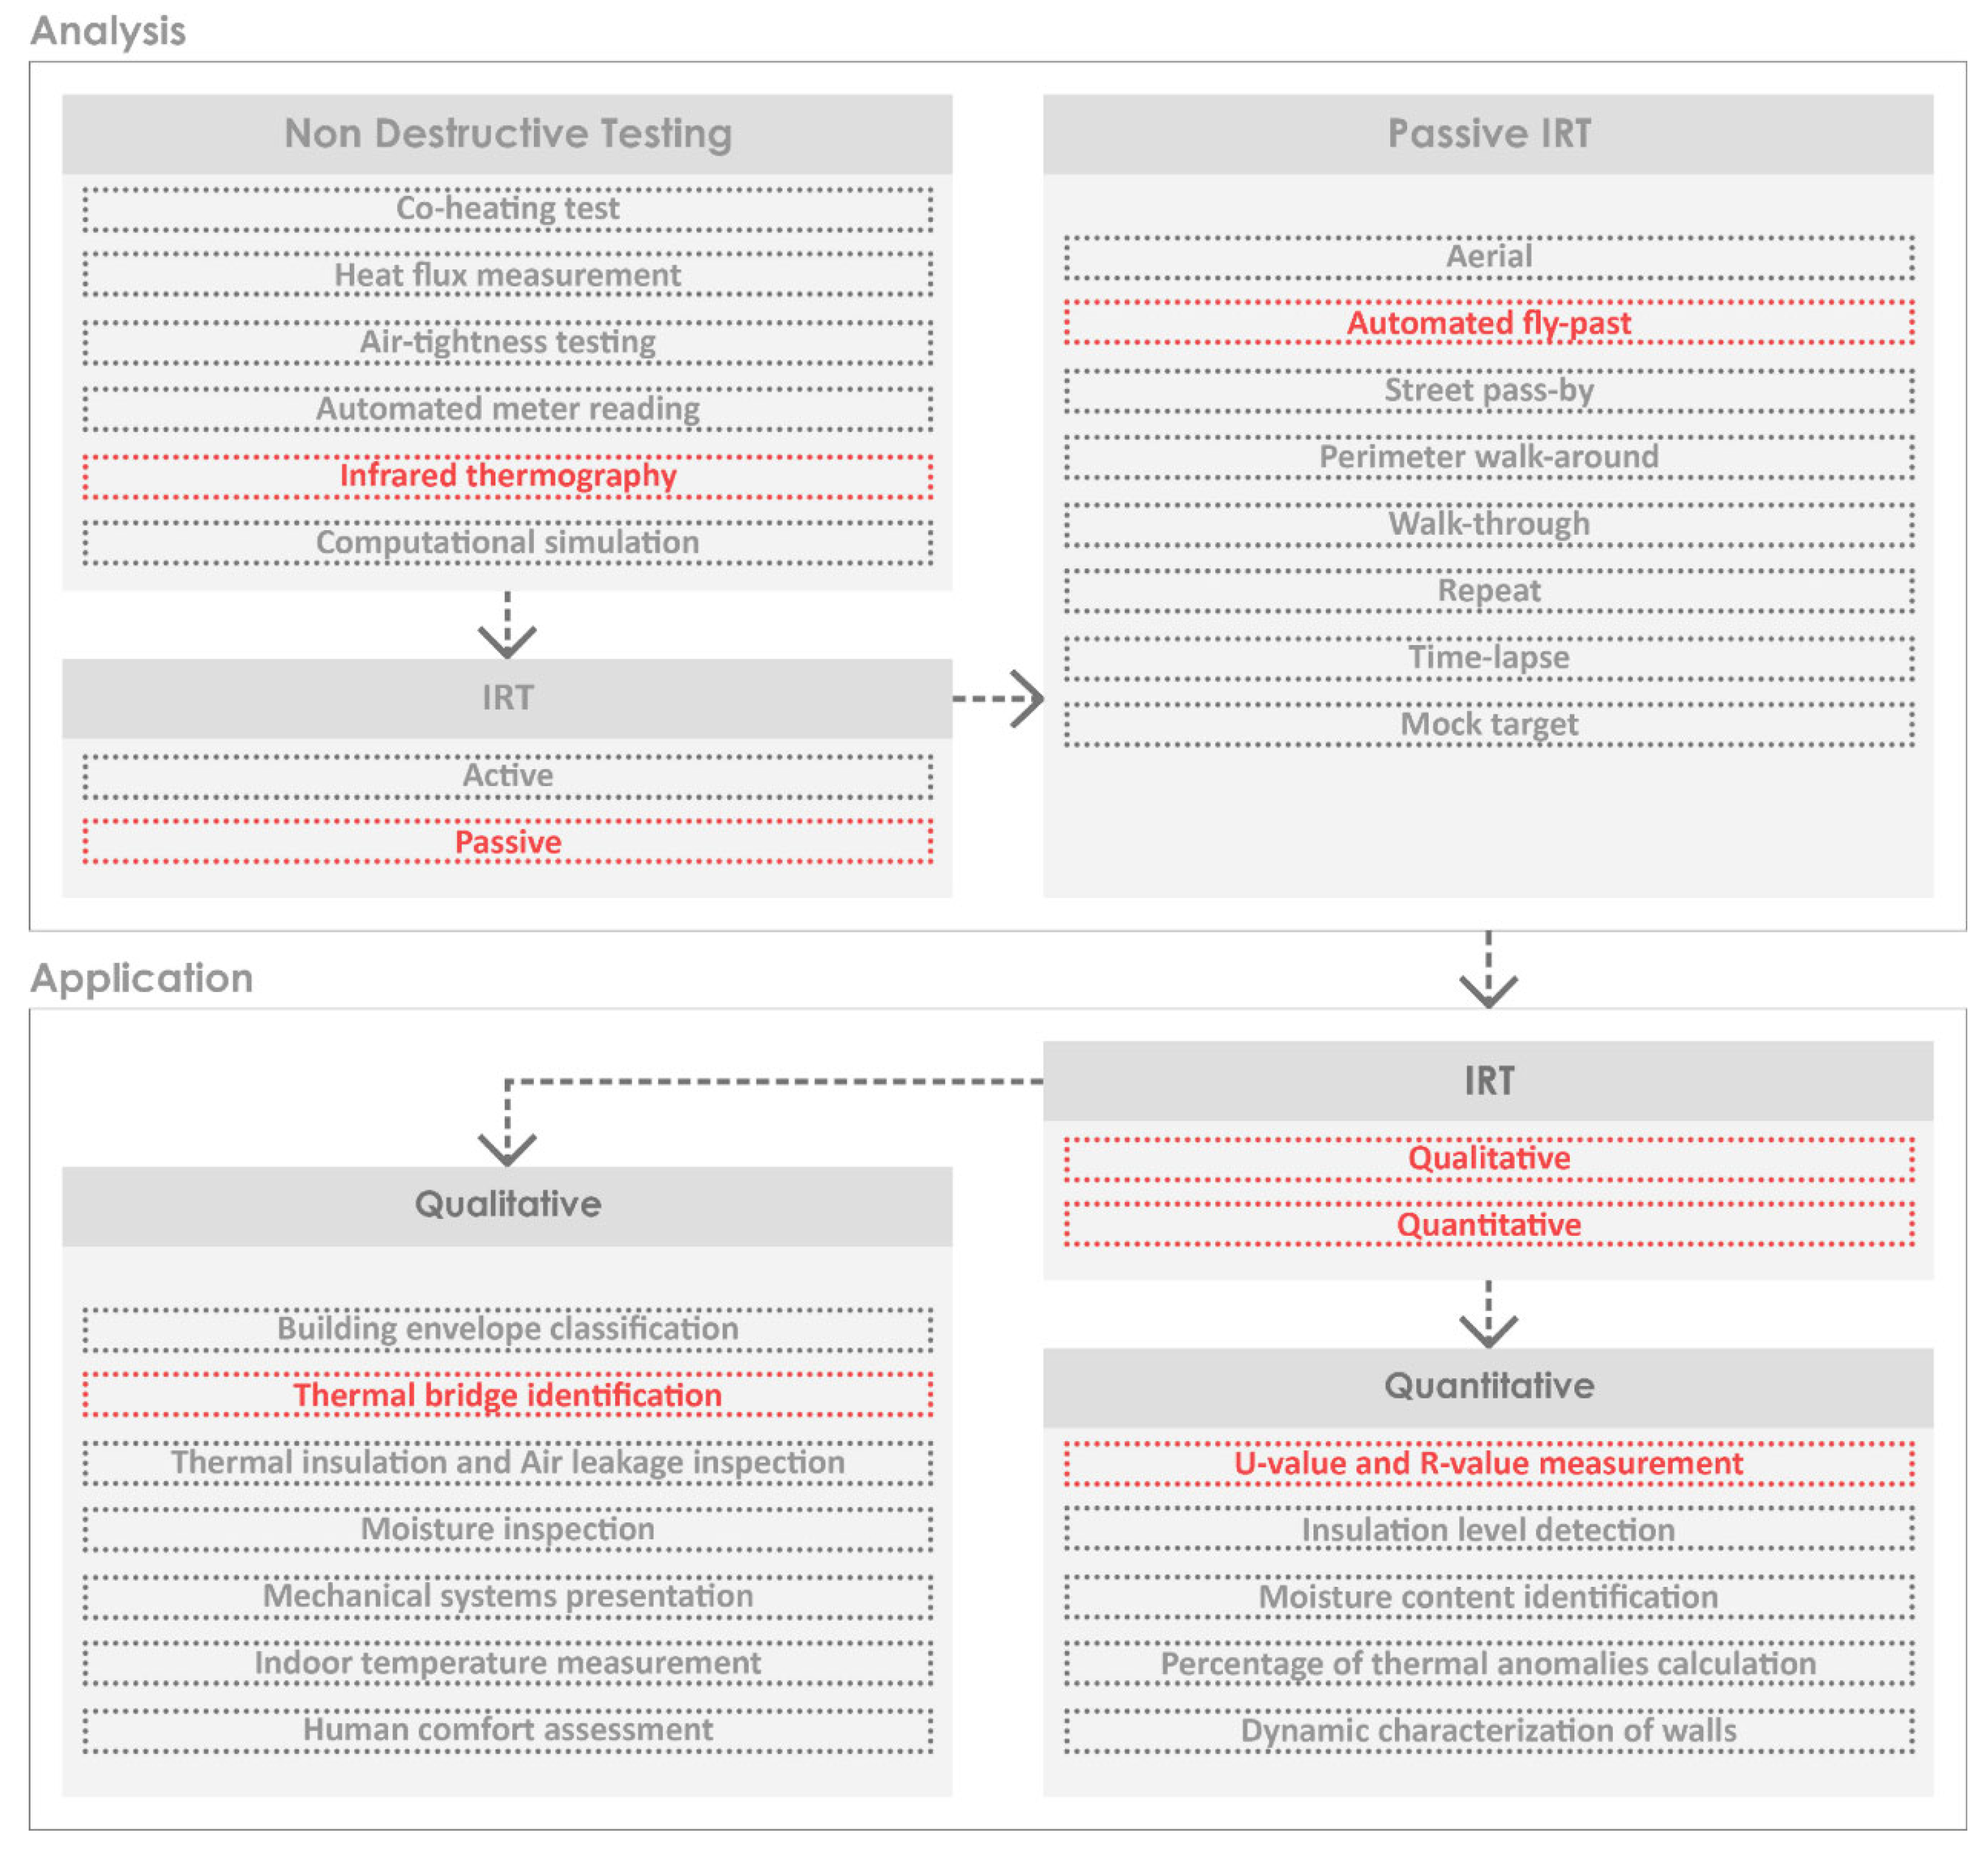
There are several NDT methods that are used in building energy audits, including co-heating tests, heat flux measurement, airtightness testing, automated meter reading, and computational simulations. As an NDT method, IRT can be used in building energy audits at different levels, as shown in Figure 1 [41]. Qualitative IRT is based on potential thermal anomaly identification, while quantitative IRT is characterized by numerical analysis to quantify the rate of heat transfer (e.g., thermal transmittance (U-value) determination) [42]. While both of these methods are applicable in level 2 audits, it is rare to find their simultaneous implementation. For level 3 audits, hourly energy simulation is required to help auditors to make informed decisions about building improvements. For an existing building, comparing the real U-values of walls and windows with the design values is essential. However, the literature does not comprehensively explore uncertainty due to changes in the building envelope’s U-value due to environmental conditions, material degradation, and deterioration [43].
As an approach to assessing building envelopes’ thermal properties, IRT has gained significant interest in the literature [44]. Passive and active methods are two general approaches to IRT in building energy audits. Passive IRT explores the entire building fabric to identify energy-related defects, while active IRT focuses on a specific area to analyze building defects [41]. Passive IRT is more common in energy auditing. This method is divided into aerial, automated fly-past, street pass-by, perimeter walkaround, walkthrough, repeat, timelapse, and mock target methods [45]. An automated fly-past survey involves the use of an infrared thermal camera or sensor mounted on an unmanned aerial system (UAS) [46,47,48]. A UAS equipped with these sensors (called drone thermography) is used in energy assessments to document building envelopes’ thermal performance. However, data collection is performed using the UAS, but the actual masking of thermal anomalies is usually performed by experts, and it is a manual process.
Automated vision-based algorithms have been implemented to detect thermal anomalies in building envelopes [49,50]. Kylili et al. [42] classified the application of IRT in building energy assessment into qualitative and quantitative methods. Lucchi further categorized qualitative methods into seven subgroups and quantitative methods into five subgroups [41]. Figure 2 shows these subgroups and highlights the scope of this research related to the analysis and application of IRT for thermal anomaly identification (qualitative) and U-value or thermal resistance (R-value) measurement (quantitative) in building envelopes.

3.7. Discussion of Envelope Scanning Techniques Based on Input Categories

Figure 3 shows a matrix of the relationships between the different building envelope scanning techniques and various building energy model inputs. While IRT may provide more benefits compared to other techniques, it cannot provide all the required information. IRT might be useful in extracting information regarding leakage locations through the building envelope. Still, none of these techniques can be used to characterize the airtightness level of the whole building or enclosure in an accurate way. Other tools (e.g., blower door test) might be used in a hybrid workflow to fully characterize the thermal and airtightness properties. While IRT approaches might not be efficient for subsurface component identification, building energy simulation requires detailed thermal and visual surface and subsurface properties (e.g., thickness, thermal conductivity, and solar absorptance information for each layer).
A combination of two or more (e.g., IRT and GPR) techniques could be used to collect all the inputs needed for the thermal simulation engine (e.g., EnergyPlus). It should be noted that the IRT method may be applied to measure the real total effective R-value of the building envelope, but not detailed layer-by-layer properties. Therefore, future studies could quantify the accuracy of energy models when using the simplified total thermal resistance compared to the detailed one.

4. Drone-Based Technologies for Building Inspection

4.1. Unmanned Systems

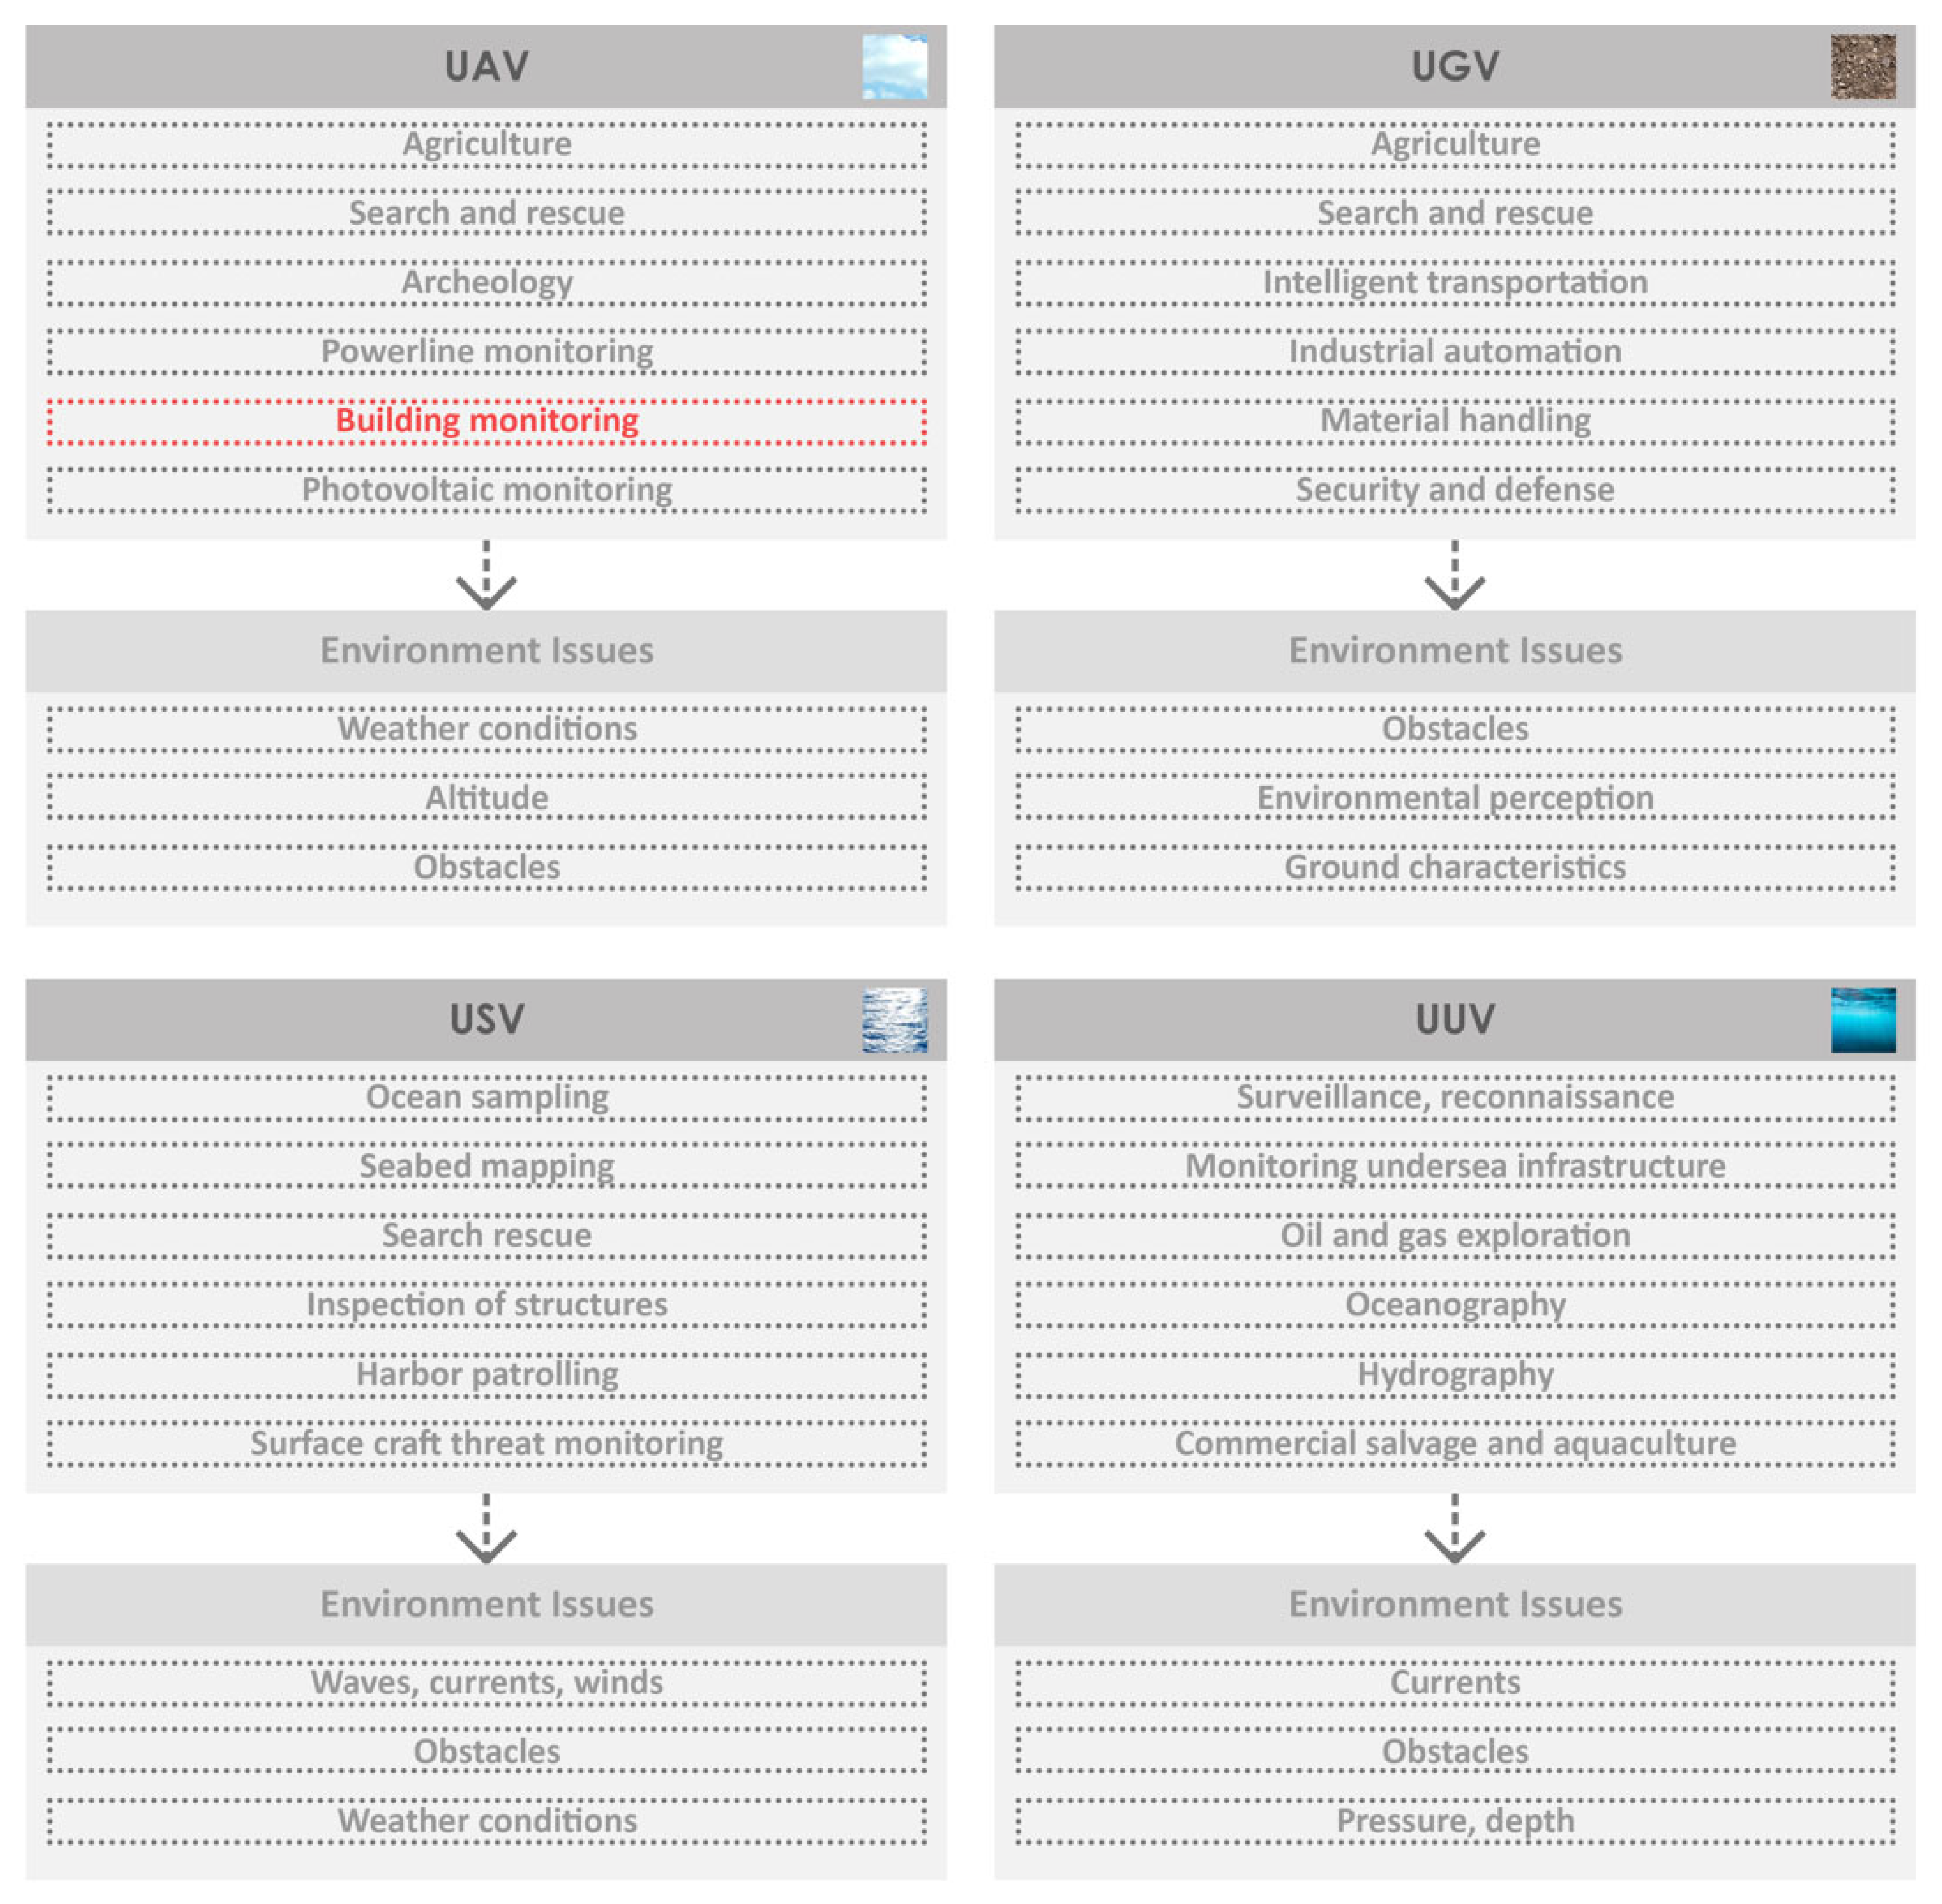
An unmanned system (US) or vehicle (UV) is defined as an “electro-mechanical system, with no human operator aboard, that is able to exert its power to perform designed missions” [52]. UVs can be either remotely controlled by a pilot or navigate autonomously using preprogrammed plans or more advanced dynamic automation systems [53]. These vehicles include those operating in the air (unmanned aerial vehicle (UAV) or UAS, commonly referred to as a drone), on the ground (unmanned ground vehicle (UGV)), on the sea surface (unmanned surface vehicle (USV)), or in the water column (unmanned underwater vehicle (UUV)).
UAVs or drones are unmanned systems that navigate in the air, capable of surveying large areas and accessing environments that are hostile to humans. They can be controlled remotely or operate autonomously. There are various types of UAVs, each designed for specific purposes. These UAVs vary significantly in size, ranging from centimeters to tens of meters; in weight, from tens of grams to thousands of kilograms; in operational altitude, from tens of meters to thirty kilometers; and in range, from 100 m to 1000 km [54]. The environment in which UAVs operate can greatly influence their mission outcomes. Extreme weather conditions, such as wind, rain, and storms, can cause UAVs to deviate from their predetermined paths or, particularly for smaller UAVs, prevent them from operating and taking measurements. Altitude is another crucial parameter for UAVs, influenced by the environmental conditions. For instance, in areas with rapidly changing elevation, such as steep terrain, UAVs must quickly adapt to maintain the required altitude. In high-altitude applications, UAVs need to adjust to changes in atmospheric density and temperature to preserve their aerodynamic performance.
Despite their widespread use, UAVs have limitations, including a restricted payload weight, operational altitude, and range, as well as challenges posed by weather conditions, obstacles, and operation in dense urban environments (see Figure 4). Research is actively seeking to address these weaknesses.

4.2. Overview of Drone Applications in Construction and Building Monitoring

In recent years, the design and construction industry has experienced a significant transformation driven by technological advancements. Among these innovations, drones have emerged as pivotal tools, reshaping how construction projects are planned and executed and how buildings are inspected [55]. Equipped with advanced sensors, cameras, and global positioning system (GPS) technology, drones offer exceptional capabilities for data collection, the creation of digital building models, and the performance of remote inspections. By employing various types of drones, construction professionals can optimize workflows, enhance project coordination, and mitigate risks [56]. Surveying drones, equipped with high-resolution cameras and LiDAR sensors, facilitate precise mapping, topographical analysis, and site planning [57]. The use drones for inspection applications provides a distinct advantage in assessing hard-to-reach or hazardous areas of buildings or sites. By identifying structural or thermal defects, monitoring the construction quality, and ensuring compliance with safety regulations, the use of drones enhances project transparency, reduces manual labor, and improves overall project outcomes.
Beyond the primary phases of design and construction, drones continue to revolutionize building maintenance. Regular inspections using drones allow for proactive maintenance planning, the early identification of potential issues, and the prevention of costly repairs. By conducting detailed assessments of buildings and infrastructure, drones contribute to the resilience of constructed assets. Additionally, the integration of drones in the maintenance and inspection phases allows for the identification of defects and anomalies. The use of drones in the construction industry signifies a transformative leap towards achieving higher efficiency, safety, and sustainability. By harnessing their data acquisition, monitoring, and inspection capabilities, design and construction professionals can make informed decisions, improve project outcomes, and optimize resource utilization. As drone technology continues to evolve, it is expected to play an increasingly critical role in reshaping the building and construction industry, fostering innovation and driving the adoption of smart, resilient construction and building practices.
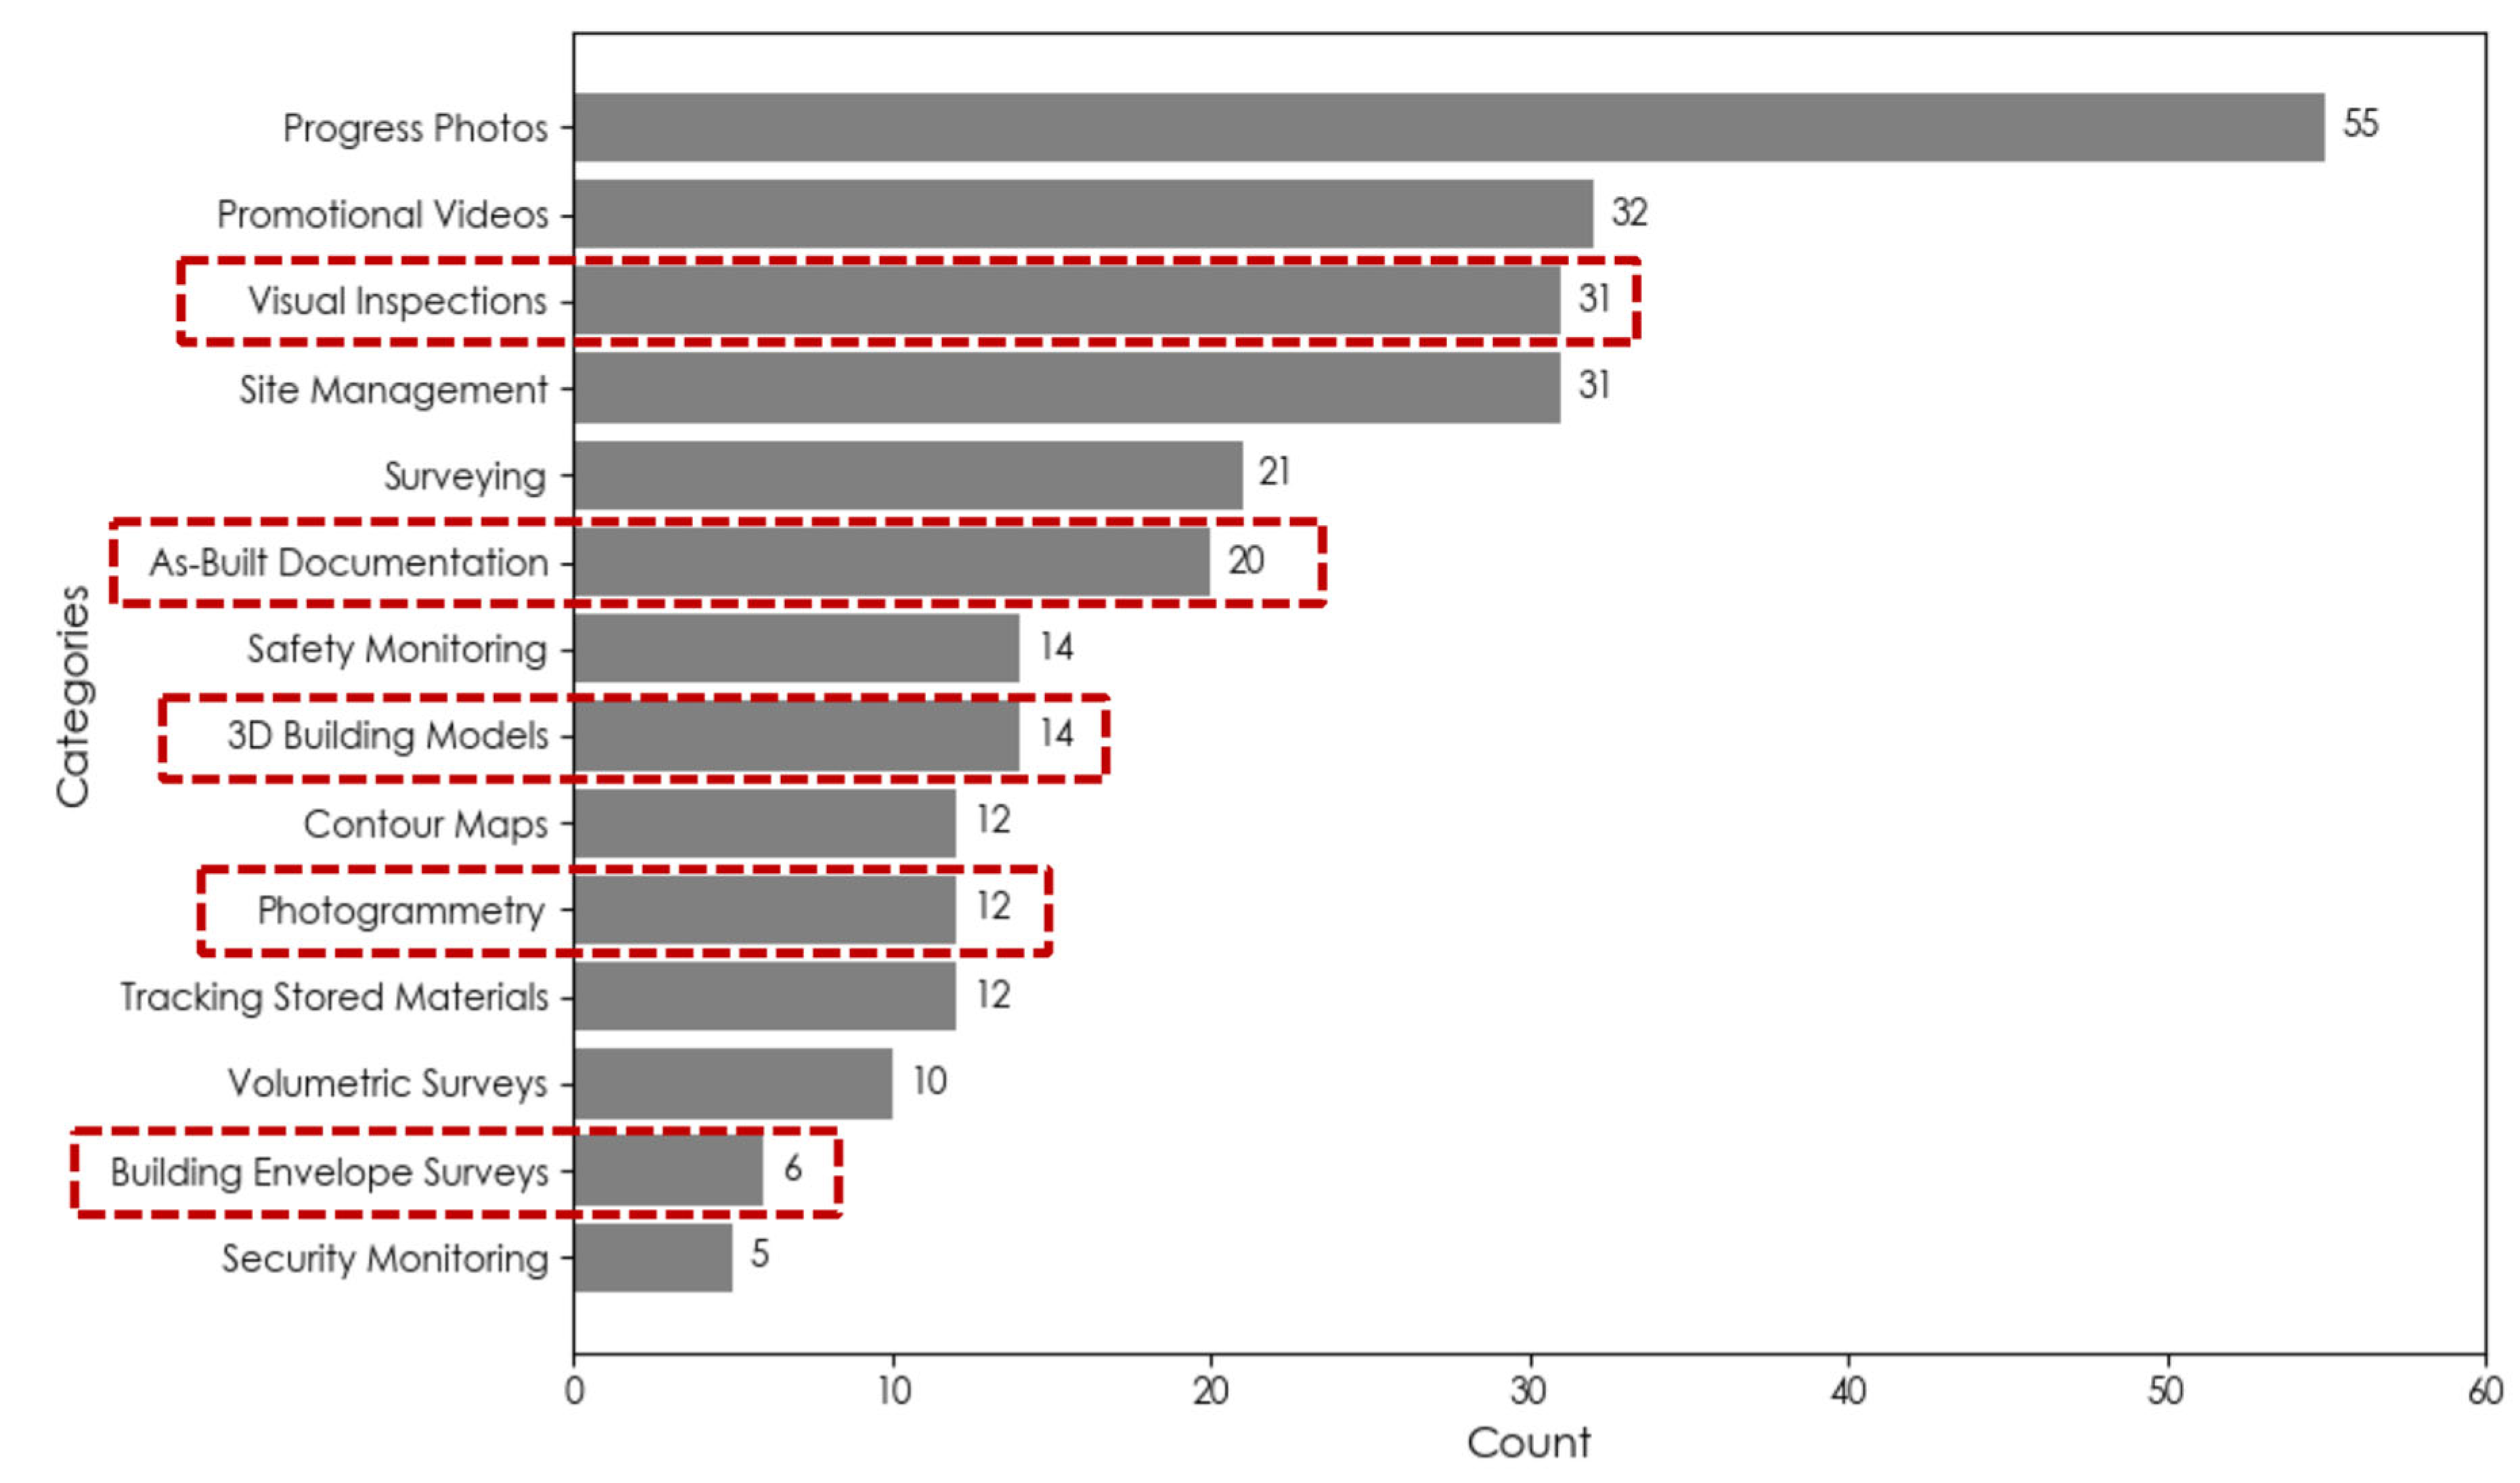
In a research study, the researchers conducted surveys in various construction companies to determine how drones were utilized in their projects. The findings indicated that the most common use of drones was in capturing progress photos, followed by creating promotional videos, conducting inspections, and improving site management (Figure 5). Based on our analysis, 30.2% of all applications are related to building envelope inspection and creating building models for auditing purposes.

4.3. Sensors for Drones

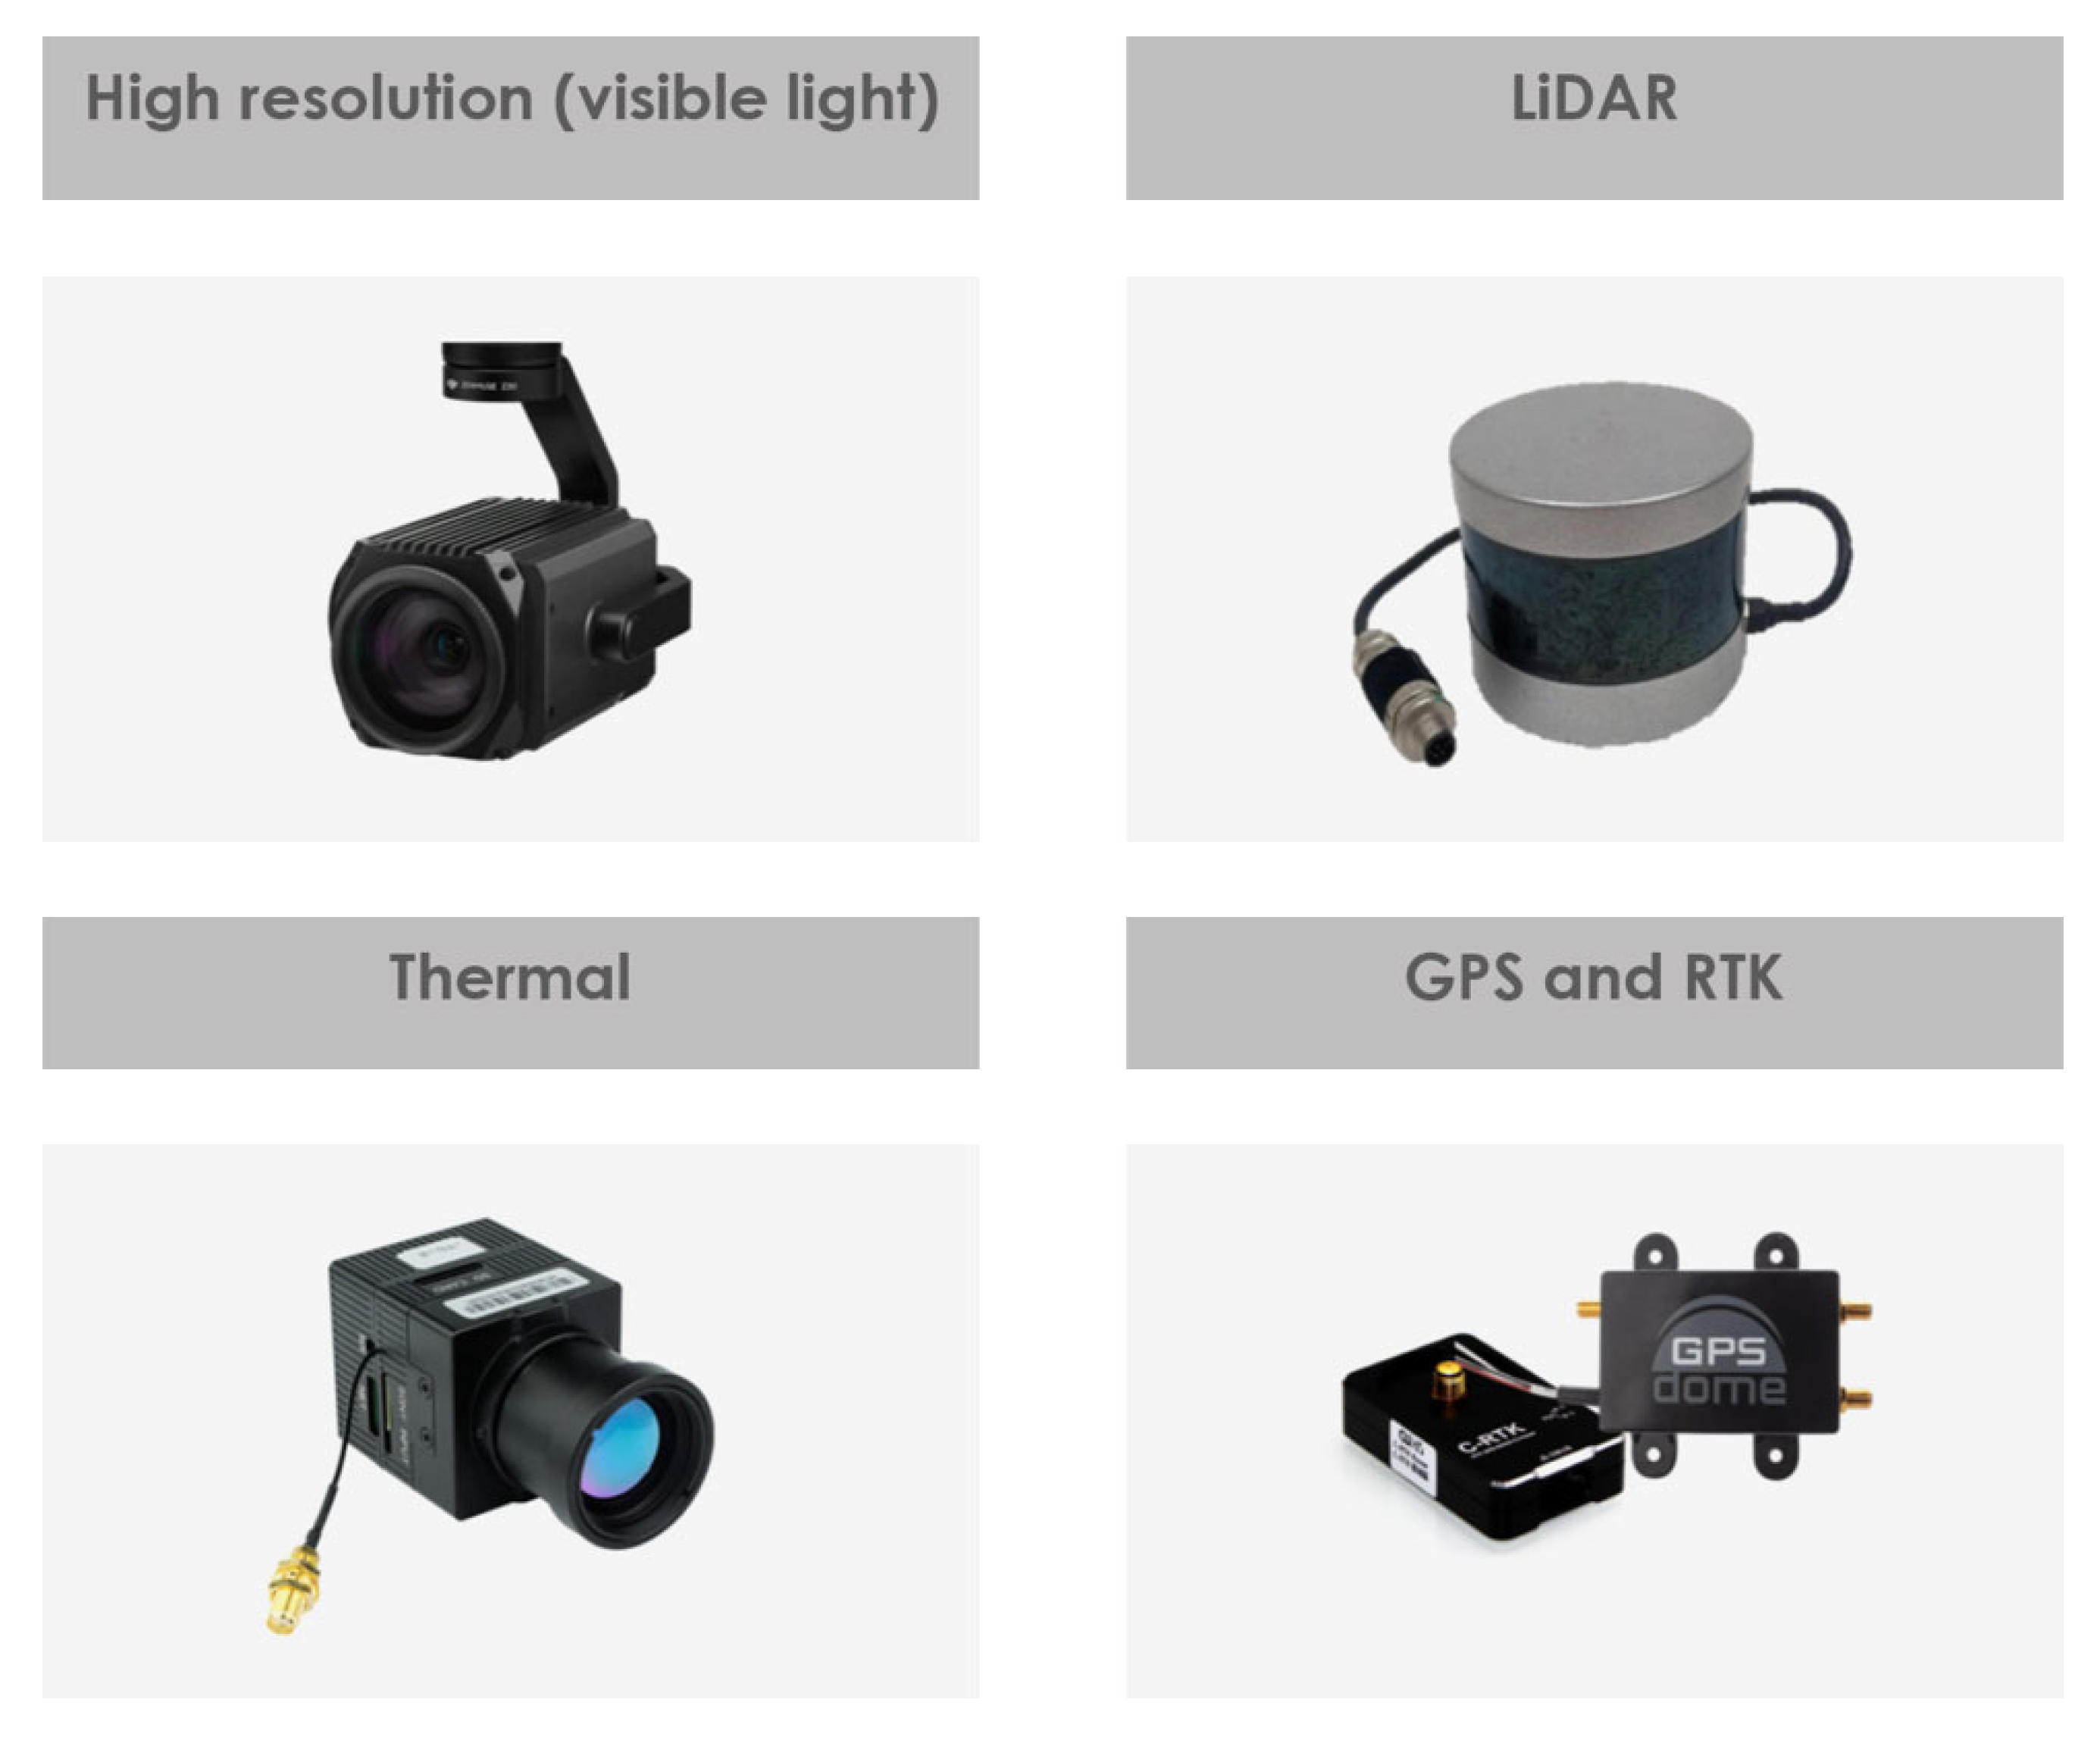
Drones used in the built environment are equipped with various sensors to enable effective data collection and task execution. Figure 6 shows examples of these sensors. GPS and real-time kinematic (RTK) sensors provide precise positioning data, enabling the UAV to accurately map the site and navigate through tight spaces.

4.3.1. High-Resolution Camera

Red green blue (RGB) digital cameras capture high-spatial-resolution radiation values in the red, green, and blue spectral bands [59]. The quality of the acquired images is determined by the spatial resolution of the RGB sensor. Specific disadvantages include sensitivity to changes in lighting conditions and to reflections and glare.
Drones have significantly transformed bridge inspection and structural maintenance by providing a safer and more efficient means of inspection. One of the key advantages is the enhanced safety for engineers and maintenance crews, as drones can access hard-to-reach or dangerous areas, such as the undersides of bridges, without the need for scaffolding or other equipment. This remote operation minimizes the risk of injury to workers and reduces the setup costs and time [60].
Drones expedite the inspection process, quickly capturing images and videos that can be analyzed in real time. This fast data collection speeds up the generation of inspection reports, reducing bridge downtime and minimizing traffic disruptions. The detailed imagery provided by drones can reveal minute cracks or wear that may be missed during human inspections, enabling the early detection of potential issues and preventing costly repairs. Drones can be programmed for regular monitoring, helping to track changes in bridge conditions over time and after extreme weather events like floods, typhoons, and earthquakes [61]. However, the use of drones for bridge maintenance and building inspection requires skilled operators to maneuver the drones for data collection, as well as experts to analyze the information. The effectiveness of crack and defect detection using drone-captured images depends on the image quality, lighting conditions, and surface texture and the expertise of image analysts. Advanced image processing algorithms, including edge detection and pattern recognition, have been employed to enhance the image quality and detect defects in the existing literature. Integrating AI and machine learning can further improve these detection tasks by training algorithms, enhancing the efficiency and reliability of the process. Establishing guidelines for image capture, processing, and analysis is also a crucial aspect to ensure accurate and consistent results.

4.3.2. Spectral Sensors

Spectral sensors, which can be either multispectral or hyperspectral, are classified based on the number and width of their spectrum bands. They measure the radiance reflected, emitted, and transmitted from the target to gather information [59]. These sensors can detect wavelengths in both the visible and near-infrared ranges.

4.3.3. Thermal Sensors

Thermal sensors detect electromagnetic energy in the infrared wavelength range emitted by targets and convert it into images. RGB cameras provide better spatial resolutions compared to other sensors. However, multispectral cameras offer significant advantages in specific applications, such as in agriculture to determine the physiological status of plants, which is not possible with RGB cameras.
Thermal cameras mounted on drones provide useful information about temperature variations and potential issues within structures by capturing thermal images. These cameras detect infrared radiation emitted by objects, visualizing temperature differences, which can reveal various issues, such as material degradation, insulation problems, moisture infiltration, electrical faults, and thermal bridges. The early identification of these anomalies enables proactive maintenance and accurate assessment for the better design of upgrades in retrofits. Once thermal images are acquired, image processing and analysis techniques are used to extract useful information and identify potential anomalies [55]. Various steps, such as image enhancement and noise reduction, are important in preparing the thermal analysis.

4.3.4. LiDAR Sensors

LiDAR sensors measure distances by illuminating a target and analyzing the reflected light. They offer a wide field of view (FOV) and high accuracy, but their size and weight can poses challenges for UAV payloads. An example of the use of LiDAR sensors is in archaeology to measure the effects of buried archaeological remains on the landscape topography, providing detailed digital terrain and surface models [62]. Specific disadvantages include high costs and the need for specialized training and expertise, as well as their limited range of around 100 m.
Drones equipped with LiDAR are valuable tools for structural maintenance and digital model reconstruction, enabling the accurate 3D mapping and visualization of structures like buildings, bridges, and industrial facilities. These combinations help to detect structural issues such as cracks, deformation, and corrosion by comparing the captured data with reference models or previous scans, preventing further deterioration or failure [63]. However, there are challenges associated with LiDAR-equipped drones. Processing LiDAR data requires specialized software and expertise, and skilled operators are needed to handle both the drones and the data effectively. Adverse weather conditions like rain and fog can impact LiDAR performance [64]. Sensor accuracy is also a concern, as variations in quality or calibration can affect data accuracy. Regular calibration and maintenance are essential for reliable measurements. Signal interference from obstacles such as trees and power lines can obstruct LiDAR signals, leading to incomplete or distorted data, which necessitates proper flight planning and obstacle avoidance algorithms [55]. To overcome these challenges, researchers are developing advanced data processing techniques to streamline LiDAR data analysis. Additionally, the integration of LiDAR with other sensing technologies, like thermal imaging or multispectral cameras, is being explored to provide a more comprehensive assessment of structural conditions.
For UAVs flying at lower altitudes, static and dynamic obstacles pose a critical risk to vehicle integrity. Various sensors can help UAVs to detect obstacles and the surrounding environment, such as radar, LiDAR, and electro-optic sensors [53]. Radar detects obstacles by continuously emitting electromagnetic waves and measuring the time difference between the emitted and reflected waves to determine the distance [53]. Radar offers a wide sensing range and quick target area scanning. LiDAR, while having a smaller detection range than radar, provides detailed obstacle distance and range information. Electro-optic sensors determine the relative positions of obstacles using the elevation and azimuth via a camera but do not provide distance or speed information. Unlike radar and LiDAR, electro-optic sensors’ performance is significantly affected by the weather, particularly cloudy conditions.

4.3.5. Data Fusion Strategies

The integration of multisensor modalities, such as thermal imaging, LiDAR, and RGB cameras, enhances the comprehensiveness and reliability of building envelope assessments [65,66]. Sensor fusion refers to the process of combining complementary data from these modalities to create a unified, enriched dataset that can better support tasks such as defect detection and 3D reconstruction. Classical data fusion strategies include Kalman filtering, which is widely used for time-series sensor fusion by recursively predicting and updating estimates based on noise and uncertainty models [67]. Another probabilistic approach is Bayesian fusion, which incorporates prior and conditional probabilities from different sensor observations to improve the accuracy and reduce the ambiguity in feature identification [67]. Recent advancements have explored deep learning-based fusion, including feature-level fusion and decision-level fusion, where raw data or extracted features from thermal, RGB, and LiDAR streams are combined using convolutional neural networks (CNNs), attention mechanisms, or multimodal transformers [67]. For example, in construction progress monitoring applications, stereo vision data fused with kinematic information was shown to accurately estimate spatial volumes and predict material quantities using a hybrid time-series architecture, which could also be adapted to the envelope monitoring domain. In the context of building diagnostics, sensor fusion enables improved anomaly detection, especially under varying lighting or weather conditions. For instance, thermal anomalies can be better contextualized using edge or geometry data from RGB or LiDAR streams [68]. The fusion of modalities thus contributes significantly to reducing false positives or negatives and supports the robust localization of building envelope defects.

4.4. Drones for Building Inspection

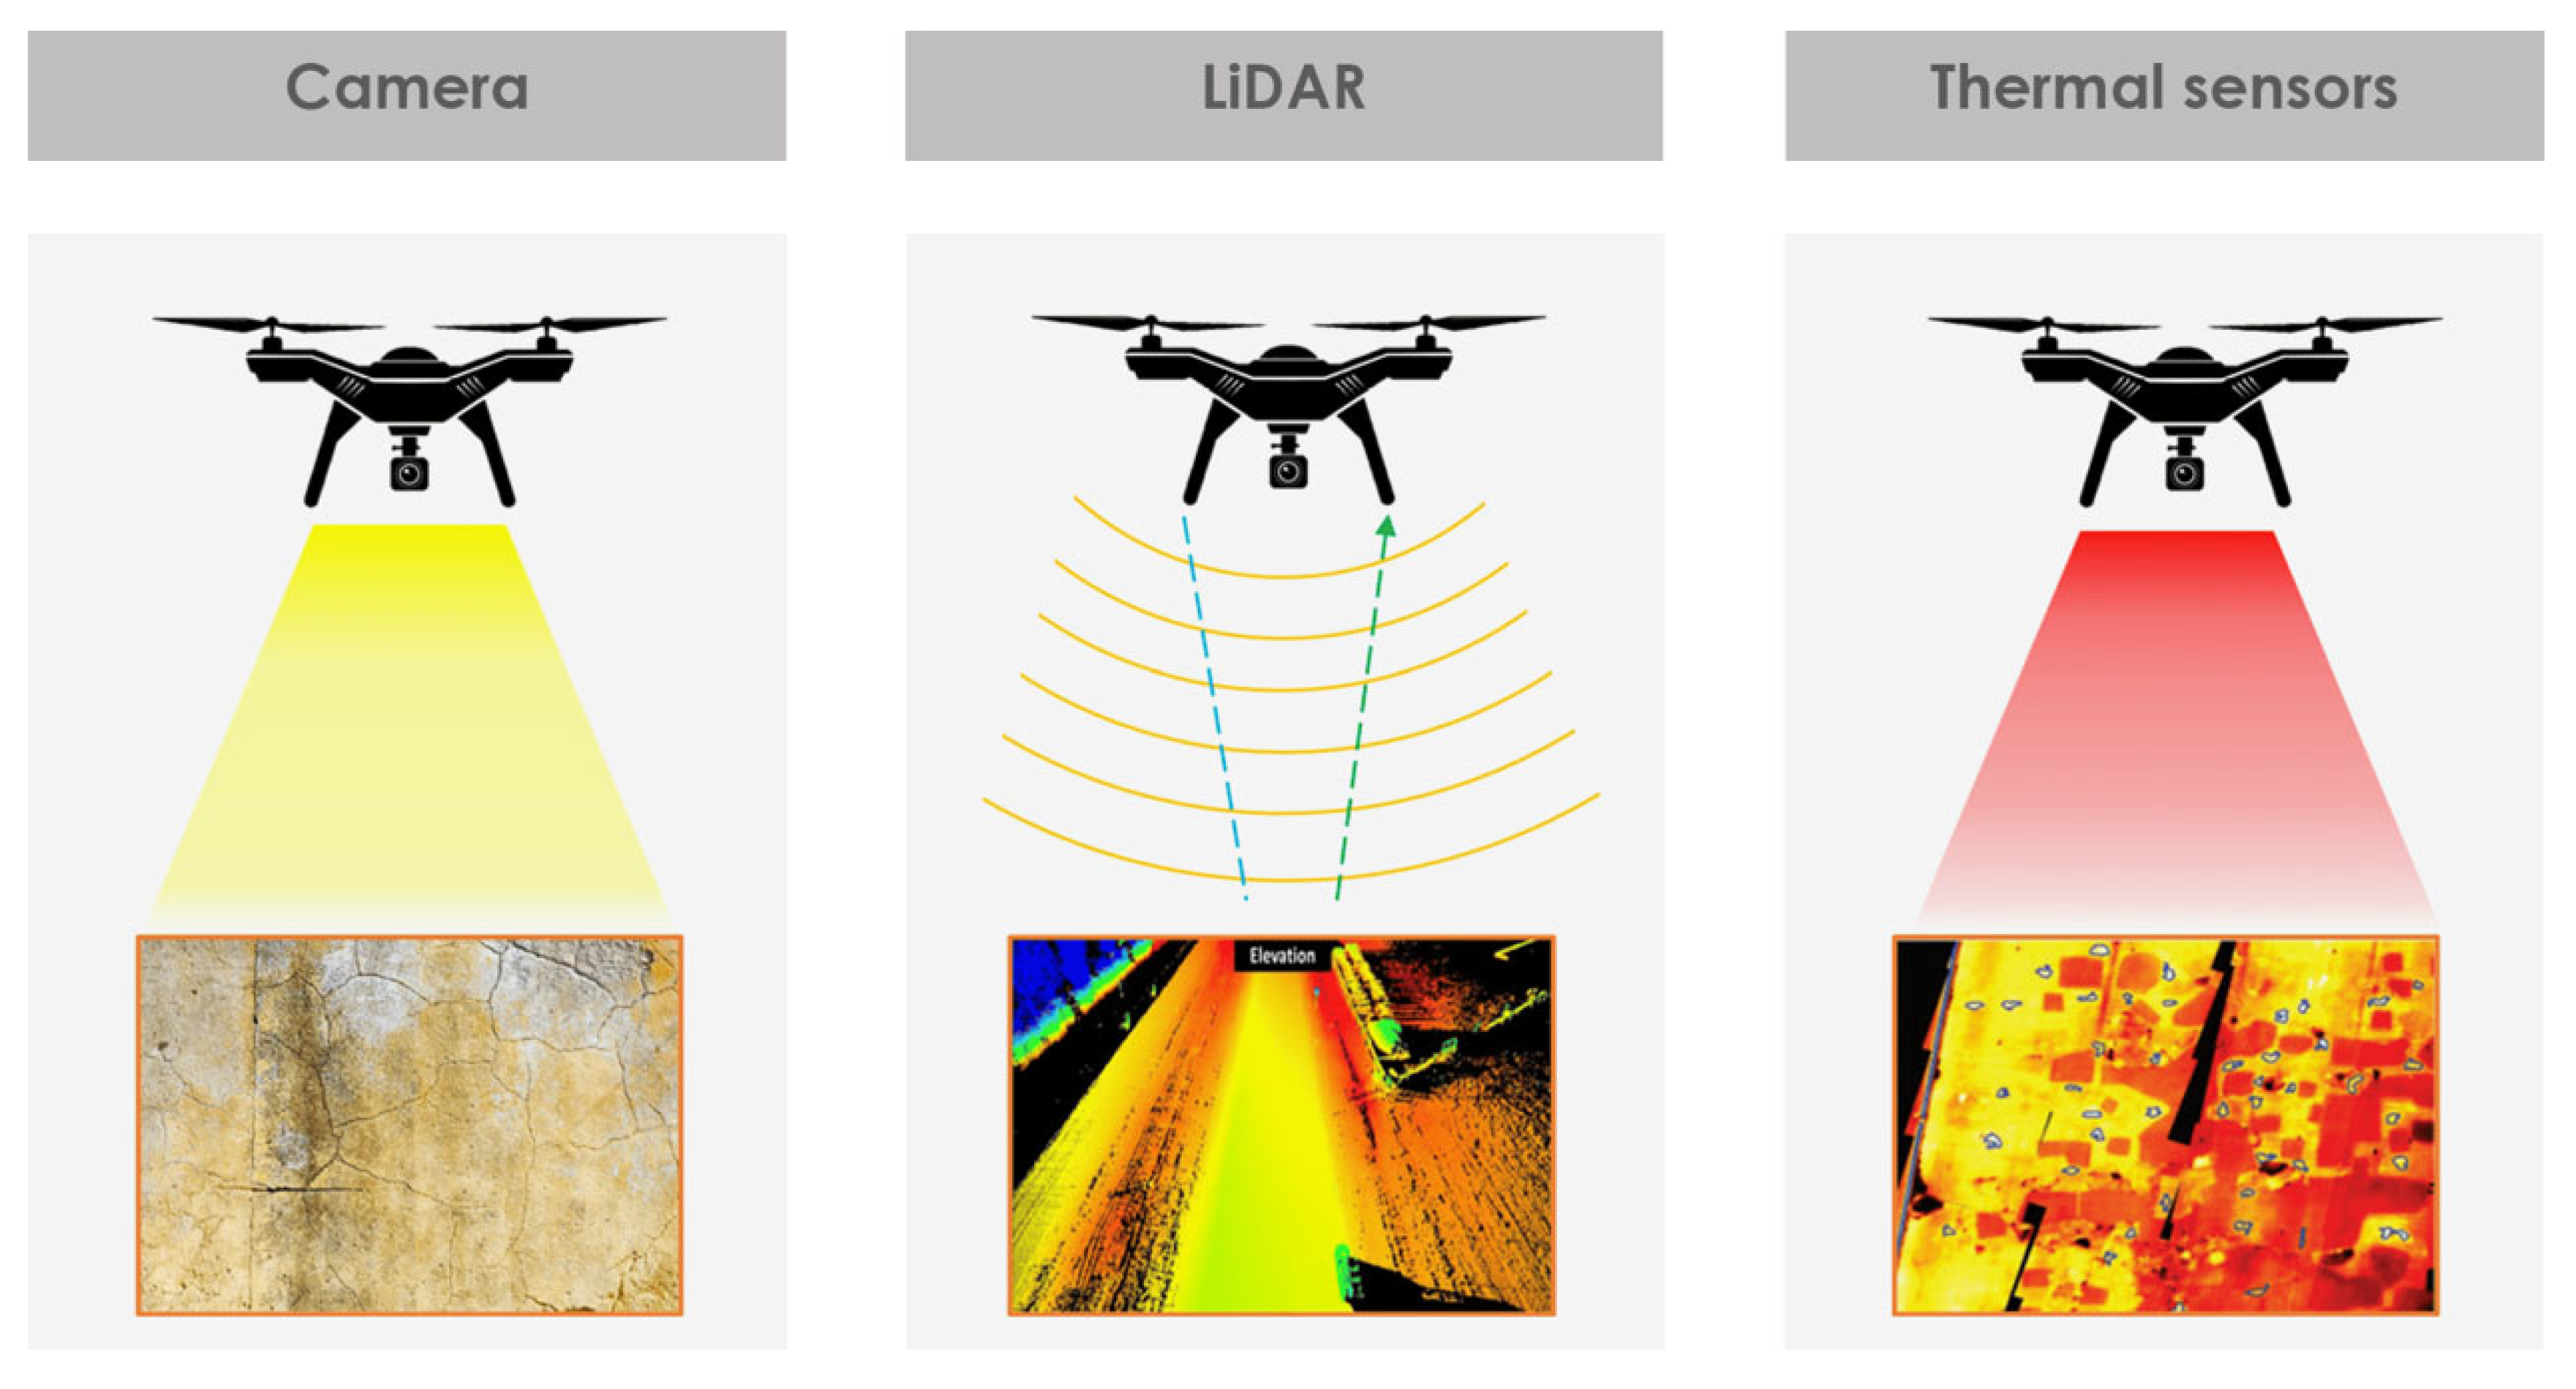
Traditionally, building envelope diagnostics has involved manual inspections, which are both time-consuming and sometimes unsafe, especially in difficult-to-reach areas. The use of drones equipped with cameras and sensors has introduced a more efficient and safer alternative. As mentioned, drones equipped with high-resolution RGB cameras, LiDAR, and thermal sensors can detect defects in structures that are not visible to the human eye. Figure 7 shows the differences in drones equipped with cameras, LiDAR, and IRT sensors.
However, non-destructive testing relies on visual inspections, with experts analyzing images and videos captured by drones to identify potential defects. Recent advancements in sensor technology (e.g., thermal imaging) have expanded the capabilities of UAVs to more sophisticated building inspection applications. The potential use of drone-based techniques has been explored not only to assess structural conditions [69] but also to identify envelope defects for building inspection (e.g., excessive air infiltration, missing insulation) [40]. For example, a recent study by New York City’s Department of Buildings found that drones are useful in effectively collecting visual data [70]. In addition, they recognized drones equipped with thermal sensors as beneficial in improving building energy assessment and retrocommissioning efforts. However, the limited experience with the use of drones in this context makes it difficult to determine precisely how drone use might support existing façade inspection and assess related issues that may arise (e.g., privacy concerns, use of sidewalks, economic benefits, tree adjacency).
While there are limited research outcomes related to drone-based technology for building inspections, two ongoing projects under consideration for the Department of Energy (DOE)’s Envelope Retrofit Opportunities for Building Optimization Technologies (E-ROBOT) Prize are focused on this topic [71]. The Thermadrone project takes drone-captured images of building envelopes using thermal and visual sensors and applies advanced modeling techniques to fast-track diagnostics and verify the success of retrofits. The EASEEbot project from New York University implements an AI-powered and robot-assisted system that scales and flies through buildings to auto-generate 3D models using advanced reconstruction techniques. This project proposes using visual, thermal, and depth cameras in two modes of flight and climb. Their system is expected to identify and quantify common envelope defects in flight mode and apply long-wave radar and machine learning when a problem is identified in order to detect hidden deep moisture penetration and other major envelope defects. Likewise, a recent study introduced an advanced vehicle-mounted data capturing system for scalable multispectral data collection in residential building façades and to model the urban environment [72]. In this approach, the visual camera rig is installed on top of a platform, with four LiDAR units on each corner and IRT and hyperspectral line scanners on both sides.
The integration of deep learning techniques with drone-based approaches for data collection has further enhanced the accuracy and efficiency of building inspection. Deep learning algorithms can automatically detect defects in images and videos, reducing the reliance on manual labor. One study combined drone technology and IRT with AlexNet-based transfer learning to detect and identify embankment leakages efficiently [73]. Recent studies have demonstrated the effective application of deep learning models for automated defect detection using drone-acquired imagery. CNNs have been used extensively for thermal anomaly detection in building envelopes, where thermal images collected by UAVs have been classified to detect heat loss areas [40]. For RGB imagery, object detection algorithms like Faster R-CNN have been employed to identify structural cracks and spalling with high accuracy under varying lighting conditions [74]. Lightweight models such as YOLOv3 have also been applied for the real-time detection of envelope anomalies in urban inspections, offering rapid processing with acceptable accuracy [69,75]. For pixel-wise segmentation, U-Net architectures have been adapted to drone images to isolate building façade elements and thermal anomalies [76]. More recently, multimodal deep learning approaches combining RGB and thermal infrared data have been used for façade segmentation using encoder–decoder networks such as U-Net, as demonstrated in [77], enabling the improved spatial localization of envelope defects. A method was presented for the management of detected defects in external walls by mapping them to BIMs and modeling defects as objects, using a deep learning-based instance segmentation model to detect and extract defect features [78]. These AI-based methods are becoming increasingly robust and versatile for building diagnostics, allowing researchers and practitioners to identify defects and anomalies across different surface types, lighting conditions, and sensing modalities. On the other hand, there are limited studies on the application of drones with other sensor configurations, such as ultrasound or GPR.
One of the essential considerations when designing drone-based data collection is determining the flight path. Planning a drone flight requires an understanding of various parameters, including the distance from the target, altitude, speed, overlap, and flight pattern. The literature indicates that auditing requires an established flight plan that either targets regions of interest or audits the building and its surfaces in their entirety. Often, multiple audits are required to accurately capture the entirety of a building. Flight planners frequently determine the next best view based on preliminary scans or surveys [79]. The importance of flight path design lies in generating good scans for a better overview of the scene considering parameters such a reasonable distance and overlap [80]. An overlap is useful for the 3D reconstruction of the building to be scanned. A distance between the drone and the building ensures scan accuracy and collision avoidance.
Several researchers have addressed the issue of flight planning through mathematical modeling, considering the limitations of camera technology and battery life to develop equations that consider the drone’s distance from the target, the flight speed, and the path geometry [81]. A research study utilized mathematical principles to optimize drone flight paths and a scientific process to test the feasibility of auditing a geo-cluster of 300 buildings with a quadrotor [82]. Their findings demonstrated that, with the developed algorithms, the quadrotor could scan a cluster of 300 buildings in approximately 6 h, assuming unlimited battery life, although this hypothesis has only been tested on significantly smaller scales. While mathematical principles help to optimize drone-based auditing, various researchers have decided to tackle the issue of flight paths using a more geometric approach [40], and the most common solution has been to design either vertical, horizontal, or elliptical flight paths.
Horizontal flight paths are particularly effective, especially when combined with a low flight speed. Many researchers design their flights based on a grid overlaid on the site boundaries, ensuring that the drone collects data from each grid unit [83]. The vertical flight path typically involves specified overlaps to ensure comprehensive and detailed data collection from the façade. Research studies have recommended various overlaps, with a range of >35% to 90% [84], depending on the purpose [40]. The literature also shows the use of elliptical flight paths for photogrammetry, 3D model generation, or analysis [51]. For surveys of large or urban areas, a height of 100–200 m allows for high overlap and high-resolution data capture. Based on a review study [40], altitudes typically vary from 20 to 75 m above ground, with some studies using fixed heights, such as 30–75 m for archaeological surveys and 50 m for general purposes. Distances from the target surface range from less than 1 m for the detection of small-scale cracks to up to 25 m, depending on the specific application and the required level of detail. To summarize the effective parameters based on [40], over 70% overlap is effective for the collection of data through the design of horizontal and vertical flight paths to audit or visualize energy use in buildings. An elliptical flight path with over 95% overlap is effective for photogrammetry and 3D model reconstruction. Maintaining a distance of 12 m from the target surface, with variable bay widths of 2–3 m, is appropriate when taking images every 1.5 m along the path. It should be noted that, for the generation of 3D models, flying multiple elliptical paths at different altitudes is ideal to cover the gaps in the point clouds. The most effective altitudes are twice the height and footprint size of the building, with each subsequent flight increasing in altitude and size by approximately 1.25 times. The ellipses should have over 70% overlap, and the frequency of image capture should result in over 90% data overlap.
The timing of the flight is also crucial. While combining image-based modeling with drone imaging helps to reduce shadow occlusion, daylight and solar radiation still influence the radiative flux from materials [85,86]. This can lead to false positives or exaggerated readings. Usually, cloudy morning or evening hours with stable temperatures and no precipitation are appropriate for flights [87]. A difference between the indoor and outdoor temperatures of at least 10 K is recommended when an FLIR camera is being used; however, this might not be the same for all types of IRT. The thermal camera settings should be adjusted with accurate emissivity values before flight, adjusting as needed during the flight or post-analysis for precise readings. The proper calibration of GPS devices is also important to ensure the accurate geo-tagging of images.
There are various applications for the design of flight paths for horizontal planes. For instance, the Litchi app and Pix4D (version 4.8.2) were employed in previous studies. Other applications include, but are not limited to, DroneDeploy and the UgCS software (version 5.10.0). UgCS provides a light façade scan tool, but it has its own limitations, which are beyond the scope of this research. A fully automated vertical plane flight path design tool for the specific purpose of building inspection could be formulated to enable more efficient integrated vision-based workflows; nevertheless, careful flight path design is critical in this type of study to ensure effectiveness [35].

5. A Drone-Based Workflow for Integrated Building Envelope Assessment

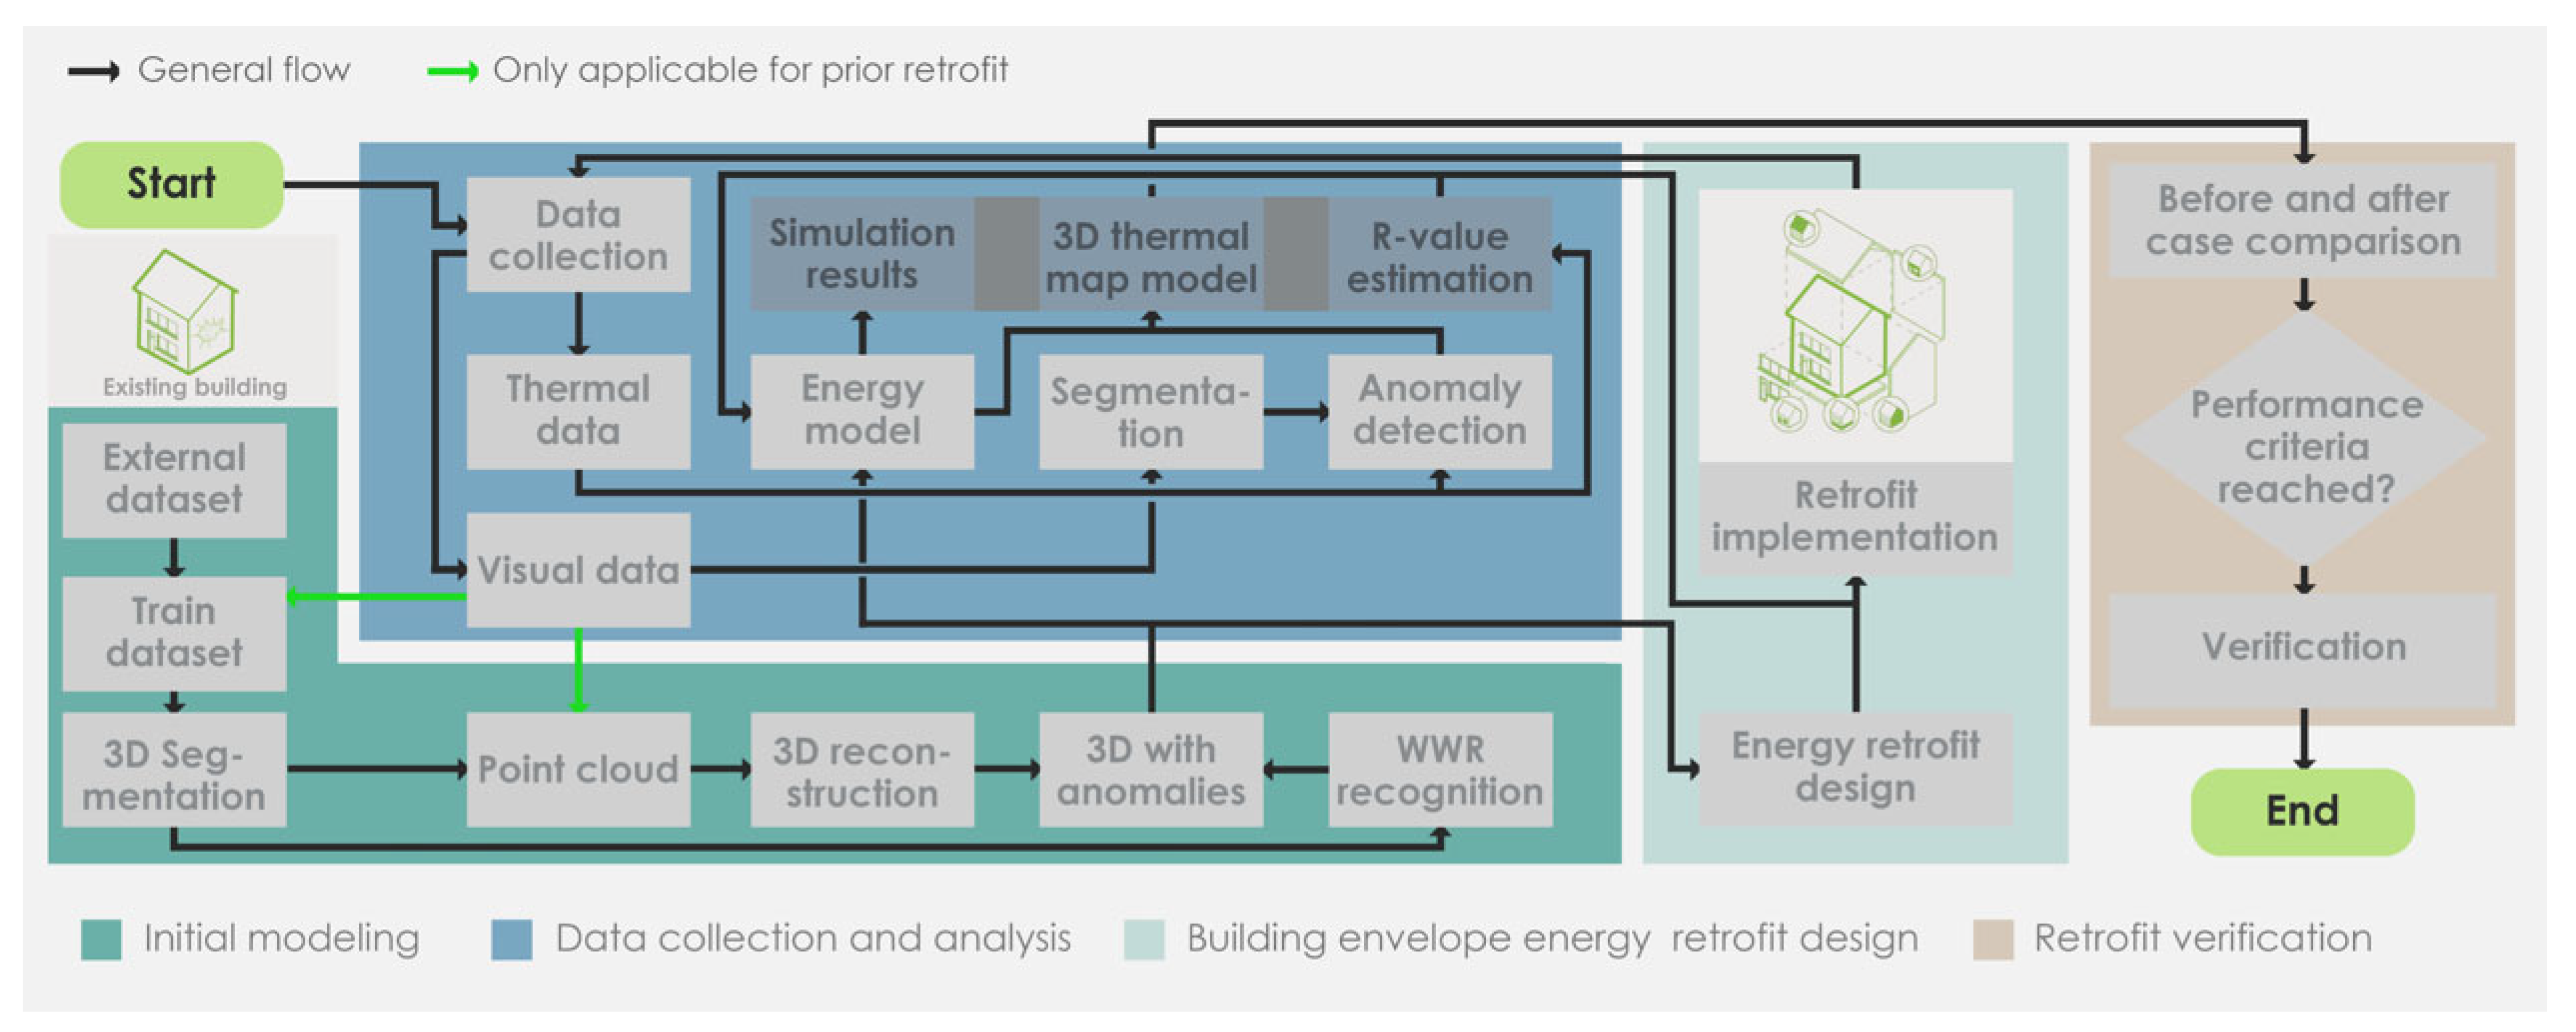
Considering the findings of the review regarding the potential of a drone-based approach, this study developed a drone-based framework for integrated building envelope assessment, which automates building envelope inspection procedures and collects data for the development of semantic-rich BIMs and energy models for retrofit design. Figure 8 shows an overview of the proposed workflow for drone-based building inspection, with four components: initial modeling; data collection and analysis; building energy retrofit design and implementation; and retrofit verification.
The same workflow can be used to compare the pre- and post-retrofit performance and calculate the degree of success of retrofit solutions.

5.1. Case Study

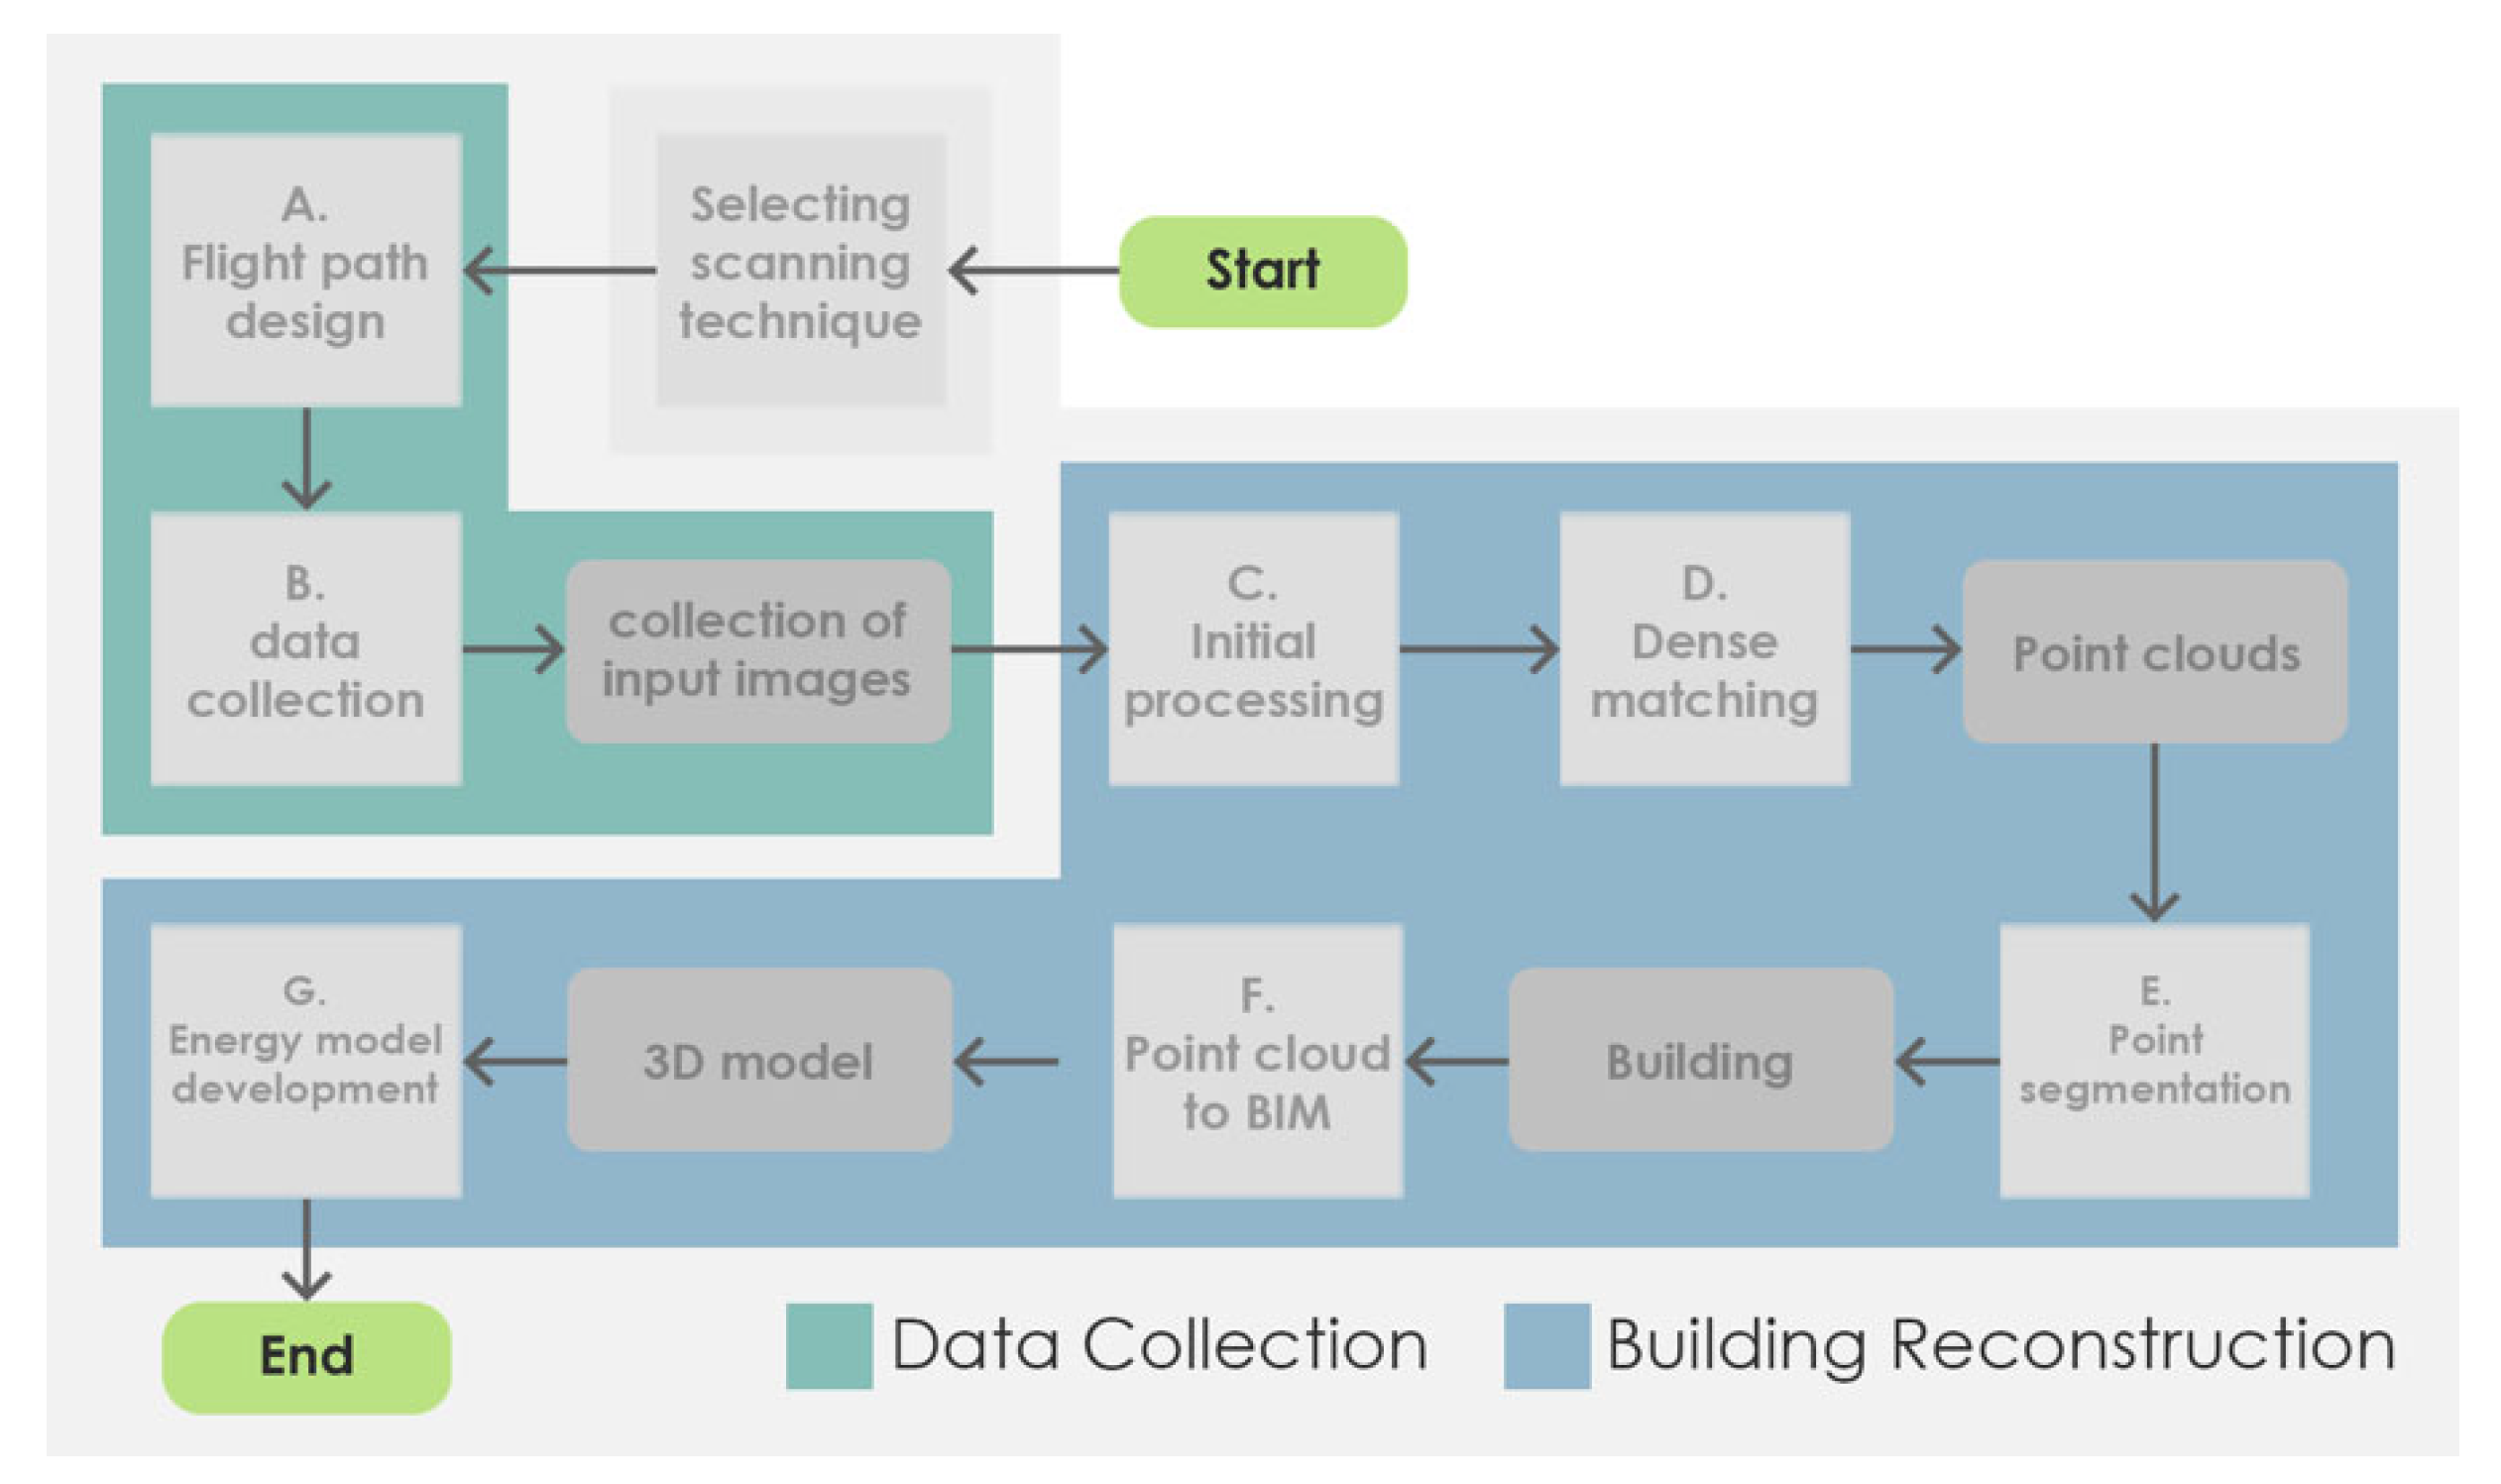
The reviewed literature varies some parameters in the recommended building inspection methodologies. Based on the proposed comprehensive workflow outlined in Figure 8, a case study was developed to demonstrate its application within a focused area. This case study specifically targets building reconstruction and the reproduction of geometries for use in building energy modeling. It follows the full workflow shown in Figure 8, including data collection, point cloud generation, classification, and digital model generation and conversion for energy simulation. Figure 9 presents a simplified version of this workflow. The main objective of the case study was to design and test an empirical setup for drone-based building inspection using thermal and RGB imagery.

5.1.1. Flight Path Design and Data Collection

The Building Envelope Systems Test (BEST) Laboratory (two-story building) on the Syracuse University campus, located at Syracuse, New York, was selected as the case study. This building is a baseline residential building used for research and development related to building envelope and energy performance. An ongoing study sponsored by the DOE Advanced Building Construction (ABC) program was planned to use the BEST Laboratory to demonstrate an exterior add-on panel system to improve the thermal insulation and airtightness of the building envelope. To design the panel layout and attach the system to the existing envelope, it was necessary to characterize the geometry of the existing façade, including its corners, openings, and locations for structural support. Therefore, this research explored the use of the drone-based scanning method to obtain the required geometrical information.
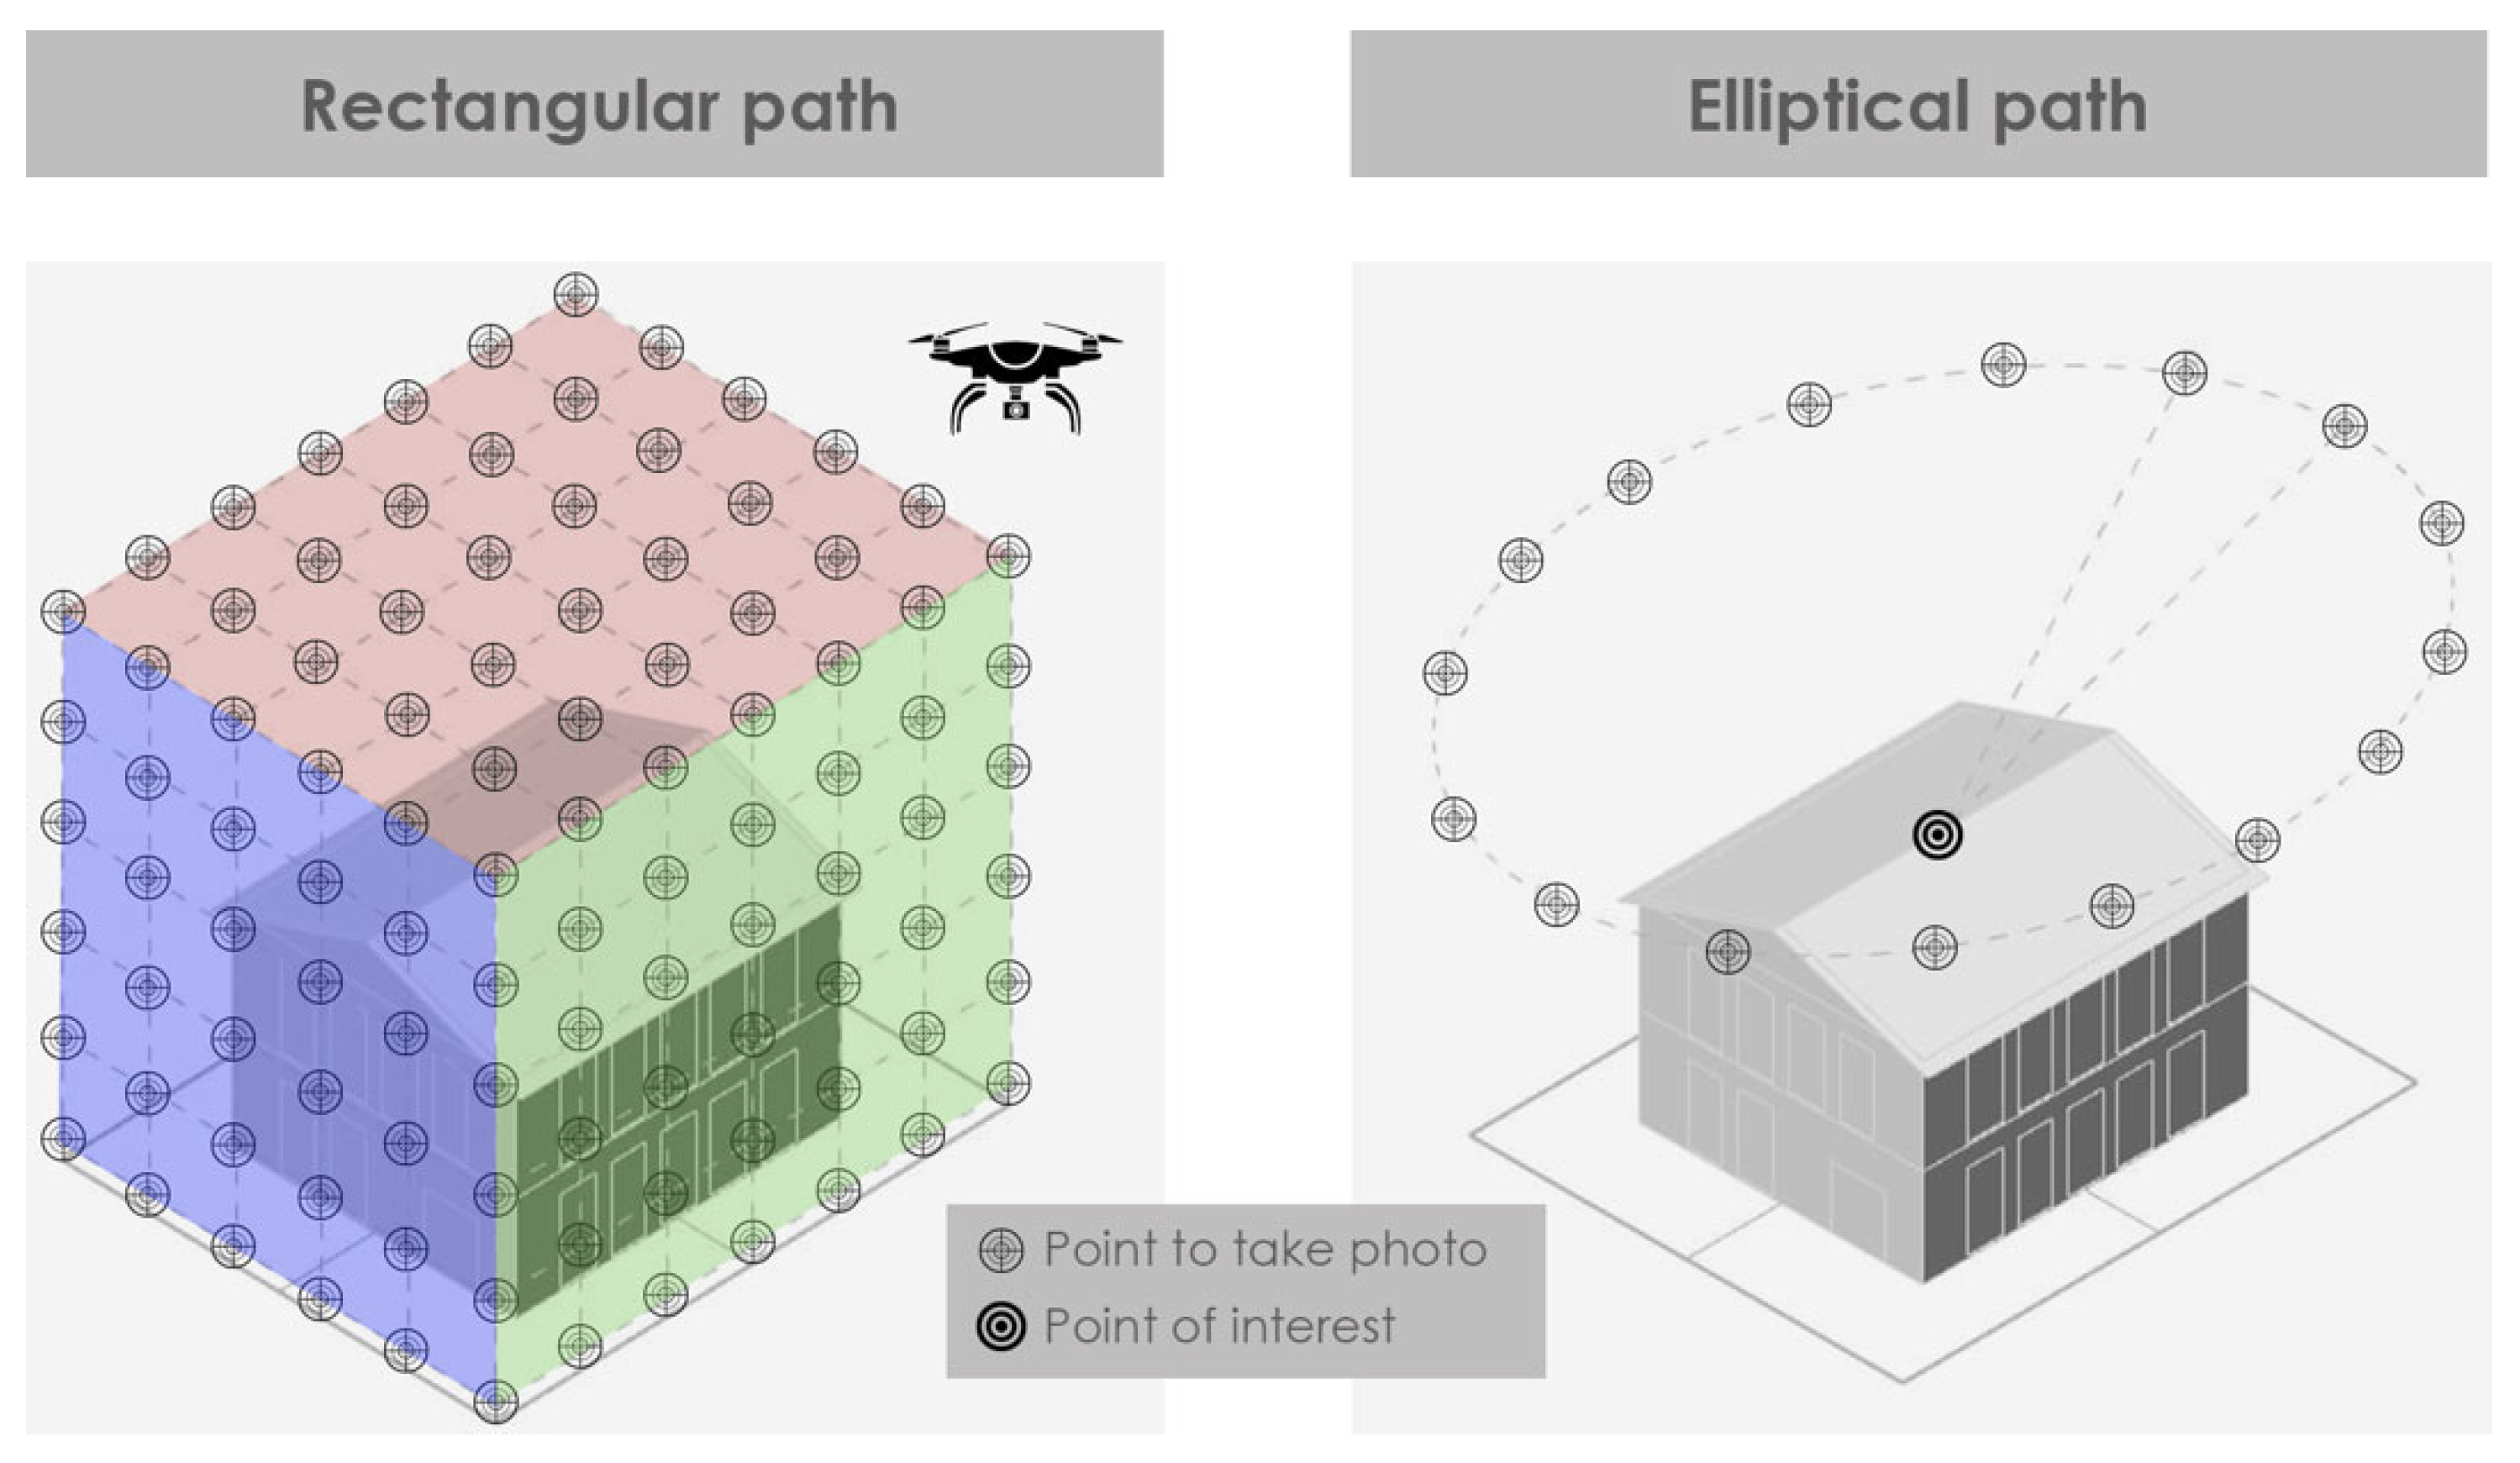
A quick site visit was planned and conducted first in order to design a safe flight path. After receiving the required authorizations from the Federal Aviation Administration (FAA) and University Office of Risk Management, we organized a site visit to collect data. Figure 10 demonstrates two different flight paths that were designed and investigated for the case study. For the rectangular flight path, data were collected with the sensor positioned perpendicular to the surface. However, for the elliptical flight path, the sensor was automatically adjusted to an off-nadir angle to effectively capture the target area.
The elliptical flight was investigated for the creation of a 3D point cloud of the building, in addition to the actual camera path over the tie points. A rectangular flight path was designed and implemented as well, as this is more useful for an automated vision-based envelope inspection. In the rectangular flight path shown in Figure 10, two representative vertical flight paths and one horizontal flight path are highlighted in color (northern vertical plane in blue, western plane in green, and horizontal plane in red). However, in the experiment, all five different envelope planes were inspected. The Pix4Dcapture (which provides free flight capabilities to follow vertical flight plans and grid capabilities for automated horizontal flight paths) and DJI Pilot apps were used to control the drone (taking images that were perpendicular to the façade) during the flight. Distances of 3.5 m from the finishing of the vertical faces of the building envelope and 7.5 m from the top point of the roof, with a 3 m step to capture images, were considered in the flight path design step. These considerations allowed us to obtain higher image overlap than when using the threshold range of 70–80% that was discussed before.
The circular flight capability of Pix4Dcapture was used to control the drone during the elliptical flight. Three different altitudes of 18.3, 24.4, and 30.5 m were considered, referred to as Scenarios 1, 2, and 3, respectively. The top-view design of the flight plan for the collection of data was taken with a 10° angle between images.
Building inspections were conducted with a DJI Mavic 2 Enterprise Dual that was equipped with visual and thermal cameras. Both thermal and visible images were considered to be taken during the experiment. The experiment was conducted in mid-August, during the evening, with a semi-cloudy sky and stable temperatures without precipitation [21]. An air temperature of 23.3 °C and relative humidity of 41% were recorded during the experiment.
A ground-based laser scanning survey was conducted using the Leica BLK360, a compact terrestrial LiDAR scanner capable of capturing up to 360,000 points per second with ranging accuracy of ±4 mm at 10 m. Multiple scans were acquired from strategic positions around the building perimeter to ensure full envelope coverage, particularly for lower façade zones occluded in aerial imagery. The raw scans were exported in .e57 format and imported into the CloudCompare software (version 2.12.4) for post-processing. For a comparative analysis with the drone-based photogrammetric point cloud, the datasets were co-registered using iterative closest point (ICP) alignment, with prealignment based on coarse manual positioning. The alignment quality was verified by checking the point cloud deviation statistics and residual errors, ensuring sufficient accuracy for the ground truth evaluation of the UAV data.

5.1.2. Post-Flight Analysis and Building Reconstruction

Pix4Dmapper was used to generate 3D point clouds from our collection of input images. We used the classification tool to segment the points into the ground, road surface, vegetation, buildings, and human-made objects. Then, we imported the points in the building categories into the Autodesk® ReCap® software (version 2022.2.1) to create a 3D model. The raw data from digital photogrammetry lack the necessary information to create a building energy model (e.g., walls, windows, and roof). Therefore, this intermediate step was required to transform the point cloud into a 3D model. Simplifications were made to reduce the geometric complexity while maintaining thermal relevance, such as merging small façade features and excluding non-thermally relevant appendages. Accordingly, the constructed model was transported into the Rhinoceros 3D environment. This model was used to provide inputs for building energy modeling. Thermal simulation engines (e.g., EnergyPlus) require a 3D model to be a closed volume concerning boundary conditions [88]. Therefore, a 3D model that does not represent a closed volume cannot be used for this purpose. The feasibility of this workflow was verified by running a successful energy simulation, using EnergyPlus (version 22.2), which is handled via Honeybee in the Grasshopper interface [89]. The default construction set of Honeybee was assigned to the building model, and other simulation parameters were extracted from [90], according to residential use. Material properties such as thermal conductivity and emissivity were assigned based on the DOE’s prototype building assumptions [91]. Zoning was approximated with one thermal zone for the first floor and another one for the second floor. These assumptions were consistent with standard practice for early-stage retrofit design simulations. Furthermore, the hourly annual weather data were selected for Syracuse from the EnergyPlus Weather (EPW) repository. The classification results revealed several challenges at building corners and roof overhangs, where false positives were observed due to occlusions and oblique camera angles. Vegetation mislabeling along façade edges was also noted and attributed to shadows and point cloud overlap artifacts. These issues highlight the need for enhanced post-processing algorithms or integration with ground-based scanning. Despite these limitations, the classification accuracy for major components (walls, roofs, ground) was above 90%—sufficient for energy modeling inputs. Future workflows may benefit from the integration of semantic segmentation models trained on urban UAV datasets to improve the label robustness.

6. Results and Discussion

6.1. Case Study Systems

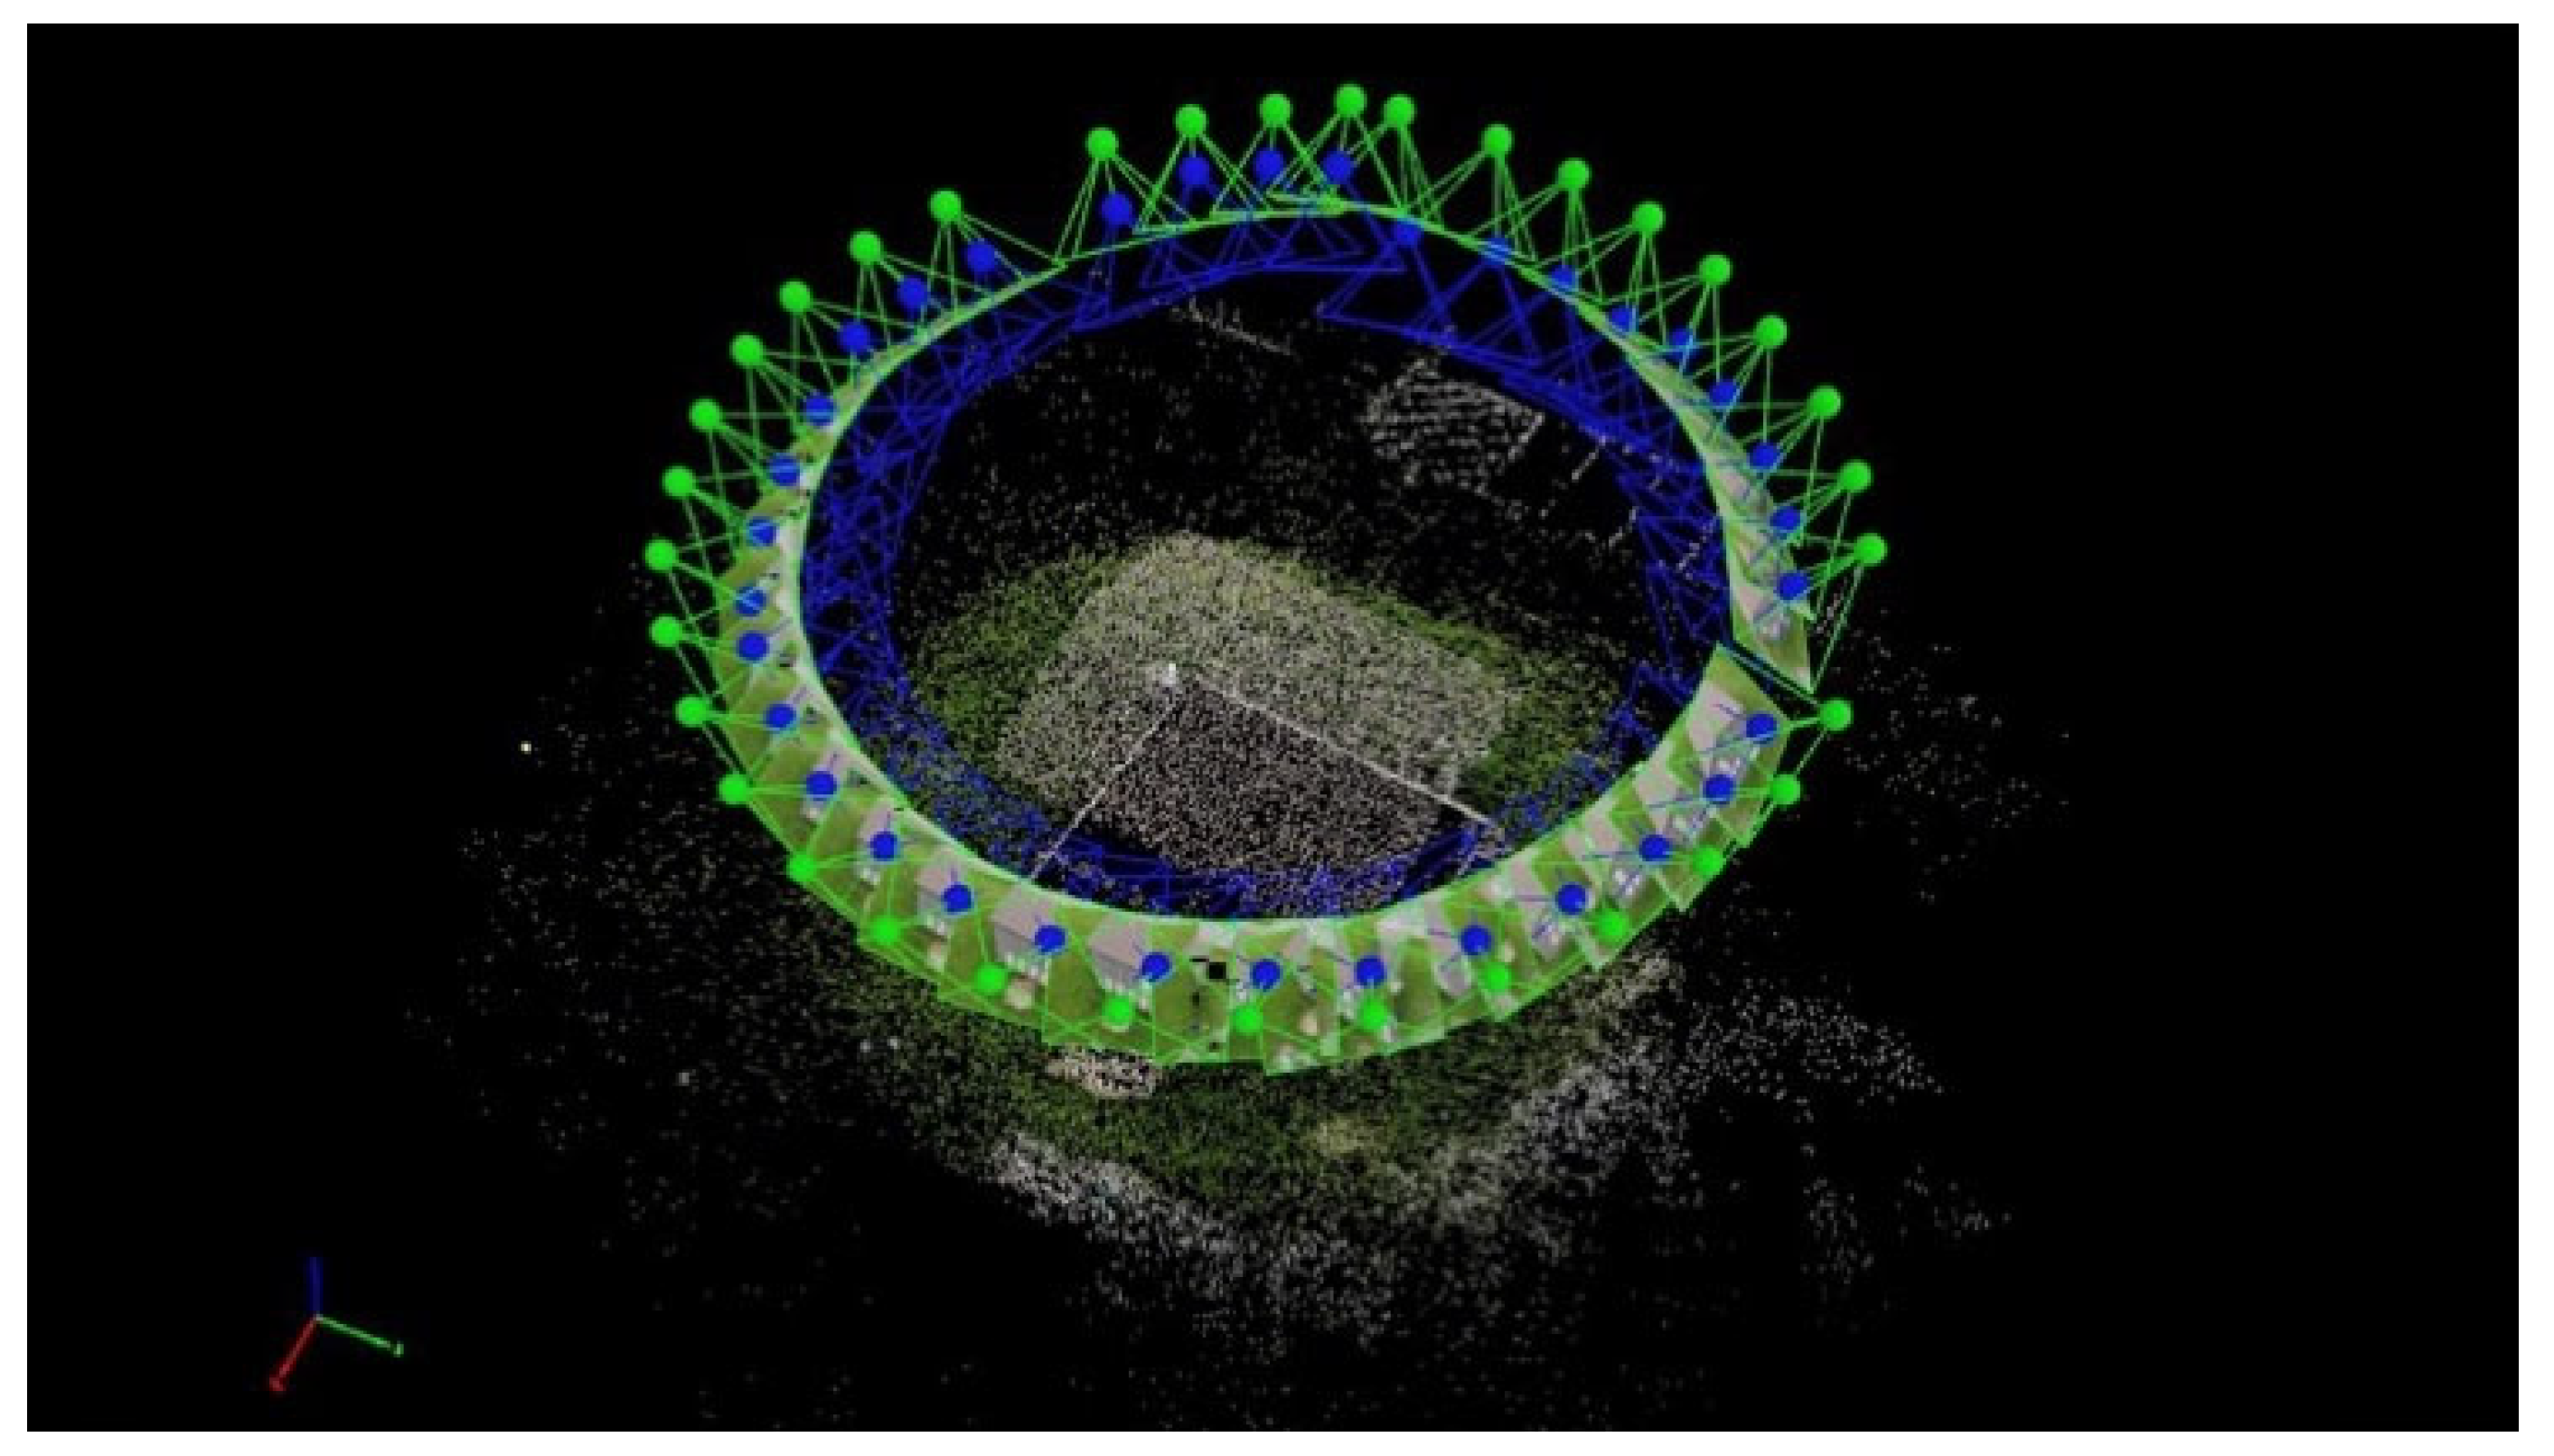
After collecting the data, a dataset containing images with GPS positioning was imported into Pix4Dmapper. This software extracts pixels from images and creates a point cloud model. This step is achieved by triangulating individual pixels from multiple geo-located images. Initial processing is needed to create tie points, which is the preliminary step in creating point clouds and mesh reconstruction. Figure 11 shows the camera path and the initial created cloud.
Three different altitudes of 18.3, 24.4, and 30.5 m were considered, referred to as Scenarios 1, 2, and 3, respectively. Figure 12 demonstrates the results of the point clouds and classification for the three different altitude scenarios. As expected, according to the point clouds, Scenario 1, with a lower altitude, yielded a more precise model. The observed trend is that, when increasing the altitude from 18.3 m to 30.5 m, the quality of the point cloud at the corners of the building is reduced. This can be explained by the angle at which the picture is taken with the camera to the points of interest. From the perspective view, false positive points were labeled as vegetation along the vertical corner edges and behind the roof overhang. Additional algorithms may be needed to further post-process and improve the accuracy of the labeling task.
From additional testing, we observed that blurry or missing images led to local artifacts, such as warped geometry or incomplete surfaces, particularly in low-texture regions. Nonetheless, the photogrammetry pipeline degraded gracefully when sufficient image overlap (above 70%) and focus were maintained. To ensure consistency, our workflow included tie point density checks and reprojection error thresholds to identify and exclude problematic images before generating the dense point cloud.
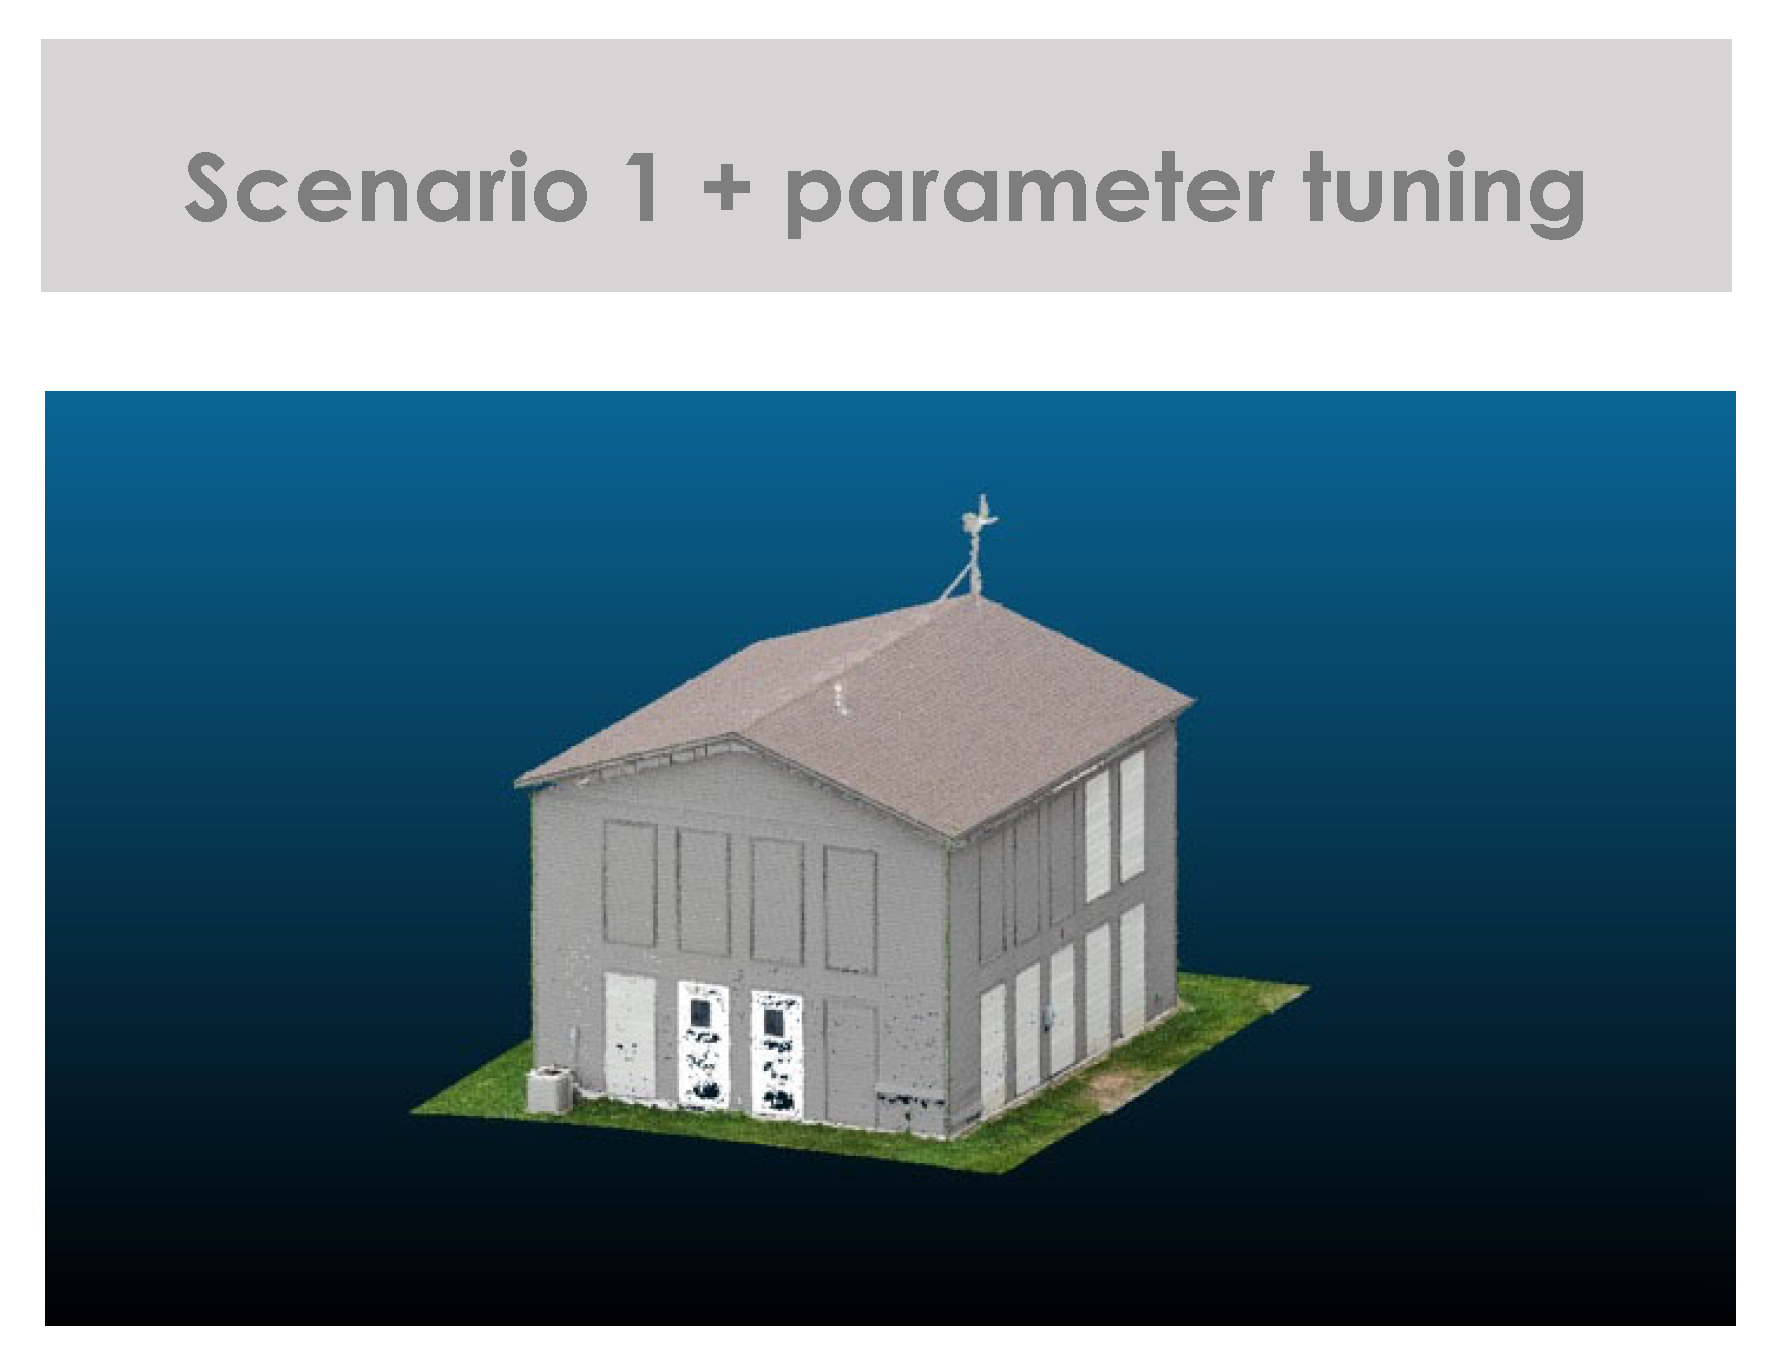
The computation times for the point clouds created from Scenarios 1, 2, and 3 were 5 min and 20 s, 5 min and 42 s, and 6 min and 43 s, respectively. The numbers of points in the point clouds created from Scenarios 1, 2, and 3 were 2,908,150, 2,655,083, and 2,385,936, respectively. Among these three scenarios, the first one was selected. After selecting the scenario form the previous step, two parameters, namely the point density (from medium to high) and image scale (from 0.5 to 1), were tuned to improve the accuracy. Figure 13 shows the point cloud after parameter tuning. It contained 20,786,114 points. It took 69 min and 21 s (after parameter tuning) to construct the point cloud. This processing time is consistent with UAV-based photogrammetry workflows at the building scale, where reconstructions from high-resolution imagery and dense point clouds typically require 1–2 h depending on the model complexity and system specifications.
Additionally, a laser scanning experiment was performed to compare and verify the accuracy of point cloud generation when using the drone-based approach. The CloudCompare software was used to compare the point clouds generated with the drone-based method to those with a terrestrial LiDAR approach. Figure 14 shows the results in terms of the cloud-to-cloud (C2C) absolute difference maps for the two methods (Scenario 1 before tuning and after parameter tuning).
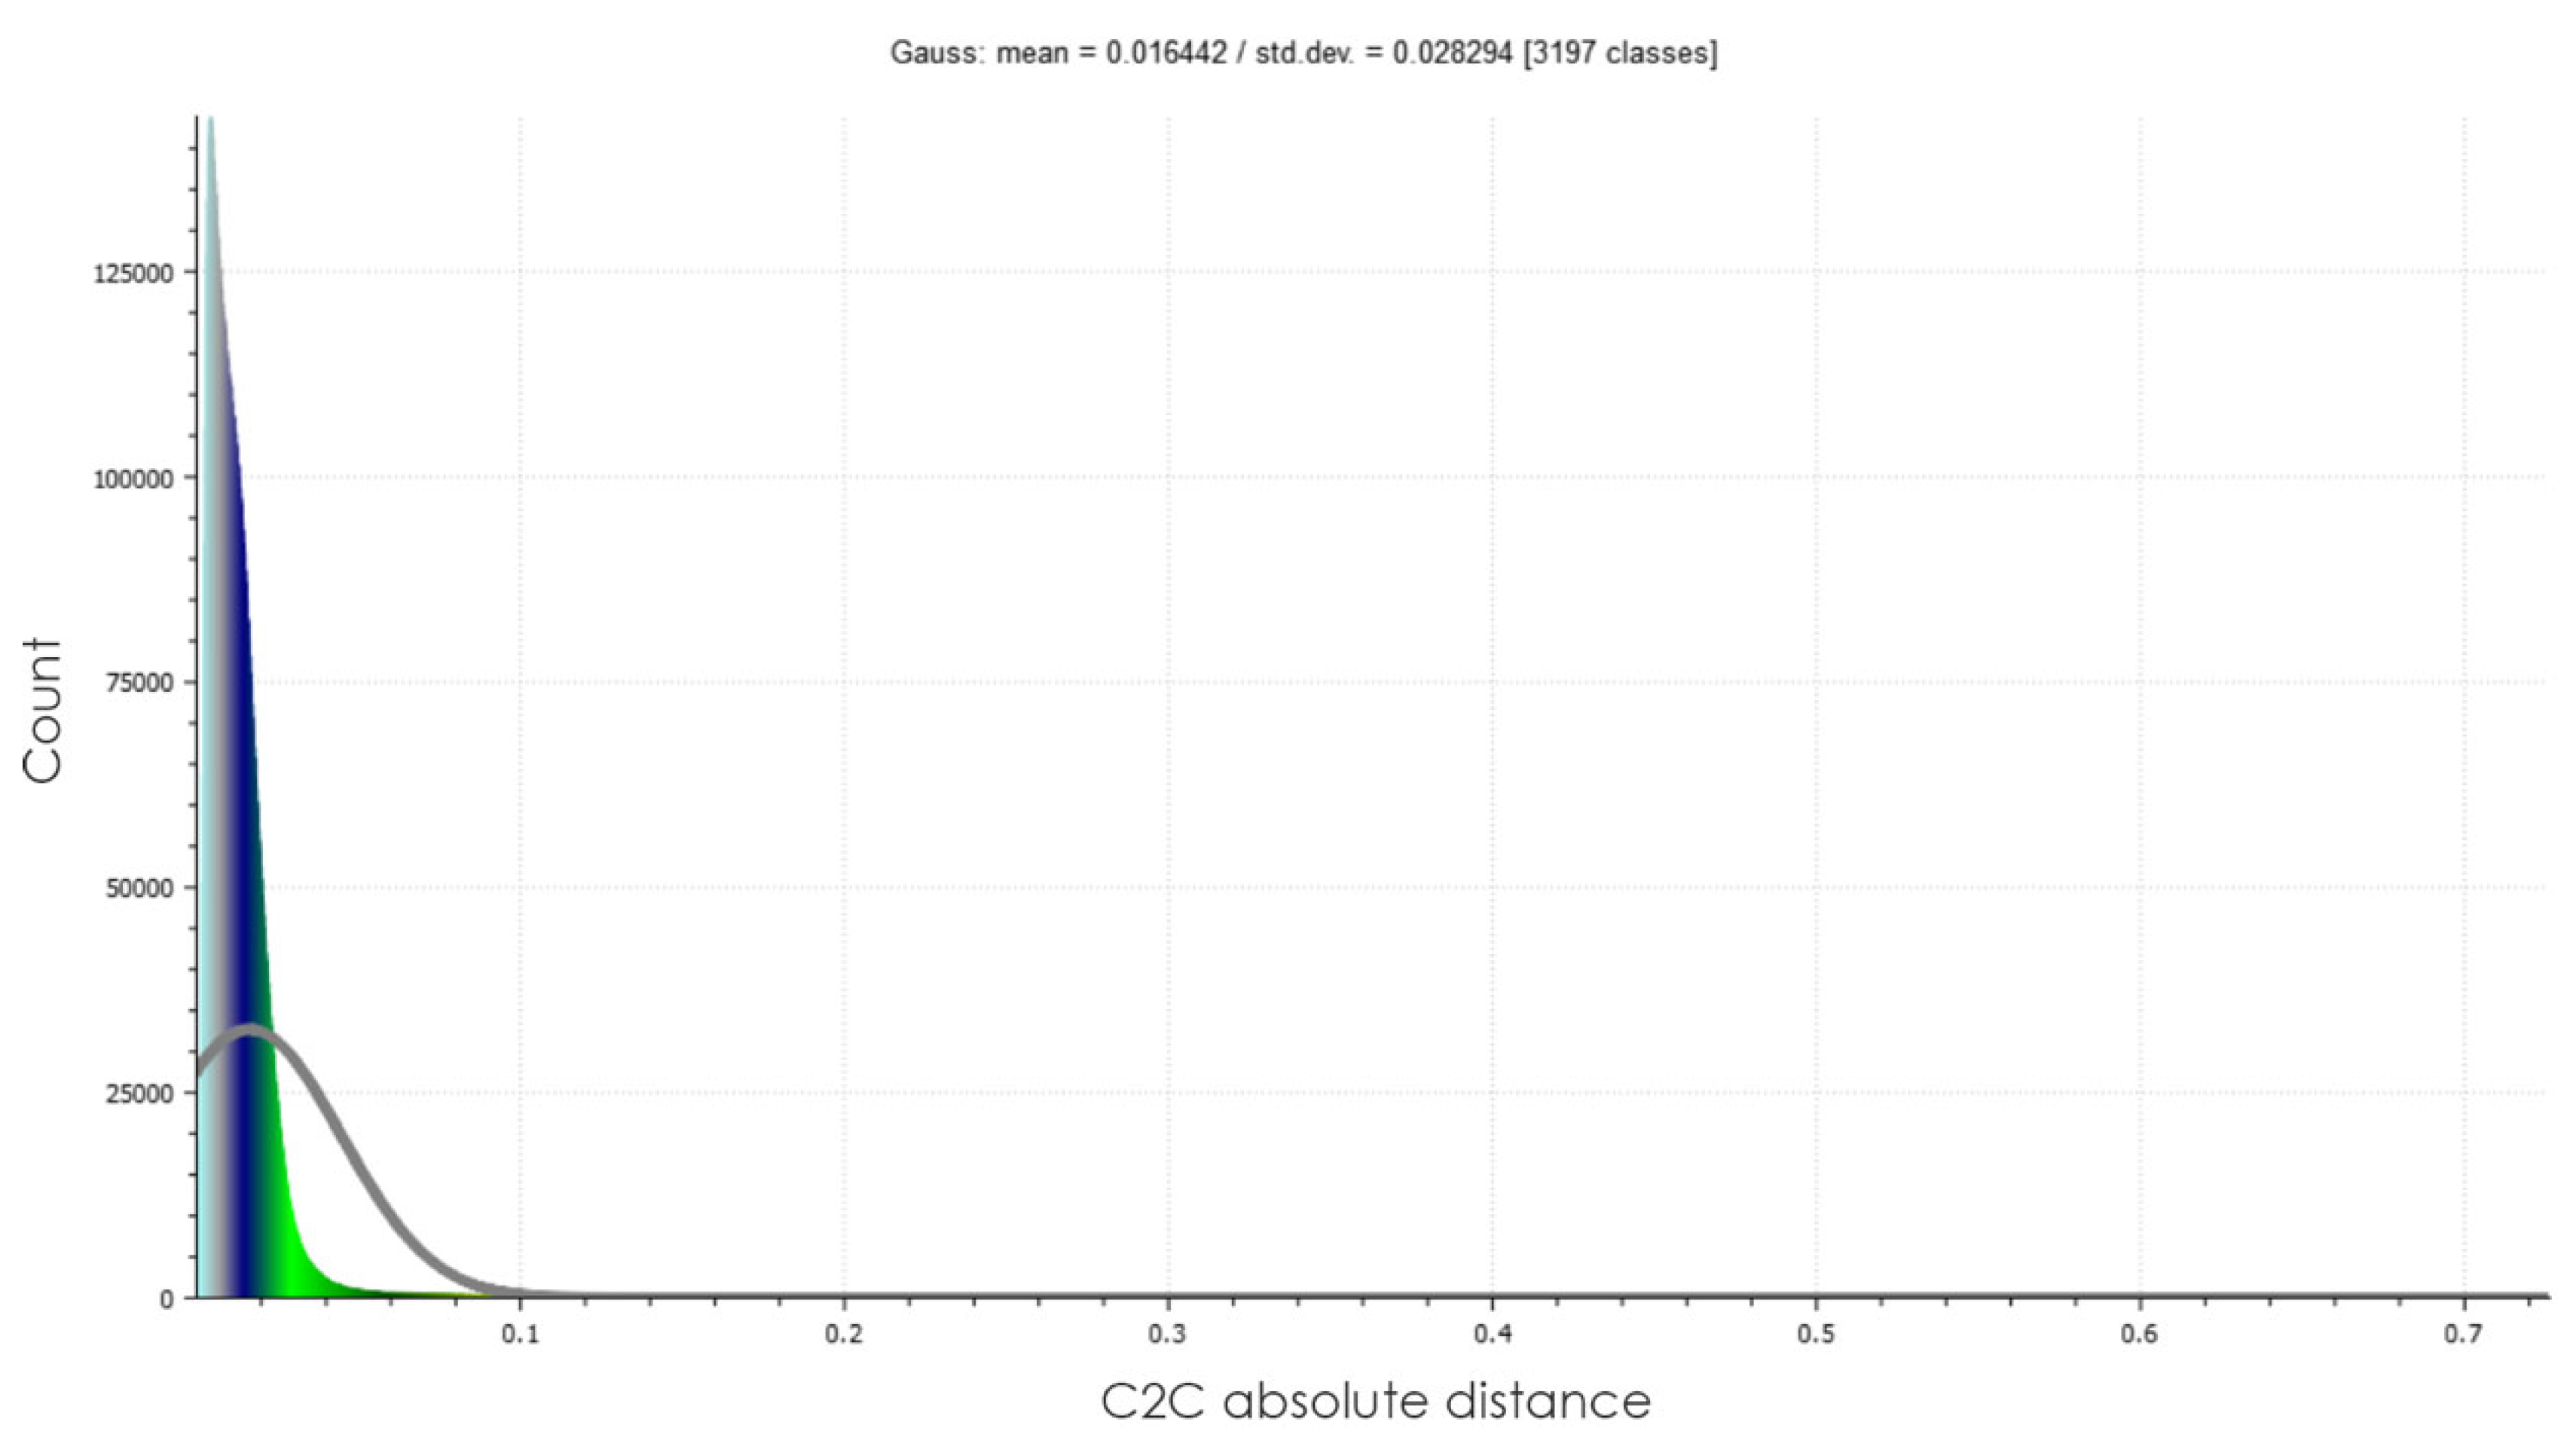
Figure 15 shows the cloud-to-cloud distance distributions between the laser scan and drone-based model. The color histogram indicates the frequency of observed deviations across the point cloud, while the grey line represents the cumulative distribution function. The results demonstrate a reduction in the standard deviation from 0.054 mm to 0.028 mm after parameter tuning. Further improvements may still be possible with additional processing.
The building class was separated and exported to Autodesk ReCap, where it could be translated into a building energy model. Figure 16 shows the constructed energy model visualized in Rhinoceros, in addition to the energy intensity results in terms of heating and cooling for the simulated case. The results show that the Honeybee model is debugged. Therefore, a successful experiment was conducted using drone scanning technology to create a building energy model.
Energy simulations, along with automated building envelope inspection, are essential in conducting and reporting energy audits [92]. This information is required for the design of retrofitting strategies considering two aspects—firstly, it is crucial in creating an energy model baseline with which to apply and compare various retrofit strategies; secondly, detailed geometry models help in conducting a successful design phase for each retrofitting project. There are also various aspects that can be improved in future studies. We used an FLIR dual-sensor camera, but, to improve the quality of the images, it is possible to use cameras with a higher resolution. It is also possible to install other sensors or even laser scanners on the drones.
The results of the case study prove the feasibility of this quick, inexpensive, and reliable approach to inspecting, assessing, and reporting existing building conditions. However, the data exchange between various tools and platforms is a limitation, and, in an ideal case, the steps for the generation of point clouds, segmentation, and transformation to BIMs could be fully automated into one package. Moreover, 3D point cloud reconstruction and point segmentation is performed in the Pix4D software and works accurately. As mentioned, if the goal is to create an end-to-end platform for automated building inspection, point clouds can be generated using various available APIs. Additionally, the energy simulation in Grasshopper can be integrated into the end-to-end platform using the Grasshopper API. Additional missing data for the creation of an energy model must be realized based on building characteristics or additional onsite measurements. These missing data include detailed thermal and visual properties and the airtightness level of the whole building enclosure.

6.2. Challenges of Drone-Based Approaches

Despite the numerous opportunities that drones offer for built environment projects, there are several challenges and limitations that must be considered when implementing this technology. These include regulatory and legal issues, technical limitations, data-related challenges, uncertainty, training and expertise, and safety concerns.
Data-Related Issues: The data-related aspects regarding drone-based approaches include data acquisition, processing, management, and security, as well as accuracy and precision [93]. One of the main challenges with this technology is acquiring accurate and reliable data. The quality of the data relies on the precision of the sensors and the quality of the camera used to capture images. Processing the large amounts of data collected by drones is another significant challenge. For instance, in the case study, it took about 69 min (after parameter tuning) to construct the point clouds. The extensive datasets generated require substantial computational resources for analysis. For instance, the raw image dataset from the case study was 2.7 GB in size. Data processing software must handle various data formats and sources. Additionally, the costs associated with data storage and processing present another challenge. Efficiently storing, organizing, and accessing the data generated by drone-based approaches is essential. Effective data management also necessitates security protocols to protect sensitive information [94]. Drones are vulnerable to cyberattacks, data interception, and hacking, which can result in data loss or manipulation. Implementing robust cybersecurity protocols, encryption techniques, and secure communication channels is necessary. Regular security assessments, updates, and employee training are also crucial in maintaining data integrity and privacy [95]. Furthermore, high levels of accuracy and precision are required for reliable data collection. Factors such as sensor calibration, GPS accuracy, and image resolution are among the parameters that can influence data accuracy.
Battery Constraints: One major issue across the design, construction, and maintenance phases is the limited flight time and range due to battery constraints. Most commercial drones have short flight durations, restricting their ability to cover large construction sites or large buildings, thus reducing their operational efficiency and necessitating frequent battery changes and recharging. Ongoing research aims to improve the battery’s energy density and recharge rate, enabling drones to operate for longer and cover more ground. Alternative power sources, such as fuel cells, solar panels, or wireless charging, could also reduce the need for frequent battery replacements, enhancing the efficiency.
Environmental Conditions: Environmental conditions like strong winds, rain, or fog pose challenges, as drones are vulnerable to turbulence and precipitation, which can damage electronic components and cause downtime and increased maintenance costs. Additionally, the environmental conditions strongly influence the accuracy of data acquisition using IRT and photogrammetry in drone-based building inspections. Solar radiation and ambient temperatures can introduce radiometric noise and false positives in thermal imaging, as demonstrated in thermographic surveys, where solar heating caused localized temperature spikes unrelated to structural issues [96]. Wind increases the convective heat loss from surfaces, diminishing the thermal contrast, which is essential for accurate defect detection. Furthermore, fog and rain scatter infrared and visible light, degrade image clarity, and impair feature matching in detection workflows. Uneven lighting conditions, such as harsh shadows or glare, similarly reduce the matching accuracy in photogrammetric reconstruction, as noted in studies assessing environmental impacts [97]. These findings underscore the importance of conducting inspections under stable conditions to ensure reliable thermal and visual data capture. Additionally, developing drones with durable structures, waterproofing, and advanced navigation systems will allow them to withstand harsh weather and continue operations safely.
Uncertainty in Drone-Based Assessment: Various sources of uncertainty exist in drone-based inspections. At the sensor level, calibration drift, resolution limits, and thermal camera emissivity assumptions introduce variability. Operationally, inconsistencies in the flight path, angle of image capture, and GPS noise impact repeatability. Environmental conditions such as wind and light variations further contribute to measurement errors. Finally, post-processing uncertainties arise during point cloud generation, surface classification, and energy model parameter assignment. Quantifying and minimizing these uncertainties is critical in improving the confidence in retrofit decision-making.
Drone Operators: Drone control relies on human operators, who may make mistakes, leading to accidents or unintended flights. Typically, the majority of the risks associated with drone operations are attributed to human operators. While there seems to be a lack of specialized drone operators, standardized training and user-friendly control interfaces are important for technological readiness, as well as accelerating their implementation and usage [98]. The use of automated flight path planning, offered by various software programs, is beneficial. However, there is a need for improvements in the capabilities for specific types of flight, such as vertical flight paths.
Regulations: The development of regulations for commercial and recreational UAVs is relatively recent in the U.S. at the federal level. In 2014, a legal precedent was established that classified UAVs as aircraft. In 2015, the FAA announced that businesses could gain approval to operate UAVs, anticipating that over 7000 businesses would access drones within three years [99]. In the same year, commercial drones were allowed to fly during daylight with a maximum speed of 100 miles per hour, a maximum weight of 0.55 pounds (250 g), and a maximum altitude of 500 feet. Drone operators had to be at least 17 years old, pass tests, and obtain a certificate to operate drones. Later, in 2015, the FAA mandated that drones weighing more than 0.55 pounds, including all attachments, must be registered [100].
In December 2020, the FAA announced the Final Rule on the Operation of Small Unmanned Aircraft Systems Over People, establishing four new categories of UAVs based on their weight and potential injury severity and permitting nocturnal flights with recurrent online training. These regulations emphasized safety, introducing remote identification (remote ID) to provide identification, location, and performance information to people on the ground and other airspace users [101]. UAVs without remote ID technology must be operated within sight for safety. Most other U.S. regulations on recreational and commercial drones also focus on safety, such as weight limits and avoiding proximity to other aircraft. Recreational users must register their drones and pass safety tests, while commercial operators need certification.
However, there are no federal privacy regulations specifically addressing the privacy issues posed by UAVs. The FAA’s Final Rule states that “privacy issues are outside the focus and scope of the rule.” Drone users must comply with existing privacy laws and regulations, with some states addressing privacy concerns [101].
The use of UAVs for building inspection is governed by a complex array of regulations and laws that vary by country or region. Regulatory authorities typically enforce requirements related to pilot certification, UAV registration, flight restrictions, and data privacy [58]. These regulations can present significant challenges for construction companies and inspection firms seeking to utilize UAVs for construction inspections. As mentioned, in the U.S., for example, the FAA regulates drone usage under Part 107. These rules outline the process of obtaining a remote pilot certificate and registering drones with the FAA. They also include flight restrictions, such as a maximum altitude of 400 feet and the requirement to keep the drone within the visual line of sight. Non-compliance with these regulations can lead to substantial fines or even criminal charges.
Regulatory challenges can also influence the ability to obtain necessary permits and approvals for the operation of drones in building inspections. In some countries, securing permits to fly drones over urban or populated areas can be difficult due to privacy and safety concerns [102]. Additionally, construction companies, university campuses, and inspection firms may need extra permits or approval from local authorities, depending on the project’s location and nature. Understanding and adhering to relevant regulations is crucial for the safe and effective operation of UAVs in building inspection. Inspection firms must carefully navigate the regulatory and legal landscape in their region and collaborate with regulatory bodies and local authorities to secure the necessary approvals.
While the drone-based approach provides geometric and surface temperature information, the focus of this work was not to estimate thermal/optical properties such as R-values or emissivity. Estimating these parameters would require additional boundary condition data (e.g., indoor temperature or heat flux) or integration with simulation tools. This remains a limitation of the current approach and represents an important direction for future research.

7. Conclusions

This study provides an overview of the data requirements and benefits of a drone-based approach for building envelope inspection. It identifies the essential data needed for energy retrofit design, such as geometric information, thermal characteristics, and defect identification. Suitable sensors for drones, including but not limited to LiDAR, thermal cameras, and high-resolution cameras, were evaluated for their effectiveness in data collection. Effective flight path parameters and conditions, such as the altitude, overlap, and timing, were discussed, emphasizing their importance for accurate data capture. An experiment was conducted to empirically assess the reviewed work and develop an overall framework. A drone-based building inspection method was presented and tested, and the results were stated. This study illustrates the practical application of the proposed workflow, demonstrating its potential for the creation of 3D models and in conducting energy simulations. This research also highlights several challenges associated with drone-based approaches, including data accuracy, environmental conditions, operator training, and regulatory compliance. Addressing these challenges is crucial in optimizing the use of drones in building inspections. The study underscores the potential of drone technology to revolutionize building inspections by making them more efficient, accurate, and scalable. This advancement supports the development of sustainable and energy-efficient buildings, aligning with stringent international and national climate targets. Existing software presents a variety of options for post-processing, with reduced manual workflows, as a step closer towards fully automated building performance inspections using drones. Further research and technological advancements are necessary to fully realize the potential of drone-based building inspections and to address the identified challenges effectively. Future studies should build on the presented workflows to develop an end-to-end platform for building energy audits.

Author Contributions

Conceptualization, S.M. and R.R.; methodology, S.M. and R.R.; software, S.M.; validation, S.M. and R.R.; formal analysis, S.M.; investigation, S.M.; resources, R.R. and P.C.; data curation, S.M.; writing—original draft preparation, S.M.; writing—review and editing, S.M., R.R. and P.C.; visualization, S.M.; supervision, R.R. and P.C.; project administration, S.M. All authors have read and agreed to the published version of the manuscript.

Funding

This research received no external funding.

Data Availability Statement

The data and code used in this study are available from the corresponding author and can be shared upon reasonable request.

Conflicts of Interest

Author Ryan Razkenari is employed by the Amazon. The remaining authors declare that the research was conducted in the absence of any commercial or financial relationships that could be construed as a potential conflict of interest.

References

  1. New York State Energy Research and Development Authority (NYSERDA) Advanced Buildings Program. Available online: https://www.nyserda.ny.gov/All-Programs/Advanced-Buildings (accessed on 27 June 2022).
  2. Mirzabeigi, S.; Soltanian-Zadeh, S.; Krietemeyer, B.; Dong, B.; Wilson, N.; Carter, B.; Zhang, J. Towards Occupant-Centric Building Retrofit Assessments: An Integrated Protocol for Real-Time Monitoring of Building Energy Use, Indoor Environmental Quality, and Enclosure Performance in Relationship to Occupant Behaviors. ASHRAE Trans. 2024, 130, 70–78. [Google Scholar]
  3. Crovella, P. Integrated Building Assessment to Enable Retrofit Design, Fabrication and Verification: A Drone-Based Approach. In SyracuseCoE Research Brief Series; Syracuse University Libraries: Syracuse, NY, USA, 2024; Volume 5. [Google Scholar]
  4. Mirzabeigi, S. Integrated Building Envelope Assessment Towards Automation of Energy Retrofits: Drone-Based Data Acquisition, Automated Thermal Anomaly Detection, and Workflow Development. Ph.D. Thesis, State University of New York College of Environmental Science and Forestry, Syracuse, NY, USA, 2024. [Google Scholar]
  5. ANSI/ASHRAE/ACCA Standard 211-2018; Standard for Commercial Building Energy Audits. ASHRAE: Atlanta, GA, USA, 2018.
  6. Mirzabeigi, S.; Razkenari, M. Design Optimization of Urban Typologies: A Framework for Evaluating Building Energy Performance and Outdoor Thermal Comfort. Sustain. Cities Soc. 2022, 76, 103515. [Google Scholar] [CrossRef]
  7. City of New York Housing Preservation & Development (HPD); Housing Development Corporation (HDC); New York State Homes & Community Renewal (HCR). Integrated Physical Needs Assessment (IPNA) Standard for New York City and State Low/Moderate Income Multifamily Buildings. New York, USA. 2022. Available online: https://www.nyserda.ny.gov/-/media/Project/Nyserda/Files/Programs/IPNA/IPNA-Standard.pdf (accessed on 27 May 2025).
  8. City of New York RCNY §103-07. Energy Audits and Retro-Commissioning of Base Building Systems. Rules of the City of New York, Title 1, Chapter 100, Subchapter C, Section 103-07. Published October 4, 2024; effective January 1, 2025. Available online: https://www.nyc.gov/assets/buildings/rules/1_RCNY_103-07.pdf (accessed on 8 May 2025).
  9. ASTM E2841-19; Standard Guide for Conducting Inspections of Building Facades for Unsafe Conditions. ASTM International: West Conshohocken, PA, USA, 2019.
  10. ASTM E2270-14; Standard Practice for Periodic Inspection of Building Façades for Unsafe Conditions. ASTM International: West Conshohocken, PA, USA, 2019.
  11. City of New York RCNY §103-04. Periodic Inspection of Exterior Walls and Appurtenances of Buildings. Rules of the City of New York, Title 1, Chapter 100, Subchapter C, Section 103-04. Title Promulgated in 2020 and Amended Most Recently in February 2020. Available online: https://www.nyc.gov/assets/buildings/rules/1_RCNY_103-04.pdf (accessed on 8 May 2025).
  12. Pətrəucean, V.; Armeni, I.; Nahangi, M.; Yeung, J.; Brilakis, I.; Haas, C. State of Research in Automatic As-Built Modelling. Adv. Eng. Inform. 2015, 29, 162–171. [Google Scholar] [CrossRef]
  13. Wang, C.; Cho, Y.K. Application of As-Built Data in Building Retrofit Decision Making Process. Procedia Eng. 2015, 118, 902–908. [Google Scholar] [CrossRef]
  14. Schley, M.; Haines, B.; Roper, K.; Williams, B. BIM for Facility Management. Prepared for the BIM-FM Consortium, 12 August 2016. Available online: https://it.ifma.org/wp-content/uploads/2019/04/BIM-FM-Consortium-BIM-Guide-v2_1.pdf (accessed on 8 May 2025).
  15. Ghosh, A.; Chasey, A.D.; Cribbs, J. BIM for Retrofits: A Case Study of Tool Installation at an Advanced Technology Facility. In Proceedings of the 51st ASC Annual International Conference Proceedings, College Station, TX, USA, 22–25 April 2015. [Google Scholar]
  16. United BIM Inc. The Ultimate Guide: Scan to BIM; United-BIM Inc.: East Hartford, CT, USA, 2018. [Google Scholar]
  17. U.S. Institute of Building Documentation (USIBD). USIBD Level of Accuracy (LOA) Specification Guide, Version 2.0 (2016). Arlington, VA, USA. Published 10 October 2016. Available online: https://www.usibd.org/product/usibd-level-of-accuracy-loa-specification-guide-version-2-0-2016/ (accessed on 8 May 2025).
  18. El Masri, Y.; Rakha, T. A Scoping Review of Non-Destructive Testing (NDT) Techniques in Building Performance Diagnostic Inspections. Constr. Build. Mater. 2020, 265, 120542. [Google Scholar] [CrossRef]
  19. Mirzabeigi, S.; Zhang, R.; Krietemeyer, B.; Zhang, J. Modeling the Effects of Panel Interfaces on Air-Tightness and Thermal Performance of an Integrated Whole-Building Energy Efficiency Retrofit Assembly. In Proceedings of the International Buildings Physics Conference 2024, Toronto, ON, Canada, 25–27 July 2024; Springer Nature: Singapore, 2024. [Google Scholar]
  20. Riveiro, B.; Solla, M. Non-Destructive Techniques for the Evaluation of Structures and Infrastructure; CRC Press: Boca Raton, FL, USA, 2016. [Google Scholar]
  21. Burrows, P. Five Things to Know When Choosing a Mobile or Terrestrial Laser Scanner. Available online: https://shop.leica-geosystems.com/blog/five-things-know-when-choosing-mobile-or-terrestrial-laser-scanner (accessed on 14 June 2025).
  22. Grussenmeyer, P.; Landes, T.; Voegtle, T.; Grussenmeyer, P.; Landes, T.; Voegtle, T.; Ringle, K. Comparison Methods of Terrestrial Laser Scanning, Photogrammetry and Tacheometry Data for Recording of Cultural Heritage Buildings. Int. Arch. Photogramm. Remote Sens. Spat. Inf. Sci. 2008, 37, 213–218. [Google Scholar]
  23. Previtali, M.; Barazzetti, L.; Brumana, R.; Cuca, B.; Oreni, D.; Roncoroni, F.; Scaioni, M. Automatic Façade Segmentation for Thermal Retrofit. Int. Arch. Photogramm. Remote Sens. Spat. Inf. Sci. 2013, 40, 197–204. [Google Scholar] [CrossRef]
  24. Kim, J.-C.; Shin, S. Automatic Building Feature Extraction Using Lidar Data and Digital Map. 2006. Available online: https://www.asprs.org/a/publications/proceedings/fall2006/0019.pdf (accessed on 20 June 2022).
  25. Wood, R.L.; Mohammadi, M.E. LiDAR Scanning with Supplementary UAV Captured Images for Structural Inspections. In Proceedings of the International LiDAR Mapping Forum 2015, Denver, CO, USA, 23–25 February 2015; pp. 1–10. [Google Scholar]
  26. Jiang, R.; Jáuregui, D.V.; White, K.R. Close-Range Photogrammetry Applications in Bridge Measurement: Literature Review. Measurement 2008, 41, 823–834. [Google Scholar] [CrossRef]
  27. Schickert, M. Progress in Ultrasonic Imaging of Concrete. Mater. Struct. 2005, 38, 807–815. [Google Scholar] [CrossRef]
  28. Morales-Conde, M.J.; Rodríguez-Liñán, C.; Rubio de Hita, P. Application of Non-Destructive Techniques in the Inspection of the Wooden Roof of Historic Buildings: A Case Study. Adv. Mat. Res. 2013, 778, 233–242. [Google Scholar] [CrossRef]
  29. Shah, A.A.; Ribakov, Y. Effectiveness of Nonlinear Ultrasonic and Acoustic Emission Evaluation of Concrete with Distributed Damages. Mater. Des. 2010, 31, 3777–3784. [Google Scholar] [CrossRef]
  30. Ren, K.; Burkholder, R.J.; Chen, J. Investigation of Gaps between Blocks in Microwave Images of Multilayered Walls. In Proceedings of the IEEE Antennas and Propagation Society, AP-S International Symposium (Digest), Vancouver, BC, Canada, 19–24 July 2015; Institute of Electrical and Electronics Engineers Inc.: Piscataway, NJ, USA, 2015; pp. 691–692. [Google Scholar]
  31. Sévigny, P.; Fournier, J. Automated Front Wall Feature Extraction and Material Assessment Using Fused LIDAR and Through-Wall Radar Imagery. 2017. Available online: https://www.sto.nato.int/publications/STO%20Meeting%20Proceedings/STO-MP-SET-241/MP-SET-241-10-4.pdf (accessed on 8 May 2025).
  32. Zhang, W. Two-Dimensional Microwave Tomographic Algorithm for Radar Imaging through Multilayered Media. Prog. Electromagn. Res. 2014, 44, 261–270. [Google Scholar] [CrossRef]
  33. Giunta, G.; Calloni, G. Ground Penetrating Radar Applications on the Façade of St. Peter’s Basilica in Vatican. In Proceedings of the 15th World Conference on Non-Destructive Testing, Rome, Italy, 15–21 October 2000. [Google Scholar]
  34. Clark, M.R.; McCann, D.M.; Forde, M.C. Application of Infrared Thermography to the Non-Destructive Testing of Concrete and Masonry Bridges. NDT E Int. 2003, 36, 265–275. [Google Scholar] [CrossRef]
  35. Mirzabeigi, S.; Razkenari, M. Automated Vision-Based Building Inspection Using Drone Thermography. In Proceedings of the Construction Research Congress 2022: Computer Applications, Automation, and Data Analytics, Arlington, VA, USA, 9–12 March 2022; Volume 2-B, pp. 737–746. [Google Scholar]
  36. Snell, J.; Schwoegler, M. The Use of Infrared Thermal Imaging for Home Weatherization. The Snell Group Online Conference: IR for Weatherization & Building Diagnostics, Montpelier, VT, USA, May 2009. Available online: https://www.efficiencyvermont.com/Media/Default/bbd/2011/docs/presentations/efficiency-vermont-schwoegler-ir-home-weatherization-2009.pdf (accessed on 8 May 2025).
  37. Bauer, E.; Pavón, E.; Oliveira, E.; Pereira, C.H.F. Facades Inspection with Infrared Thermography: Cracks Evaluation. J. Build. Pathol. Rehabil. 2016, 1, 2. [Google Scholar] [CrossRef]
  38. Berger, M.; Armitage, A. Room Occupancy Measurement Using Low-Resolution Infrared Cameras. In Proceedings of the IET Irish Signals and Systems Conference (ISSC 2010), Cork, Ireland, 23–24 June 2010; pp. 249–254. [Google Scholar] [CrossRef]
  39. Mirzabeigi, S.; Razkenari, M. Data-Driven Building Occupancy Prediction: An Educational Building Case Study. In Proceedings of the Computing in Civil Engineering 2021, Orlando, FL, USA, 12–14 September 2021; American Society of Civil Engineers (ASCE): Reston, VA, USA, 2021; pp. 9–16. [Google Scholar]
  40. Rakha, T.; Gorodetsky, A. Review of Unmanned Aerial System (UAS) Applications in the Built Environment: Towards Automated Building Inspection Procedures Using Drones. Autom. Constr. 2018, 93, 252–264. [Google Scholar] [CrossRef]
  41. Lucchi, E. Applications of the Infrared Thermography in the Energy Audit of Buildings: A Review. Renew. Sustain. Energy Rev. 2018, 82, 3077–3090. [Google Scholar] [CrossRef]
  42. Kylili, A.; Fokaides, P.A.; Christou, P.; Kalogirou, S.A. Infrared Thermography (IRT) Applications for Building Diagnostics: A Review. Appl. Energy 2014, 134, 531–549. [Google Scholar] [CrossRef]
  43. Bayomi, N.; Nagpal, S.; Rakha, T.; Reinhart, C.; Fernandez, J.E. Aerial Thermography as a Tool to Inform Building Envelope Simulation Models. In Proceedings of the 10th Symposium on Simulation for Architecture and Urban Design (SimAUD 2019), San Diego, CA, USA, 7–9 April 2019; Rockcastle, S., Rakha, T., Cerezo Davila, C., Papanikolaou, D., Zakula, T., Eds.; The Society for Modeling & Simulation International (SCS): San Diego, CA, USA, 2019; pp. 45–48. ISBN 978-1-7138-0460-4. [Google Scholar]
  44. Danielski, I.; Fröling, M. Diagnosis of Buildings’ Thermal Performance—A Quantitative Method Using Thermography Under Non-Steady State Heat Flow. Energy Procedia 2015, 83, 320–329. [Google Scholar] [CrossRef]
  45. Fox, M.; Coley, D.; Goodhew, S.; De Wilde, P. Thermography Methodologies for Detecting Energy Related Building Defects. Renew. Sustain. Energy Rev. 2014, 40, 296–310. [Google Scholar] [CrossRef]
  46. Iwaszczuk, D.; Stilla, U. Quality Assessment of Building Textures Extracted from Oblique Airborne Thermal Imagery. ISPRS Ann. Photogramm. Remote Sens. Spat. Inf. Sci. 2016, 3, 3–8. [Google Scholar] [CrossRef]
  47. Cho, Y.K.; Ham, Y.; Golpavar-Fard, M. 3D As-Is Building Energy Modeling and Diagnostics: A Review of the State-of-the-Art. Adv. Eng. Inform. 2015, 29, 184–195. [Google Scholar] [CrossRef]
  48. Park, J.; Kim, P.; Cho, Y.K.; Kang, J. Framework for Automated Registration of UAV and UGV Point Clouds Using Local Features in Images. Autom. Constr. 2019, 98, 175–182. [Google Scholar] [CrossRef]
  49. De Filippo, M.; Asadiabadi, S.; Ko, N.; Sun, H. Concept of Computer Vision Based Algorithm for Detecting Thermal Anomalies in Reinforced Concrete Structures. Multidiscip. Digit. Publ. Inst. Proc. 2019, 27, 18. [Google Scholar]
  50. Rakha, T.; Liberty, A.; Gorodetsky, A.; Kakillioglu, B.; Velipasalar, S. Heat Mapping Drones: An Autonomous Computer Vision-Based Procedure for Building Envelope Inspection Using Unmanned Aerial Systems (UAS). Technol. Archit. Des. 2018, 2, 30–44. [Google Scholar] [CrossRef]
  51. Mirzabeigi, S.; Eteghad, P.; Razkenari, M.; Crovella, P.; Zhang, J. Drone-Based Scanning Technology for Characterizing the Geometry and Thermal Conditions of Building Enclosure System for Fast Energy Audit and Design of Retrofitting Strategies. In Proceedings of the 2022 (6th) Residential Building Design & Construction Conference, University Park, TX, USA, 11 May 2022; pp. 251–260. [Google Scholar]
  52. Autonomy Levels for Unmanned Systems (ALFUS) Framework; National Institute of Standards and Technology (NIST): Gaithersburg, MD, USA, 2004.
  53. Balestrieri, E.; Daponte, P.; De Vito, L.; Lamonaca, F. Sensors and Measurements for Unmanned Systems: An Overview. Sensors 2021, 21, 1518. [Google Scholar] [CrossRef]
  54. Shakhatreh, H.; Sawalmeh, A.H.; Al-Fuqaha, A.; Dou, Z.; Almaita, E.; Khalil, I.; Othman, N.S.; Khreishah, A.; Guizani, M. Unmanned Aerial Vehicles (UAVs): A Survey on Civil Applications and Key Research Challenges. IEEE Access 2019, 7, 48572–48634. [Google Scholar] [CrossRef]
  55. Choi, H.W.; Kim, H.J.; Kim, S.K.; Na, W.S. An Overview of Drone Applications in the Construction Industry. Drones 2023, 7, 515. [Google Scholar] [CrossRef]
  56. Shanti, M.Z.; Cho, C.S.; de Soto, B.G.; Byon, Y.J.; Yeun, C.Y.; Kim, T.Y. Real-Time Monitoring of Work-at-Height Safety Hazards in Construction Sites Using Drones and Deep Learning. J. Saf. Res. 2022, 83, 364–370. [Google Scholar] [CrossRef] [PubMed]
  57. Fan, J.; Saadeghvaziri, M. Applications of Drones in Infrastructures: Challenges and Opportunities. In Proceedings of the ICARD 2019: International Conference on Aerial Robotics and Drone, Los Angeles, CA, USA, 20–24 May 2019. [Google Scholar]
  58. Liang, H.; Lee, S.-C.; Bae, W.; Kim, J.; Seo, S. Towards UAVs in Construction: Advancements, Challenges, and Future Directions for Monitoring and Inspection. Drones 2023, 7, 202. [Google Scholar] [CrossRef]
  59. Jang, G.J.; Kim, J.; Yu, J.K.; Kim, H.J.; Kim, Y.; Kim, D.W.; Kim, K.H.; Lee, C.W.; Chung, Y.S. Review: Cost-Effective Unmanned Aerial Vehicle (UAV) Platform for Field Plant Breeding Application. Remote Sens. 2020, 12, 998. [Google Scholar] [CrossRef]
  60. Kim, I.H.; Jeon, H.; Baek, S.C.; Hong, W.H.; Jung, H.J. Application of Crack Identification Techniques for an Aging Concrete Bridge Inspection Using an Unmanned Aerial Vehicle. Sensors 2018, 18, 1881. [Google Scholar] [CrossRef]
  61. Omar, T.; Nehdi, M.L. Remote Sensing of Concrete Bridge Decks Using Unmanned Aerial Vehicle Infrared Thermography. Autom. Constr. 2017, 83, 360–371. [Google Scholar] [CrossRef]
  62. Adamopoulos, E.; Rinaudo, F. Uas-Based Archaeological Remote Sensing: Review, Meta-Analysis and State-of-the-Art. Drones 2020, 4, 46. [Google Scholar] [CrossRef]
  63. Bolourian, N.; Soltani, M.M.; Albahri, A.H.; Hammad, A. High Level Framework for Bridge Inspection Using LiDAR-Equipped UAV. In Proceedings of the ISARC 2017, 34th International Symposium on Automation and Robotics in Construction, Taiwan, China, 30 June 2017; pp. 683–688. [Google Scholar]
  64. Chauve, A.; Bretar, F.; Durrieu, S.; Pierrot Deseilligny, M.; Puech, W. FullAnalyze: A Research Tool for Handling Processing and Analyzing Full-Waveform Lidar Data. In Proceedings of the IEEE International Geoscience & Remote Sensing Symposium, Cape Town, South Africa, 12–17 July 2009; IEEE: Piscataway, NJ, USA, 2009. [Google Scholar]
  65. Zheng, S.; Zhang, J.; Zu, R.; Li, Y. Vision Transformer-Enhanced Thermal Anomaly Detection in Building Facades through Fusion of Thermal and Visible Imagery. J. Asian Arch. Build. Eng. 2024, 1–15. [Google Scholar] [CrossRef]
  66. Motayyeb, S.; Samadzedegan, F.; Dadrass Javan, F.; Hosseinpour, H. Fusion of UAV-Based Infrared and Visible Images for Thermal Leakage Map Generation of Building Facades. Heliyon 2023, 9, e14551. [Google Scholar] [CrossRef] [PubMed]
  67. Li, S.; Zhou, G.; Wang, S.; Jia, X.; Hou, L. Multi-Sensor Data Fusion and Deep Learning-Based Prediction of Excavator Bucket Fill Rates. Autom. Constr. 2025, 171, 106008. [Google Scholar] [CrossRef]
  68. Zhang, Z.; Zhu, L. A Review on Unmanned Aerial Vehicle Remote Sensing: Platforms, Sensors, Data Processing Methods, and Applications. Drones 2023, 7, 398. [Google Scholar] [CrossRef]
  69. Sreenath, S.; Malik, H.; Husnu, N.; Kalaichelavan, K. Assessment and Use of Unmanned Aerial Vehicle for Civil Structural Health Monitoring. Procedia Comput. Sci. 2020, 170, 656–663. [Google Scholar] [CrossRef]
  70. Hrubecky, J.; Wendy Wan, P. Using Drones to Conduct Facade Inspections—Local Law 102 of 2020; New York City Department of Buildings: New York, NY, USA, 2020. Available online: https://www.nyc.gov/assets/buildings/pdf/LL102of2020-DroneReport.pdf (accessed on 3 May 2022).
  71. United States Department of Energy DOE Announces Its E-ROBOT Prize Phase 1 Winners. Available online: https://www.energy.gov/eere/buildings/articles/doe-announces-its-e-robot-prize-phase-1-winners (accessed on 14 June 2025).
  72. Dai, M.; Ward, W.O.C.; Meyers, G.; Densley Tingley, D.; Mayfield, M. Residential Building Facade Segmentation in the Urban Environment. Build. Environ. 2021, 199, 107921. [Google Scholar] [CrossRef]
  73. Zhou, R.; Wen, Z.; Su, H. Automatic Recognition of Earth Rock Embankment Leakage Based on UAV Passive Infrared Thermography and Deep Learning. ISPRS J. Photogramm. Remote Sens. 2022, 191, 85–104. [Google Scholar] [CrossRef]
  74. Luo, K.; Kong, X.; Zhang, J.; Hu, J.; Li, J.; Tang, H. Computer Vision-Based Bridge Inspection and Monitoring: A Review. Sensors 2023, 23, 7863. [Google Scholar] [CrossRef] [PubMed]
  75. Qiu, Q.; Lau, D. Real-Time Detection of Cracks in Tiled Sidewalks Using YOLO-Based Method Applied to Unmanned Aerial Vehicle (UAV) Images. Autom. Constr. 2023, 147, 104745. [Google Scholar] [CrossRef]
  76. Mirzabeigi, S.; Razkenari, M.; Crovella, P. Automated Thermal Anomaly Detection through Deep Learning-Based Semantic Segmentation of Building Envelope Images. In Proceedings of the ASCE International Conference on Computing in Civil Engineering, New Orleans, LA, USA, 28–31 July 2024. [Google Scholar]
  77. Liu, Y.; Liu, Y.; Duan, Y. MVG-Net: LiDAR Point Cloud Semantic Segmentation Network Integrating Multi-View Images. Remote Sens. 2024, 16, 2821. [Google Scholar] [CrossRef]
  78. Tan, Y.; Li, G.; Cai, R.; Ma, J.; Wang, M. Mapping and Modelling Defect Data from UAV Captured Images to BIM for Building External Wall Inspection. Autom. Constr. 2022, 139, 104284. [Google Scholar] [CrossRef]
  79. Borrmann, D.; Nüchter, A.; Dakulović, M.; Maurović, I.; Petrović, I.; Osmanković, D.; Velagić, J. A Mobile Robot Based System for Fully Automated Thermal 3D Mapping. Adv. Eng. Inform. 2014, 28, 425–440. [Google Scholar] [CrossRef]
  80. Dugstad, A.-K.; Noichl, F.; Koleva, B. UAV Path Planning for Photogrammetric Capture of Buildings towards Disaster Scenarios. In Proceedings of the 33. Forum Bauinformatik, München, Germany, 24–26 September 2025. [Google Scholar]
  81. Maes, W.H.; Huete, A.R.; Steppe, K. Optimizing the Processing of UAV-Based Thermal Imagery. Remote Sens. 2017, 9, 476. [Google Scholar] [CrossRef]
  82. Emelianov, S.; Bulgakow, A.; Sayfeddine, D. Aerial Laser Inspection of Buildings Facades Using Quadrotor. Procedia Eng. 2014, 85, 140–146. [Google Scholar] [CrossRef]
  83. Choi-Fitzpatrick, A.; Juskauskas, T. Up in the Air: Applying the Jacobs Crowd Formula to Drone Imagery. Procedia Eng. 2015, 107, 273–281. [Google Scholar] [CrossRef]
  84. Haala, N.; Cramer, M.; Weimer, F.; Trittler, M. Performance test on UAV-based photogrammetric data collection. Int. Arch. Photogramm. Remote Sens. Spat. Inf. Sci. 2012, 38, 7–12. [Google Scholar] [CrossRef]
  85. Siebert, S.; Teizer, J. Mobile 3D Mapping for Surveying Earthwork Projects Using an Unmanned Aerial Vehicle (UAV) System. Autom. Constr. 2014, 41, 1–14. [Google Scholar] [CrossRef]
  86. Mirzabeigi, S.; Khalili Nasr, B.; Mainini, A.G.; Blanco Cadena, J.D.; Lobaccaro, G. Tailored WBGT as a Heat Stress Index to Assess the Direct Solar Radiation Effect on Indoor Thermal Comfort. Energy Build. 2021, 242, 110974. [Google Scholar] [CrossRef]
  87. WuDunn, M.; Dunn, J.; Zakhor, A. Point Cloud Segmentation Using RGB Drone Imagery. In Proceedings of the 2020 IEEE International Conference on Image Processing (ICIP), Abu Dhabi, United Arab Emirates, 25–28 October 2020; pp. 2750–2754. [Google Scholar]
  88. Alawadhi, M.S. Building Energy Model Generation Using a Digital Photogrammetry-Based 3D Model. Ph.D. Thesis, Carleton University, Ottawa, ON, Canada, 2017. [Google Scholar]
  89. Li, L.; Mirzabeigi, S.; Soltanian-Zadeh, S.; Dong, B.; Krietemeyer, B.; Gao, P.; Wilson, N.; Zhang, J. A High-Performance Multi-Scale Modular-Based Green Design Studio Platform for Building and Urban Environmental Quality and Energy Simulations. Sustain. Cities Soc. 2025, 119, 106078. [Google Scholar] [CrossRef]
  90. Mirzabeigi, S.; Razkenari, M. Multiple Benefits through Residential Building Energy Retrofit and Thermal Resilient Design. In Proceedings of the 6th Residential Building Design & Construction Conference (RBDCC 2022), State College, PA, USA, 11–12 May 2022; pp. 456–465. [Google Scholar]
  91. Mirzabeigi, S.; Dong, B. Miscellaneous Electric Loads Prediction by Deep Learning Implementation: An Educational Case Study. ASHRAE Trans. 2024, 130, 230–238. [Google Scholar]
  92. Mirzabeigi, S.; Soltanian-Zadeh, S.; Carter, B.; Krietemeyer, B.; Zhang, J. “Jensen” Networked Sensors for In-Situ Real-Time Monitoring of the Local Hygrothermal Conditions and Heat Fluxes Across a Building Enclosure Before and After a Building Retrofit. In Proceedings of the Multiphysics and Multiscale Building Physics, Toronto, ON, Canada, 25–27 July 2024; Berardi, U., Ed.; Springer Nature: Singapore, 2025; pp. 527–532. [Google Scholar]
  93. Quamar, M.M.; Al-Ramadan, B.; Khan, K.; Shafiullah, M.; El Ferik, S. Advancements and Applications of Drone-Integrated Geographic Information System Technology—A Review. Remote Sens. 2023, 15, 5039. [Google Scholar] [CrossRef]
  94. Ma, Y.; Wu, H.; Wang, L.; Huang, B.; Ranjan, R.; Zomaya, A.; Jie, W. Remote Sensing Big Data Computing: Challenges and Opportunities. Future Gener. Comput. Syst. 2015, 51, 47–60. [Google Scholar] [CrossRef]
  95. Weng, W.; Wang, J.; Shen, L.; Song, Y. Review of Analyses on Crowd-Gathering Risk and Its Evaluation Methods. J. Saf. Sci. Resil. 2023, 4, 93–107. [Google Scholar] [CrossRef]
  96. Mahmoodzadeh, M.; Gretka, V.; Mukhopadhyaya, P. Challenges and Opportunities in Quantitative Aerial Thermography of Building Envelopes. J. Build. Eng. 2023, 69, 106214. [Google Scholar] [CrossRef]
  97. Berra, E.F.; Peppa, M.V. Advances and Challenges of UAV SFM MVS Photogrammetry and Remote Sensing: Short Review. Int. Arch. Photogramm. Remote Sens. Spat. Inf. Sci. 2020, XLII-3/W12-2020, 267–272. [Google Scholar] [CrossRef]
  98. Johnsen, B.H.; Nilsen, A.A.; Hystad, S.W.; Grytting, E.; Ronge, J.L.; Rostad, S.; Öhman, P.H.; Overland, A.J. Selection of Norwegian Police Drone Operators: An Evaluation of Selected Cognitive Tests from “The Vienna Test System”. Police Pract. Res. 2024, 25, 38–52. [Google Scholar] [CrossRef]
  99. Lee, D.; Hess, D.J.; Heldeweg, M.A. Safety and Privacy Regulations for Unmanned Aerial Vehicles: A Multiple Comparative Analysis. Technol. Soc. 2022, 71, 102079. [Google Scholar] [CrossRef]
  100. Federal Aviation Administration Code of Federal Regulations. Available online: https://www.govinfo.gov/content/pkg/CFR-2020-title14-vol1/xml/CFR-2020-title14-vol1-part48.xml (accessed on 12 July 2024).
  101. Federal Aviation Administration Remote Identification of Unmanned Aircraft, Federal Aviation Administration. Available online: https://www.faa.gov/sites/faa.gov/files/2021-08/RemoteID_Final_Rule.pdf (accessed on 12 July 2024).
  102. Watkins, S.; Burry, J.; Mohamed, A.; Marino, M.; Prudden, S.; Fisher, A.; Kloet, N.; Jakobi, T.; Clothier, R. Ten Questions Concerning the Use of Drones in Urban Environments. Build. Environ. 2020, 167, 106458. [Google Scholar] [CrossRef]
Figure 1. Different IRT methods in building energy audits. Adapted with permission from [41].
Buildings 15 02230 g001
Figure 2. Analysis and application of IRT for thermal anomaly identification (qualitative) and U-value measurement (quantitative) of envelopes.
Buildings 15 02230 g002
Figure 3. The matrix of relationships between different building envelope scanning techniques and various building energy model inputs. Adapted with permission from [51].
Buildings 15 02230 g003
Figure 4. Unmanned system types and their critical environmental factors. Adapted with permission from [54].
Buildings 15 02230 g004
Figure 5. Drone applications in the built environment—results from surveyed companies. Adapted with permission from [58].
Buildings 15 02230 g005
Figure 6. Examples of sensors, including high-resolution (visible light), LiDAR, thermal, GPS, and RTK sensors. Adapted with permission from [58].
Buildings 15 02230 g006
Figure 7. Difference in drones equipped with cameras, LiDAR, and IRT sensors. Adapted with permission from [55].
Buildings 15 02230 g007
Figure 8. Overview of the proposed workflow for drone-based building inspection.
Buildings 15 02230 g008
Figure 9. Overall workflow of the case study.
Buildings 15 02230 g009
Figure 10. Two different types of flight path design for the BEST Laboratory.
Buildings 15 02230 g010
Figure 11. UAV camera path recorded during image acquisition for the case study.
Buildings 15 02230 g011
Figure 12. Point clouds and classification results for three different scenarios.
Buildings 15 02230 g012
Figure 13. Point cloud created after parameter tuning.
Buildings 15 02230 g013
Figure 14. C2C absolute difference map of two approaches before (left) and after (right) parameter tuning.
Buildings 15 02230 g014
Figure 15. Distribution fitting for the created cloud, after parameter tuning, with laser scan data, in mm.
Buildings 15 02230 g015
Figure 16. Energy model visualized in Rhinoceros and simulation results.
Buildings 15 02230 g016
Disclaimer/Publisher’s Note: The statements, opinions and data contained in all publications are solely those of the individual author(s) and contributor(s) and not of MDPI and/or the editor(s). MDPI and/or the editor(s) disclaim responsibility for any injury to people or property resulting from any ideas, methods, instructions or products referred to in the content.