Article

Building Envelope Thermal Anomaly Detection Using an Integrated Vision-Based Technique and Semantic Segmentation

by
Shayan Mirzabeigi
1,2,*,
Ryan Razkenari
3 and
Paul Crovella
1
1
Department of Sustainable Resources Management, State University of New York College of Environmental Science and Forestry, Syracuse, NY 13210, USA
2
Department of Mechanical and Aerospace Engineering, Syracuse University, Syracuse, NY 13244, USA
3
Amazon, Arlington, VA 20148, USA
*
Author to whom correspondence should be addressed.
Buildings 2025, 15(15), 2672; https://doi.org/10.3390/buildings15152672
Submission received: 24 June 2025 / Revised: 21 July 2025 / Accepted: 25 July 2025 / Published: 29 July 2025

Abstract

Infrared thermography is a common approach used in building inspection for identifying building envelope thermal anomalies that cause energy loss and occupant thermal discomfort. Detecting these anomalies is essential to improve the thermal performance of energy-inefficient buildings through energy retrofit design and correspondingly reduce operational energy costs and environmental impacts. A thermal bridge is an unwanted conductive heat transfer. On the other hand, an infiltration/exfiltration anomaly is an uncontrollable convective heat transfer, typically happening around windows and doors, but it can also be due to a defect that comprises a building envelope’s integrity. While the existing literature underscores the significance of automatic thermal anomaly identification and offers insights into automated methodologies, there is a notable gap in addressing an automated workflow that leverages building envelope component segmentation for enhanced detection accuracy. Consequently, an automatic thermal anomaly identification workflow from visible and thermal images was developed to test it, utilizing segmented building envelope information compared to a workflow without any semantic segmentation. Therefore, building envelope images (e.g., walls and windows) were segmented based on a U-Net architecture compared to a more conventional semantic segmentation approach. The results were discussed to better understand the importance of the availability of training data and for scaling the workflow. Then, thermal anomaly thresholds for different target domains were detected using probability distributions. Finally, thermal anomaly masks of those domains were computed. This study conducted a comprehensive examination of a campus building in Syracuse, New York, utilizing a drone-based data collection approach. The case study successfully detected diverse thermal anomalies associated with various envelope components. The proposed approach offers the potential for immediate and accurate in situ thermal anomaly detection in building inspections.

1. Introduction

The building sector is responsible for almost 40% of total primary energy consumption and related GHG emissions [1]. This sector is a significant contributor to the total energy demands worldwide. The U.S. DOE plans a 35% energy reduction target for this sector using cost-effective technologies by 2030 [2]. In this context, building energy retrofit plays a significant role in achieving clean energy goals [3], creating a vast construction market [4]. However, building energy audits, the initial step of the retrofitting process, are usually time-consuming, not scalable, and coupled with safety challenges [5]. IRT as one of the NDT methods, can be used in building energy audits at different levels [6]. Qualitative IRT is based on potential thermal anomalies identification, while quantitative IRT is characterized by numerical analysis to quantify thermal anomalies [7]. Thermal bridges are the weakest components of the envelope in terms of heat losses. Up to 30% of building heat loss is for thermal bridging in insulated buildings [8]. Being able to identify building envelope thermal anomalies, including thermal bridges and leak area due to infiltration or exfiltration, would be important to improve the thermal performance of energy inefficient buildings, with energy retrofit design, and correspondingly reduce their operational energy costs. Furthermore, being able to detect thermal anomalies that cause occupant thermal discomfort may also be beneficial for improving thermal comfort [9]. Thermal bridges are classified into repeating, geometrical, and linear. Repeating is defined as a regular pattern and distributed over a big area (e.g., mortar joints in a wall) [10]. Geometrical is characterized by a change of direction in the surface of building envelope (e.g., corner of an external wall) [11]. Linear is defined as discontinuities because of different construction methods or materials (e.g., walls around windows) [12].

1.1. Thermal Anomaly Detection

Several studies have been performed to analyze thermal images to find thermal anomalies in building envelopes. Rakha et al. combined dynamic threshold detection with thermal edge filtering and segmentation [13]. In this approach, the leakage threshold is defined dynamically. The leakage bin is characterized as a bin where the actual heat leakage pixel falls. Lower and upper limits are set to delete some false positives and not dominate temperature distribution, respectively. Then, Canny edge detector is applied for filtering. The actual leakage regions are segmented in the final step to represent the leakage regions [13]. A similar study also implemented a computer vision algorithm through dynamic calibration, thermal edge detections, and leakage segmentation for thermal anomalies in reinforced concrete structures, with the difference that Otsu thresholding method has used for filtering irrelevant thermal edges [14].
An image processing approximation algorithm based on sampling Kantorovich operators has been proposed for detecting thermal bridges [15]. In this procedure, threshold temperature was determined to detect thermal bridges in joints considering that thermal images have defects from bimodal temperature distributions. In addition, the reconstruction of thermographic images, to enhance their resolutions, was applied using this algorithm, and it was optimized to decrease processing times. Principal Components Analysis was implemented to describe the temperature change of each image pixel along the time period. The first criterion included controlling if the histogram was close to a bimodal distribution completed with analysis of the transition phase. The second criterion was the extraction of geometric boundaries [16]. Following this approach, another study applied a thermal anomaly detection algorithm provided in [15], but rather than assuming the bimodal temperature distribution; modified it having a multimodal distribution [17]. They applied it on a wall target domain based on Convolutional Neural Network (CNN) segmentation.
Another study proposes a mathematical algorithm for image resolution enhancement concerning the accuracy of energy losses and validates it by applying a hot box apparatus [18]. Garrido et al. performed a thermal image rectification [16]. The procedure includes detecting thermal bridges by geometric properties and temperature differences with their context. In addition, thermophysical characteristics of linear thermal transmittance can be computed. The accuracy can be compared with existing methodologies using false positives and negatives through Precision, Recall, and F-score. Principal Components were implemented to describe the temperature change of each image pixel along the time period. The histogram of temperature distribution is characterized by an increasing/decreasing temperature evolution between the thermal bridge and the stable zone. The first criterion includes controlling if the histogram is close to bimodal distribution completed with analysis of transition phase. The second criterion is the extraction of geometrical boundaries [19]. These studies used thresholds to classify thermal bridges from thermal images.
Another study addressed a gap in threshold-based thermal bridge detection that was related to difficulties in selecting thresholds and limitations in detecting other thermal defects [20]. Consequently, they proposed a machine-learning framework for this purpose. Their method is based on anomaly area clustering, feature extraction, and artificial neural networks for automatic thermal bridge detection. The limitations of that study were the lack of datasets for thermal bridge modeling and its application only for linear-shaped thermal bridges. The compromising point that highlights the importance of our study is that auditors may use their subjective assessments in inspection procedures, and this significantly affects detecting thermal anomalies [20]. In addition, the differences caused by surface temperatures of various construction elements and the amount that they contribute to heat loss may be different, (e.g., window and opaque wall) and affect the detection procedure. Being able to characterize anomalies based on segmented envelope information would be a significant contribution, and beneficial for retrofit cases that target specific building components [21]. The difficulty of characterizing anomalies for images with sky, different building components, and additional objects highlights the importance of such studies in the sense that not many prior works explored this application based on segmented envelope information. Some of the proposed approaches did not generalize their approach. For instance, a detection approach was proposed, but to tackle the limitation faced, only specific images (very limited scope from one specific part of envelope (e.g., wall)) were used to show its application. In another example, background subtraction was applied for removing additional pixels that affected anomaly detection.

1.2. Semantic Segmentation

Semantic segmentation is one of the most important tasks in computer vision; methods for acquiring, processing, analyzing and understanding digital images; and the extraction of high-dimensional data from the real world to produce numerical or symbolic information, as well as for targets classifying every pixel (in 2D image) or point (in 3D data) into semantic categories. It is different from image classification, and object detection, in that it is not necessary to know what the visual concepts are beforehand. Classification classifies objects that it has specific labels. Classification can be applied to pixels and segmented objects. Segmentation is grouping pixels of similar properties into segments or objects, and classification is labeling those segments or objects. Object detection is about localization, in addition to classifying all instances of known object classes for a particular problem and creating bounding boxes around the objects. A relatively newer task is instance segmentation where pixels belonging to each object are labeled separately. Semantic segmentation—referring to the pixel-level classification of each image region into meaningful categories such as walls and windows—is used in this study to isolate building envelope components prior to thermal anomaly analysis.
Traditional segmentation algorithms cluster based on edges and contours. Table 1 categorized various methods with their advantages in addition to challenges and limitations [22].
In recent years, deep learning-based algorithms or architectures have achieved considerable success with remarkable improvement in terms of performance accuracy and computation time. Deep learning refers to a class of machine learning techniques using multi-layered neural networks that learn hierarchical patterns from large datasets. In this study, it is applied to automate the segmentation of building envelope components and enhance defect localization.
Guo et al. have divided the state-of-the-art semantic segmentation algorithms into region-based semantic segmentation, Fully Convolutional Network (FCN)-based semantic segmentation, and weakly supervised segmentation [23]. Region-based methods extract free from regions and then, apply a region-based classification. For testing it, a pixel is labelled according to the highest scoring region that contain it. Region Based Convolutional Neural Networks (RCNN) is a representative example that extracts two types of features including full region and foreground region, but the feature might not be compatible with the segmentation task [24]. It may not contain sufficient special information for a good boundary generation and creating segmentation proposal by this algorithm is computationally expensive and can potentially affect the final performance. The key idea in the second category is learning a mapping from pixel to pixels, without extracting region proposal [25]. The network comprises of convolutional, pooling, and up sampling layers for predictions on arbitrary-sized inputs.
One of the issues with this algorithm is low resolution or its direct prediction because by propagating through several alternated convolutional and pooling layers, the resolution of the output feature maps is down-sampled. An instance of performance improvement has been addressed in [26], by a multi-scale convolutional network consisting of multiple scale sub-networks with different resolution outputs to progressively refine the coarse prediction. The third category of algorithms have been developed to fulfill the semantic segmentation by using annotated bounding boxes [27], or even image-level labels [28]. For instance, one challenge of employing the image-level supervision is the ignorance of the object localization. In general, benefits of deep learning algorithms are improving computational efficiency and accuracy, giving insights about how the visual systems work. Additionally, it can be more general than object detection and recognition. Challenges are including but not limited to the need for large amount of labelled data for training, very high computational power (e.g., heavy usage of near supercomputers for the training phase), and understanding of the ramifications of incorrect segmentations.
Pixel-wise building envelope segmentation also presents several challenges, primarily due to the intricate shapes and varied exteriors of building envelope elements such as windows and doors. These complexities make it difficult to develop a universal solution for segmenting different envelopes. Early efforts in façade segmentation often involved the use of multiple images for window localization and 3D reconstruction [29]. However, another research study highlighted a shift in focus towards single-image façade segmentation over multiple-image-based approaches [30]. As mentioned, the FCN is one of the state-of-the-art semantic segmentation algorithms and many image semantic segmentation models are based on this architecture. This model replaces the fully connected layers, initially used for image-level classification, with convolution and pooling layers to achieve pixel-wise classification. It also concatenates fine low-level features with coarse high-level features, combining information at different levels. This approach has been widely adopted and tested on natural images [31]. Building on the FCN structure, U-Net was developed specifically for medical image segmentation [32]. The model employs a U-shaped architecture with skip connections and utilizes data augmentation techniques. A recent study demonstrated the effectiveness of this architecture for exploiting multiscale information and employing data augmentation, particularly under conditions of limited dataset size [33]. Semantic information based on 2D images has made a lot of progress recently, but because of its limitation in occlusion, computational complexity and other data aspects, its performance for 3D data is not satisfactory. In general, working with 2D images and 3D point clouds are very different. Images are collected as data sets using a camera device, however, point cloud are collected using laser scans, photogrammetry, Simultaneous Localization and Mapping (SLAM), structured lighting, or videogrammetry techniques [34]. The 3D problem is a much harder problem than 2D processing. It is difficult to perform convolution operations on irregular and disordered 3D point clouds directly [35] because of the nature of the data itself.
Recent studies have significantly advanced the field of UAV-based building diagnostics. Mirzabeigi et al. presented a comprehensive review of UAV-assisted thermal inspection techniques, emphasizing the challenges of image interpretation, flight conditions, and the lack of automated anomaly detection workflows [36]. Their work outlined the need for semantic segmentation and automated post-processing tools to enhance thermal defect localization—gaps directly addressed by the present study. Lin et al. developed a true 3D thermal inspection method by combining RGB and infrared UAV imagery with multimodal registration and weighted thermal texture mapping, enabling enhanced defect localization on complex façade geometries [37]. A recent study integrated UAV-based thermography and photogrammetry to detect building envelope defects in historical façades, highlighting the advantage of hybrid imaging approaches in preserving architectural integrity [38]. Another investigation proposed a deep learning-based thermal anomaly detection framework using semantic segmentation, confirming the effectiveness of U-Net architectures for pixel-level classification of thermal defects from UAV imagery [39]. However, most of these approaches either lack component-level segmentation or are not tested under realistic UAV-collected datasets. These recent contributions provide strong context for our proposed approach, which integrates semantic segmentation and drone-based data acquisition in a fully automated pipeline, addressing these critical limitations.
To provide a clearer overview of the state-of-the-art in building envelope thermal anomaly detection, Table 2 summarizes representative studies, their methodologies, types of imaging used, application contexts, and key findings relevant to this research.

2. Research Objectives

All that being said, being able to automatically detect anomaly thresholds would be important and advantageous for this procedure. Consequently, an automatic thermal bridge identification approach based on the target building components, to improve the state-of-the-art building envelope thermal anomaly detection, should gain importance to solve the problem associated with reliance on energy auditors and for improving the thermal anomaly detection performance. Therefore, the main objective of this study is to develop and validate an automated, drone-based workflow for thermal anomaly detection in building envelopes, integrating deep learning–based semantic segmentation. To support this overarching goal, the study pursues the following secondary objectives:
  • To collect visible and thermal imagery of a case study building using UAVs and to implement a deep learning–based segmentation approach that distinguishes between envelope components prior to anomaly detection.
  • To compare the detection accuracy of workflows with and without semantic segmentation using standard evaluation metrics.
  • To assess the potential of this workflow for scalable, component-level diagnostics in building envelope evaluations (e.g., pre- and post-retrofit evaluation).
These objectives are framed to overcome key limitations in existing approaches—namely, the lack of component-level thermal defect identification and the limited automation in drone-based inspections. Based on the challenges identified in prior research and the goals of this study, the key contributions of this work are as follows:
  • An automated vision-based workflow was developed for building envelope thermal anomaly detection using visible and thermal imagery.
  • A deep learning–based semantic segmentation method (U-Net) was integrated into the workflow to isolate building envelope components (e.g., walls and windows).
  • The impact of segmentation on detection accuracy was quantitatively assessed using precision, recall, F1 score, and Intersection over Union (IoU), with a significant improvement observed when component-level segmentation was applied.
  • A drone-based case study was conducted to validate the framework.
  • The study demonstrated that segmented anomaly detection achieved a higher accuracy than the baseline workflow.
  • The work offers insight into challenges related to training data, and thermal imaging conditions, and outlines considerations for future large-scale applications.

3. Materials and Methods

This study adopts an integrated methodology combining UAV-based data acquisition, image preprocessing, semantic segmentation, and anomaly detection. This four-stage process was designed to enable efficient and accurate detection of building envelope thermal anomalies. UAVs were used to capture RGB and thermal data, followed by training a segmentation model for component detection. Segmented images were then analyzed for thermal anomalies using image statistics. The methodology ensures reproducibility and adaptability across different building types.
This section is divided into four sub-sections, including (1) the application of drone thermography, which is accompanied by design of flight path and collecting data; (2) the application of computer vision and various image processing algorithms to analyze thermal images to detect thermal anomalies with and without segmented building envelope components; (3) the dataset; and (4) performance metrics for error quantification.

3.1. Flight Path Design and Data Collection

Compliance with airspace regulations presents a notable challenge in the extensive application of drones for building inspection purposes. To tackle this issue, the FAA has introduced Rule Part 107 and the Low Altitude Authorization and Notification Capability (LAANC) as mechanisms to facilitate and expedite the adherence to these regulations.
LAANC allows drone pilots to receive near real-time authorization for operations under 400 feet in controlled airspace around airports [40]. Therefore, the required authorizations were received for the operation time. Prior to designing the flight path, a quick site visit was required for the purpose of determining the flight path with minimum obstacles. Building inspections were conducted with a DJI Mavic 2 Enterprise Dual drone (DJI Technology Co., Ltd., Shenzhen, China) that was equipped with visual and thermal cameras. Since shading and sunlight can have potential impacts on thermal images, visible images were used for further reference during the analysis. The vertical flight path was selected and designed for inspecting the south facade of the Baker Laboratory (four-story building) on the SUNY ESF campus located in Syracuse, New York, USA. The study was conducted in Syracuse, New York, which has a cold humid continental climate (Dfb) characterized by significant seasonal variation. Thermal images were collected during a spring evening under partly cloudy skies, with stable weather conditions and no precipitation. At the time of data collection, the outdoor-to-indoor temperature difference of around 11 °C was recorded, which was suitable for thermal anomaly detection. Additionally, to minimize the influence of reflected temperatures from façade surfaces, thermal data collection was scheduled during the time of the day with stable and overcast conditions, avoiding periods of direct solar exposure. Surfaces were allowed to equilibrate for at least 8 h without sunlight prior to image acquisition. This precaution reduces radiative reflections and enhances the accuracy of surface temperature readings. Additionally, materials with known reflectivity issues were considered during segmentation and labeling to avoid misclassification of thermal anomalies. Figure 1 shows the rectangular path with dimensions. The Pix4Dcapture (version 4.12) and DJI Pilot app (version 1.1.3) were used for controlling the drone and taking images during the flight. However, they do not provide vertical flight planning capability. The free flight capability of the Pix4Dcapture, that was designed for advanced users, helped us to manually follow the flight path that we designed for this purpose. A distance of 6.5 m away from the finishing of the building envelope with one meter step for capturing images were considered in the flight path design step, resulting in a 90% image overlap that was implemented for gathering data. Therefore, the threshold range of 70–80% overlap which has been suggested for rectangular flight paths, considering auditing and visualizing building energy use, provided in [41], was respected.

3.2. Thermal Anomaly Detection Approach

This section is divided into two sub-sections, including (1) a vision-based workflow for thermal anomaly detection based on whole images and (2) thermal anomaly detection based on segmented information of building envelope components. Segmentation of building components refers to the process of classifying each pixel in the image into categories such as wall, window, or roof. This separation allows for domain-specific analysis of thermal anomalies. This study builds upon our previously research, where a preliminary version of the UAV-based thermal inspection workflow was introduced and demonstrated through a pilot study [42]. In this manuscript, we extend the methodology and analysis by incorporating a deep learning segmentation pipeline, larger dataset, and comprehensive performance evaluation metrics.

3.2.1. A Vision-Based Workflow for Thermal Anomaly Detection Based on Whole Image

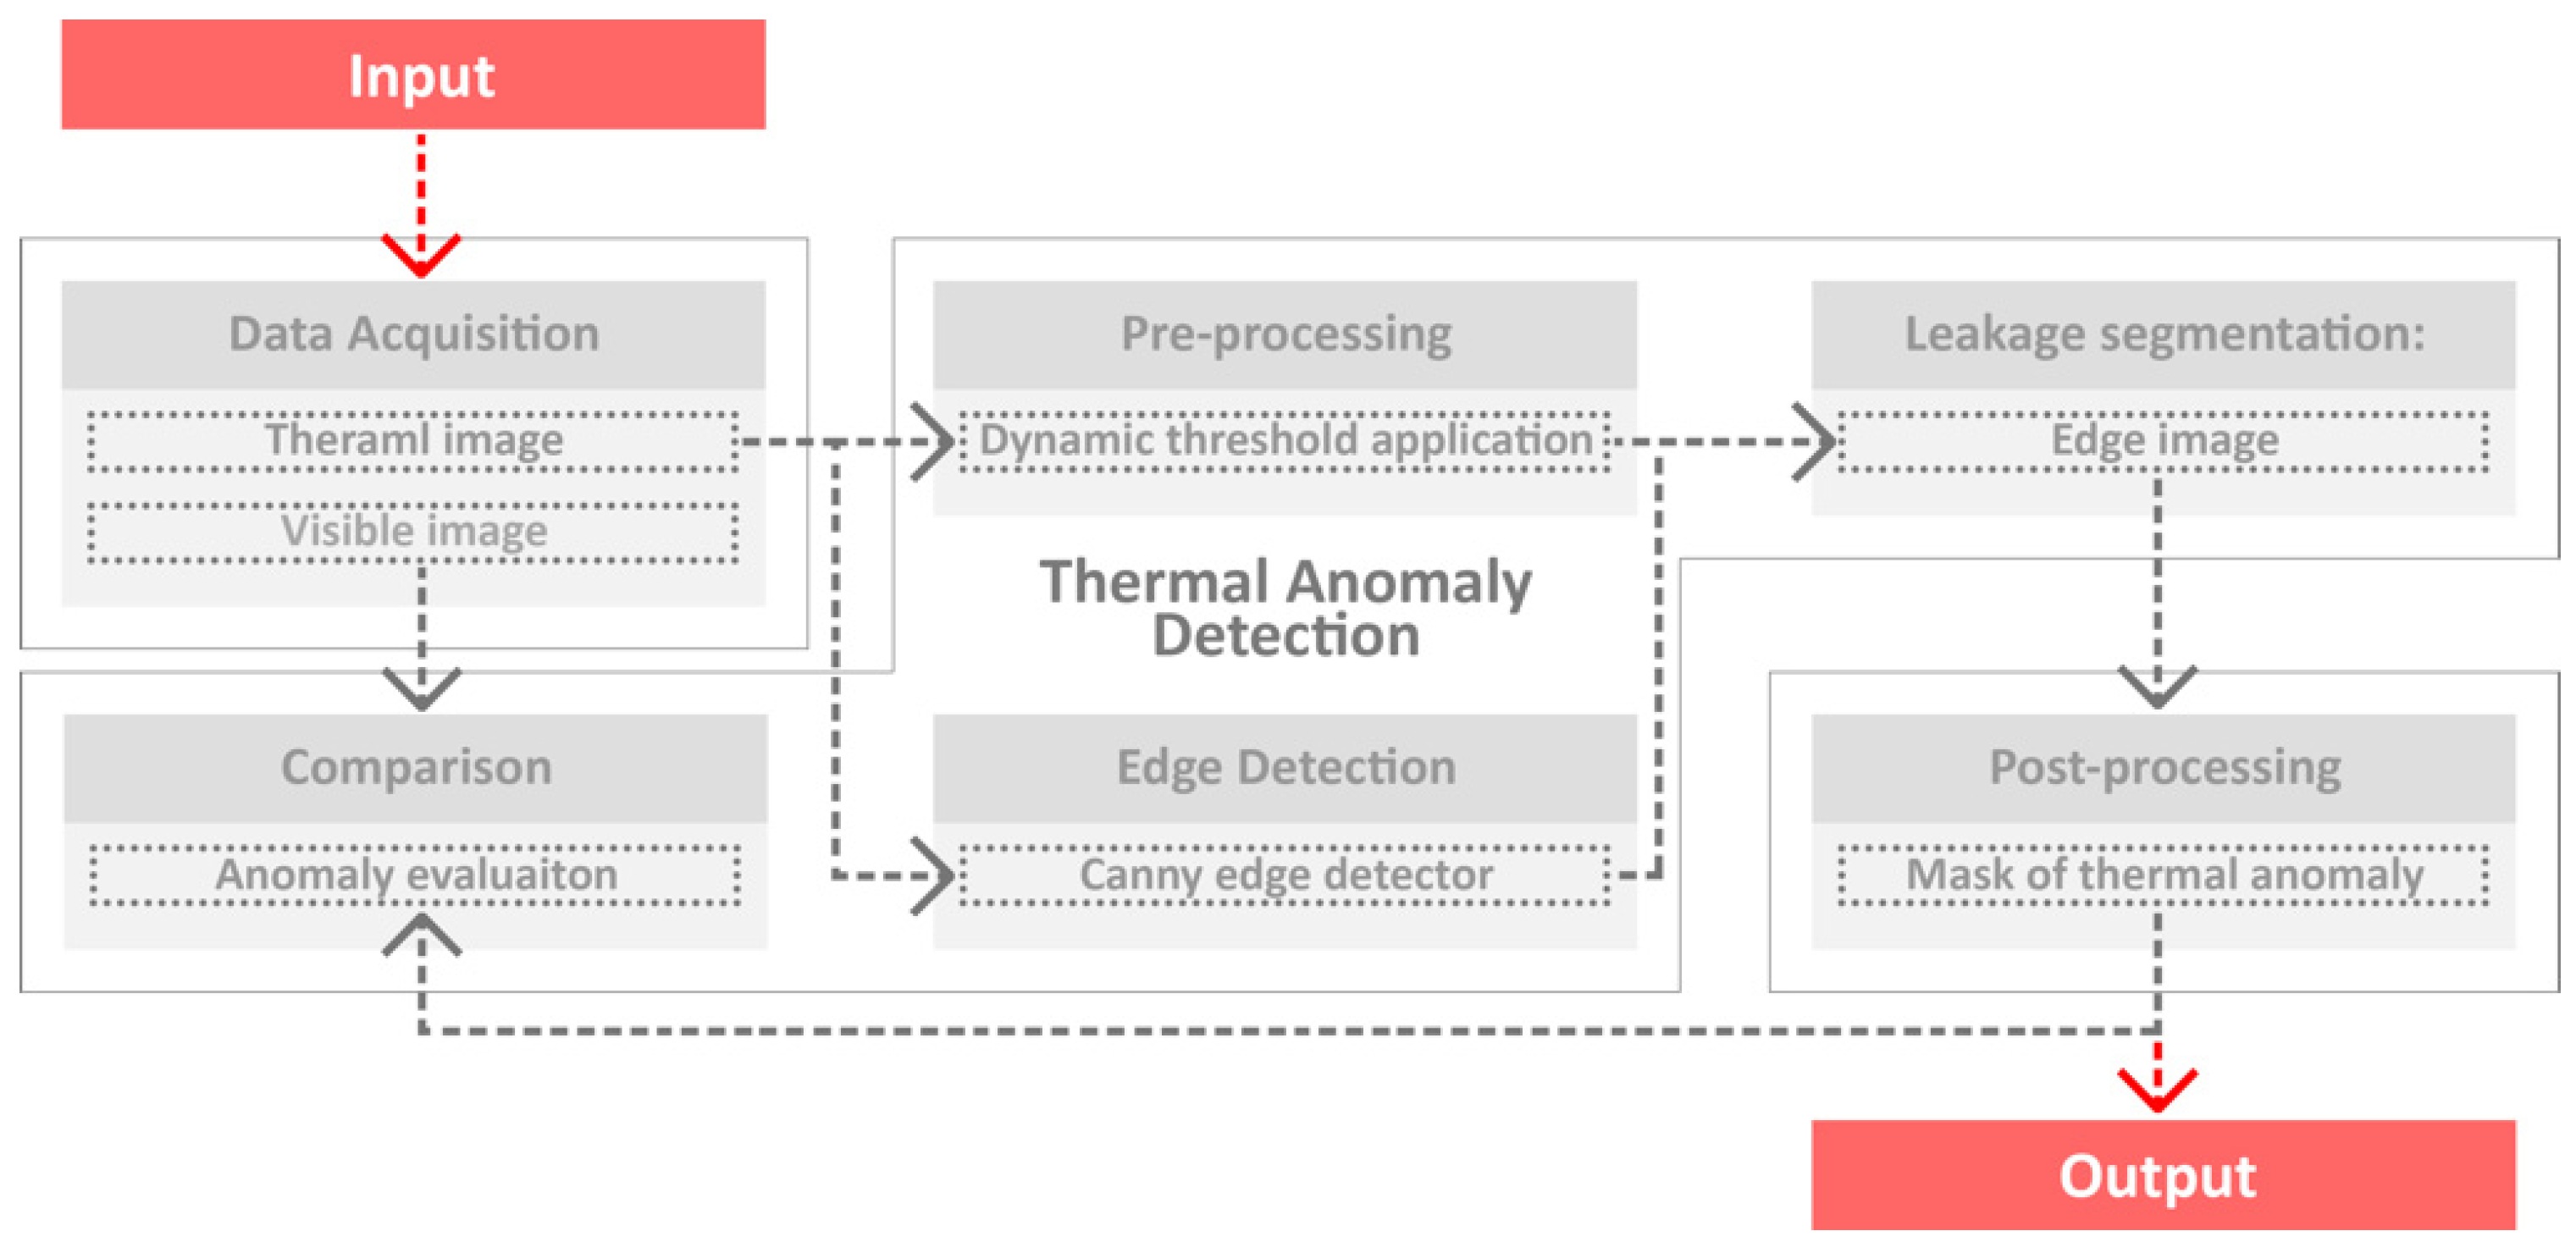
The primary purpose of the algorithm is to detect thermal anomalies of thermal images, considering the input, which is temperature data. The OpenCV library [43], NumPy [44] and scikit-learn [45] packages of Python (version 3.8.10) development environment were used for image processing of the thermal images. Figure 2 shows the overview to the steps of this implementation.
Thermal anomalies are characterized by sharp temperature changes that happen in a thermal image [14]. A preprocessing step is first applied to calibrate the thermal image in the form of two-dimensional matrix of temperatures and eliminate false positives using a dynamic threshold application. Then, thermal edges are found by the application of a Canny edge detector and irrelevant information are filtered off using adaptive thresholding. Next, the actual leakage areas enclosed by thermal edges are segmented [13]. Eventually, to fill the segmented areas with gaps inside, a post-processing (morphological closing) step is applied, and the result is compared to visible image for evaluating anomaly. The final output is the mask of thermal anomaly area for the whole image domain.

3.2.2. Thermal Anomaly Detection Based on Segmented Building Envelope Images

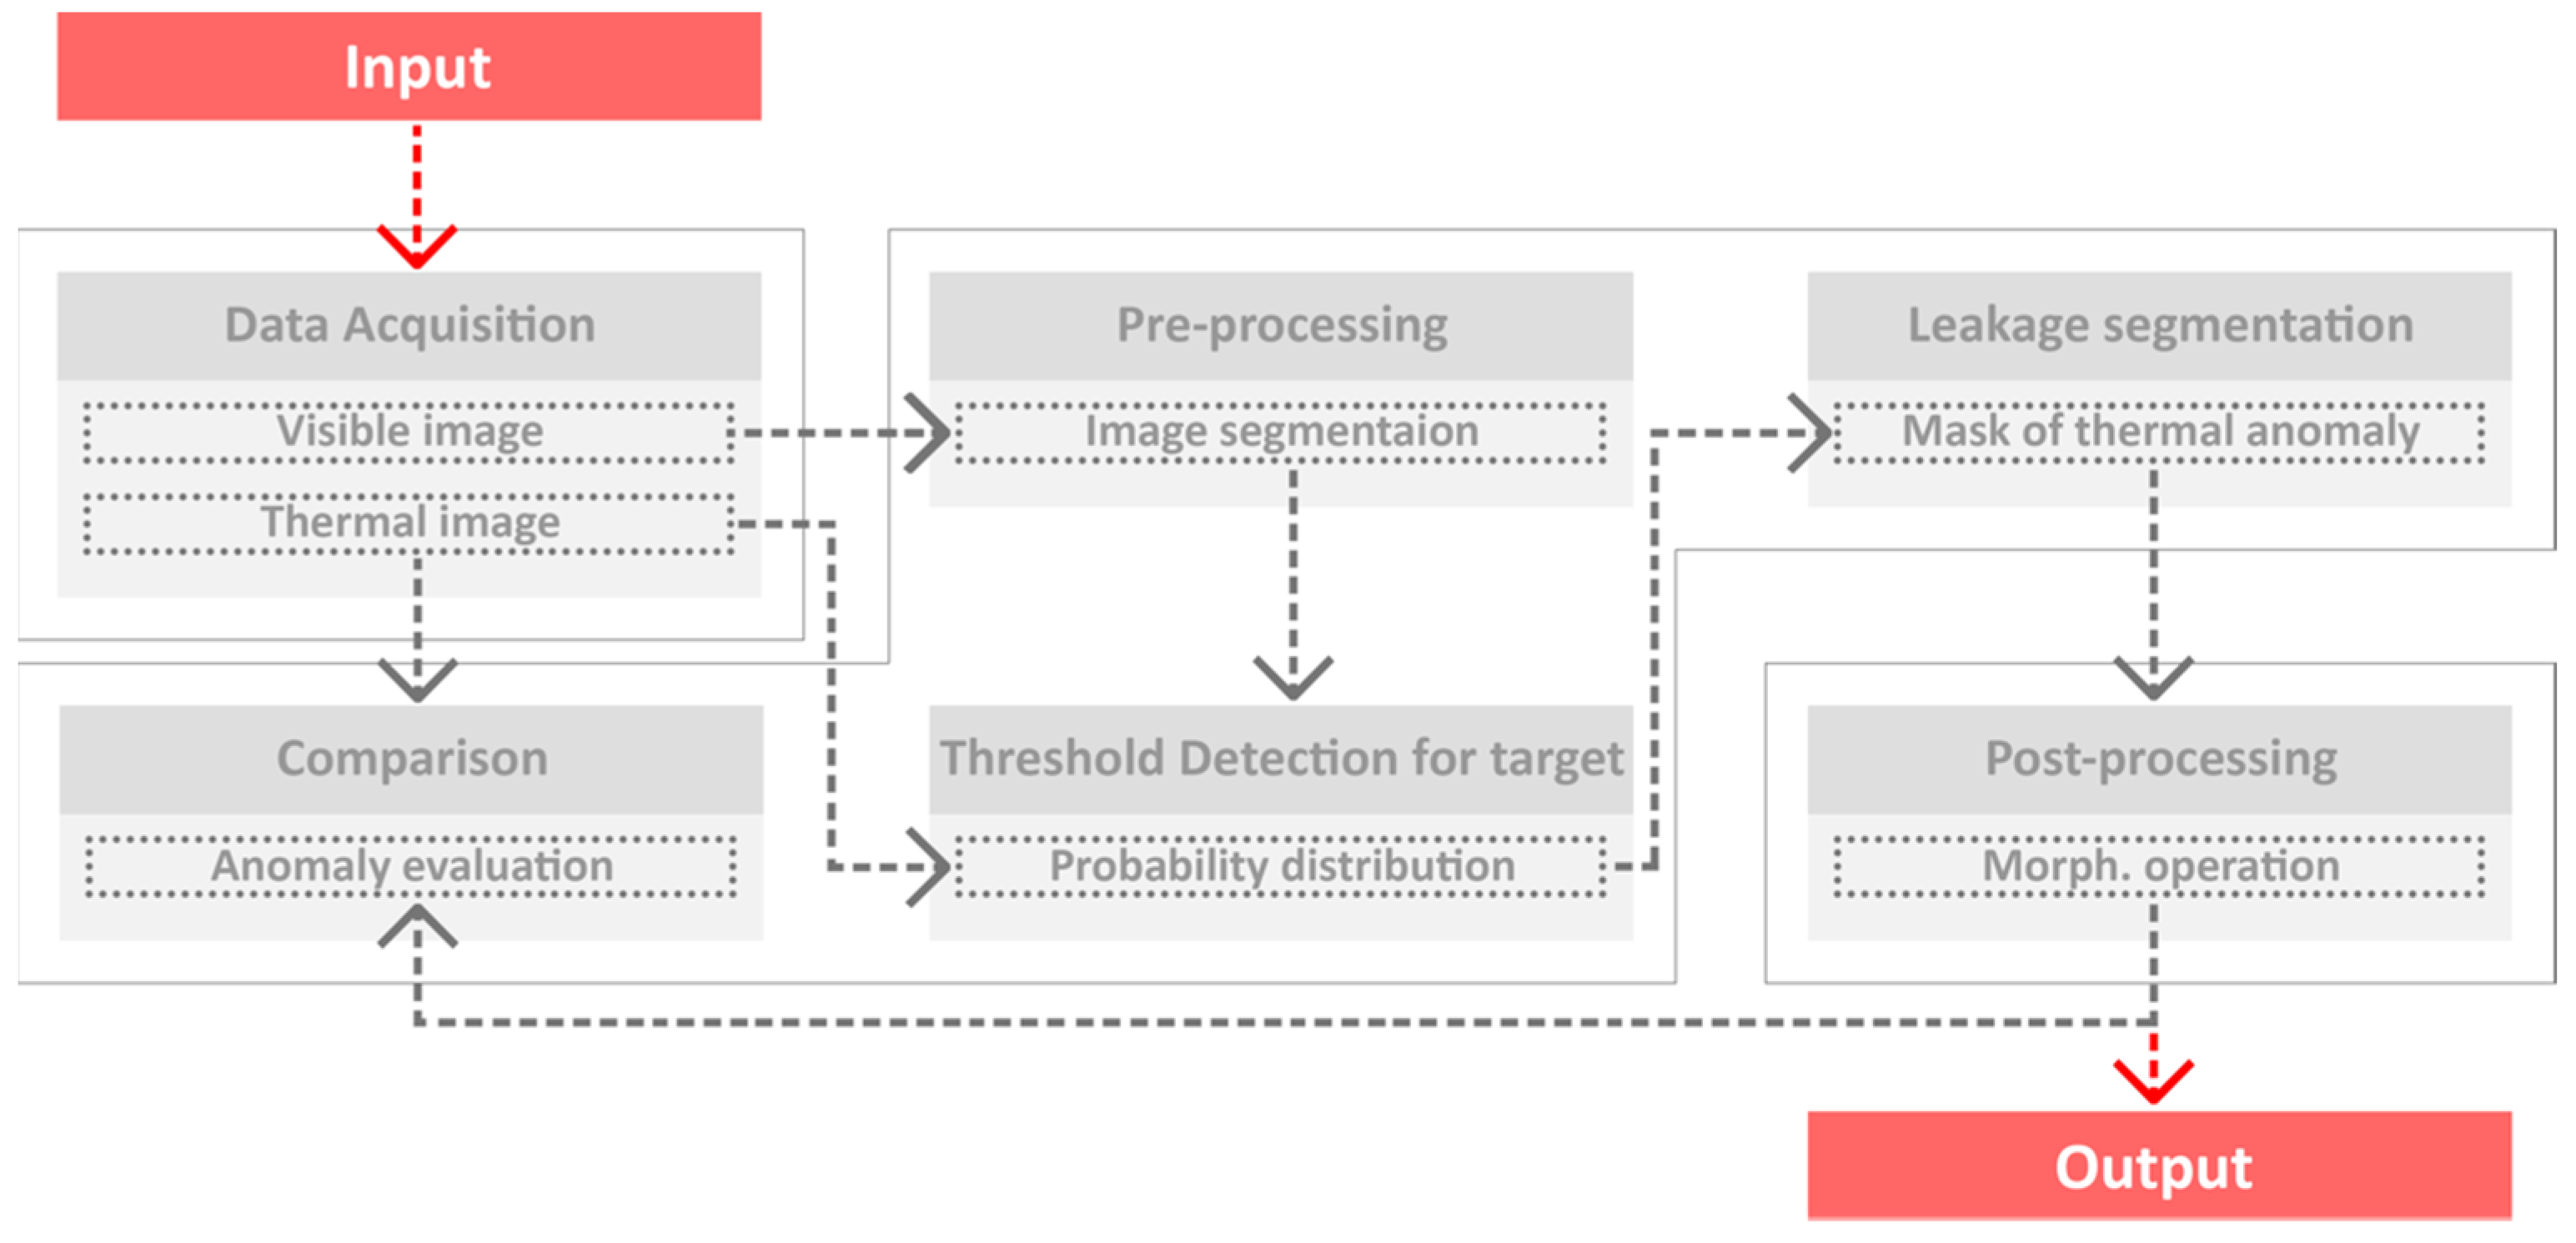
In a preprocessing step, visible images are semantically segmented. A separate sub-section discusses the semantic segmentation approach. Thermal anomalies are characterized by sharp temperature changes in thermal images [14]. Figure 3 shows the overview of the steps in the detection workflow.
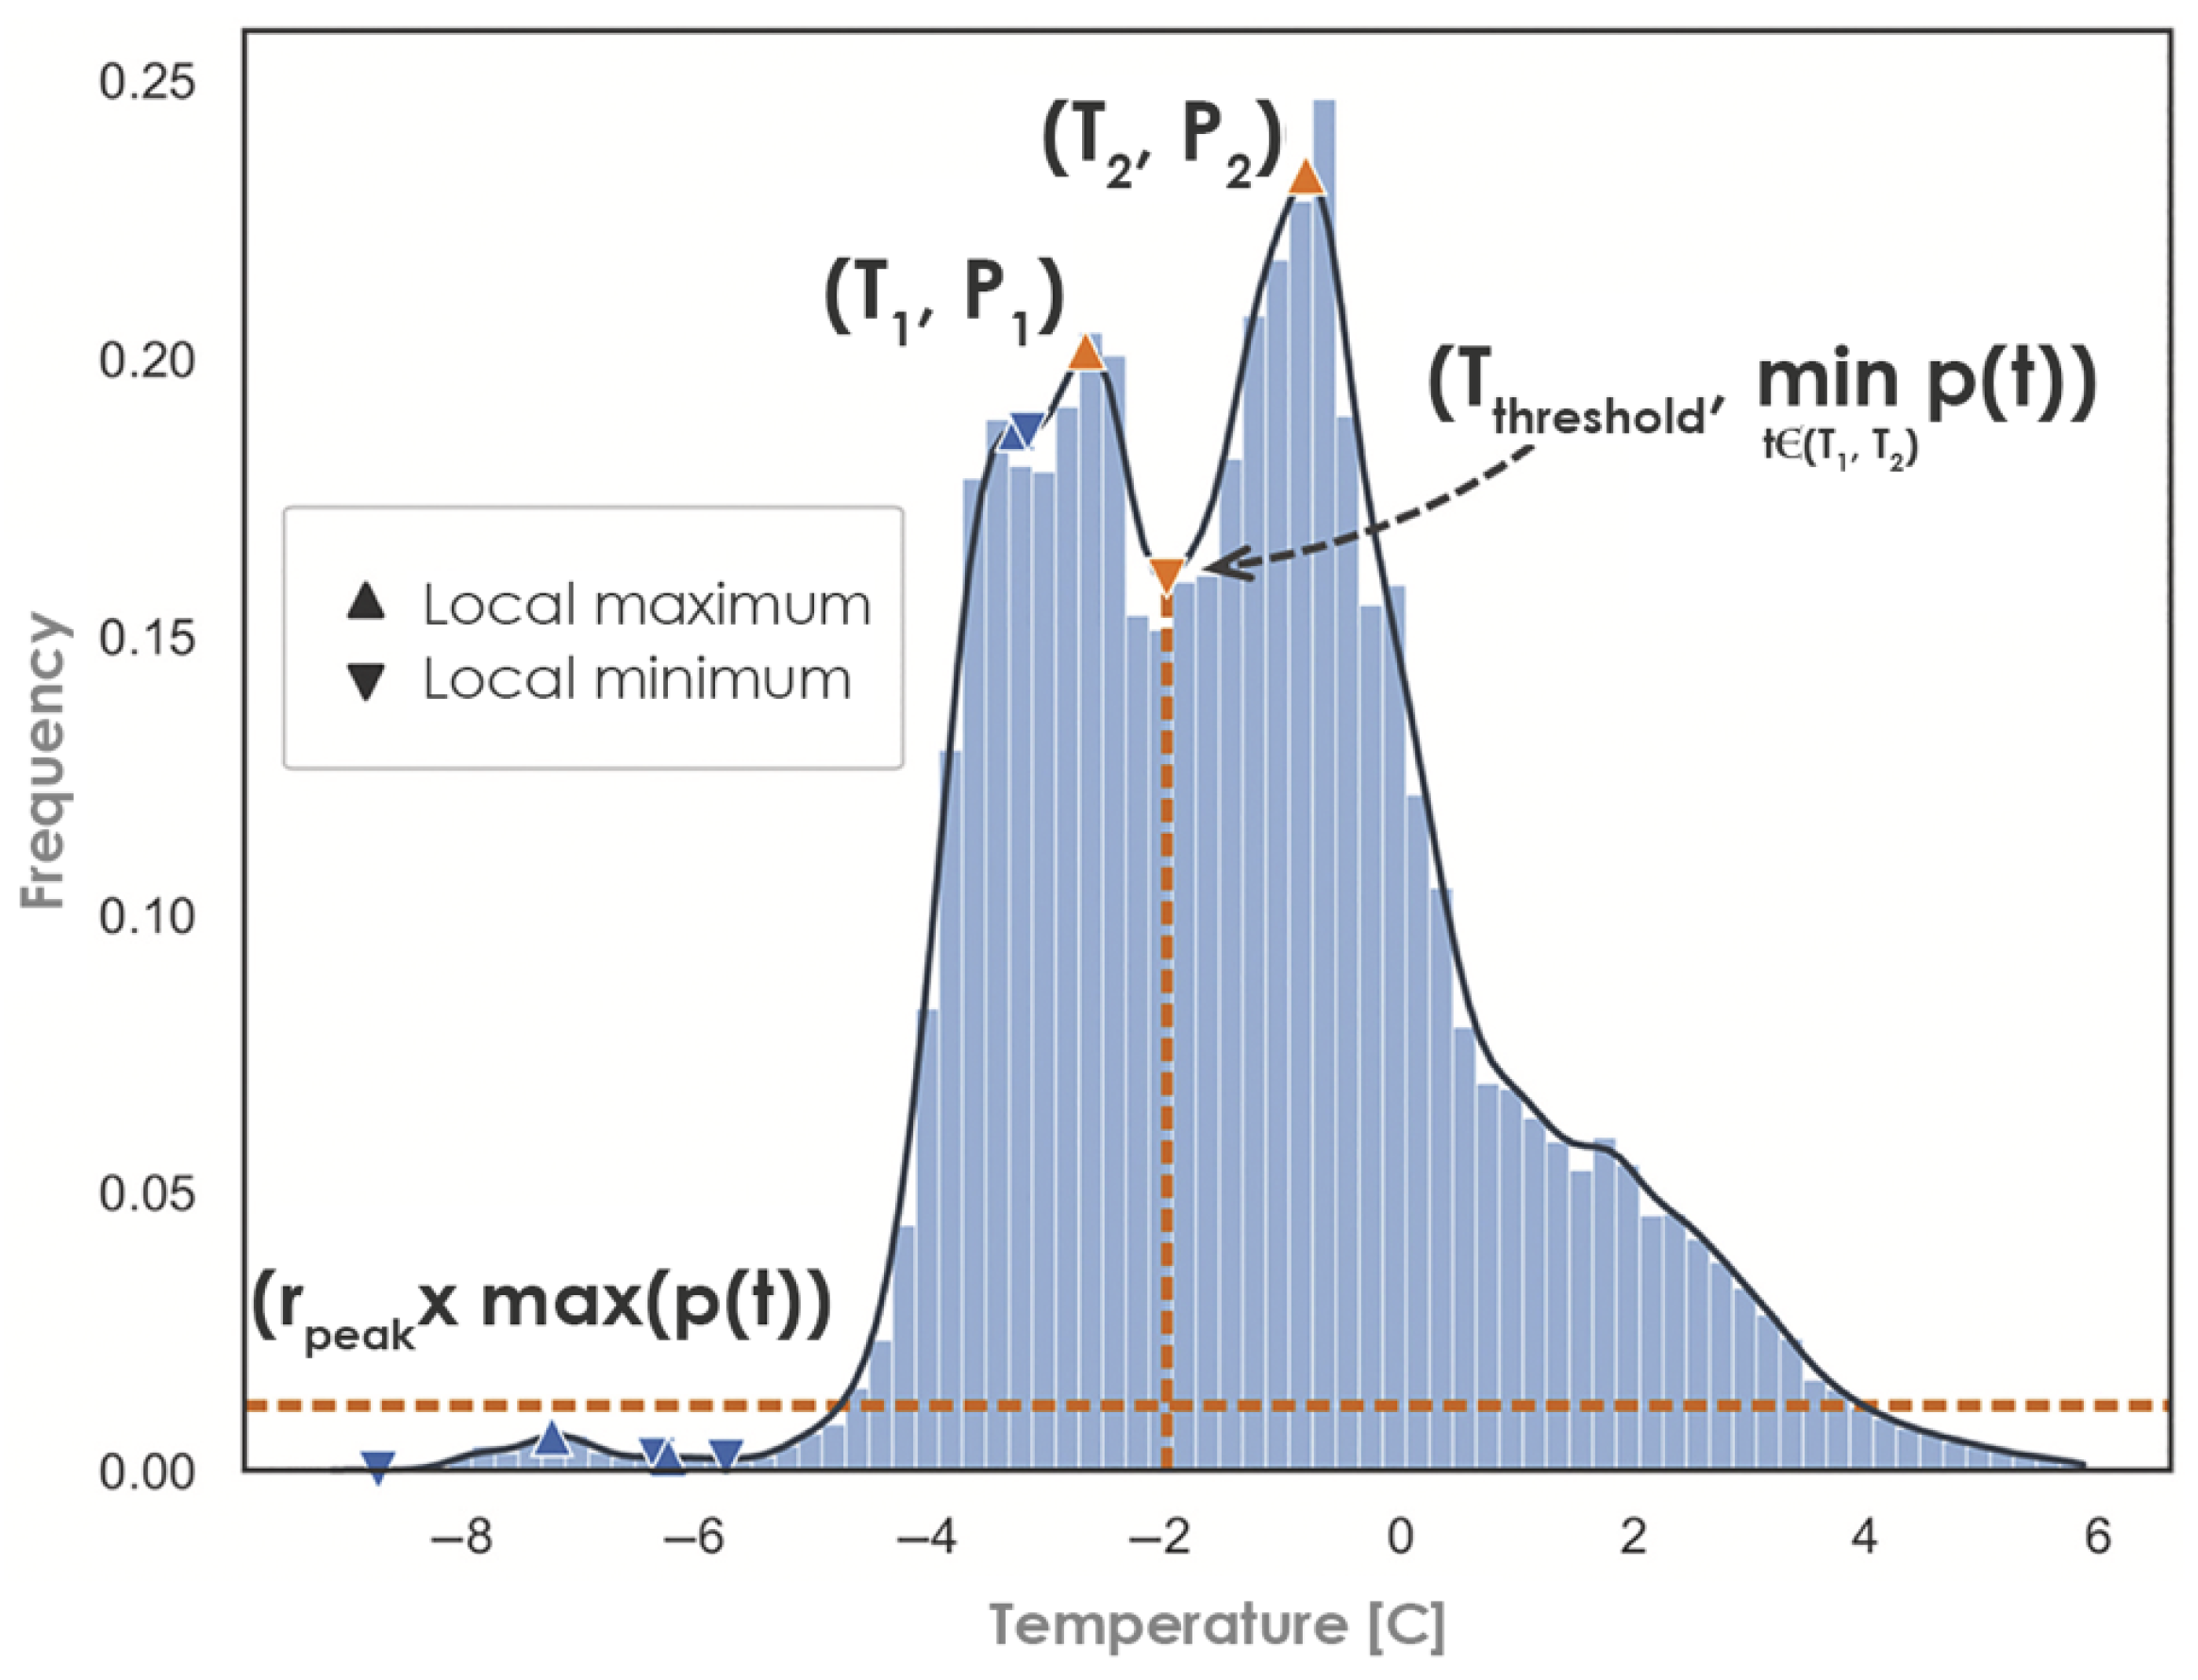
Following the automatic anomaly threshold detection approach provided in [15], and improved by a more recent research study [20], the probability distribution of the target class is estimated. To prevent misclassification due to anomalies in excessively small areas, a certain percentage are excluded. The two largest local maxima are searched. The value with the smallest probability between the two is assigned as the threshold (Figure 4). It should be noted that the distribution with one global maximum is assumed to follow a unimodal distribution. After detecting the threshold for the target, the actual leakage areas are segmented by comparing the pixel’s value with the detection threshold. Then, as a post-processing phase, morphological operations are applied to smooth the mask, and finally it can be compared with the actual visible and thermal image. Under comparison, the anomaly is evaluated by the building science expert. This step is considered for the justification of algorithm’s output. This process is iterative and may be repeated for various classes of target envelope components that are considered in detection phase. The brown dashed line in Figure 4 indicates the selected threshold value between the two local maxima. The blue region represents the normal pixel distribution, and the brown region highlights the anomaly pixel range that exceeds the threshold.
Unlike traditional thresholding-based thermal anomaly detection workflows that operate on entire images and often misclassify non-relevant background elements (e.g., sky, adjacent structures), our approach applies class-specific thresholding to semantically segmented envelope components. For instance, by isolating walls and windows prior to anomaly detection, the method leverages domain-specific thermal behavior to improve detection accuracy. This component-wise detection mechanism, enabled by deep learning segmentation, is a key advancement over previous methods that rely solely on global image statistics or manual threshold tuning.

3.2.3. Semantic Segmentation

Based on the review results and the potential of implementing deep learning, we employed a color-based thresholding methodology, as well as K-Means clustering for segmentation, and compared them with the U-Net model architecture for semantic segmentation.
For the color-based thresholding methodology, the process begins by reading the input images and converting them from RGB color space to the Hue, Saturation, Value (HSV) color space using OpenCV (version 4.5.2). Specific color ranges were defined for segmentation tasks (for windows and walls separately). Binary masks were generated based on these color ranges, with pixels falling within the specified ranges set to 255 (white) and others to 0 (black). The ground truth images were similarly processed to create corresponding masks for evaluation purposes. This approach, leveraging the HSV color space and thresholding, provides an effective and computationally efficient method for segmentation tasks with predefined color ranges.
For the clustering-based segmentation method using K-Means clustering, the image is first read using OpenCV. The image is then reshaped into a list of pixels to prepare it for clustering. K-Means clustering is applied to segment the image into a predefined number of clusters, with the number of clusters set to three in this case. The number of initializations (10), the maximum number of iterations (300), and a random state (42) are set as parameters. The K-Means algorithm clusters the pixels based on their color similarity, and the resulting cluster centers and labels for each pixel are used to create the segmented image. The clustered pixels are then reshaped back to the original image shape to form the segmented output. The segmented labels obtained from the K-Means clustering are binarized to create a mask for the cluster assumed to represent the target region (e.g., walls), and to evaluate the performance of the algorithm.
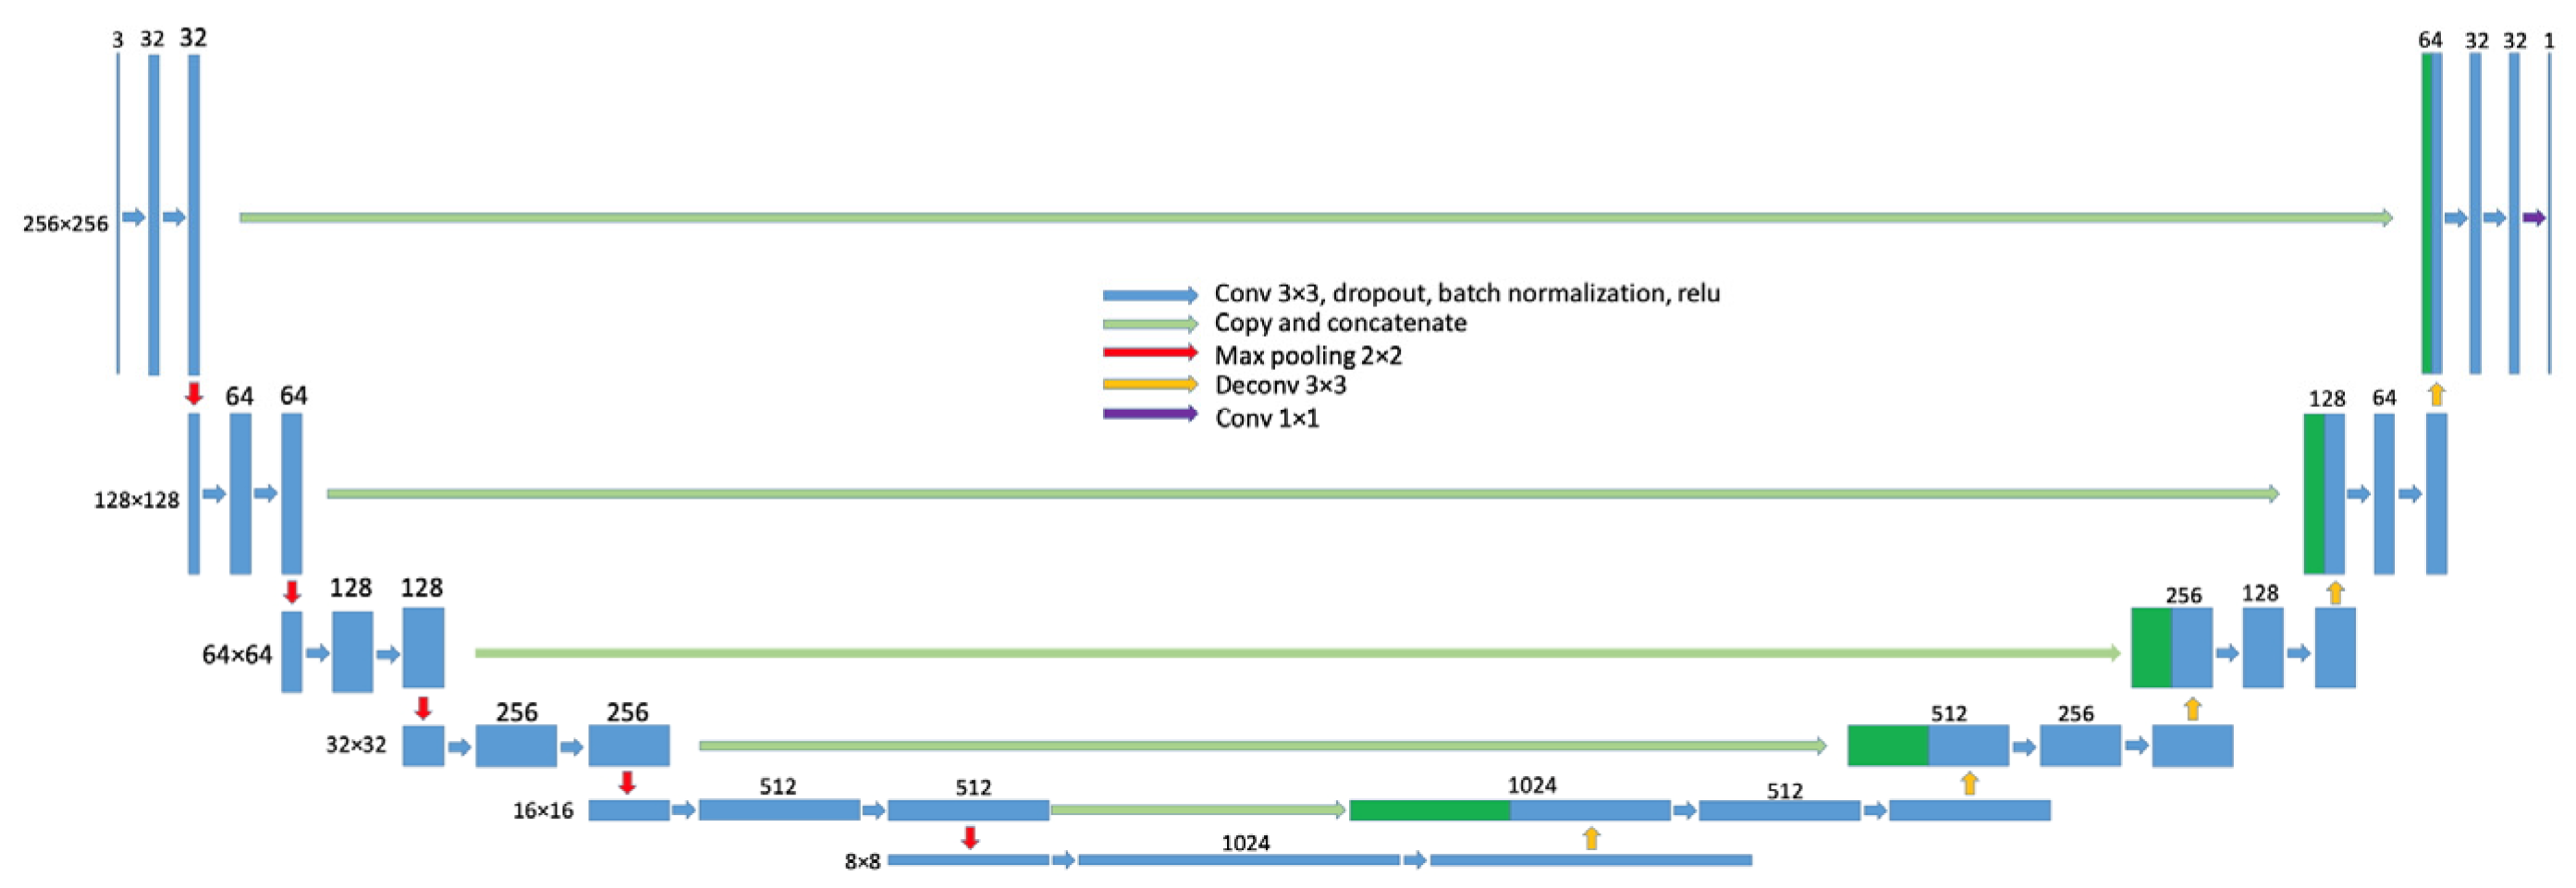
Figure 5 shows an example of a U-Net model architecture for semantic segmentation that can be trained to identify walls, roofs, chimneys, windows, and doors from building images [33]. A similar approach has been implemented for building facade image segmentation. The model was developed using deep learning-based semantic segmentation technology and an ensemble learning strategy [46].
The U-Net model was used for segmentation, comprising a contracting path, an expansive path, and skip structures [33], and for creating the model to identify various building components [47]. The contracting path consists of six convolutional blocks, each featuring two 3 × 3 size filter convolution layers with a 1 × 1 stride, a dropout layer, batch normalization, and rectifier activation. Zero padding is employed in the convolution process to maintain the feature map dimension. These blocks progressively increase the number of feature maps from a small number to a large one. Max pooling with a 2 × 2 stride is applied to each block, except the last one, reducing the feature map resolution. The expansive path then restores the feature map dimensions, concatenating feature maps from the contracting path in each block, followed by two convolution layers to decrease feature map numbers. The final step involves a 1 × 1 stride convolution layer with sigmoid activation to reduce the number of feature maps to 1. The loss function is binary entropy. The U-Net architecture eliminates the need for manual feature design and expert input, thus reducing setup complexity and improving adaptability across varied datasets. Training of deep neural networks is conducted using a stochastic gradient-based optimizer to minimize the cost function with respect to its parameters. The Adam optimizer is selected, offering advantages over traditional stochastic gradient descent by dynamically updating the learning rate based on the first and second moments of gradients.
All code used for segmentation and anomaly detection was implemented using Python, leveraging the open-source libraries described earlier. Architectural and training details for the U-Net model, including optimizer selection, loss function, and layer configuration, are described. This ensures that the proposed workflow is reproducible and adaptable to other datasets and building envelope typologies.

3.3. Dataset

For the development of the dataset for semantic segmentation of building elements, the annotation task was carried out using the software LabelMe (version 5.1.1), which is an open-source graphical image annotation tool. The images contained various elements that needed to be annotated. The different elements were annotated with specific colors for ease of identification.
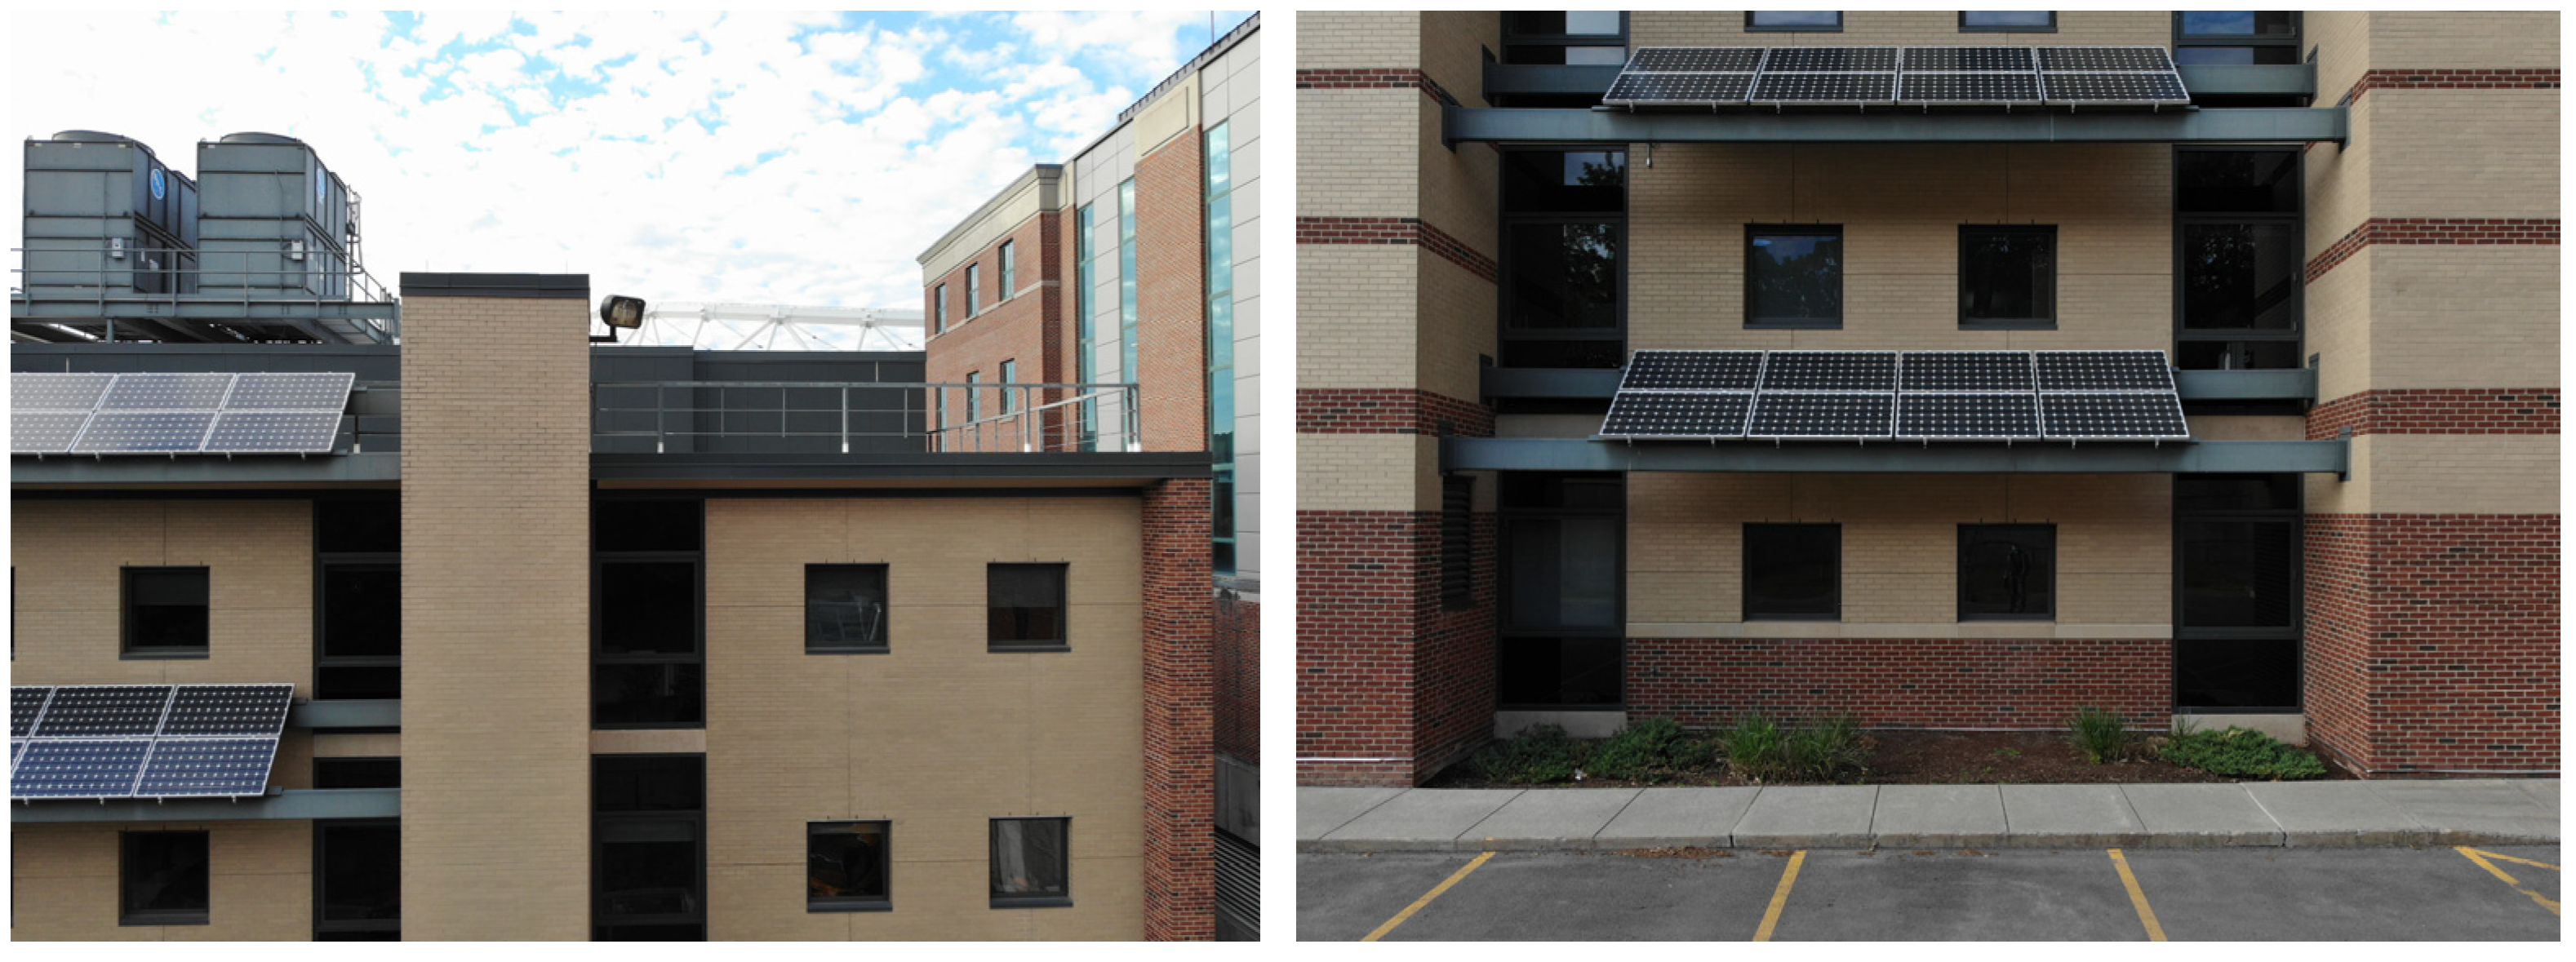
The “wall” class encompasses the entire wall area, including both negligible and unavoidable objects. These objects are defined as relatively small items attached to the walls. Only building external walls were included in this class; walls like fences and boundary walls were excluded. High-density occlusions, such as vehicles and waste bins, are avoided during labeling. The “roof” class includes all components of a roof (e.g., rafters). In some of prior works, non-building objects like sky and vegetation were labelled. However, in this work, since evaluating the thermal performance of buildings is the target, objects which are not related to buildings were not labelled. Initial software output was JSON files were then converted into a PNG image format. This conversion was performed to enable a more visually intuitive representation of the annotations, which is particularly helpful for understanding the semantic information within the image. Figure 6 and Figure 7 show the steps of the annotation task and image annotation examples.
In particular, for the deep learning model, a total of 596 images were used for the training dataset, and 105 images were utilized for the testing and validation dataset. Additionally, data augmentation method using the random flips and rotations was applied. These augmentations were applied to the training dataset to enhance the diversity of the training samples and improve the robustness of the model.

3.4. Performance Metrics

The segmentation results are evaluated to quantify the specific processing performance of algorithms. The model is assessed through various metrics: accuracy, precision, recall, F1 score, and IoU. The main metrics include True Positive Rate (TPR), Recall, True Negative Rate (TNR), F1, and IoU. The thermal anomaly detection methods were tested on 105 thermal images. Building experts were asked to identify if there are thermal anomalies in the dataset (instances of anomalies and thermal bridges not the exact mask of thermal anomaly), and the performance of two algorithms with and without segmentation was assessed based on precision, and on recall.
Additionally, the effectiveness and reproducibility of the proposed workflow depend on key operating and environmental parameters established during the data collection and processing phases. The flight path maintained a distance of 6.5 m from the façade, with 1-m vertical steps, resulting in 90% image overlap for comprehensive coverage. Environmental conditions were carefully monitored to ensure data quality. Thermal inspections were scheduled when the outdoor-to-indoor temperature difference exceeded 10 °C, wind speeds were below 5 m/s, and surfaces were not exposed to direct solar radiation for at least 8 h prior to the survey. Cloudy or overcast conditions were preferred to minimize sky reflections in thermal images. Additional considerations included documenting indoor temperature settings, window coverings, and potential Wi-Fi interference, as these may influence thermal readings and drone operation. For the deep learning workflow, 596 labeled images were used to train the U-Net segmentation model, with 105 images reserved for testing and validation (approximately 20%). The model segmented wall and window components using a six-block U-Net architecture, trained with binary cross-entropy loss and the Adam optimizer. To account for the influence of different façade materials on thermal image interpretation, the segmentation model was trained using a representative dataset that included a variety of material types. General assumptions regarding typical emissivity ranges were applied during preprocessing to reduce variability in thermal readings, ensuring consistency in the anomaly detection process. These parameters collectively support the technical rigor, scalability, and reproducibility of the proposed method.

4. Results and Discussion

The results and discussion of the analysis are broken down into three categories: comparison of semantic segmentation models, thermal anomaly detection based on the whole image, and thermal anomaly detection based on segmented building envelope images.

4.1. Comparison of Semantic Segmentation Models

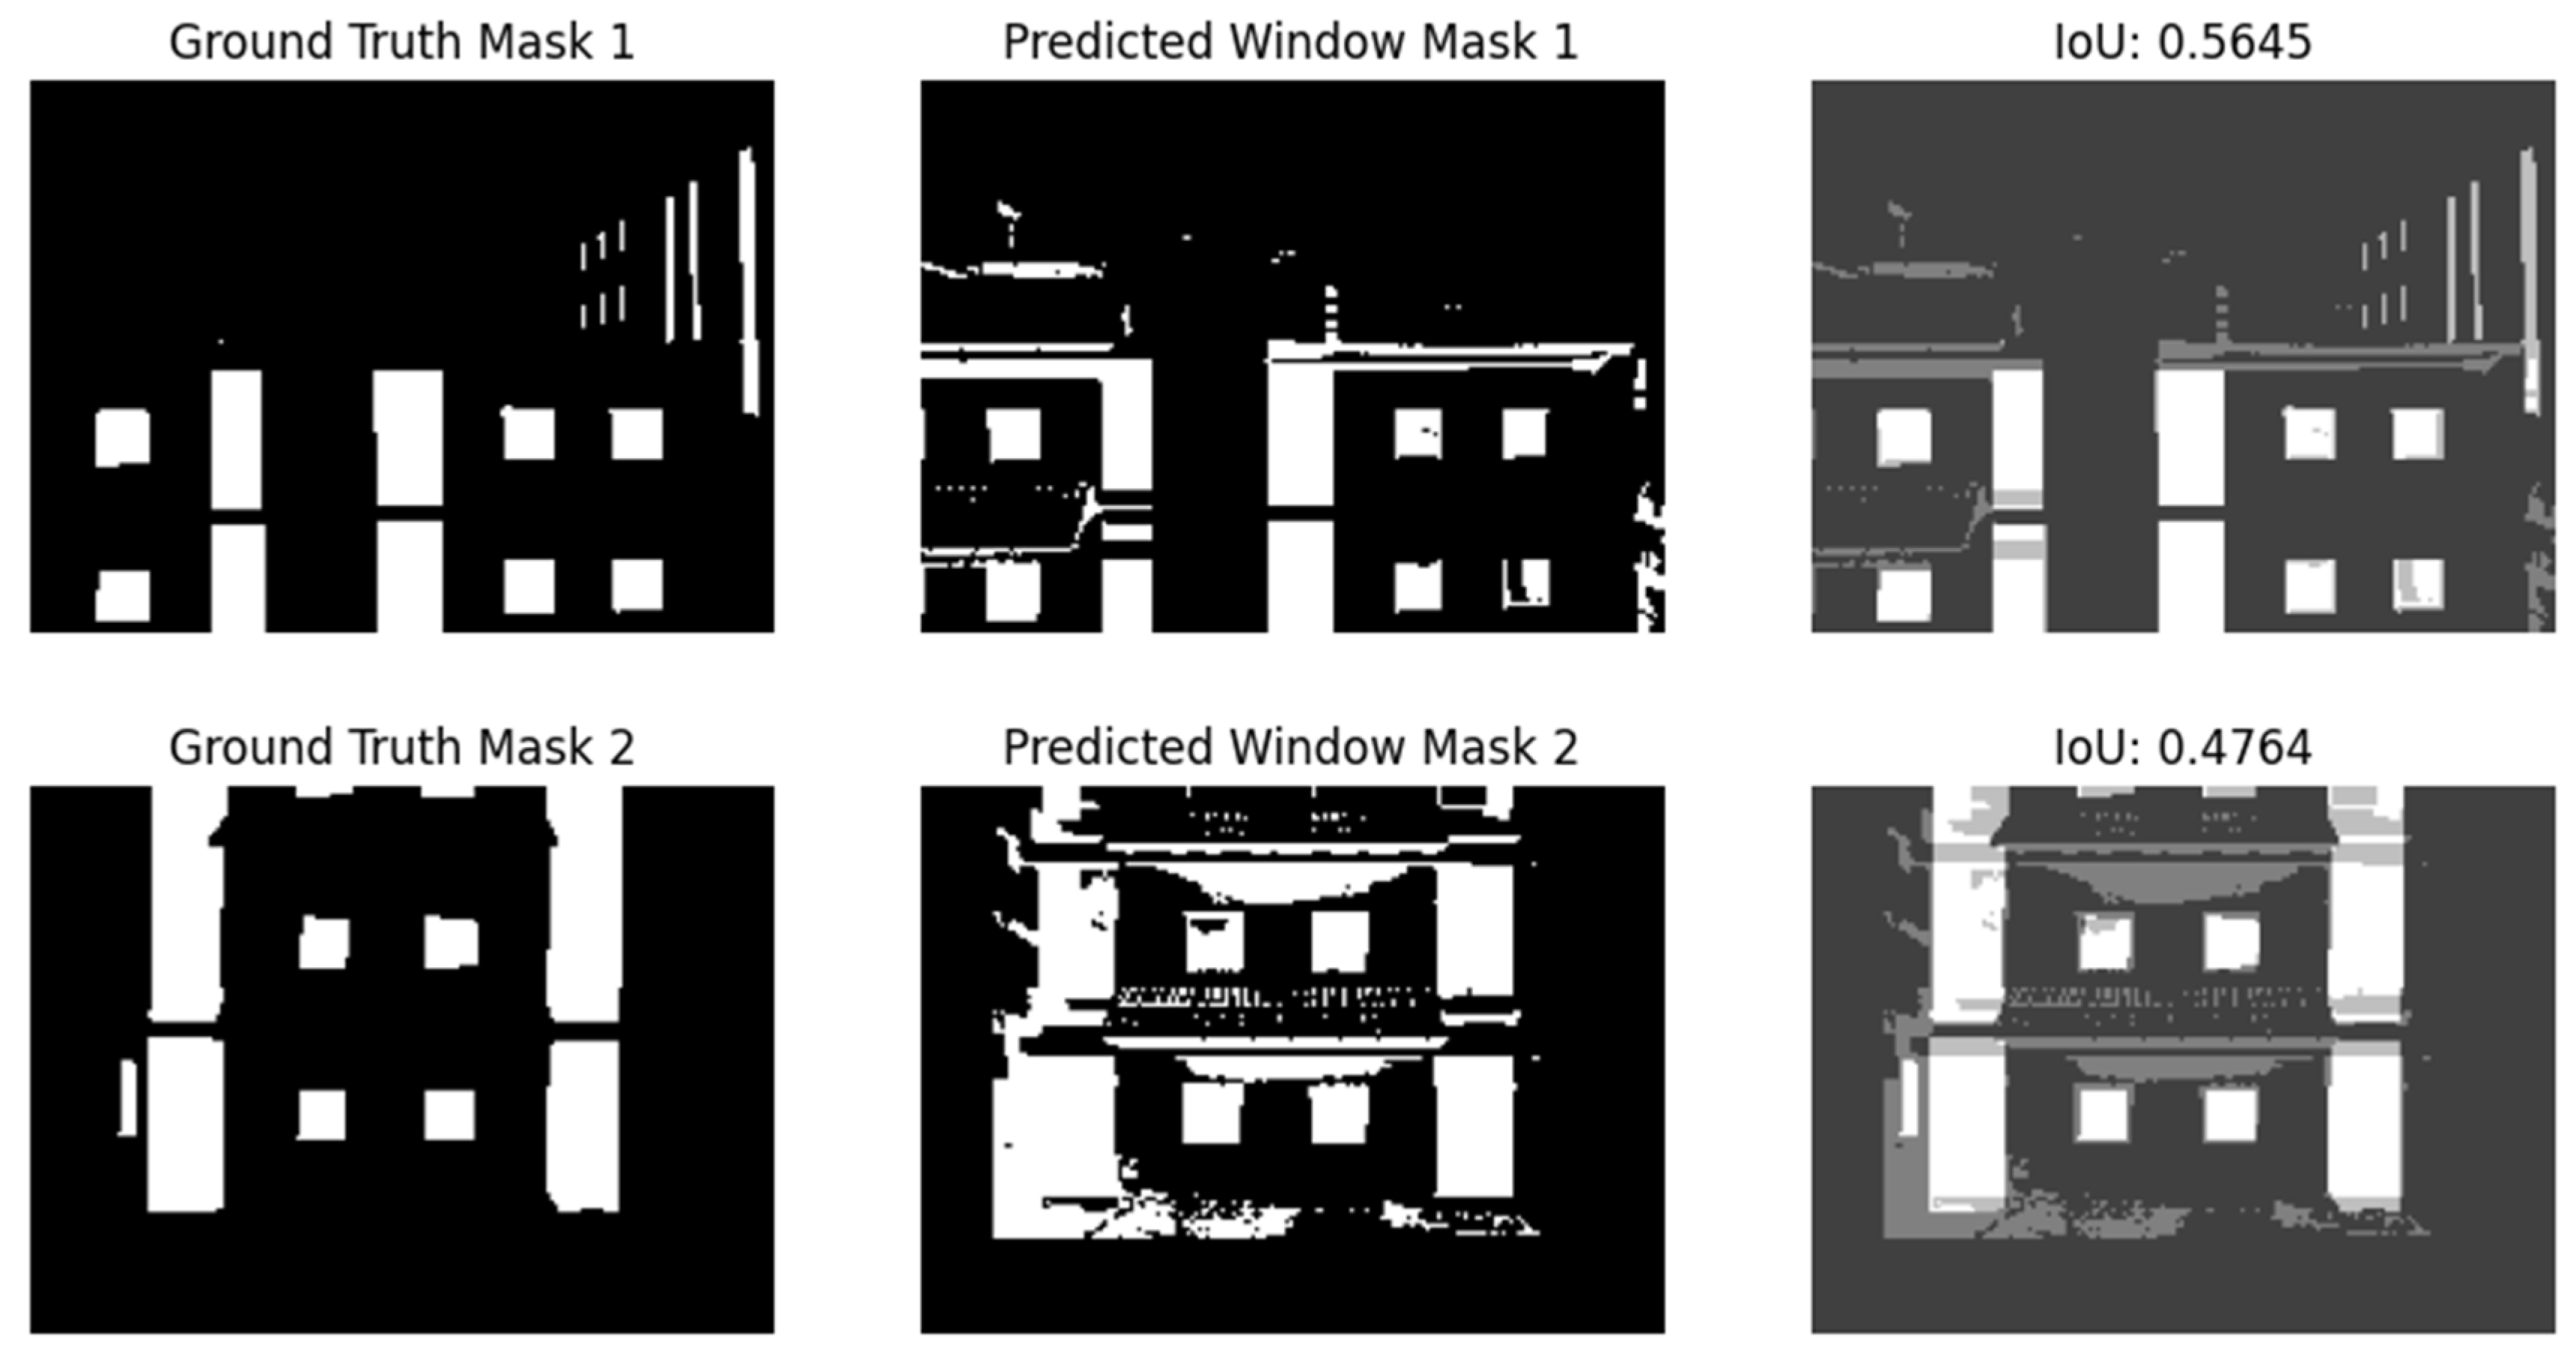
Figure 8 and Figure 9 demonstrates the thresholding method’s prediction comparisons with their corresponding raw labelled image as well as calculated IoU values of walls and windows, respectively.
The segmentation performance of thresholding was evaluated on walls and windows. The detailed results are presented in Table 3.
Thresholding provided relatively high precision for both walls and windows (0.9345 and 0.6112, respectively). However, it showed lower recall values, particularly for walls (0.5297), indicating that it missed a significant number of true positives. The F1 scores and IoU values further reflect this imbalance, with walls having a notably lower F1 (0.6524) and IoU (0.5143) compared to windows.
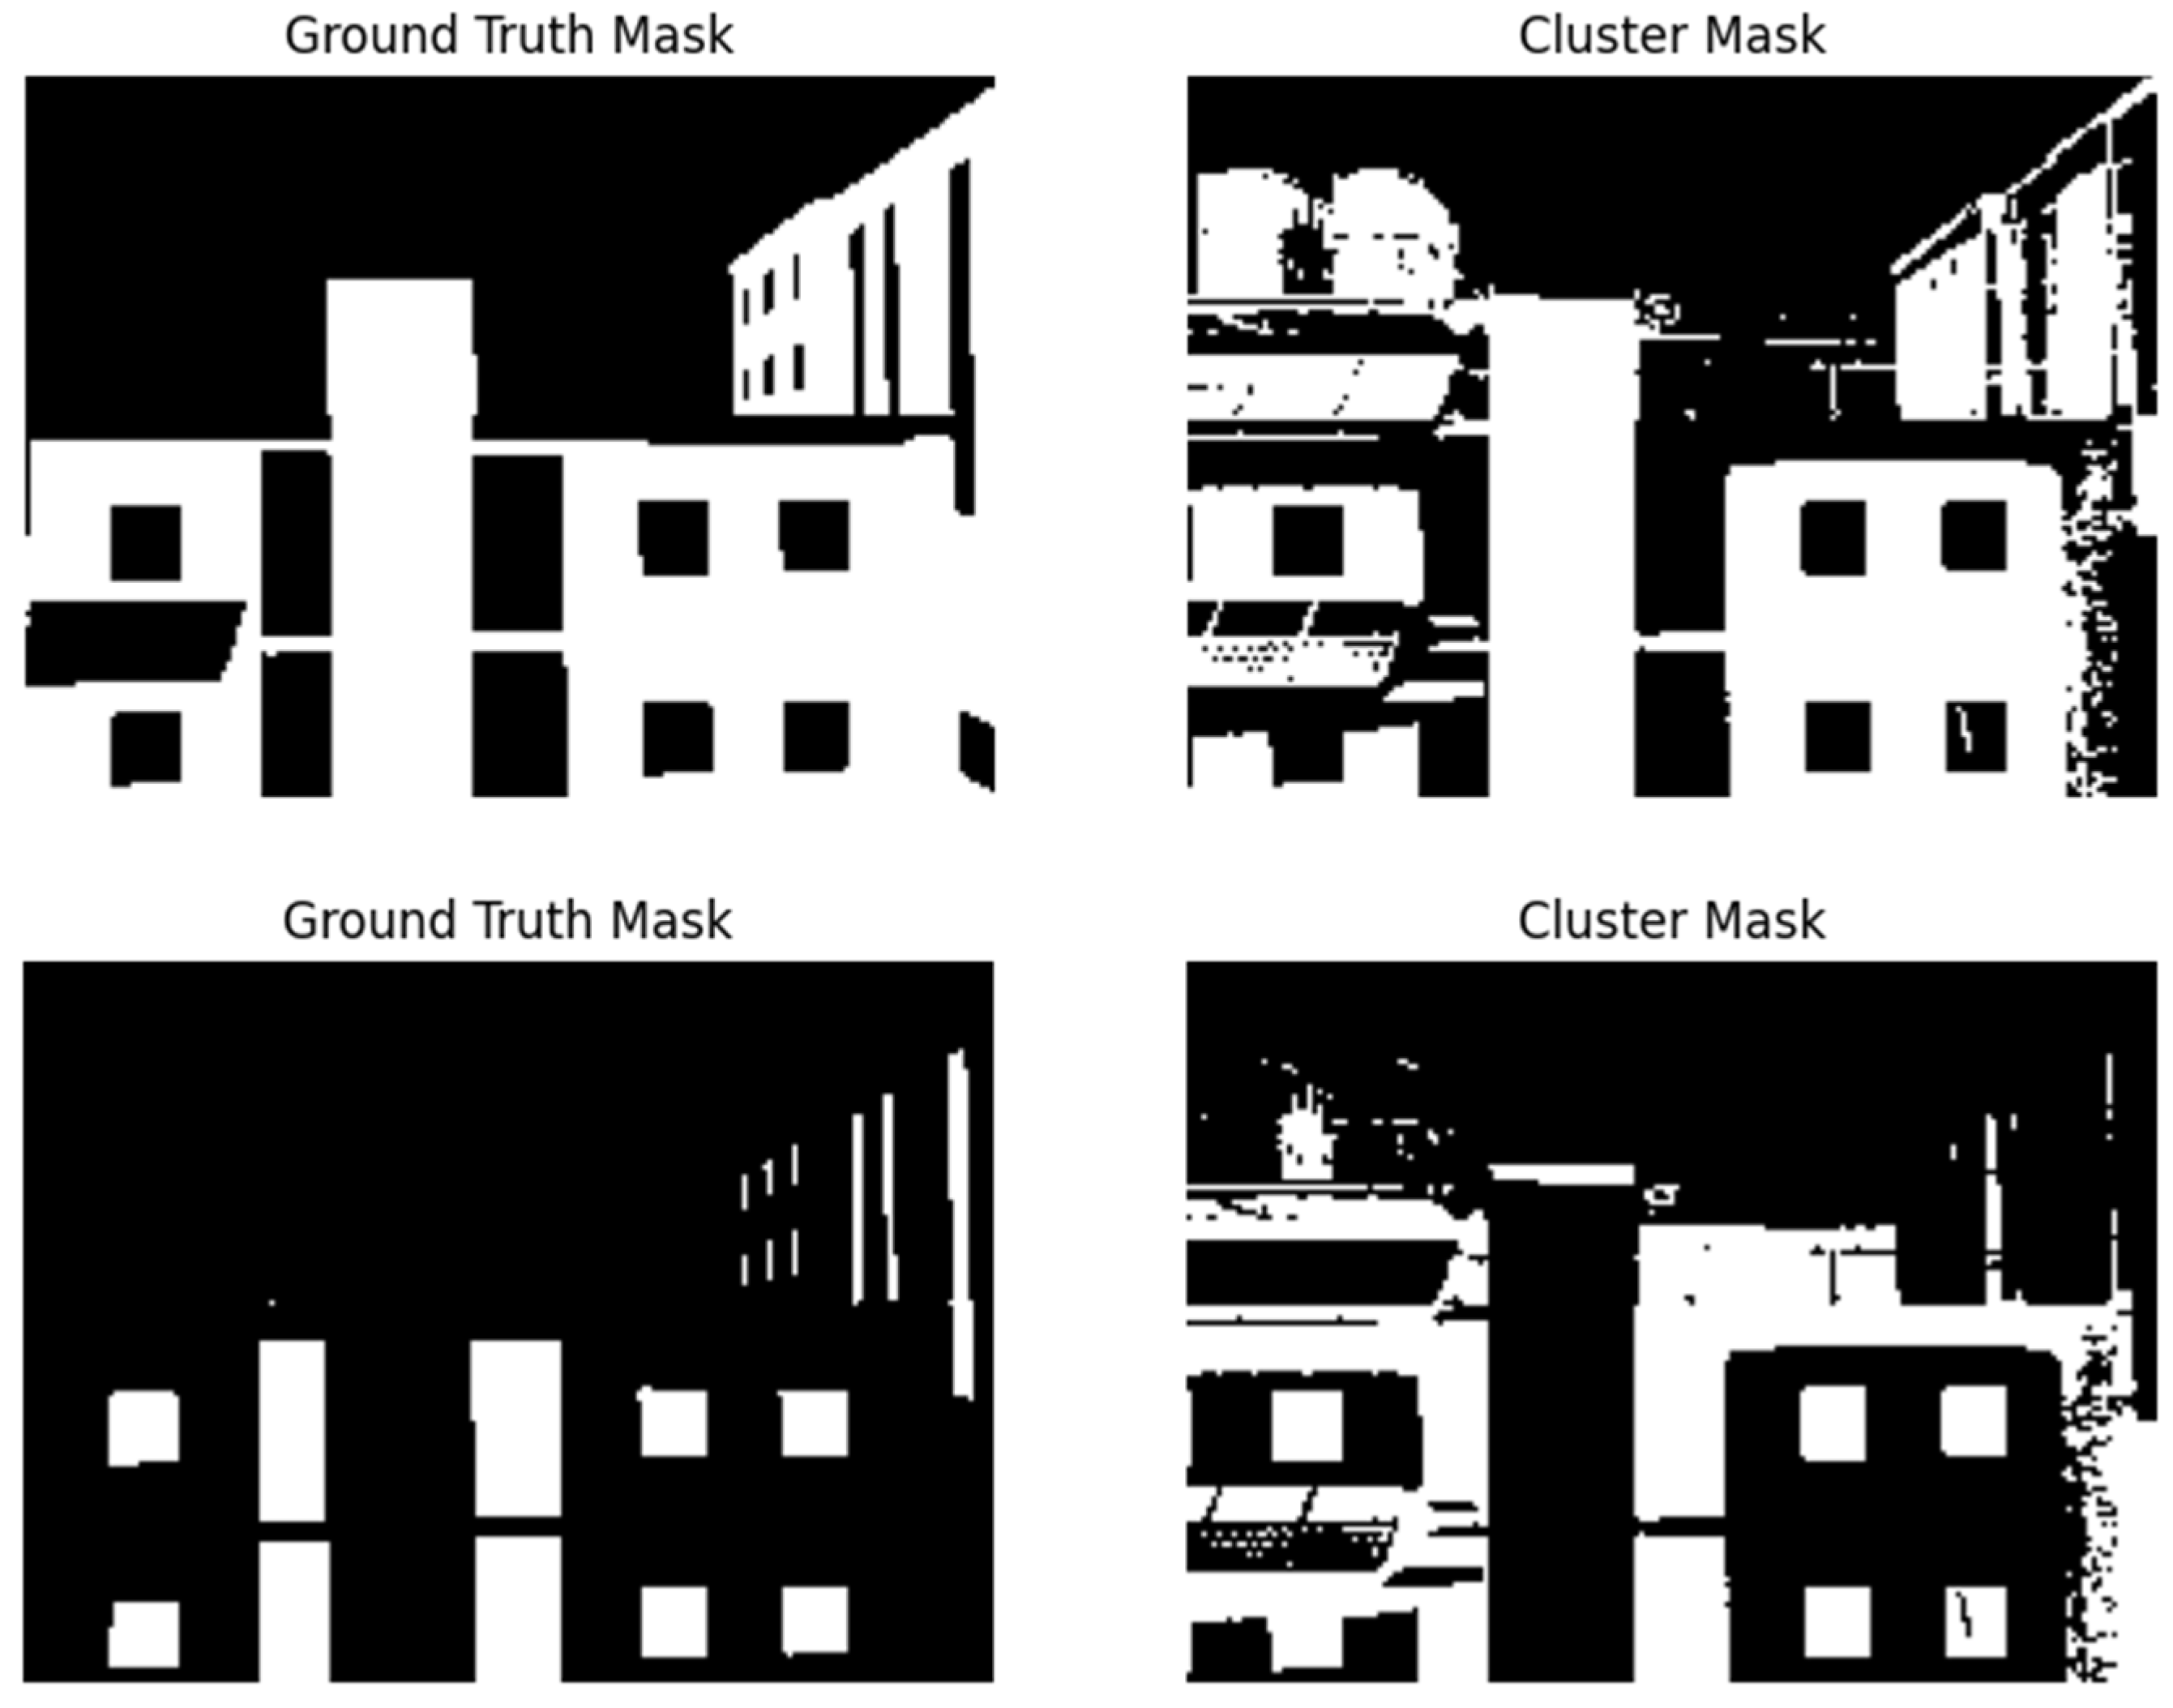
Figure 10 demonstrates K-Means clustering’s prediction comparisons with their corresponding ground truth image of walls and windows.
The segmentation performance of K-Means clustering was evaluated on two classes of walls and windows. The detailed results are presented in Table 4.
K-means clustering showed an improvement in recall for both walls and windows (0.7655 and 0.8496, respectively) compared to thresholding. However, precision for windows dropped significantly (0.3719), resulting in lower overall accuracy and IoU (0.3489 for windows). The F1 score for windows was higher (0.8496), indicating that while the method could detect more true positives, it also produced more false positives.
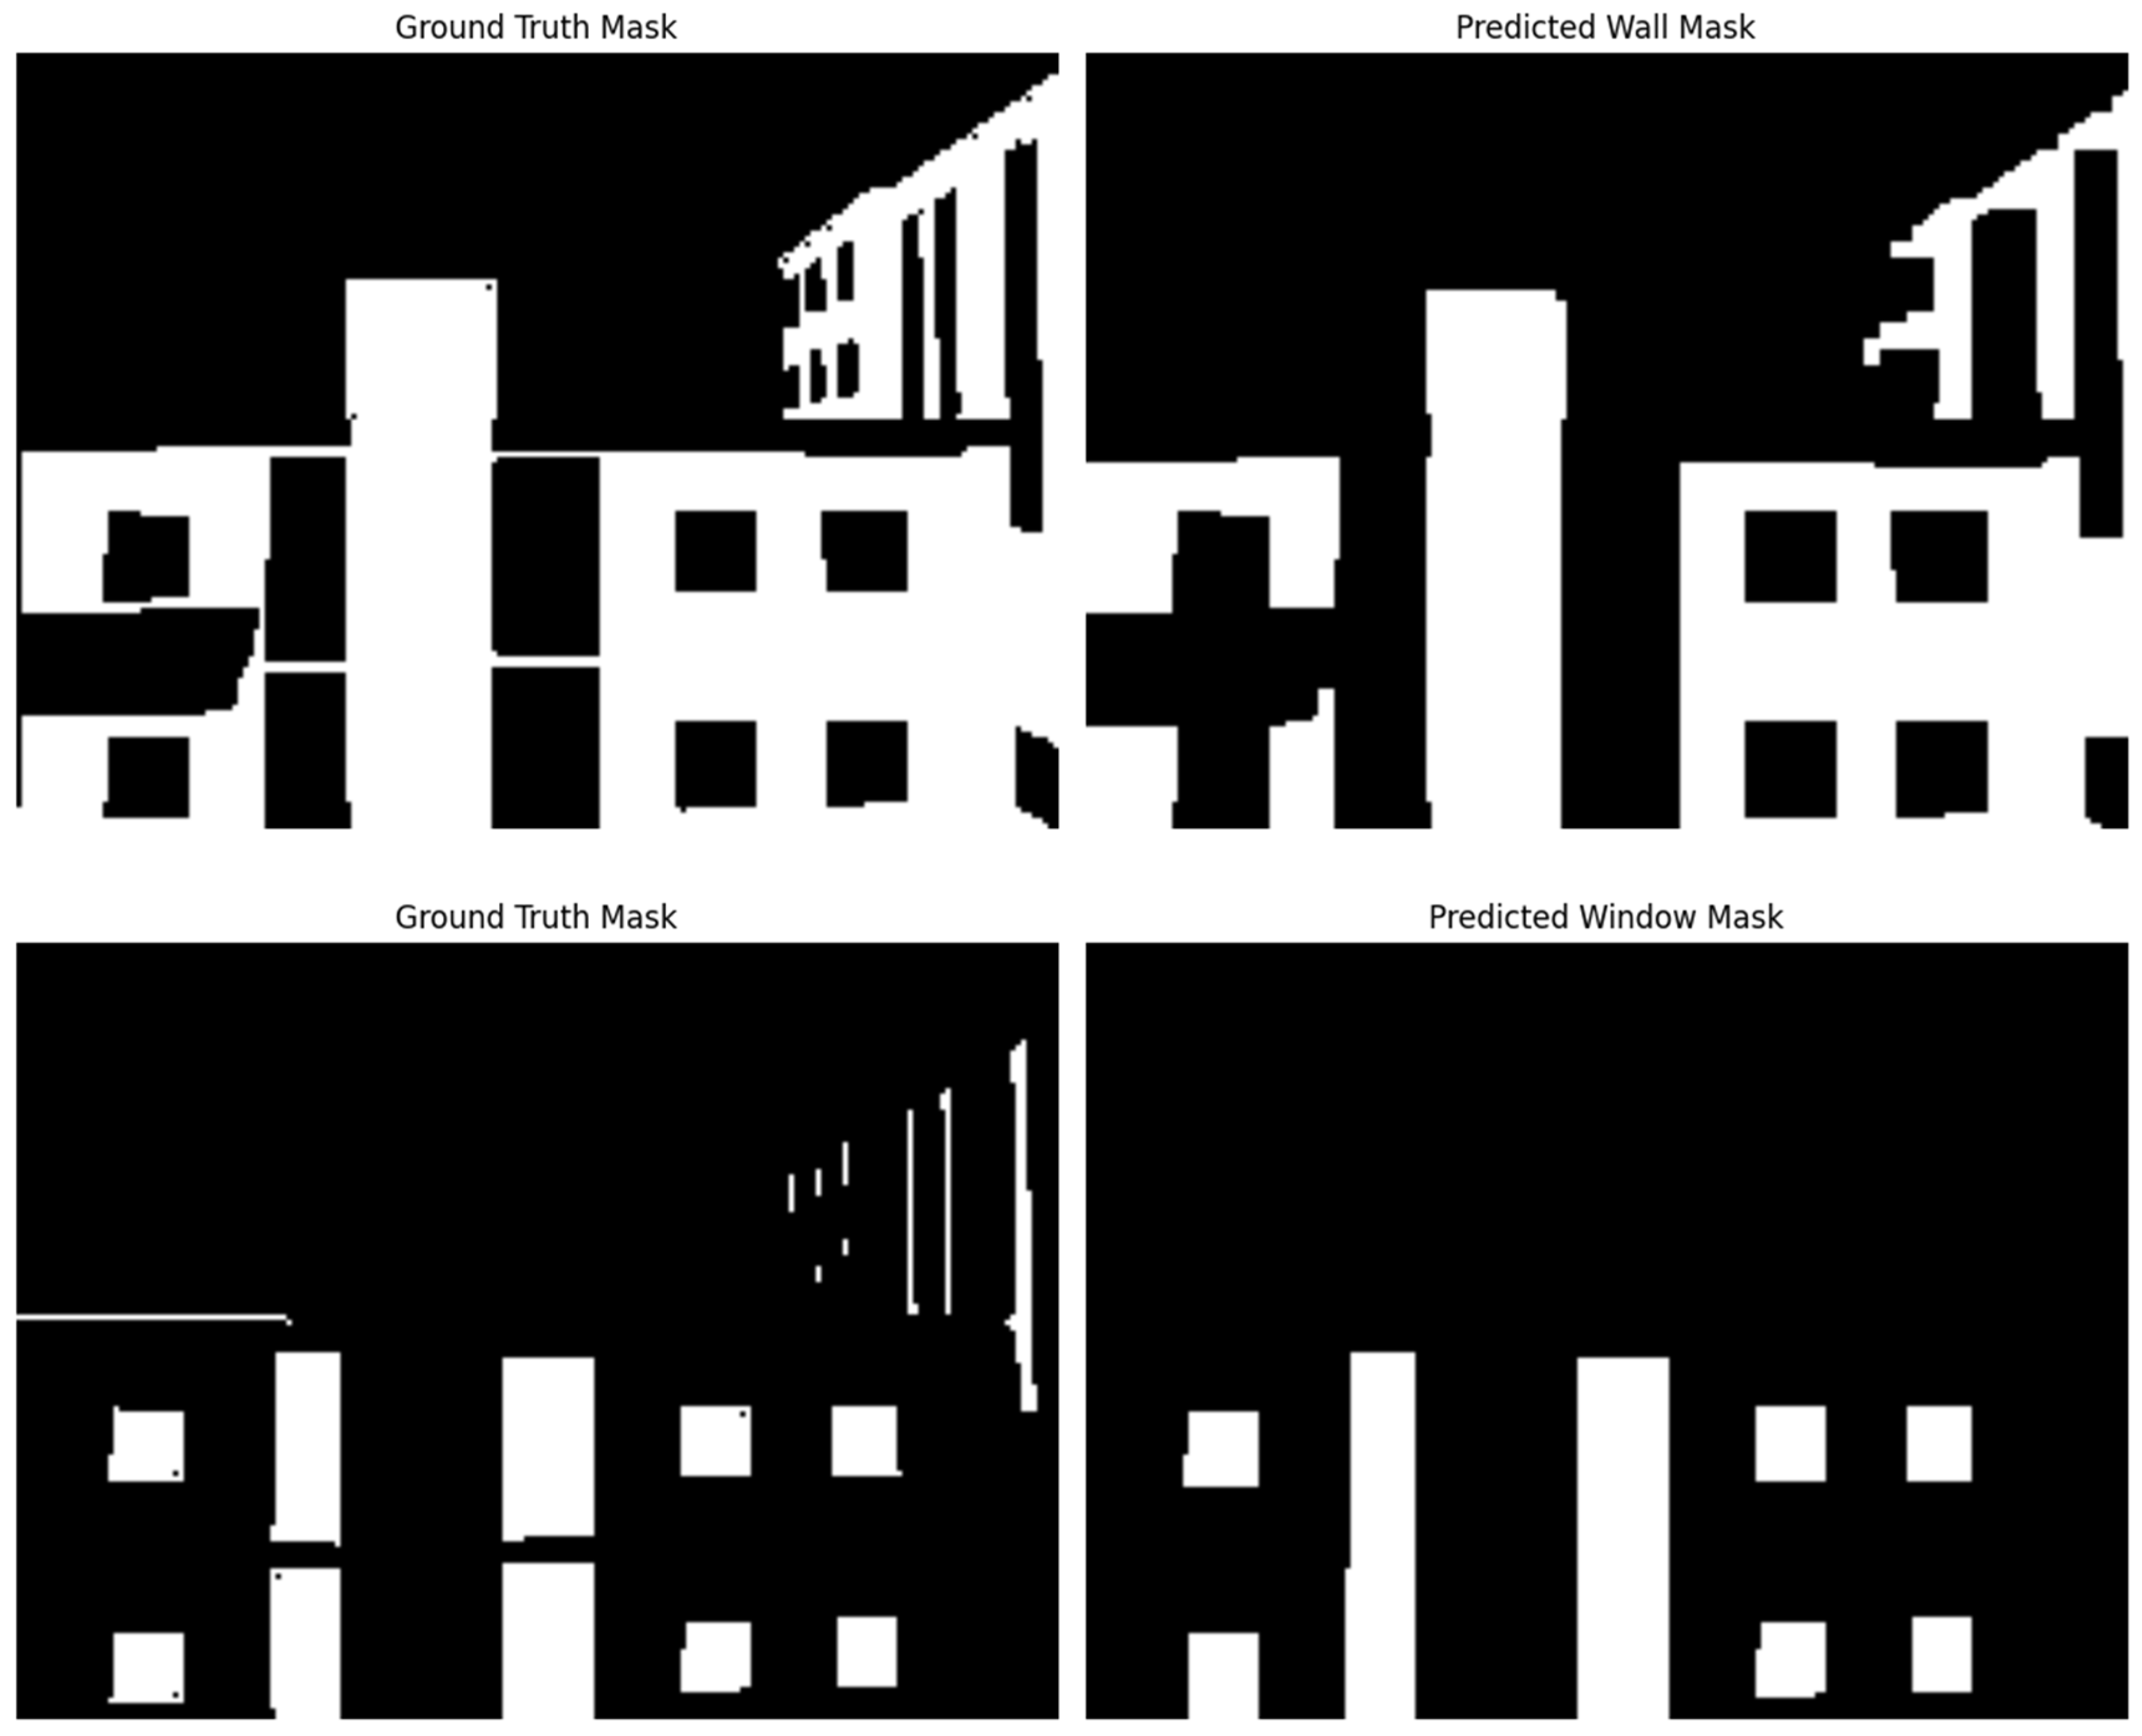
Figure 11 shows examples of U-Net model prediction comparisons with their corresponding ground truth mask of walls and windows.
The segmentation performance of U-Net was evaluated on two classes of walls and windows. The detailed results are presented in Table 5.
The U-Net method outperformed both thresholding and K-means clustering across all metrics. For walls, U-Net achieved the highest accuracy (0.9313), precision (0.9376), recall (0.8893), F1 score (0.9128), and IoU (0.8396). Similarly, for windows, U-Net showed superior performance with an accuracy of 0.9639, precision of 0.8532, recall of 0.8251, F1 score of 0.8389, and IoU of 0.7225. This indicates that U-Net is highly effective at both identifying true positives and minimizing false positives, leading to better segmentation performance overall. However, for training the U-Net model a large dataset was annotated. This aspect should be considered in deep learning implementation for semantic segmentation in building envelope segmentation.

4.2. Thermal Anomaly Detection Based on Whole Image

The results of this approach are shown in Figure 12. Sample 1 illustrates the case of addition of beam to wall representing geometrical thermal bridge that was capture through the IR image and presented on top of visible image. A case of material degradation and deterioration, combined with air leakage, is detected in Sample 2. In this thermal scenario, that is represented from right end of the inspected facade, this anomaly might be caused by the high exposure of building material to weather scenarios compared to the intermediate areas’ materials, where the protection is provided by large ducts located in the right and left side of the portion of envelope. Sample 3 shows the detection of thermal anomaly through the envelope penetration that is successfully detected.
To compare with the drone thermography, the data was also collected using the FLIR infrared camera (eledyne FLIR LLC, Wilsonville, OR, USA). Figure 13 demonstrates the results FLIR infrared camera in terms of framework implementation for thermal anomaly detection over the whole image.
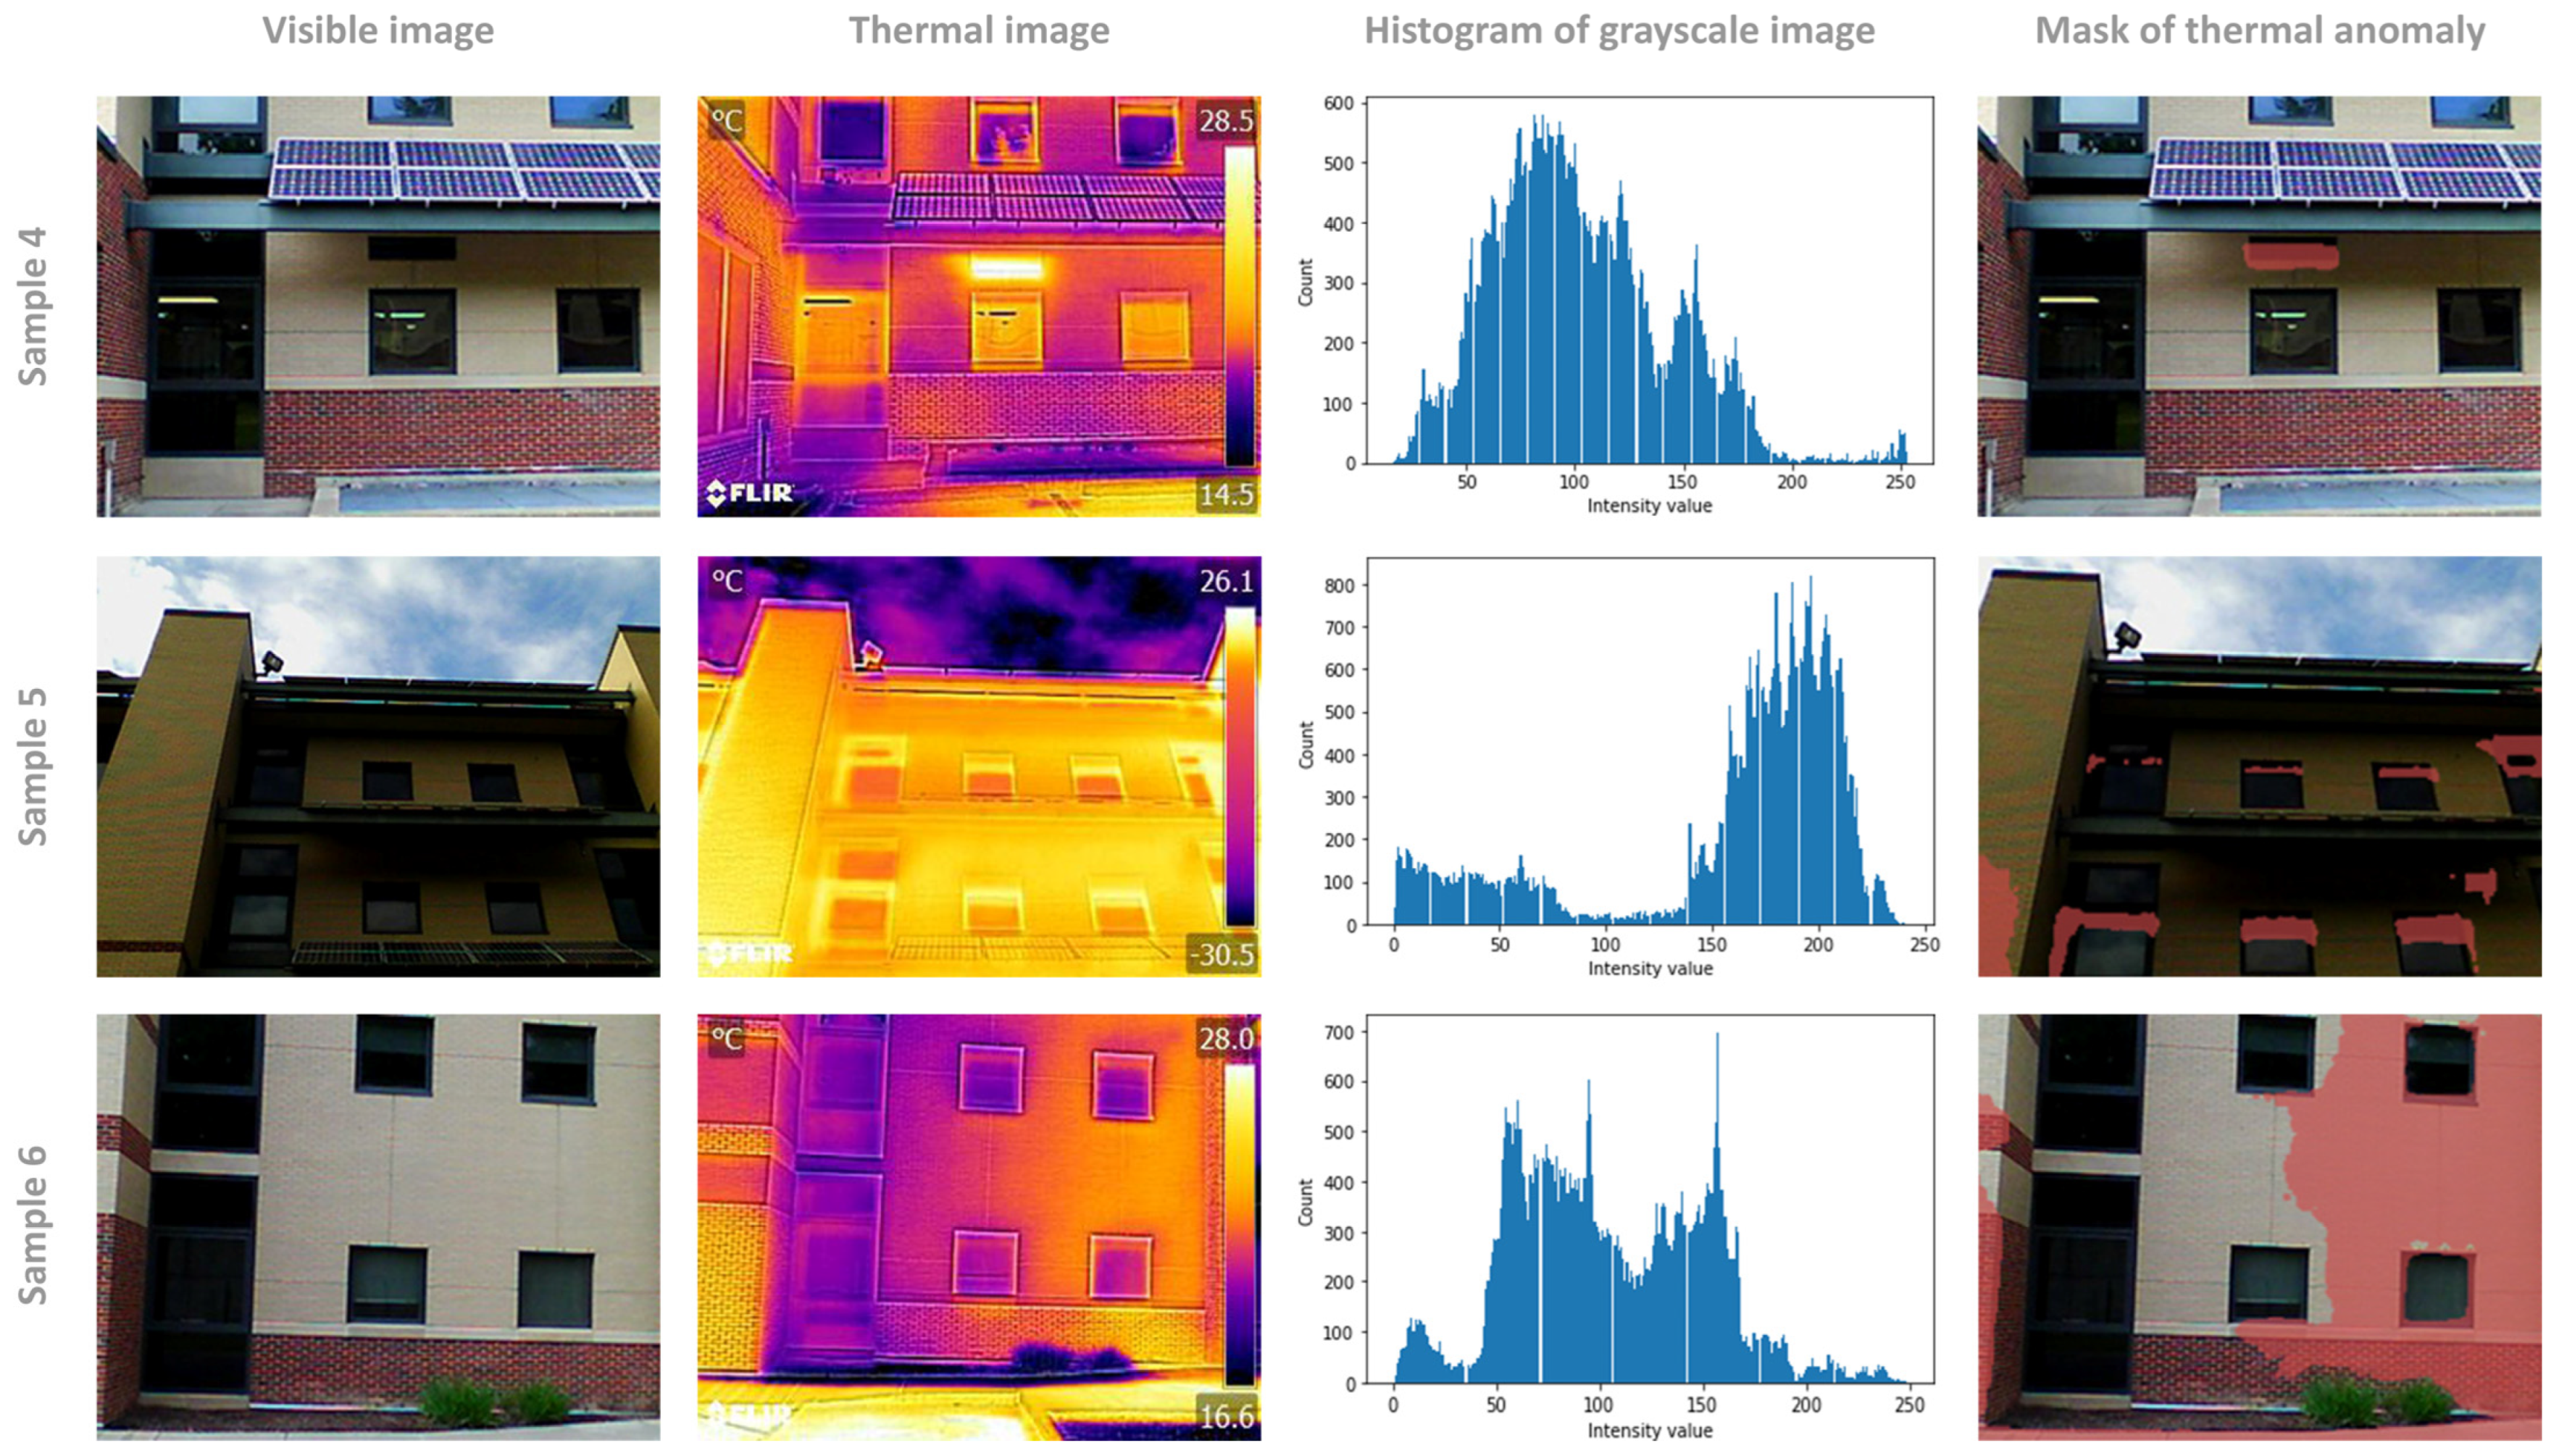
It should be noted that an additional preprocessing step has been conducted on thermal information taken with the FLIR camera to transfer information and eliminate the target point for ease of image processing using the FLIR Tools+ (version 5.13). To validate the proposed framework in this study, the results were compared with the ground truth. To create the ground truth, we checked each thermal image and specified the areas corresponding to thermal anomalies. As shown by Sample 5, the framework is capable of successfully filtering off the sky and identifying the thermal anomaly. Sample 1, 2, and 3 illustrates cases of envelop penetration, thermal bridge, and material degradation, respectively. However, a small region of false positive of ground information has been detected in the Sample 6.
As mentioned, the FLIR Infrared camera, as a tool for traditional building envelope inspection, was used to assess the same envelope area for the same building. The comparison between the traditional and automated approach showed that the automated proposed solution can decrease number of hours spent for auditing a large building. It gave the possibility of assessing the envelope in a comprehensive manner. For instance, all inaccessible envelope components were inspected; however, an auditor might assume the same performance for those areas (in the traditional approach). Example of images taken with the FLIR camera demonstrated its effectiveness for the first two floors, but additional efforts needed when the orientation of the camera changed to take images from higher levels, meaning that the traditional approach might be more effective for a low-rise small building (e.g., single-family house), but not necessarily the most time and cost-effective technique for a mid-rise, high-rise large building, or a neighborhood scale. Another aspect is that the decision making about implementing which of those approaches is strongly dependent on the project objectives. It should be noted that for the drone thermography application, human oversite is needed for safety concerns.

4.3. Thermal Anomaly Detection Based on Segmented Envelope Images

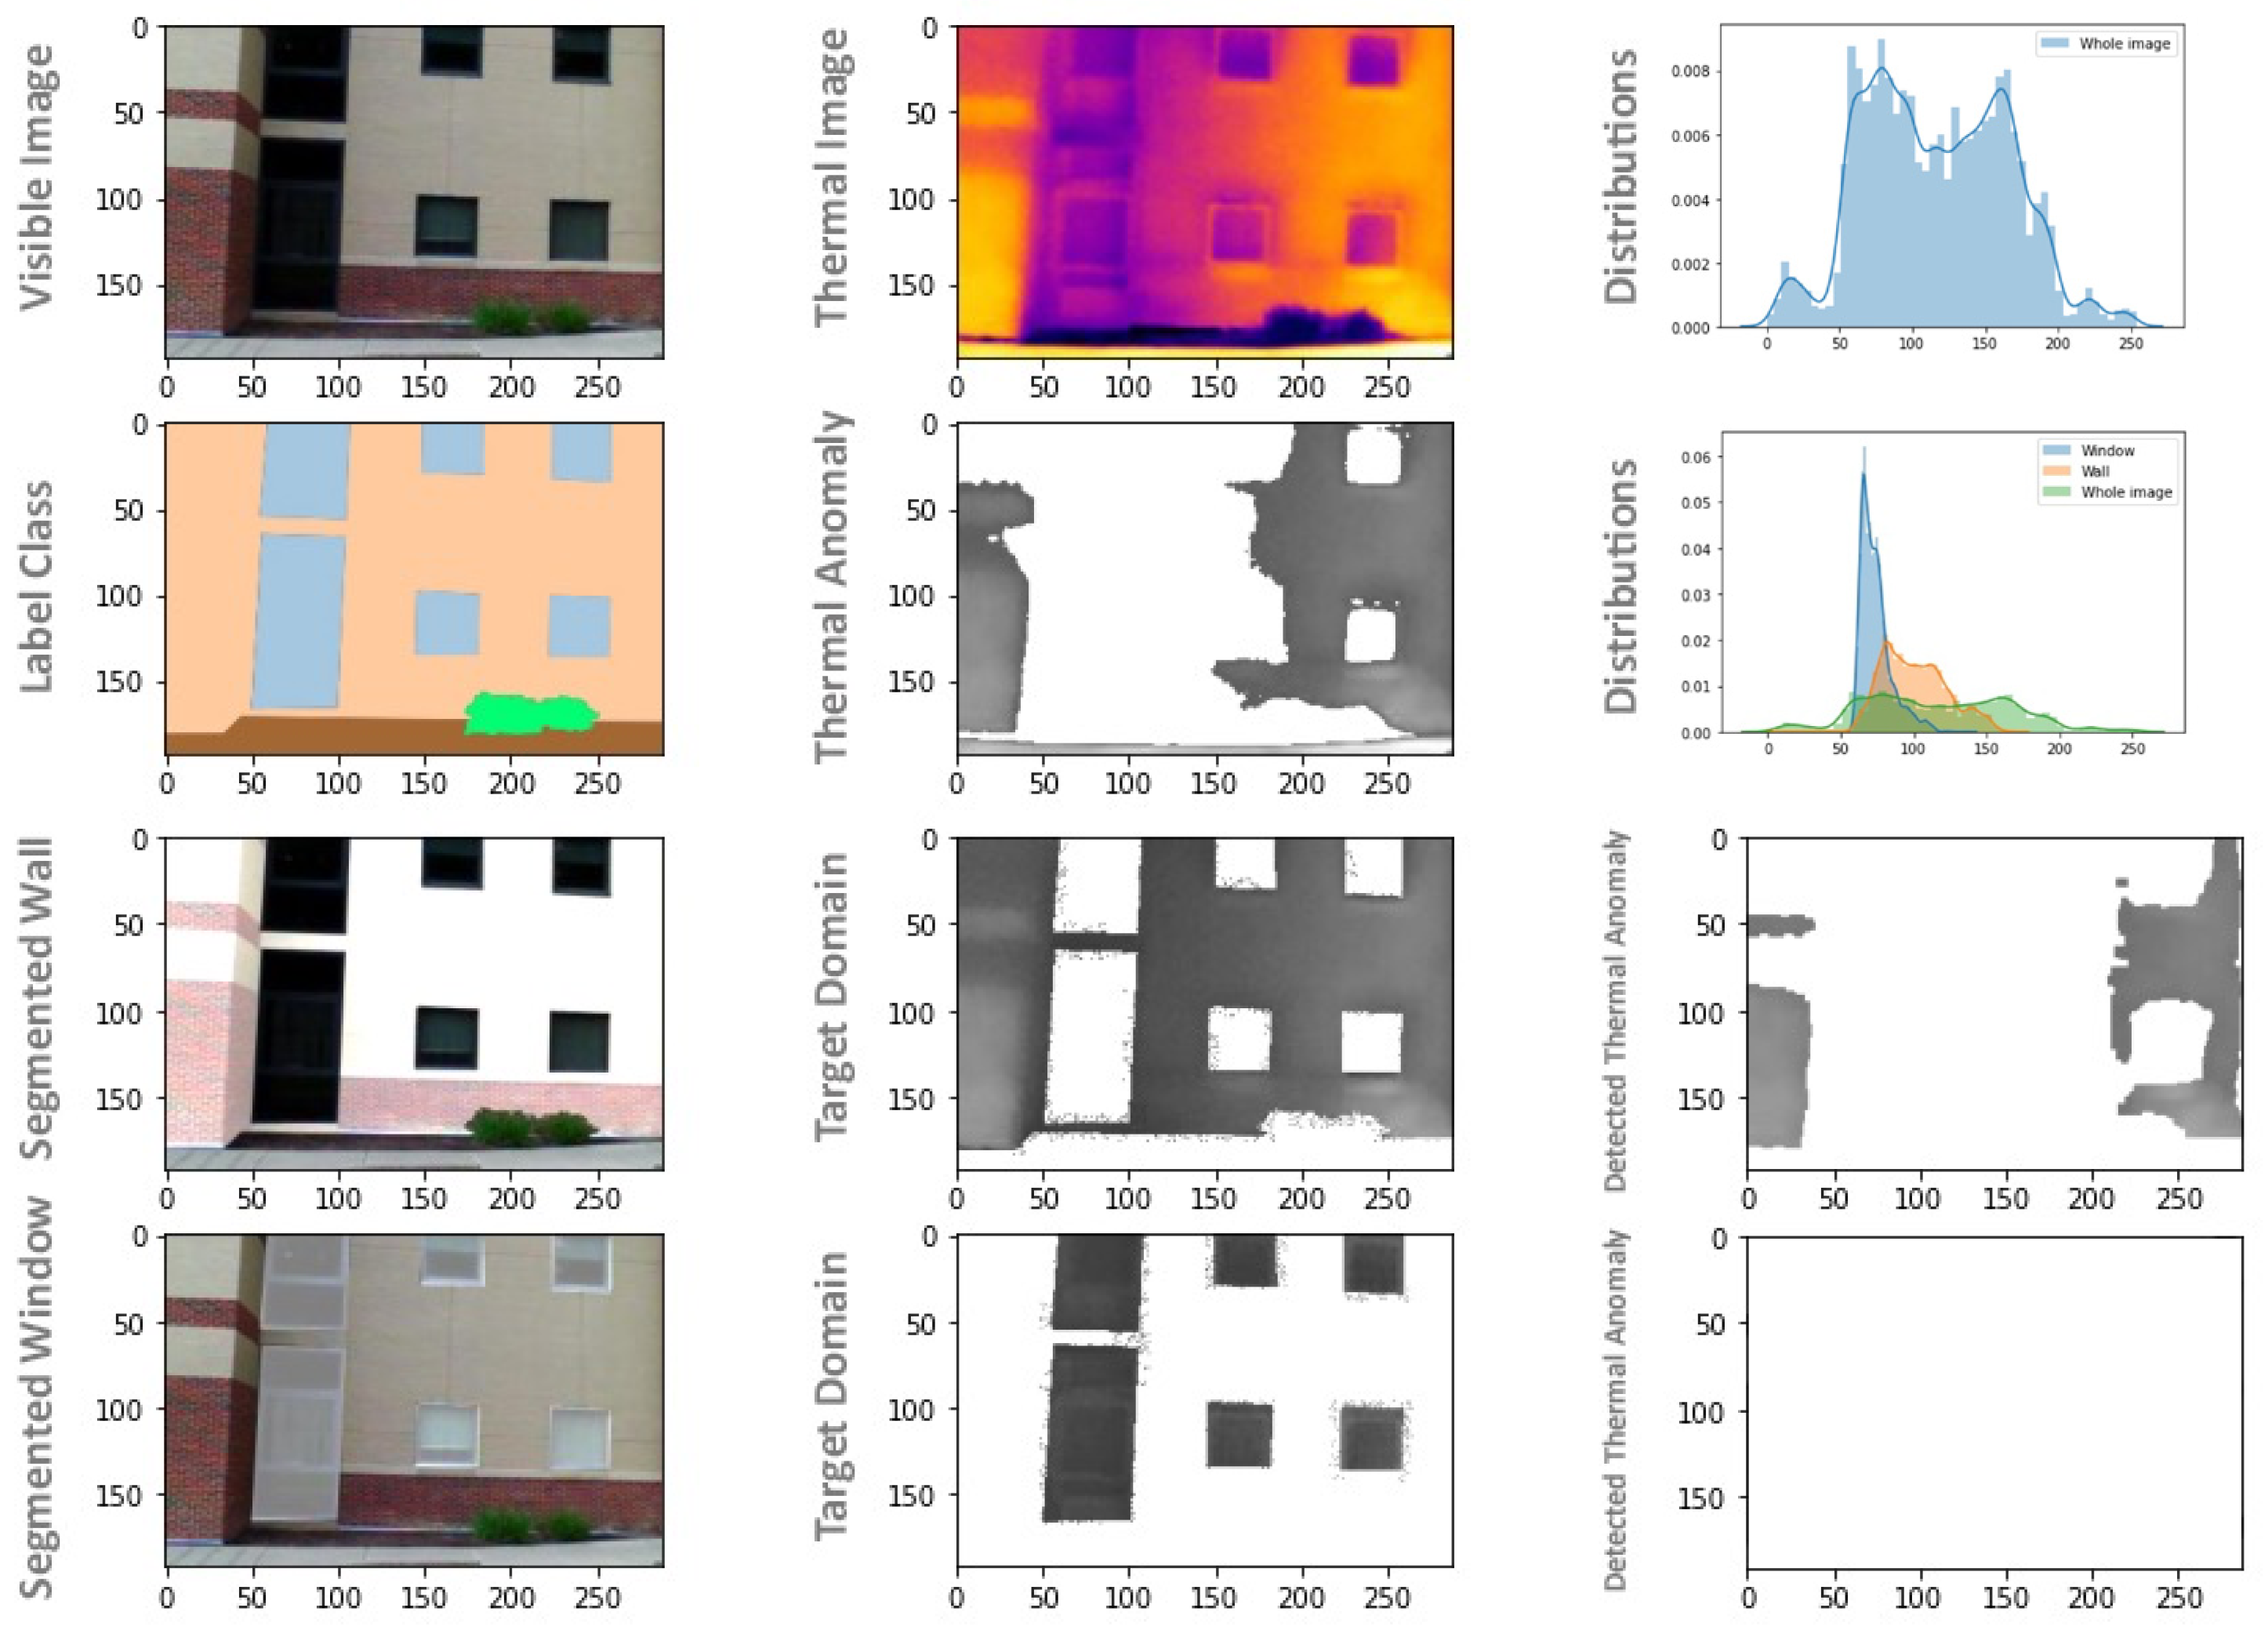
Results of implementing thermal anomaly detection based on segmented images (wall and window target domain) are shown in Figure 14, Figure 15 and Figure 16. A case of material degradation and deterioration is provided in Figure 14.
After detecting the thermal threshold from the probability distribution of the whole image, leakage was segmented, and the mask of the thermal anomaly was shown. However, after separating the target domains of wall and window, separate probability distributions were characterized. In this wall domain thermal scenario, the anomaly was found near the right end of the inspected façade; this anomaly might be caused by the high exposure of building material to weather scenarios compared to the intermediate areas’ materials, where the protection is provided by large ducts. On the left side of the frame, the anomaly can be characterized by a change of surface materials. Some of anomalies in this domain may be due to the differences in emissivity of bricks of different colors. This is because the thermal images were acquired with a single value for the emissivity for all objects in the field of view of the camera. On the other hand, for the window domain, no anomaly was detected following the distribution with one global maximum.
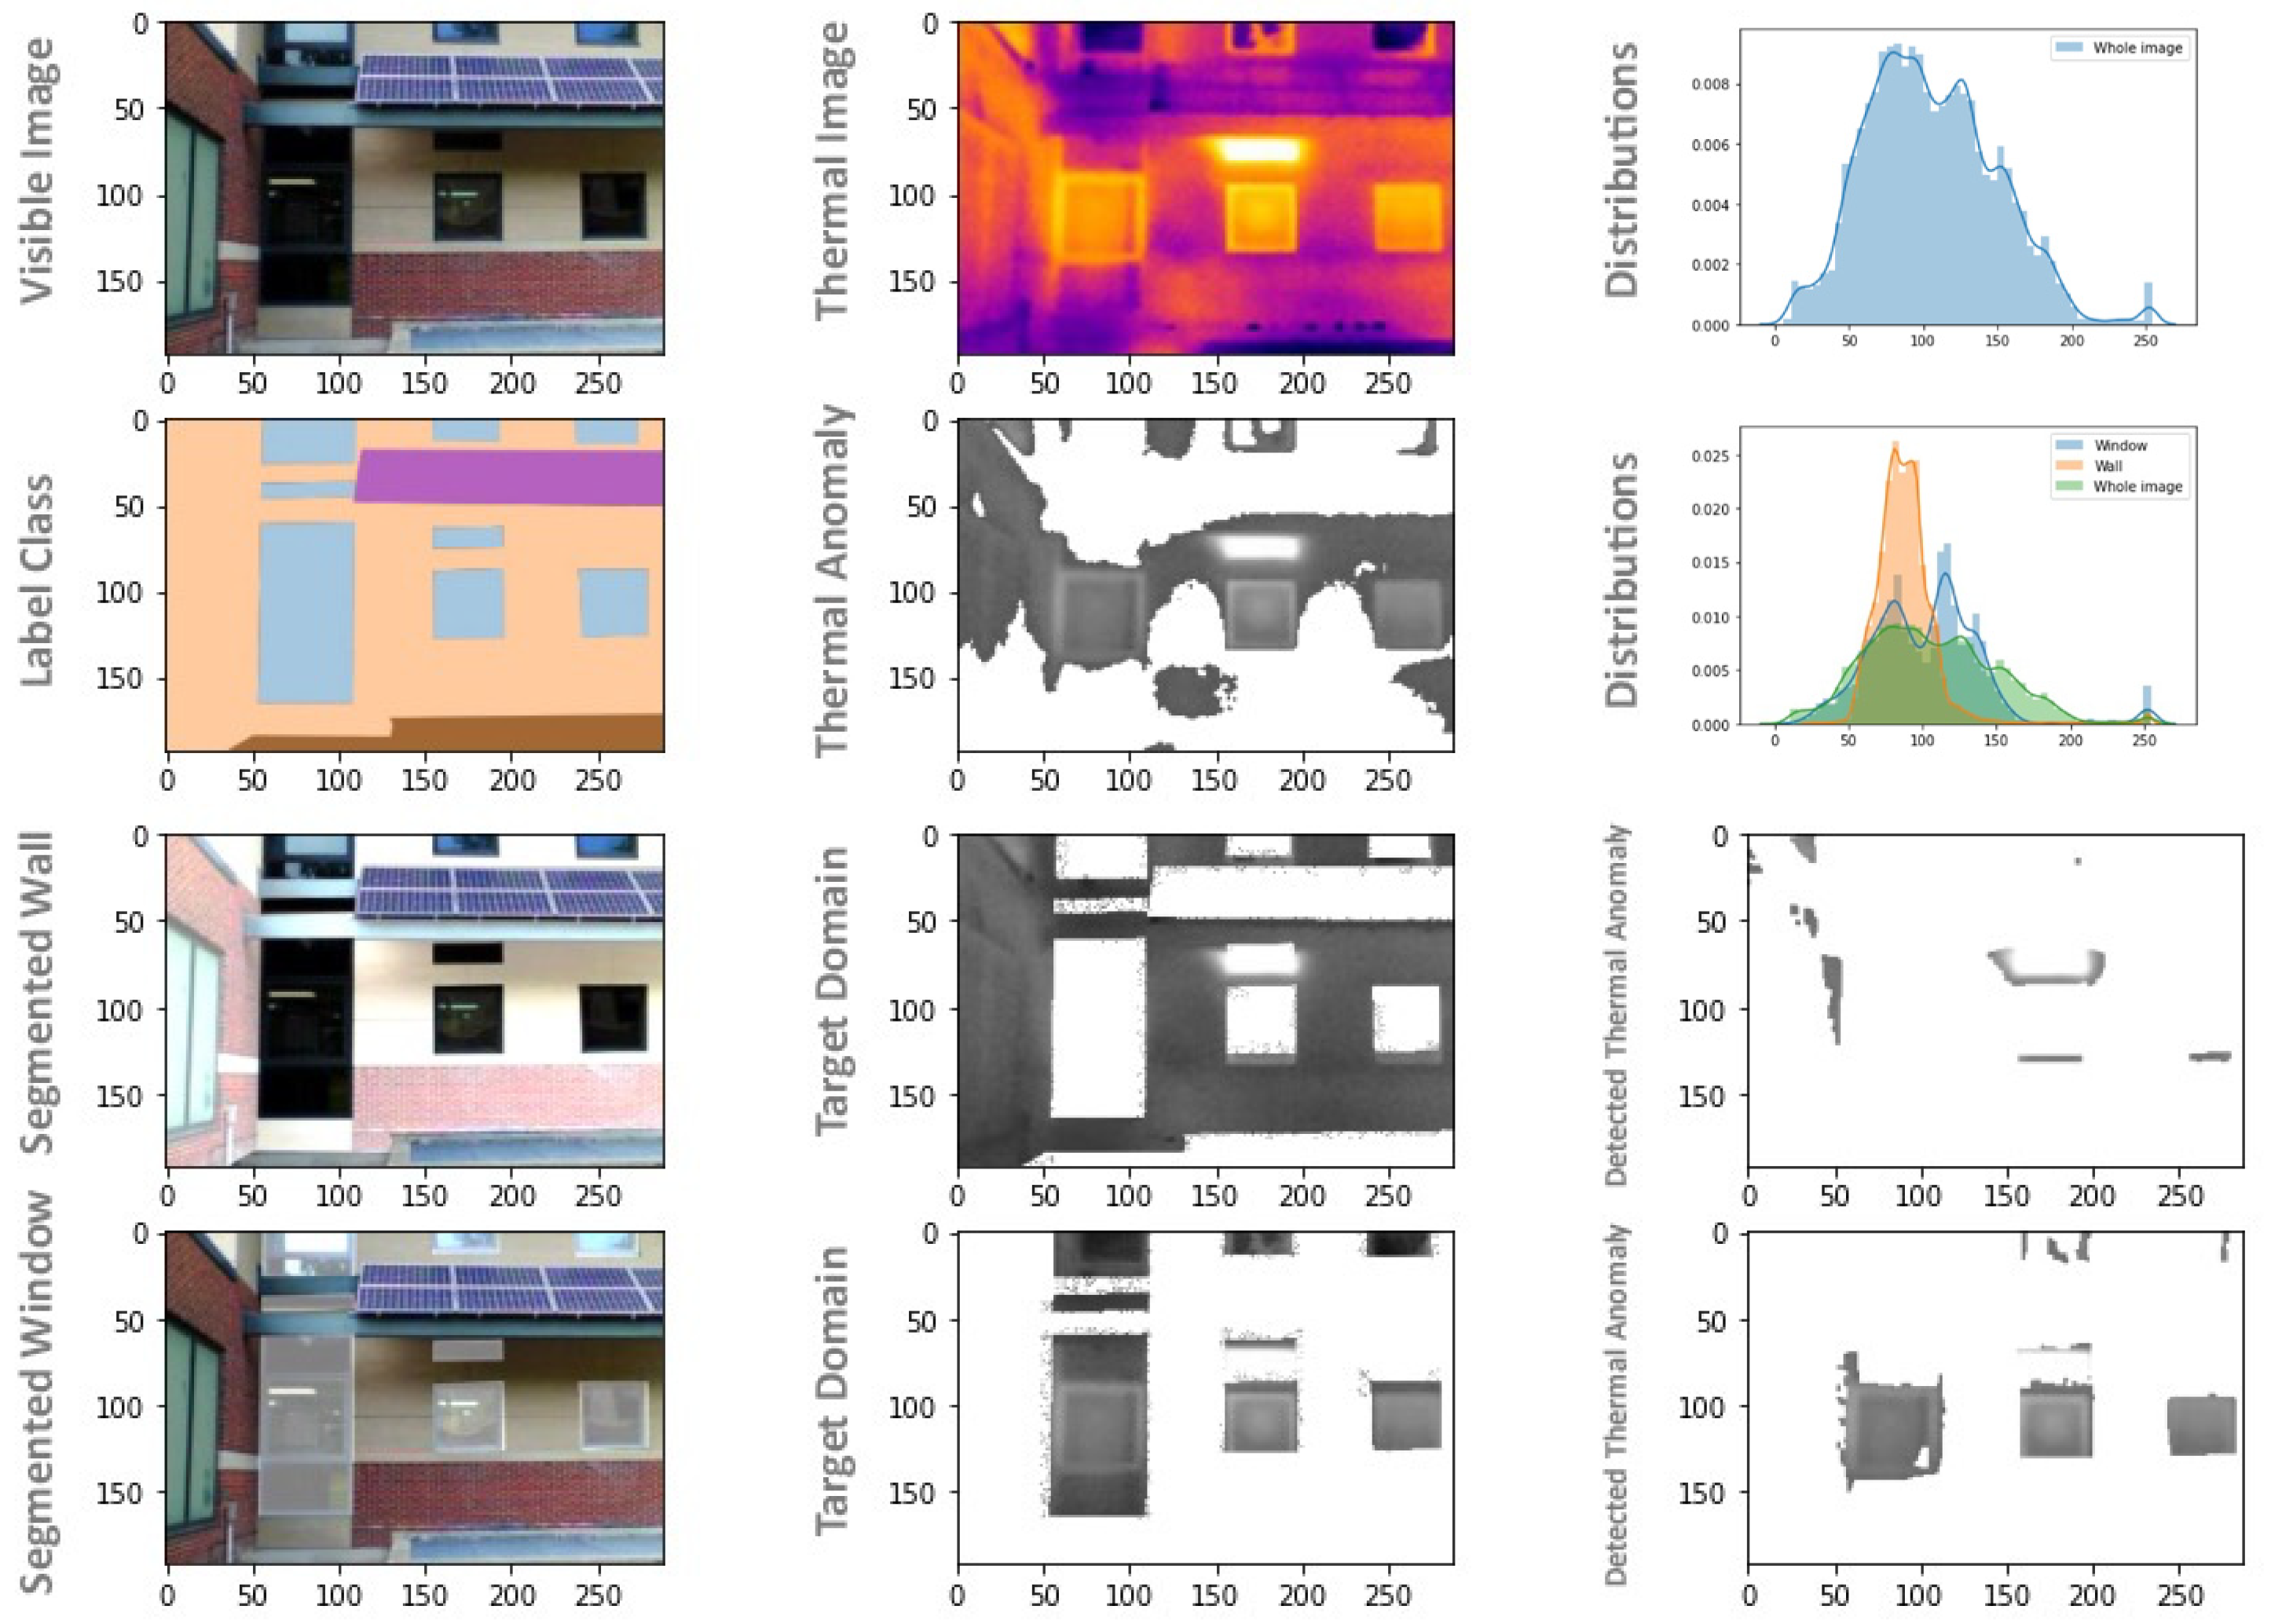
Figure 15 shows another selected visible and thermal image. The wall and window domain were considered as targets. The mask of thermal anomaly detected for the whole image showed a large area detected; that some locations did not seem to be anomalies. On the other hand, after segmentation and separation of wall and window, the results were improved. In particular, the mask of detected anomaly for window demonstrates the air leakage around the windows and envelope penetration were successfully detected. For the wall domain, a small region of false positive (apart from beam to wall connection) on the left side of image was detected in this sample.
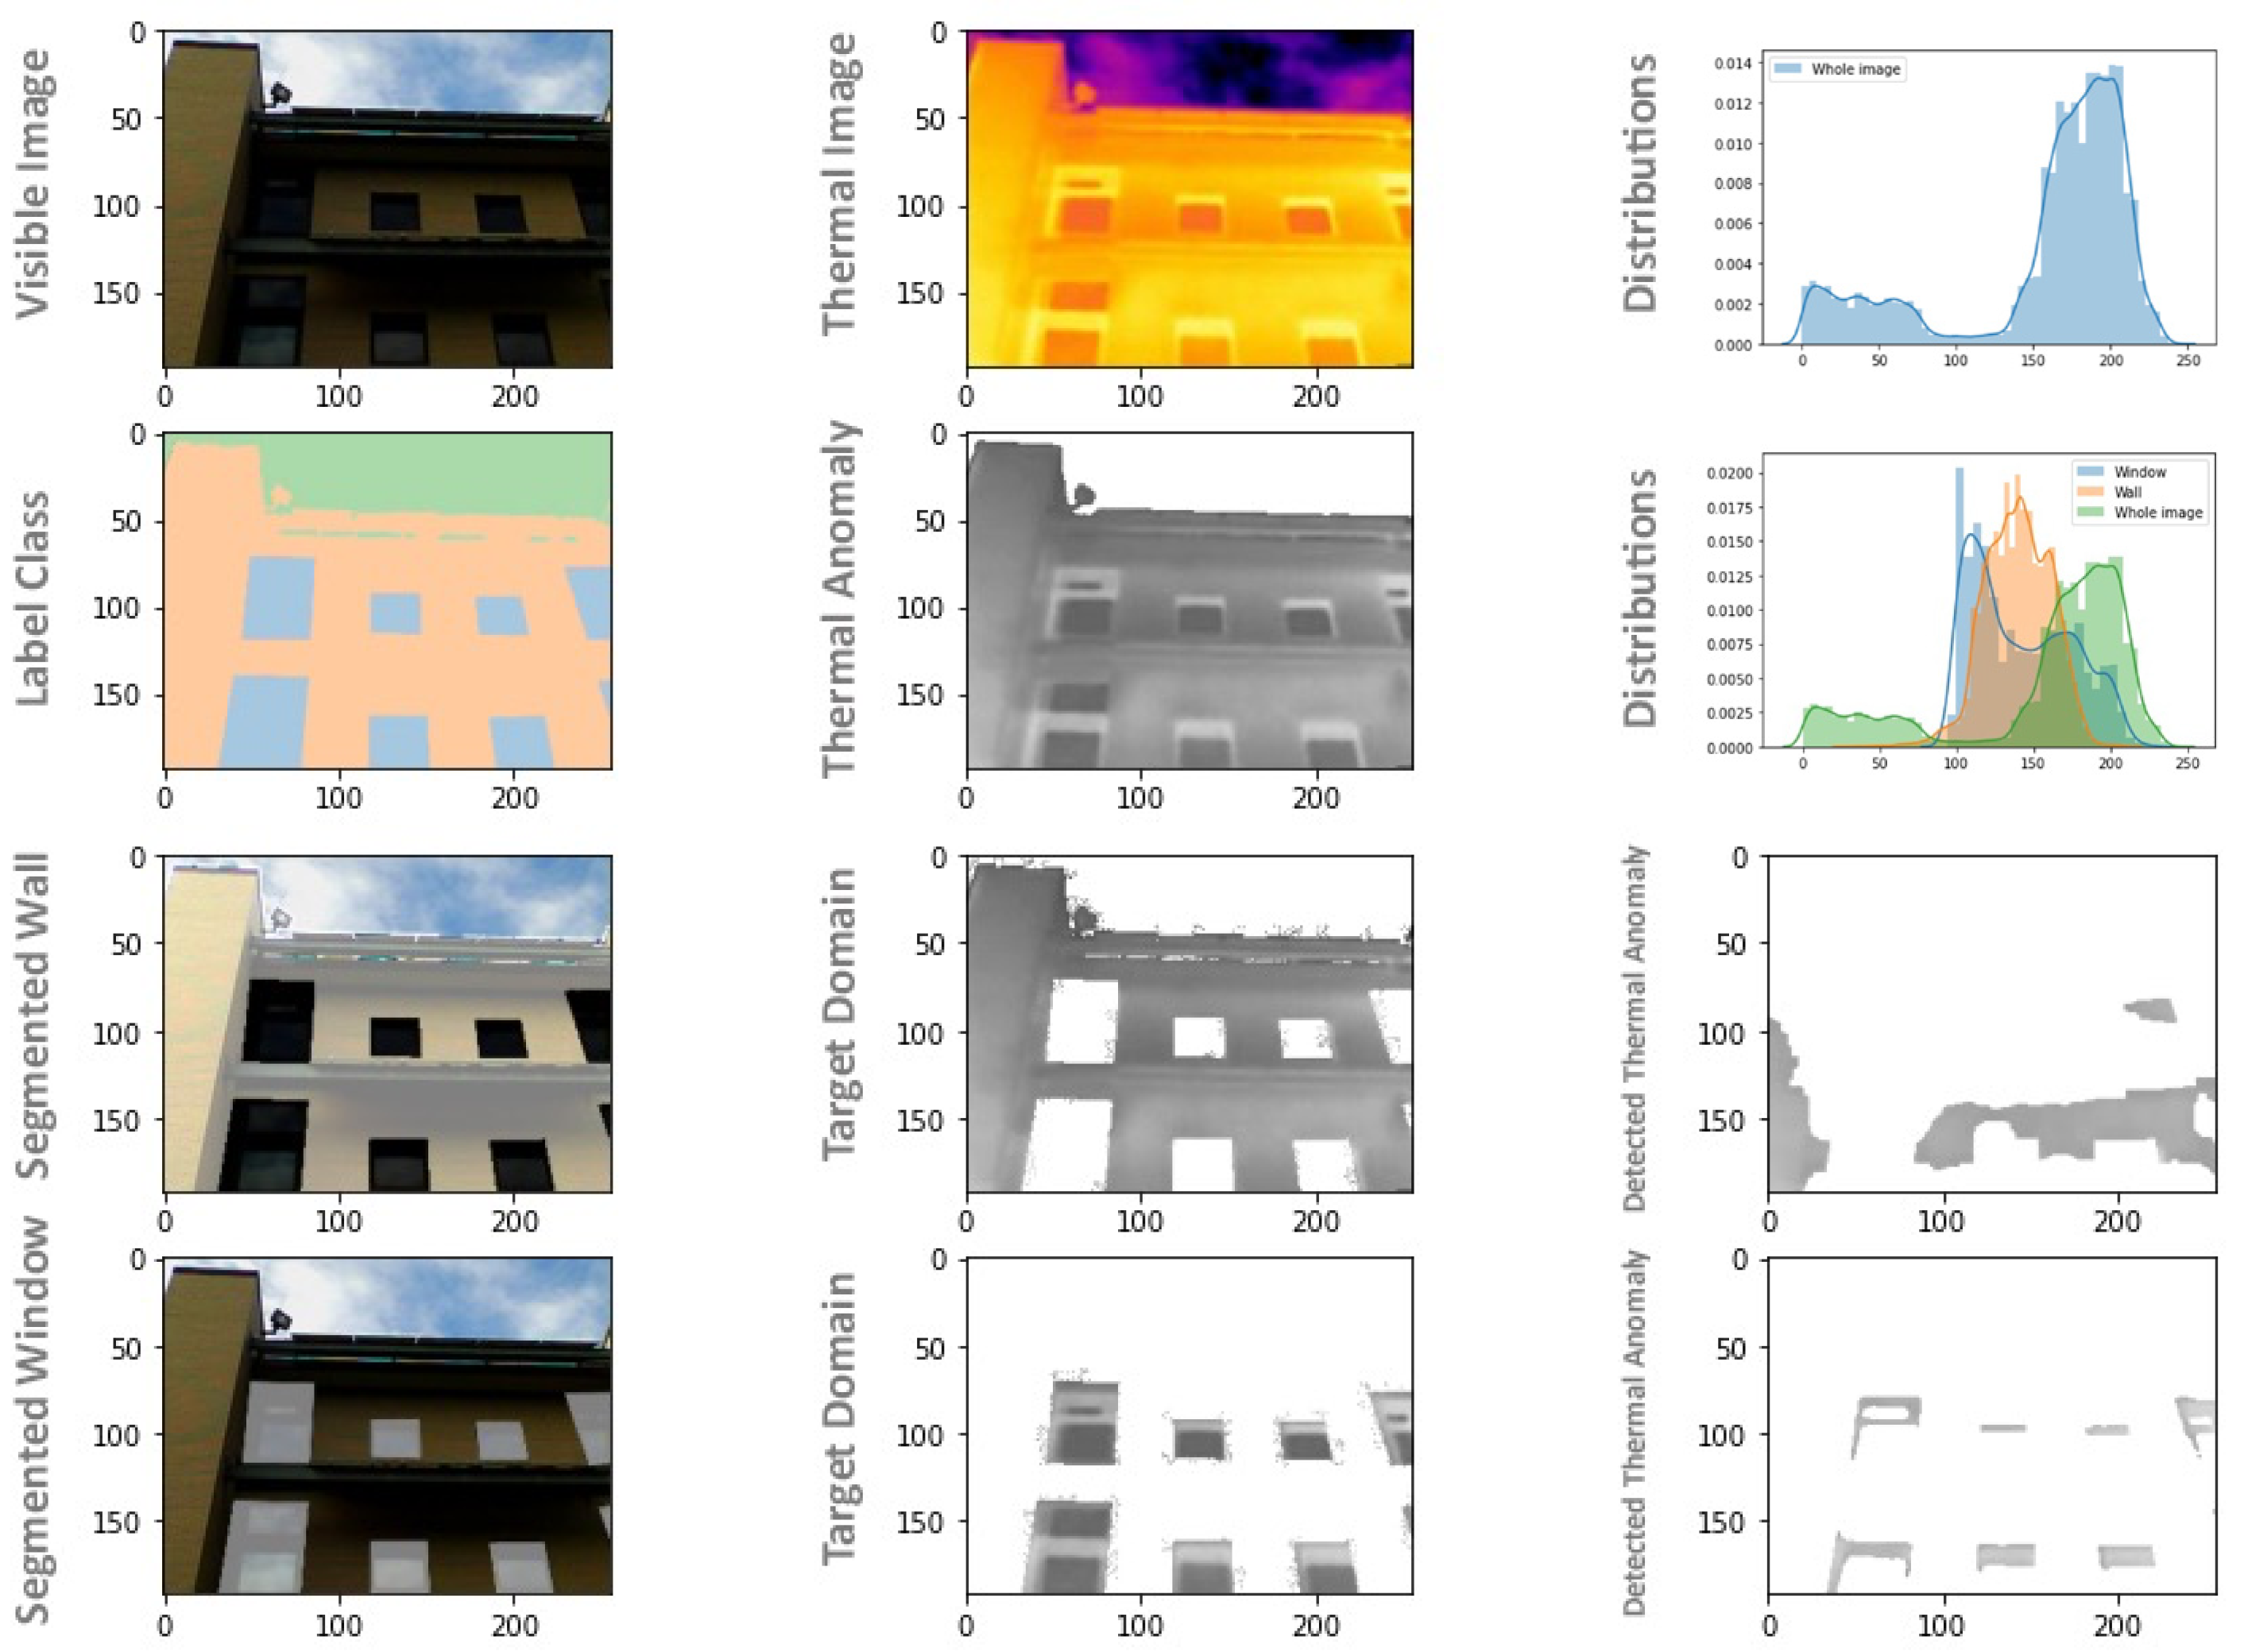
Sample 9 (Figure 16) illustrates a portion of the two top floors of the building in addition to sky presence. In the first step for the whole image, the whole building was detected as anomaly that would not seem to be correct. However, after segmentation, the performance was clearly improved. The cases of deterioration for the wall and losses around the window are the results of the detection procedure provided by this example.
Both of the thermal anomaly detection frameworks were tested. The model is expected to perform well on precision and recall measures for a detection task. A higher precision score means that most of the detections are actual leakages, while a higher recall score means that most of the actual anomalies are detected. The importance of these measures can differ based on the needs of the application. The first algorithm was applied, and it successfully detected 76 of identified anomaly regions, and missed 29 thermal anomalies. The workflow also reported 30 regions that are considered false positives.
The first method resulted in precision and recall rates of 72% and 72%, respectively. For the second algorithm (with segmented building envelope information), it successfully detected 92 of identified anomaly regions, and missed 13 thermal anomalies, and reported 8 false positives. The second method resulted in precision and recall rates of 92% and 88%, respectively.
The significantly higher precision indicated that it is much better at correctly identifying true anomalies and minimizing false positives. This means that when this algorithm reports a thermal anomaly, it is highly likely to be a true anomaly. The second algorithm has a higher recall meaning it detects most of the actual anomalies. This demonstrates its ability to identify most of the true anomalies, reducing the number of missed anomalies (false negatives). This improvement is due to the algorithm’s ability to handle the distinct thermal properties of different target domains. However, the first algorithm still has its place in scenarios where a quick, broad analysis is sufficient or where resources are constrained. The choice between the two methods should be guided by the specific needs of the application (e.g., energy retrofits), considering factors such as the required accuracy, available resources, and the complexity of the building being analyzed.
While the current study focuses on a single campus building, the modularity of the proposed workflow makes it adaptable to a wide range of building types. The segmentation component can be retrained with new annotated datasets to accommodate diverse façade configurations and materials. Moreover, since the method operates on visible and thermal imagery, it is transferable across geographic regions and climates, provided adjustments are made for environmental conditions such as emissivity, solar exposure, and weather impacts on thermal imaging. These aspects are critical for future scaling and deployment in varied inspection contexts.

5. Conclusions

This study presents a novel, automated, and vision-based workflow for detecting thermal anomalies in building envelopes, integrating drone-based data collection, infrared thermography, and deep learning-based semantic segmentation. The methodology was applied to a university campus building using visible and thermal imagery captured by UAVs. By employing U-Net segmentation to isolate façade components, such as walls and windows, the framework enables component-specific anomaly detection, improving both precision and reliability. Key findings and contributions include the following:
  • Developed and validated a deep learning-enhanced workflow for building envelope inspection using RGB and thermal images.
  • Achieved significant improvements in detection performance using semantic segmentation: precision increased from 72% to 92% and recall from 72% to 88%.
  • Demonstrated the ability to distinguish thermal anomalies at the component level (e.g., wall vs. window), reducing false positives and enhancing interpretability.
  • Quantified the trade-off in computational time (6 h for segmentation) and data storage (13% increase in dataset size), which is justified by performance gains.
  • By addressing the high costs, lengthy inspection times, and safety risks of traditional methods, our approach significantly improves the practicality and efficiency of building envelope diagnostics. The ability to quickly and accurately detect defects, such as thermal anomalies, including thermal bridges and air leakage, using drone-based imagery and automated processing makes this method well-suited for energy retrofit assessments. The proposed method can be applied not only for pre-retrofit diagnostics but also for post-retrofit verification of envelope improvements. It enables building owners and energy auditors to prioritize retrofit interventions more effectively and to scale inspections across portfolios of buildings with reduced labor and cost.
To further improve the accuracy of the segmentation task, future research should focus on expanding the dataset used for training deep learning models. A larger and more diverse dataset, incorporating different building types and façade conditions, will enhance the model’s ability to generalize. Given its reliance on drone imagery, open-source tools, and modular steps, the proposed workflow is scalable and adaptable to other building inspection scenarios, especially when tailored training data and calibration are applied to local contexts.

Author Contributions

Conceptualization, S.M. and R.R.; methodology, S.M. and R.R.; software, S.M.; validation, S.M. and R.R.; formal analysis, S.M.; investigation, S.M.; resources, R.R. and P.C.; data curation, S.M.; writing—original draft preparation, S.M.; writing—review and editing, S.M., R.R. and P.C.; visualization, S.M.; supervision, R.R. and P.C.; project administration, S.M. All authors have read and agreed to the published version of the manuscript.

Funding

This research received no external funding.

Data Availability Statement

The data and code used in this study are available from the corresponding author and can be shared upon reasonable request.

Conflicts of Interest

Author Ryan Razkenari was employed by the company Amazon. The remaining authors declare that the research was conducted in the absence of any commercial or financial relationships that could be construed as a potential conflict of interest.

Nomenclature

CNNConvolutional Neural Network
FAAFederal Aviation Administration
FCNFully Convolutional Network
FNFalse Negative
FPFalse Positive
HSVHue, Saturation, Value
IoUIntersection over Union
IRInfrared
LAANCLow Altitude Authorization and Notification Capability
RCNNRegion Based Convolutional Neural Networks
RGBRed, Green, Blue
SLAMSimultaneous Localization and Mapping
TNTrue Negative
TPTrue Positive
TPRTrue Positive Rate
TNRTrue Negative Rate
UAVUnmanned Aerial Vehicle

References

  1. United Nation Environment Programme (UNEP). Global Status Report: Towards a Zero-Emission, Efficient, and Resilient Buildings and Construction Sector; United Nation Environment Programme (UNEP): Nairobi, Kenya, 2017. [Google Scholar]
  2. United States Department of Energy. Increasing Efficiency of Building Systems and Technologies. In Quadrennial Technology Review; The United States Department of Energy: Washington, DC, USA, 2015. [Google Scholar]
  3. Mirzabeigi, S.; Razkenari, M. Multiple Benefits through Residential Building Energy Retrofit and Thermal Resilient Design. In Proceedings of the 2022 (6th) Residential Building Design & Construction Conference, University Park, PA, USA, 11 May 2022; pp. 456–465. [Google Scholar]
  4. Mirzabeigi, S.; Homaei, S.; Razkenari, M.; Hamdy, M. The Impact of Building Retrofitting on Thermal Resilience Against Power Failure: A Case of Air-Conditioned House. In Proceedings of the Environmental Science and Engineering, Leuven, Belgium, 8–10 September 2023; Springer Science and Business Media Deutschland GmbH: Singapore, 2023; pp. 2609–2619. [Google Scholar]
  5. Shapiro, I. Energy Audits in Large Commercial Office Buildings. ASHRAE J. 2009, 51, 18. [Google Scholar]
  6. Lucchi, E. Applications of the Infrared Thermography in the Energy Audit of Buildings: A Review. Renew. Sustain. Energy Rev. 2018, 82, 3077–3090. [Google Scholar] [CrossRef]
  7. Kylili, A.; Fokaides, P.A.; Christou, P.; Kalogirou, S.A. Infrared Thermography (IRT) Applications for Building Diagnostics: A Review. Appl. Energy 2014, 134, 531–549. [Google Scholar] [CrossRef]
  8. BRE Group. The Importance of Thermal Bridging. Available online: https://tools.bregroup.com/certifiedthermalproducts/page.jsp?id=3073 (accessed on 24 July 2025).
  9. Mirzabeigi, S.; Khalili Nasr, B.; Mainini, A.G.; Blanco Cadena, J.D.; Lobaccaro, G. Tailored WBGT as a Heat Stress Index to Assess the Direct Solar Radiation Effect on Indoor Thermal Comfort. Energy Build. 2021, 242, 110974. [Google Scholar] [CrossRef]
  10. Taylor, T.; Counsell, J.; Gill, S. Energy Efficiency Is More than Skin Deep: Improving Construction Quality Control in New-Build Housing Using Thermography. Energy Build. 2013, 66, 222–231. [Google Scholar] [CrossRef]
  11. Ficapal, A.; Mutis, I. Framework for the Detection, Diagnosis, and Evaluation of Thermal Bridges Using Infrared Thermography and Unmanned Aerial Vehicles. Buildings 2019, 9, 179. [Google Scholar] [CrossRef]
  12. Janssens, A.; Van Londersele, E.; Vandermarcke, B.; Roels, S.; Standaert, P.; Wouters, P. Development of Limits for the Linear Thermal Transmittance of Thermal Bridges in Buildings. In Proceedings of the 10th Thermal Performance of the Exterior Envelopes of Whole Buildings Conference: 30 Years of Research, Clearwater, FL, USA, 2–7 December 2007; American Society of Heating, Refrigerating and Air-Conditioning Engineers: Atlanta, GA, USA, 2007. [Google Scholar]
  13. Rakha, T.; Liberty, A.; Gorodetsky, A.; Kakillioglu, B.; Velipasalar, S. Heat Mapping Drones: An Autonomous Computer-Vision-Based Procedure for Building Envelope Inspection Using Unmanned Aerial Systems (UAS). Technol.|Archit. + Des. 2018, 2, 30–44. [Google Scholar] [CrossRef]
  14. De Filippo, M.; Asadiabadi, S.; Ko, N.; Sun, H. Concept of Computer Vision Based Algorithm for Detecting Thermal Anomalies in Reinforced Concrete Structures. In Proceedings of the 15th International Workshop on Advanced Infrared Technology and Applications (AITA 2019), Florence, Italy, 16–19 September 2019. [Google Scholar]
  15. Asdrubali, F.; Baldinelli, G.; Bianchi, F.; Costarelli, D.; Rotili, A.; Seracini, M.; Vinti, G. Detection of Thermal Bridges from Thermographic Images by Means of Image Processing Approximation Algorithms. Appl. Math. Comput. 2018, 317, 160–171. [Google Scholar] [CrossRef]
  16. Garrido, I.; Lagüela, S.; Arias, P.; Balado, J. Thermal-Based Analysis for the Automatic Detection and Characterization of Thermal Bridges in Buildings. Energy Build. 2018, 158, 1358–1367. [Google Scholar] [CrossRef]
  17. Park, G.; Lee, M.; Jang, H.; Kim, C. Thermal Anomaly Detection in Walls via CNN-Based Segmentation. Autom. Constr. 2021, 125, 103627. [Google Scholar] [CrossRef]
  18. Baldinelli, G.; Bianchi, F.; Rotili, A.; Costarelli, D.; Seracini, M.; Vinti, G.; Asdrubali, F.; Evangelisti, L. A Model for the Improvement of Thermal Bridges Quantitative Assessment by Infrared Thermography. Appl. Energy 2018, 211, 854–864. [Google Scholar] [CrossRef]
  19. Garrido, I.; Lagüela, S.; Arias, P. Autonomous Thermography: Towards the Automatic Detection and Classification of Building Pathologies. In Proceedings of the 14th Quantitative InfraRed Thermography Conference Autonomous, Berlin, Germany, 25–29 June 2018. [Google Scholar]
  20. Kim, C.; Choi, J.; Jang, H.; Kim, E. Automatic Detection of Linear Thermal Bridges from Infrared Thermal Images Using Neural Network. Appl. Sci. 2021, 11, 931. [Google Scholar] [CrossRef]
  21. Mirzabeigi, S.; Zhang, J.; Razkenari, M. Exterior Retrofitting Systems for Energy Conservation and Efficiency in Cold Climates: A Systematic Review. In Proceedings of the Environmental Science and Engineering, Leuven, Belgium, 8–10 September 2023; Springer Science and Business Media Deutschland GmbH: Singapore, 2023; pp. 413–422. [Google Scholar]
  22. Aly, A.A.; Deris, S.B.; Zaki, N. Research review for digital image segmentation techniques. Int. J. Comput. Sci. Inf. Technol. (IJCSIT) 2011, 3, 99–106. [Google Scholar] [CrossRef]
  23. Guo, Y.; Liu, Y.; Georgiou, T.; Lew, M.S. A Review of Semantic Segmentation Using Deep Neural Networks. Int. J. Multimed. Inf. Retr. 2018, 7, 87–93. [Google Scholar] [CrossRef]
  24. Girshick, R.; Donahue, J.; Darrell, T.; Berkeley, U.C.; Malik, J. Rich Feature Hierarchies for Accurate Object Detection and Semantic Segmentation. In Proceedings of the 2014 IEEE Conference on Computer Vision and Pattern Recognition (CVPR), Columbus, OH, USA, 23–28 June 2014. [Google Scholar]
  25. Long, J.; Shelhamer, E.; Darrell, T. Fully Convolutional Networks for Semantic Segmentation. In Proceedings of the 2015 IEEE Conference on Computer Vision and Pattern Recognition (CVPR), Boston, MA, USA, 8–10 June 2015; Volume 39. [Google Scholar]
  26. Eigen, D.; Fergus, R. Predicting Depth, Surface Normals and Semantic Labels with a Common Multi-Scale Convolutional Architecture. In Proceedings of the ICCV, Washington, DC, USA, 7–13 December 2015; pp. 2650–2658. [Google Scholar]
  27. Dai, J.; He, K.; Sun, J. BoxSup: Exploiting Bounding Boxes to Supervise Convolutional Networks for Semantic Segmentation. In Proceedings of the ICCV, Washington, DC, USA, 7–13 December 2015; pp. 1635–1643. [Google Scholar]
  28. Pinheiro, P.O.; Collobert, R.; Epfl, D.L. From Image-Level to Pixel-Level Labeling with Convolutional Networks. In Proceedings of the CVPR, Boston, MA, USA, 7–12 June 2015; pp. 1713–1721. [Google Scholar]
  29. Reznik, S.; Mayer, H. Implicit Shape Models, Self-Diagnosis, and Model Selection for 3D Facade Interpretation. Photogramm.-Fernerkund.-Geoinf. 2008, 3, 187–196. [Google Scholar]
  30. Rahmani, K.; Mayer, H. High quality facade segmentation based on structured random forest, region proposal network and rectangular fitting. In Proceedings of the ISPRS Annals of the Photogrammetry, Remote Sensing and Spatial Information Sciences, Karlsruhe, Germany, 10–12 October 2018; Copernicus GmbH: Göttingen, Germany, 2018; Volume 4, pp. 223–230. [Google Scholar]
  31. Badrinarayanan, V.; Kendall, A.; Cipolla, R. SegNet: A Deep Convolutional Encoder-Decoder Architecture for Image Segmentation. IEEE Trans. Pattern Anal. Mach. Intell. 2017, 39, 2481–2495. [Google Scholar] [CrossRef]
  32. Ronneberger, O.; Fischer, P.; Brox, T. U-Net: Convolutional Networks for Biomedical Image Segmentation; Springer: Cham, Switzerland, 2015. [Google Scholar]
  33. Dai, M.; Meyers, G.; Tingley, D.D.; Dai, M.; Meyers, G.; Tingley, D.D.; Mayfield, M. Initial Investigations into Using an Ensemble of Deep Neural Networks for Building Façade Image Semantic Segmentation. In Proceedings of the SPIE Remote Sensing, Strasbourg, France, 9–12 September 2019; Volume 11157. [Google Scholar]
  34. Agapaki, E.; Nahangi, M. Scene Understanding and Model Generation. In Infrastructure Computer Vision; Elsevier Inc.: Amsterdam, The Netherlands, 2020; pp. 65–167. ISBN 9780128155035. [Google Scholar]
  35. Zhang, J.; Zhao, X.; Chen, Z.; Lu, Z. A Review of Deep Learning-Based Semantic Segmentation for Point Cloud. IEEE Access 2019, 7, 179118–179133. [Google Scholar] [CrossRef]
  36. Mirzabeigi, S.; Razkenari, R.; Crovella, P. A Review of the Potential of Drone-Based Approaches for Integrated Building Envelope Assessment. Buildings 2025, 15, 2230. [Google Scholar] [CrossRef]
  37. Waqas, A.; Araji, T. Machine learning-aided thermography for autonomous heat loss detection in buildings. Energy Energy Convers. Manag. 2024, 304, 118243. [Google Scholar] [CrossRef]
  38. Li, Q.; Peng, X.; Zhong, X.; Xiao, X.; Wang, H.; Zhao, C.; Zhou, K. Quantitative identification of debonding defects in building façades based on UAV-thermography using a two-stage network integrating dual attention mechanism. Infrared Phys. Technol. 2024, 138, 105241. [Google Scholar] [CrossRef]
  39. Lin, D.; Yang, N.; Miao, Q.; Cui, X.; Xu, D. True 3D thermal inspection of buildings using multimodal UAV images. J. Build. Eng. 2025, 100, 111806. [Google Scholar] [CrossRef]
  40. Federal Aviation Administration. Become a Drone Pilot. Available online: https://www.faa.gov/uas/commercial_operators/become_a_drone_pilot (accessed on 24 July 2025).
  41. Rakha, T.; Gorodetsky, A. Review of Unmanned Aerial System (UAS) Applications in the Built Environment: Towards Automated Building Inspection Procedures Using Drones. Autom. Constr. 2018, 93, 252–264. [Google Scholar] [CrossRef]
  42. Mirzabeigi, S.; Razkenari, M. Automated Vision-Based Building Inspection Using Drone Thermography. In Proceedings of the Construction Research Congress 2022: Computer Applications, Automation, and Data Analytics, Arlington, VA, USA, 9–12 March 2022; American Society of Civil Engineers (ASCE): Reston, VA, USA, 2022; Volume 2-B, pp. 737–746. [Google Scholar]
  43. Bradski, G. The OpenCV Library. Dr. Dobb’s J. Softw. Tools 2000, 120, 122–125. [Google Scholar]
  44. Harris, C.R.; Millman, K.J.; Van Der Walt, S.J.; Gommers, R.; Virtanen, P.; Cournapeau, D.; Wieser, E.; Taylor, J.; Berg, S.; Smith, N.J.; et al. Array Programming with NumPy. Nature 2020, 585, 357–362. [Google Scholar] [CrossRef] [PubMed]
  45. Pedregosa, F.; Varoquaux, G.; Gramfort, A.; Michel, V.; Thirion, B. Scikit-Learn: Machine Learning in Python. J. Mach. Learn. Res. 2011, 12, 2825–2830. [Google Scholar]
  46. Dai, M.; Ward, W.O.C.; Meyers, G.; Densley, D.; Mayfield, M. Residential Building Facade Segmentation in the Urban Environment. Build. Environ. 2021, 199, 107921. [Google Scholar] [CrossRef]
  47. Karthik, G. Image Segmentation with Unet Pytorch. Available online: https://www.kaggle.com/gokulkarthik/image-segmentation-with-unet-pytorch (accessed on 24 July 2025).
  48. Mirzabeigi, S.; Razkenari, M.; Crovella, P. Automated Thermal Anomaly Detection through Deep Learning-based Semantic Segmentation of Building Envelope Images. In Proceedings of the ASCE International Conference on Computing in Civil Engineering (i3CE 2024), Pittsburgh, PA, USA, 28–31 July 2024. [Google Scholar]
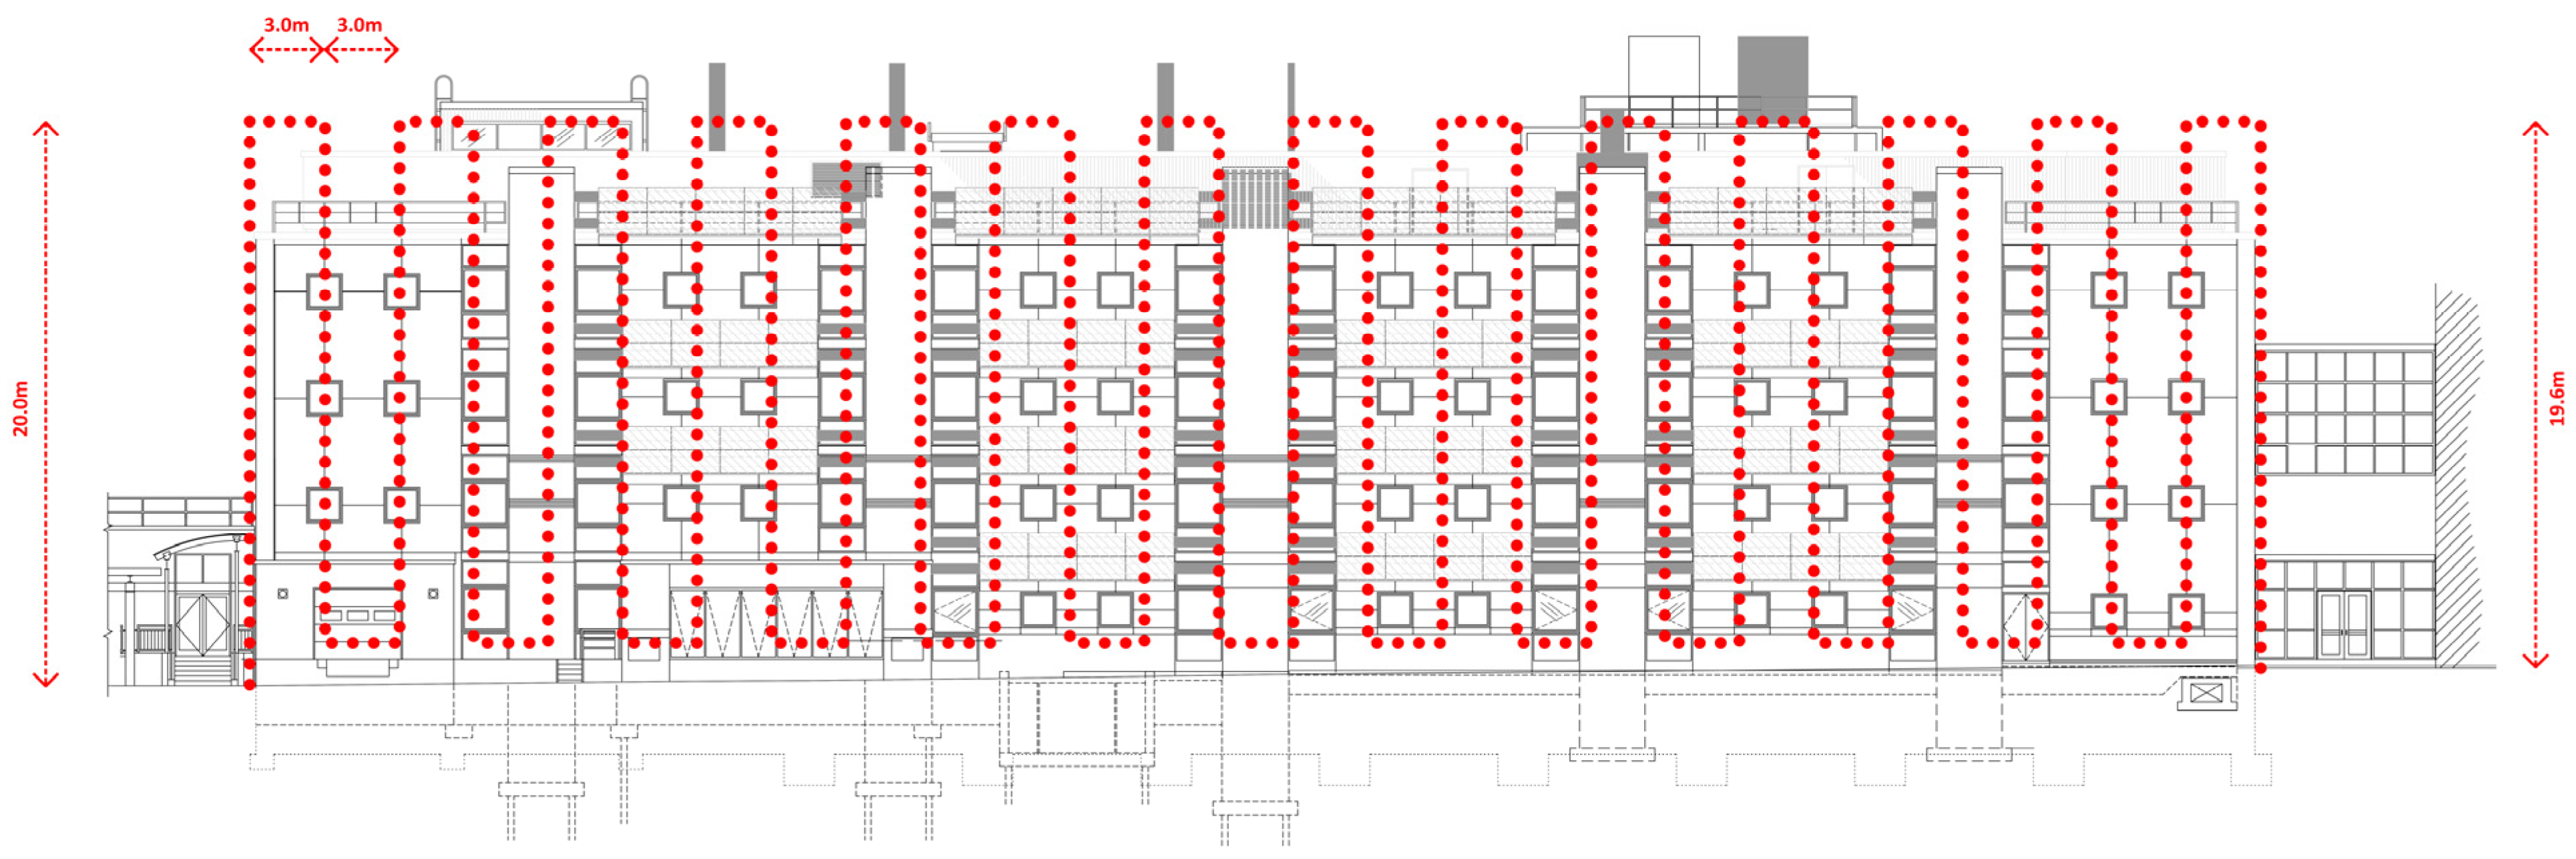
Figure 1. Vertical flight path for building inspection. Adapted with permission from [42].
Buildings 15 02672 g001
Figure 2. Overview to the steps of computer vision implementation for thermal anomaly detection based on whole image. Adapted with permission from [42].
Buildings 15 02672 g002
Figure 3. Overall workflow for thermal anomaly detection based on segmented envelope images.
Buildings 15 02672 g003
Figure 4. Probability distribution and anomaly threshold detection approach. Adapted with permission from [17].
Buildings 15 02672 g004
Figure 5. The U-Net model architecture. Adapted with permission from [33].
Buildings 15 02672 g005
Figure 6. LabelMe annotation example.
Buildings 15 02672 g006
Figure 7. Annotated image examples.
Buildings 15 02672 g007aBuildings 15 02672 g007b
Figure 8. Walls class prediction examples from thresholding method.
Buildings 15 02672 g008
Figure 9. Windows class prediction examples from thresholding method.
Buildings 15 02672 g009
Figure 10. Walls and windows class prediction examples from K-Means clustering.
Buildings 15 02672 g010
Figure 11. Wall and window prediction examples from U-Net model.
Buildings 15 02672 g011
Figure 12. Example of RGB and thermal images taken with the drone thermography and the final detected thermal anomalies on the whole images. Adapted with permission from [42].
Buildings 15 02672 g012
Figure 13. Example of RGB and thermal images taken with the FLIR camera and the final detected thermal anomalies on the whole images. Adapted with permission from [42].
Buildings 15 02672 g013
Figure 14. RGB and thermal images (sample 7) and the anomaly detected for the whole image, in addition to targeted segmented walls and windows with the final results of detected thermal anomaly for those domains. Adapted with permission from [48].
Buildings 15 02672 g014
Figure 15. RGB and thermal images (sample 8) and the anomaly detected for the whole image, in addition to targeted segmented walls and windows with the final results of detected thermal anomaly for those domains. Adapted with permission from [48].
Buildings 15 02672 g015
Figure 16. Visible and thermal images (sample 9) and the anomaly detected for the whole image, in addition to targeted segmented walls and windows with the final results of detected thermal anomaly for those domains. Adapted with permission from [48].
Buildings 15 02672 g016
Table 1. Comparison of the pre deep learning segmentation methods. Adapted with permission from [22].
MethodAdvantageDisadvantage
Inverse dynamics method
-
Helping in accurately modeling and predicting object movements.
-
Enhancing segmentation quality in dynamic scenes.
-
Using a nonlinear optimizer.
-
Requiring substantial computational resources and complex algorithms, making it less efficient for real-time applications.
-
Being appropriate for scenarios with significant motion dynamics, and less effective for static scenes.
Active contour method
-
Detecting and refining object boundaries very well, leading to precise segmentation results.
-
Preserving global line shapes efficiently, and being adaptable to various shapes and sizes.
-
Requiring careful initialization; poor initial placement can lead to suboptimal segmentation results.
-
Lacking accuracy with weak image boundaries and image noise.
Watersheds Method
-
Being effective at segmenting distinct regions based on gradient information, providing clear and accurate boundaries.
-
handling noise in images very well, making it useful for images with varying intensity.
-
Helping to improve the capture range.
-
Over segmentation.
-
Requiring preprocessing steps, making it less straightforward to apply.
Novel edge-based method
-
Computationally efficient, making it suitable for real-time applications and large datasets.
-
depending on the assumption that the deformation and movement of the tracked object is small between the frames.
-
Being sensitive to noise and small variations in the image, potentially leading to inaccuracies in segmentation.
Topological alignments method
-
Maintaining the topological structure of objects, ensuring that connected components and other topological features are accurately segmented.
-
Handling variations and deformations in object shapes well, making it suitable for complex and irregular objects.
-
Complicated and computationally intensive.
Pattern Recognition method
-
Being capable of achieving high accuracy in segmenting objects based on learned patterns and features.
-
Adaptability to various types of data and applications, improving performance through training on diverse datasets.
-
Requiring large amounts of labeled training data.
-
Complicated.
Threshold method
-
Trying to find edge pixels while eliminate the noise influence.
-
Being easy to implement and understand, requiring minimal computational resources.
-
Using gradient magnitude to find the potential edge pixels.
-
sensitivity to lighting conditions which can lead to inaccurate segmentations.
-
Not being effective for complex images with varying intensities or when objects have overlapping intensity ranges.
Region-based method
-
Segmenting images by grouping pixels into regions with similar properties
-
Being effective for homogeneous regions.
-
Struggling with boundaries and regions with varying intensity.
-
Sensitivity to noise and requiring post-processing.
Clustering-based method
-
Segmenting images by clustering pixels based on their features.
-
Being useful for multi-spectral and multi-modal data.
-
Requiring the selection of number of clusters.
-
Struggling with high-dimensional data.
Graph-based method
-
Representing the image as a graph allows for powerful segmentation techniques.
-
Handling arbitrary shapes and topologies.
-
Computationally intensive.
-
Requiring parameter tuning.
Morphological method
-
Using morphological operations to segment images is straightforward and effective.
-
Being appropriate for binary images and basic shape analysis.
-
Limited by the shape and size of the structuring element.
-
Not handling complex textures very well.
Template Matching
-
Being simple to implement and understand.
-
Requiring predefined templates.
-
Not being effective for detecting objects with significant variations or in cluttered scenes.
Level Set method
-
Being capable of capturing complex shapes and topologies.
-
Sensitivity to noise and requiring post-processing.
-
Computationally intensive.
Table 2. Summary of representative studies on thermal anomaly detection methods for building envelope inspection, including key methodologies, imaging modalities, application focus, and main findings.
StudyMethodologyImagingApplicationKey Findings
Rakha et al. (2018) [13]Dynamic thresholding + Canny edge + segmentationThermalDrone-based inspectionDetected leakage using dynamic thresholds and edge filtering; sky and background filtering needed
De Filippo et al. (2019) [14]CV-based filtering + Otsu thresholdingThermalConcrete structure defect detectionAutomated pipeline using thermal edges for anomaly detection
Asdrubali et al. (2018) [15]Sampling Kantorovich operatorThermalThermal bridge detectionBimodal temperature distribution used; thresholding based on histogram analysis
Park et al. (2021) [17]CNN-based segmentationThermal + RGBWall defect detectionImproved performance over traditional thresholding; limited to linear thermal bridges
Kim et al. (2021) [20]Neural network + clusteringThermalLinear thermal bridge detectionUsed artificial neural networks and shape clustering for classification
Garrido et al. (2018) [19]PCA + geometric analysisThermalThermal bridge quantificationUsed histogram and geometric boundaries to characterize defects
Waqas et al. (2024) [37]Deep residual CNNThermalBuilding façades inspectionAchieved high classification accuracy using supervised deep learning for automatic anomaly detection
Li et al. (2024) [38]YOLOv7Thermal + RGBThermal defect detectionReal-time thermal defect segmentation; robust performance under varying environmental conditions
Lin et al. (2025) [39]3D thermal-RGB point cloud fusionThermal + RGB3D inspection of façadesCreated 3D thermographic models from UAV imagery; enhanced fault localization and visualization
Table 3. Segmentation performance metrics for thresholding.
TypeAccuracyPrecisionRecallF1IoU
wall0.74420.93450.52970.65240.5143
window0.88750.61120.78090.68350.5205
Table 4. Segmentation performance metrics for K-Means clustering.
TypeAccuracyPrecisionRecallF1IoU
wall0.78180.75380.76550.75960.6124
window0.80120.37190.84960.84960.3489
Table 5. Segmentation performance metrics for U-Net model.
TypeAccuracyPrecisionRecallF1IoU
wall0.93130.93760.88930.91280.8396
window0.96390.85320.82510.83890.7225
Disclaimer/Publisher’s Note: The statements, opinions and data contained in all publications are solely those of the individual author(s) and contributor(s) and not of MDPI and/or the editor(s). MDPI and/or the editor(s) disclaim responsibility for any injury to people or property resulting from any ideas, methods, instructions or products referred to in the content.