Article

PC3D-YOLO: An Enhanced Multi-Scale Network for Crack Detection in Precast Concrete Components

1
School of Civil Engineering and Architecture, Wuhan Institute of Technology, Wuhan 430074, China
2
Wuhan Haidian Foreign Language Shi Yan School, Wuhan 430223, China
3
School of Computer Science and Engineering, Wuhan Institute of Technology, Wuhan 430205, China
*
Author to whom correspondence should be addressed.
Buildings 2025, 15(13), 2225; https://doi.org/10.3390/buildings15132225
Submission received: 14 May 2025 / Revised: 8 June 2025 / Accepted: 17 June 2025 / Published: 25 June 2025
(This article belongs to the Section Building Materials, and Repair & Renovation)

Abstract

Crack detection in precast concrete components aims to achieve precise extraction of crack features within complex image backgrounds. Current computer vision-based methods typically conduct limited local searches at a single scale, constraining the model’s capacity for feature extraction and fusion in information-rich environments. To address these limitations, we propose PC3D-YOLO, an enhanced framework derived from YOLOv11, which strengthens long-range dependency modeling through multi-scale feature integration, offering a novel approach for crack detection in precast concrete structures. Our methodology involves three key innovations: (1) the Multi-Dilation Spatial-Channel Fusion with Shuffling (MSFS) module, employing dilated convolutions and channel shuffling to enable global feature fusion, replaces the C3K2 bottleneck module to enhance long-distance dependency capture; (2) the AIFI_M2SA module substitutes the conventional SPPF to mitigate its restricted receptive field and information loss, incorporating multi-scale attention for improved near-far contextual integration; (3) a redesigned neck network (MSCD-Net) preserves rich contextual information across all feature scales. Experimental results demonstrate that, on the self-developed dataset, the proposed algorithm achieves a recall of 78.8%, an AP@50 of 86.3%, and an AP@50-95 of 65.6%, outperforming the YOLOv11 algorithm. Furthermore, evaluations on the CRACKS_MANISHA and DECA datasets also confirm the proposed model’s strong generalization capability across different data domains.

1. Introduction

With the demographic dividend gradually waning, labor costs and management expenses soaring, profit margins narrowing, and competition in the construction sector intensifying, traditional building industries’ high energy consumption and strong environmental impacts have become increasingly prominent under the “double carbon” policy [1]. Prefabricated construction has gained increasing significance in this context. Contrary to traditional construction, prefabricated buildings consist of components manufactured in factories that are assembled on-site through reliable connections. Compared to conventional cast-in-place concrete structures, prefabricated architecture boasts advantages such as faster construction speed, shorter duration, fewer wet work processes on the construction site, and lesser pollution [2].
However, precast concrete components, owing to the influence of multiple factors such as technology and management, exhibit prominent quality issues [3]. Common occurrences of component fractures resulting from product structural deficiencies and improper handling during transportation and installation have been observed [4,5]. These phenomena lead to a reduction in the local stiffness of components, causing discontinuities in materials, posing a significant threat to building safety [6]. However, traditional crack detection methodologies exhibit inefficiencies and subjectivity and fail to meet the requirements of actual engineering projects [7,8].
In recent years, with the rapid development of artificial intelligence technology, object detection techniques based on deep learning have demonstrated broad application prospects in various fields. Zhang et al. propose a Transformer object detection model based on multi-channel attention (MCCA) and dimensionality feature aggregation (DFAM), aiming to enhance the accuracy of detecting offending animals in images with occlusion or blur [9]. An et al. propose a model based on deep neural networks that utilize photo recognition to identify common edible nuts and estimate their nutritional components, enabling precise tracking of nut calorific content and nutrients [10]. Gan et al. proposed ARSFusion, a fusion network that realizes efficient integration of infrared and visible light images in road scenes under all-weather conditions through an adaptive feature aggregation mechanism that adjusts to varying lighting conditions [11]. Ha et al. tackled the challenge of detecting blocks in soil-retaining walls under diverse lighting conditions by integrating RGB enhancement with Mask R-CNN [12].
In this context, the YOLO series algorithms have garnered significant attention in the field of civil engineering, with Raushan et al. assessing the performance of YOLOv3-v10 in three distinct scenarios of architectural damage. The experimental results demonstrate the efficacy of the YOLO model in detecting and localizing multiple features within damaged backgrounds [13]. Jiang et al. proposed the Fast-YOLO object detection algorithm based on the YOLOv3 network architecture, enabling high-precision detection of concrete damage [14]. Gan et al. combined the YOLOv5-DeepSORT object tracking algorithm with deep parameter optimization for trajectory prediction, realizing dynamic assessment of worker safety risk levels [15].
Cracks are common structural defects in buildings and roads and have been extensively studied by numerous researchers. Pham et al. proposed a deep learning and image processing-based framework for the automatic detection and quantification of ground cracks [16]. Li et al. introduced a fusion model based on grid classification and box detection (GCBD) for asphalt pavement crack detection, addressing limitations of traditional methods in perceptual field coverage, topological optimization, and computational efficiency [17]. Zhu et al. designed a lightweight encoder–decoder network that enhances detection accuracy in complex backgrounds while supporting efficient model deployment [18]. Zheng et al. proposed the CAL-ISM framework, which tackles challenges such as high annotation costs, limited model generalization, and low accuracy in width measurement [19]. Dong et al. developed YOLOv5-AH, an improved version of YOLOv5 that achieves a balance between detection accuracy and inference speed in pavement crack detection [20]. Mayya et al. proposed a three-phase framework to address background interference in stone crack detection, achieving high-precision detection and classification [21]. Li et al. further introduced the OUR-Net algorithm, which decouples and fuses high- and low-frequency features of pavement cracks, significantly improving segmentation accuracy in complex scenes [22]. Huang et al. proposed a lightweight feature attention fusion network to reduce computational costs and enhance real-time performance in pavement crack segmentation [23]. Fan et al. developed a probabilistic fusion-based deep convolutional neural network model to address accuracy limitations and quantization requirements in crack detection and measurement tasks [24].
Previous studies have enhanced crack detection accuracy by incorporating attention mechanisms, multi-scale feature fusion, and network architecture optimization. However, most of these studies have concentrated on concrete crack detection under relatively simple conditions. For scenarios involving complex backgrounds, many approaches rely on image preprocessing techniques, such as adding artificial noise or adjusting image brightness. Nevertheless, these methods fall short of accurately replicating the real-world complexity encountered during actual production and manufacturing processes. In contrast, crack detection in precast concrete components involves several additional challenges, including the following:
(1) Precast concrete components typically contain numerous embedded holes and reserved steel bars to facilitate interconnection during construction [25,26]. These embedded holes often appear as prominent dark regions in images, while the reserved steel bars exhibit linear features that resemble cracks. Such characteristics substantially increase the complexity of accurate crack detection.
(2) In the production and transportation of precast concrete components, QR codes are often affixed to facilitate component management by recording relevant information [27]. However, due to their distinct linear structures and high contrast, QR codes can interfere with crack detection tasks. In particular, during the identification of shallow or hairline cracks, the model may mistakenly interpret the edges of QR code regions as cracks, leading to false positives.
(3) There is a lack of research in the application of existing crack detection algorithms to precast concrete components, as conventional feature extraction paradigms fail to effectively transfer to this specific scenario, resulting in limited detection effectiveness.
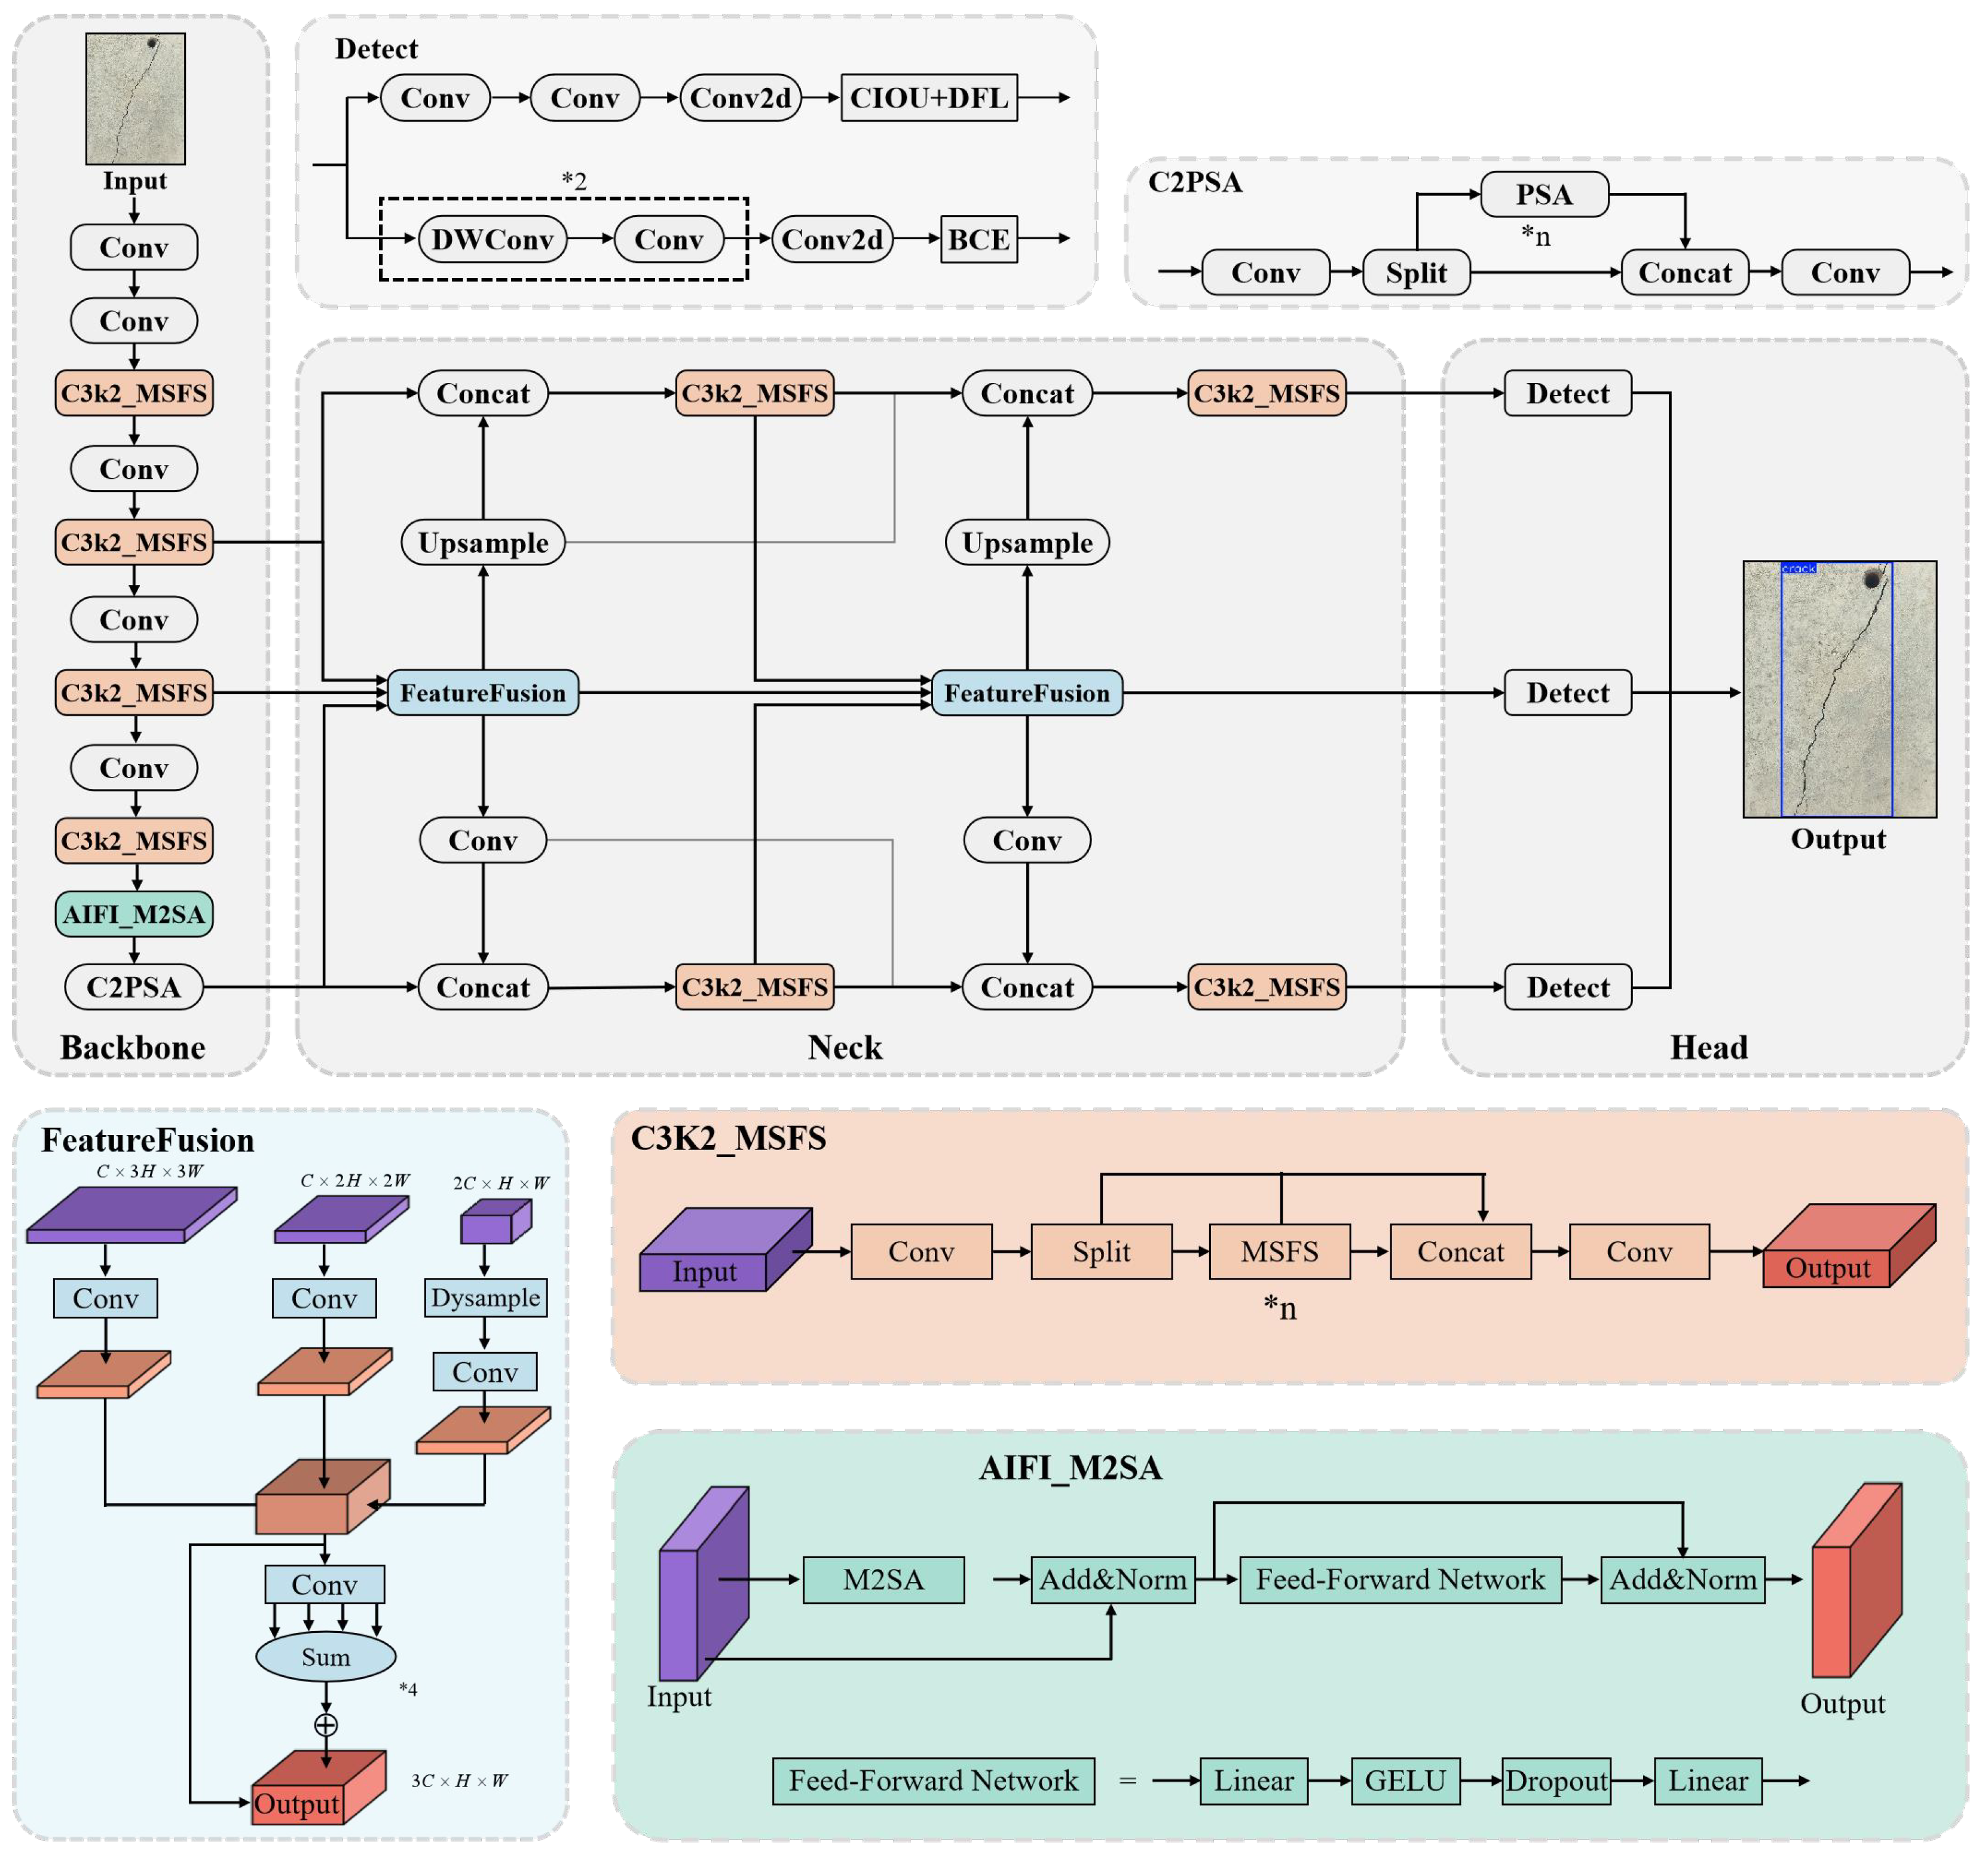
In light of these concerns, this paper presents a Precast Concrete Components Crack Detection Model (PC3D-YOLO), which is trained and validated on three datasets. The experimental results demonstrate that the PC3D-YOLO model possesses a larger reception field and enhanced cross-modal communication capability, mitigates the impact of max-pooling on feature extraction in the original model, and enables the model to capture more detailed contextual information for features of different sizes. The article’s principal contributions are as follows:
(1) This study integrates the precast concrete components’ crack images provided by Wuhan Construction New Building Materials Green Industry Science & Technology Co., Ltd., Wuhan, Hubei, China, with those from the SDNET2018 dataset, using the Labelimg software for image annotation. Ultimately, a dataset was constructed for this study.
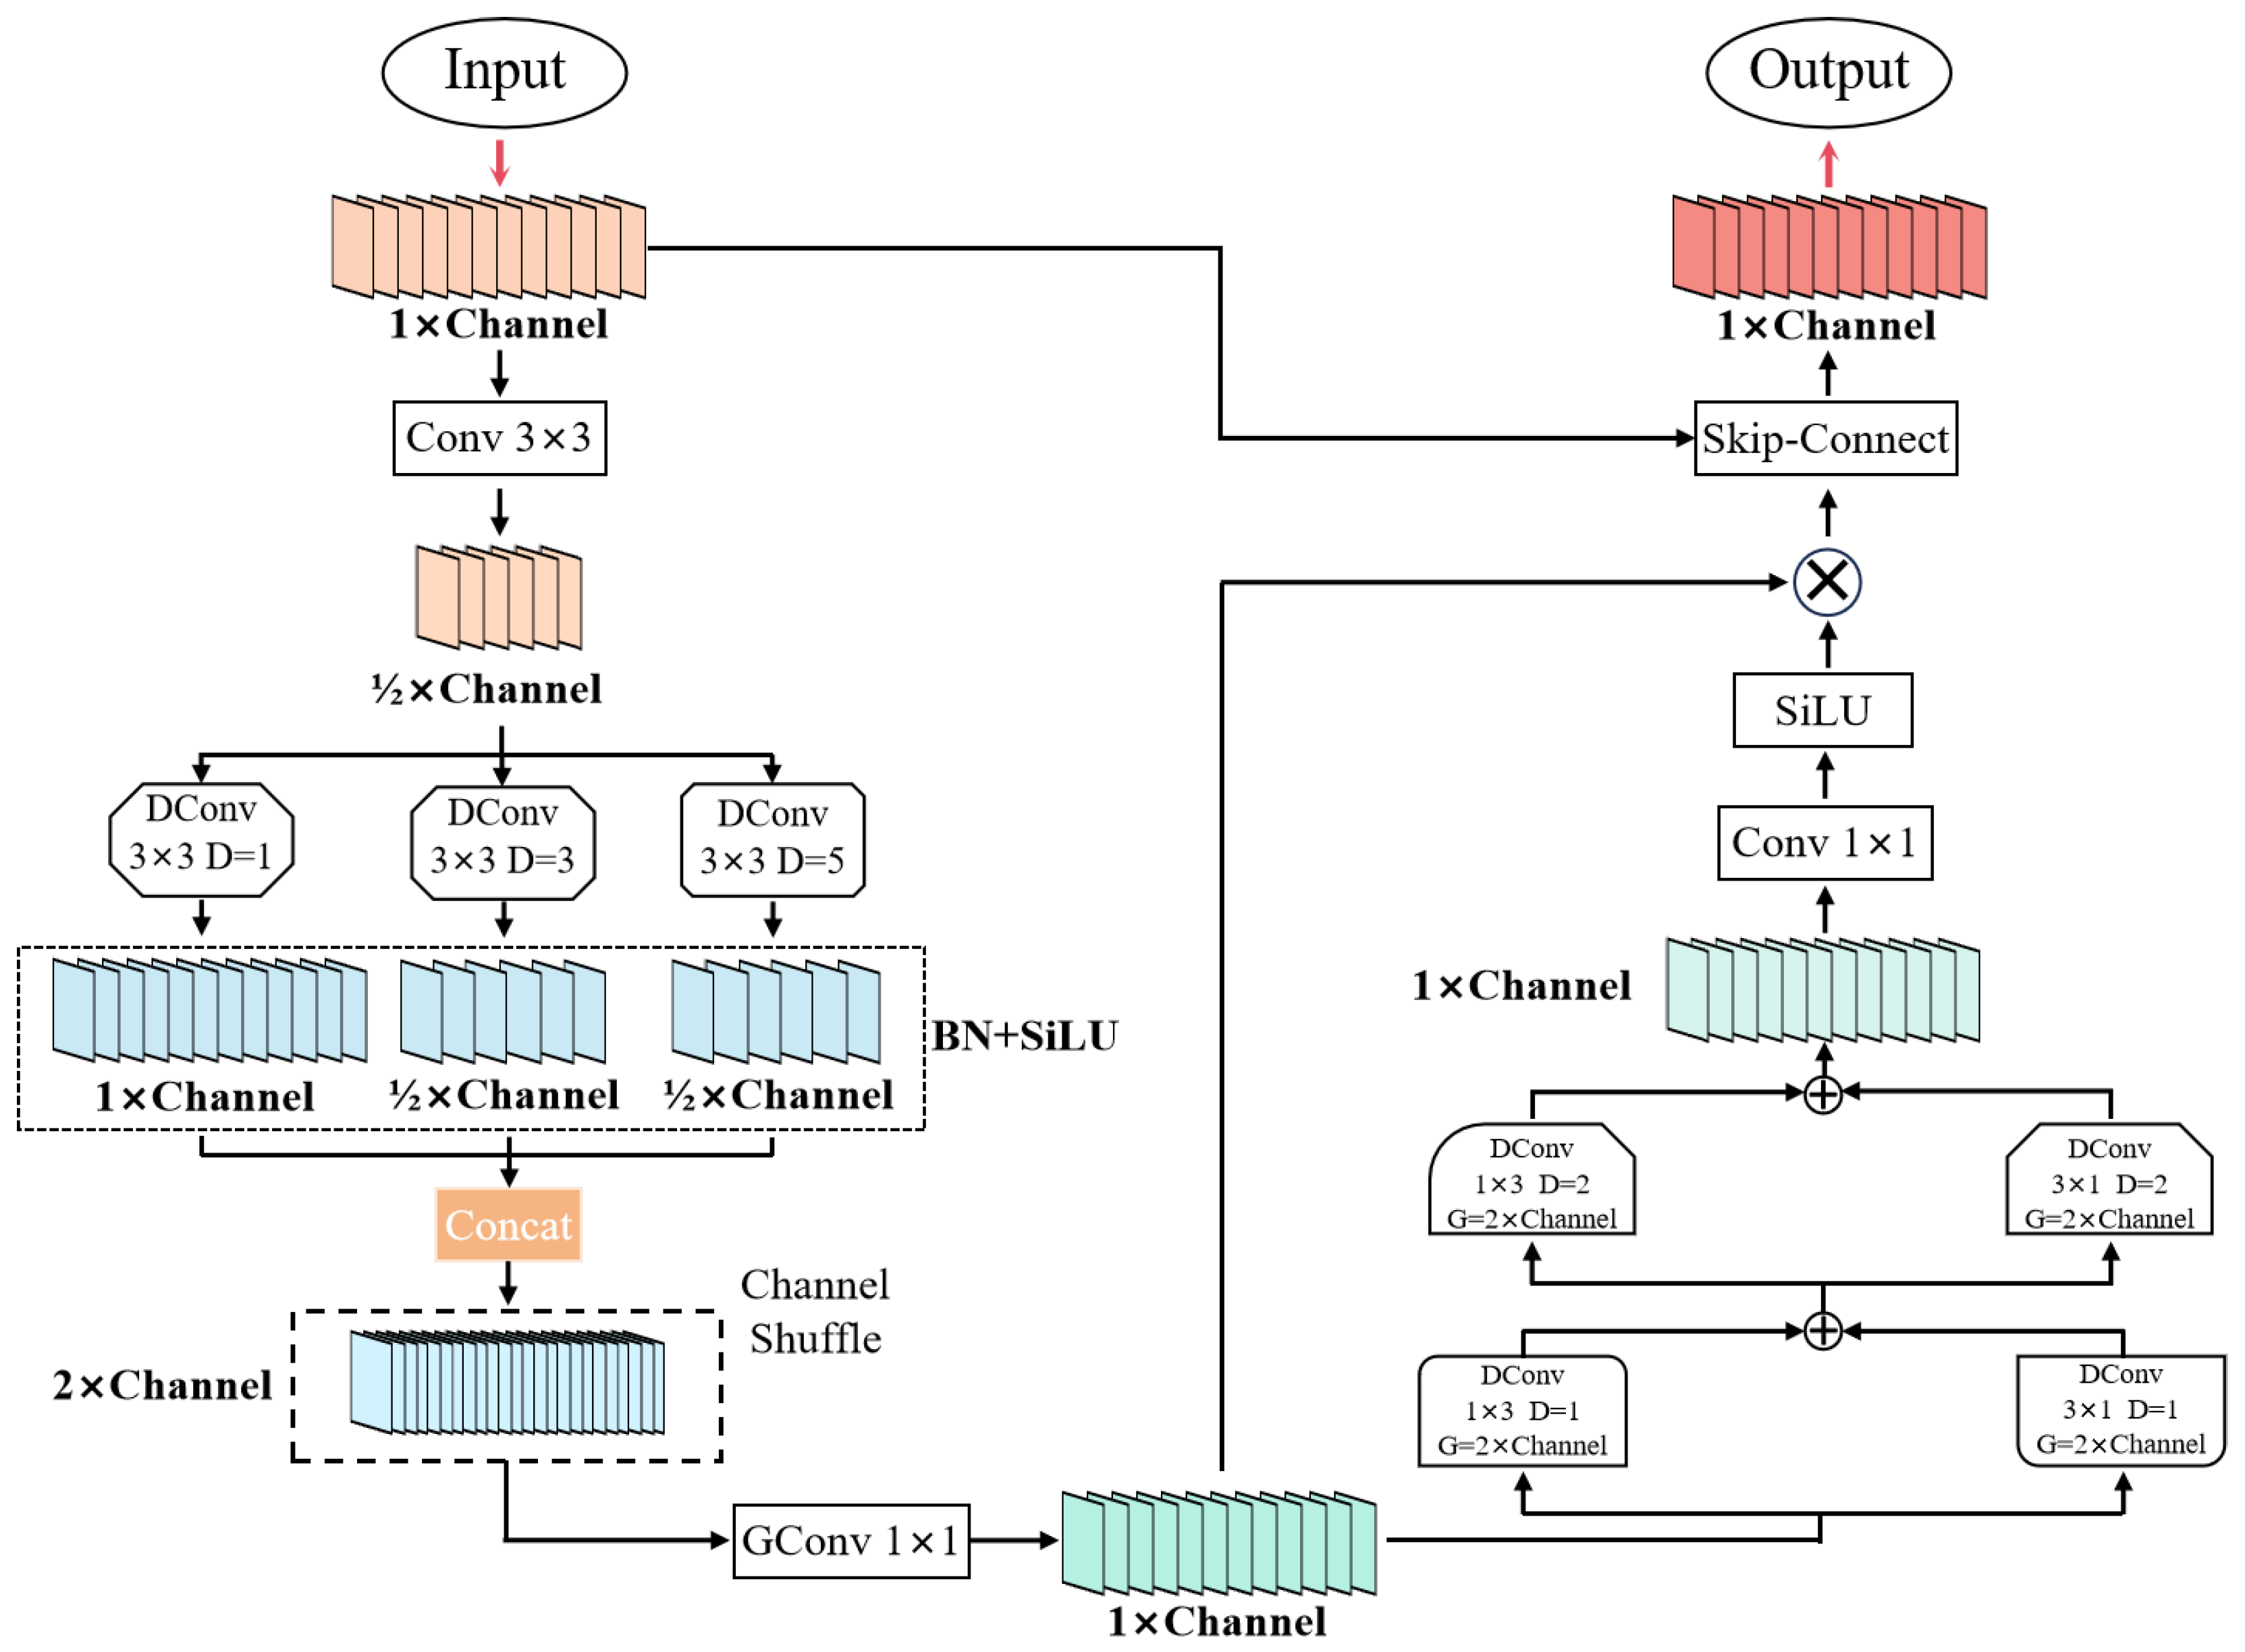
(2) This study proposes the Multi-Dilation Spatial-Channel Fusion with Shuffling (MSFS) module for feature extraction from complex backgrounds to target cracks.
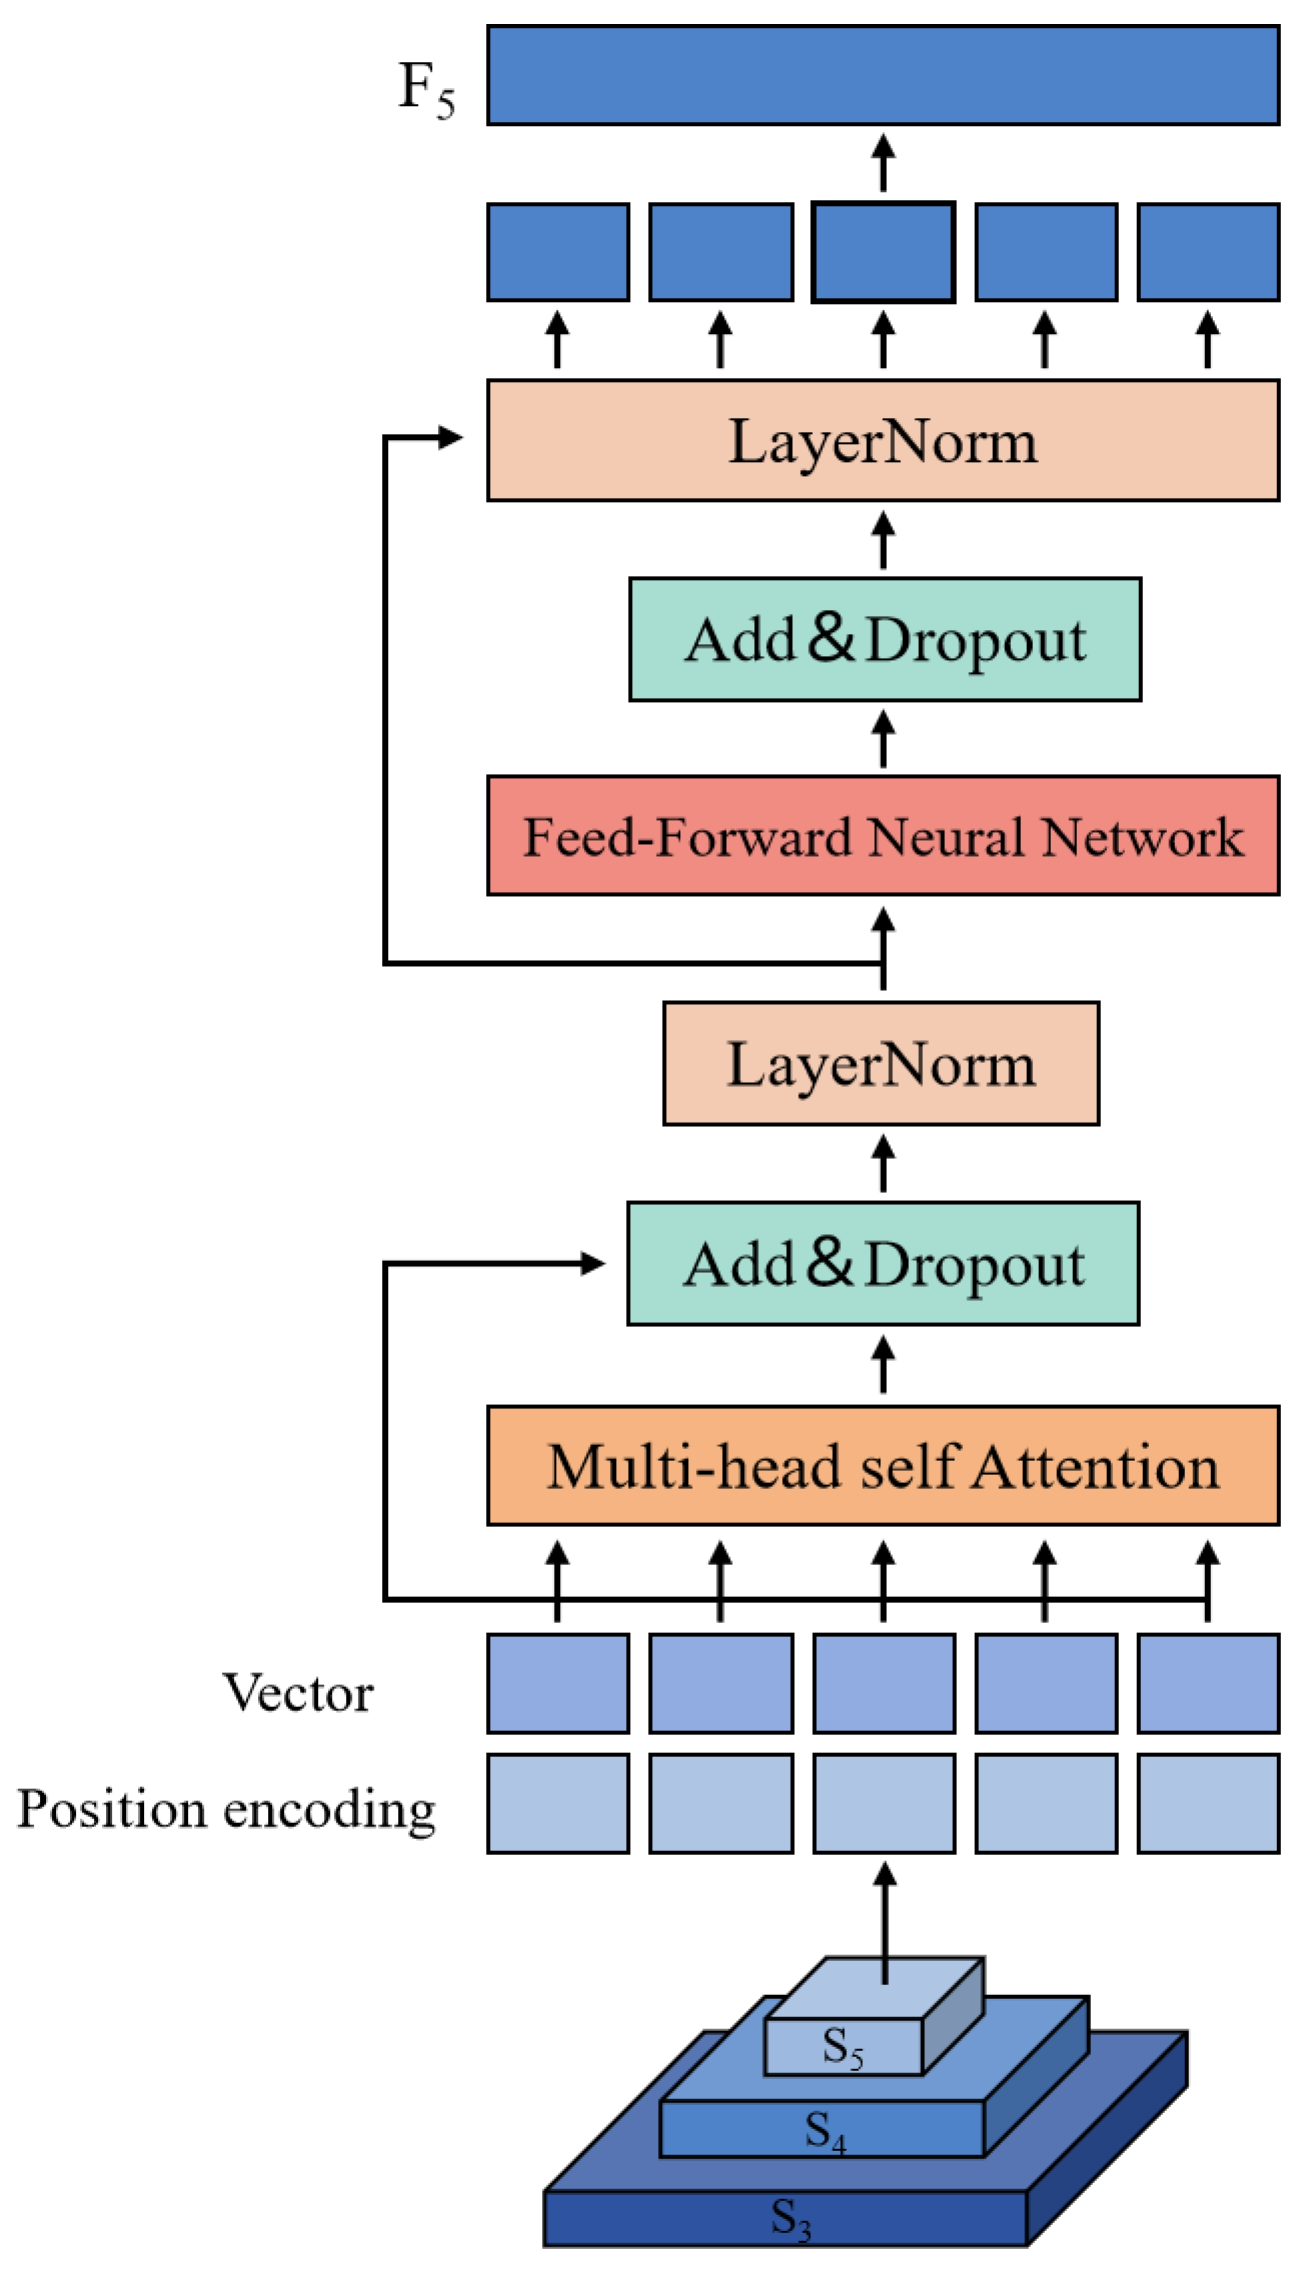
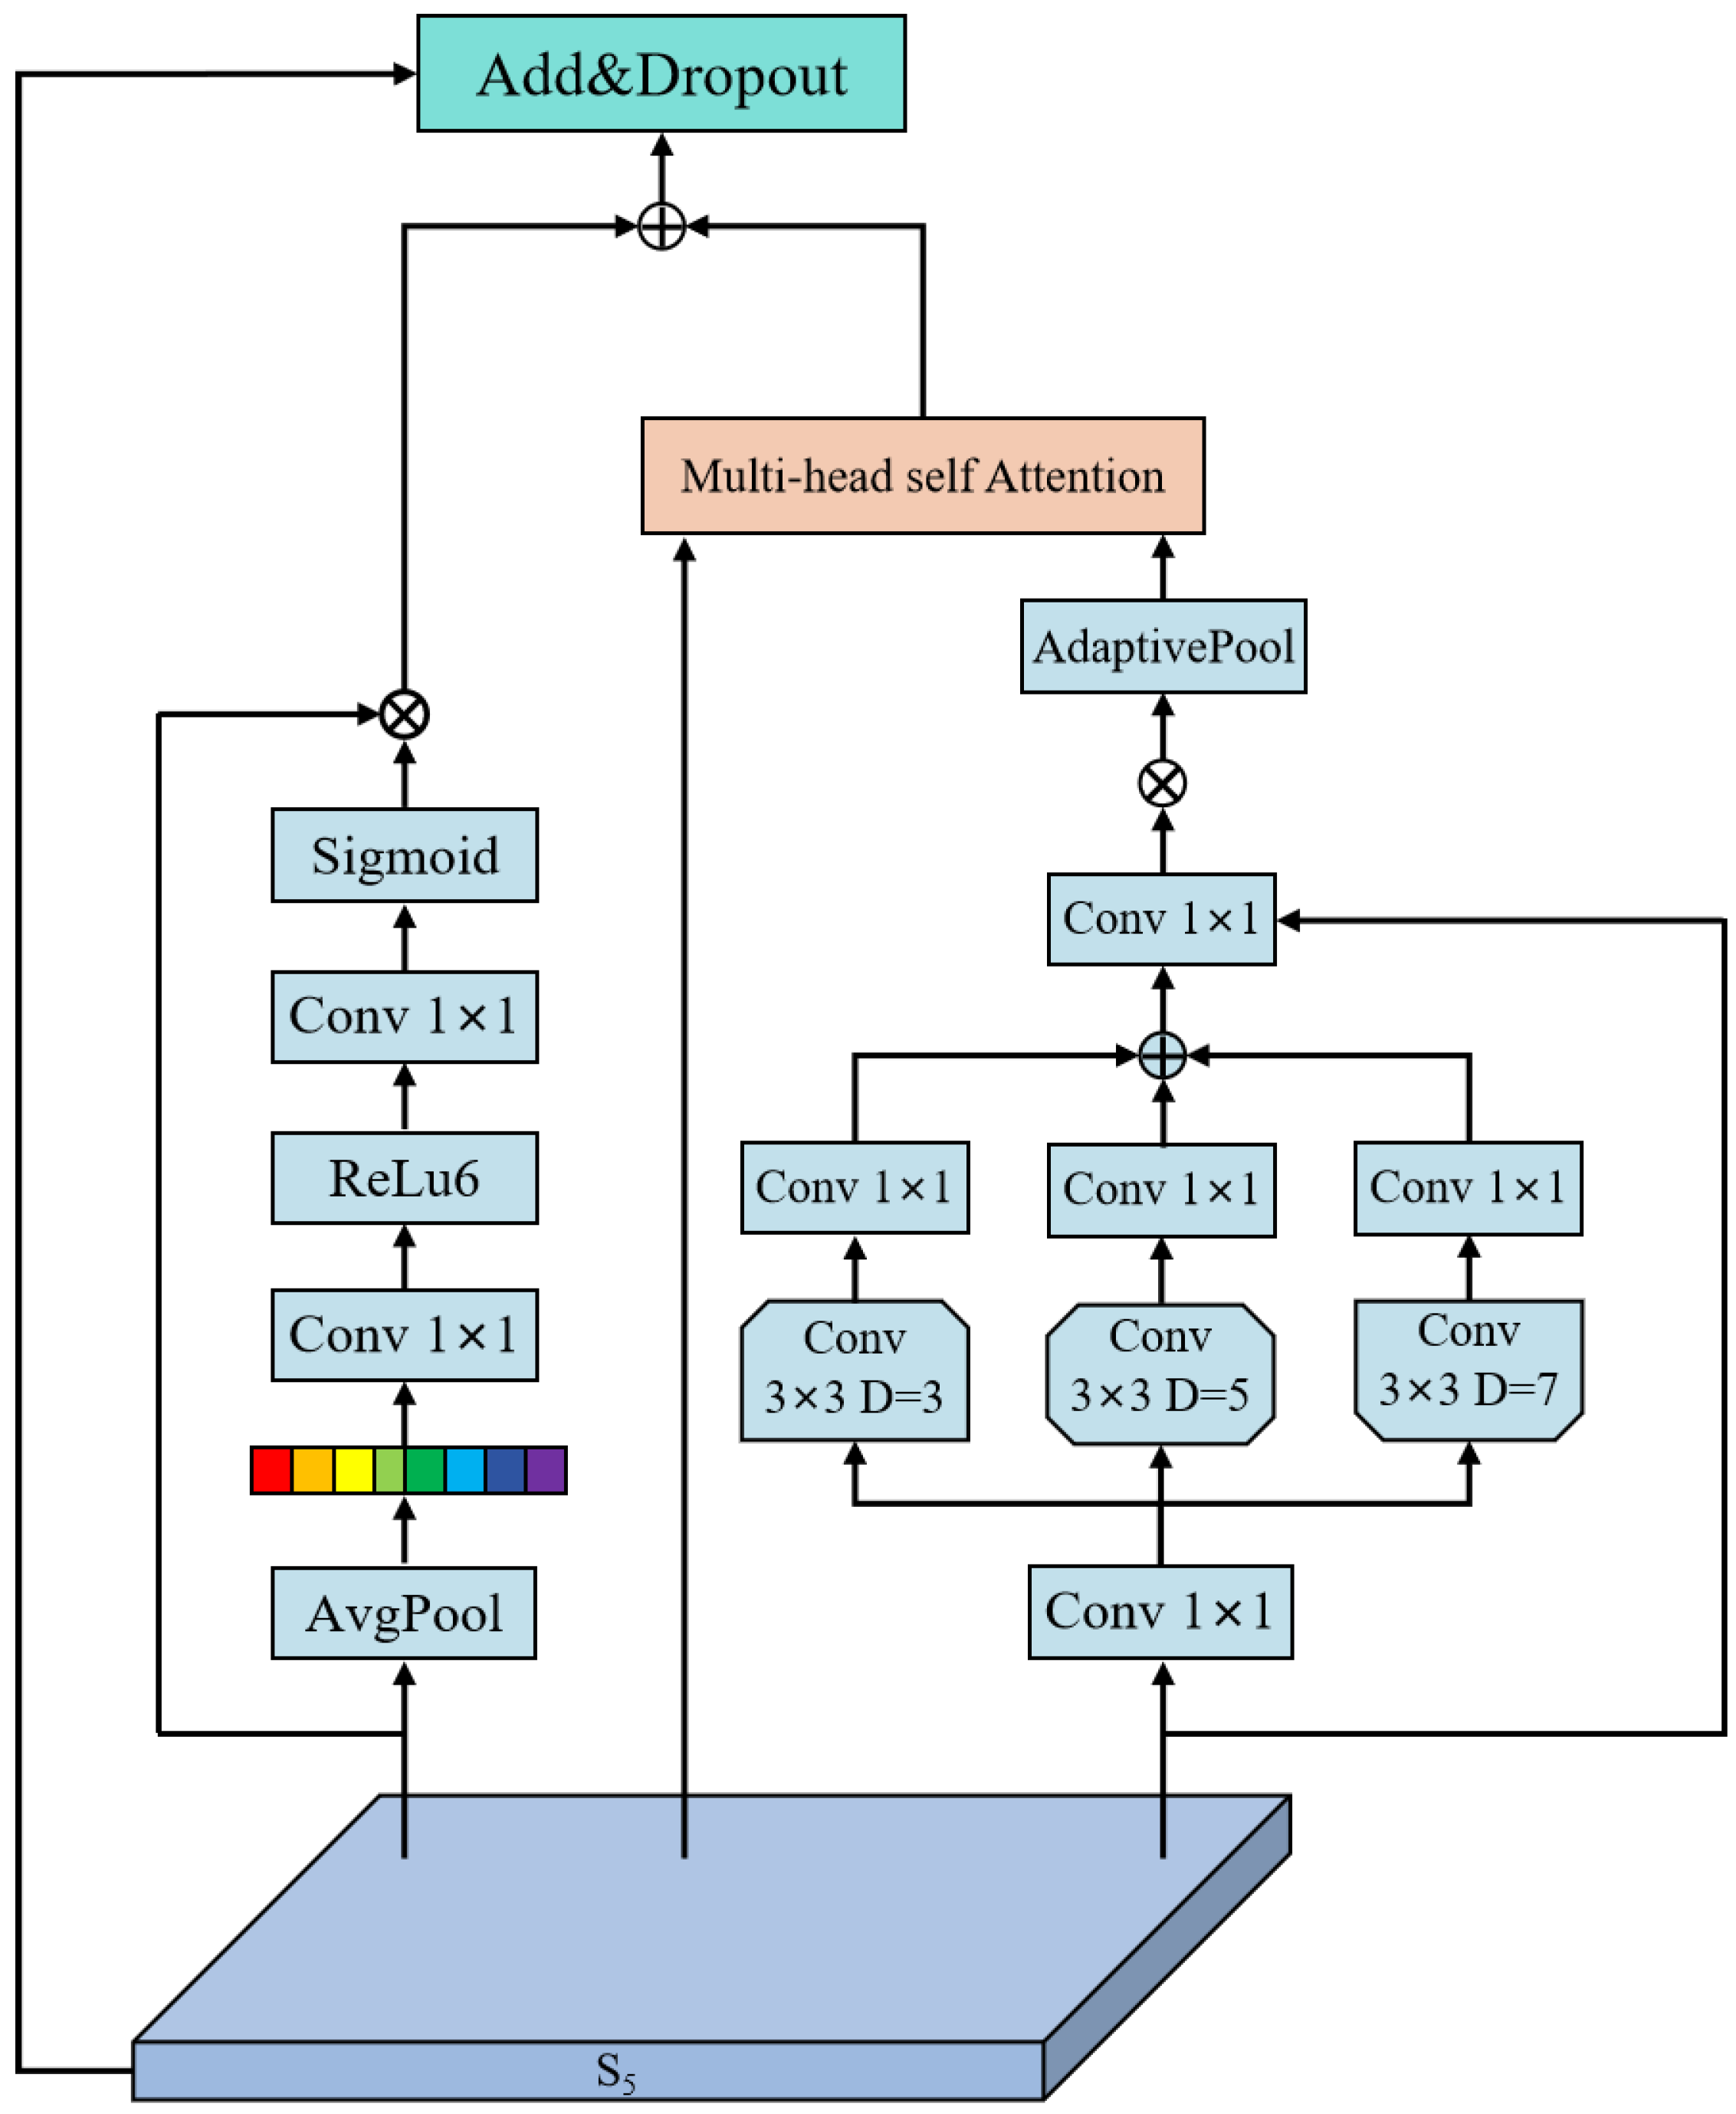
(3) This study adopts an Attention-based Intrascale Feature Interaction (AIFI_M2SA) module, which enhances the integration of information regarding crack features.
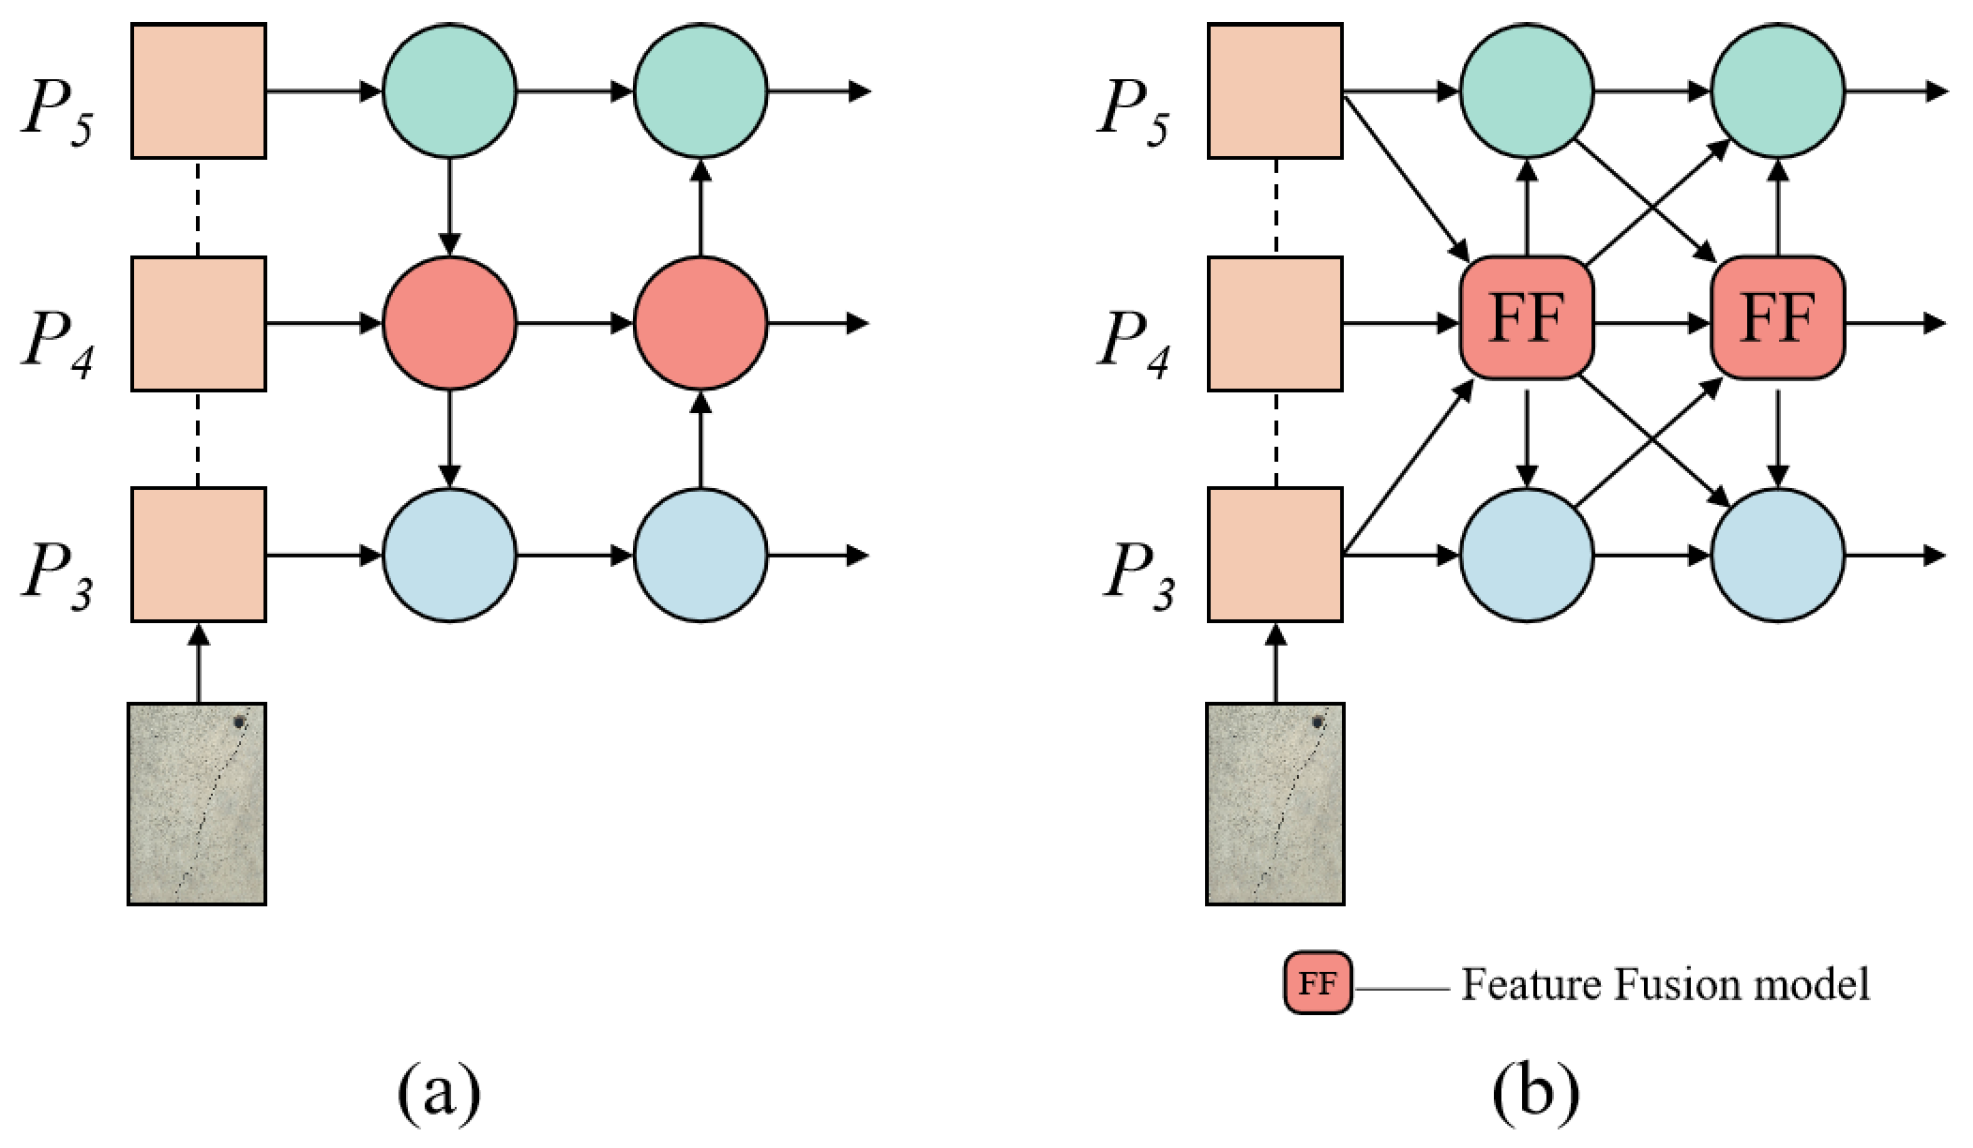
(4) This research is designed with the Multi-Scale Context Diffusion Network (MSCD-Net), which employs parallel deep convolutions to capture cross-scale information, enabling the fusion and diffusion of contextual information.

2. Methodology

2.1. Baseline Model

Since its inception, the YOLO series algorithms have undergone constant refinement and iteration. YOLOv11, an object detection algorithm, was released by Ultralytics on 30 September 2024. The overall architecture of YOLO11 comprises three main components: the Backbone, Neck, and Head. The Backbone is responsible for feature extraction and integrates modules such as CBS, C3k2, SPPF, and C2PSA. Among them, the C3k2 module combines the computational efficiency of C2f with the structural flexibility of C3k, allowing dynamic selection of whether to incorporate the C3k layer during runtime for feature processing. The SPPF (Spatial Pyramid Pooling Fast) module enhances multi-scale feature representation by employing three max-pooling layers, thereby improving the network’s feature extraction capability. The C2PSA module further strengthens both feature representation and the attention mechanism. The Neck adopts a combination of Feature Pyramid Network (FPN) and Path Aggregation Network (PAN) structures to effectively fuse features across different scales and transmit them to the detection Head. Finally, the Head predicts object categories and bounding box coordinates by processing the fused multi-scale feature maps.

2.2. PC3D-YOLO Model

This study proposes the PC3D-YOLO model, based on the original structure of YOLOv11, with a model structure depicted in Figure 1.
Compared with the baseline model, the proposed approach demonstrates superior global feature extraction and fusion capabilities, leading to improved detection precision. Specifically, the model replaces the C3K2 bottleneck with the MSFS module, which utilizes parallel dilated convolutions to capture multi-scale spatial features and employs channel shuffle operations to facilitate effective cross-channel feature interactions. In addition, the SPPF module is replaced with the AIFI_M2SA module, which integrates multi-scale, multi-head self-attention with channel-wise information to enable global context modeling and enhance the model’s robustness. Finally, the neck network is redesigned to improve the fusion and transmission of multi-scale features, allowing each detection scale to access richer contextual information and further enhancing overall detection performance.

2.2.1. MSFS Module

The C3K2 module, widely used for extracting essential features from images, consists of multiple bottlenecks but faces limitations due to its reliance on standard 3 × 3 convolutions and residual connections. These constraints result in restricted receptive fields and weak feature interactions, which hinder effective feature extraction and fusion. Therefore, to compensate for these deficiencies, this study designed the Multi-Dilation Spatial-Channel Fusion with Shuffling (MSFS) module, of which its structural configuration is depicted in Figure 2.
This module first employs a 3 × 3 convolution for dimensionality reduction and preliminary spatial information acquisition on the input features, followed by multi-scale feature extraction via depth-wise convolutions with varying hole rates, where all convolution kernels have a size of 3 and the hole rates of D = { 1 , 2 , 3 } . Then, in the direction of depth, feature maps are concatenated to increase the depth of the feature maps, capturing information across different network layers, resulting in a more diverse feature representation. The formula is expressed as follows:
X i = D Conv 3 × 3 d i ( Conv 3 × 3 ( X ) ) X ˜ = Concat ( X i )
where X i ( i = 1 , 2 , 3 ) represents the output from three empty convolutional layers; Conv 3 × 3 ( · ) denotes a 3 × 3 convolution; DConv 3 × 3 d i ( · ) indicates a 3 × 3 empty convolution with a hole rate of di; Concat ( · ) signifies that the outputs from three convolutions X i will be concatenated in the channel dimension, and the concatenated result output is X ˜ .
In addition, Wei et al. [28] argued that establishing connections between multi-scale features is somewhat challenging, and that small-span connections assist in bridging large spans, thus small reception fields are important. Consequently, the number of channels output by the branch with a porosity rate of 1 is twice that of any other branch.
Furthermore, given that the use of different-sized convolutions for multi-scale feature grouping extraction leads to inadequate information exchange among groups, hindering the flow of information. In this regard, this model performs channel shuffle processing on the output feature maps, so that the features in each group are dispersed to different groups, followed by the fusion of these features through a 1 × 1 grouped convolution.
Given the distinct horizontal and vertical directional nature of the cracks, initial efforts are made to obtain low-level directional features in both horizontal and vertical directions via 1 × 3 and 3 × 1 separable convolutional layers. Next, by maintaining the kernel size constant, spatially separable dilated convolution with a hole rate of 2 was employed to enhance long-range contextual information. Subsequently, feature fusion is conducted through a 1 × 1 convolution, with the SiLU activation function enhancing the nonlinear expression of features. Ultimately, adaptive feature refinement is achieved via the Hadamard product, with residual connections employed to alleviate gradient vanishing, thus outputting the feature map. In summary, the process can be formulated as follows:
X 1 = Conv 1 × 3 d = 1 ( X c ) + C o n ν 3 × 1 d = 1 ( X c ) X 2 = DConv 1 × 3 d = 2 ( X 1 ) + D C o n v 3 × 1 d = 2 ( X 1 ) X s = SiLU ( Conv 1 × 1 ( X 2 ) ) X o u t = ( X s X c ) + X
where X 1 and X 2 denote the outputs of the feature maps after the first and second parallel processing, respectively, X o u t denotes the final MSFS output of the feature maps, SiLU ( · ) denotes the activation function operation, and ⊗ denotes the Hadamard product.

2.2.2. AIFI_M2SA Module

In YOLOv11, Spatial Pyramid Pooling-Faster (SPPF) modules are incorporated to enable efficient computation and multi-scale feature fusion. The architectural design of the SPPF module is illustrated in Figure 3. However, the SPPF relies on multiple fixed-size max pooling operations for feature extraction, which may result in the loss of critical feature information and limit its capacity to capture long-range dependencies and contextual features effectively.
To address the aforementioned limitations, this paper introduces the Attention-based Intrascale Feature Interaction (AIFI) module as a replacement for the SPPF module. The AIFI module, originally proposed by Zhao et al. [29] in July 2023, is illustrated in Figure 4. Specifically, the AIFI module first encodes positional information using sine and cosine functions and subsequently enhances high-level semantic features through a multi-head self-attention mechanism. To ensure network stability, two residual connections with layer normalization are incorporated, while a feed-forward neural network is utilized to implement nonlinear representations, thereby enhancing the model’s robustness.
Although the AIFI module demonstrates promising performance, it struggles to effectively capture long-range dependencies due to the limitations of positional encoding [30]. Additionally, the parallel and independent processing of information across different attention heads hampers sufficient inter-channel information exchange.
In light of this, the article introduces the multi-scale, multi-head self-attention (M2SA) module within the AIFI framework. The M2SA structure is as depicted in Figure 5 [31]. At the heart of the M2SA structure lies the ability to harness multi-scale global context features and channel information through two branching pathways. One branch employs multi-scale features by using empty convolution and outputs feature P through the adaptive average pooling layer, which is used for the calculation of the key tensor and value tensor, thus calculating multi-head self-attention, and the formula is expressed as shown below:
( Q i , K ˜ i , V ˜ i ) = X i W q , P i W k , P i W ν Attention = Concat ( softmax ( Q i K ˜ i T d k ) V ˜ i ) h W o
Moreover, by employing a pathway attention branch to efficiently compute the importance of each feature channel, thus enhancing the weights of effective feature maps while decreasing the weights of ineffective or less impactful ones, an output containing channel attention is yielded. The above process can be expressed as follows:
X p = Avgpool ( X ) X c = ReL u 6 ( Conv 1 × 1 ( X p ) ) Attention c = Sigmoid ( Conv 1 × 1 ( X c ) ) X
Finally, the sum of the outputs from both branches serves as new input for further computations in the AIFI module.
X out = Attention + Attention c

2.2.3. MSCD-Net Network

The Neck module employs a combined structure of the Feature Pyramid Network (FPN) and Path Aggregation Network (PAN), as depicted in Figure 6a. However, it faces the issue of inadequate interaction between multi-scale features, which impedes the effective fusion of spatial details and semantic information. As a result, the finer details in deeper feature maps are not adequately represented in the shallower feature maps. In this study, the Multi-Scale Context Diffusion Network (MSCD-Net) was selected as the neck network for the improved model, with its network structure illustrated in Figure 6b.
MSCD-Net introduces a multi-level feature-adaptive focusing mechanism that enables dense information exchange among different scale feature maps. Compared to the traditional FPN-PAN fusion strategy, this network can more effectively integrate non-hierarchical feature information from the backbone network, preserving shallow space detail information while fusing deep semantic features. Moreover, during the feature propagation process, semantic contextual information across different levels is synergistically optimized through a diffusion mechanism, thereby facilitating subsequent feature expression and enhancing the model’s object detection capabilities.
The feature fusion module realizes multi-scale dynamic fusion of cross-layer features through multi-branch feature recombination and mixed reception field convolutions, as illustrated in Figure 7. Firstly, accept input features of three dimensions (X1, X2, X3) at the input end, with X2 serving as the benchmark scale for the middle layer. By upsampling dynamically in the X1 domain to enhance spatial resolution, and adaptively downsampling X3 to X2 to match the same scale. Three sets of features, normalized via channel augmentation, are integrated through tensor concatenation for feature aggregation across dimensions. Subsequently, employing four distinct depths for separable convolutions, the fused features are extracted with fine-grained, medium-scale, and broad-range contextual information. In conclusion, add up the dimensions in a new dimension and preserve the original distribution of the initial concatenation by connecting residuals, ensuring gradient propagation stability.

3. Experiments

3.1. Dataset

In this study, three datasets were utilized to train and evaluate the proposed model, aiming to comprehensively assess its effectiveness and robustness. Following the standard protocol established in previous works [32,33,34], each dataset was randomly split into training and validation subsets using a 4:1 ratio. As shown in Table 1, where Precast Concrete Components Crack Datasets (PC3) is the self-made dataset of this study.

3.1.1. Self-Made Dataset

The PC3 dataset consists of 2713 crack images of concrete walls from the unlabeled SDNET2018 dataset [37] and 2195 crack images of precast concrete components collected by Wuhan Construction New Building Materials Green Industry Science & Technology Co., Ltd., Wuhan, Hubei, China. The former primarily includes images of small and wide cracks, ranging from 0.06 mm to 25 mm, in conventional scenarios. The latter more accurately reflects the real-world production and application conditions of precast concrete components, thereby enhancing the practical relevance and applicability of the dataset.

3.1.2. Public Datasets

Since no publicly available dataset specifically for precast concrete cracks exists, this study employs two alternative datasets to simulate detection challenges in complex scenarios.
The CRACKS_MANISHA dataset expands its original concrete road crack images to 4973 samples through data augmentation techniques, including image rotation and noise addition. These enhanced images contain 12,847 labeled crack targets (Figure 8). To mitigate overfitting and reduce data redundancy, a total of 2223 representative images were strategically selected for model training and validation. Although the datasets were initially collected from concrete pavements, they feature a high degree of background complexity and interference, which closely mirror the noise characteristics typically encountered in precast concrete components. These characteristics make the dataset highly suitable for simulating the practical challenges of crack detection in precast structures.
Introduced by Chaokai Zhang et al. in their 2024 study [36], the DECA dataset comprises 1959 annotated concrete crack images, with representative samples illustrated in Figure 9. This dataset incorporates multi-scale crack patterns and diverse environmental variables (including illumination variations and meteorological conditions) to replicate actual industrial inspection scenarios.

3.2. Experiment Environment

All experiments in this study were conducted on a cloud server running the Linux operating system. The hardware configuration consisted of an NVIDIA Quadro RTX 4090D GPU with 24 GB of memory and an Intel Xeon E5-2682 v4 CPU with 64 GB of RAM. The model training was implemented using the PyTorch 1.13.0 deep learning framework, with a batch size of 4. Each of the three datasets was trained for 300 epochs using an initial learning rate of 0.01.

3.3. Evaluation Metrics

To comprehensively evaluate the detection accuracy of the model, this study employs three assessment indicators, including precision (P), recall (R), average precision (AP), and Frames Per Second (FPS) [38,39,40]. The definitions of precision, recall, and AP are
P = T P T P + F P R = T P T P + F N A P = 0 1 P ( R ) d R

4. Result and Discussion

4.1. Comparative Experiments

To comprehensively evaluate the performance of the PC3D-YOLO model in the task of detecting cracks in precast concrete components, this section selects some mainstream models and conducts comparative experiments with them on the three datasets shown in Table 1, as shown in Table 2, Table 3 and Table 4. Among these, YOLOv8-CD and YOLOv10-DECA are advanced methods specifically designed for concrete crack detection tasks.
From Table 2, Table 3 and Table 4, it can be seen that the two-stage algorithm Faster R-CNN exhibits inferior overall performance in terms of average precision (AP), with an AP@50 (model average precision when IOU = 0.5) of 78.3%, 64.0%, and 71.7%, respectively, and an AP@50-95 (model average precision when IOU = 0.5–0.95) of 48.7%, 39.9%, and 42.6%. At the same time, there is a problem with low recall. The reason may lie in the RPN candidate box filtering mechanism within the algorithm, as well as the two-stage accumulation of errors. Moreover, as two-stage algorithms require the generation of candidate boxes followed by classification and regression, the overall process is relatively complex and computationally intensive, which leads to slower detection speeds.
Among single-stage algorithms, the FCOS and SSD models demonstrate relatively poor performance in both detection accuracy and speed, whereas the YOLO series generally achieves better results. Notably, PC3D-YOLO delivers the highest detection accuracy, with AP@50 scores of 86.3%, 83.1%, and 89.7%, and AP@50-95 scores of 65.6%, 67.6%, and 69.9% across the three datasets. These results confirm the effectiveness of the proposed algorithmic improvements, which substantially reduce the interference caused by complex backgrounds, enable the extraction of richer feature representations, and enhance both the accuracy and robustness of crack detection in precast concrete components.
Although this improvement in accuracy comes at the cost of a certain reduction in detection speed, it is acceptable within the context of this study. Crack detection for precast concrete components is primarily conducted during the production and quality inspection phases, where real-time performance is not critically required. Furthermore, the achieved inference speed of approximately 62.4 FPS is sufficient to meet the demands of most real-time detection applications.
Regarding the relatively poor performance of YOLOv7 among the YOLO series models, this study attributes the issue to the absence of large-kernel convolutions, which are essential for capturing long-range dependencies. Additionally, its feature optimization relies primarily on the inherent design of the Efficient Layer Aggregation Network (ELAN), which may limit its ability to handle complex backgrounds. In contrast, YOLOv8 incorporates the Concatenate-to-Fuse (C2f) module, which not only preserves intermediate layer features but also enables parallel fusion of multi-scale features. This significantly enhances the model’s feature extraction capability in complex scenes. YOLOv11 incorporates a C2PSA layer following the SPPF layer to enhance feature representation through an attention mechanism, which is a key factor contributing to its improved detection accuracy.
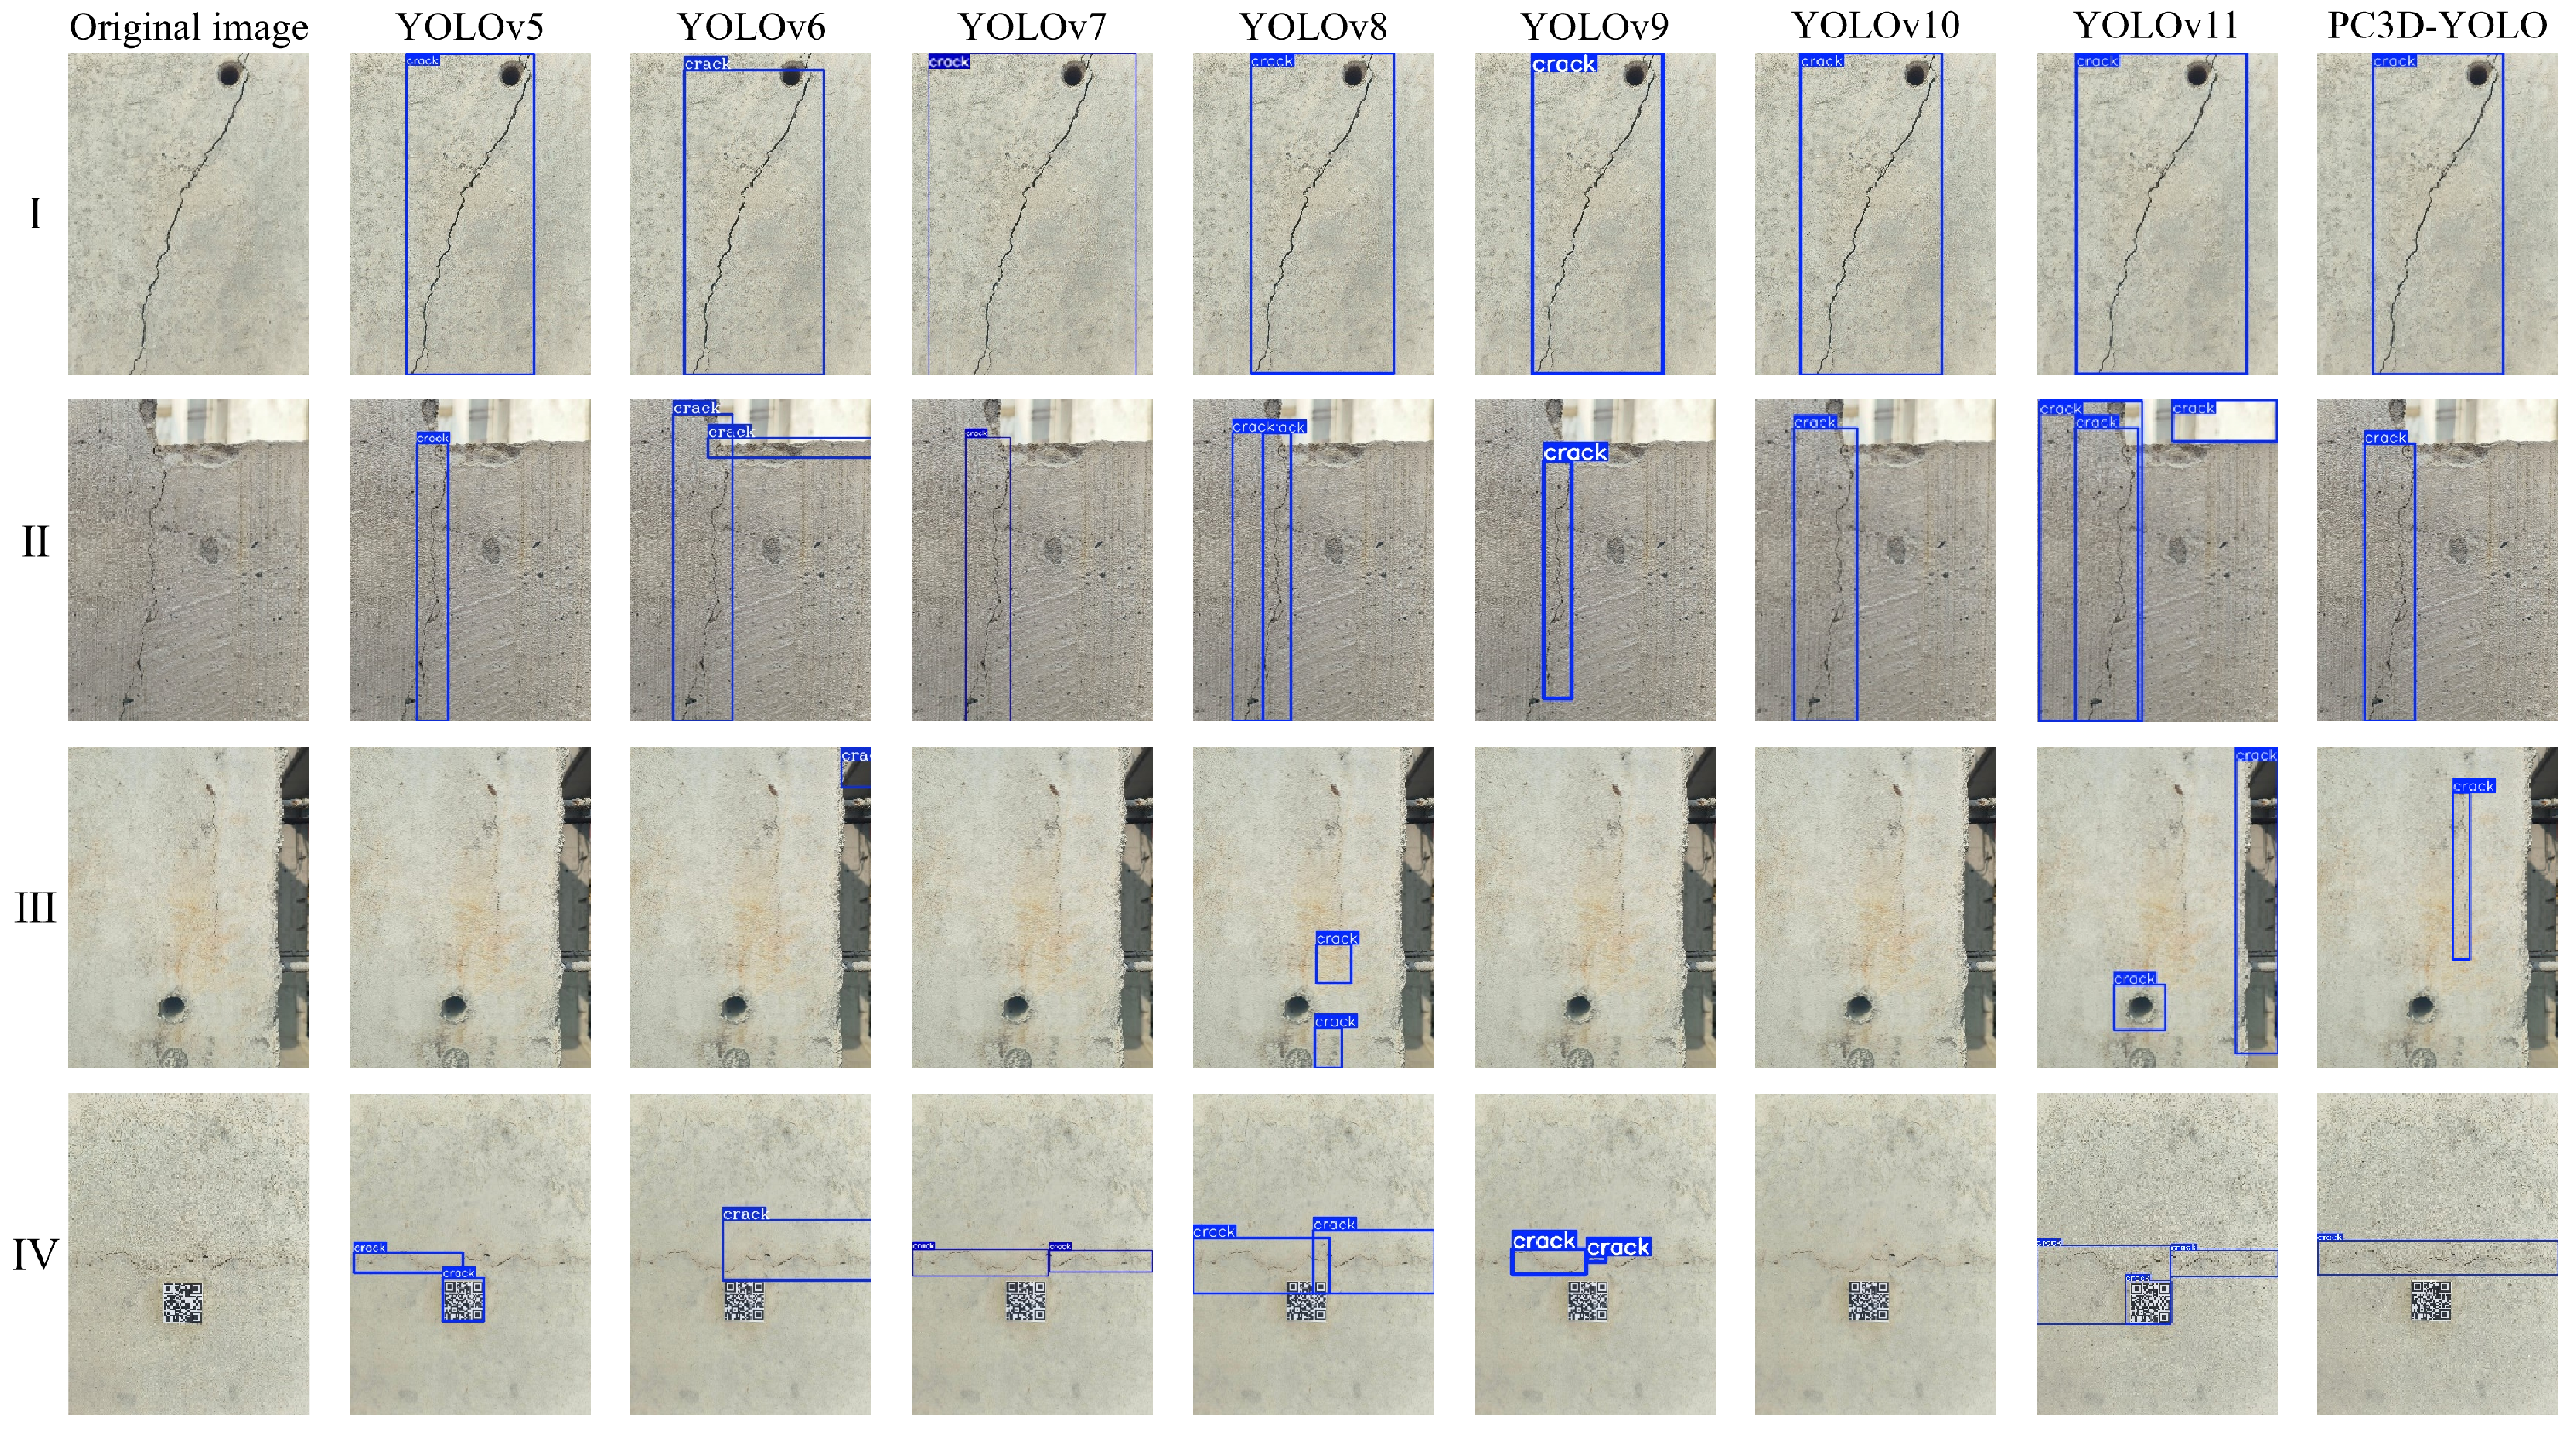
To intuitively demonstrate the effectiveness of the proposed model improvements, this paper visualizes the detection results of the PC3D-YOLO model and the YOLO series models on the PC3 dataset, as illustrated in Figure 10.
In Scene I, all models in the YOLO series were able to detect cracks. However, YOLOv7 exhibited noticeable localization inaccuracies. This may be attributed to its anchor-based mechanism, which can lead to significant positioning errors when there is a large discrepancy between the predefined anchor sizes and the actual target dimensions. Compared with other models, PC3D-YOLO showed better detection results, including more intensive attention to cracks.
In Scene II, the crack is located at the corner of the window frame, and non-structural regions are inevitably captured during the image acquisition process. These irrelevant areas introduce considerable interference into the detection task. Additionally, most YOLO models possess a relatively limited receptive field, which hinders their ability to analyze crack features from a global perspective. As a result, issues such as false detections and repeated detections may occur. In contrast, the improved model incorporates a larger receptive field and a more effective feature interaction mechanism, enabling it to accurately localize the crack target even in complex environments.
In contrast to Scenes I and II, Scene III presents a more complex image background with fewer distinguishable features for effective crack detection. Experimental results clearly indicate that most YOLO models fail to identify cracks under these conditions. Furthermore, both YOLOv8 and YOLOv11 produce false detections, primarily due to the presence of dark regions caused by reserved holes, which resemble cracks in color, as well as the geometric similarity between reserved steel bars and actual cracks. In comparison, PC3D-YOLO demonstrated superior capability in extracting and distinguishing crack features, achieving more accurate detection in this challenging scenario.
In Scene IV, the use of QR codes to encode precast concrete components during the manufacturing process was simulated. Yet, due to the multitude of pixel blocks constituting QR codes, they readily form color high-contrast zones that exhibit certain similarities in geometric characteristics with cracks, thus being susceptible to false detection. Conversely, PC3D-YOLO exhibits better performance in this scenario.
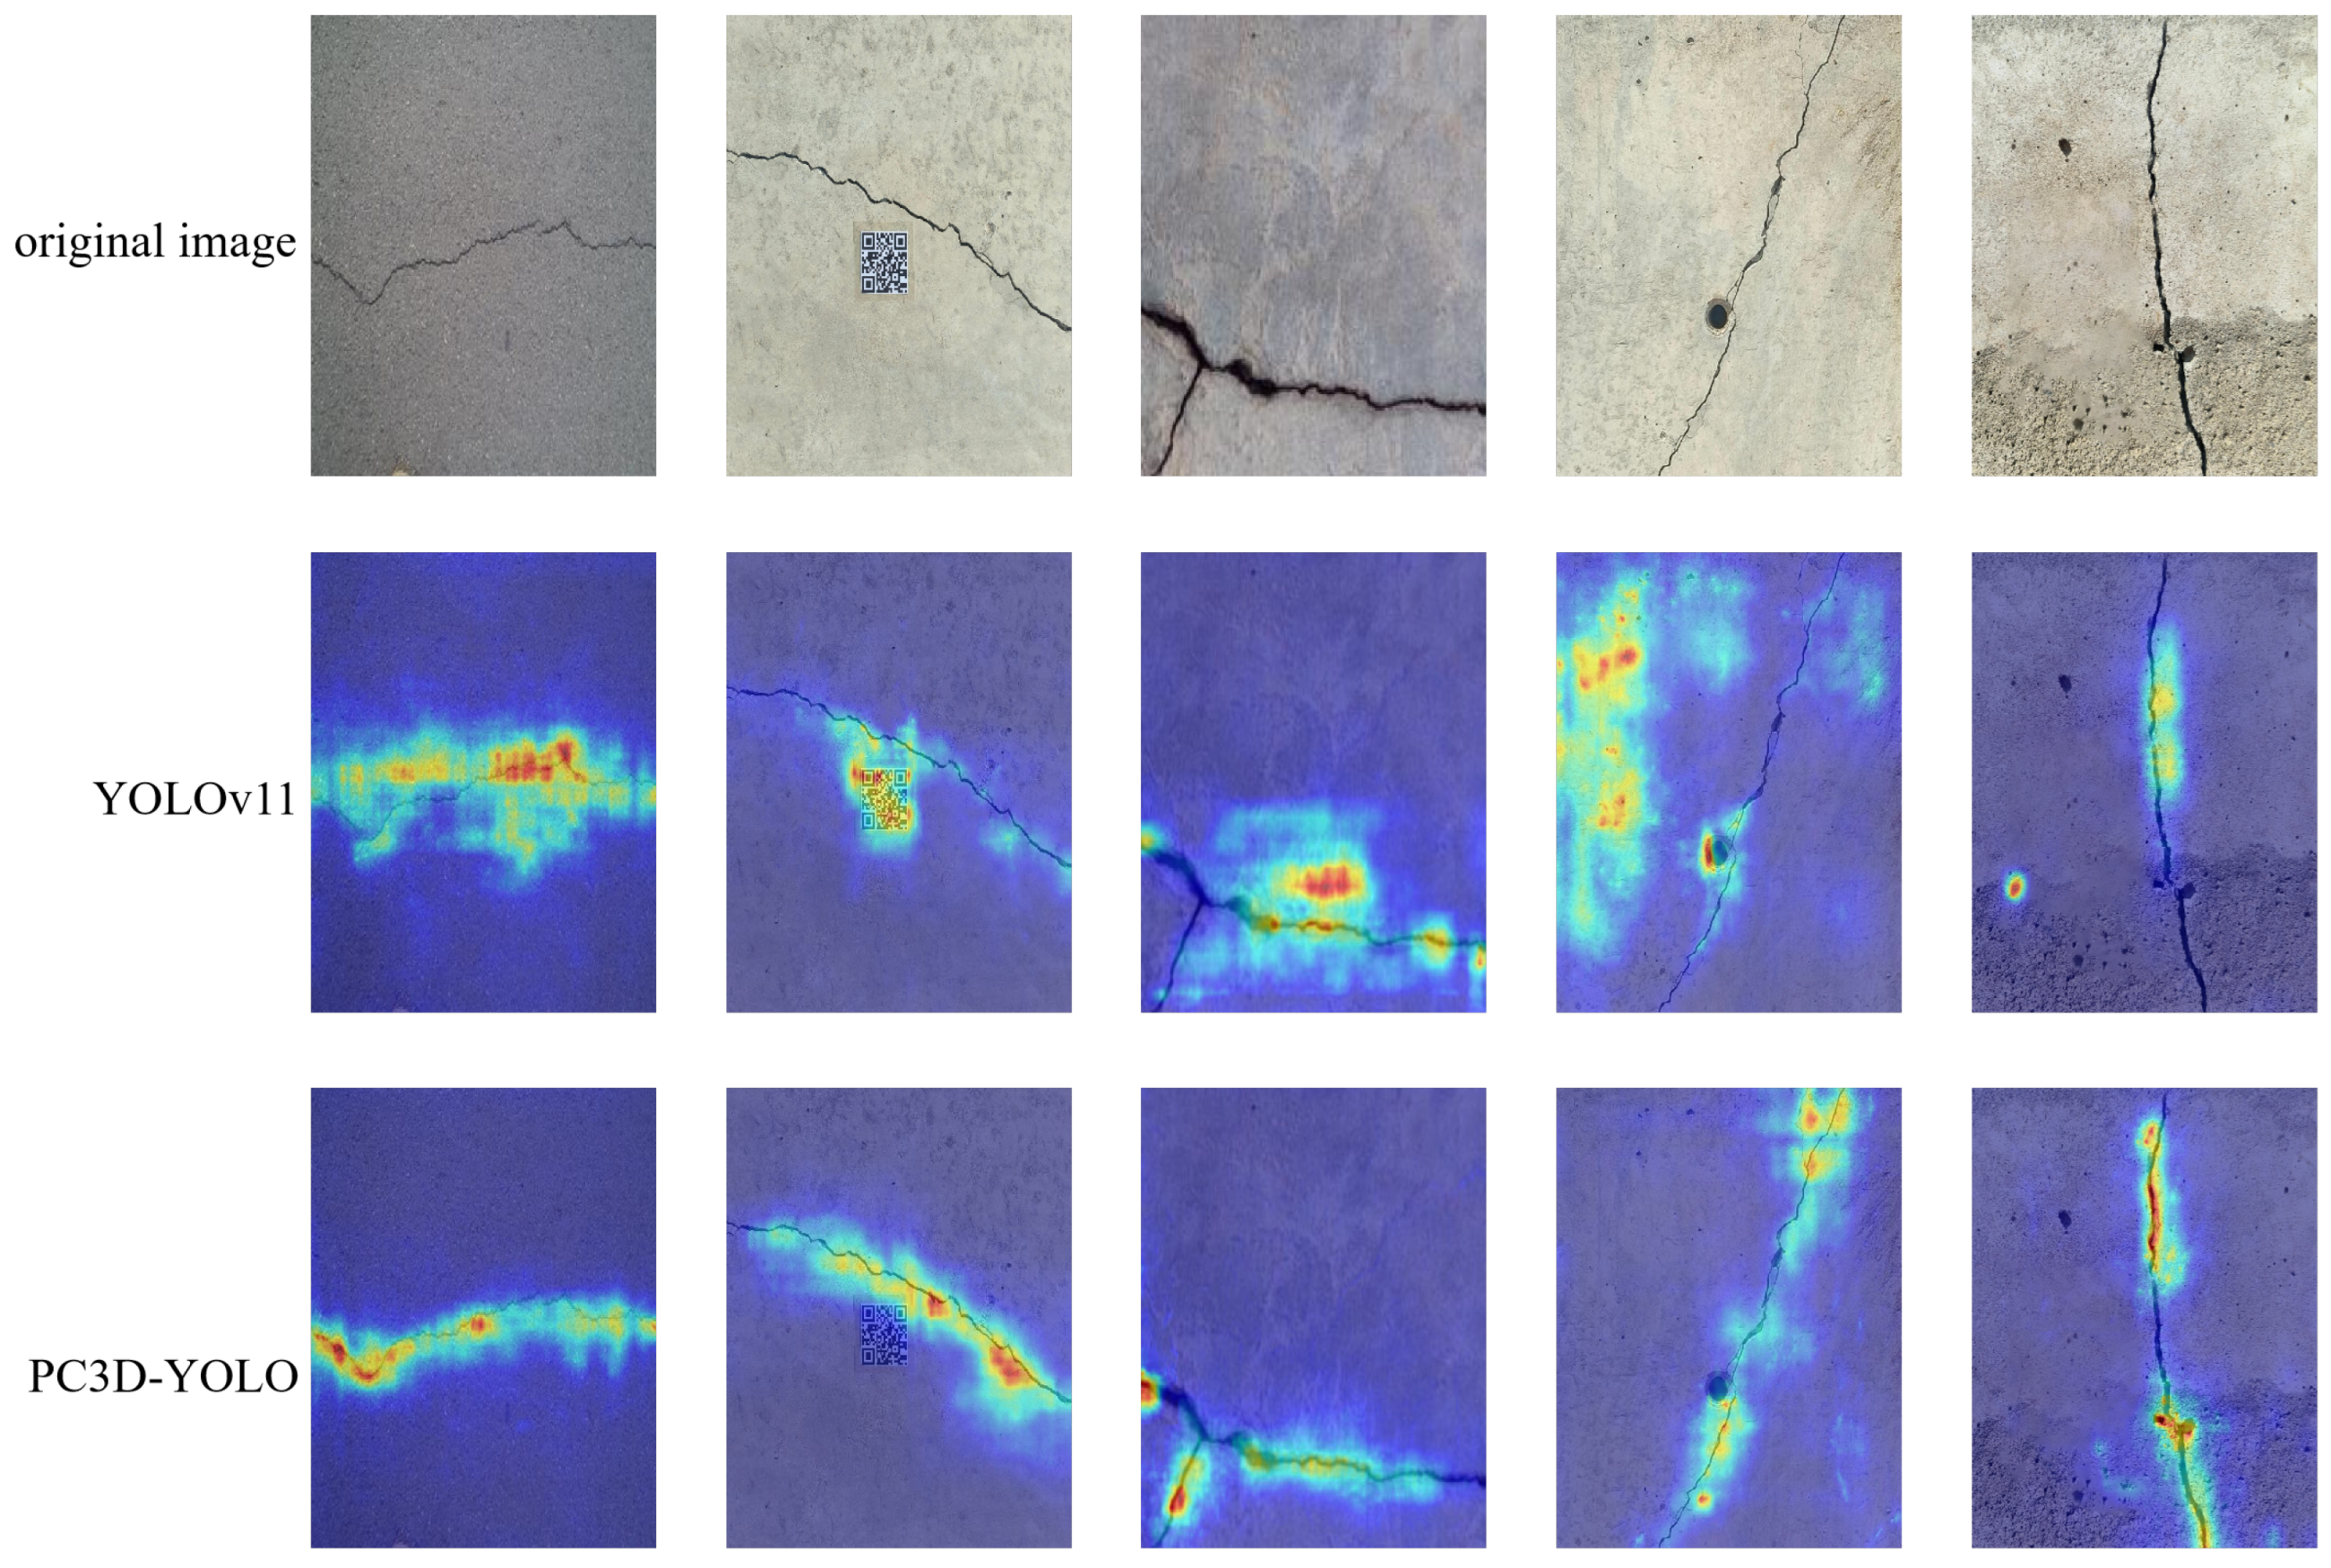
Furthermore, to intuitively illustrate the enhancement of feature extraction in PC3D-YOLO, this study visualizes the feature maps of PC3D-YOLO and YOLOv11 in the form of heatmaps, as shown in Figure 11. Visualization results indicate that the YOLOv11 model exhibits limitations in both feature extraction and target localization. In contrast, PC3D-YOLO is able to capture crack features more accurately and comprehensively, owing to the incorporation of a larger receptive field and a multi-scale feature interaction mechanism. These enhancements enable PC3D-YOLO to maintain robust detection performance even in complex environments, highlighting its advantages over traditional YOLO models.
In summary, the enhanced model demonstrated exceptional performance in handling complex scenes, confirming the effectiveness of the model improvement design. It substantiated that the PC3D-YOLO model offered a more robust and reliable solution for the task of target detection of cracks in prefabricated concrete components.

4.2. Ablation Experiment

Testing the YOLOv11 algorithm as a baseline model on three datasets. Table 5, Table 6 and Table 7 show the results of the ablation experiment. Experiment A represents the results obtained with YOLOv11. From experiments B, C, and E, it can be seen that after introducing the MSFS module and AIFI_M2SA module into the backbone network, a larger reception field is achieved, enabling the detection of critical characteristic information in complex backgrounds. Both recall and mAP have shown significant improvements, indicating that these modules enhance the ability of the backbone network to extract crack features. From experiment D, it can be seen that MSCD-Net’s improvement in the neck network is effective, and in experiments F and G, it demonstrates its ability to further refine feature extraction and fusion processes with the improved backbone network. In conclusion, the PC3D-YOLO algorithm exhibited significant contributions in enhancing the performance and model optimization of crack detection for precast concrete components via the adoption of multiple improvement strategies. When trained on three distinct datasets, the models achieved substantial performance gains compared to the baseline. Specifically, recall rose by 3.4%, 3.0%, and 4.9%; AP@50 rose by 2.8%, 3.3%, and 2.1%; and AP@50-95 showed improvements of 4.6%, 5.5%, and 3.2%, respectively.

4.3. Analysis of MSFS Module

4.3.1. Module Effect Validation Experiments

To validate the effectiveness of the MSFS module in target detection algorithms, this experiment introduced the DBB module [51], RFAConv module [52], and DWR module [28] into the backbone network C3k2 module as alternatives for the Bottleneck module, and performed comparative experiments on the PC3 dataset. The experiment is shown in Table 8.
From experimental results, it can be inferred that the DBB module exhibits high precision and recall rates in this group of comparative experiments due to its adoption of a structural reparameterization conversion method (introducing different reception fields and multi-branch structures during training, while equating the DBB module to a convolution during inference), but its average precision is relatively poor under high thresholds. This may be attributed to algorithmic localization errors. In the group comparative experiment involving the MSFS module, all four evaluation indicators attained their optimal values, demonstrating the superiority of the module in extracting crack characteristics from precast concrete components.
To showcase the global feature extraction capabilities of MSFS, this paper will display the reception field of experiment group modules through visualization techniques, allowing for the observation of the model’s attention range in terms of image size. The results are shown in Figure 12.
Evidently, the YOLOv11 model possesses a narrower reception field upon sampling, whereas the DWR module, despite offering a larger reception field, exhibits lower attention to the periphery and still lags in its ability to capture global information. In contrast, the MSFS module expands on the original field of view while also enhancing the attention to image regions, thereby significantly boosting the ability to extract crack features.

4.3.2. Channel Mixing and Contrast Experiment

To verify the significance of channel mixing for cross-channel information exchange within the module, this study set up different channel mixing numbers (g = 1, 2, 4, 8, 16) and investigated the impact of channel mixing on module accuracy, to determine the optimal number of mixing groups. As shown in Table 9, the experimental results are as follows:
From the experimental results, it can be observed that models utilizing channel mixing (Groups > 1) consistently outperform those without channel mixing (Groups = 1). When Groups { 1 , 2 , 4 , 8 } , the model’s overall indicator increased as the group size grew, yet when the groups reached 16, their performance declined. This could be due to the excessive group size causing too few input channels per group, thus compromising the feature expression capacity. Consequently, the final study set the number of channels per module in MSFS to 8.

5. Discussion

While the PC3D-YOLO model exhibits high detection performance in the field of detecting cracks in precast concrete components, there still exist some limitations in its application in industrial scenarios. Firstly, the model’s higher computational complexity and parameter count may pose challenges for deployment on mobile hardware platforms. Given that the model, during its construction, incorporates multiple branches and multi-scale convolutions, it enhances its contextual perception and multi-scale feature extraction capabilities in complex scenes. However, this inevitably leads to increased computational complexity and parameter count. Future improvements can be achieved through knowledge distillation and model pruning to enable model lightweighting without loss, for adaptation in different deployment scenarios.
Furthermore, the self-made dataset employed in this study is partially sourced from an open-source dataset, which, although it captures concrete crack data, lacks the manufacturing features of precast components, thus failing to fully reflect the distribution characteristics of precast structures. In future research, by collecting more comprehensive data from pre-fabrication production lines, a specialized dataset with coupled characteristics of process damage can be constructed, further enhancing the model’s ability to generalize under diverse environmental conditions.
It is also worth noting that PC3D-YOLO has been validated on three distinct datasets, which differ in background textures, crack morphologies, and image acquisition conditions, thereby offering a certain degree of diversity. The model’s consistent performance across these datasets suggests a promising level of generalization to varying environments. However, it has not yet been evaluated on other material types such as steel or marble, nor under challenging conditions such as low-light environments or occlusions. These areas still warrant further investigation to comprehensively evaluate and improve the model’s performance.
Future research could explore the application of this method to other defect detection tasks, such as structural steel frameworks, by fine-tuning the model on domain-specific datasets to verify its generalization capability. In addition, further efforts are needed to enhance the quantitative extraction of crack geometric features—including length, width, and location—to support more accurate structural evaluation and engineering decision-making.

6. Conclusions

To tackle the challenge in detecting cracks of precast concrete components, where image scenes are complex and feature extraction of target objects is difficult, this paper proposes PC3D-YOLO. Using multiple experimental analyses, potential technical solutions for the detection of defects in precast concrete components of prefabricated building structures have been provided. The primary findings of this study can thus be summarized as follows:
(1) By introducing the MSFS module into the original network structure of YOLOv11, multi-scale feature information is extracted, enhancing the communication between different channels and enabling modeling with continuity in both horizontal and vertical directions. Compared to the baseline model, it achieved a significant improvement in recall by 3.8%, along with a 2.0% increase in AP@50.
(2) Introducing the AIFI_M2SA module addresses the issue of feature information loss in the original SPPF module during the feature extraction process. This is accomplished by integrating multi-scale and multi-head attention with channel attention, thereby constructing a stronger global context dependence relationship.
(3) Employing MSCD-Net as the neck network for the improved model, it realizes a rich contextual feature in each scale by focusing and diffusing feature information.
(4) It was evaluated on three datasets using comparative experiments, ablation experiments, and module experiments. The results showed a maximum improvement of 4.9% in recall and 5.5% in AP, further demonstrating the high accuracy of PC3D-YOLO and its adaptability across diverse scenarios.
(5) Compared with two advanced algorithms specifically designed for concrete crack detection, the proposed PC3D-YOLO model achieves superior performance across all three datasets. Notably, on the DECA dataset, it achieves an AP@50 that is 2.5% higher than YOLOv8-CD and 4.1% higher than YOLOv10-DECA. These results further demonstrate the effectiveness and advancement of the proposed approach in the field of concrete crack detection.
In the future, the dataset will be expanded to cover a wider range of defect types, thereby further enhancing the model’s capabilities in classifying different defect types. Additionally, the proposed PC3D-YOLO model shall undergo lightweighting processing to facilitate integration with embedded devices, enabling the deployment of a precast concrete components crack inspection application at the edge.

Author Contributions

Conceptualization, W.G. and Z.K.; methodology, Z.K. and K.G.; software, H.D.; validation, H.D.; investigation, K.G.; resources, A.Y.H.; data curation, A.Y.H.; writing—original draft preparation, Z.K.; writing—review and editing, W.G.; visualization, Y.J.; supervision, Q.G.; project administration, W.G. All authors have read and agreed to the published version of the manuscript.

Funding

This research was funded by National Natural Science Foundation of China (No. 42471388), and The Science Foundation of the Department of Transport of Hubei Province (No. 2023-121-3-4), and National College Students Innovation and Entrepreneurship Training Program (No. S202410490056), and Wuhan Institute of Technology Student President Fund (No. XZJJ2024017).

Data Availability Statement

The raw data supporting the conclusions of this article will be made available by the authors upon request.

Acknowledgments

Thanks to Wuhan Construction New Building Materials Green Industry Science & Technology Co., Ltd. for providing the dataset for this paper.

Conflicts of Interest

The authors declare no conflicts of interest.

References

  1. Wu, H.; Qian, Q.K.; Straub, A.; Visscher, H. Exploring Transaction Costs in the Prefabricated Housing Supply Chain in China. J. Clean. Prod. 2019, 226, 550–563. [Google Scholar] [CrossRef]
  2. Xu, H.; Kim, J.I.; Chen, J. Improved Framework for Estimating Carbon Emissions from Prefabricated Buildings during the Construction Stage: Life Cycle Assessment and Case Study. Build. Environ. 2025, 272, 112599. [Google Scholar] [CrossRef]
  3. Zhou, M.; Wang, J.; Yu, B.; Chen, K. A Quality Management Method for Prefabricated Building Design Based on BIM and VR-Integrated Technology. Appl. Sci. 2024, 14, 1635. [Google Scholar] [CrossRef]
  4. Valinejadshoubi, M.; Bagchi, A.; Moselhi, O. Damage Detection for Prefabricated Building Modules during Transportation. Autom. Constr. 2022, 142, 104466. [Google Scholar] [CrossRef]
  5. Shao, Y.; Zhang, Z.; Liu, X.; Zhu, L.; Han, C.; Li, S.; Du, W. Comprehensive Utilization of Industry By-Products in Precast Concrete: A Critical Review from the Perspective of Physicochemical Characteristics of Solid Waste and Steam Curing Conditions. Materials 2024, 17, 4702. [Google Scholar] [CrossRef] [PubMed]
  6. Zawad, M.R.S.; Zawad, M.F.S.; Rahman, M.A.; Priyom, S.N. A Comparative Review of Image Processing Based Crack Detection Techniques on Civil Engineering Structures. J. Soft Comput. Civ. Eng. 2021, 5, 58–74. [Google Scholar]
  7. Świt, G.; Krampikowska, A.; Tworzewski, P. Non-Destructive Testing Methods for In Situ Crack Measurements and Morphology Analysis with a Focus on a Novel Approach to the Use of the Acoustic Emission Method. Materials 2023, 16, 7440. [Google Scholar] [CrossRef]
  8. Łaziński, P.; Jasiński, M.; Uściłowski, M.; Piotrowski, D.; Ortyl, Ł. GPR in Damage Identification of Concrete Elements—A Case Study of Diagnostics in a Prestressed Bridge. Remote Sens. 2024, 17, 35. [Google Scholar] [CrossRef]
  9. Zhang, H.; Li, H.; Sun, G.; Yang, F. MDA-DETR: Enhancing Offending Animal Detection with Multi-Channel Attention and Multi-Scale Feature Aggregation. Animals 2025, 15, 259. [Google Scholar] [CrossRef]
  10. An, R.; Perez-Cruet, J.M.; Wang, X.; Yang, Y. Build Deep Neural Network Models to Detect Common Edible Nuts from Photos and Estimate Nutrient Portfolio. Nutrients 2024, 16, 1294. [Google Scholar] [CrossRef]
  11. Gan, W.; Pan, J.; Geng, J.; Wang, H.; Hu, X. A Fusion Method for Infrared and Visible Images in All-weather Road Scenes. Geomat. Inf. Sci. Wuhan Univ. 2024. [Google Scholar] [CrossRef]
  12. Ha, Y.S.; Oh, M.; Pham, M.V.; Lee, J.S.; Kim, Y.T. Enhancements in image quality and block detection performance for Reinforced Soil-Retaining Walls under various illuminance conditions. Adv. Eng. Softw. 2024, 195, 103713. [Google Scholar] [CrossRef]
  13. Raushan, R.; Singhal, V.; Jha, R.K. Damage Detection in Concrete Structures with Multi-Feature Backgrounds Using the YOLO Network Family. Autom. Constr. 2025, 170, 105887. [Google Scholar] [CrossRef]
  14. Jiang, Y.; Pang, D.; Li, C. A Deep Learning Approach for Fast Detection and Classification of Concrete Damage. Autom. Constr. 2021, 128, 103785. [Google Scholar] [CrossRef]
  15. Gan, W.; Gu, K.; Geng, J.; Qiu, C.; Yang, R.; Wang, H.; Hu, X. A Novel Three-Stage Collision-Risk Pre-Warning Model for Construction Vehicles and Workers. Buildings 2024, 14, 2324. [Google Scholar] [CrossRef]
  16. Pham, M.V.; Ha, Y.S.; Kim, Y.T. Automatic detection and measurement of ground crack propagation using deep learning networks and an image processing technique. Measurement 2023, 215, 112832. [Google Scholar] [CrossRef]
  17. Li, B.L.; Qi, Y.; Fan, J.S.; Liu, Y.F.; Liu, C. A grid-based classification and box-based detection fusion model for asphalt pavement crack. Comput.-Aided Civ. Infrastruct. Eng. 2023, 38, 2279–2299. [Google Scholar] [CrossRef]
  18. Zhu, G.; Liu, J.; Fan, Z.; Yuan, D.; Ma, P.; Wang, M.; Sheng, W.; Wang, K.C. A lightweight encoder–decoder network for automatic pavement crack detection. Comput.-Aided Civ. Infrastruct. Eng. 2024, 39, 1743–1765. [Google Scholar] [CrossRef]
  19. Zheng, Y.; Gao, Y.; Lu, S.; Mosalam, K.M. Multistage semisupervised active learning framework for crack identification, segmentation, and measurement of bridges. Comput.-Aided Civ. Infrastruct. Eng. 2022, 37, 1089–1108. [Google Scholar] [CrossRef]
  20. Dong, Z.; Zhu, G.; Fan, Z.; Liu, J.; Li, H.; Cai, Y.; Huang, H.; Shi, Z.; Ning, W.; Wang, L. Automatic Pavement Crack Detection Based on YOLOv5-AH. In Proceedings of the 2022 12th International Conference on CYBER Technology in Automation, Control, and Intelligent Systems (CYBER), Baishan, China, 27–31 July 2022; pp. 426–431. [Google Scholar]
  21. Mayya, A.M.; Alkayem, N.F. Triple-stage crack detection in stone masonry using YOLO-ensemble, MobileNetV2U-net, and spectral clustering. Autom. Constr. 2025, 172, 106045. [Google Scholar] [CrossRef]
  22. Li, P.; Wang, M.; Fan, Z.; Huang, H.; Zhu, G.; Zhuang, J. OUR-Net: A multi-frequency network with octave max unpooling and octave convolution residual block for pavement crack segmentation. IEEE Trans. Intell. Transp. Syst. 2024, 25, 13833–13848. [Google Scholar] [CrossRef]
  23. Huang, Y.; Liu, Y.; Liu, F.; Liu, W. A lightweight feature attention fusion network for pavement crack segmentation. Comput.-Aided Civ. Infrastruct. Eng. 2024, 39, 2811–2825. [Google Scholar] [CrossRef]
  24. Fan, Z.; Li, C.; Chen, Y.; Di Mascio, P.; Chen, X.; Zhu, G.; Loprencipe, G. Ensemble of deep convolutional neural networks for automatic pavement crack detection and measurement. Coatings 2020, 10, 152. [Google Scholar] [CrossRef]
  25. Chen, Q.; Luo, X.; Xing, M.; Li, Z. Shaking Table Test of Fully Assembled Precast Concrete Shear Wall Substructure with Tooth Groove Connection and Vertical Reinforcement Lapping in Reserved Hole. J. Build. Eng. 2023, 76, 107151. [Google Scholar] [CrossRef]
  26. Gu, S.; Yang, J.; Shen, S.; Li, X. Investigation on a Novel Reinforcement Method of Grouting Sleeve Connection Considering the Absence of Reserved Reinforcing Bars in the Transition Layer. Materials 2024, 17, 5961. [Google Scholar] [CrossRef] [PubMed]
  27. van Groesen, W.; Pauwels, P. Tracking Prefabricated Assets and Compliance Using Quick Response (QR) Codes, Blockchain and Smart Contract Technology. Autom. Constr. 2022, 141, 104420. [Google Scholar] [CrossRef]
  28. Wei, H.; Liu, X.; Xu, S.; Dai, Z.; Dai, Y.; Xu, X. DWRSeg: Rethinking Efficient Acquisition of Multi-scale Contextual Information for Real-time Semantic Segmentation. arXiv 2023. [Google Scholar] [CrossRef]
  29. Zhao, Y.; Lv, W.; Xu, S.; Wei, J.; Wang, G.; Dang, Q.; Liu, Y.; Chen, J. Detrs Beat Yolos on Real-Time Object Detection. In Proceedings of the IEEE/CVF Conference on Computer Vision and Pattern Recognition, Seattle, WA, USA, 17–18 June 2024; pp. 16965–16974. [Google Scholar]
  30. He, Z.; Cao, L. SOD-YOLO: Small Object Detection Network for UAV Aerial Images. Ieej Trans. Electr. Electron. Eng. 2025, 20, 431–439. [Google Scholar] [CrossRef]
  31. Wu, H.; Huang, P.; Zhang, M.; Tang, W.; Yu, X. CMTFNet: CNN and Multiscale Transformer Fusion Network for Remote-Sensing Image Semantic Segmentation. IEEE Trans. Geosci. Remote Sens. 2023, 61, 1–12. [Google Scholar] [CrossRef]
  32. Yang, H.; Wang, L.; Pan, Y.; Chen, J.J. A Teacher-Student Framework Leveraging Large Vision Model for Data Pre-Annotation and YOLO for Tunnel Lining Multiple Defects Instance Segmentation. J. Ind. Inf. Integr. 2025, 44, 100790. [Google Scholar] [CrossRef]
  33. Guo, Y.; Chen, S.; Zhan, R.; Wang, W.; Zhang, J. LMSD-YOLO: A Lightweight YOLO Algorithm for Multi-Scale SAR Ship Detection. Remote Sens. 2022, 14, 4801. [Google Scholar] [CrossRef]
  34. Zhao, G.; Dong, S.; Wen, J.; Ban, Y.; Zhang, X. Selective Fruit Harvesting Prediction and 6D Pose Estimation Based on YOLOv7 Multi-Parameter Recognition. Comput. Electron. Agric. 2025, 229, 109815. [Google Scholar] [CrossRef]
  35. Deep Learning Project. CRACKS_MANISHA Dataset. 2024. Available online: https://universe.roboflow.com/deep-learning-project-yf7cd/cracks_manisha (accessed on 3 June 2025).
  36. Zhang, C.; Peng, N.; Yan, J.; Wang, L.; Chen, Y.; Zhou, Z.; Zhu, Y. A Novel YOLOv10-DECA Model for Real-Time Detection of Concrete Cracks. Buildings 2024, 14, 3230. [Google Scholar] [CrossRef]
  37. Dorafshan, S.; Thomas, R.J.; Maguire, M. SDNET2018: An Annotated Image Dataset for Non-Contact Concrete Crack Detection Using Deep Convolutional Neural Networks. Data Brief 2018, 21, 1664–1668. [Google Scholar] [CrossRef] [PubMed]
  38. Aly, G.H.; Marey, M.; El-Sayed, S.A.; Tolba, M.F. YOLO Based Breast Masses Detection and Classification in Full-Field Digital Mammograms. Comput. Methods Programs Biomed. 2021, 200, 105823. [Google Scholar] [CrossRef] [PubMed]
  39. Chen, Y.; Xu, H.; Zhang, X.; Gao, P.; Xu, Z.; Huang, X. An Object Detection Method for Bayberry Trees Based on an Improved YOLO Algorithm. Int. J. Digit. Earth 2023, 16, 781–805. [Google Scholar] [CrossRef]
  40. Mirhaji, H.; Soleymani, M.; Asakereh, A.; Mehdizadeh, S.A. Fruit Detection and Load Estimation of an Orange Orchard Using the YOLO Models through Simple Approaches in Different Imaging and Illumination Conditions. Comput. Electron. Agric. 2021, 191, 106533. [Google Scholar] [CrossRef]
  41. Ren, S.; He, K.; Girshick, R.; Sun, J. Faster R-CNN: Towards Real-Time Object Detection with Region Proposal Networks. IEEE Trans. Pattern Anal. Mach. Intell. 2016, 39, 1137–1149. [Google Scholar] [CrossRef]
  42. Lin, T.Y.; Goyal, P.; Girshick, R.; He, K.; Dollár, P. Focal Loss for Dense Object Detection. In Proceedings of the IEEE International Conference on Computer Vision, Venice, Italy, 22–29 October 2017; pp. 2980–2988. [Google Scholar]
  43. Liu, W.; Anguelov, D.; Erhan, D.; Szegedy, C.; Reed, S.; Fu, C.Y.; Berg, A.C. SSD: Single Shot MultiBox Detector. In Computer Vision – ECCV 2016; Leibe, B., Matas, J., Sebe, N., Welling, M., Eds.; Springer International Publishing: Cham, Switzerland, 2016; Volume 9905, pp. 21–37. [Google Scholar] [CrossRef]
  44. Lu, J.; Song, W.; Zhang, Y.; Yin, X.; Zhao, S. Real-Time Defect Detection in Underground Sewage Pipelines Using an Improved YOLOv5 Model. Autom. Constr. 2025, 173, 106068. [Google Scholar] [CrossRef]
  45. Li, C.; Li, L.; Jiang, H.; Weng, K.; Geng, Y.; Li, L.; Ke, Z.; Li, Q.; Cheng, M.; Nie, W.; et al. YOLOv6: A Single-Stage Object Detection Framework for Industrial Applications. arXiv 2022. [Google Scholar] [CrossRef]
  46. Wang, C.Y.; Bochkovskiy, A.; Liao, H.Y.M. YOLOv7: Trainable Bag-of-Freebies Sets New State-of-the-Art for Real-Time Object Detectors. In Proceedings of the IEEE/CVF Conference on Computer Vision and Pattern Recognition, Vancouver, BC, Canada, 17–24 June 2023; pp. 7464–7475. [Google Scholar]
  47. Varghese, R.; Sambath, M. Yolov8: A Novel Object Detection Algorithm with Enhanced Performance and Robustness. In Proceedings of the 2024 International Conference on Advances in Data Engineering and Intelligent Computing Systems (ADICS), Chennai, India, 18–19 April 2024; pp. 1–6. [Google Scholar]
  48. Wang, C.Y.; Yeh, I.H.; Mark Liao, H.Y. YOLOv9: Learning What You Want to Learn Using Programmable Gradient Information. In Computer Vision—ECCV 2024; Leonardis, A., Ricci, E., Roth, S., Russakovsky, O., Sattler, T., Varol, G., Eds.; Springer Nature: Cham, Switzerland, 2025; Volume 15089, pp. 1–21. [Google Scholar] [CrossRef]
  49. Wang, A.; Chen, H.; Liu, L.; Chen, K.; Lin, Z.; Han, J. Yolov10: Real-time End-to-End Object Detection. Adv. Neural Inf. Process. Syst. 2024, 37, 107984–108011. [Google Scholar]
  50. Dong, X.; Liu, Y.; Dai, J. Concrete Surface Crack Detection Algorithm Based on Improved YOLOv8. Sensors 2024, 24, 5252. [Google Scholar] [CrossRef] [PubMed]
  51. Ding, X.; Zhang, X.; Han, J.; Ding, G. Diverse Branch Block: Building a Convolution as an Inception-like Unit. In Proceedings of the IEEE/CVF Conference on Computer Vision and Pattern Recognition, Nashville, TN, USA, 20–25 June 2021; pp. 10886–10895. [Google Scholar]
  52. Zhang, X.; Liu, C.; Yang, D.; Song, T.; Ye, Y.; Li, K.; Song, Y. RFAConv: Innovating Spatial Attention and Standard Convolutional Operation. arXiv 2024. [Google Scholar] [CrossRef]
Figure 1. The network structure of PC3D-YOLO.
Buildings 15 02225 g001
Figure 2. The network structure of the MSFS module.
Buildings 15 02225 g002
Figure 3. The structural layout of SPPF network.
Buildings 15 02225 g003
Figure 4. AIFI network structure.
Buildings 15 02225 g004
Figure 5. M2SA network structure.
Buildings 15 02225 g005
Figure 6. A comparative study of two network structures. (a) The PAN-FPN network structure. (b) The MSCD-Net network architecture.
Buildings 15 02225 g006
Figure 7. Network structure of feature fusion.
Buildings 15 02225 g007
Figure 8. Typical images in the CRACKS_MANISHA dataset.
Buildings 15 02225 g008
Figure 9. Typical images in the DECA dataset.
Buildings 15 02225 g009
Figure 10. A visualization of YOLO series model detection results.
Buildings 15 02225 g010
Figure 11. YOLOV11 and PC3D-YOLO feature extraction heatmaps.
Buildings 15 02225 g011
Figure 12. Visualization of reception fields. Among these, the lower the gray value, the higher the model’s attention on that region.
Buildings 15 02225 g012
Table 1. Dataset splitting details.
DatasetsPC3CRACKS_MANISHA [35]DECA [36]
Trainning Sets392619741567
Validation Sets982494392
Resolution450 × 600512 × 5121000 × 1000
Table 2. Statistical analysis of comparative experiment results on the PC3 dataset.
ModelPrecision (%)Recall (%)AP@50 (%)AP@50-95 (%)FPS
Faster R-CNN [41]81.367.678.348.729.6
FCOS [42]72.273.673.939.141.2
SSD-512 [43]74.767.177.441.144.7
YOLOv5 [44]79.075.180.149.347.3
YOLOv6 [45]84.370.281.856.148.0
YOLOv7 [46]80.460.872.236.248.7
YOLOv8 [47]85.776.583.462.977.4
YOLOv9 [48]80.673.681.758.161.5
YOLOv10 [49]83.972.181.357.364.4
YOLOv1184.975.483.561.068.4
YOLOv8-CD [50]85.473.584.262.773.8
YOLOv10-DECA [36]83.177.884.865.053.8
PC3D-YOLO87.278.886.365.662.3
Table 3. Statistical analysis of comparative experiment results on the CRACKS_MANISHA dataset.
ModelPrecision (%)Recall (%)AP@50 (%)AP@50-95 (%)FPS
Faster R-CNN66.353.864.039.929.5
FCOS68.851.065.348.441.2
SSD-51273.759.671.543.844.9
YOLOv581.366.371.945.647.2
YOLOv676.365.875.858.948.2
YOLOv778.868.872.247.948.6
YOLOv892.372.680.563.877.5
YOLOv978.968.872.547.761.5
YOLOv1090.571.479.363.664.4
YOLOv1191.173.579.862.168.3
YOLOv8-CD92.973.280.766.873.6
YOLOv10-DECA89.568.978.161.953.8
PC3D-YOLO94.776.583.167.662.4
Table 4. Statistical analysis of comparative experiment results on the DECA dataset.
ModelPrecision (%)Recall (%)AP@50 (%)AP@50-95 (%)FPS
Faster R-CNN73.857.871.742.629.6
FCOS69.358.668.941.241.4
SSD-51271.762.469.739.744.8
YOLOv579.778.980.948.547.1
YOLOv682.379.787.565.947.9
YOLOv772.978.979.047.348.6
YOLOv882.581.787.466.577.5
YOLOv982.883.187.465.861.5
YOLOv1081.277.283.664.264.2
YOLOv1183.277.687.666.768.5
YOLOv8-CD84.583.587.469.573.9
YOLOv10-DECA84.878.386.566.354.0
PC3D-YOLO88.782.489.769.962.5
Table 5. Results of ablation experiment on the PC3 dataset.
NumMSFSAIFI_M2SAMSCD-NetPrecision (%)Recall (%)AP@50 (%)AP@50-95 (%)
A×××84.975.483.561.0
B🗸××85.978.285.563.7
C×🗸×86.076.185.463.3
D××🗸85.477.385.163.2
E🗸🗸×87.178.685.764.8
F🗸×🗸85.677.385.964.0
G×🗸🗸86.378.385.664.3
H🗸🗸🗸87.278.886.365.6
Table 6. Results of ablation experiment on the CRACKS_MANISHA dataset.
NumMSFSAIFI_M2SAMSCD-NetPrecision (%)Recall (%)AP@50 (%)AP@50-95 (%)
A×××91.073.579.862.1
B🗸××91.573.781.265.6
C×🗸×92.974.280.563.6
D××🗸91.974.781.666.5
E🗸🗸×93.875.481.866.9
F🗸×🗸93.175.982.267.4
G×🗸🗸86.494.176.282.4
H🗸🗸🗸94.776.583.167.6
Table 7. Results of ablation experiment on the DECA dataset.
NumMSFSAIFI_M2SAMSCD-NetPrecision (%)Recall (%)AP@50 (%)AP@50-95 (%)
A×××83.177.587.666.7
B🗸××83.577.888.567.8
C×🗸×84.379.987.967.7
D××🗸85.979.588.868.5
E🗸🗸×85.581.588.967.9
F🗸×🗸85.779.289.368.9
G×🗸🗸86.481.788.668.6
H🗸🗸🗸88.782.489.769.9
Table 8. An experimental comparison of MSFS module.
ModelPrecision (%)Recall (%)AP@50 (%)AP@50-95 (%)
YOLOv1184.975.483.561.0
+DBB85.576.884.561.9
+RFAConv85.274.484.362.0
+DWR84.175.984.962.7
+MSFS85.978.285.563.7
Table 9. Results of experiments with various mixing groups.
GroupsPrecision (%)Recall (%)AP@50 (%)AP@50-95 (%)
185.275.884.561.5
285.476.884.361.9
485.677.385.062.8
885.978.285.563.7
1684.775.884.262.3
Disclaimer/Publisher’s Note: The statements, opinions and data contained in all publications are solely those of the individual author(s) and contributor(s) and not of MDPI and/or the editor(s). MDPI and/or the editor(s) disclaim responsibility for any injury to people or property resulting from any ideas, methods, instructions or products referred to in the content.

