Article

Shaking Table Test of a Subway Station–Soil–Aboveground Structures Interaction System: Structural Impact on the Field

1
Institute of Earthquake Protection and Disaster Mitigation, Lanzhou University of Technology, Lanzhou 730050, China
2
China Institute of Building Standard Design & Research Co., Ltd., Beijing 100044, China
3
Gansu Construction Traffic Construction Co., Ltd., Lanzhou 730050, China
*
Authors to whom correspondence should be addressed.
Buildings 2025, 15(13), 2223; https://doi.org/10.3390/buildings15132223
Submission received: 15 May 2025 / Revised: 16 June 2025 / Accepted: 18 June 2025 / Published: 25 June 2025
(This article belongs to the Section Building Structures)

Abstract

The seismic design of underground or aboveground structures is commonly based on the free-field assumption, which neglects the interaction between underground structures–soil–aboveground structures (USSI). This simplification may lead to unsafe or overly conservative, cost-intensive designs. To address this limitation, a series of shaking table tests were conducted on a coupled USSI system, in which the underground component consisted of a subway station connected to tunnels through structural joints to investigate the “city effect” on-site seismic response, particularly under long-period horizontal seismic excitations. Five test configurations were developed, including combinations of one or two aboveground structures, with or without a subway station. These were compared to a free-field case to evaluate differences in dynamic characteristics, acceleration amplification factors (AMFs), frequency content, and response spectra. The results confirm that boundary effects were negligible in the experimental setup. Notably, long-period seismic inputs had a detrimental impact on the field response when structures were present, with the interaction effects significantly altering surface motion characteristics. The findings demonstrate that the presence of a subway station and/or aboveground structure alters the seismic response of the soil domain, with clear dependence on the input motion characteristics and relative structural positioning. Specifically, structural systems lead to de-amplification under high-frequency excitations, while under long-period inputs, they suppress short-period responses and amplify long-period components. These insights emphasize the need to account for USSI effects in seismic design and retrofitting strategies, particularly in urban environments, to achieve safer and more cost-effective solutions.

1. Introduction

In recent years, the rapid population growth in urban cities has led to an increase in underground structures and a reduction in the spatial distance between underground structures and aboveground structures. As a result, the behavior of structures, including underground, aboveground structures, and the surrounding field, is not independent. The complex dynamic interactions between underground structures, soil, and aboveground structures in urban areas can be called “city effects” [1,2], which can significantly change the wave field of seismic wave propagation, causing the input ground motion field to be different from the free-field vibration and affecting the seismic response of the structures (including both underground and aboveground structures).
When an aboveground building stands near an underground facility, the building’s inertia affects the surrounding shear-wave field. This changes the ground motions and stress transmitted to the soil, influences the soil-yielding response, and, in turn, alters the response of the underground structure. Conversely, an underground structure interrupts wave transmission through the soil; reflections and refractions at its interfaces can reduce the ground motion reaching the surface and affect the performance of nearby buildings [3,4,5,6,7,8,9,10,11,12,13,14]. As the ground itself mediates these two-way interactions, an accurate assessment of seismic “city effects” is essential.
However, the available seismic design methods for not only underground but also aboveground structures usually assume free-field conditions, precluding the existence of structures discussed above. For the seismic design of aboveground structures, acceleration design response spectra at the ground surface are the main parameters used for seismic design in urban areas, which ignores the effect of surrounding aboveground and underground structures. For underground structures, some form of dynamic earth pressure is applied to the underground structure design, assuming that free-field deformation controls the structure, and then pseudo-static and simplified dynamic analyses with uncoupled approaches are suggested by the guidelines [15] on the basis of neglecting the effect of surrounding structures on the field. All the above could lead to an erroneous evaluation of the inputs and further lead to inaccurate designs for structures because of the lack of a full dynamic analysis, including USSI (underground structure–soil–aboveground structure interaction) and plastic soil behavior. Therefore, research on the effect of structures on the field is essential for achieving the most reliable seismic design of such structures.
Recognizing the impact of “city effects,” researchers have mainly examined either underground structure–soil interaction [16,17,18,19,20,21,22,23] or soil–surface building interaction [20,24,25]. Studies that investigate the entire underground–soil–surface system remain limited, although they are increasingly relevant as densely spaced projects become common. Notably, Mroueh and Shahrour [26] used fully three-dimensional models to analyze how constructing a lined tunnel affects nearby buildings. Such work underscores that a fully coupled underground–soil–surface analysis is essential for safe and economical seismic design. Azadi and Hosseini [27] used the PLAXIS-2D finite method to show that earthquake-induced horizontal displacement and bending moments in buildings near a new tunnel highly depend on the structural type and input–motion frequency. Yioutra-Mitra [22], applying a finite-difference model, examined the impact of an SV wave incident on a single circular tunnel and demonstrated its influence on a surface building in an elastic half-space. Tzarmados [28] extended the inquiry to rectangular tunnels and nearby buildings, finding that surface structures amplify tunnel deformation, whereas small tunnels have little effect on the buildings when their size is short relative to the seismic wavelength. Guo et al. [29] quantified inter-story drifts in buildings adjacent to tunnels through generalized drift spectra. Pitilakis et al. [24] carried out a series of FEM studies on circular tunnels beneath single and multiple buildings, while Abate and Massimino [30,31] used a fully coupled model to explore how tunnel depth, building position, and earthquake characteristics govern the seismic behavior of the combined system.
Most prior research relies on theory or numerical simulations; experimental studies of the fully coupled USSI system are rare. Xu [29] conducted the first large-scale shaking table test on an underground structure–pile–soil–building system modeled on the Tianjin transit project in China. However, the surface building had little influence on the station for two reasons: first, the aboveground structure size considered in the test was too small; and second, the aboveground structural form considered in his article was a special one, which was connected to the station to form a integrated structure when constructed. Recently, Wang et al. [32], informed by their numerical research [33], performed a series of shaking table tests on a tunnel–soil–building system but included only a single building above the tunnel.
However, a subway station that has joints connecting with tunnels differs from a tunnel in terms of the mechanical and vibration characteristics attributed to its distinct structural form. In addition, there is often more than one aboveground structure around the subway station in urban areas. Furthermore, most of the mentioned studies mainly focused on the response of structures. Little research has focused on the seismic response of the field, which is the key factor in structural design in the long-period ground motions, which may induce more severe damage in soft soil than other ground motions because of the long fundamental period of the system.
It can be seen from the above discussion that there is a need to quantify the response of the field considering the “city effect” with various input motions and provide empirical data by calibrating simplified analytical models and complex dynamic models in the future, which will influence structural designs.
This study seeks to address this need using a series of shaking table tests under a sequence of shakes, which include (a) a free-field system (FF); (b) a single aboveground structure–soil interaction system (I); (c) a multiple aboveground structures–soil interaction system (IS); (d) a subway station with tunnel connecting joints–soil interaction system (U); (e) a subway station with tunnel connecting joints–soil–single aboveground structure interaction system (UI); and (f) a subway station with tunnel-connecting joints–soil–multiple aboveground structures interaction system (UIS), respectively. In particular, answers are sought to the questions listed below.
To meet this objective, a series of shaking table programs was carried out, consisting of six configurations: FF—free-field soil; I—soil with one surface building; IS—soil with multiple surface buildings; U—soil with a subway station and tunnels; UI—a subway station–soil system with one surface building; and UIS—a subway station–soil system with multiple surface buildings.
The tests address five key questions:
  • Can the test solve the boundary problem effectively?
  • For the free field, what is the effect of long-period earthquakes on the field response?
  • For the free field, what is the effect of a subway station with joints on the field response?
  • For the free field, what is the effect of aboveground structures on the field response?
  • For the free field, what is the effect of structures on the field response spectra?
The rest of this paper is organized as follows: Section 2 outlines the experimental facility. Section 3 details model scaling, soil preparation, and structural prototypes. Section 4 evaluates boundary performance. Section 5 presents acceleration results in both the time and frequency domains.

2. USSI Experimental Equipment and Design

All tests were conducted at the State Key Laboratory for Disaster Reduction in Civil Engineering, Tongji University. The shaking table specifications can be seen in Table 1.

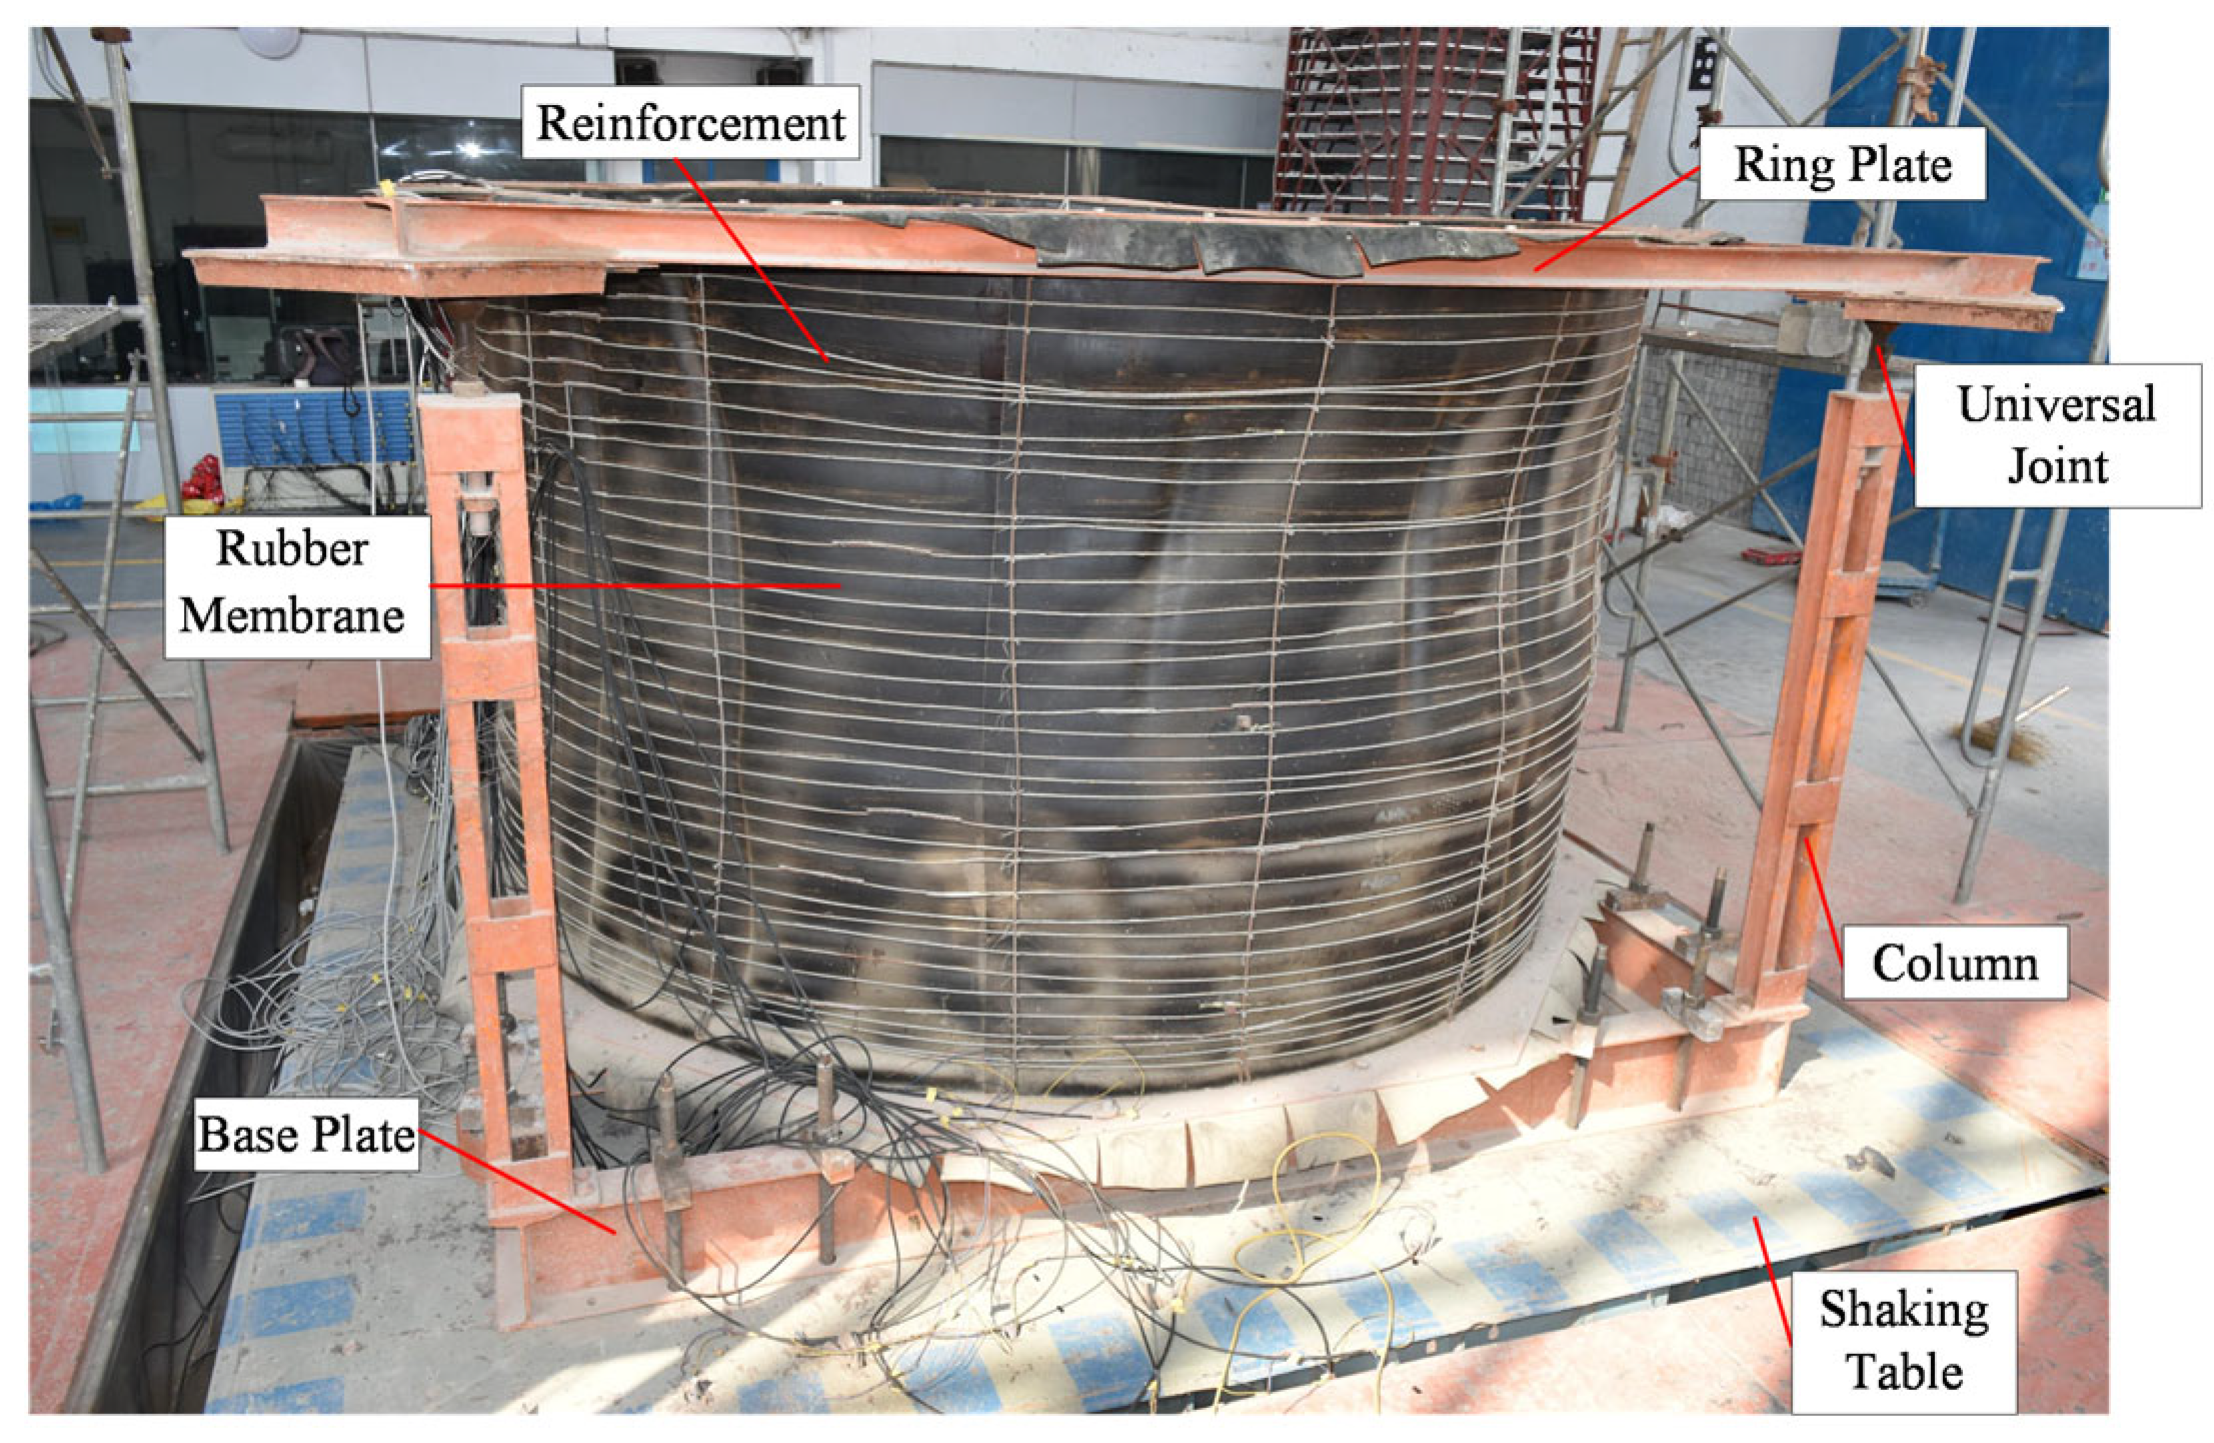
2.1. Model Soil Container

This study employed a flexible-wall container that confines a circular soil column while permitting horizontal shear deformation, approximating free-field conditions under predominantly horizontal shaking. The concept originated with Meymand [34], who, in 1998, developed a 2.29 m diameter, 2.13 m high container at the University of California, Berkeley, to study pile–soil interaction. Tests confirmed that the container replicated free-field soil behavior. Moss [35] later refurbished the container, using a 1.5 m high version (diameter ≈ 2.3 m) to model a tunnel section in saturated clay. Building on this work, Chen [2] constructed a 2.06 m high container holding a 3 m diameter soil column, further demonstrating minimal boundary effects. Subsequent field shaking table experiments with the same container type [36,37] showed that boundary influence is negligible when the structure is sufficiently distant from the wall. Consistent with those findings and the boundary assessment in Section 4 discussed later, the boundary effects on the dynamic response in the present tests can be disregarded.
The fully assembled test container was 2.058 m in height and confined a soil column with a diameter of 3 m, as shown in Figure 1. It consisted of a lateral rubber membrane with a thickness of 5 mm, reinforcement bars with a diameter of 4 mm and a spacing of 60 mm to strengthen the outside of the box, an upper ring plate, a base plate, and columns that supported the upper ring plate. Bolts were used to fix the membrane to the plates. A height-adjustable screw rod and universal joint were installed to adjust the cylinder and allow the ring plate to deform laterally, respectively. More details are given in [2].

2.2. Similitude Theory

Scale-model studies rely on appropriate scaling laws. Meymand [34] outlines three main approaches, listed here in order of increasing complexity: (1) dimensional analysis, (2) similitude theory, and (3) the method of governing equations. Dimensional analysis converts a physically consistent equation into a set of dimensionless groups based on the fundamental dimensions of mass, length, and time. Similitude theory—often expressed through the Buckingham π theorem [38]—extends this process by identifying the dominant forces in the system and incorporating them into dimensionless terms. The method of governing equations is the most comprehensive and powerful of the three. It recasts the full differential equations of the system in a non-dimensional form.
Balancing generality and practicality, the Buckingham π theorem was adopted to derive the scaling relations used in this study. The Buckingham π theorem, expressed in the elasticity range, can be expressed by the following formula:
f ( σ , l , E , ρ , t , u , v , a , g , f ) = 0
where σ, l, E, ρ, u, v, a, g, and f are stress, length, elastic modulus, density, time, displacement, velocity, acceleration, gravity acceleration, and frequency, respectively.
Similitude ratio design plays a crucial role in shaking table tests to model a dynamic structure–soil–structure interaction system. To ensure that the model can realistically reproduce the actual working state of prototype structures to the greatest extent, the key parameters determining the experimental results should be selected according to the purpose of the experiment, and their similitude ratios should be made as consistent as possible.
As the primary objective was to study the field response in the subway station–soil–aboveground structure interaction system, the following basic principles were used to design the similitude ratio for the model test:
  • Uniform similitude ratios for the structures and soil should be considered;
  • The loss of gravity was allowed, and no additional weight was added to the soil owing to the complications of adding artificial mass to the soil;
  • The similitude ratio design should be based on the size and bearing capacity of the shaking table and the size of the soil container.
Based on the above principles and the Buckingham π theory, the similitude ratios of the length, acceleration, and elastic modulus were selected as essential parameters, and then, the other quantities were deduced:
f ( σ E , ρ E / a l , t l / E , u l , v a l , g a , f a / l ) = 0
where σ E , ρ E / a l , t l / E , u l , v a l , g a , and f a / l are dimensionless parameters that ensure similarity between the prototype and the model, requiring them to be equal in value.
According to Formula (2), each similar ratio needs to satisfy the following relationship:
S σ = S E S ρ = S σ / ( S a S l ) S m = S σ S l 2 / ( S a ) S t = S l / S a S v = S a S l S f = S a / S l
As the acceleration of gravity cannot change, it is difficult to make all the above factors satisfy the relationship. If S a = S g = 1 , S ρ = S σ / S l , the geometric similarity ratio of the soil–underground structural system is usually small, generally less than 1:20, and usually, S ρ is less than the unit, too. In order to satisfy such a similarity relationship, S σ needs to be less than 1:20, which means that the material of the model soil should be as soft as it can be; otherwise, it will lead to “distorted” models with inaccurate predictions of the prototype response. Therefore, only the gravity distortion model can be adopted to satisfy the similarity theory.
According to the above analysis, a geometric scale of 1:30 was selected as an optimal balance between similitude requirements, material properties, and equipment constraints. This scale ensured the full model system could fit within the shaking table and soil container. Moreover, it allowed the manageable construction of structural components such as tunnel joints and maintained acceptable scaling distortion under the gravity-distorted similitude framework. To accommodate the table’s load capacity, acceleration was scaled by a factor of 2.0. Organic glass [37]—chosen for its uniformity, high strength, and relatively low elastic modulus—served as the model–structure material. As its elastic modulus is 2.6 GPa versus 30 GPa for concrete, the modulus scale factor is 2.6/30. The resulting similarity ratios for both the surface buildings and the subway station are summarized in Table 2.

2.3. Material and Designation of the Model
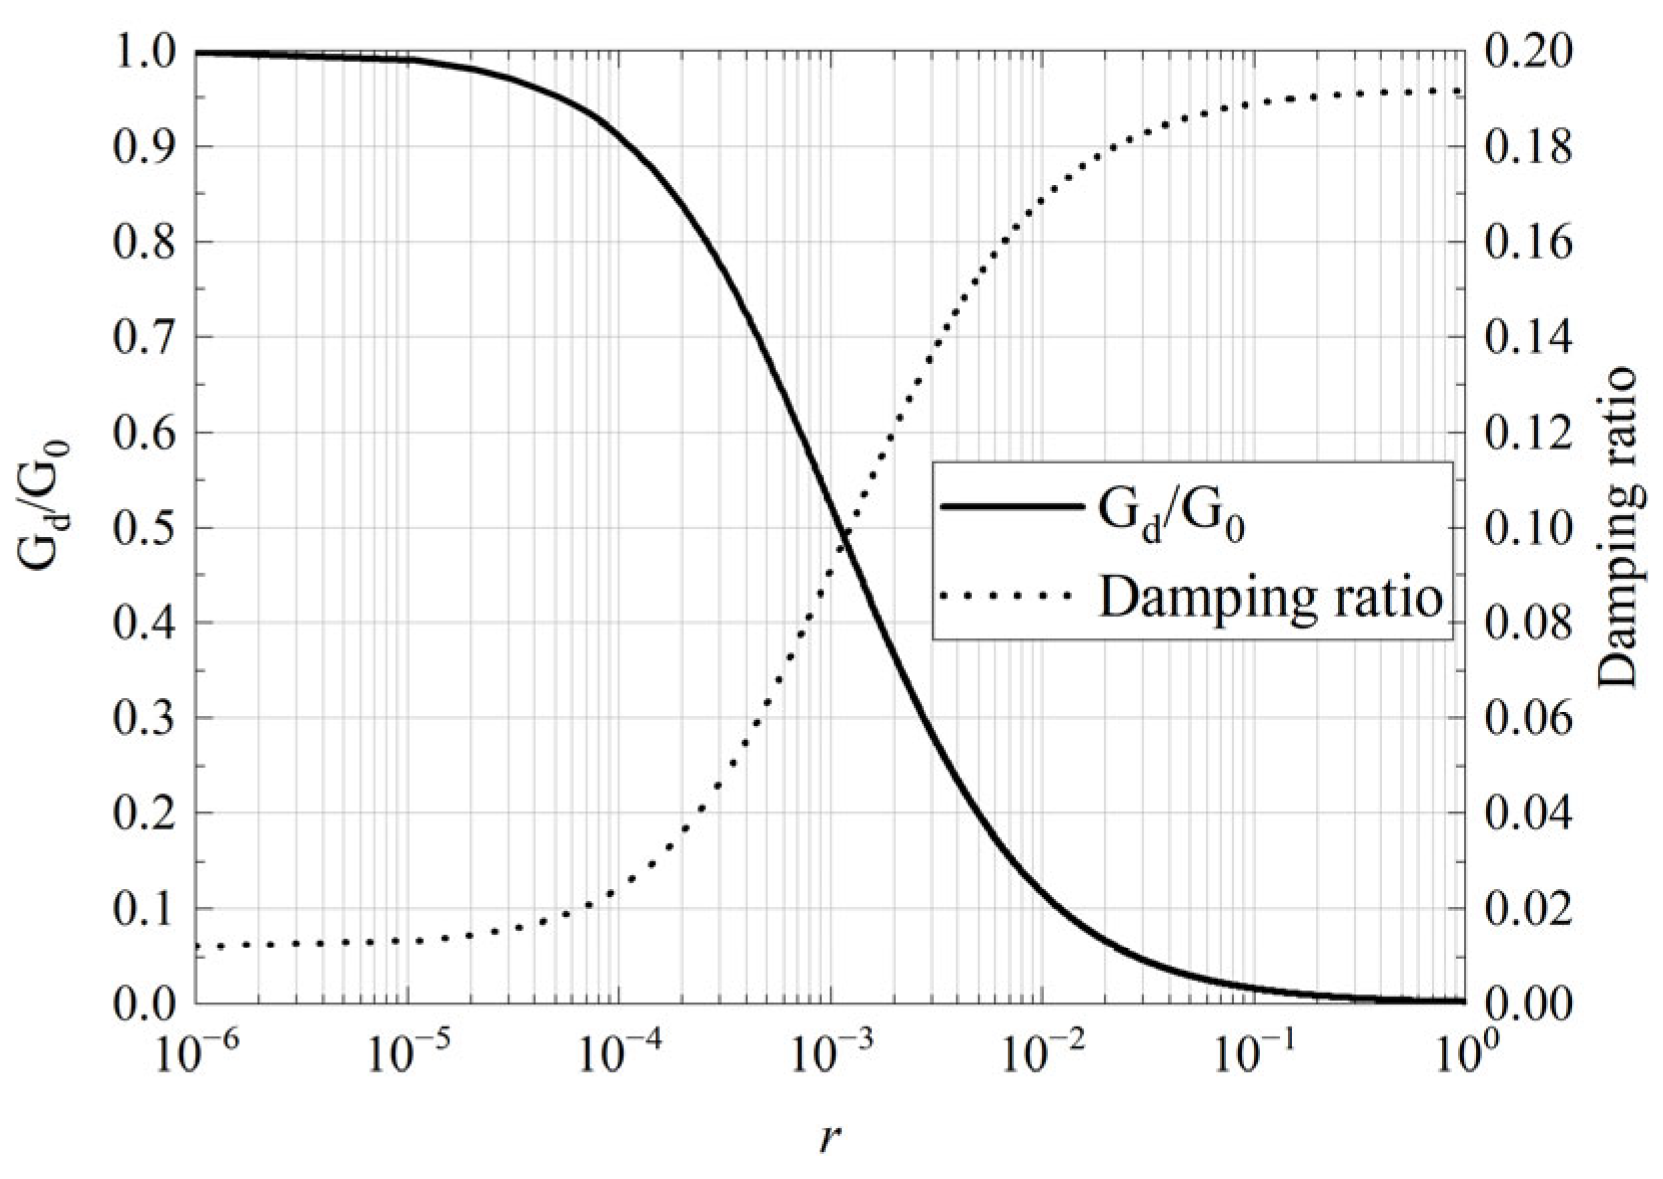
2.3.1. Model Soil

To reduce specimen weight without compromising soft-soil behavior, a lightweight synthetic soil [39,40,41] blended from sawdust and sand in a 1:2.5 mass ratio was used, which is a mixture commonly adopted for shaking table models [42].
Martin and Seed [43] developed the normalized shear modulus degradation of model soil with shear:
G d G 0 = 1 ( γ d / γ 0 ) 2 B 1 + ( γ d / γ 0 ) 2 B A ,
where G d is the dynamic shear modulus of soil, γ d is the dynamic shear strain, G 0 is the initial dynamic shear modulus of soil, and A and B are fitting values. The shear strain and damping ratio with shear strain are usually used in engineering:
D = D m i n + D 0 1 G d G 0 β ,
where D m i n is the basic damping ratio of the soil, and D 0 , as well as β , are the shape factors of the damping ratio curve. As the soil used in these tests and Yang’s [44] were from the same manufacturer, the results of the cyclic triaxial test are listed in Table 3, and the soil stiffness degradation and damping curve are shown in Figure 2.
To avoid non-uniform density in the model ground, the soil was placed in 20 mm layers. Each layer was compacted with a hand hammer and then leveled with a plank. Random samples from every layer were tested to confirm consistent density throughout the model ground.

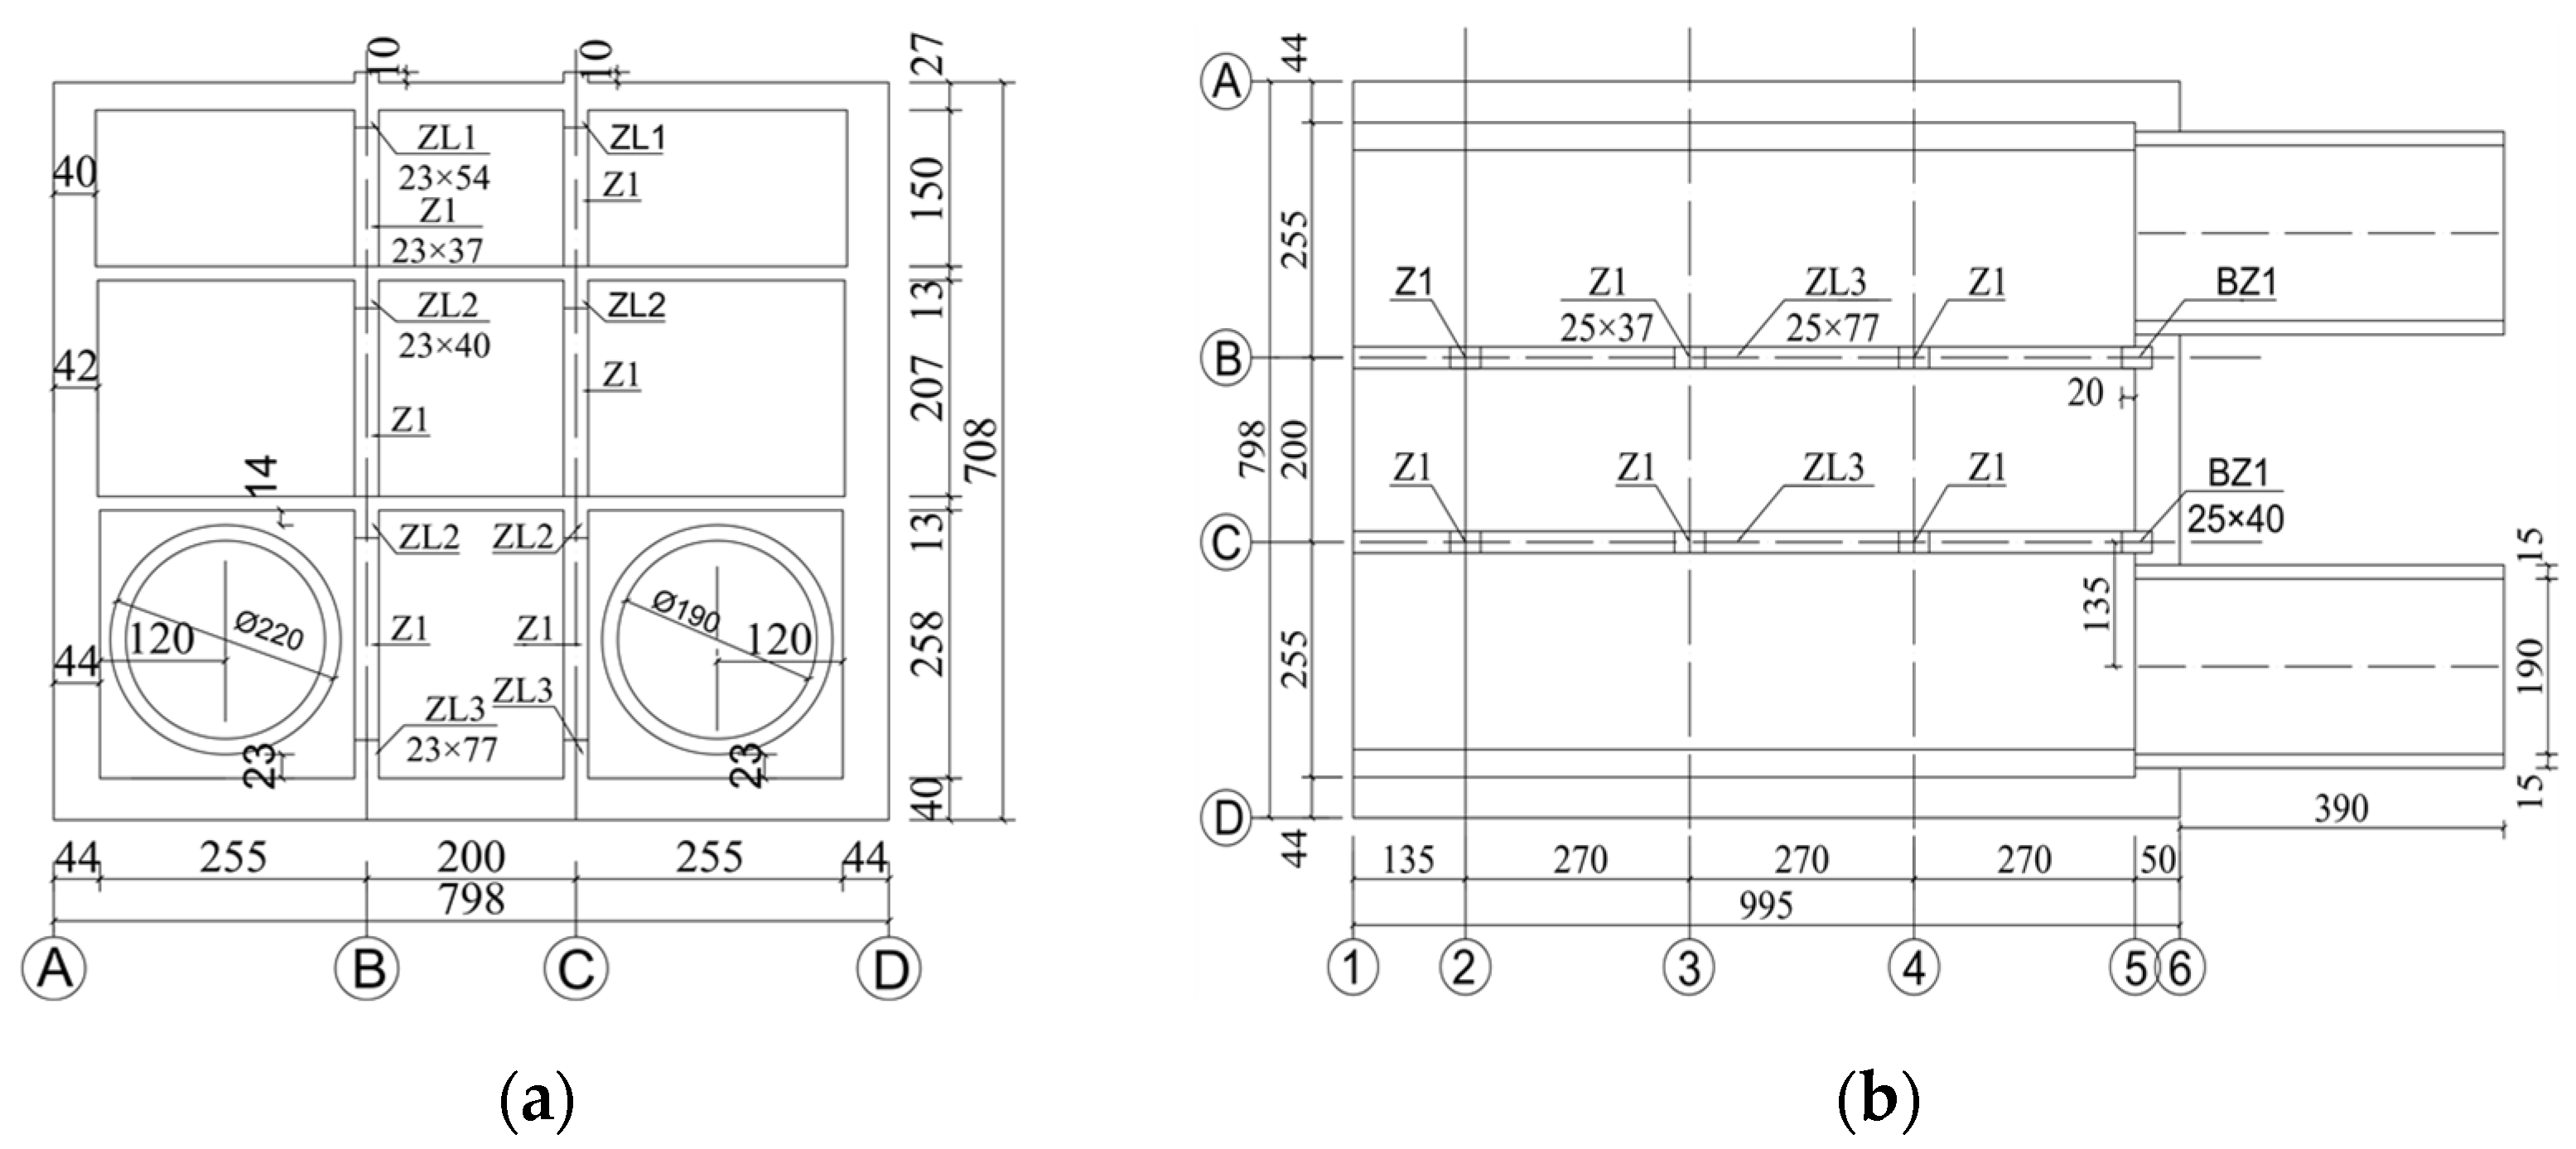
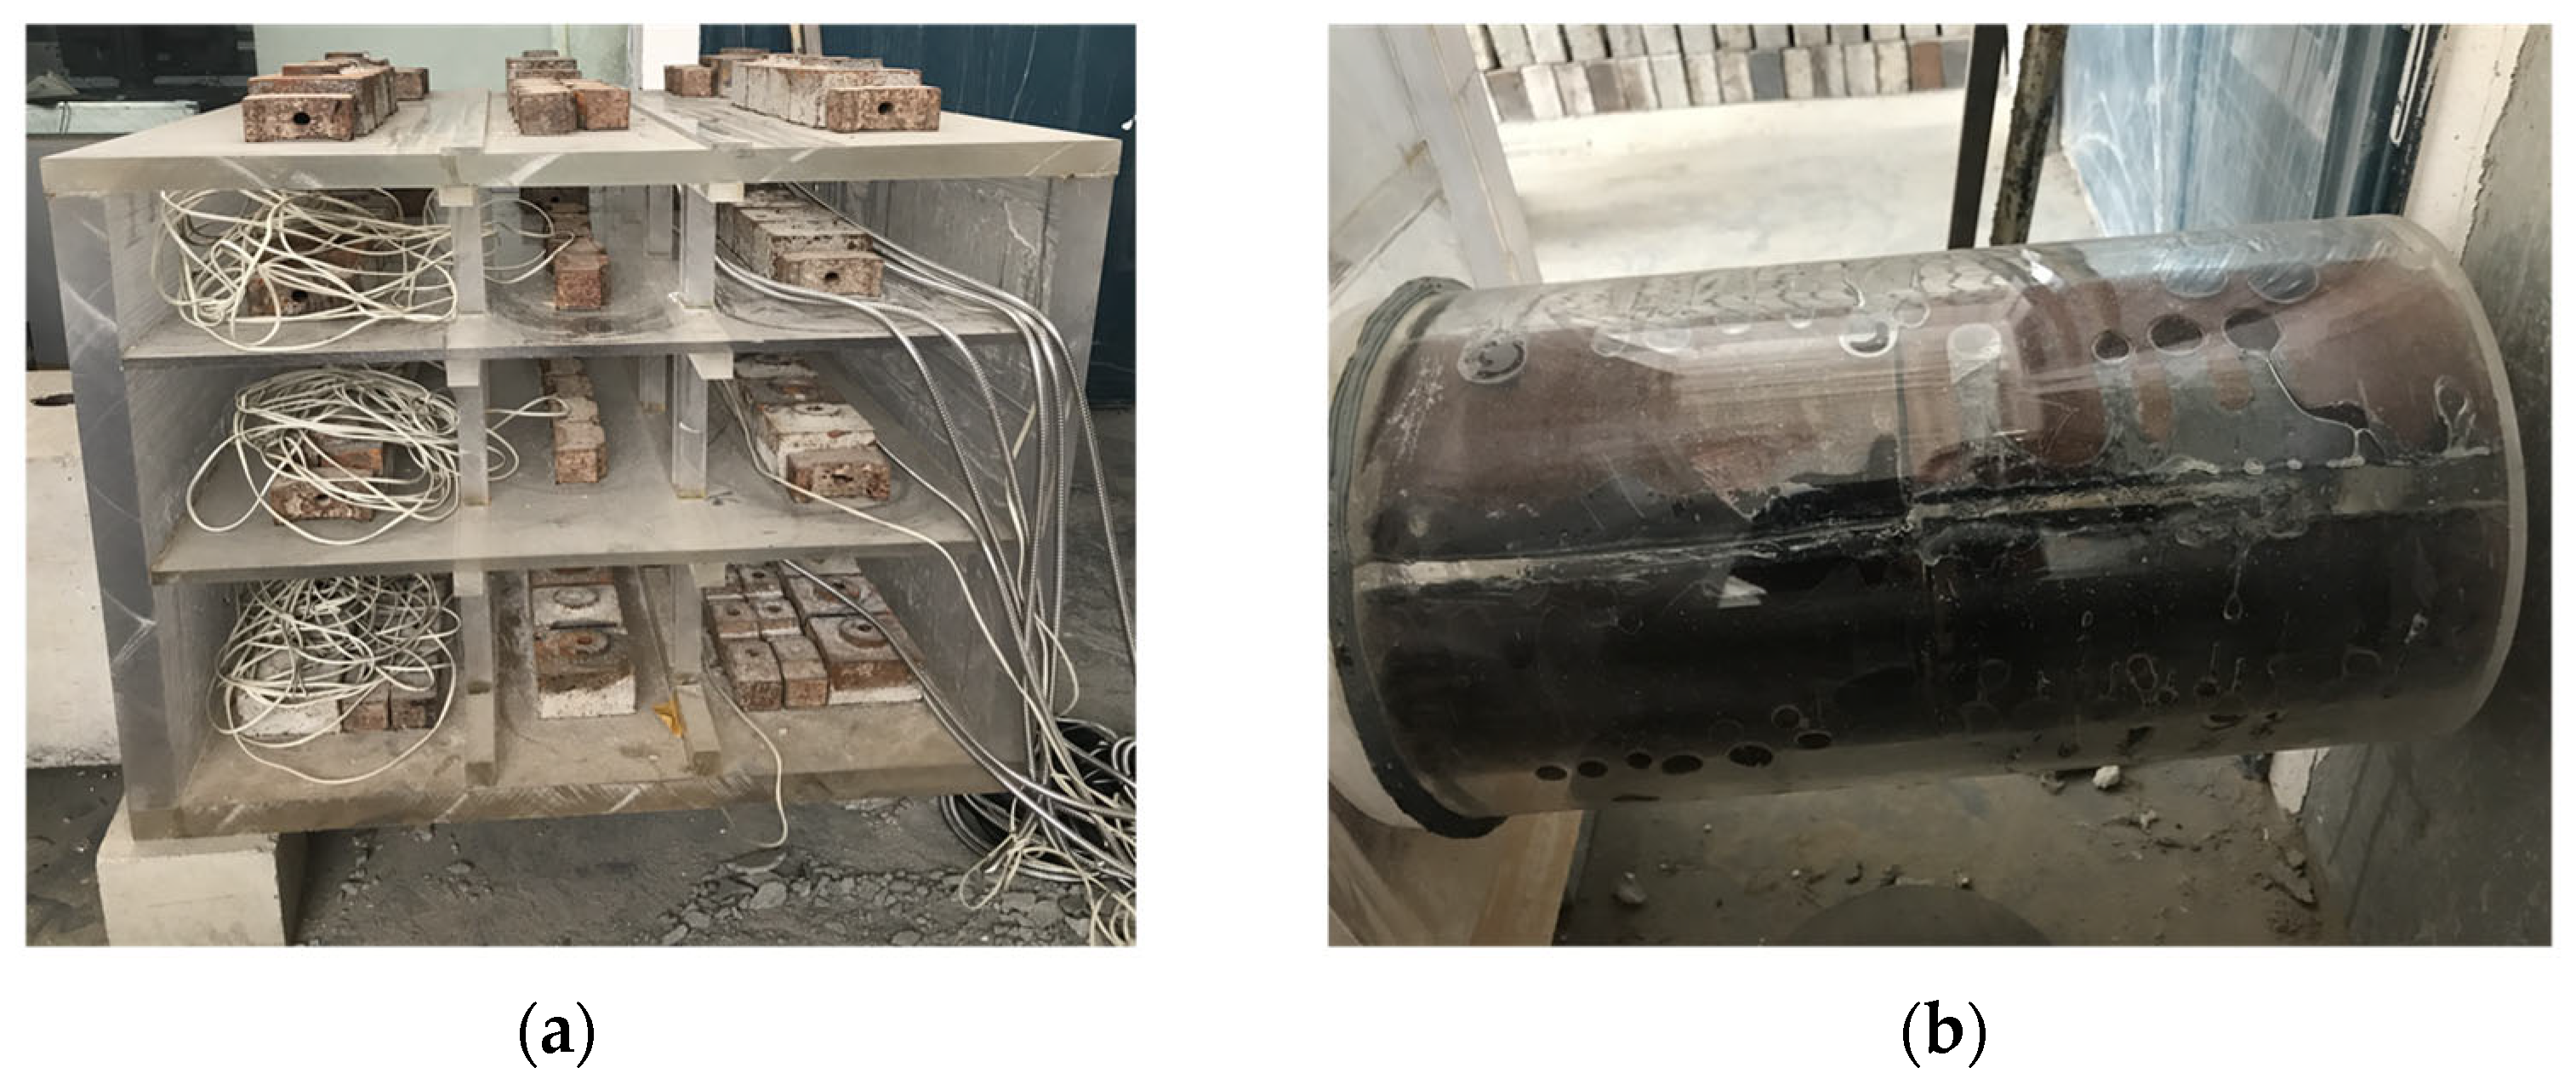
2.3.2. Model Subway Station Structure with Tunnel Connecting Joints

The prototype of the model underground structure represents a modern, three-story island–platform subway station with a height of 21.24 m, a lobby floor at grade, an equipment floor above, and an island platform with tunnel junctions below. The full-scale station is built from C30 reinforced concrete.
The scaled model (Figure 3) was fabricated from organic glass and comprises the station frame plus tunnel joints to match reality. To satisfy the density and dynamic similarity requirements, the model’s mass had to reach 536.2 kg. As the organic glass structure weighed only 197.2 kg, 339 kg of steel blocks were attached, distributing them evenly to preserve structural rigidity, which is shown in Figure 4.

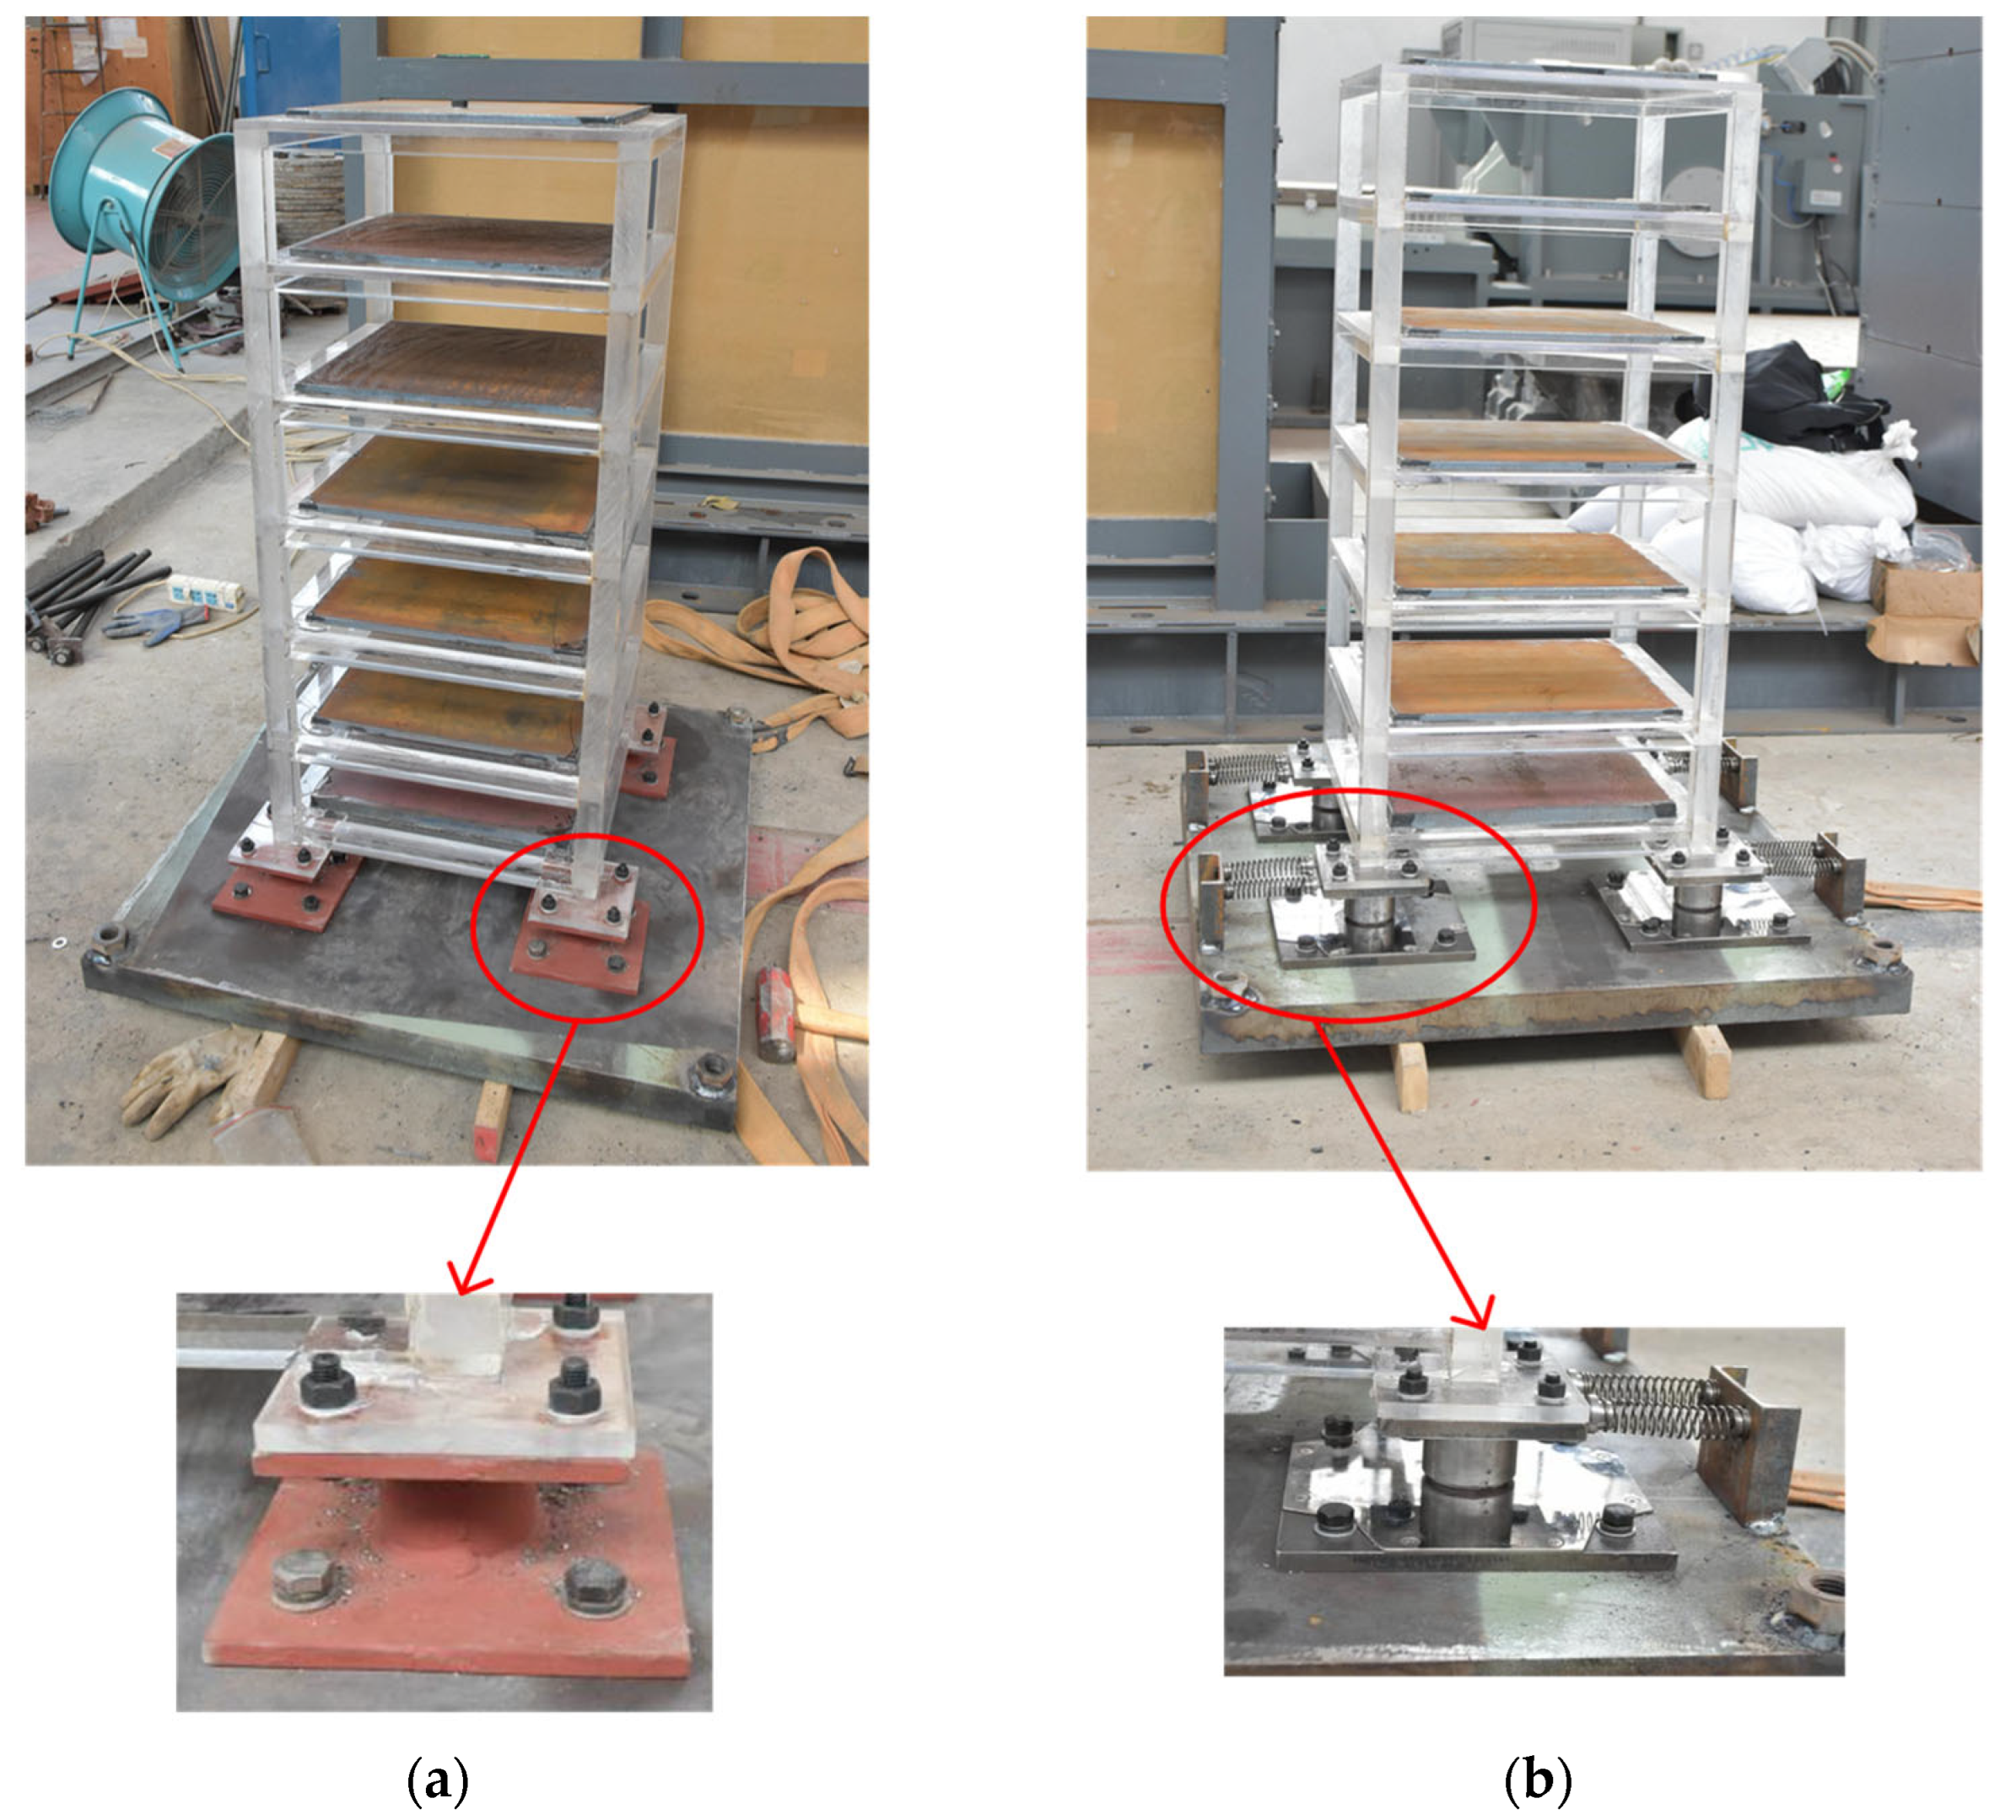
2.3.3. Model Aboveground Structures

The prototype design of the model aboveground structures was two frame structures with the same frame and raft foundation but different bearings. The structural frame had six floors, and each floor was 4.5 m high. The longitude and transverse span were 12 m. The dimensions of the raft foundation were 24 m × 24 m × 1.5 m. The two bearings included a rigid one and a slide one.
Two six-story frame models were fabricated from 10 mm thick organic glass, matching the material used for the station model. According to the geometric similarity ratio, each frame had a 0.43 m × 0.43 m cross-section and stood 0.90 m tall, as shown in Figure 5a. Beams, columns, and floor slabs were produced separately and then assembled. The bare frame weighs 49.7 kg. To simulate the superstructure’s dynamic properties, 10 kg was added to every floor except the base, which received 20 kg, bringing the total mass of each frame to 129.7 kg. A photograph of the completed model is presented in Figure 5b.
The raft foundation was designed as the steel foundation of the structures in the model. The dimensions of the raft foundation were 0.8 m × 0.8 m × 0.05 m to match the prototype structure and similitude ratio. Before the design, the foundation of the prototype structure was checked to be anti-overturning, and the computation results were satisfactory.
Two types of bearings were selected: rigid and slide. Four small rigid bearings connected the frame structure with the foundation, which had eight steel plates with a thickness of 10 mm. Pictures of the prepared model with the designed rigid bearings are given in Figure 6a. In the sliding bearing system, each unit consisted of a PTFE (polytetrafluoroethylene) circular column with a diameter of 100 mm and a height of 4 mm, paired with a 200 mm × 200 mm stainless steel plate, as shown in Figure 6b. The bearings had an average horizontal stiffness of 1718 N/m and a mechanical displacement limit of 50 mm to prevent excessive sliding under strong excitations. To maintain a stable friction coefficient of 0.07, silicone grease was applied between the PTFE and steel surfaces. A total of four slide bearings, combined with steel plates, steel angles, and eight springs, were used to connect the aboveground structure to the raft foundation, forming the isolated model structure. Since the response of the aboveground structure was not the focus of this study, additional design details are not presented here.

3. USSI Test Configuration and Instruments

3.1. Loading Method

To study the effect of long-period seismic loading on the USSI system, two long-period bedrock records (the Tokachi earthquake wave recorded in 1968 (HKD wave) and the Chi-Chi earthquake wave recorded in 1999 (TCU wave)) and one ordinary bedrock record (a Mexican earthquake wave recorded in 1985 (ATYC wave)) were selected as the input motions. Table 4 lists the horizontal loading order, and Figure 7 presents the acceleration time histories and Fourier spectra of the three waves. The Fourier spectra show that the main frequency bandwidth of the ATYC wave was concentrated at 1.5–6 Hz, where the first dominant frequency was 1.71 Hz. Meanwhile, the main frequency bandwidths of the TCU and HKD waves were both 0–4 Hz, and the first dominant frequencies were 0.13 and 0.177 Hz, respectively.
Using a time-scaling factor of 0.1291, the original 0.01 s record was compressed to 0.001291 s and rounded to 0.0013 s for convenience. To represent three earthquake intensities, the inputs were amplitude-scaled to peak ground accelerations of 0.1, 0.2, and 0.3 g. White-noise pulses with the same PGA were applied before and after each test to monitor any change in the model’s dynamic properties.

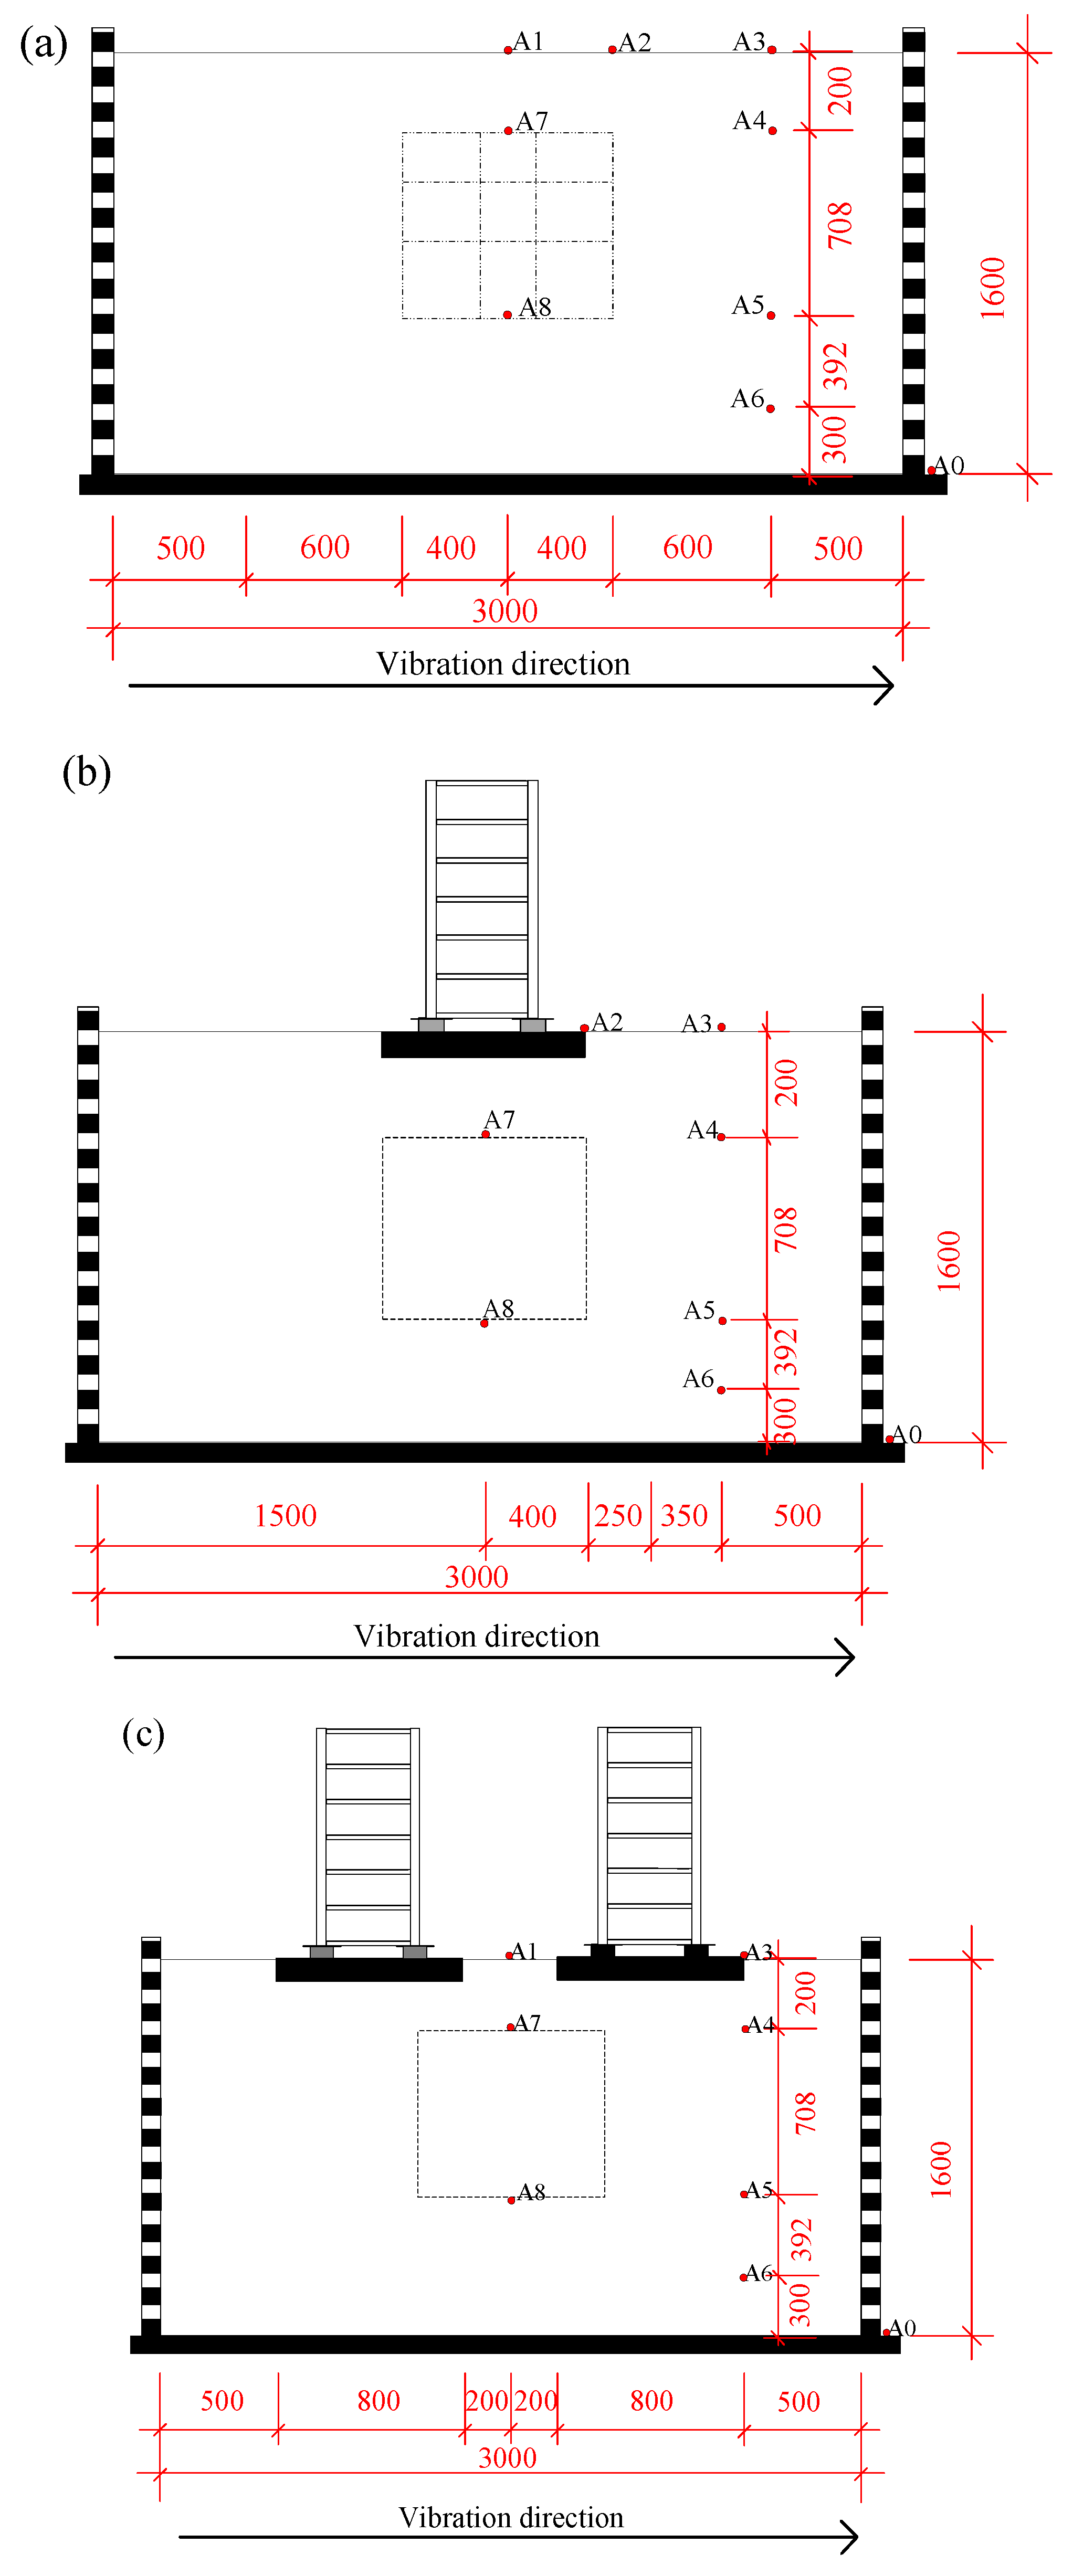
3.2. Test Configuration

As the purpose of this study was to investigate the coupled effect of the underground structure, aboveground structures, and soil, six test configurations were designed: (a) a free-field system (FF); (b) a single aboveground structure–soil interaction system (I); (c) a multiple aboveground structures—soil interaction system (IS); (d) subway station with tunnel connecting joints–soil interaction system (U); (e) a subway station with tunnel connecting joints–soil–single aboveground structure interaction system (UI); and (f) a subway station with tunnel connecting joints–soil–multiple aboveground structures interaction system (UIS). Figure 8 shows the schematic diagrams of the six configurations. Each test configuration includes the same input cases, which are summarized in Table 4.
The instrumentation comprised accelerometers, strain gauges, soil-pressure gauges, and displacement transducers. Thirty-seven accelerometers were embedded in the soil or mounted on the structures. Ten displacement transducers monitored floor movements in the surface buildings, while twenty-five strain gauges were affixed to key members of the subway station. Eight soil-pressure gauges were placed around the station to record surrounding earth pressures. Due to the focus of this study, only the arrangements of the accelerometers in the soil are introduced here. The sensor arrangements differed for each test configuration. Figure 9a presents the location of the accelerometers in test FF. A1 was installed at the central point in the surface of the model soil, and A2 and A3 were positioned 40 and 60 cm, respectively, from the container center. Figure 9b depicts the accelerometer locations in test I, and Figure 9c portrays the arrangement in test IS. The sensor locations in tests U, UI, and UIS can be determined by referring to tests FF, I, and IS.

3.3. Boundary Effect

The boundary effect of the soil container (i.e., the artificial boundaries not only impose constraints on the model soil but also cause the model soil to produce reflections and scattering that differ from those of actual soil) could not be avoided in the shaking table test. In order to analyze whether the test solves the boundary problem of the soil container effectively, the acceleration amplification factor (AMF) and Fourier amplitude spectra of TCU1 were analyzed and shown in Figure 10a and Figure 10b, respectively. As expected, the AMF of A1, A2, and A3 showed little difference for TCU1, and the Fourier amplitude spectra matched quite well. This indicates that the boundary effect had very little impact on the relevant response of the measuring points selected in this paper. Thus, with regard to the aim of the study, which was to investigate the seismic response law of the field in a fully coupled system rather than simulate real engineering, the boundary effect could be eliminated from the test.

4. Structural Impact on the Field and Discussion

The representative results are presented and discussed here with regard to the maximum acceleration, frequency contents for soil, Arias intensity, and spectral acceleration.

4.1. Dynamic Characteristics

4.1.1. Dynamic Characteristics of the Model Soil

Soil dynamics during an earthquake depend on factors such as shear modulus and depth. To characterize the model soil, the natural frequency and damping ratio were derived using the transfer function method by data from the accelerometer A3, placed at the soil surface, which recorded the response to 1–50 Hz white noise excitation. The recognized results, summarized in Table 5, show that as the number of loading cycles increased, the soil’s natural frequency declined, while its damping ratio rose, reflecting the densification of the model soil over the course of testing.

4.1.2. Dynamic Characteristics of Six Systems

From the six test configurations in Section 3.1, Figure 11 shows the dynamic characteristics of systems FF, I, IS, U, UI, and UIS. Figure 11a,b show the first-order frequencies and damping ratios, respectively. With the comparison between test FF and U, I and UI, IS, and UIS, respectively, the presence of a subway station was found to elevate the first-order frequency and damping ratio to some extent. This was mainly due to the stiffening effect of the subway station. The underground station acts as a rigid body embedded in the soil, which restricts the deformation of the surrounding soil layers. This effectively increases the composite stiffness of the soil structure system, especially in the near-field zone. In contrast with the above situation, the presence of aboveground structures had a lower first-order frequency and much higher damping ratio in comparison to test FF and I, as well as FF and IS. The first-order frequency decreased further as the number of aboveground structures increased. The reduction in first-order frequency is mainly attributed to the mass effect. When aboveground structures are added to the system (e.g., comparing FF vs. I or FF vs. IS in Figure 8), the total mass of the system increases significantly, while the overall stiffness increases relatively less. Since natural frequency f = k / m / 2 π , this increase in mass results in a decrease in the first-order frequency. The heavier the aboveground structure (especially in multi-layer configurations like IS), the more pronounced the frequency reduction. The increase in the damping ratio is mainly attributed to energy dissipation by the superstructure. As shown in Figure 11b, aboveground structures significantly increase the damping ratio of the system. This is due to several mechanisms: interaction damping caused by relative movement and radiation damping between the superstructure and the underlying soil; and extended vibration modes involving the superstructure, which provide more paths for energy dissipation. These additional dissipation sources result in a higher equivalent damping ratio for the soil–structure system as a whole.

4.2. Response of Benchmark Model (FF) to Earthquake Ground Motion

The response in terms of the acceleration in test FF is presented here to demonstrate the influence of the input motion characteristics on the field and as a benchmark mode to analyze the effect of structures on the field response. Figure 12 plots the depth profiles of the acceleration–magnification factor (AMF), defined as the ratio of the peak soil acceleration at depth d to the peak input acceleration measured at the shaking table. It can be observed that the free-field test (FF) reveals that the soil amplifies motion as waves travel upward. The AMF increases steadily toward the ground surface. Near the surface, low-intensity inputs (PGA ≈ 0.1 g) produce similar amplification, with the AMF ranging from 2.11 to 2.40. In contrast, higher-intensity inputs (PGA ≈ 0.3 g) yield more scattered and lower amplification factors between 1.58 and 2.03.
With regard to the effect of the period of inputs on the field response, long-period ground motions—represented by the HKD and TCU records—generated noticeably larger surface amplification factors than the ordinary ATYC motion. This difference arises for two reasons. The first is that the soil column acts as a frequency filter: high-frequency components are attenuated during upward propagation, whereas low-frequency components pass with little reduction. Consequently, at constant peak ground acceleration, motions rich in low-frequency energy evoke stronger soil responses. The second is that the time histories of TCU and HKD show that they maintain significant amplitudes over long durations (80~140 s), allowing for accumulated strain and larger energy transmission into the soil medium. In contrast, ATYC motion, while possibly intense in short bursts, has a shorter duration (about 40 s) and less capacity to excite deep or flexible soil profiles. In addition, as the input PGA increases, the soil has greater hysteretic behavior and higher energy dissipation.
Long-period motions (HKD and TCU) produced higher amplification factors at the soil surface than ordinary motion (ATYC). As the soil selectively filters high frequencies, it responds more strongly to inputs rich in low-frequency content at the same PGA. As the PGA increases, soil hysteresis—and thus energy dissipation—also grows.
Figure 13 presents the acceleration response spectra (PSA) from the shaking table to the soil surface. As expected, the long-period motion caused a greater response than the ordinary input because of the resonance phenomenon. At 8 Hz (i.e., the first-order frequency of the system; see Section 4.1.1), the acceleration response spectra for input TCU1 showed the biggest amplification. HKD1 had greater values than ATYC1 (i.e., the ordinary input) from the shaking table to the surface ground.
Figure 14 shows the time–frequency diagram for the seismic waves recorded with the accelerometer A3. Table 5 indicates that the first- and second-order frequencies of the soil were 8.0 and 26.84 Hz, respectively. TCU1 and HKD1 mainly consisted of first-order frequency components around 8 Hz, with fewer second-order frequency components around 26 Hz. Meanwhile, ATYC1 included both first- and second-order frequency components. Considering the change in frequency over time, the energy was concentrated at 4–9 s for ATYC1, as well as at 6–12 and 4–8 s for HKD and TCU1, respectively. This is in line with the time–history diagram. Thus, the soil had an important amplification effect on waves propagating from the shaking table to the surface, and the effect of long-period motion is greater than that of ordinary input.

4.3. Field Response in Terms of Acceleration
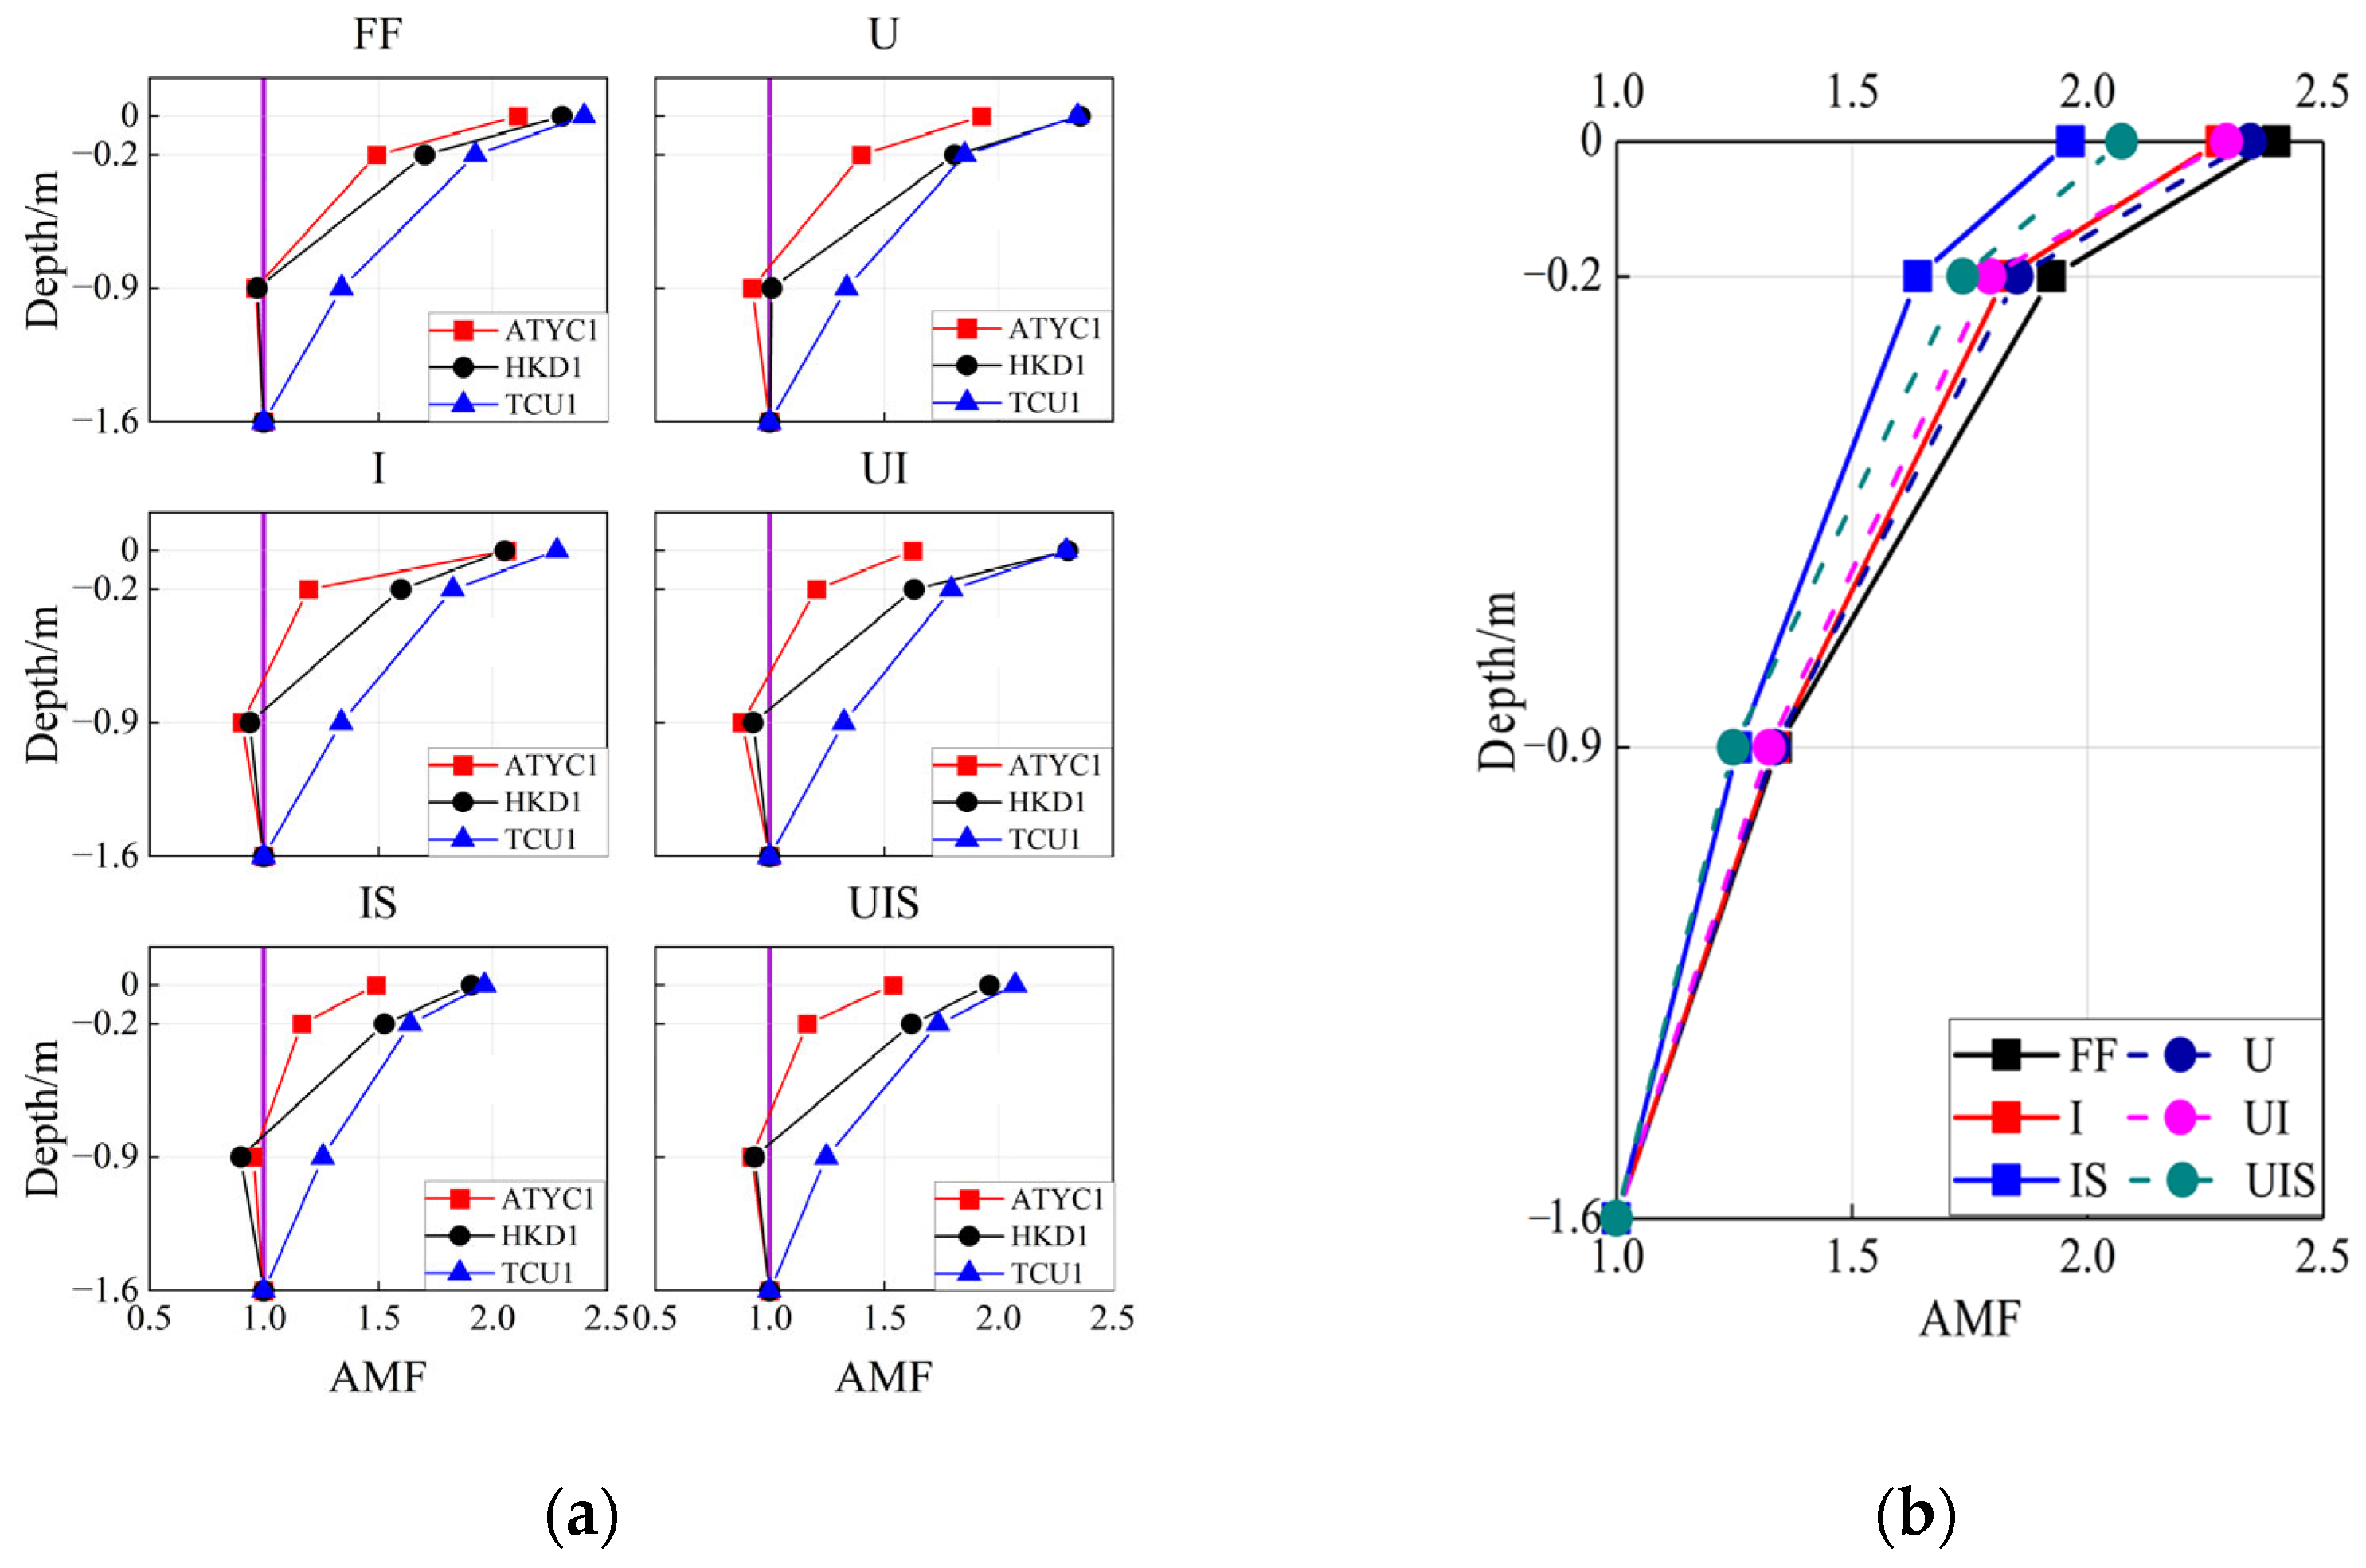
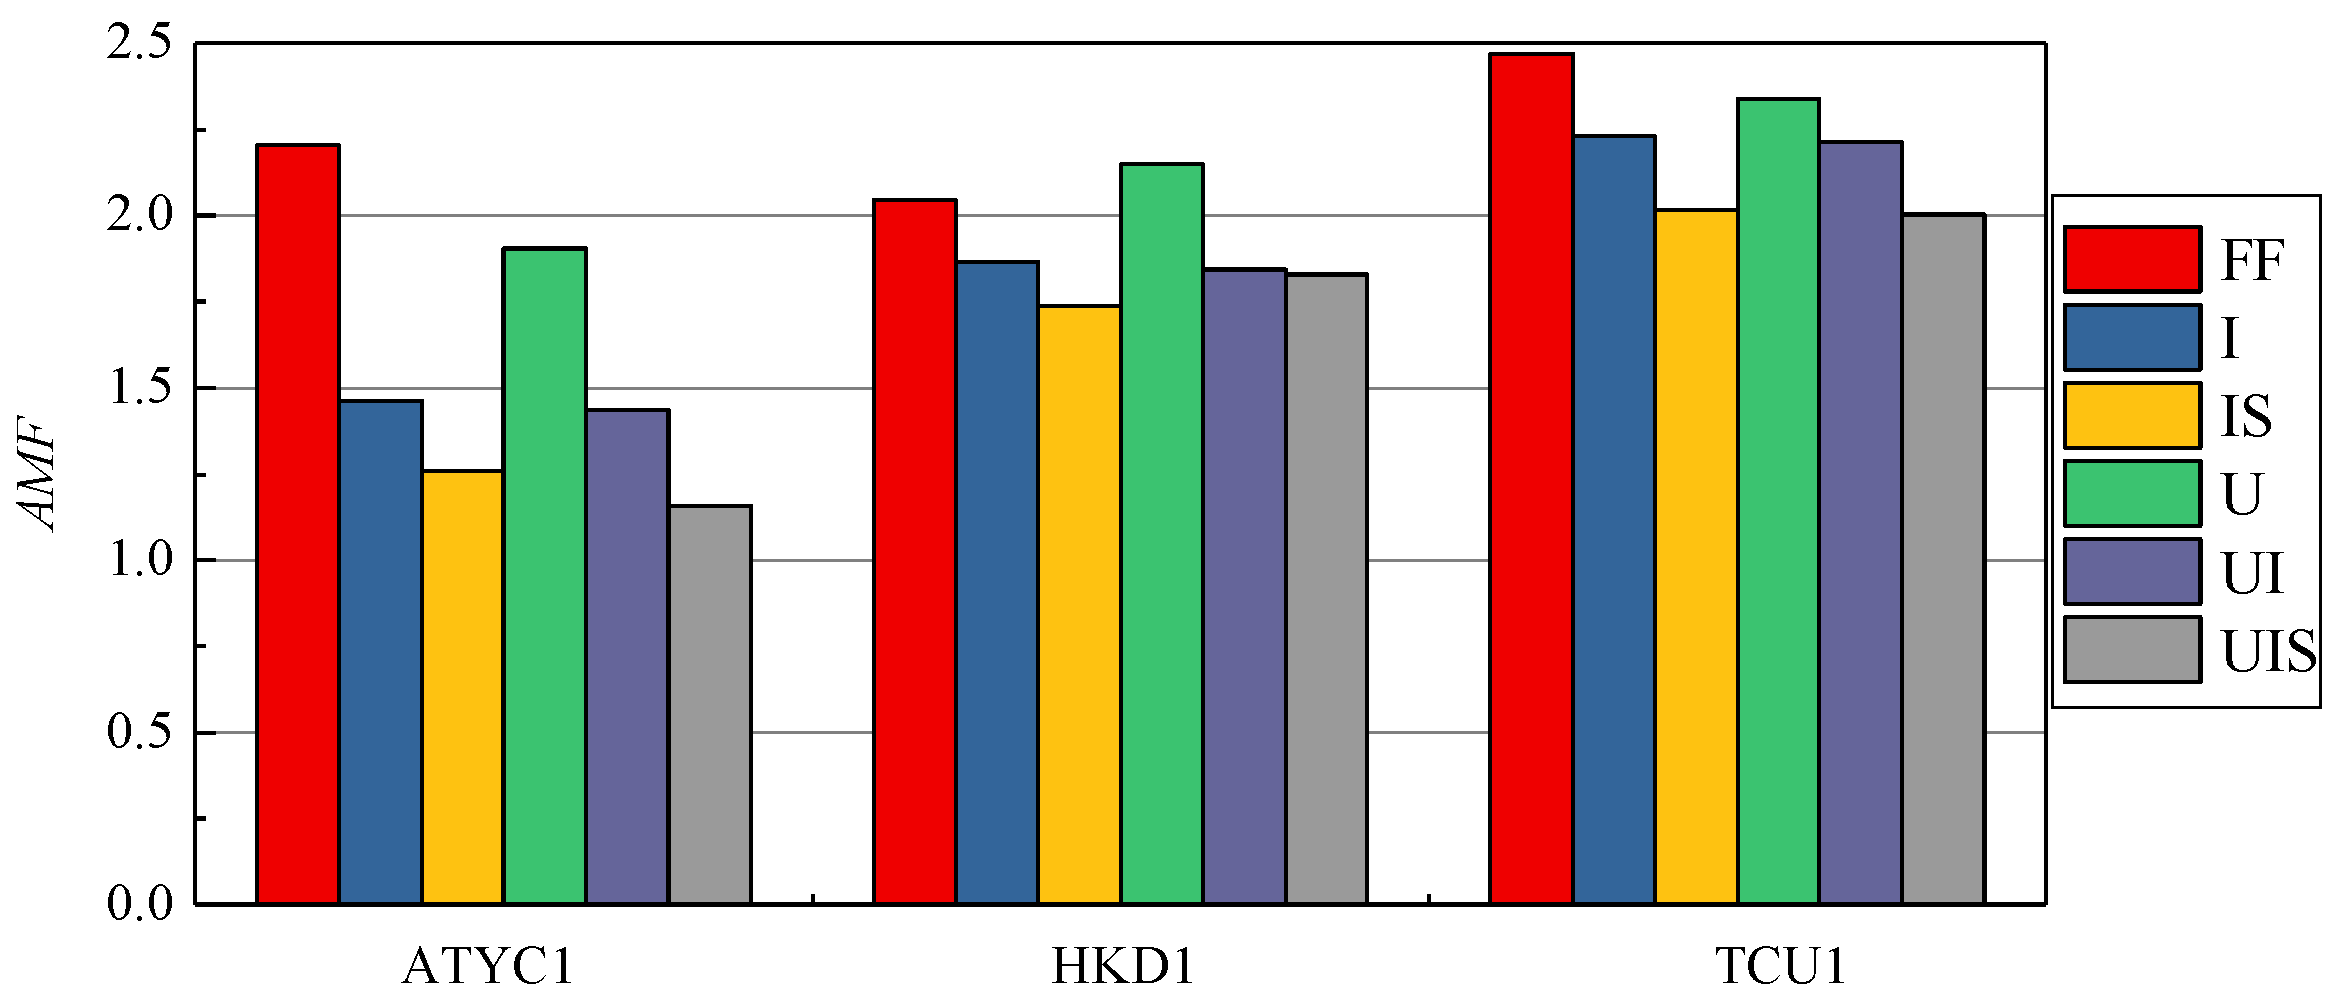
4.3.1. PGA Analysis

Figure 15 reports the AMF at checkpoints A3, A4, and A5 for all six system tests (FF, U, I, UI, IS, and UIS). The data for A6 was not used here because of a problem with the sensor. Figure 15a refers to the AMF value comparison for test X (FF, I, IS, U, UI, and UIS) considering the different effects of the inputs, and Figure 15b compares the six system tests’ values under the same input TCU1. In test FF (black line in Figure 15b), the AMF = 2.40 at the soil surface. It was greater than the values for the other five conditions, i.e., the structure, no matter which type, has a beneficial effect on the urban area in this case. For the tests with only aboveground structures (red and blue lines: tests I and IS), there was a slight reduction in the AMF at the soil surface compared with the tests for both aboveground structures and the subway station (pink and green lines: tests UI and UIS). In other words, the subway station had a detrimental effect on the urban area around the aboveground structures (not directly below the aboveground structures) because of the refraction and reflection of waves at the interface between the subway station surface and the soil. Considering the number of aboveground structures (red and blue lines: tests I and IS; pink and green lines: tests UI and UIS), the AMF at the soil surface decreased as the number of aboveground structures increased. This can be attributed to the coupling effect of the structure on the propagation of seismic waves in the soil.
Figure 16 shows the AMF of A1 at the soil surface directly above the subway station under inputs ATYC1, HKD1, and TCU1 from Table 3 in the six system tests. The AMF decreased in tests UI (purple stripe) and UIS (gray stripe) compared with tests I (blue stripe) and IS (yellow stripe), which indicates that the presence of the subway station had a beneficial effect on the urban area directly above or near the station, which was obvious for input motions with higher-frequency components. This was attributed to the absence of material inside the station, which prevented wave propagation around the subway station. In turn, the station changed the path of the seismic waves. The combined effect of the subway station and aboveground structures on the seismic response of the soil (gray stripe) shows a further reduction in the AMF compared to the other cases.
The results shown in Figure 15 and Figure 16 are extremely significant for the design of subway stations and aboveground structures. When an aboveground structure is within a certain distance from the side of the station, it should be considered for the safer design of the subway station. When the structure is above the subway station directly or near it, the beneficial effects of the subway station on the field should be considered to realize a cost-effective design.
Figure 17 shows the Ra-z profiles from the shaking table to the soil surface, where Ra is the relative ratio between the maximum accelerations at the detected depth z for test X (i.e., I, IS, U, UI, and UIS) and test FF. Ra at the soil surface was less than unity (i.e., the AMF at the soil surface was smaller than that with test FF). The Ra values corresponding to the long-period inputs (blue and black lines) were greater than those corresponding to the ordinary input (red and pink lines). This trend was clearer for shallower soil. In other words, long-period seismic waves had a detrimental effect on the seismic response of the field with regard to a subway station or aboveground structures in the cases examined in this study. As the PGA increased, Ra decreased compared with the cases with PGA = 0.1 g. This was mainly ascribed to the nonlinear and softening behavior of the soil.

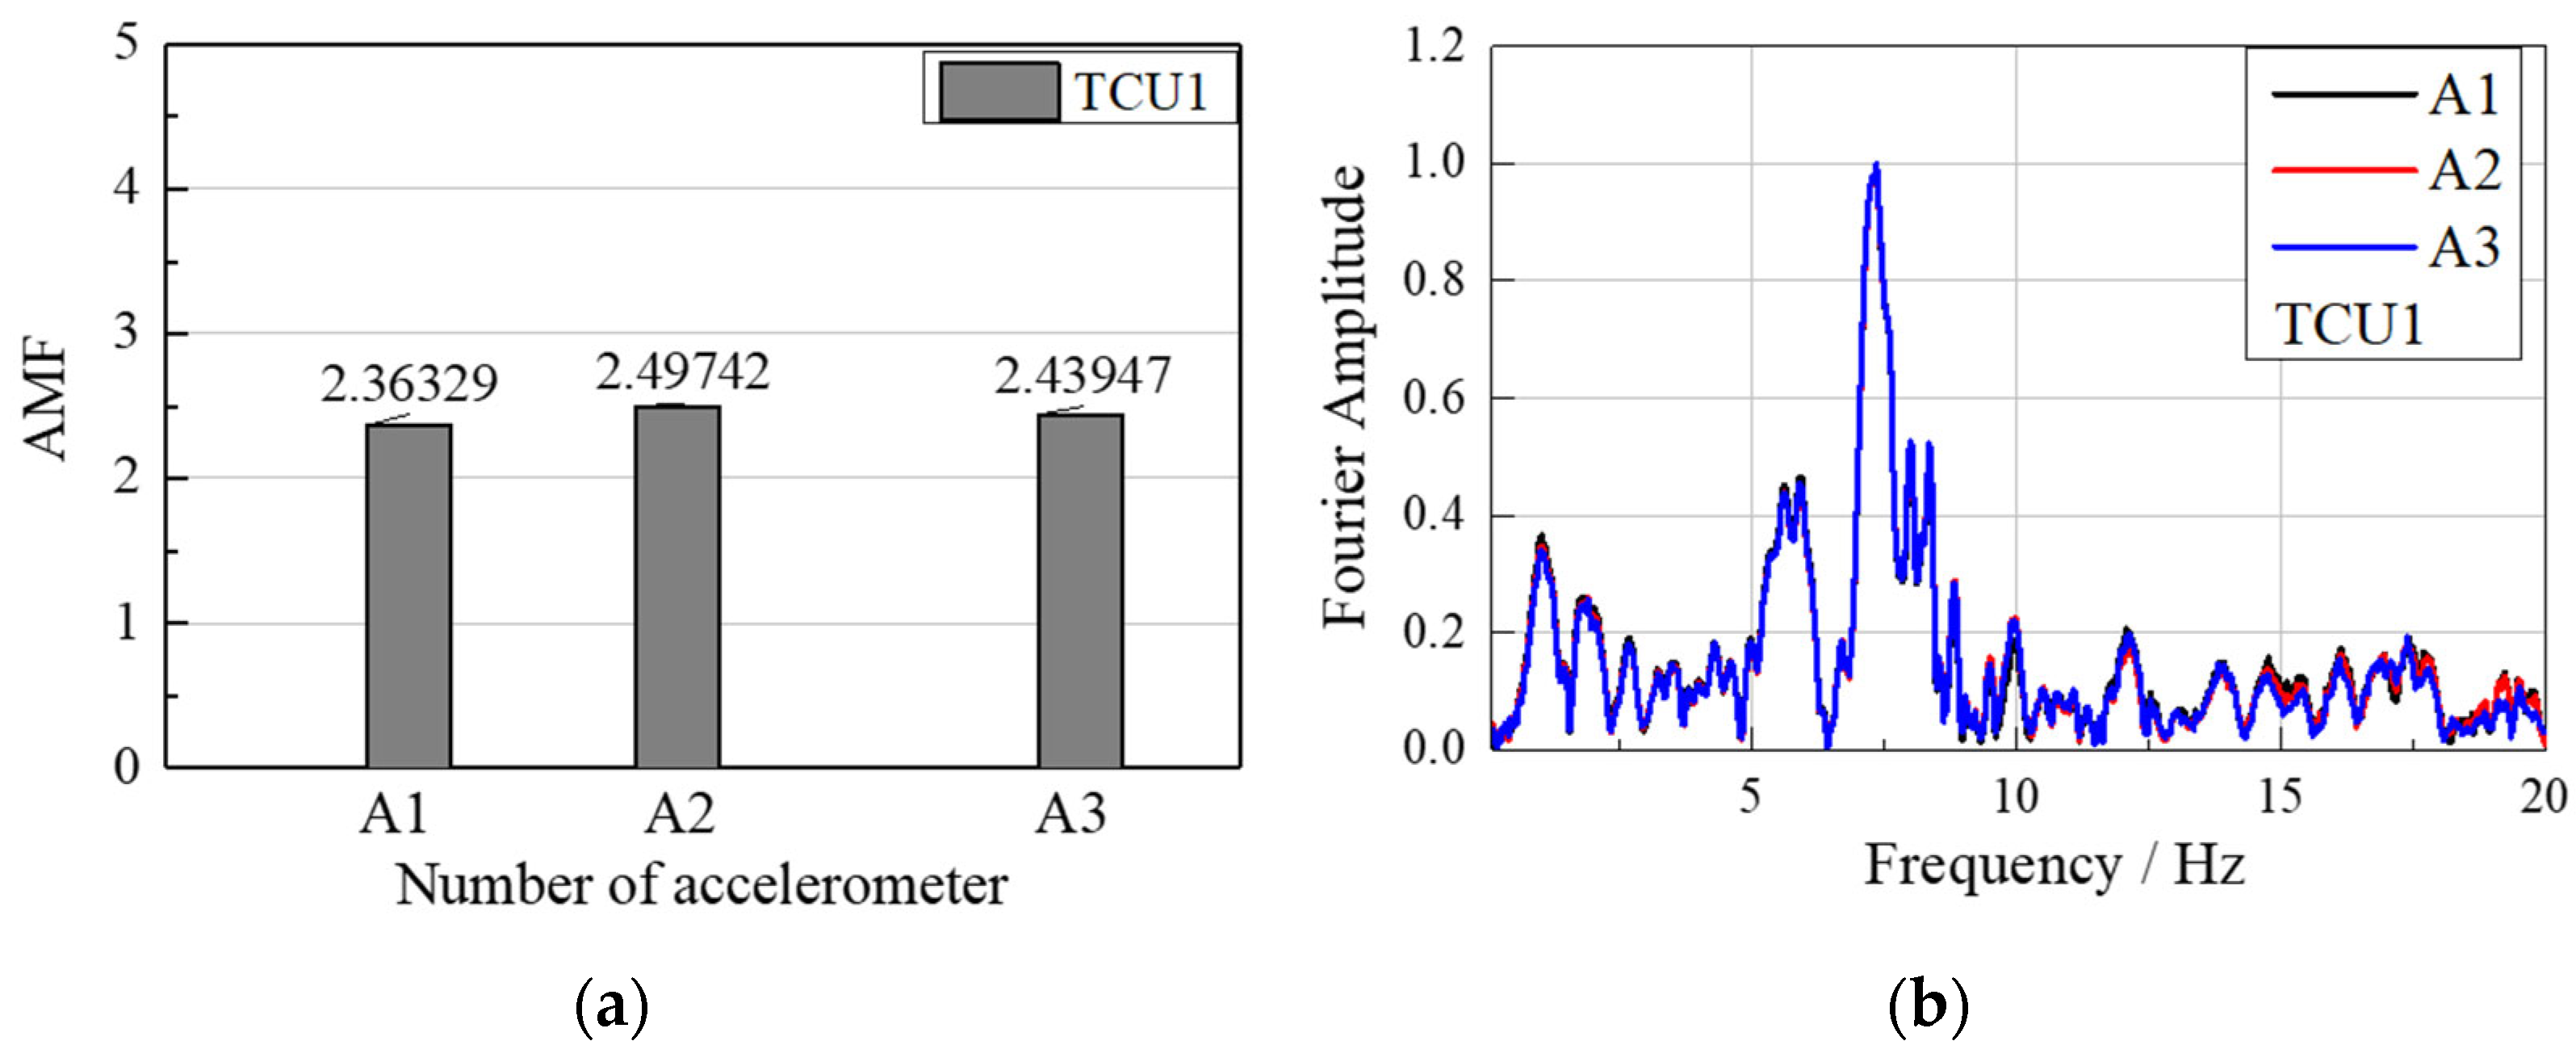
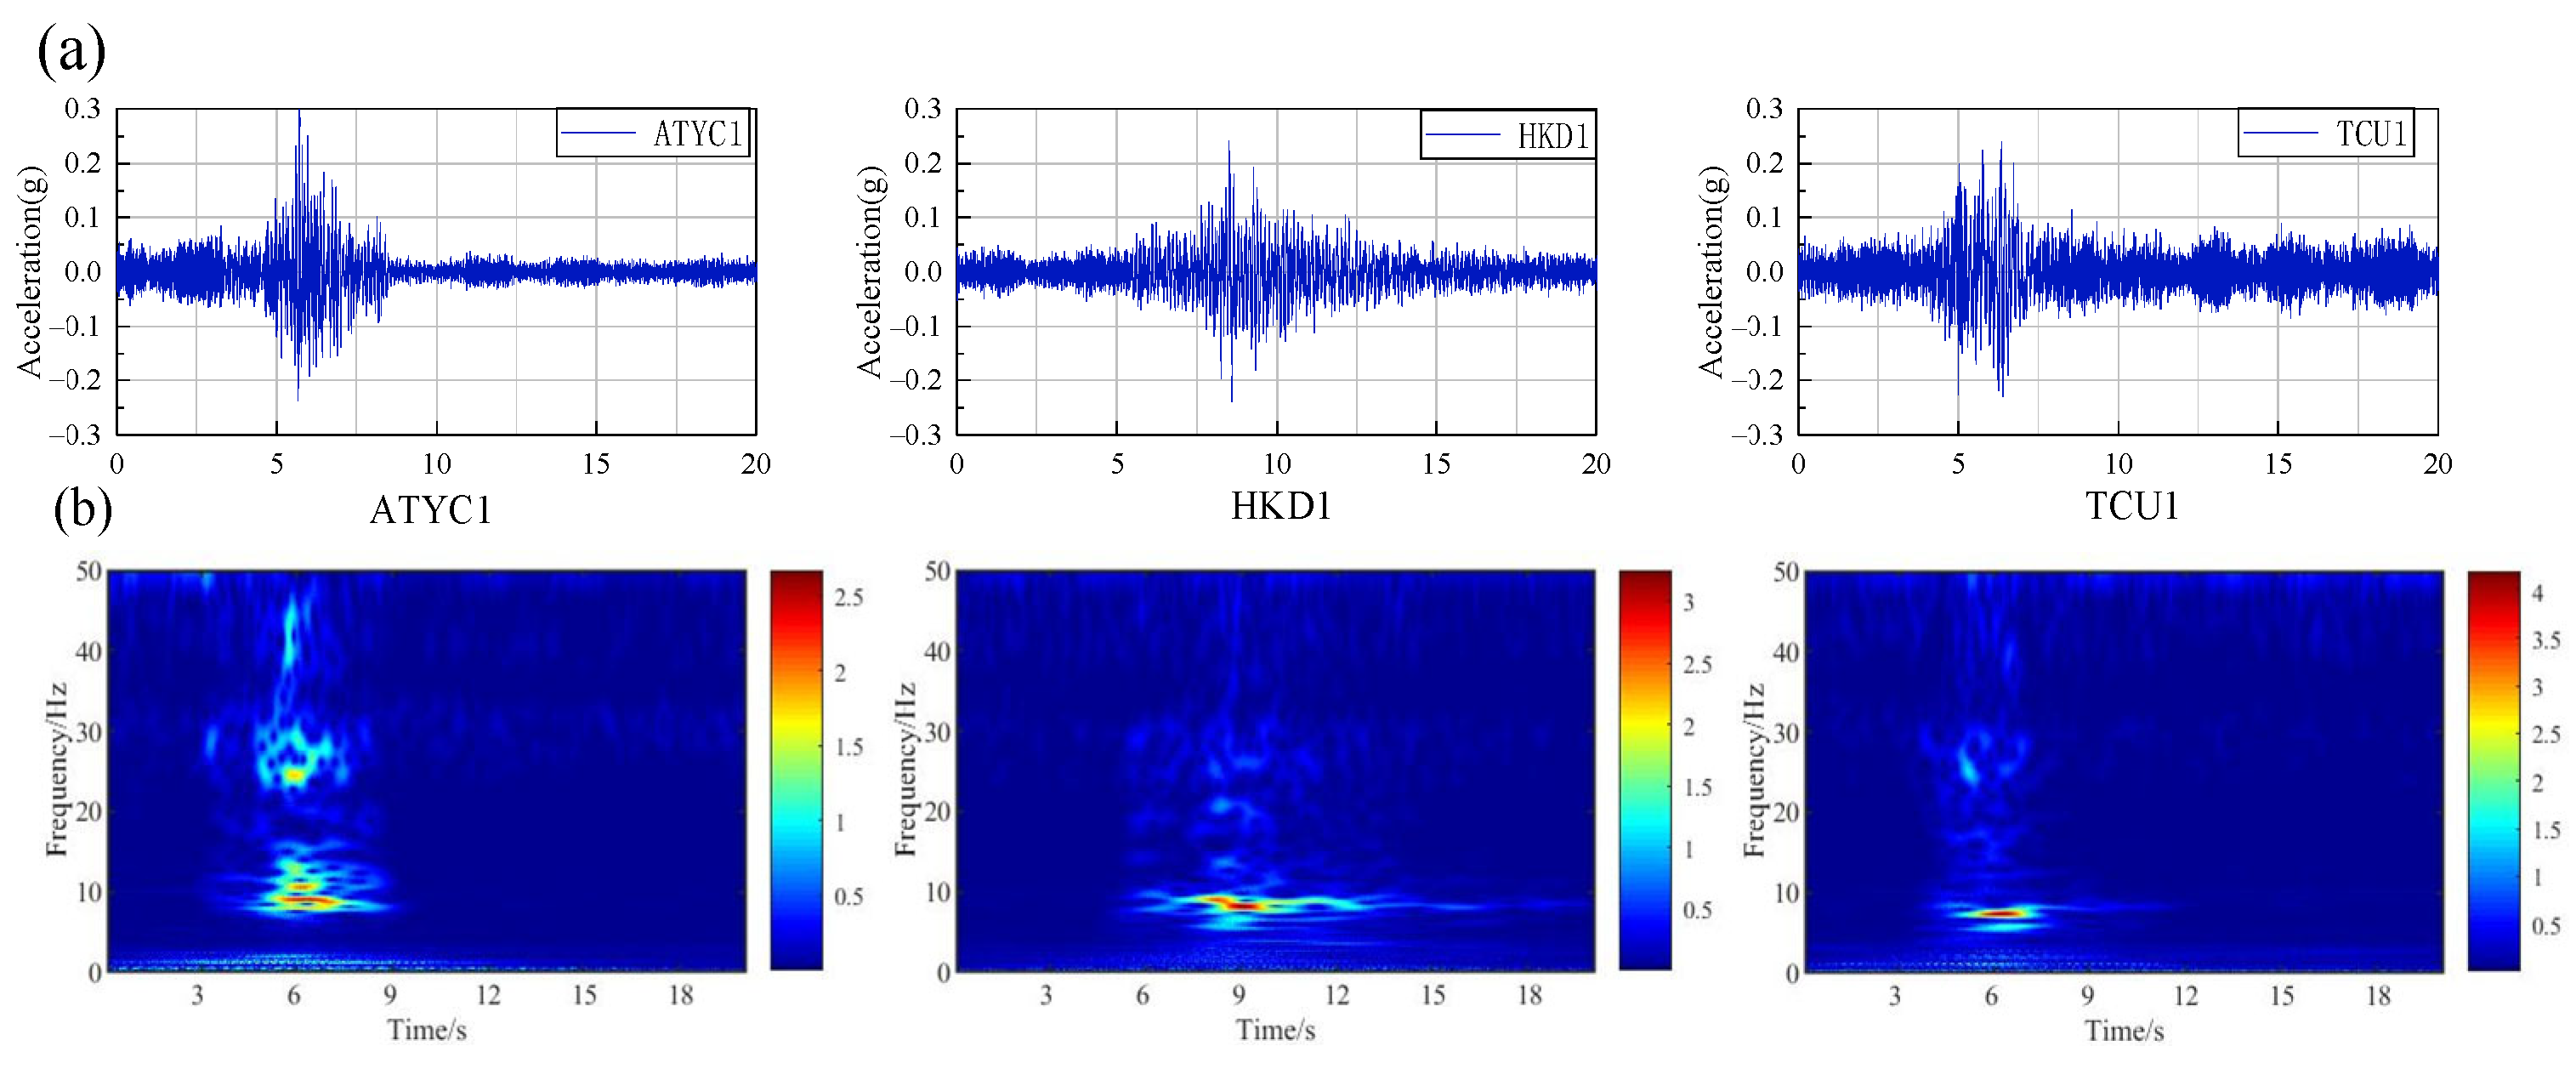
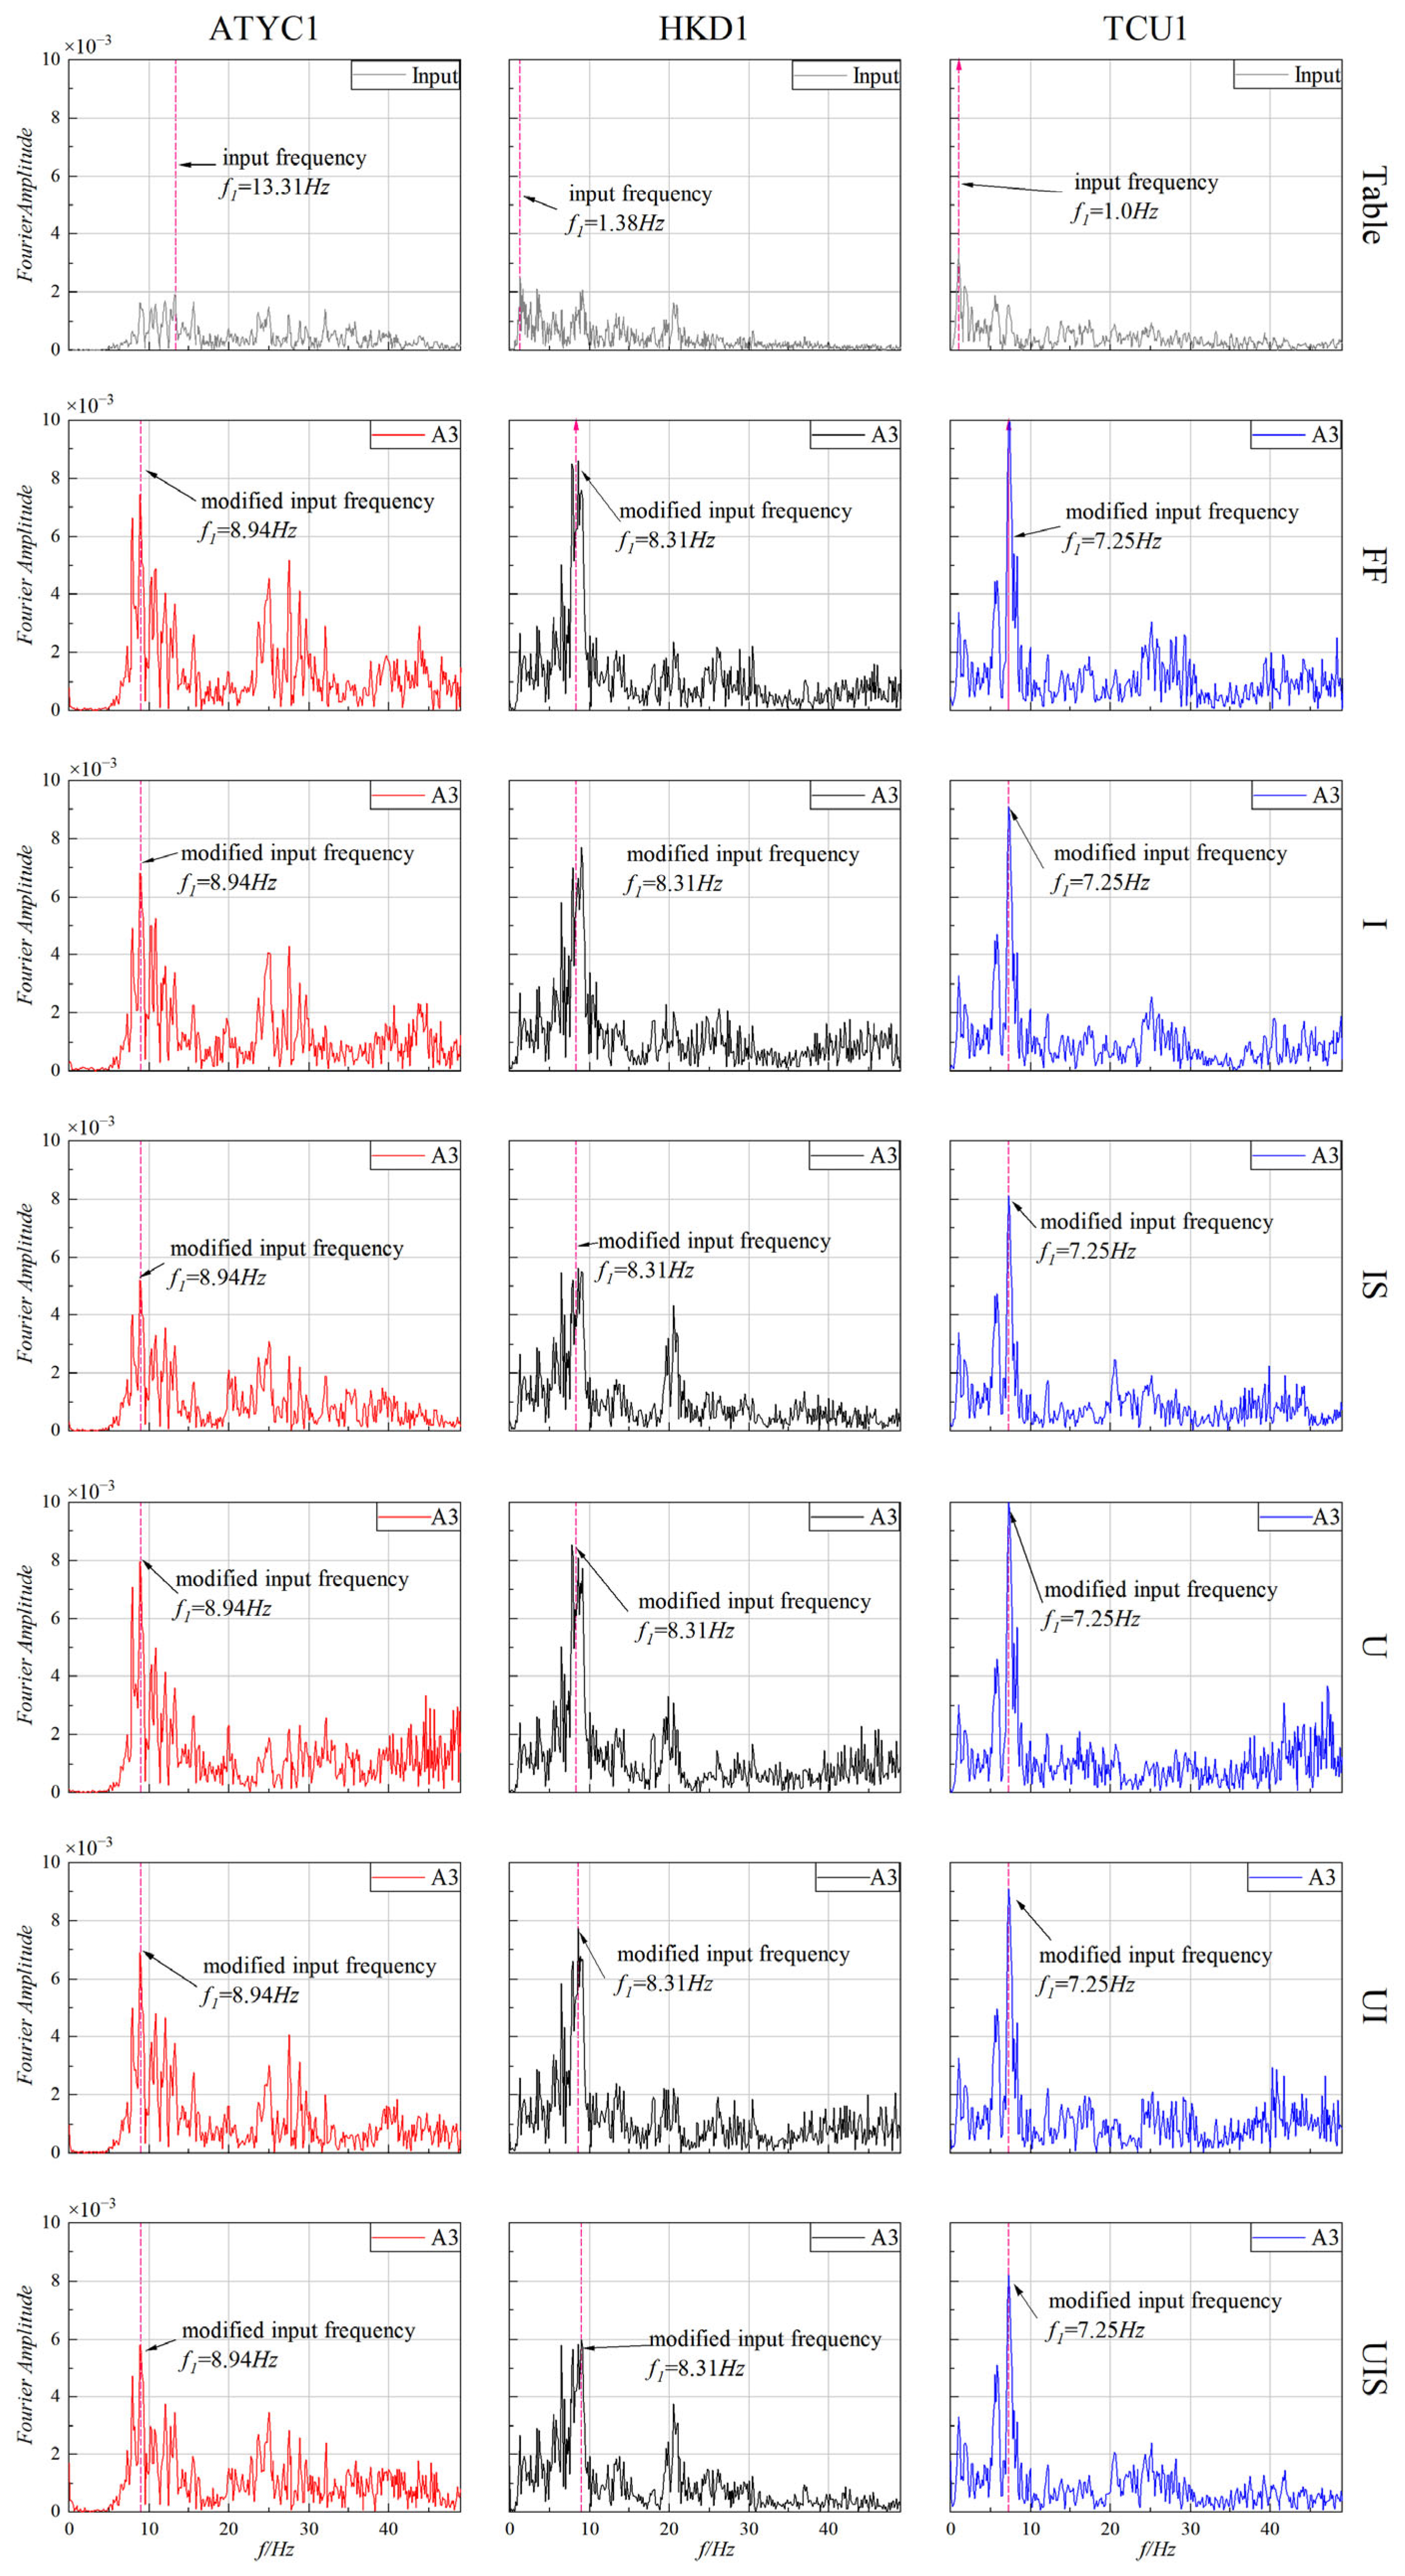
4.3.2. Frequency Analysis

Figure 18 shows the Fourier amplitude spectra (FAS) at A3 to demonstrate the frequency characteristics of the six tests. When the FAS were compared for the inputs from the shaking table (first row), there were significant differences between the predominant frequencies of the wave from the table to the soil surface because of the soil filtering effect. When the input waves were characterized by the long and ordinary periods (see the black and blue lines), the soil demonstrated an amplification filtering effect on the predominant frequency of the long-period seismic waves (f1: changes from 1.38 to 8.31 Hz for HKD1 and 1.0 to 7.25 Hz for TCU1). With the ordinary-period seismic waves (see the red lines), the soil had a de-amplification effect on the predominant frequency. The predominant frequency showed no significant differences in the six tests. However, Figure 19 shows the Arias intensity [45] for different tests under seismic inputs, which indicates significant differences. The Arias intensity of the seismic waves increased with propagation through the soil. The presence of a subway station and/or aboveground structures reduced the Arias intensity compared with that for test FF. Tests IS and UIS had the smallest values, which match the results discussed in Section 4.3.1.
Previous studies have shown that the presence of a subway station and/or aboveground structures always modifies the input wave characteristics in terms of not only the frequency contents but also the PGA. The present results are a significant contribution to the seismic design of new structures or the retrofitting of old structures.

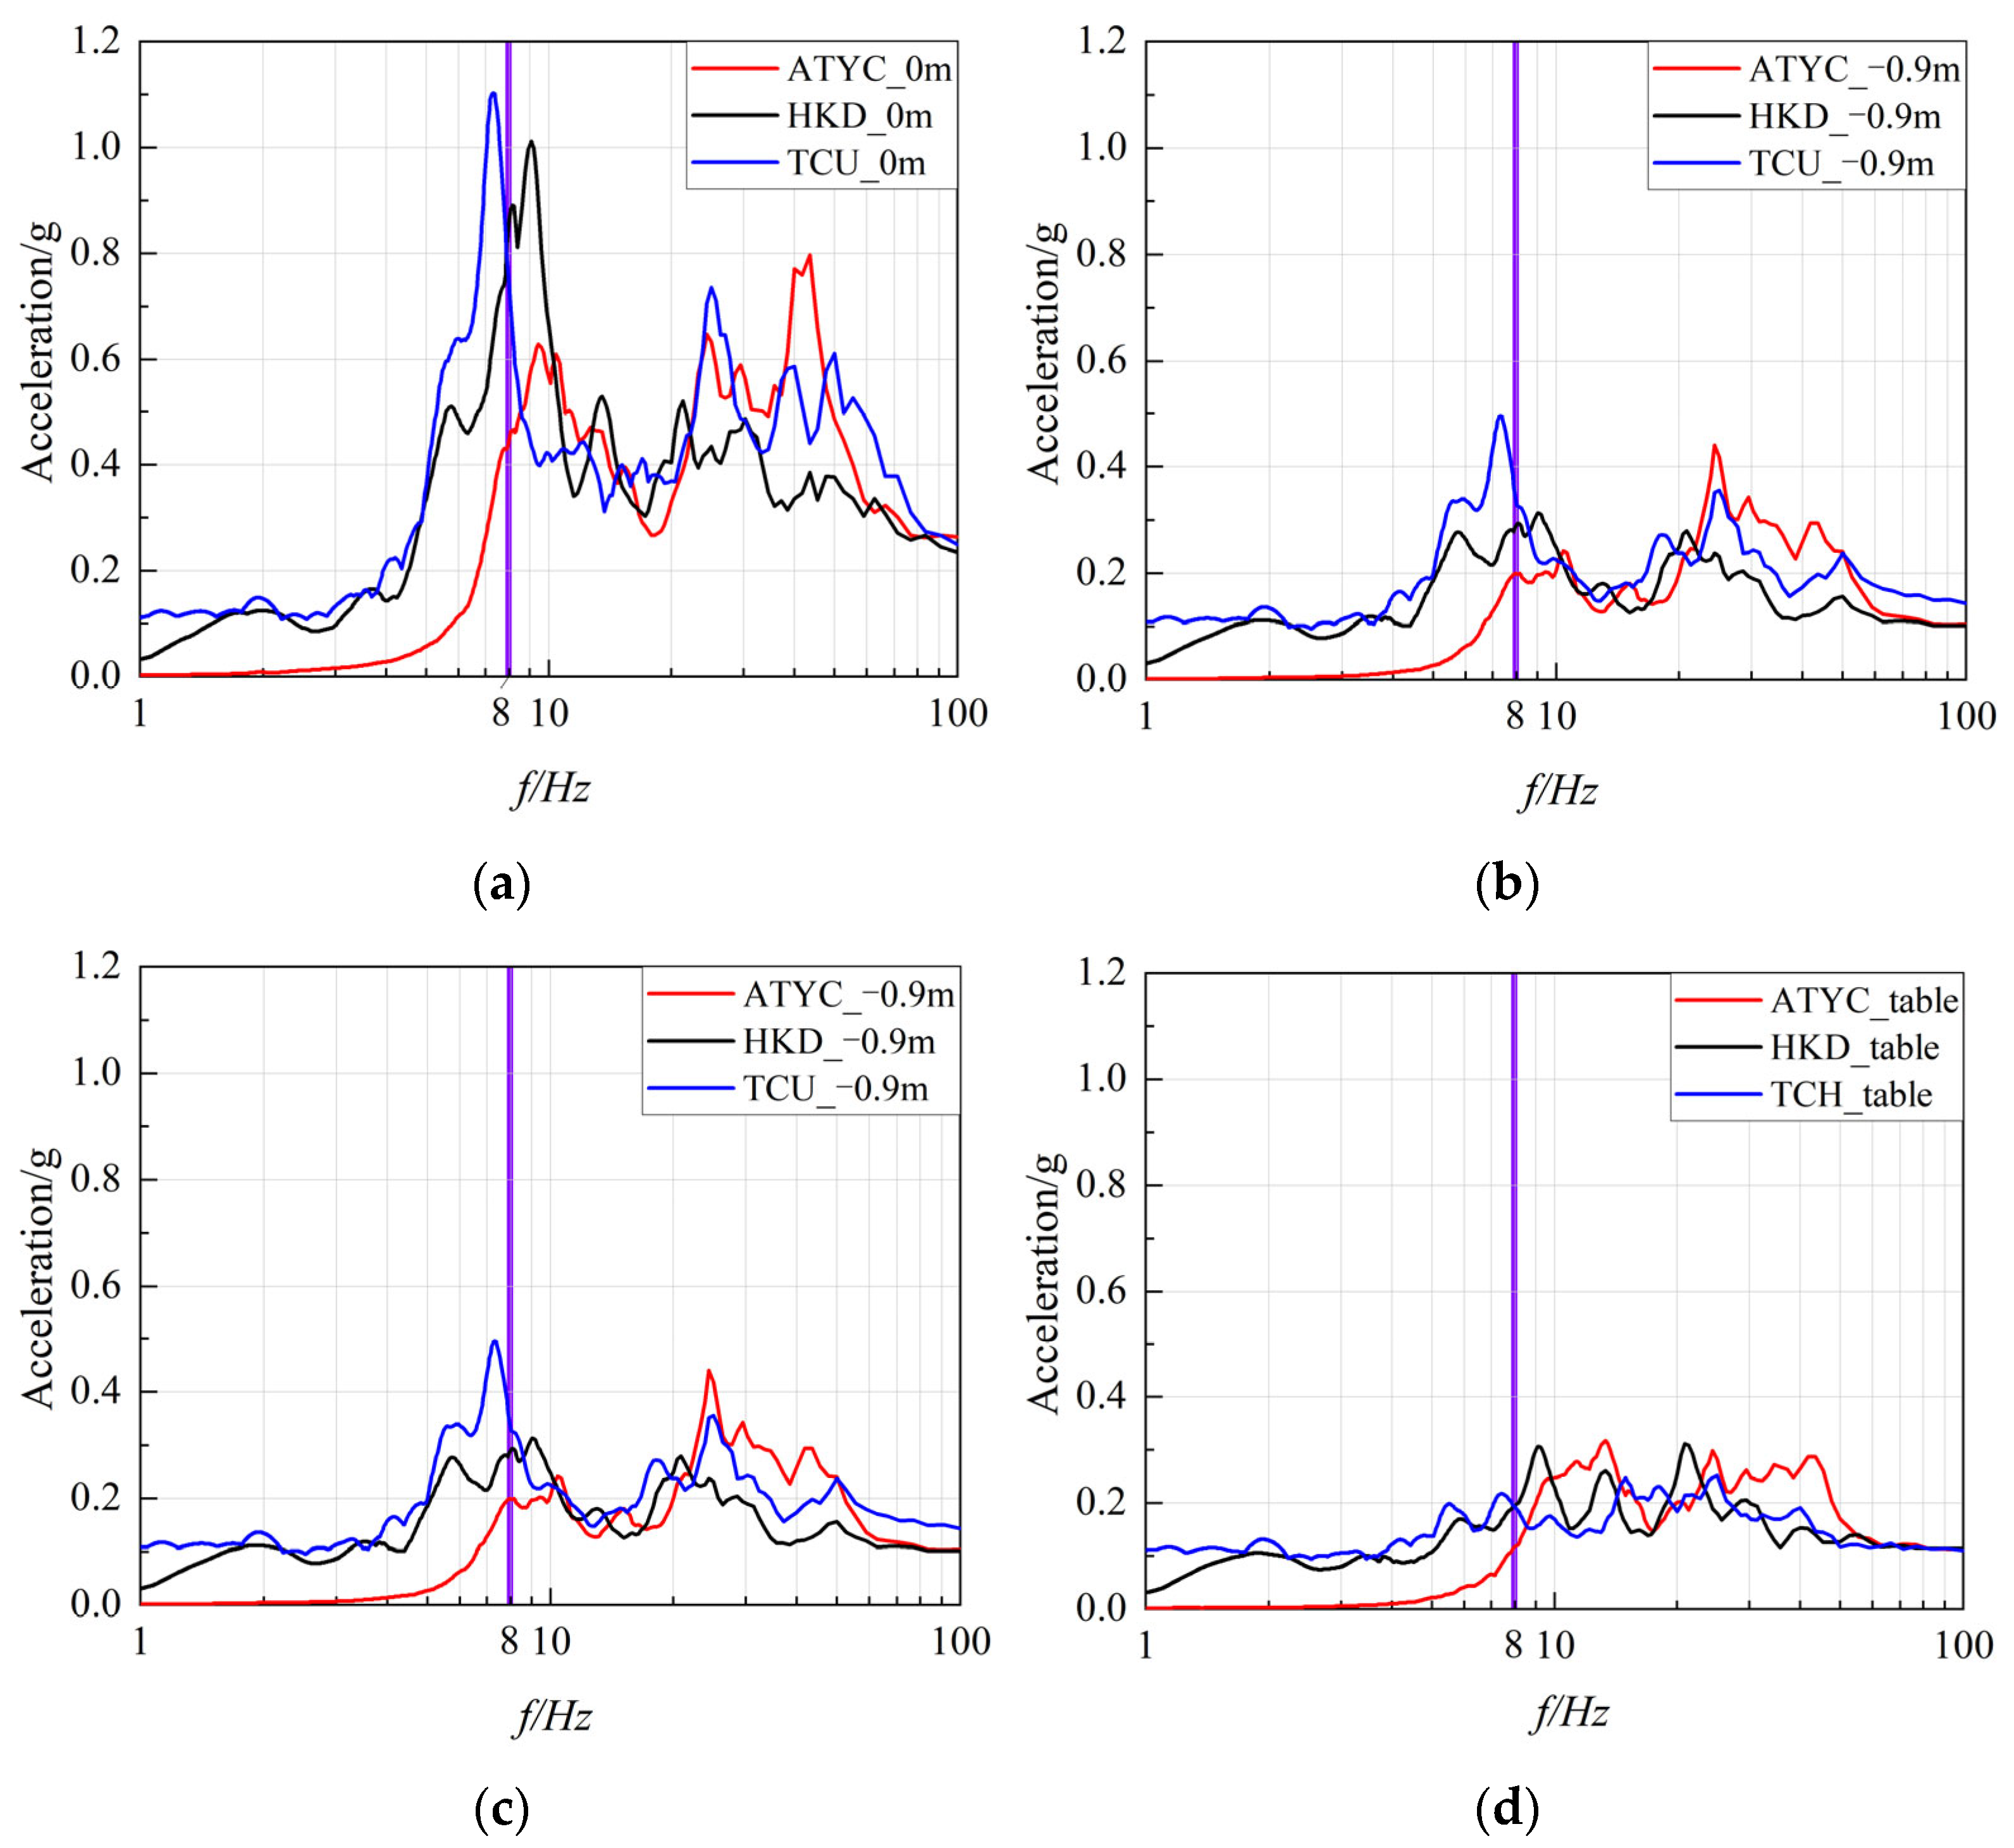
4.3.3. Response Spectra Analysis

Response spectra are crucial for designing new structures. However, response spectra in current design specifications ignore the effects of structures on the field. In order to study this, Figure 20a plots the responses of the six systems in terms of the acceleration response spectra for checkpoint A3 and the table versus the period when the input motion had a PGA of 0.1 g. Figure 20b shows the amplification ratio between the acceleration response spectral amplitudes for test X (I, IS, U, UI, and UIS) and for test FF at the surface ground versus the period with the input motions described above. It can be observed that the presence of structures caused de-amplification compared to test FF with ordinary excitation, where test IS had the maximum ratio of 1.86 and test I had the minimum ratio of 1.28. This is in line with the results described in Section 4.3.1. In contrast, except for test I, the presence of structures caused de-amplification over short periods and amplification over long periods with long-period excitation, where the maximum de-amplification ratio was about 3.7, and the minimum amplification ratio was about 1.74 for test IS. The ratio was greater than unity in some cases, such as tests I and U with input ATYC. This was attributed to the discreteness of the data, not because of the amplification type, in order to guarantee the correctness of the conclusions.

5. Conclusions

A shaking table test was conducted to evaluate the influence of subway stations with tunnel connecting joints and aboveground structures on the seismic response of the field under long-period earthquake excitations. Detailed descriptions of the experimental setup, test configurations, and validation procedures are provided. The results for the free-field (FF) condition were compared against five alternative configurations, focusing on the amplification factor (AMF), Fourier amplitude spectrum (FAS), Arias intensity, and spectral acceleration. The main conclusions can be summarized as follows:
  • The boundary effect was effectively minimized under the test conditions and found to have a negligible influence on the overall results.
  • The seismic response of the soil was significantly amplified, particularly under strong ground motions enriched with low-frequency components. Increased peak ground acceleration (PGA) led to enhanced hysteretic energy dissipation in the model soil. A clear pattern of high-frequency attenuation and low-frequency amplification was observed from the shaking table to the soil surface.
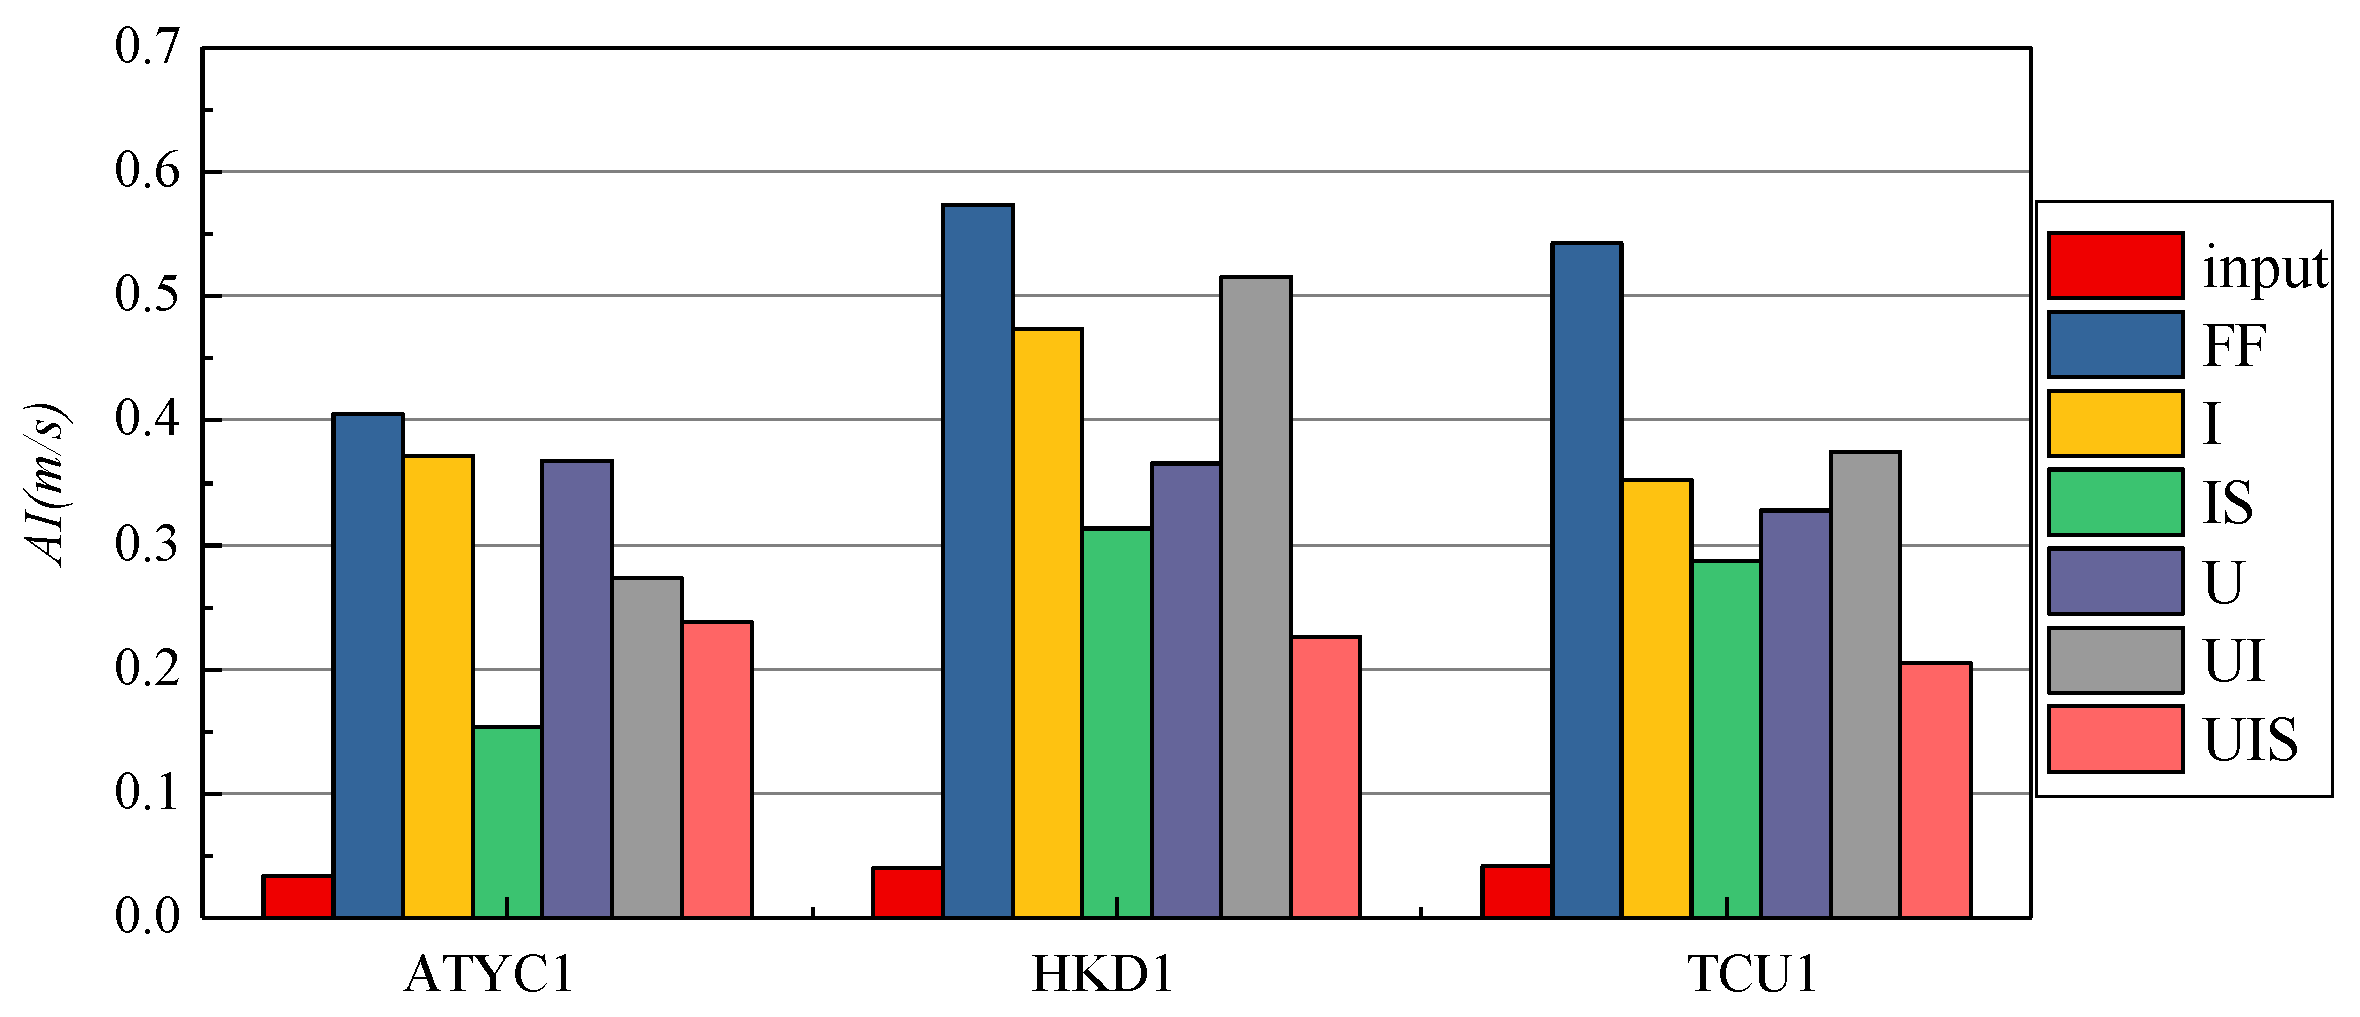
  • The presence of a subway station increases the first-order frequency of the field. It amplifies the AMF of the field response with aboveground structures at a certain distance from the subway station and de-amplifies the AMF with that directly above the station. Additionally, it altered the frequency characteristics of input motions and reduced the Arias intensity compared to the benchmark case. Overall, the subway station exerted a protective influence on nearby urban areas while potentially increasing seismic risk for more distant regions.
  • The presence of aboveground buildings reduces the first-order frequency of soil. Increasing the number of aboveground structures further reduces the first-order frequency. In addition, it reduces the AMF of the field, and the effect is greater with the addition of the number of buildings, at least as far as the case analyzed here is concerned. The input motions’ frequency characteristics change, and the Arias intensity is also reduced.
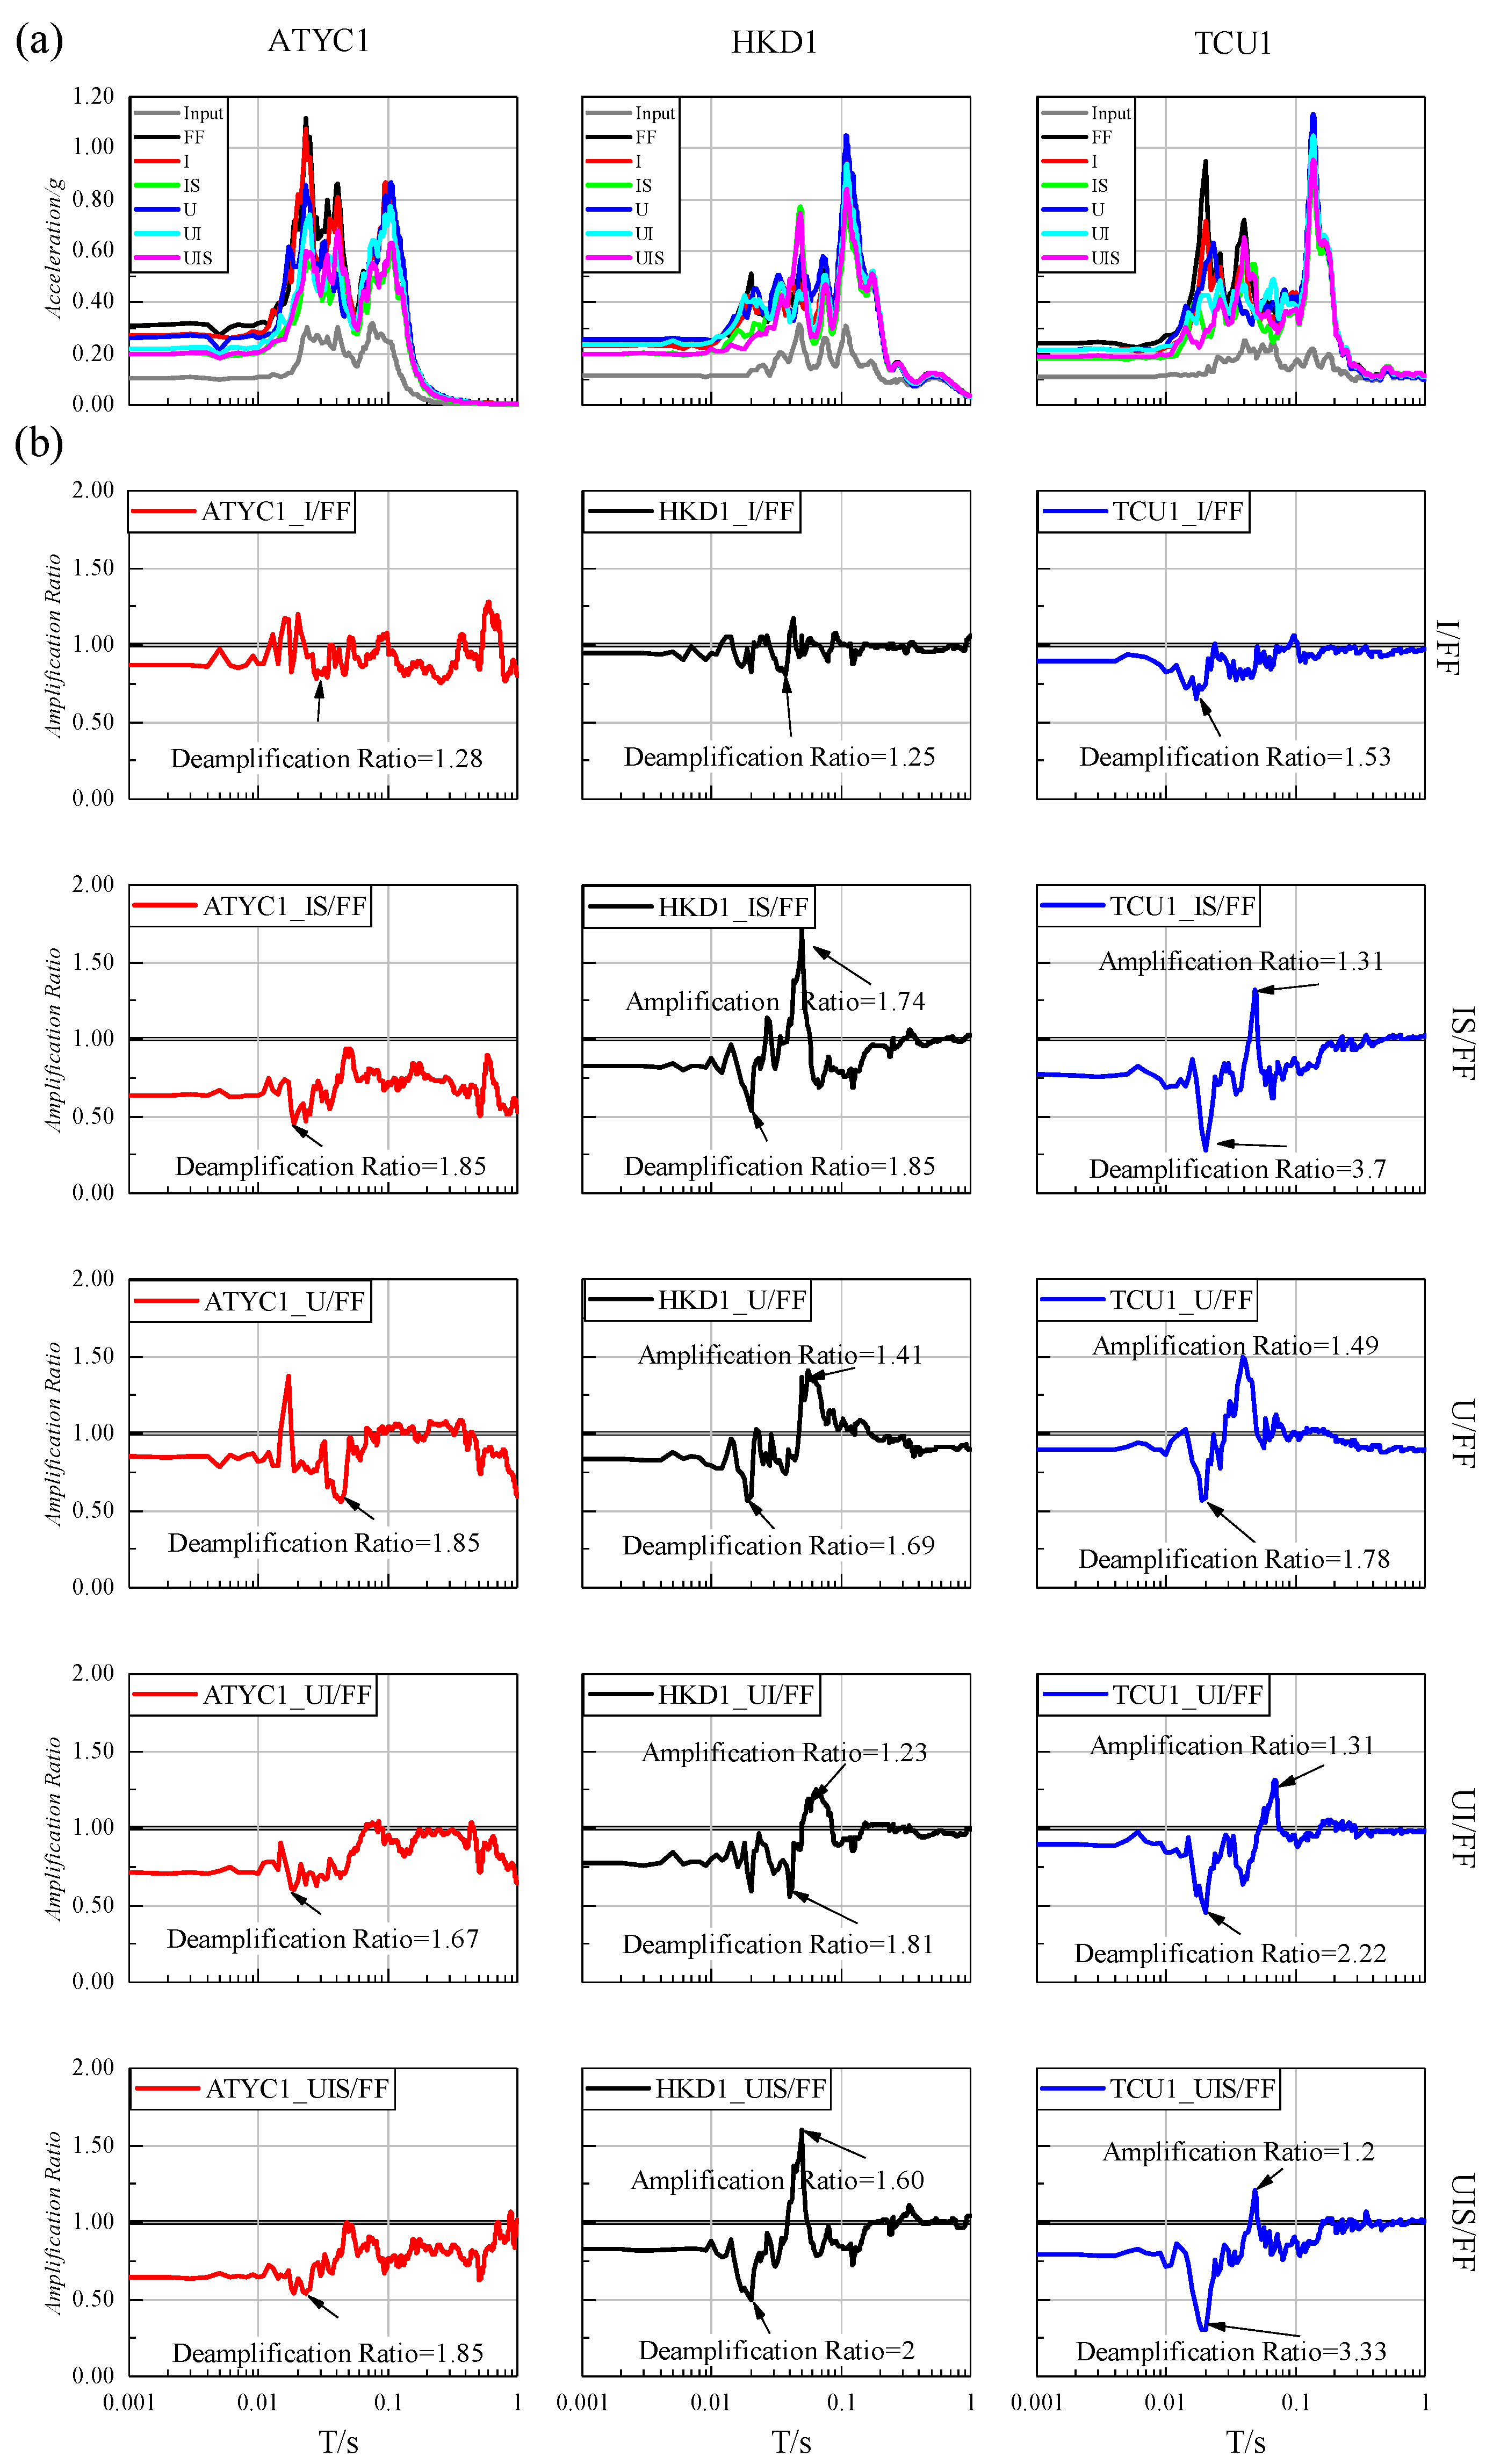
  • The presence of a subway station and/or aboveground buildings causes de-amplification of the acceleration response spectra with high-frequency excitation and de-amplification for short periods and amplification for long periods with low-frequency excitation.
The model soil used in the shaking table tests was selected to simulate the dynamic behavior of soft soils. As such, the results and conclusions are most applicable to structures founded in or interacting with soft soil deposits. In addition, since the superstructures modeled in this study represent simplified mid- and low-rise buildings with relatively short fundamental periods, the findings are particularly relevant for such structures commonly found in urban environments. The applicability to high-rise buildings, pile-supported systems, or stiff or highly heterogeneous soils may be limited and should be verified in future studies.

Author Contributions

Conceptualization, N.H.; methodology, N.H.; software, Y.L.; formal analysis, Y.L.; investigation, N.H.; resources, N.H.; data curation, N.H.; writing—original draft preparation, N.H.; writing—review and editing, B.X.; visualization, Z.Y.; supervision, X.H.; project administration, N.H.; funding acquisition, N.H. All authors have read and agreed to the published version of the manuscript.

Funding

This research was funded by the China Postdoctoral Science Foundation, grant number 2024M753067; the Science and Technology Foundation of Gansu Province, grant number 23JRRA801; Fundation of Western Center of Disaster Mitigation in Civil Engineering of Ministry of Education, grant number WCDMCE-24-02; Open funds projects of international research base of seismic mitigation and isolation of Gansu Province, grant number GII2023-D01.

Data Availability Statement

Data will be made available upon request.

Conflicts of Interest

Author Na Hong was employed by the company China Institute of Building Standard Design & Research Co., Ltd. Authors Xiaochun Ha and Bin Xu were employed by the company Gansu Construction Traffic Construction Co., Ltd. The remaining authors declare that the research was conducted in the absence of any commercial or financial relationships that could be construed as a potential conflict of interest.

References

  1. Ghergu, M.; Ionescu, I.R. Structure–soil–structure coupling in seismic excitation and “city effect”. Int. J. Eng. Sci. 2009, 47, 342–354. [Google Scholar] [CrossRef]
  2. Chen, Y.; Lu, X.; Huang, W. Simulation Method of Soil Boundary Condition in Shaking Table Tests of Soil-Structure Interaction. Struct. Eng. 2000, 3, 25–30. [Google Scholar]
  3. Wang, F.; Sett, K. Time domain stochastic finite element simulation towards probabilistic seismic soil-structure interaction analysis. Soil Dyn. Earthq. Eng. 2019, 116, 460–475. [Google Scholar] [CrossRef]
  4. Zhang, J.; Sun, M.; Fan, Z.; Yuan, Y.; Sun, Q. Shaking table test on shaft-tunnel junction in liquefiable sand site. Tunn. Undergr. Space Technol. 2024, 154, 106097. [Google Scholar] [CrossRef]
  5. Tao, L.; Shi, C.; Ding, P.; Yang, X.; Bao, Y.; Wang, Z. Shaking table test of the effect of an enclosure structure on the seismic performance of a prefabricated subway station. Tunn. Undergr. Space Technol. 2022, 125, 104533. [Google Scholar] [CrossRef]
  6. Yue, F.; Liu, B.; Zhu, B.; Jiang, X.; Chen, L.; Liao, K. Shaking table test and numerical simulation on seismic performance of prefabricated corrugated steel utility tunnels on liquefiable ground. Soil Dyn. Earthq. Eng. 2021, 141, 106527. [Google Scholar] [CrossRef]
  7. Xu, C.; Jiang, Z.; Du, X.; Shen, Y.; Chen, S. 1-g shaking table tests of precast horseshoe segmental tunnel: Experimental design, dynamic properties, deformation mode and damage pattern. Tunn. Undergr. Space Technol. 2021, 113, 103976. [Google Scholar] [CrossRef]
  8. Ding, X.; Zhang, Y.; Wu, Q.; Chen, Z.; Wang, C. Shaking table tests on the seismic responses of underground structures in coral sand. Tunn. Undergr. Space Technol. 2021, 109, 103775. [Google Scholar] [CrossRef]
  9. Zhu, T.; Hu, J.; Zhang, Z.; Zhang, J.-M.; Wang, R. Centrifuge Shaking Table Tests on Precast Underground Structure-Superstructure System in Liquefiable Ground. J. Geotech. Geoenviron. Eng. 2021, 147, 106756. [Google Scholar] [CrossRef]
  10. Wu, W.; Ge, S.; Yuan, Y.; Ding, W.; Anastasopoulos, I. Seismic response of subway station in soft soil: Shaking table testing versus numerical analysis. Tunn. Undergr. Space Technol. 2020, 100, 103389. [Google Scholar] [CrossRef]
  11. Tao, L.; Ding, P.; Yang, X.; Lin, P.; Shi, C.; Bao, Y.; Wei, P.; Zhao, J. Comparative study of the seismic performance of prefabricated and cast-in-place subway station structures by shaking table test. Tunn. Undergr. Space Technol. 2020, 105, 103583. [Google Scholar] [CrossRef]
  12. Ding, X.; Feng, L.; Wang, C.; Chen, Z.; Han, L. Shaking table tests of the seismic response of a utility tunnel with a joint connection. Soil Dyn. Earthq. Eng. 2020, 133, 106133. [Google Scholar] [CrossRef]
  13. Zhang, J.; Yuan, Y.; Bao, Z.; Yu, H.; Bilotta, E. Shaking table tests on shaft-tunnel junction under longitudinal excitations. Soil Dyn. Earthq. Eng. 2020, 132, 106055. [Google Scholar] [CrossRef]
  14. Liu, B.; Zhang, D.; Li, X.; Li, J. Seismic response of underground structure–soil–aboveground structure coupling system: Current status and future prospects. Tunn. Undergr. Space Technol. 2022, 122, 104372. [Google Scholar] [CrossRef]
  15. Smerzini, C.; Pitilakis, K.; Hashemi, K. Evaluation of earthquake ground motion and site effects in the Thessaloniki urban area by 3D finite-fault numerical simulations. Bull. Earthq. Eng. 2017, 15, 787–812. [Google Scholar] [CrossRef]
  16. Moghadam, M.R.; Baziar, M.H. Seismic ground motion amplification pattern induced by a subway tunnel: Shaking table testing and numerical simulation. Soil Dyn. Earthq. Eng. 2016, 83, 81–97. [Google Scholar] [CrossRef]
  17. Alielahi, H.; Kamalian, M.; Adampira, M. Seismic ground amplification by unlined tunnels subjected to vertically propagating SV and P waves using BEM. Soil Dyn. Earthq. Eng. 2015, 71, 63–79. [Google Scholar] [CrossRef]
  18. Chen, G.; Chen, S.; Qi, C.; Du, X.; Wang, Z.; Chen, W. Shaking table tests on a three-arch type subway station structure in a liquefiable soil. Bull. Earthq. Eng. 2015, 13, 1675–1701. [Google Scholar] [CrossRef]
  19. Baziar, M.H.; Moghadam, M.R.; Kim, D.; Choo, Y.W. Effect of underground tunnel on the ground surface acceleration. Tunn. Undergr. Space Technol. 2014, 44, 10–22. [Google Scholar] [CrossRef]
  20. Clouteau, D.; Broc, D.; Devésa, G.; Guyonvarh, V.; Massin, P. Calculation methods of Structure–Soil–Structure Interaction (3SI) for embedded buildings: Application to NUPEC tests. Soil Dyn. Earthq. Eng. 2012, 32, 129–142. [Google Scholar] [CrossRef]
  21. Smerzini, C.; Avilés, J.; Paolucci, R.; Sánchez-Sesma, F.J. Effect of underground cavities on surface earthquake ground motion under SH wave propagation. Earthq. Eng. Struct. Dyn. 2009, 38, 1441–1460. [Google Scholar] [CrossRef]
  22. Yiouta, P.; Kouretzis, G.; Bouckovalas, G.; Sofianos, A. Effect of underground structures in earthquake resistant design of surface structures. In Dynamic Response and Soil Properties. 2007. Available online: https://ascelibrary.org/doi/abs/10.1061/40904(223)16 (accessed on 17 June 2025).
  23. Nam, S.H.; Song, H.W.; Byun, K.J.; Maekawa, K. Seismic analysis of underground reinforced concrete structures considering elasto-plastic interface element with thickness. Eng. Struct. 2006, 28, 1122–1131. [Google Scholar] [CrossRef]
  24. Pitilakis, K.; Tsinidis, G.; Leanza, A.; Maugeri, M. Seismic behaviour of circular tunnels accounting for above ground structures interaction effects. Soil Dyn. Earthq. Eng. 2014, 67, 1–15. [Google Scholar] [CrossRef]
  25. Rizos, D.C.; Wang, Z. Coupled BEM–FEM solutions for direct time domain soil–structure interaction analysis. Eng. Anal. Bound. Elem. 2002, 26, 877–888. [Google Scholar] [CrossRef]
  26. Mroueh, H.; Shahrour, I. A full 3-D finite element analysis of tunneling–adjacent structures interaction. Comput. Geotech. 2003, 30, 245–253. [Google Scholar] [CrossRef]
  27. Azadi, M.; Hosseini, S.M.M.M. The Impact of Underground Tunnel Excavation on Adjacent Buildings During Earthquake Case Study: Shiraz Underground, Iran. Electron. J. Geotech. Eng. 2007, 12, 1–10. [Google Scholar]
  28. Tzarmados, D. Dynamic Interaction of Shallow Metro Tunnels with Aboveground Structures at the Surface. Master’s Thesis, Civil Engineering Department, Aristotle University of Thessaloniki, Thessaloniki, Greece, 2011. [Google Scholar]
  29. Guo, J.; Chen, J.; Bobet, A. Influence of a subway station on the inter-story drift ratio of adjacent surface structures. Tunn. Undergr. Space Technol. 2013, 35, 8–19. [Google Scholar] [CrossRef]
  30. Abate, G.; Massimino, M.R. Numerical modelling of the seismic response of a tunnel–soil–aboveground building system in Catania (Italy). Bull. Earthq. Eng. 2017, 15, 469–491. [Google Scholar] [CrossRef]
  31. Abate, G.; Massimino, M.R. Parametric analysis of the seismic response of coupled tunnel-soil-aboveground building systems by numerical modelling. Bull. Earthq. Eng. 2017, 15, 443–467. [Google Scholar] [CrossRef]
  32. Wang, G.; Yuan, M.; Miao, Y.; Wu, J.; Wang, Y. Experimental study on seismic response of underground tunnel-soil-surface structure interaction system. Tunn. Undergr. Space Technol. 2018, 76, 145–159. [Google Scholar] [CrossRef]
  33. Wang, G.; Yuan, M.; Ma, X.; Wu, J. Numerical study on the seismic response of the underground subway station-surrounding soil mass-ground adjacent building system. Front. Struct. Civ. Eng. 2017, 11, 424–435. [Google Scholar] [CrossRef]
  34. Meymand, P.J. Shaking Table Scale Model Tests of Nonlinear Soil-Pile-Superstructure Interaction in Soft Clay. Ph.D. Thesis, University of California, Berkeley, CA, USA, 1998. [Google Scholar]
  35. Moss, R.E.S.; Crosariol, V.A. Scale model shake table testing of an underground tunnel cross section in soft clay. Earthq. Spectra 2013, 29, 1413–1440. [Google Scholar] [CrossRef]
  36. Li, P.; Yang, J.; Lu, Z. Shaking table test and theoretical analysis of the pile-soil-structure interaction at a liquefiable site. Struct. Des. Tall Spec. Build. 2018, 27, e1513. [Google Scholar] [CrossRef]
  37. Chen, Z.; Chen, W.; Li, Y.; Yuan, Y. Shaking table test of a multi-story subway station under pulse-like ground motions. Soil Dyn. Earthq. Eng. 2016, 82, 111–122. [Google Scholar] [CrossRef]
  38. Moncarz, P.D.; Krawinkler, H. Theory and Application of Experimental Model Analysis in Earthquake Engineering (Report No. 50); John A. Blume Earthquake Engineering Center, Department of Civil Engineering, Stanford University: Stanford, CA, USA, 1981. [Google Scholar]
  39. Shang, S.; Liu, F.; Lu, H. Design and experimental study of a model soil used for shaking table test. Earthq. Eng. Eng. Vib. 2006, 4, 199–204. [Google Scholar]
  40. Blaney, G.M.W. Synthetic clay soil for dynamic model pile tests. In Dynamic Response of Pile Foundations—Experiment, Analysis and Observation; ASCE: New York, NY, USA, 1987. [Google Scholar]
  41. Tavenas, F.R.M.L. An Artificial Material for Simulating Champlain Clays. Can. Geotech. J. 1973, 3, 489–503. [Google Scholar] [CrossRef]
  42. Yan, X.; Yu, H.; Yuan, Y. Multi-point shaking table test of the free field under non-uniform earthquake excitation. Soils Found. 2015, 55, 985–1000. [Google Scholar] [CrossRef]
  43. Martin, P.P.; Seed, H.B. One-dimensional dynamic ground response analyses. J. Geotech. Eng. Div. ASCE 1982, 108, 935–952. [Google Scholar] [CrossRef]
  44. Jinping, Y. Shaking Table Test on Energy Dissipating Structures Considering Soil-Structure Dynamic Interaction. Ph.D. Thesis, Tongji University, Shanghai, China, 2018. [Google Scholar]
  45. Arias, A. A Measure of Earthquake Intensity. In Seismic Design for Nuclear Power Plants; Hansen, R.J., Ed.; MIT Press: Cambridge, MA, USA, 1970. [Google Scholar]
Figure 1. Soil container.
Buildings 15 02223 g001
Figure 2. Dynamic properties of the synthetic soil used in the test.
Buildings 15 02223 g002
Figure 3. Main dimensions of the subway station model (units: mm): (a) the section view and (b) the top view.
Buildings 15 02223 g003
Figure 4. Additional mass distribution pictures for the subway station model: (a) the frame structure and (b) the tunnel.
Buildings 15 02223 g004
Figure 5. The model aboveground structural frame designed for the tests (unit: mm): (a) the main dimensions and (b) the photo.
Buildings 15 02223 g005
Figure 6. Model aboveground structures with (a) rigid bearings and (b) slide bearings.
Buildings 15 02223 g006
Figure 7. Acceleration time history and Fourier spectra of (a) HKD, (b) TCU, and (c) ATYC.
Buildings 15 02223 g007
Figure 8. Design for six different test configurations: (a) FF, (b) U, (c) I, (d) IU, (e) IS, and (f) UIS.
Buildings 15 02223 g008
Figure 9. Schematic of acceleration sensors (unit: mm): (a) FF, (b), I, and (c) IS.
Buildings 15 02223 g009
Figure 10. (a) AMF and (b) Fourier amplitude spectra of the soil surface for TCU1.
Buildings 15 02223 g010
Figure 11. (a) First-order frequency and (b) damping ratio of the six tests.
Buildings 15 02223 g011
Figure 12. AMF versus d for the input motion: (a) 0.1 g, (b) 0.2 g, and (c) 0.3 g.
Buildings 15 02223 g012
Figure 13. Typical 5%-damped response spectra for seismic waves from the table to the soil surface: (a) 0 m, (b) −0.2 m, (c) −0.9 m, and (d) table.
Buildings 15 02223 g013
Figure 14. (a) Time–history and (b) time–frequency diagrams for the seismic waves recorded with the A3 accelerometer.
Buildings 15 02223 g014
Figure 15. AMF at checkpoints A3, A4, and A5 for all six system tests: (a) AMF of a specific test for different inputs, (b) AMF of six tests for input TCU1.
Buildings 15 02223 g015
Figure 16. The AMF at the surface soil (A1) for all six tests.
Buildings 15 02223 g016
Figure 17. Seismic response in terms of the relative ratio (Ra) for the three adopted input waves.
Buildings 15 02223 g017
Figure 18. Fourier spectra at the base of the table (input) and the ground surface (A3) for all tests.
Buildings 15 02223 g018
Figure 19. Arias intensity of different tests under seismic inputs.
Buildings 15 02223 g019
Figure 20. Acceleration response spectra at the ground surface (A3) for all tests: (a) the spectra amplitude and (b) the amplification ratio.
Buildings 15 02223 g020
Table 1. Shaking table specifications.
Platform size4 m × 4 m
Maximum capacity25 t
Shaking directionX, Y, Z six degrees of freedom
Peak accelerationsX: 1.2 g~0.8 g
Y: 0.8 g~0.6 g
Z: 0.7 g~0.5 g
Maximum velocities X/Y: ±1000 mm/s
Maximum displacements X/Y: ±500 mm
Frequency range0.1 Hz~50 Hz
Table 2. Similitude relationships and ratios of the model test system.
TypesPhysical QuantitiesSimilitude RelationSimilarity Ratio
Geometry propertiesLength (l) S l 1/30
Displacement (r) S l 1/30
Material propertiesElastic modulus (E) S E 2.6/30 = 0.0867
Stress (σ) S σ = S E 0.0867
Strain (ε) S ε = S σ / S E 1.0
Equivalent density (ρ) S ρ = S σ / S a S l 1.3
Poisson’s ratio (μ) S μ 1.0
Load propertiesLine load (P) S P = S σ S l 0.00289
Surface load (q) S q = S σ 0.0867
Dynamic propertiesMass (m) S m = S ρ S l 3 0.000048148
Stiffness (k) S k = S E S l 0.00289
Time (t) S t = ( S m / S k ) / 2 0.1291
Frequency (f) S f = 1 / S t 7.7460
Acceleration (a) S a 2.0
Table 3. Results of the cyclic triaxial test for synthetic soil [36].
G 0 (MPa) γ 0 AB D min D 0 β
6.309.09 × 10−41.140.451.21 × 10−20.181.11
Table 4. Load method for the shaking table test.
Number of TestsLoad No.Name of Input WavePGA (g)
1WN1White noise0.05
2ATYC1Mexican0.1
3TCU1Chi-Chi0.1
4HKD1Tokachi0.1
5WN2White noise0.05
6ATYC2Mexican0.2
7TCU2Chi-Chi0.2
8HKD1Tokachi0.2
9WN3White noise0.05
10ATYC3Mexican0.3
11TCU3Chi-Chi0.3
12HKD3Tokachi0.3
13WN4White noise0.05
Table 5. Natural frequency and damping ratio of the model soil in test FF.
First OrderSecond Order
Loading CaseFrequency (Hz)Damping RatioFrequency (Hz)Damping Ratio
Wn18.0230685640.06714273526.844082510.049318623
Wn27.9384356570.07110180626.498703620.048931665
Wn37.8650838230.07115203226.554525820.047449223
Wn47.7837422410.07535453925.846887350.043373584
Disclaimer/Publisher’s Note: The statements, opinions and data contained in all publications are solely those of the individual author(s) and contributor(s) and not of MDPI and/or the editor(s). MDPI and/or the editor(s) disclaim responsibility for any injury to people or property resulting from any ideas, methods, instructions or products referred to in the content.

