Abstract
The global construction industry faces pressing challenges in enhancing building energy efficiency standards. To address this critical issue, facilitate worldwide green and low-carbon transformation in construction practices and improve the thermal performance of building wall panels to achieve optimal levels, a novel polypropylene fiber-reinforced concrete wall panel has been developed and investigated. A three-dimensional steady-state heat transfer finite element model of the wall panel was established to simulate its thermal performance. Key parameters, including the thickness of the inner and outer concrete layers, insulation layer thickness, connector spacing, and connector arrangement patterns, were analyzed to evaluate the thermal performance of the fiber-reinforced concrete composite sandwich wall panel. The results indicate that the heat transfer coefficients of the G-FCSP and FCSP wall panels were 0.768 W/m2 · K and 0.767 W/m2 · K, respectively, suggesting that the glass fiber grid had a negligible impact on the thermal performance of the panels. The embedded insulation layer was crucial for enhancing the thermal insulation performance of the wall panel, effectively preventing heat exchange between the two sides. Increasing the thickness of the concrete layers had a very limited effect on reducing the heat transfer coefficient. Reducing the spacing of the connectors improved the load-bearing capacity of the composite wall panel to some extent but had minimal influence on the heat transfer coefficient; to achieve optimal performance by balancing structural load distribution and thermal damage resistance, a connector spacing ranging from 200 mm to 500 mm is recommended. The variation in heat transfer coefficients among the four different connector arrangement patterns demonstrated that reducing the thermal conduction media within the wall panel should be prioritized while ensuring mechanical performance. It is also recommended that the connectors are arranged in a continuous layout.
1. Introduction
The construction industry, as a significant contributor to global energy consumption and carbon emissions, plays a pivotal role in achieving international climate commitments, particularly the global goals outlined in agreements such as the Paris Agreement—namely, reducing carbon emissions by 2030 and achieving carbon neutrality by 2050–2060. This green transition is essential for supporting countries worldwide in meeting their Nationally Determined Contributions (NDCs) and accelerating the shift toward a low-carbon built environment [1,2]. To address this critical issue and promote the green and low-carbon transformation of construction practices globally [3,4], this study focuses on optimizing the thermal performance of polypropylene fiber-reinforced concrete wall panels. In recent years, prefabricated buildings have emerged as a key pathway for low-carbon transition in the construction industry, owing to their advantages in construction efficiency, energy savings, and environmental sustainability [5,6]. However, conventional concrete wall panels still exhibit deficiencies in thermal insulation performance, making them inadequate for meeting the requirements of ultra-low-energy buildings.
Polypropylene fiber-reinforced concrete (PFRC), as a novel composite material, demonstrates significantly improved crack resistance, toughness, and durability through the incorporation of polypropylene fibers [7,8,9,10]. Chia et al. (2025) investigated the effects of hybrid basalt-recycled polypropylene fibers on the mechanical properties of concrete at different volume fractions, revealing that polypropylene fibers effectively enhance concrete’s mechanical performance [11]. Mahdi et al. (2024) studied the flexural and post-cracking behavior of polypropylene fiber-reinforced waste paperboard-mixed concrete, demonstrating that polypropylene fibers provide superior fracture energy absorption [12]. Yan et al. (2025) conducted experimental and numerical studies on the bond behavior of polypropylene fiber-reinforced concrete beam specimens under corrosive conditions. Their results indicated that a high fiber content (1.5%) exhibited optimal crack suppression (15%) in severely corrosive environments, while a 0.5% fiber content significantly improved bond strength, bond ductility, and bond stiffness of PFRC specimens [13]. Wu et al. (2025) investigated the sulfate freeze–thaw and wet–dry cycle resistance mechanisms of polypropylene fiber-reinforced foam concrete. Their findings showed that polypropylene fibers reduce the fluidity and water absorption of foam concrete. The porous structure of polypropylene fiber foam concrete (PPFFC) and the bridging effect of PPFs enable it to withstand greater expansion pressure and mitigate cracking caused by ettringite and sodium sulfate crystal formation. The addition of polypropylene fibers (PPFs) facilitates the formation of a stable double-layer structure around reactive foam, resulting in a more homogeneous pore distribution. Furthermore, PPFs tightly bond with the cement matrix and fill pores, preventing sulfate penetration. Simultaneously, PPFs act as a skeleton to absorb transverse tension and enhance the matrix’s mechanical properties [14]. However, current domestic and international research on PFRC primarily focuses on mechanical properties, durability, and high-temperature spalling resistance [15,16,17,18,19,20,21,22], while systematic studies on its thermal performance remain scarce. In particular, the thermal insulation mechanisms of PFRC wall panels under varying fiber contents, distribution patterns, and environmental temperature/humidity conditions remain unclear, limiting their widespread application in energy-efficient buildings.
Thermal performance significantly impacts building energy efficiency, indoor comfort, and structural safety—particularly in extreme scenarios such as fires, where it helps delay heat transfer and mitigate damage to building walls, reduce consumption, improve thermal comfort, and ensure structural stability. This study investigates the thermal characteristics of polypropylene fiber-reinforced concrete (PFRC) sandwich wall panels through fundamental heat transfer theory analysis. This study first systematically reviews the fundamental heat transfer theory, and then establishes a finite element model. After verifying the model’s validity, we analyze key structural parameters of the wall panel including the thickness of inner/outer concrete wythes, insulation layer thickness, connector spacing, and connector layout patterns. From a heat transfer perspective, this research thoroughly investigates the thermal performance of fiber-reinforced concrete composite sandwich wall panels. The systematic thermal performance evaluation establishes optimal design parameters, providing essential foundations for both thermal design optimization and practical engineering applications of PFRC composite wall systems in sustainable construction.
2. Finite Element Model
2.1. Finite Element Heat Transfer Analysis Theory
Finite element thermal performance analysis is based on the law of energy conservation and includes the simulation and analysis of both steady-state and transient heat conduction problems.
2.1.1. Steady-State Thermal Analysis
Steady-state thermal analysis is used to study the transfer of heat within an object under constant temperature conditions. In steady-state conditions, the temperature distribution of the system does not change over time. At this point, the heat Q transferred from the outside to the entire system and the increment of the system’s internal energy ΔU are both 0, i.e., Q = ΔU = 0. The balance equation for steady-state thermal analysis is as follows:
In this part, [K] is the thermal conductivity matrix, which includes thermal conductivity, heat transfer coefficients, shape factors, etc.; {T} is the nodal temperature vector; {Q} is the nodal heat flux vector (including heat generated).
2.1.2. Transient Thermal Analysis
Transient thermal analysis is used to study the transfer of heat within an object under conditions where temperature changes over time. In transient conditions, the temperature distribution of the system evolves with time, and it is necessary to consider the time derivative term. At this point, the heat flux q is equal to the rate of change in internal energy u with respect to time, i.e., q = du/dt. The balance equation for transient thermal analysis is as follows:
In this formula, [K] is the thermal conductivity matrix of the system; {T} is the nodal temperature vector; [C] is the specific heat capacity matrix of the system; {T′} is the time derivative of the temperature vector; {Q} is the nodal heat flux vector.
2.2. Basic Assumptions of the Model
When performing thermal analysis using the finite element software ABAQUS 2022, certain simplifications need to be made to the finite element model in order to accelerate the computational speed.
Steady-State Assumption: The system is assumed to remain in a steady state throughout the entire analysis period, meaning that the temperature distribution of the indoor and outdoor environments does not change over time. The heat transfer coefficients are assumed to be constant, and the analysis is conducted based on the theory of steady-state thermal analysis.
Uniform Material Properties: The thermal conductivity of the material is assumed to be uniform throughout the material. In reality, the thermal conductivity of a material may vary with temperature, position, or direction.
Linear Material Response: The material’s response to temperature is assumed to be linear, meaning that the heat conduction caused by temperature changes is linear. The thermal properties of the material are assumed to remain constant over the entire temperature range.
Negligible Radiation Effects: The radiation effects on the material surface are ignored. The convective and conductive heat transfer of the wall panels are assumed to be significantly greater than the effects of radiation.
Negligible Boundary Heat Loss and Contact Thermal Resistance: Heat transfer and conduction on surfaces other than those affected by temperature are ignored. The contact thermal resistance caused by gaps between different materials is also ignored.
2.3. Methodology
Based on model validation, this study establishes an ABAQUS finite element model of polypropylene fiber-reinforced concrete wall panels to investigate their thermal performance. Parametric analyses are conducted, including the thickness of the inner and outer concrete layers, insulation layer thickness, connector spacing, and connector arrangement. The thermal behavior of the composite wall panel is evaluated from a heat transfer perspective to determine optimal design parameters. Furthermore, the applicability of wall panels with different insulation thicknesses in various climatic regions is analyzed. The findings provide a foundation for the thermal design and practical engineering application of such wall panels.
2.3.1. Model Design
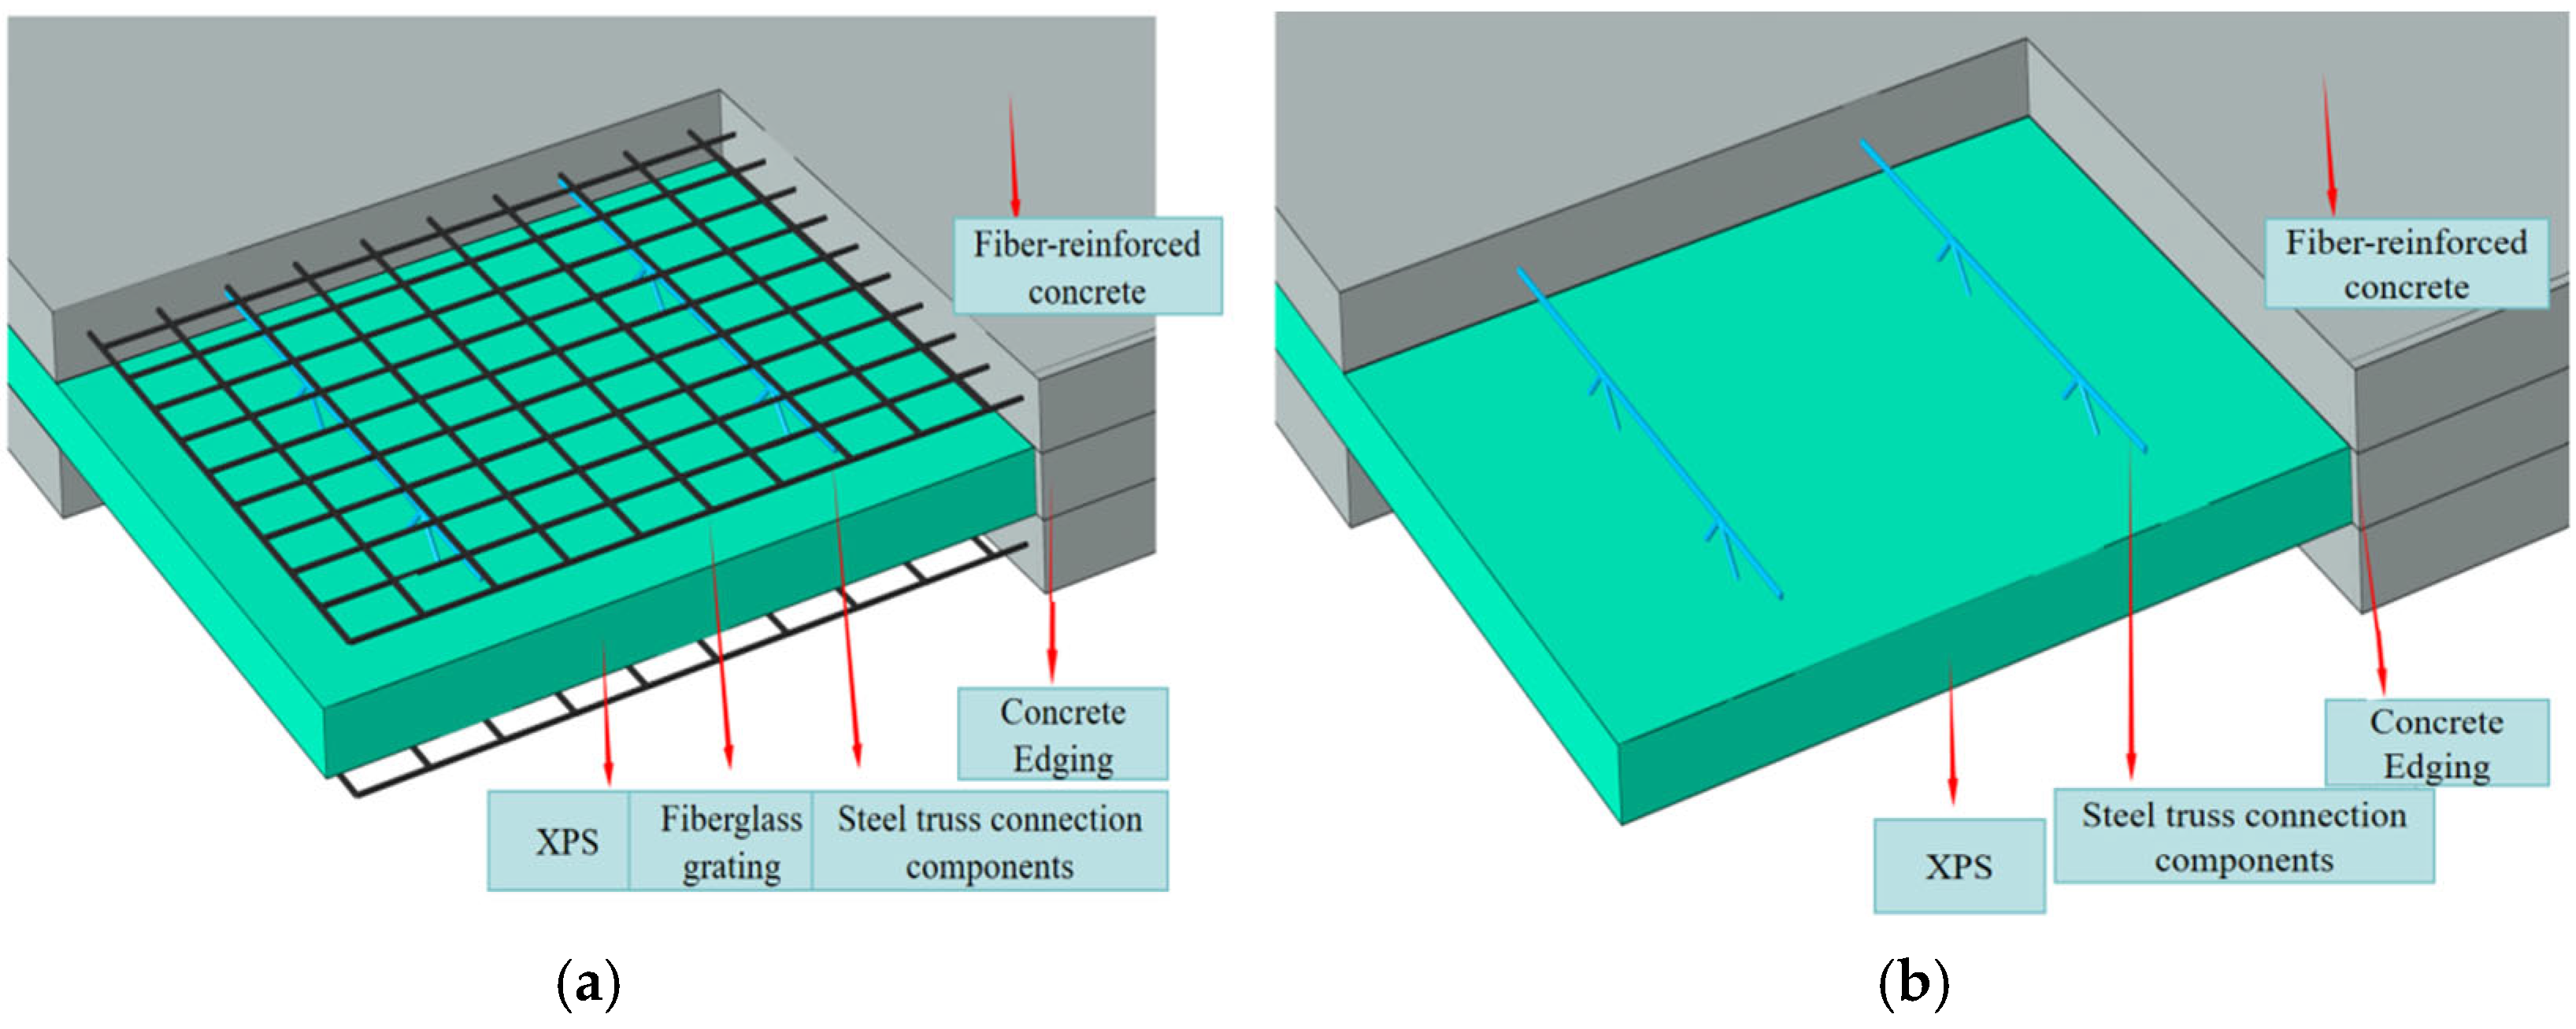
In this study, two types of wall panels were designed: the Grid-Fiber Concrete Sandwich Panel (G-FCSP), which is reinforced with glass fiber grids, and the Fiber Concrete Sandwich Panel (FCSP), which is not reinforced with steel mesh. For ease of comparison, both wall panels have dimensions of 4000 mm × 3000 mm × 150 mm. The mesh size of the glass fiber grid is 25.4 mm × 25.4 mm. According to the standard “08SJ110-2 Precast Concrete Exterior Cladding Panels”, wall panels of this size are classified as full-bay panels based on architectural elevation division. This means that the wall panels are large enough to cover an entire bay without the need for multiple panel joints. Full-bay panels significantly reduce the amount of on-site assembly work and time required, effectively shortening the construction period. They also improve the working environment for construction workers and minimize the inconvenience during the construction process. With fewer joints, full-bay panels can effectively reduce the possibility of rainwater leakage through panel joints, while also reducing energy loss and enhancing the overall thermal insulation performance of the exterior envelope. A 20 mm thick concrete edge is provided along the height of the wall panel to protect the insulation layer. Polypropylene fiber-reinforced concrete wall panels indirectly reduce energy consumption by improving thermal insulation and airtightness, while their high thermal capacity and crack resistance contribute to a stable indoor environment, enhancing thermal comfort, The board is made of Extruded Polystyrene Foam (XPS) panels. The three-dimensional structures of the two types of wall panels are illustrated in Figure 1a and Figure 1b, respectively.
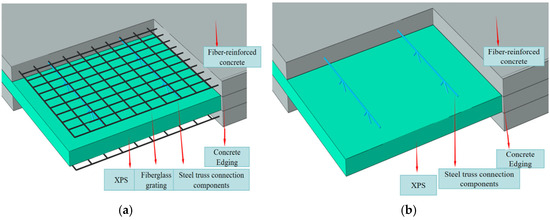
Figure 1.
The three-dimensional structure of the wall panel, where (a) is G-FCSP and (b) is FCSP.
2.3.2. Element Selection and Material Parameters
The ABAQUS software was switched to the heat transfer analysis module, and appropriate heat transfer element types were selected. The thermal transfer hexahedral eight-node linear solid element (DC3D8) was used for all materials. The mesh size was set to 50 mm, and the thickness direction was divided into four layers.
Numerous experimental studies on the determination of the thermal conductivity of polypropylene fiber-reinforced concrete have shown that for concrete with low fiber volume content, the effect of polypropylene fibers on the thermal conductivity of concrete at room temperature is minimal. Therefore, the influence of fibers on the thermal conductivity of concrete is not considered in the basic model, and only the analysis of G-FCSP and FCSP is performed. The glass fiber grid can be considered as one type of Glass Fiber-Reinforced Polymer (GFRP) material [23]. In accordance with the “Code for Thermal Design of Civil Buildings” GB 50176-2016 [24] and the European standards [25], the thermal conductivity values of the various materials are listed in Table 1.

Table 1.
Material conductivity values.
2.3.3. Boundary Conditions and Load Arrangement
When solving heat conduction problems, boundary conditions are an essential part of determining the solution, as they describe the interaction between the system and its surroundings. Boundary conditions are crucial for solving the heat conduction equation and typically involve surface temperature, heat flux, and convective heat transfer. Boundary conditions are generally classified into the following three types: (1) first, the Type Boundary Condition (Temperature Boundary Condition), where he temperature at the surface of the object is specified; (2) second, the Type Boundary Condition (Heat Flux Boundary Condition), where the heat flux through the surface of the object is specified. This indicates that the rate of heat flow into or out of the surface per unit area remains constant. (3) Third, the Type Boundary Condition (Mixed Boundary Condition), where both the temperature and heat flux at the surface are given. This situation is common in practical applications.
The heat transfer process of the wall is divided into three parts: first, convective heat exchange occurs between the fluid and the inner (or outer) surface of the wall panel; then, heat is conducted through the wall panel; and finally, convective heat exchange occurs again between the outer (or inner) surface of the wall panel and the fluid. Based on this heat transfer process, the boundary conditions for the established finite element model are of the third type. The temperatures on the inner and outer sides of the model are set to −5 °C and 25 °C, respectively. The convective heat transfer coefficients on the hot side and the room temperature side are 8.7 W/m2 · K and 23 W/m2 · K, respectively.
2.3.4. Model Validation
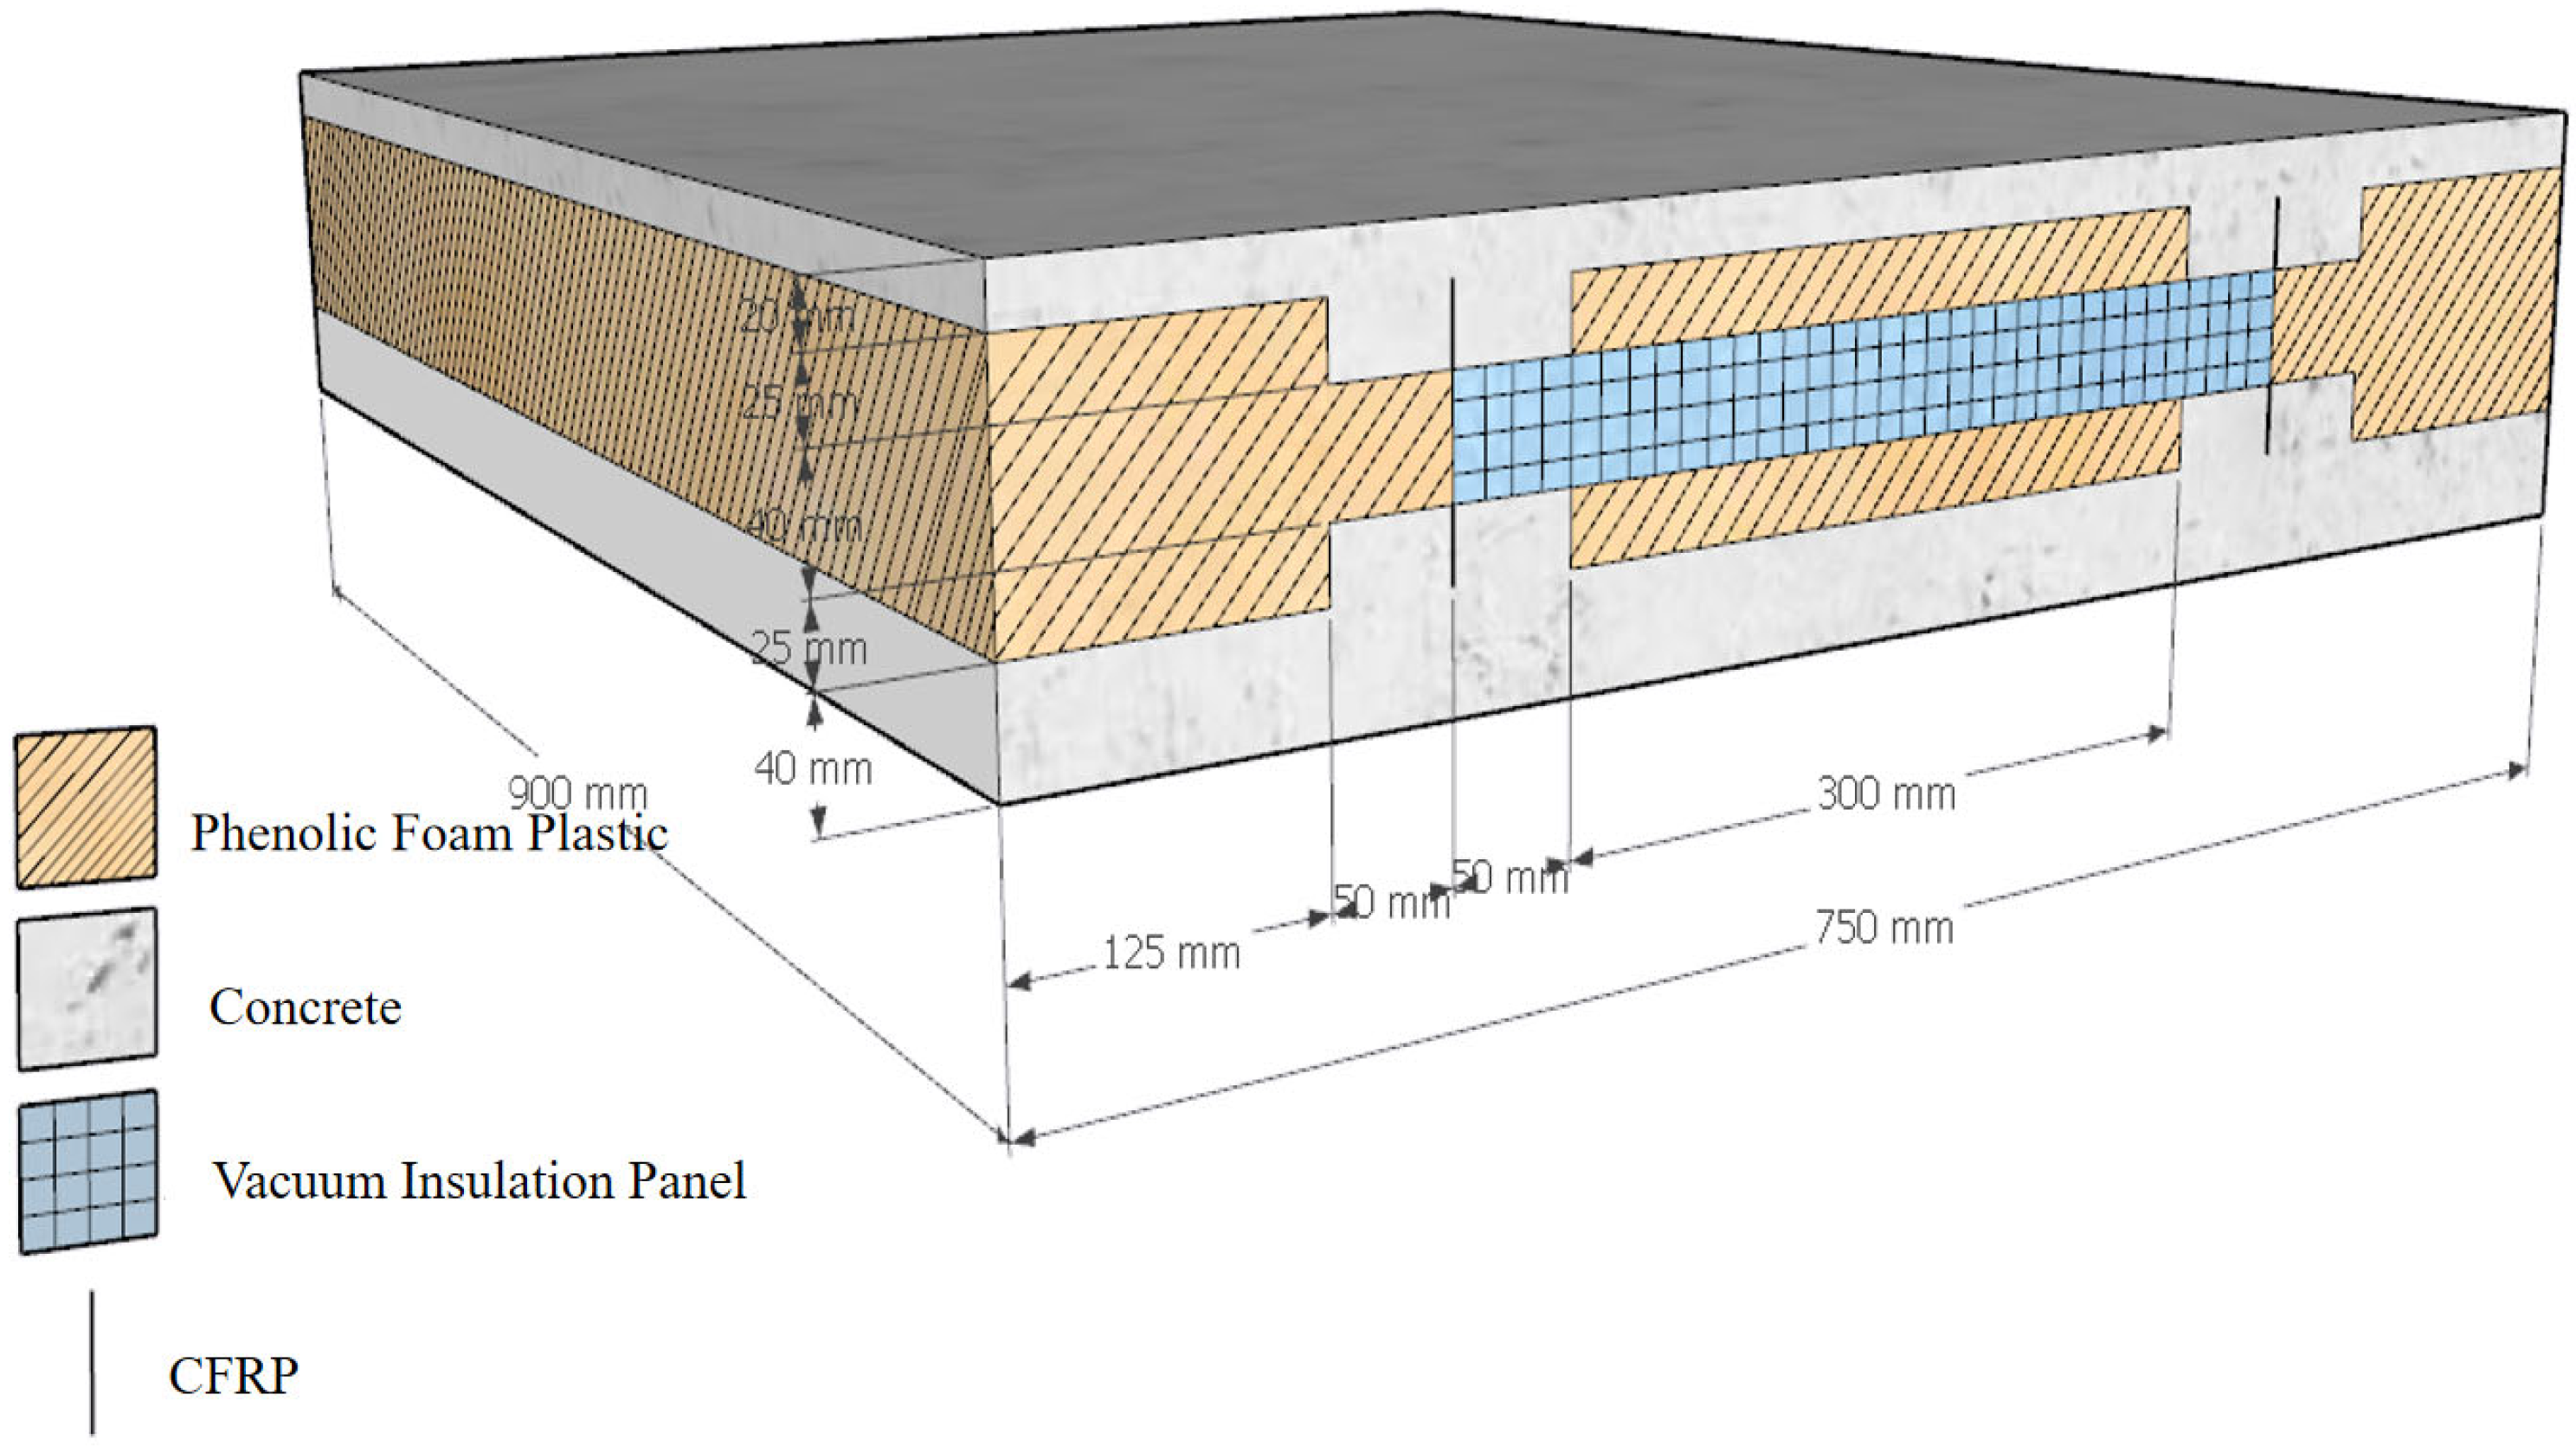
To ensure the accuracy of the thermal performance analysis of the two types of wall panels in this study, the experimental results from the literature “Thermal investigation of thin precast concrete sandwich panels” [26] were selected for validation. The corresponding finite element model was established to simulate and verify the results. The test specimen materials included concrete, phenolic foam, vacuum insulation panels (VIPs), and carbon fiber-reinforced resin material (CFRP) connectors with a lower thermal conductivity. The dimensions and specific construction details are shown in Figure 2.

Figure 2.
Three-dimensional schematic diagram of wallboard composition.
During the test, the wall panel was placed in a guarded hot box apparatus, which consisted of a heated aluminum plate. The hot side of the aluminum plate was maintained at a constant temperature of 50 °C, while the cold side of the wall panel was exposed to an ambient temperature of 16 °C. A heat flux meter and a temperature sensor were installed at the center of the wall panel and the center of the connector, respectively. Additionally, an extra temperature sensor was placed on the cold side to measure the ambient temperature. The measured thermal transmittance values were 0.144 W/(m2 · K) at the center of the wall panel and 0.555 W/(m2 · K) at the connector location. The thermal properties of the materials used in the test are listed in Table 2.
Table 2.
Model material parameters.
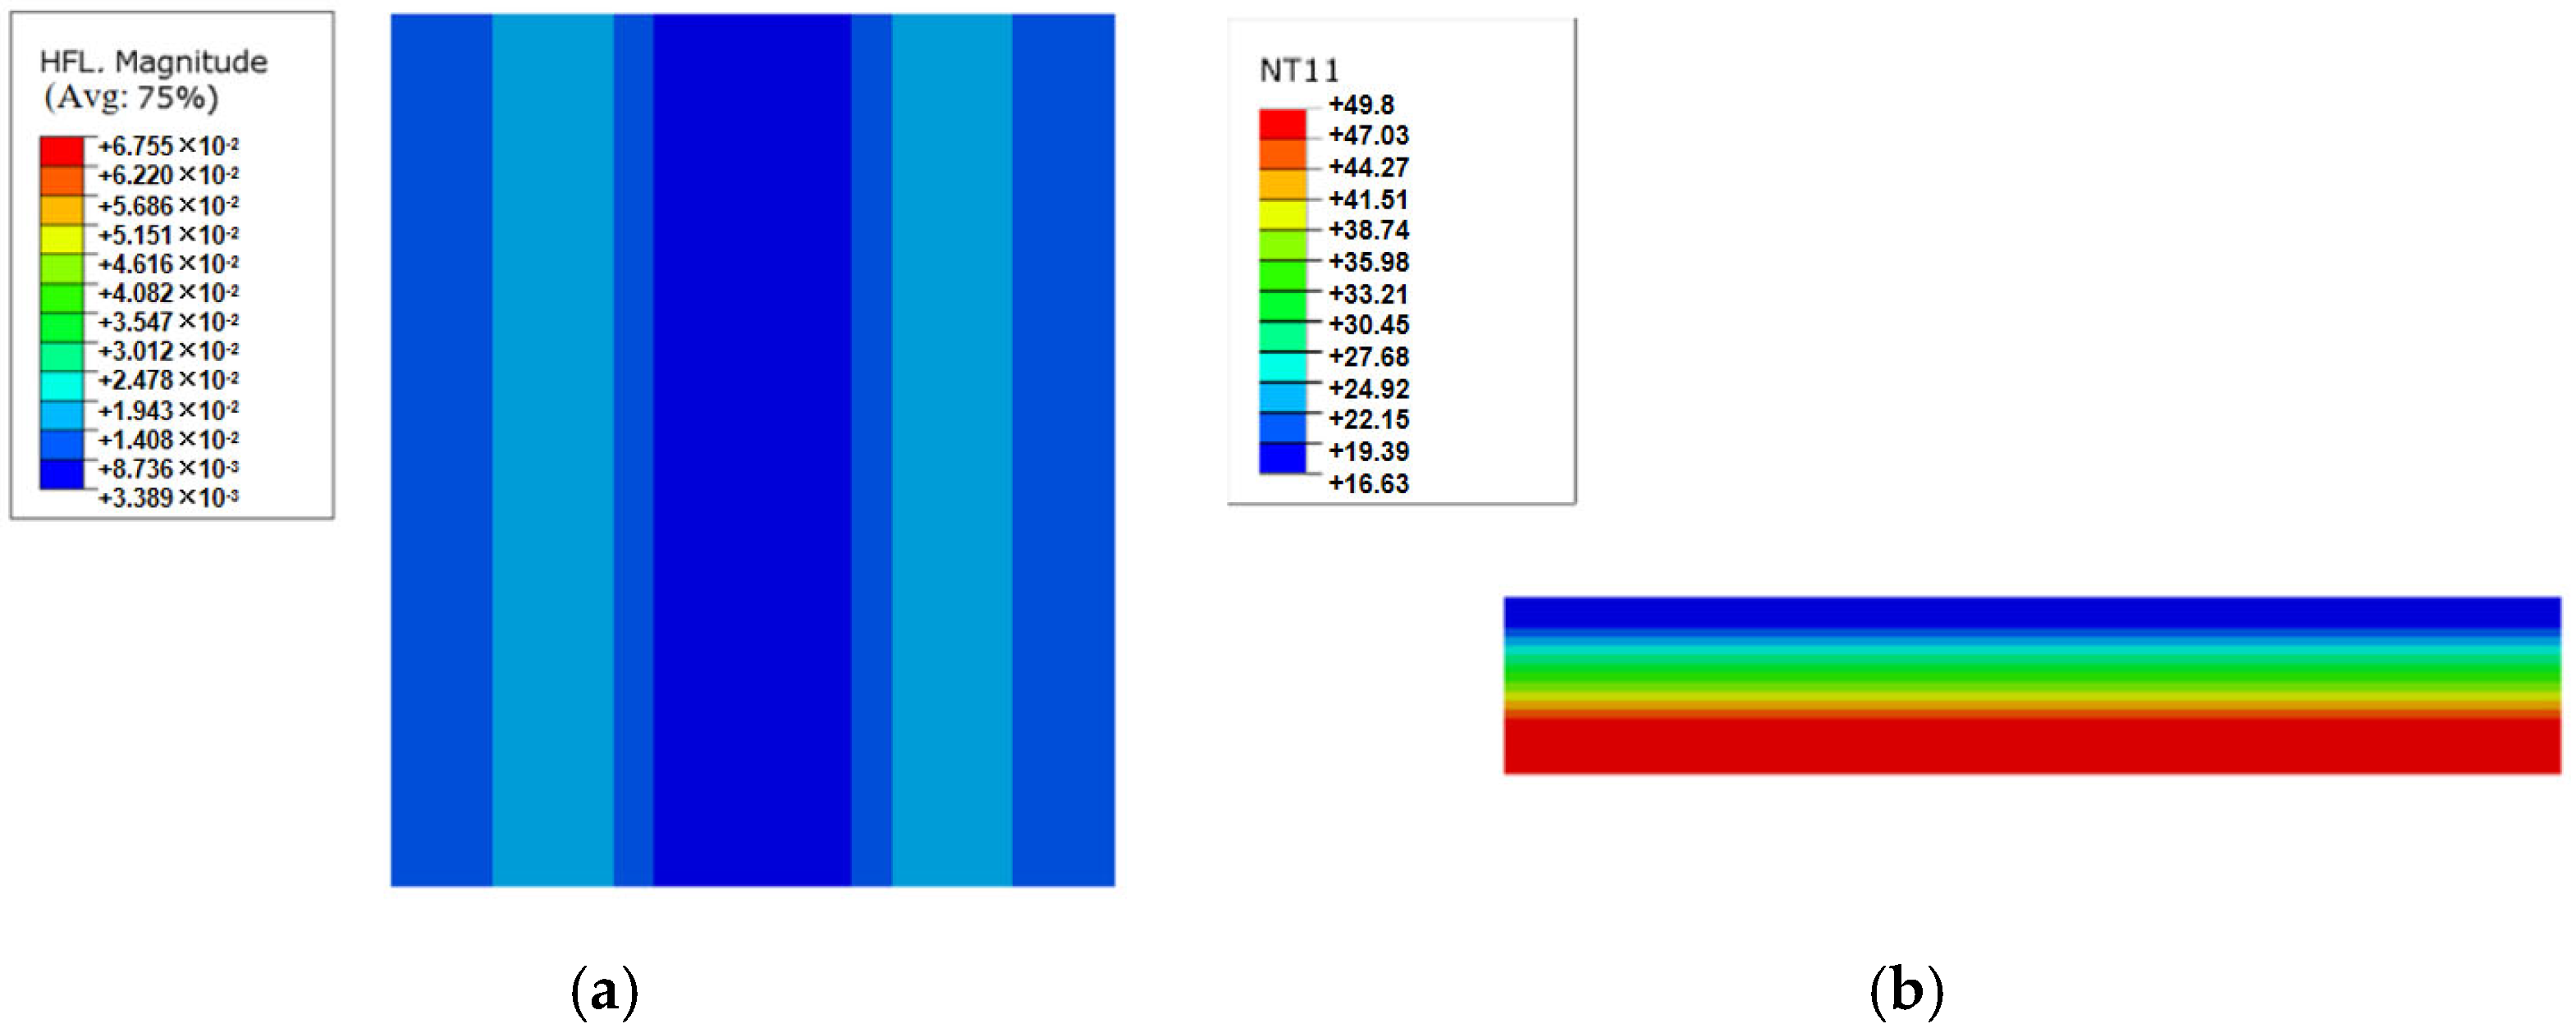
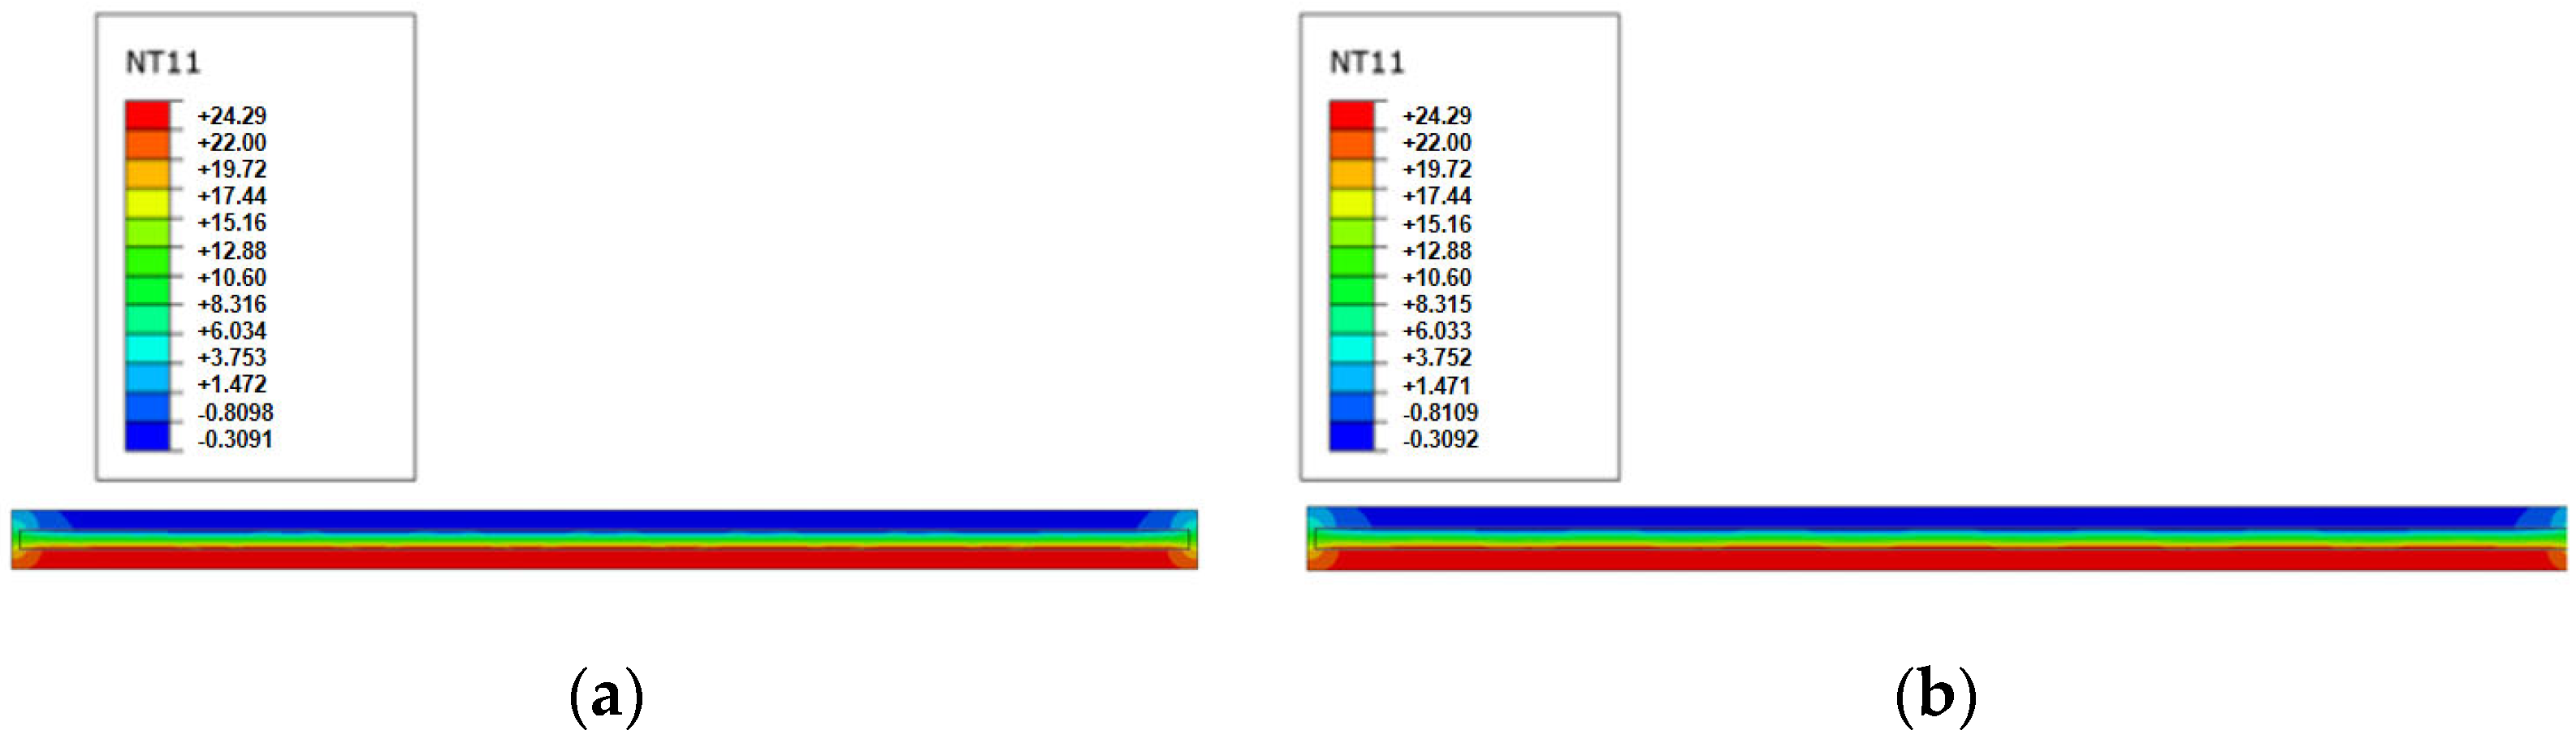
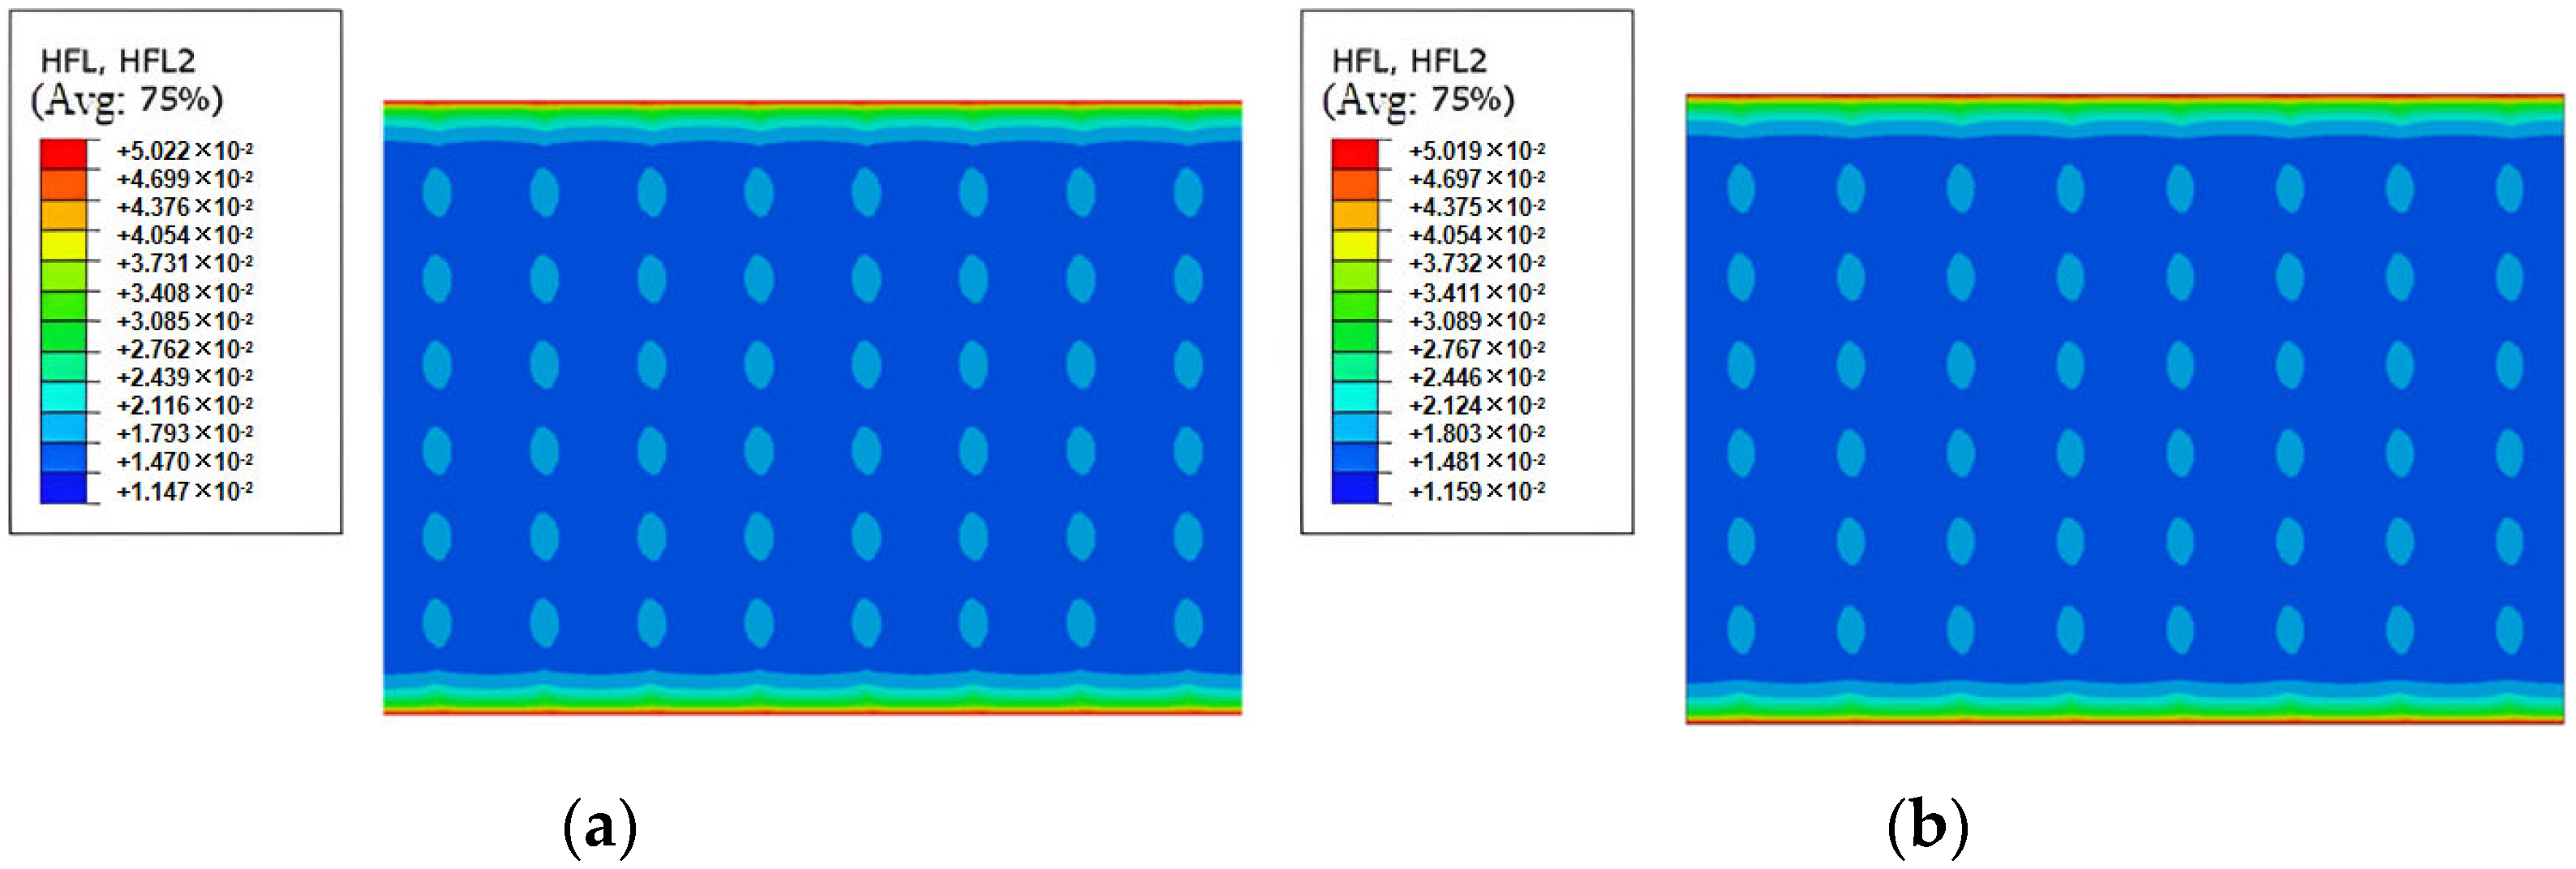
Figure 3 shows the cloud diagrams of the heat flux density distribution on the wall surface and the temperature field distribution along the wall thickness in the validation model. The heat flux density contour map shows that the heat flux density is significantly higher near the connectors of the wall panel, indicating a distinct thermal bridging effect. The temperature variation of the wall panel mainly occurs in the insulation layer in the middle of the wall panel. The temperature on the room-temperature side of the wall panel only increases by 0.63 °C, which demonstrates the effective heat-blocking function of the insulation layer.

Figure 3.
Model simulation results: (a) Heat flux distribution contour plot on wall panel; (b) temperature field contour plot through wall thickness.
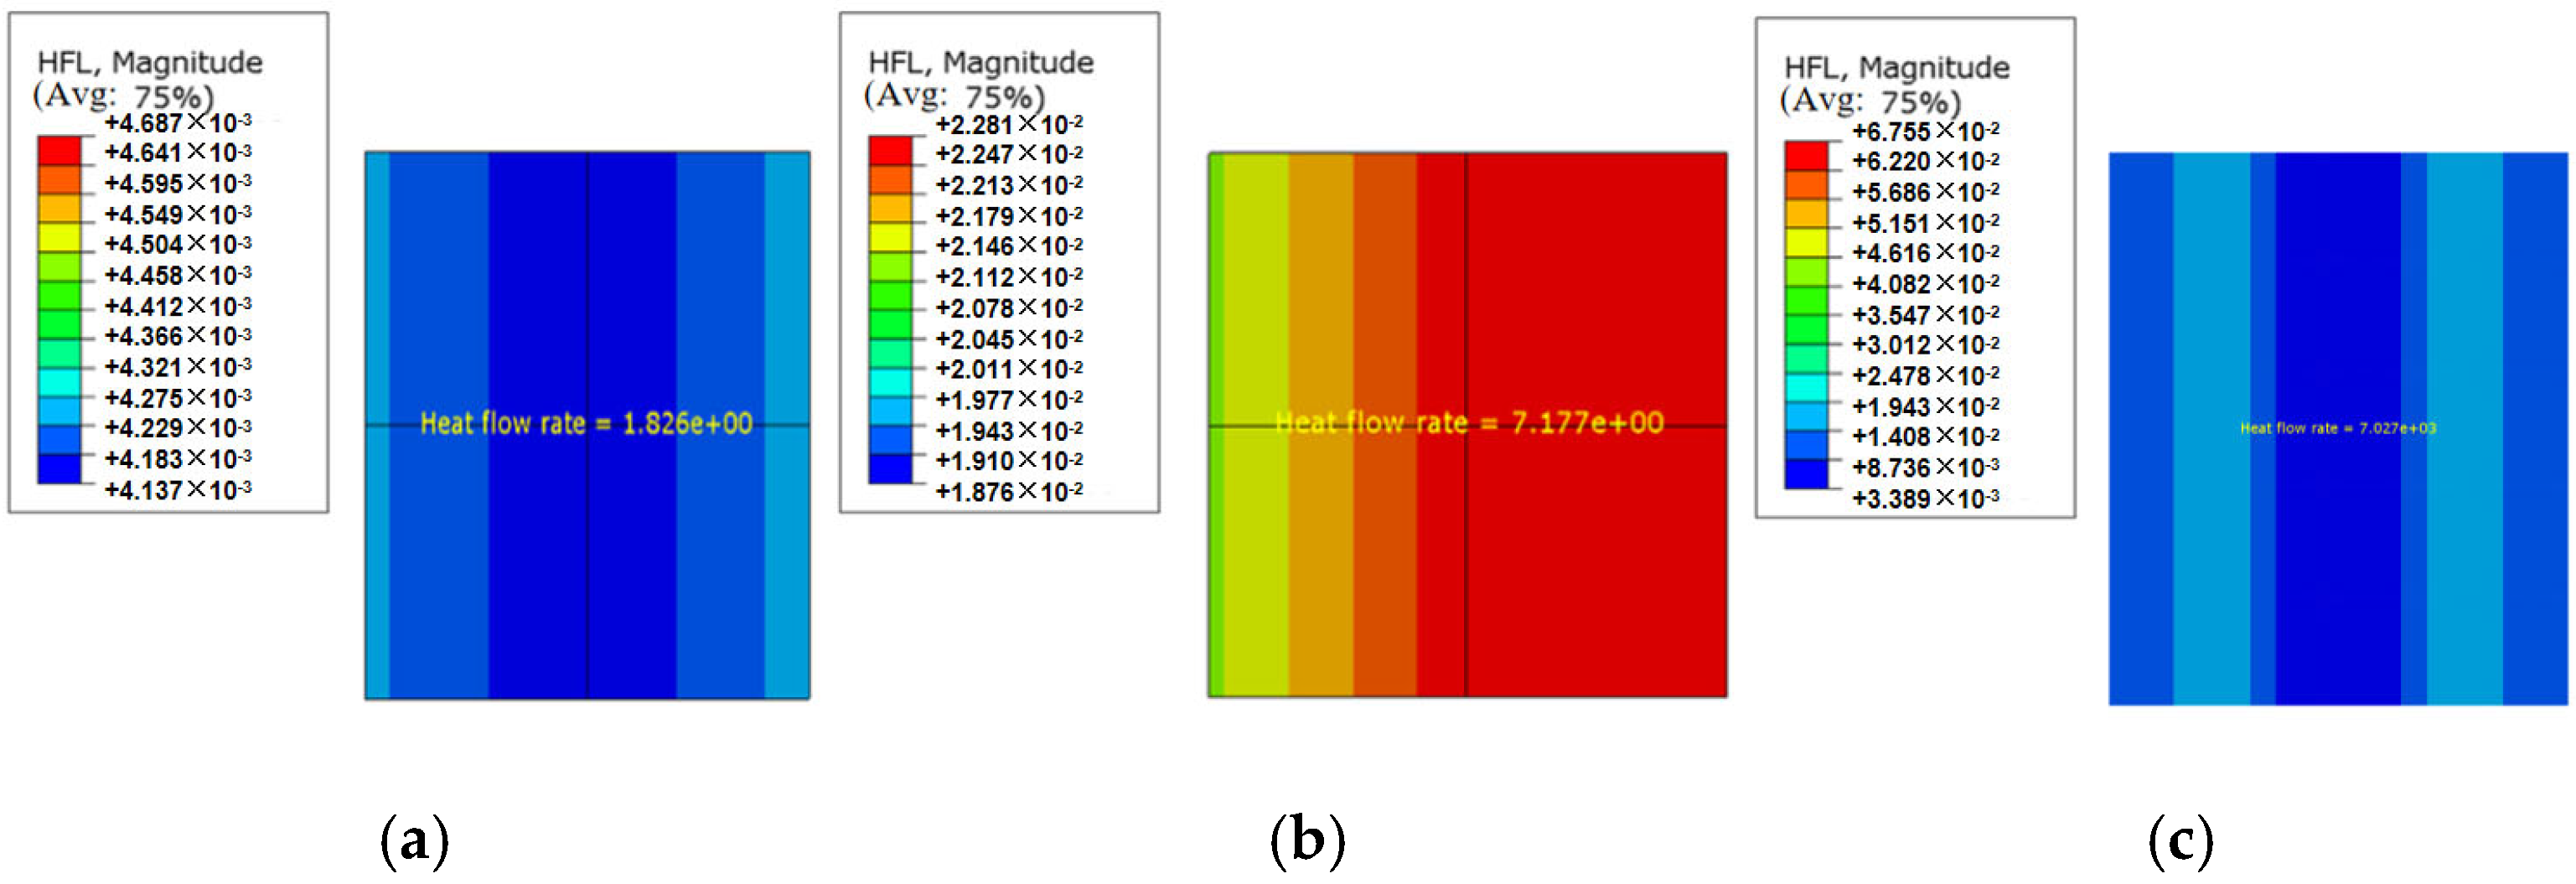
The heat flux values that correspond to the center position, thermal bridge position of the connector, and the overall wall panel were extracted from both the validation model and the experimental results, as shown in Figure 4. It can be observed that the heat flux at the central region of the wall panel is relatively low, indicating that the insulation layer effectively hinders heat transfer. In contrast, the heat flux at the thermal bridge locations (connectors) is typically significantly higher than that at the central region. This is attributed to the higher thermal conductivity of the connectors, which facilitates rapid heat transfer, thereby forming thermal bridges. The overall heat flux of the wall panel reflects a combined effect of the heat fluxes at both the central region and the thermal bridge locations.
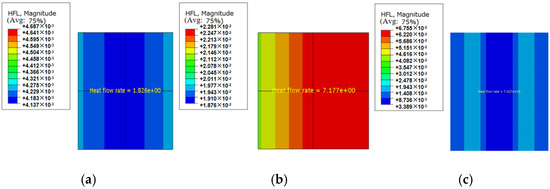
Figure 4.
Verification of the heat flux at each position of the wallboard in the model: (a) the heat flux corresponding to the center position of the wallboard in the test; (b) the heat flux corresponding to the position of the wallboard connectors in the test; (c) the overall heat flux of the wallboard surface in the test.
The simulation and calculation results for PCSP from the literature are presented in Table 3. The comparison of errors with the experimental results from the literature is shown in Table 4. The results demonstrate that the discrepancies at both the central region of the wall panel and the thermal bridge locations are within 5%, showing good agreement with experimental data. This confirms the reliability of the simulation method for subsequent analyses.
Table 3.
The simulation and calculation results of PCSP in the literature.
Table 4.
Model result validation.
3. Simulations
A finite element analysis model for the thermal performance of the sandwich wall panel was established based on the designed wall panel dimensions. The inner and outer surface temperatures of the wall panel, the temperature difference, and the average thermal transmittance coefficient of the wall panel, obtained from the simulation results and processed using Equation (3), are shown in Table 5. The thermal conductivity coefficients of the G-FCSP and FCSP wall panels were 0.768 W/m2 · K and 0.767 W/m2 · K, respectively, while the temperature differences between the hot and cold sides were 27.381 °C and 27.382 °C, with a difference of only 0.004%. The use of glass fiber grids improves the mechanical properties of fiber concrete sandwich wall panel without steel mesh to a certain extent, while having a negligible adverse effect on the thermal performance of the sandwich wall panel. This is because the thermal conductivity of glass fiber material is only 0.4 W/m2 · K, which is much lower than that of steel (58.2 W/m2 · K). Therefore, from the perspective of the thermal performance of the wall panel, the application of glass fiber grids in sandwich wall panels is feasible.
where K is the thermal transmittance coefficient of the wall (W/m2 · K); is heat flux density (W/m2), taken as the average heat flux density in the direction perpendicular to the wall surface; and are the environmental temperatures on the outer and inner sides of the wall (°C), respectively.
Table 5.
Numerical simulation results of sandwich wallboard.
The temperature contour maps, heat flux density contour maps, and cross-sectional heat flux density contour maps of the G-FCSP and FCSP are shown in Figure 5, Figure 6 and Figure 7, respectively. By comparing the temperature contour maps of the two types of wall panels, it is found that both wall panels have the same temperature on the hot side and exhibit a distinct temperature gradient. The temperature gradient is minimal in the middle of the wall panels, with most of the temperature variation occurring within the insulation layer. This indicates that the built-in insulation layer effectively prevents heat transfer between the two sides of the wall panels. The temperature gradient is more pronounced at the concrete edges of the wall panels. The temperature at the hot-side edge is lower than that at the center of the wall panel, while the temperature at the cold-side edge is higher than that at the center. This suggests that there is significant heat exchange at the concrete edges. There is a slight difference in the temperature of the cold-side nodes between the two wall panels, which is attributed to the addition of glass fiber grids in the G-FCSP. However, the impact of this variation on the thermal insulation performance of the wall panels is relatively minor.
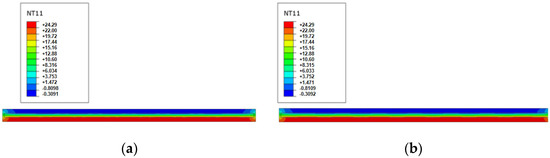
Figure 5.
Wallboard temperature cloud chart: (a) temperature contour map of G-FCSP; (b) temperature contour map of FCSP.

Figure 6.
Heat flux density cloud of wall panel surface: (a) thermal flux density contour map of the G-FCSP surface; (b) thermal flux density contour map of the FCSP surface.
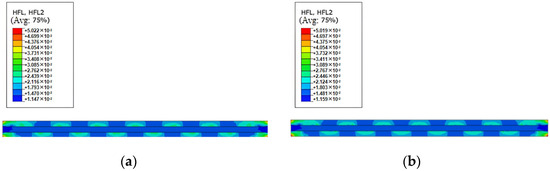
Figure 7.
Heat flux density cloud of wallboard section: (a) thermal flux density contour map of the G-FCSP cross-section; (b) thermal flux density contour map of the FCSP cross-section.
The heat flux density contour maps and cross-sectional plots of the two types of wall panels clearly show a significant increase in heat flux density at the concrete edges and the contact areas between the steel trusses and concrete. This indicates that during normal use, heat will be transferred through the concrete edges and steel trusses, exhibiting a pronounced thermal bridging effect. This further demonstrates that the edges and connectors have a certain impact on the thermal performance of the wall panels. To analyze the extent of the impact of the steel truss connectors on thermal performance, a thermal analysis was conducted on an FCSP wall panel without connectors, resulting in a thermal transmittance coefficient of 0.748 W/m2 · K. The presence of connectors increases the thermal transmittance coefficient of the FCSP by only 2.67%, indicating that the steel truss connectors have a relatively minor effect on the thermal performance. Furthermore, a thermal analysis was performed on an FCSP wall panel without the concrete edge, yielding a thermal transmittance coefficient of 0.693 W/m2 · K. The presence of the concrete edge increases the thermal conductivity of the wall panel by 10.97%, with the concrete edge thickness being 20 mm. The analyzation results presents that the concrete edge has a more significant adverse effect on the thermal performance of the wall panel. The purpose of setting a concrete edge is to protect the internal insulation layer and enhance the overall integrity of the wall panel. Therefore, to balance thermal performance, protection, and overall integrity, the edge thickness should neither be too large nor too small. If necessary, materials with lower thermal conductivity could be used to replace the concrete at the edges.
4. Discussion
The simulation results indicate that the thermal conductivity of the fiber-reinforced concrete wall panel is 0.77 W/(m2 · K), which falls between the reference values specified in EN ISO 6946 [27] for ordinary concrete (1.4 W/(m2 · K)) and lightweight insulating concrete (0.6 W/(m2 · K)). This demonstrates that the material achieves a balance between structural strength and thermal insulation potential, while also meeting international standard requirements.
To comprehensively validate the superior performance of fiber-reinforced concrete wall panels, this study conducted a comparative analysis of the thermal properties between polypropylene fiber-reinforced concrete wall panels and conventional concrete wall panels [28]. The results demonstrate that the polypropylene fiber-reinforced concrete exhibits significantly lower heat transfer coefficients (U-values) compared to conventional concrete, along with markedly improved thermal insulation performance. In practical applications, buildings utilizing polypropylene fiber-reinforced concrete (PFRC) wall panels exhibit smaller indoor temperature fluctuations and superior thermal insulation performance compared to those with conventional concrete wall panels. Consequently, polypropylene fiber-reinforced concrete wall panels are more suitable for construction applications requiring enhanced thermal insulation and temperature stability.
5. Analysis of Parameters
5.1. Thickness of Concrete Outer and Inner Leaves
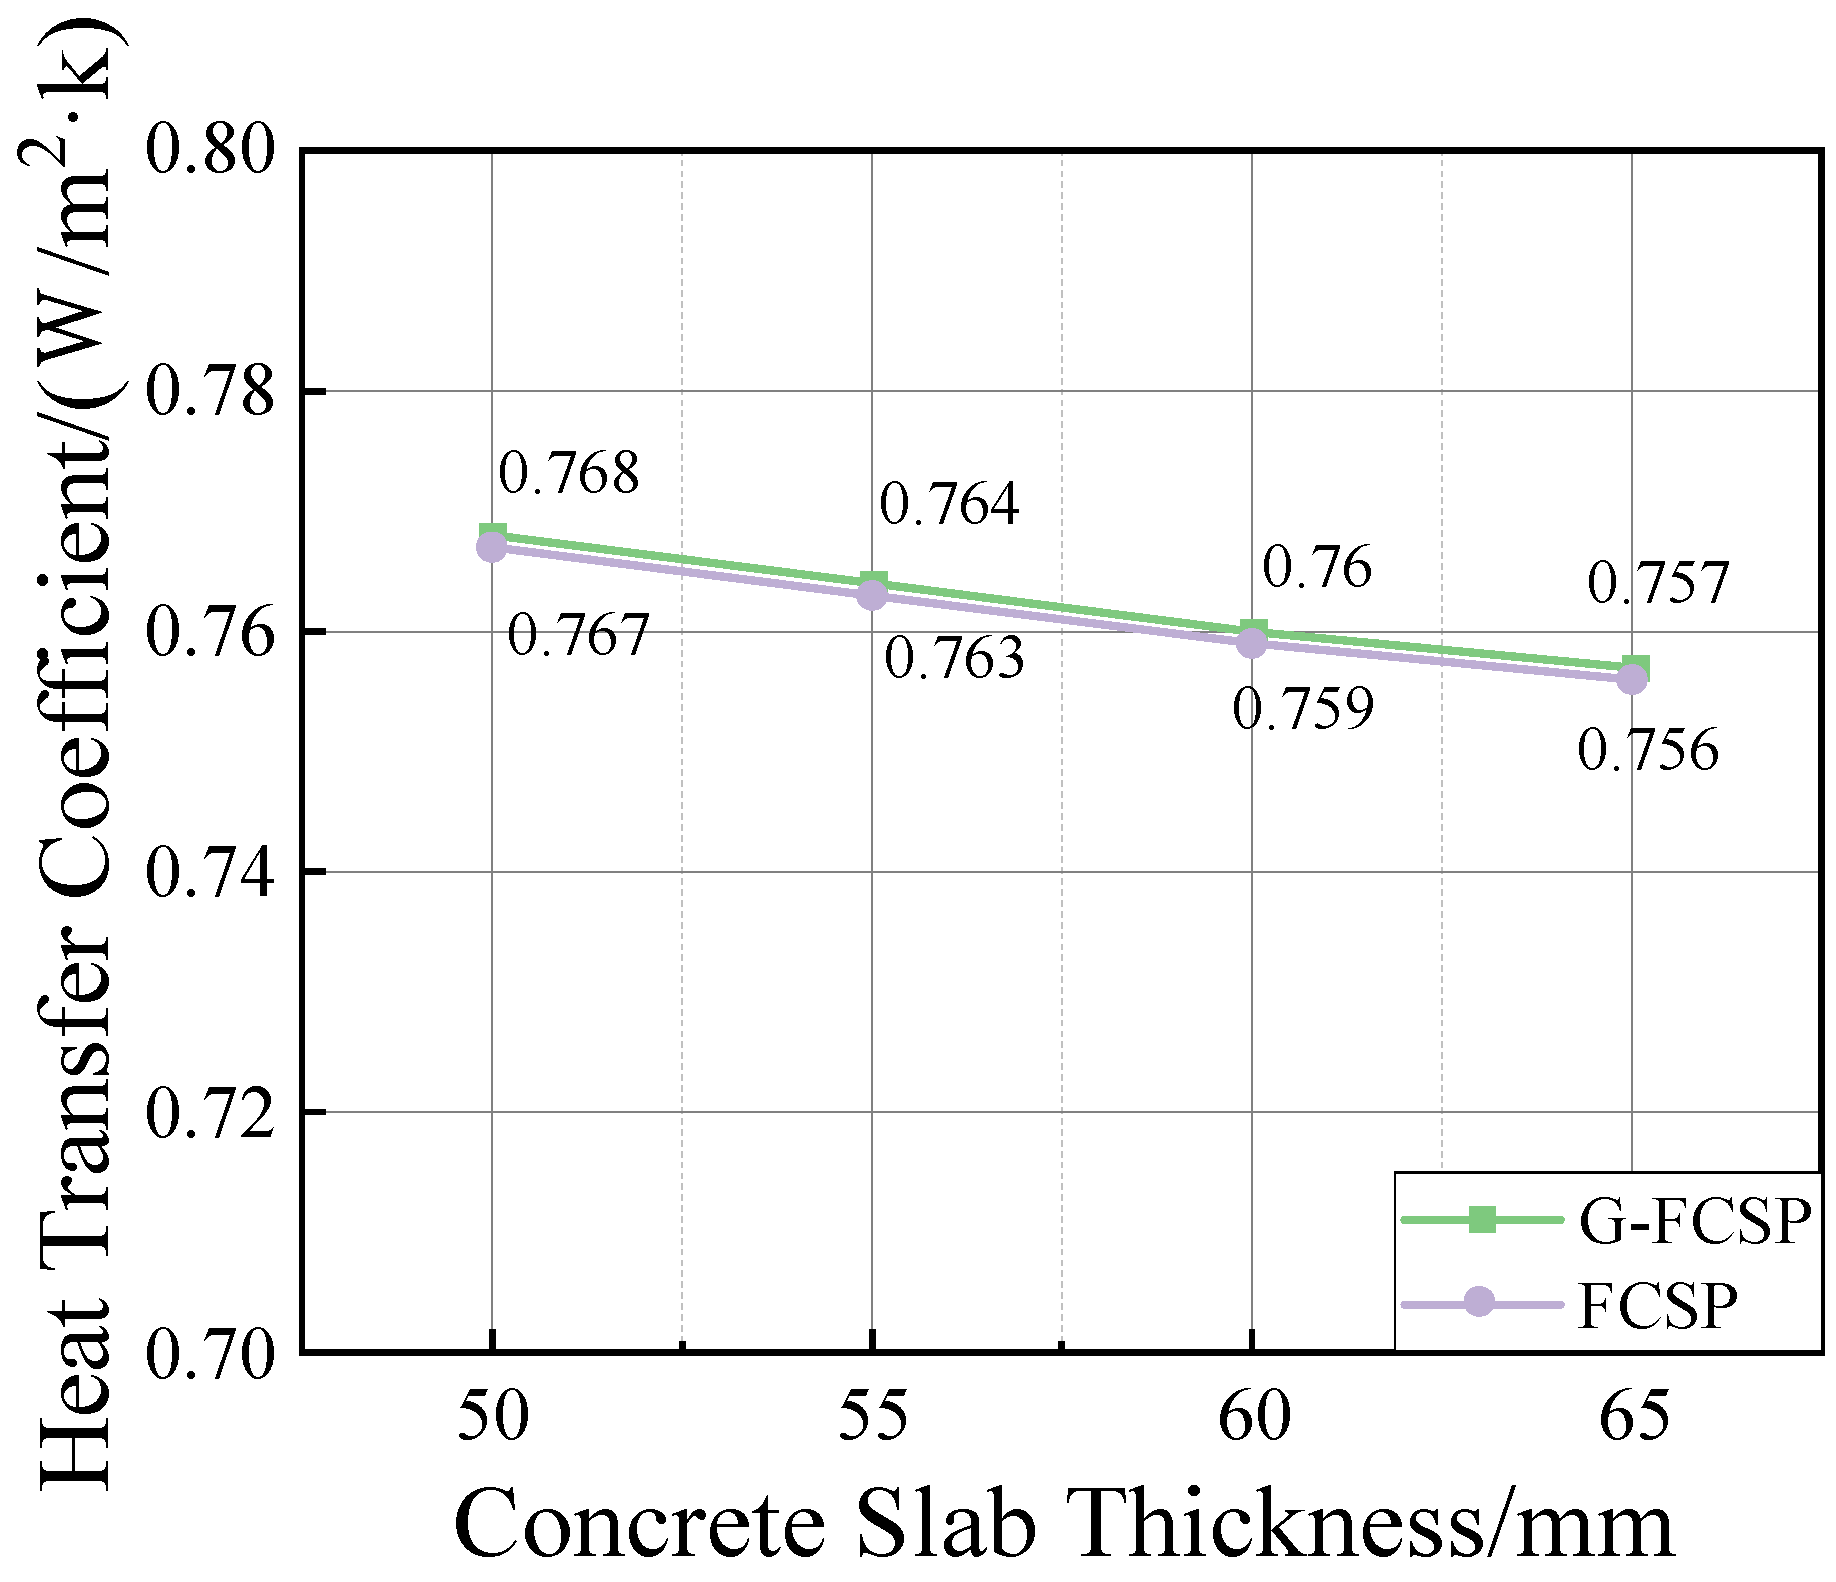
The thickness of the concrete inner and outer leaves was varied to analyze its impact on the thermal performance of the wall panels. Finite element models for thermal analysis of G-FCSP and FCSP wall panels with different concrete leaf thicknesses (55 mm, 60 mm, and 65 mm) were established, and the thermal transmittance coefficients were calculated using Equation (4). The results and trends of the thermal transmittance coefficients are presented in Table 6 and Figure 8. It is found that as the thickness of the concrete leaves increases, even when the thickness is increased to 65 mm, the thermal transmittance coefficient only decreases by 1.43%. This indicates that increasing the thickness of the concrete leaves has a very limited effect on reducing the thermal transmittance coefficients of the wall panels. Given that the wall panels should meet mechanical performance requirements while minimizing their weight, increasing the leaf thickness only leads to a significant increase in weight and manufacturing cost. Therefore, increasing the thickness of the concrete leaves to improve the thermal performance of the wall panels is not a feasible approach.
Table 6.
Heat transfer coefficient of wallboard with different concrete slab thickness.
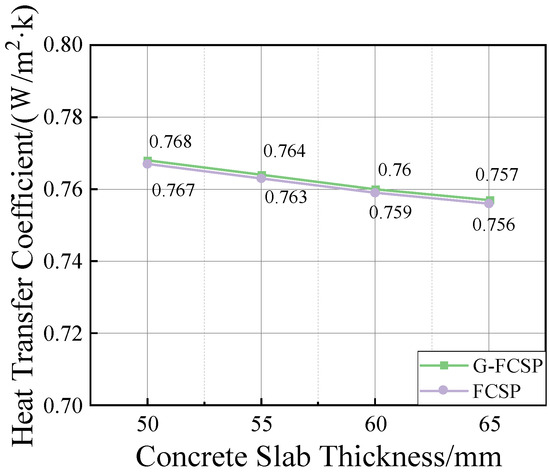
Figure 8.
The curve of heat transfer coefficient of wallboard with the thickness of concrete slab.
5.2. Insulation Layer Thickness
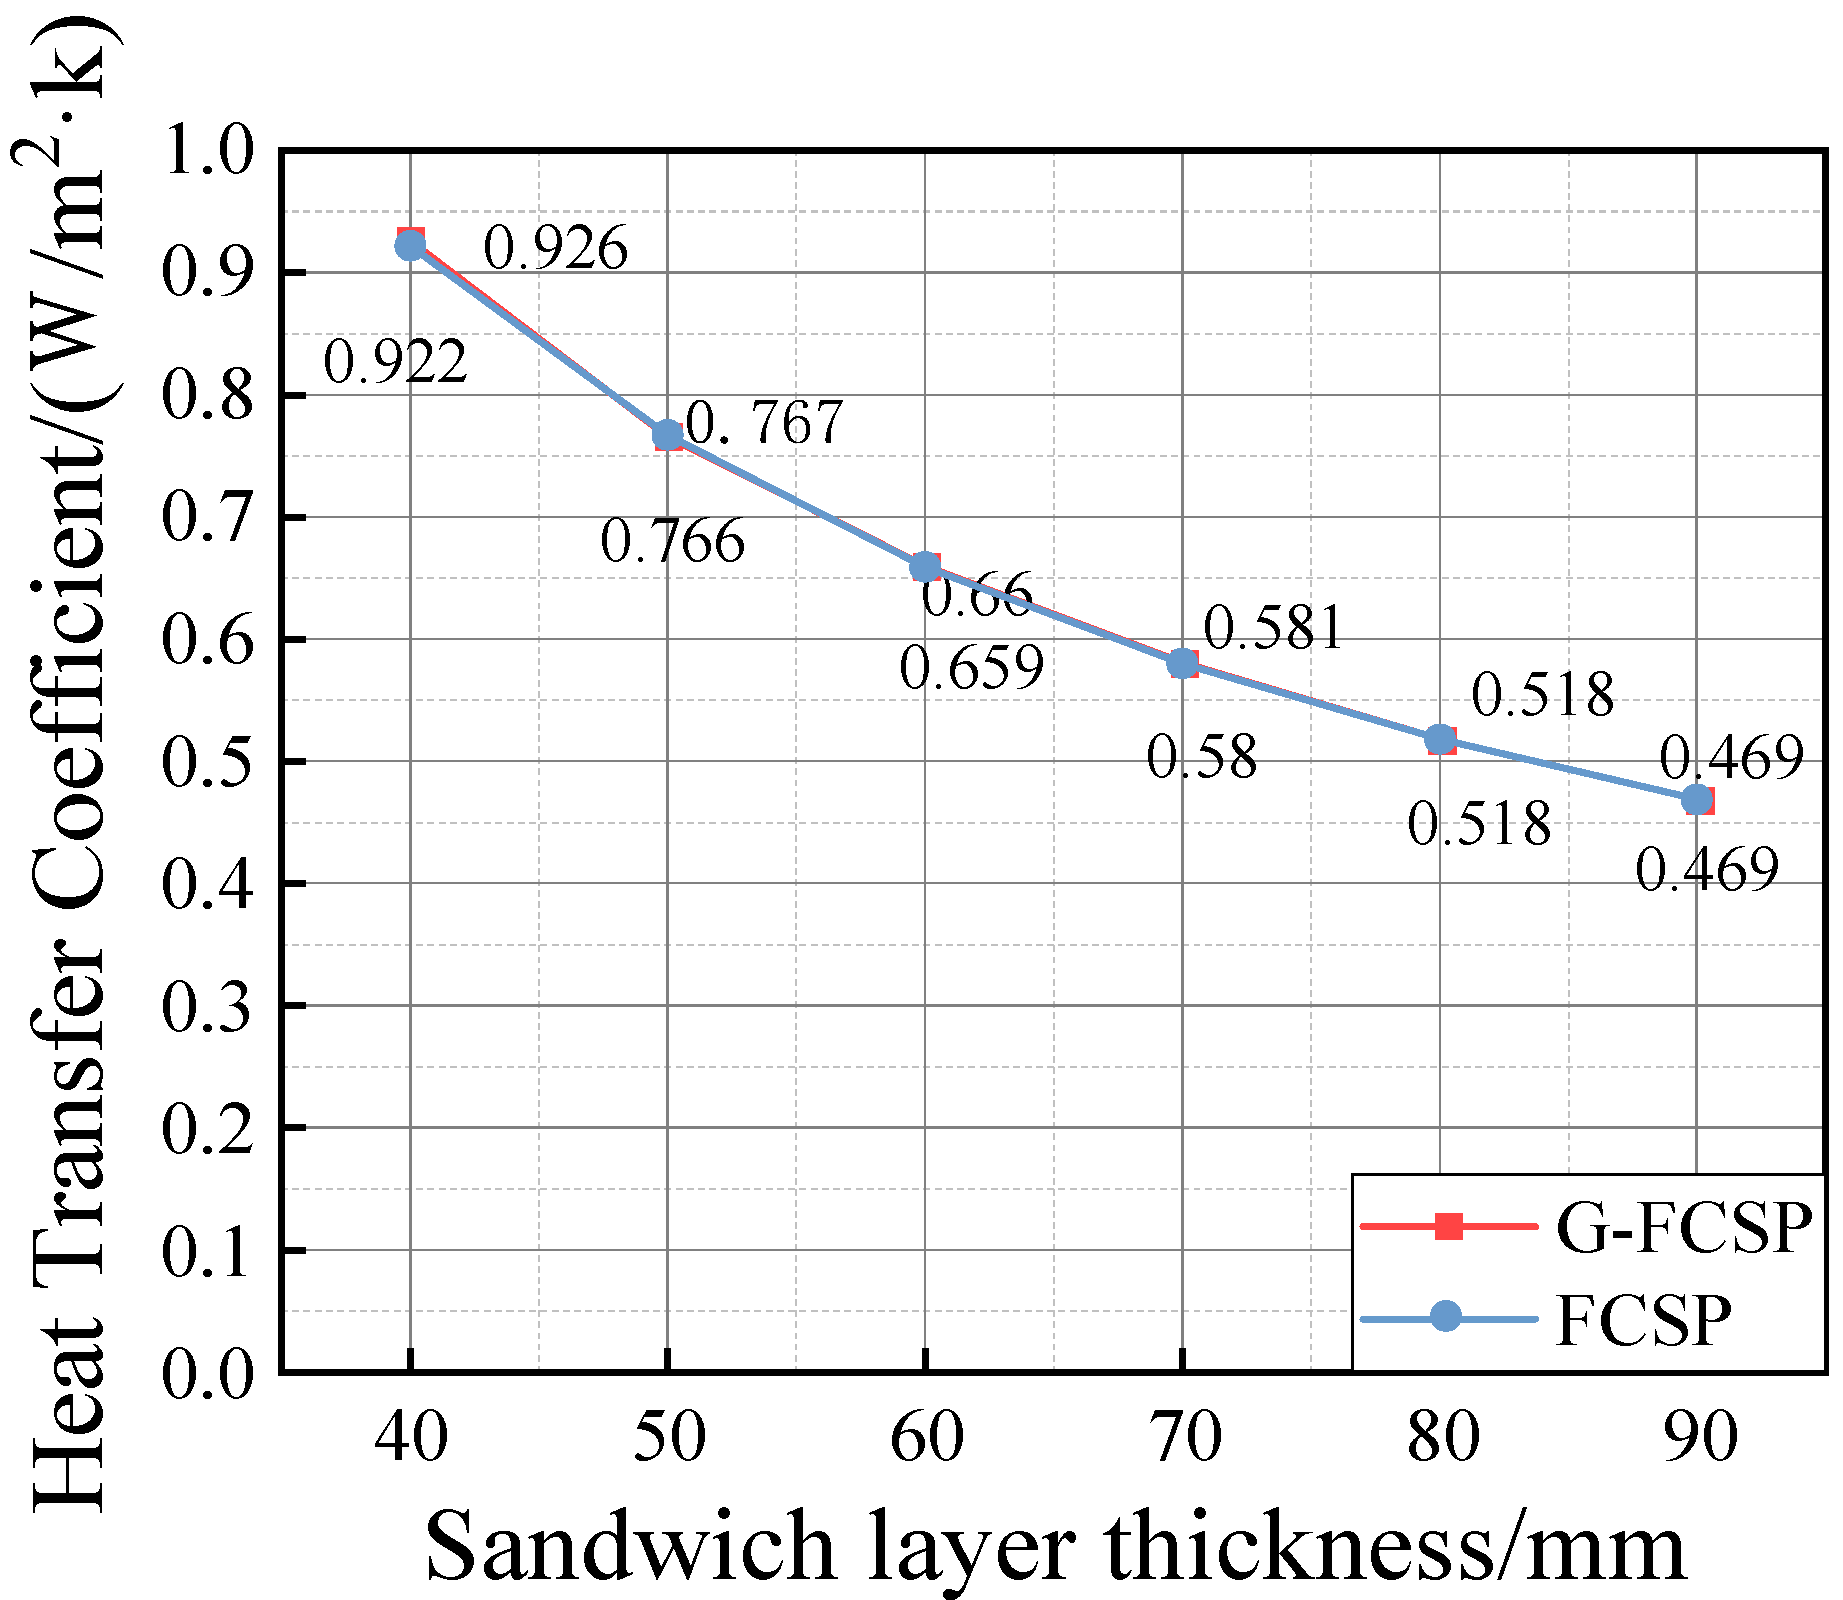
From the temperature contour maps of the model nodes for different insulation layer thicknesses, it is evident that the insulation layer effectively isolates heat transfer between the inner and outer layers of the wall panel. Therefore, it can be anticipated that the thickness of the insulation layer will have a significant impact on the thermal transmittance coefficient of the wall panel. To analyze this effect, the thickness of the insulation layer was varied, and the influence of different insulation layer thicknesses on the thermal transmittance coefficient was investigated. The original model had an insulation layer thickness of 50 mm, which was modified to 40 mm, 60 mm, 70 mm, 80 mm, and 90 mm. Finite element models for thermal analysis of G-FCSP and FCSP wall panels with these different insulation layer thicknesses were established, and the results are presented in Table 7 and Figure 9. The results indicate that the thickness of the insulation layer has a substantial impact on the thermal transmittance coefficient of the wall panel, consistent with expectations. As the thickness of the insulation layer increases, the thermal transmittance coefficient of the wall panel decreases significantly, especially when the initial thickness of the insulation layer is relatively small. The most pronounced reduction in the thermal transmittance coefficient is observed when the thickness of the insulation layer gradually increases from a smaller value. From the curve depicting the thermal conductivity coefficient of wall panels as a function of core layer thickness, it can be observed that when the insulation layer thickness increased from 40 mm to 90 mm, the thermal conductivity coefficients of G-FCSP and FCSP decreased by 49.4% and 49.1%, respectively. As the core layer thickness continued to increase, the slope of the curve gradually diminished, resulting in a progressively smaller reduction in the thermal conductivity coefficient of the wall panels. The results demonstrate that increasing the insulation layer thickness can effectively reduce heat transfer through the wall panel, which is of significant importance for enhancing its thermal performance. It was also found that the thermal transmittance coefficient variation curves of G-FCSP and FCSP almost overlap, with only a 0.1% difference. This indicates that the impact of the glass fiber grid on the thermal performance of the wallboard is minimal.
Table 7.
Heat transfer coefficient of wallboard with different sandwich layer thickness.

Figure 9.
The curve of heat transfer coefficient of wallboard with the thickness of sandwich layer.
5.3. Connector Spacing
In the original model, the connector spacing was set at 500 mm. Additional thermal analysis models were established with reduced spacings of 350 mm and 200 mm, as well as an increased spacing of 650 mm. The simulation results for different connector spacings are presented in Table 8 and Figure 10. The results indicate that reducing the connector spacing has a certain adverse effect on the thermal performance of the wall panels. When the spacing is reduced to 200 mm, the thermal transmittance coefficients of both G-FCSP and FCSP increase by 3.64%. However, the ultimate load capacity of FCSP increases by 16.1%, and that of G-FCSP increases by 20.6%. When the connector spacing increased from 500 mm to 650 mm, the thermal transmittance (U-value) of both G-FCSP and FCSP decreased by 0.8%. These results indicate that expanding the connector spacing gradually reduces the wall panel’s U-value, albeit with diminishing effectiveness. Furthermore, the influence of connector spacing enlargement on the thermal performance of wall panels becomes progressively less significant. In contrast, when the thickness of the concrete inner and outer leaves is increased from 50 mm to 60 mm, the ultimate load capacity of G-FCSP increases by 26.5%, but this also leads to an approximate 20% increase in the weight of the wall panel. Although increasing the number of connectors does have some impact on the thermal performance of the wall panels, this impact is within an acceptable range. Therefore, when it is necessary to control the weight of the wall panels while enhancing their load-bearing capacity, reducing the connector spacing and increasing the number of connectors is a better option. Based on the above analysis, to balance mechanical load capacity and thermal damage mitigation, a spacing range of 200 mm to 500 mm is recommended for connector arrangement.
Table 8.
Heat transfer coefficient of wallboard with different spacing of connectors.
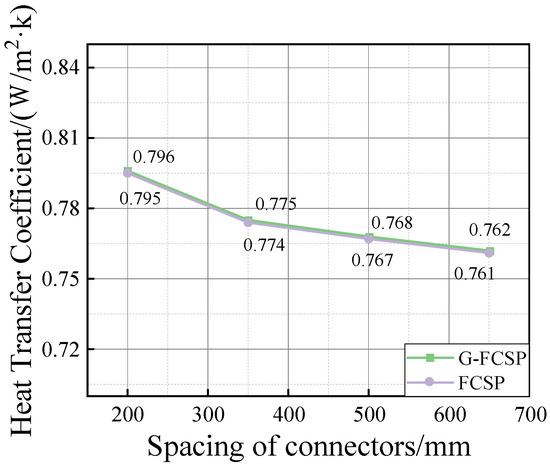
Figure 10.
The curve of heat transfer coefficient of wallboard with the arrangement spacing of connectors.
5.4. Connector Layout Patterns
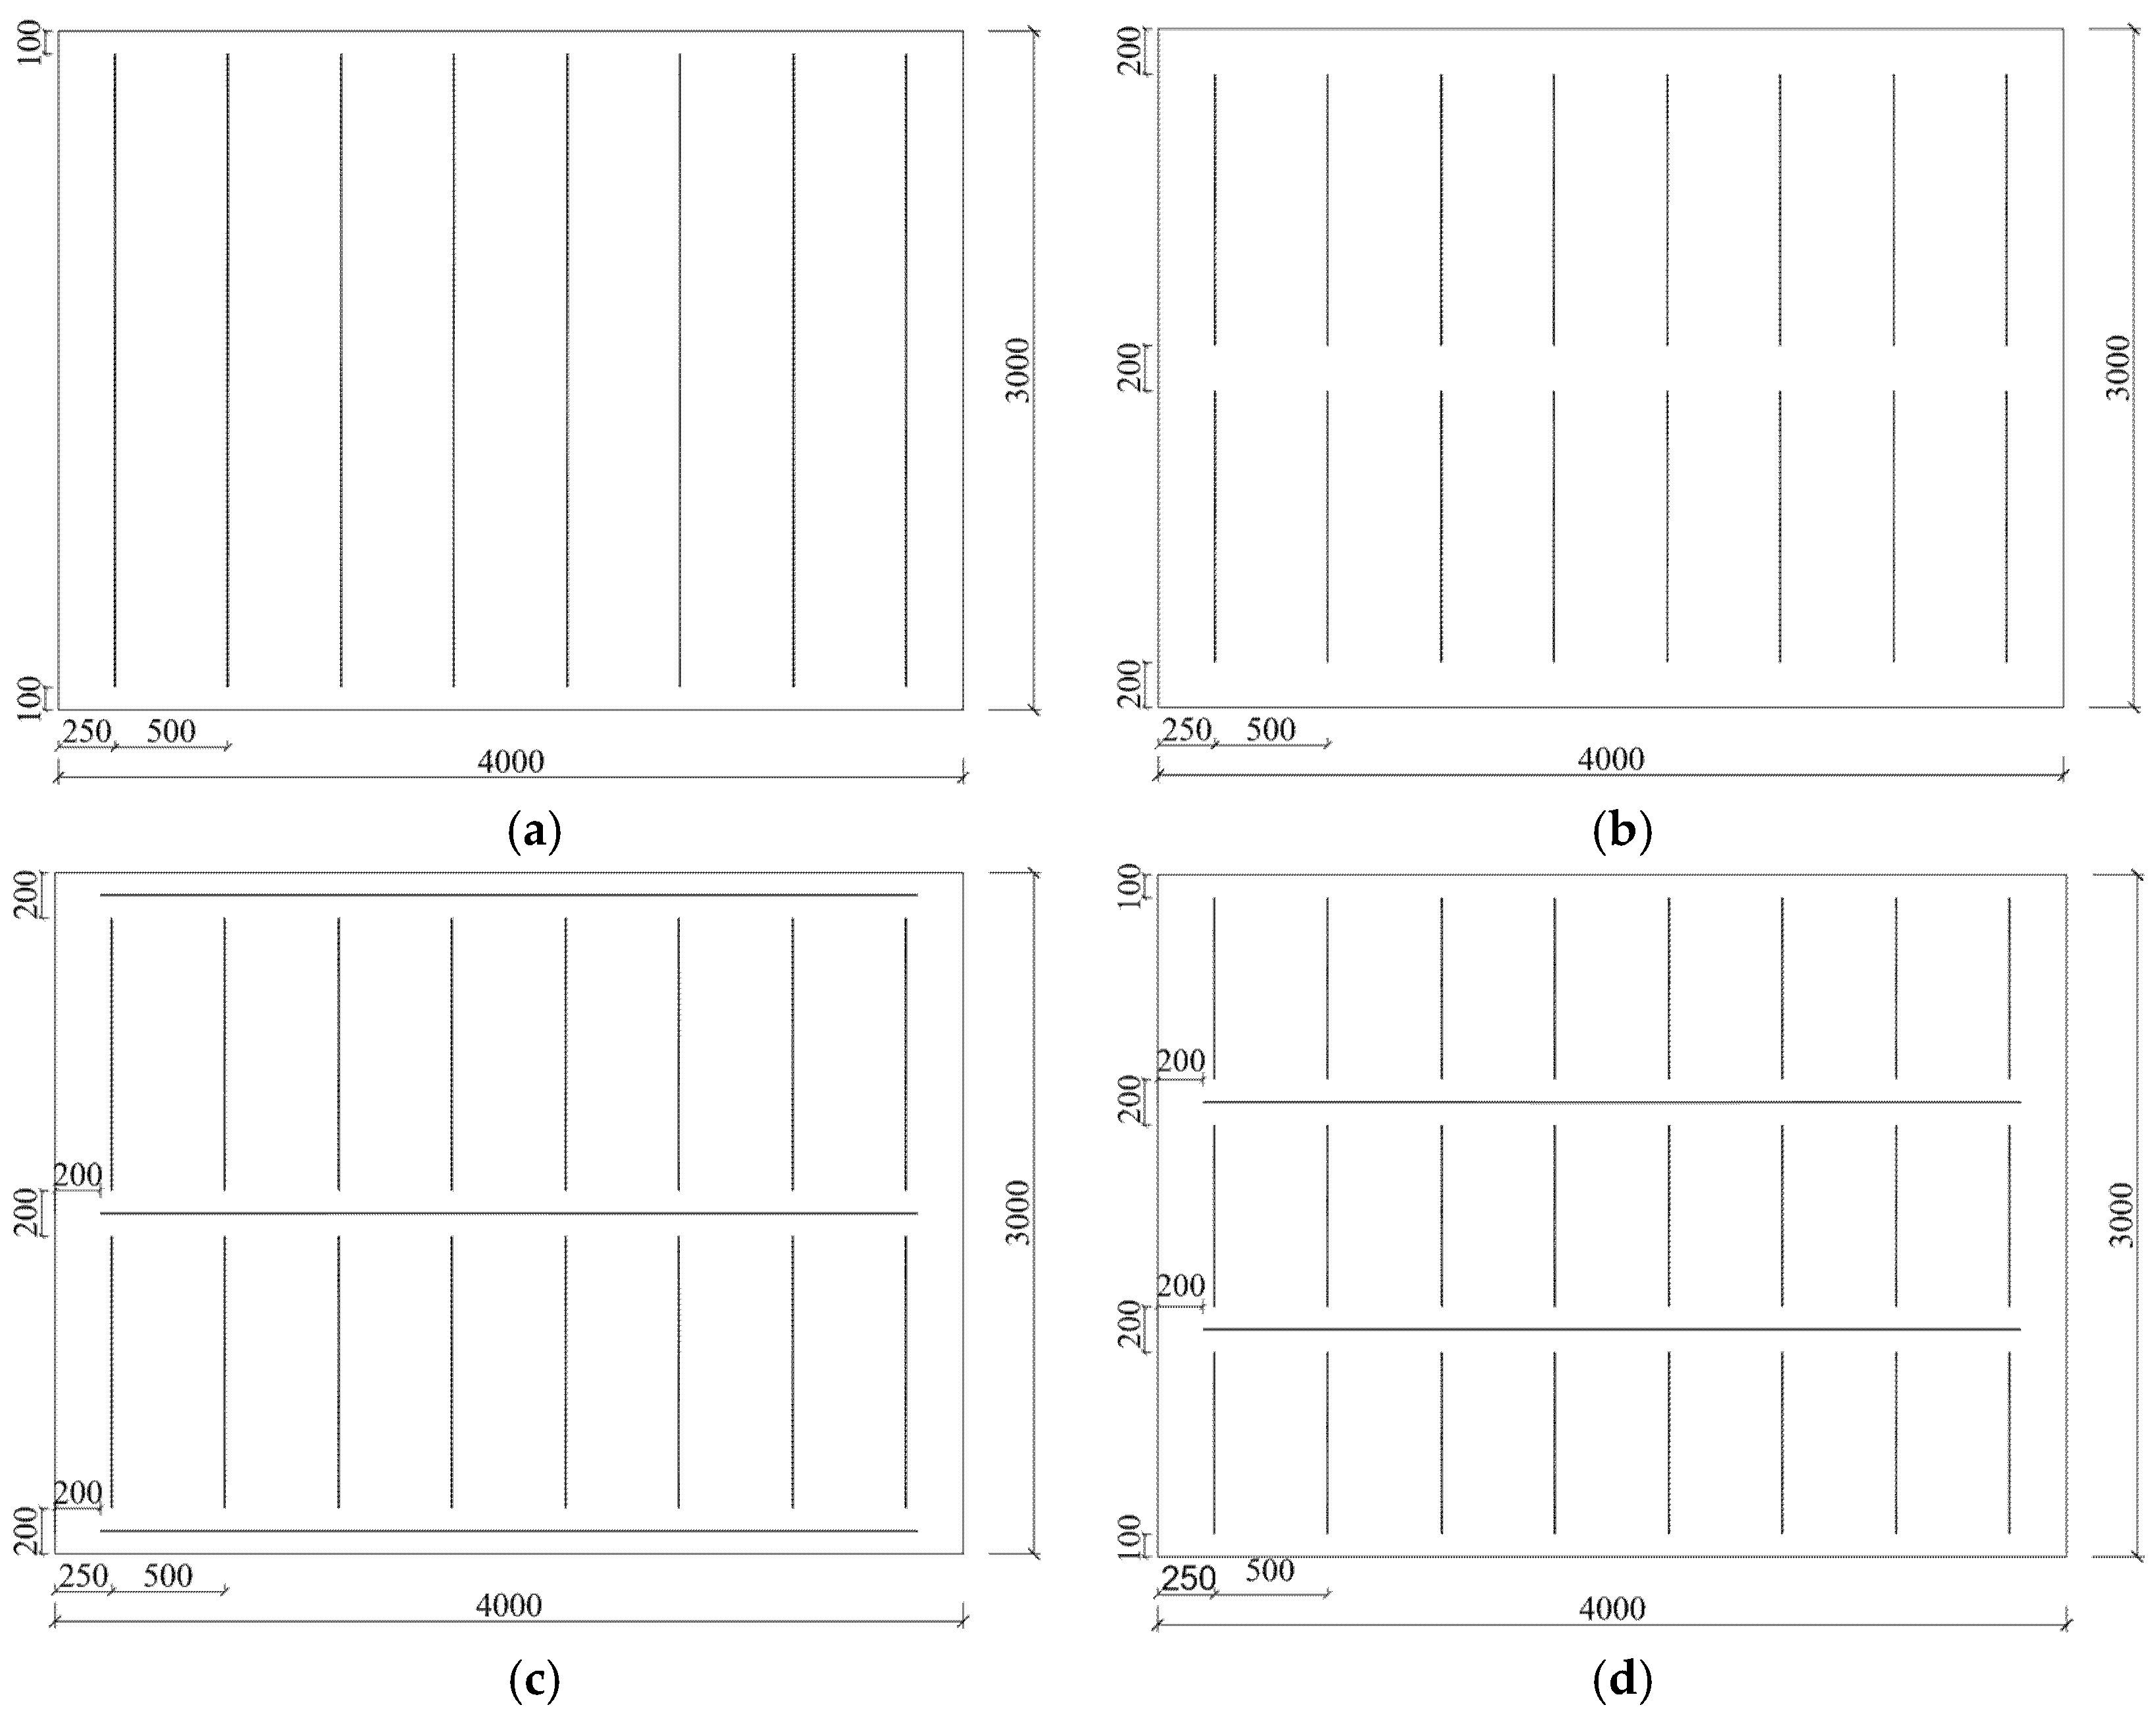
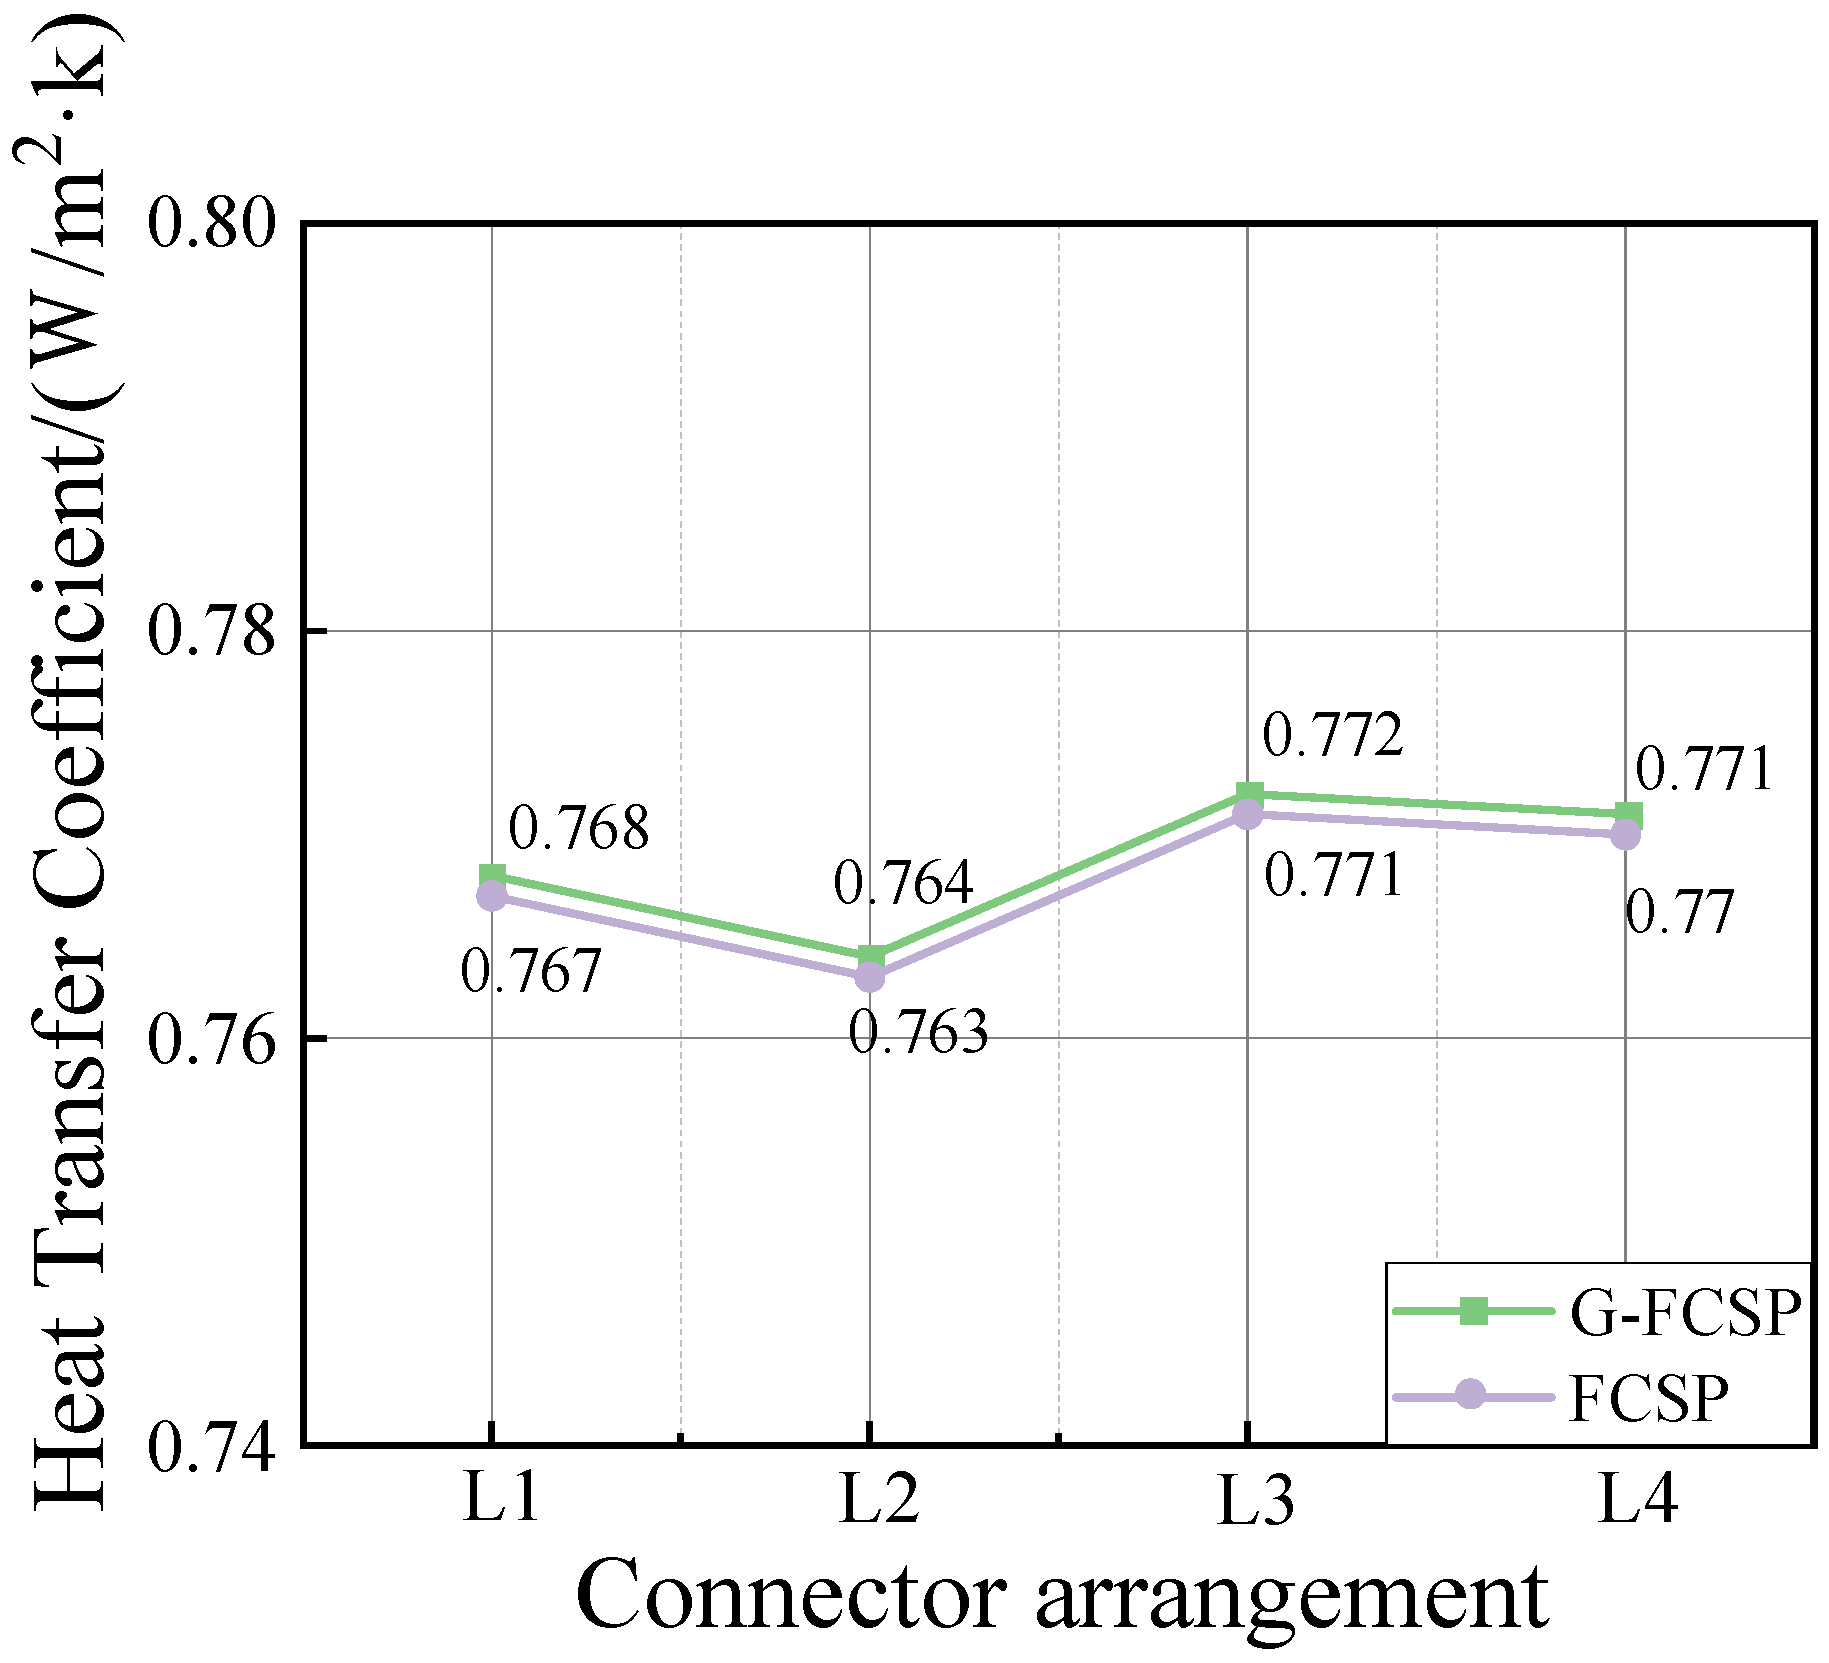
To investigate the impact of different connector layout patterns on the thermal performance of wall panels, thermal simulations were conducted on four different connector layout patterns (L1–L4). The layout patterns are shown in Figure 11, and the simulation results are presented in Table 9 and Figure 12. Among the four patterns, L2 has the lowest thermal transmittance coefficient. This is because L2 arranges two rows of connectors, each 1200 mm in length, within the wall panel, resulting in a total connector length of 2400 mm per column. In contrast, L1 has a connector length of 2800 mm per row, which effectively reduces the amount of heat-conducting medium within the wall panel. As a result, the thermal transmittance coefficient of L2 is reduced by only 0.5% compared to the other patterns. L3 and L4, although having shorter connector lengths in the height direction of the panel, introduce additional horizontal connectors with longer lengths in the width direction. This increases the thermal transmittance coefficient of the wall panel. It is recommended that connectors be arranged continuously along the full length of the panel to minimize the heat-conducting medium while ensuring mechanical performance.
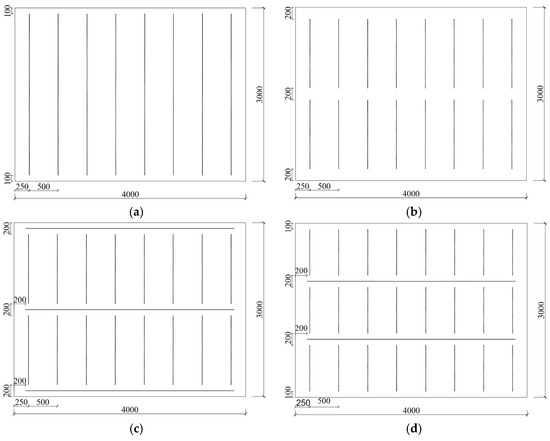
Figure 11.
Schematic diagram of different connector arrangements: (a) L1; (b) L2; (c) L3; (d) L4.
Table 9.
Heat transfer coefficient of wallboard with different arrangements of connectors.
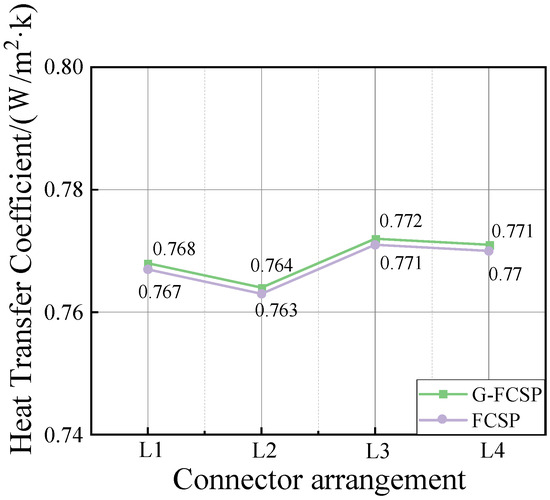
Figure 12.
The change curve of heat transfer coefficient of wallboard with different arrangements of connectors.
6. Analysis of Suitable Regions for Wall Panels with Different Insulation Layer Thicknesses
From the analysis of the four parameters discussed above, it is evident that the most effective way to improve the thermal performance of sandwich wall panels is to increase the thickness of the insulation layer. China has a vast territory with diverse climate types, and different regions have varying requirements for thermal insulation and heat isolation. Therefore, when designing wall panels, it is essential to select the appropriate insulation layer thickness based on the local climate conditions while controlling the production cost of the wall panels. It should be noted that according to the standards, the thermal inertia index of the wall panel also needs to be considered for a comprehensive evaluation. The sandwich wall panel designed in this study is a multi-layer envelope structure, and therefore, the calculation method for the value of multi-layer material envelope structures should be used. The calculation formula is given in Equation (4):
where the number of presents the thermal resistances of each layer of materials and is the thermal storage coefficient.
The calculation formula for the thermal storage coefficient S in the standards is as follows:
where λ is the thermal conductivity (W/m · K); C is specific heat capacity (J/kg · K); ρ is material density (kg/m3); T is the temperature fluctuation period (h), typically taken as 24 h.
According to the “Code for Thermal Design of Civil Buildings” GB 50176-2016 [24] and the calculation formula for the thermal storage coefficient, the thermal storage coefficient of the concrete material used in this study is 16.51 W/m2 · K, and that of the XPS (Extruded Polystyrene) board is 0.34 W/m2 · K. The wall panel in this study consists of three layers: the inner and outer concrete layers, the concrete edge, and the insulation material layer. However, due to the presence of the concrete edge, the thermal storage coefficient of the sandwich layer needs to be recalculated using Equation (6):
where S points to the thermal storage coefficients of each material layer and A is the areas occupied by each material.
The thermal storage coefficient for the concrete edge and insulation material layer is calculated to be 0.56 W/m2 · K. For a wall panel with thicknesses of 50 mm (inner concrete) + 50 mm (insulation) + 50 mm (outer concrete), the thermal transmittance coefficient can be calculated using Equation (7):
where R0 is the thermal resistance of the envelope structure (m2 · K/W); Ri is the internal surface heat transfer resistance (m2 · K/W), typically taken as 0.11 m2 · K/W for external walls; δj is the thickness of the material layer (m); λj is the thermal conductivity of the material (W/m2 · K), selected according to the standards; Re is the external surface heat transfer resistance (m2 · K/W), typically taken as 0.04 m2 · K/W for external walls.
The finite element calculation yields a thermal transmittance coefficient of 0.770 W/m2 · K for the wall panel with the given thickness. Using Equation (7), we can back-calculate the thermal resistance of the wall panel as 1.30 m2 · K/W. The thermal resistance of each concrete layer is 0.03 m2 · K/W. Therefore, the thermal resistance of the concrete edge and insulation material layer is R0-Ri-Re-0.06 = 1.09 W/m2 · K. The thermal inertia index D of the wall panel can be calculated using the following formula:
The thermal inertia index D of the wall panels with insulation layer thicknesses ranging from 40 mm to 90 mm was calculated using Equation (4), and the results are shown in Table 10. Building energy-saving standards include both residential and public buildings, and the thermal performance of wall panels should comply with the relevant regulations of the energy-saving design standards for the corresponding building zones. The simulated thermal transmittance coefficients of wall panels with different insulation layer thicknesses are compared with the thermal performance indicators for walls specified in the building energy-saving standards.
Table 10.
Heat transfer coefficient and thermal inertia index of wallboard.
In the standard “Energy-saving Design Standard for Residential Buildings in Severe and Cold Regions” JGJ26-2010 [29], the thermal transmittance coefficients of building envelope structures in different climate zones are required to meet the limits specified in Table 11, and the corresponding insulation layer thicknesses that satisfy these requirements are listed.
Table 11.
The threshold limit of the heat transfer coefficient (K).
For buildings with fewer than three stories, the thermal transmittance coefficient of the wall panels is highly regulated. The insulation layer thickness needs to be increased beyond 90 mm or other enhanced insulation measures must be taken to meet the specified limits. For buildings with four to eight stories located in Severe Cold Regions A and B, additional insulation thickness or other thermal insulation measures are also required to comply with the standards. In Severe Cold Region C and Cold Regions, A and B, buildings with four to eight stories already meet the requirements when the insulation layer thickness reaches 90 mm and 70 mm, respectively. For buildings with nine or more stories, an insulation layer thickness of 90 mm is sufficient to meet the requirements in Severe Cold Region A. In other regions, the insulation layer thickness can be reduced further.
The thermal transmittance coefficients and thermal inertia indices for wall panels specified in the standard “Energy-saving Design Standard for Residential Buildings in Hot Summer and Cold Winter Zones” JGJ 134-2010 [30] are shown in Table 12. Since the thermal inertia indices of the wall panels in this study are all less than 2.5, only the thermal transmittance coefficient limits for D ≤ 2.5 and the corresponding insulation layer thicknesses that meet the requirements are listed.
Table 12.
The threshold limit of the heat transfer coefficient (K) and thermal inertia index (D).
For buildings in hot summer and cold winter regions, the energy-saving design standards are slightly more relaxed compared to those in severe and cold regions, resulting in reduced requirements for insulation layer thickness. Thinner sandwich layer thicknesses already meet the requirements for most buildings.
In the “Energy-saving Design Standard for Residential Buildings in Hot Summer and Warm Winter Zones” JGJ 75-2012 [31], the thermal transmittance coefficient K for walls with a thermal inertia index D < 2.5 is specified to be less than 0.7. Therefore, if sandwich wall panels are to be used in hot summer and warm winter regions, the insulation layer thickness should be at least 60 mm.
The “Energy-saving Design Standard for Public Buildings GB 50189-2005” [32] has also set corresponding regulations for Class A and Class B public buildings in different regions, as shown in Table 13.
Table 13.
Thermal insulation limit values for public building envelopes.
The analysis of Table 13 reveals that Class A buildings in severe cold and cold climate zones require significantly higher thermal performance of wall assemblies, where 90 mm thick insulated sandwich panels can only satisfy the thermal transmittance requirements for buildings with shape coefficients ≤ 0.3 in Severe Cold Zone C. Our experimental results demonstrate that sandwich wall panels with 40–90 mm insulation layers exhibit thermal inertia indices below 2.5, necessitating minimum insulation thicknesses of ≥50 mm for public buildings in hot summer/cold winter zones and ≥30 mm (adjusted to ≥36 mm with a 1.2 humidity correction factor for high-humidity conditions) in hot summer/warm winter zones. Although Class B public buildings have relatively relaxed thermal transmittance limits compared to Class A, enhanced thermal measures remain essential, particularly ≥70 mm thick sandwich panels for Severe Cold Zone C and Cold Zone applications, while 40 mm thick panels prove sufficient for other climate zones with less demanding requirements, as comprehensively summarized in Table 14.
Table 14.
Recommended insulation thickness for different climate zones.
7. Conclusions
This study investigated the thermal performance of G-FCSP and FCSP wall panels through finite element analysis. The accuracy and reliability of the modeling methodology for the thermal performance simulation were first validated. Subsequently, comprehensive thermal performance analyses were conducted on both G-FCSP and FCSP wall panel models. The main conclusions are as follows:
- (1)
- The built-in insulation layer effectively inhibits heat transfer between the two sides of the wall panel. While the temperature gradient in the central region of the panel remains relatively small, significant heat exchange occurs at the concrete edges, particularly at the interfaces between the concrete edges/steel trusses and concrete, demonstrating pronounced thermal bridging effects that adversely affect the panel’s thermal performance. Comparative analysis reveals that FCSPs exhibit a marginally higher thermal transmittance (increase of approximately 2.67%), whereas complete removal of concrete edges results in substantially reduced thermal transmittance (increase of about 10.97%), highlighting the considerable negative impact of concrete edges on thermal performance. Although concrete edging serves crucial functions in protecting internal insulation and enhancing structural integrity, its thickness should be optimized, or alternative low-thermal-conductivity materials should be considered to achieve an optimal balance between thermal performance, protective function, and structural integrity.
- (2)
- The increase in concrete slab thickness from 55 mm to 65 mm has a very limited effect on reducing the thermal transmittance coefficient of the wall panels, resulting in only a 1.43% decrease. Additionally, increasing the slab thickness significantly increases the weight of the wall panels, raising manufacturing and transportation costs. Therefore, relying solely on increasing the concrete slab thickness to enhance the thermal performance of the wall panels is not feasible.
- (3)
- The thermal transmittance coefficient variation curves of the two types of wall panels almost overlap, indicating that the impact of the glass fiber grid on the thermal performance of the wall panels is negligible. The thickness of the insulation layer significantly affects the thermal performance of the wall panels. Particularly when the insulation layer is thin, increasing its thickness can notably reduce the thermal transmittance coefficient of the wall panels, thereby enhancing the insulation effect. As the insulation layer thickness increases, the reduction in the thermal transmittance coefficient gradually diminishes, showing a decreasing trend.
- (4)
- Reducing the spacing of connectors can enhance the load-bearing capacity of composite wall panels. Compared with increasing the thickness of concrete slabs, this approach effectively avoids a significant increase in the weight of the wall panels. Although increasing the number of connectors has some adverse effects on the thermal performance of the wall panels, the impact is relatively minor and acceptable. To achieve optimal performance by balancing structural load distribution and thermal damage resistance, a connector spacing ranging from 200 mm to 500 mm is recommended. The analysis of the thermal transmittance coefficients of sandwich wall panels with four different connector layouts indicates that the thermal performance can be optimized by minimizing the heat-conducting medium within the panels while ensuring mechanical performance. It is recommended to use continuous connectors along the full length of the panels. The research findings can be applied to guide the design of such wallboard engineering applications to achieve the optimal thermal performance of wallboards.
Author Contributions
Conceptualization, Z.Z. and Y.H.; methodology, Z.Z.; software, Z.Z.; validation, Y.W., Y.H. and Z.Z.; formal analysis, Y.H.; investigation, Y.W.; resources, Y.W.; data curation, Y.W.; writing—original draft preparation, Z.Z.; writing—review and editing, Y.H.; visualization, Y.H.; supervision, Y.H.; project administration, Y.H.; funding acquisition, Y.W. All authors have read and agreed to the published version of the manuscript.
Funding
The project is supposed by the Natural Science Foundation of Hebei Province, China (Funding No. G2023502005).
Data Availability Statement
The data presented in this study are available on request from the corresponding author. The data are not publicly available due to privacy.
Acknowledgments
We acknowledge the three authors in this study.
Conflicts of Interest
The authors declare no conflicts of interest.
References
- Zhong, Z.; Chen, Y.; Fu, M.; Li, M.; Yang, K.; Zeng, L.; Liang, J.; Ma, R.; Xie, Q. Role of CO2 geological storage in China’s pledge to carbon peak by 2030 and carbon neutrality by 2060. Energy 2023, 272, 127165. [Google Scholar] [CrossRef]
- Zhan, J.; Wang, C.; Wang, H.; Zhang, F.; Li, Z. Pathways to achieve carbon emission peak and carbon neutrality by 2060: A case study in the Beijing–Tianjin–Hebei region, China. Renew. Sustain. Energy Rev. 2024, 189, 113955. [Google Scholar] [CrossRef]
- Aslay, S.E. Explaining building energy efficiency prediction through architectural and engineering solutions considering environmental impacts using a hybrid model. Energy Build. 2025, 337, 115614. [Google Scholar] [CrossRef]
- Awan, A.; Kocoglu, M.; Subhan, M.; Utepkaliyeva, K.; Yusoff, N.Y.B.M.; Hossain, E. Assessing energy efficiency in the built environment: A quantile regression analysis of CO2 emissions from buildings and manufacturing sector. Energy Build. 2025, 338, 115733. [Google Scholar] [CrossRef]
- Pungercar, V.; Zhan, Q.; Xiao, Y.; Musso, F.; Dinkel, A.; Pflug, T. A new retrofitting strategy for the improvement of indoor environment quality and energy efficiency in residential buildings in temperate climate using prefabricated elements. Energy Build. 2021, 241, 110951. [Google Scholar] [CrossRef]
- Wang, S.; Li, C.; Zhang, W.; Sui, J.; Negnevitsky, M. Assessing the impact of prefabricated buildings on urban green total factor energy efficiency. Energy 2024, 297, 131239. [Google Scholar] [CrossRef]
- Cui, K.; Xu, L.; Chi, Y. Deformation behavior of polypropylene fiber reinforced concrete subject to compressive fatigue loading: Averaged ε-n curve and probabilistic ultimate fatigue strain model. Compos. Struct. 2025, 357, 118914. [Google Scholar] [CrossRef]
- Unuk, Ž. Transverse compressive behavior of plain and polypropylene fiber-reinforced concrete infilled steel tubes as hybrid steel-concrete nodes for discrete reticulated shell structures. Eng. Struct. 2025, 322, 119149. [Google Scholar] [CrossRef]
- Zhou, M.; Dang, F.; Zhang, Y.; Li, Y. Macro and micromechanical properties of polypropylene-fibre-reinforced rubber-based flexible energy-consuming concrete. Mag. Concr. Res. 2024, 77, 357–369. [Google Scholar] [CrossRef]
- Zhang, K.; Lin, W.; Lan, Q.; Zhang, Q. Compressive properties of polypropylene fiber reinforced seawater sea-sand recycled aggregate concrete under different strain rate loading. Constr. Build. Mater. 2024, 452, 138968. [Google Scholar] [CrossRef]
- Chia, E.; Nguyen, H.B.K.; Le, K.N.; Bi, K.; Pham, T.M. Performance of hybrid basalt-recycled polypropylene fibre reinforced concrete. Structures 2025, 75, 108711. [Google Scholar] [CrossRef]
- Mahdi, S.; Venkatesan, S.; Gravina, R.J. Flexural behaviour and post-cracking performance of polypropylene fibre-reinforced waste cardboard blended concrete. Case Stud. Constr. Mater. 2024, 21, e03806. [Google Scholar] [CrossRef]
- Yan, L.; Liu, L.; Liu, C. Bonding performances of polypropylene fiber reinforced concrete beam-type specimen at corrosion conditions: Experimental and simulation study. J. Build. Eng. 2025, 105, 112479. [Google Scholar] [CrossRef]
- Wu, C.; Jierula, A.; Fu, Z.; Chen, Y.; Kuang, Y.; Xia, J. Study on the mechanism of anti sulfate freeze-thaw, dry wet cycle of polypropylene fiber foam concrete. Constr. Build. Mater. 2025, 463, 140144. [Google Scholar] [CrossRef]
- Jiang, J.; Wu, M.; Ye, M. Prediction of fire spalling behaviour of fibre-reinforced concrete. Mag. Concr. Res. 2023, 76 Pt 5, 229–244. [Google Scholar] [CrossRef]
- Lin, J.; Zhang, Y.; Zhu, Y.; Du, H.; Shao, X.; Qiao, H. Experimental investigation and prediction of post-high-temperature mechanical properties of ultra-high-performance concrete (UHPC) with polypropylene (PP) fibers and bauxite coarse aggregates. J. Build. Eng. 2025, 105, 112459. [Google Scholar] [CrossRef]
- Jiang, M.; Cao, S.; Yilmaz, E. Enhanced strength and fracture features of tailings-based concrete reinforced with fibers and X-shaped rocks. J. Mater. Res. Technol. 2025, 36, 62–71. [Google Scholar] [CrossRef]
- Lu, W.; Chen, J.; Tang, Q.; Gu, F. Evaluation of mechanical properties and cracking resistance of shrinkage-compensating concrete reinforced by expansive agents with polypropylene fibers. Case Stud. Constr. Mater. 2025, 22, e04171. [Google Scholar] [CrossRef]
- Song, H.; Teng, L.; Du, C.; Zhao, L.; Meng, D.; Gao, X.; Chen, J.; Zhou, S. Mechanical properties and dynamic compression behaviour of basalt/polypropylene fibre-reinforced high-strength concrete. Mag. Concr. Res. 2024, 77 Pt 1–2, 56–66. [Google Scholar] [CrossRef]
- Huang, Y.; Ji, Y.; Wang, J.; Wang, Z.; Yu, B.; Zhang, S. Experimental and Modeling Analysis of Polypropylene Fiber Reinforced Concrete Subjected to Alkali Attack and Freeze–Thaw Cycling Effect. Materials 2024, 17, 4529. [Google Scholar] [CrossRef]
- Zhang, B.; Lin, X.; Zhang, Y.X.; Zhang, L. Microscale failure analysis of the ultra-high-performance polypropylene fibre reinforced concrete panel subjected to high thermal loading induced by fire exposure. Eng. Struct. 2023, 292, 116518. [Google Scholar] [CrossRef]
- Liu, Y.; Chen, B.; Liu, X. Experimental study on bond performance between corroded reinforcement and basalt-polypropylene fiber reinforced concrete after high temperature. Constr. Build. Mater. 2025, 474, 140944. [Google Scholar] [CrossRef]
- Kalali, A.; Kabir, M.Z. Cyclic behavior of perforated masonry walls strengthened with glass fiber reinforced polymers. Sci. Iran. 2012, 19 Pt 2, 151–165. [Google Scholar] [CrossRef]
- GB 50176-2016; Thermal Design Code for Civil Buildings. China Architecture & Building Press: Beijing, China, 2016.
- BS ISO 10456; Building Materials and Products-Hygrothermal Properties-Tabulated Design Values and Procedures for Determining Declared and Design Thermal Values. British Standards Institute: London, UK, 2009.
- O’Hegarty, R.; Reilly, A.; West, R.; Kinnane, O. Thermal investigation of thin precast concrete sandwich panels. J. Build. Eng. 2020, 27, 100937. [Google Scholar] [CrossRef]
- EN ISO 6946; Building components and building elements: Thermal Resistance and Thermal Transmittance, Calculation Method. ISO: Geneva, Switzerland, 2017.
- Al Tamimi, A.; Hassan, H.; Rodriguez-Ubinas, E.; Alhaidary, H.; Mansouri, A. Thermal performance of 3D concrete printed walls: Calculated and in-situ measured U-values. J. Asian Arch. Build. Eng. 2023, 22, 1345–1358. [Google Scholar] [CrossRef]
- JGJ 26-2010; Energy Efficiency Design Standard for Residential Buildings in Cold and Severe Cold Regions. China Architecture & Building Press: Beijing, China, 2010.
- JGJ 134-2010; Energy Efficiency Design Standard for Residential Buildings in Hot Summer and Cold Winter Regions. Guangming Daily Press: Beijing, China, 2010.
- JGJ 75-2012; Energy Efficiency Design Standard for Residential Buildings in Hot Summer and Warm Winter Regions. China Architecture & Building Press: Beijing, China, 2012.
- GB 50189-2005; Design Standard for Energy Efficiency of Public Buildings. National Standards of the People’s Republic of China: Beijing, China, 2005.


Disclaimer/Publisher’s Note: The statements, opinions and data contained in all publications are solely those of the individual author(s) and contributor(s) and not of MDPI and/or the editor(s). MDPI and/or the editor(s) disclaim responsibility for any injury to people or property resulting from any ideas, methods, instructions or products referred to in the content. |
© 2025 by the authors. Licensee MDPI, Basel, Switzerland. This article is an open access article distributed under the terms and conditions of the Creative Commons Attribution (CC BY) license (https://creativecommons.org/licenses/by/4.0/).