


Integrating Occupant Behavior into Window Design: A Dynamic Simulation Study for Enhancing Natural Ventilation in Residential Buildings


Abstract
1. Introduction
2. Methodology
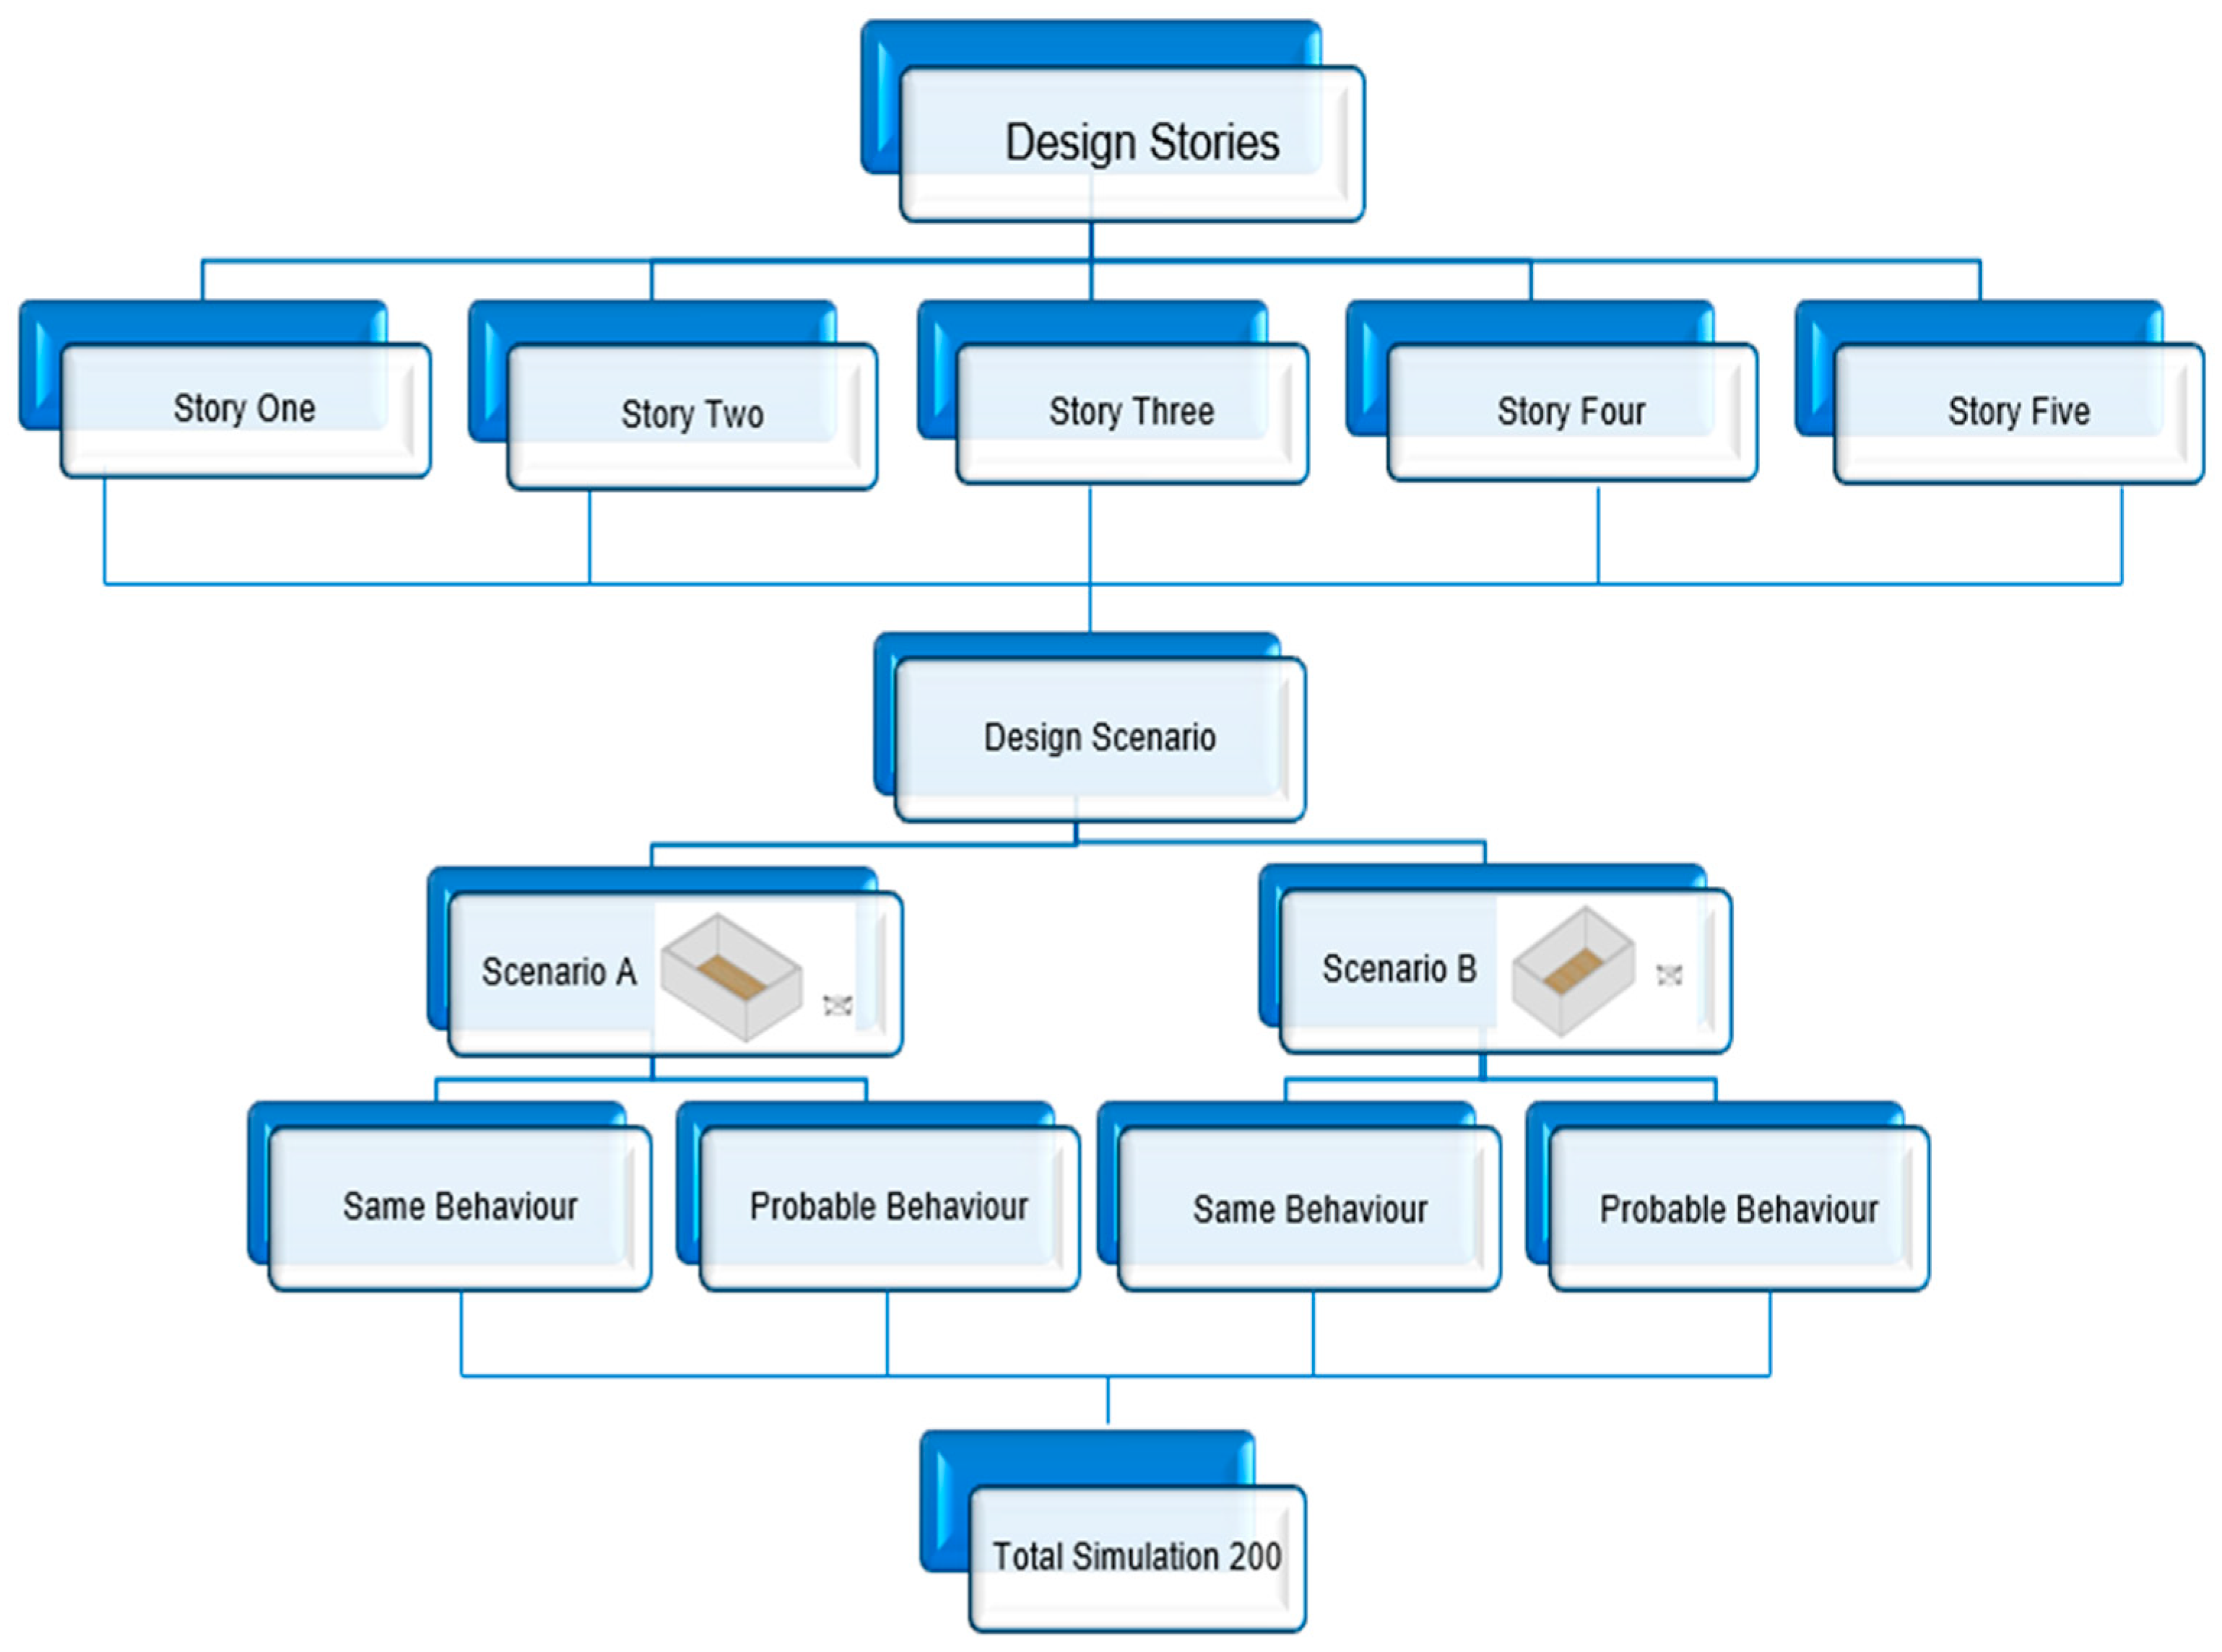
- Same Behavior (SB): a deterministic schedule representing average occupant behavior.
- Probable Behavior (PB): a stochastic (probabilistic) schedule capturing variations due to factors like comfort, privacy, and climate conditions. PB was derived by assigning time-of-day-dependent probabilities to window actions based on survey responses; no thermal comfort models (e.g., Fanger) were used. Further details are available in Appendix A.
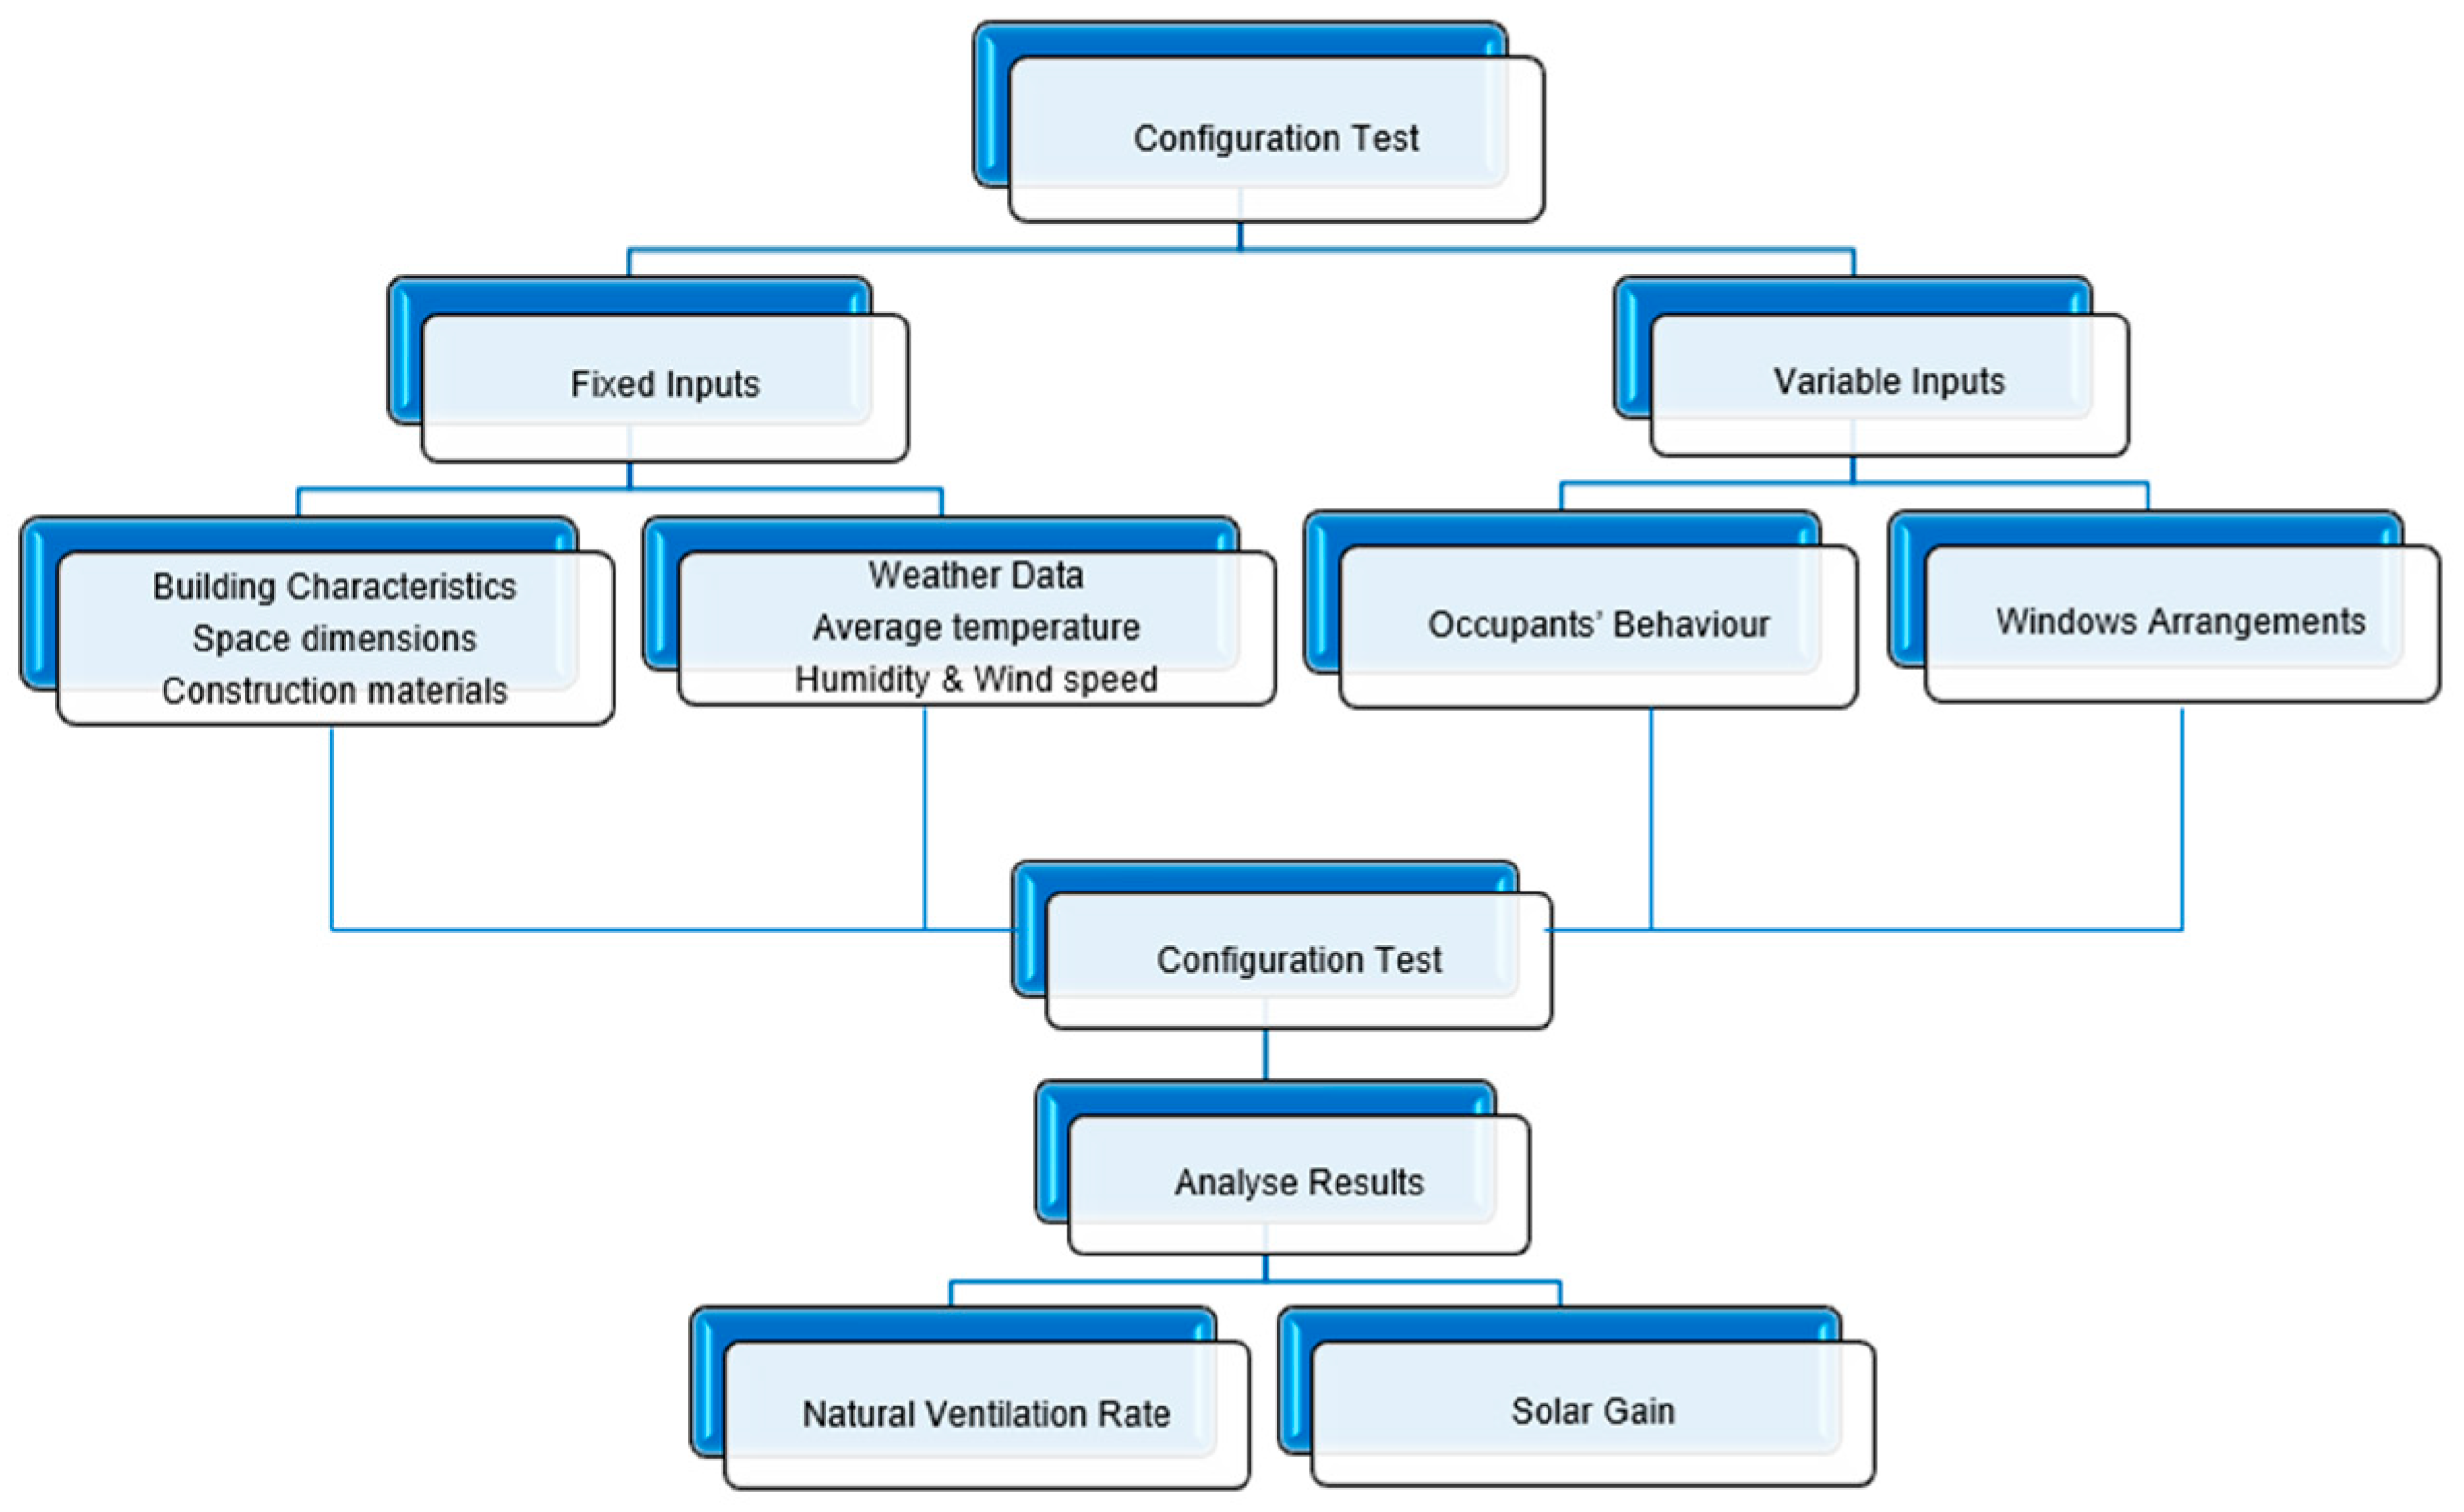
2.1. Simulation Model Setup
- Fixed inputs, such as building characteristics, materials, spatial dimensions, and climatic data (temperature, humidity, wind speed), remain constant across all simulations to ensure comparability.
- Variable inputs, window configurations, and occupant behavior schedules change systematically to evaluate their individual and combined impacts on NV performance.
2.1.1. Fixed Inputs
2.1.2. Variable Inputs
2.2. Results Analysis Method
3. Results and Discussion
3.1. Design Story 1: North-Facing Windows (WWR 45%)
3.1.1. Scenario A: 7.0 m × 2.6 m
3.1.2. Scenario B: 4.5 m × 2.6 m
3.1.3. Discussion: Design Implications and Behavioral Insights
3.2. Design Story 2: East and West Configuration
3.2.1. Scenario A: 7 m × 2.6 m East and West Walls
3.2.2. Scenario B: 4.5 m × 2.6 m East and West Walls
3.2.3. Discussion: Design Implications and Behavioral Insights
3.3. Design Story 3: Two South-Facing Windows 45%
3.3.1. Scenario A: 7.0 m × 2.6 m
3.3.2. Scenario B: 4.5 m × 2.6 m
3.3.3. Discussion: Design Implications and Behavioral Insights
3.4. Design Story 4: North–South Window Configuration
3.4.1. Scenario A: 7 m × 2.6 m North and South Walls
3.4.2. Scenario B: 4.5 m × 2.6 m North and South Walls
Discussion: Design Implications and Behavioral Insights
3.5. Design Story 5: North–East Window Configuration
3.5.1. Scenario A: 7 m × 2.6 m North Wall and 4.5 m × 2.6 m East Wall
3.5.2. Scenario B: 4.5 m × 2.6 m North Wall and 7 m × 2.6 m East Wall
3.5.3. Discussion: Design Implications and Behavioral Insights
3.6. Broader Applicability and Transferability
3.7. Summary and Guidelines
4. Limitations and Future Works
5. Conclusions
- Probable Behavior models increased ventilation rates by 5% to over 20% compared to static (Same Behavior) assumptions, demonstrating the importance of occupant variability for better predicting ventilation and indoor air quality. Static models may underestimate ventilation potential, leading to overly conservative designs.
- Moderately sized north-facing windows (around 45% WWR) combined with balanced cross-ventilation designs (e.g., north–south, east–west, north–east) consistently achieved peak ventilation rates of 25–36 ACH. These results highlight effective design strategies that optimize airflow while minimizing overheating and glare risks.
- Windows placed within occupant reach (below 1.6 m height) improved usability and increased ventilation frequency and effectiveness, emphasizing the role of ergonomic design in occupant-window operation.
- Large windows near ceilings or on west and south orientations increased solar gains (up to ~700 kWh/month), causing potential overheating and reducing window-use frequency. This reveals a trade-off between daylight benefits and thermal comfort, suggesting the need for shading or mitigation strategies in such cases.
- Balanced and symmetrical window layouts on the same façade encouraged simultaneous occupant use, enhancing overall ventilation efficiency and demonstrating the importance of coordinated window placement considering occupant behavior.
Author Contributions
Funding
Data Availability Statement
Acknowledgments
Conflicts of Interest
Appendix A. Configuration and Behavior Details
- Design Story Details
- Design Story 1: North-Facing Windows
- Occupant Behavior Narrative
- Same Behavior Pattern
- Morning (6:00 AM–10:00 AM): Fully open 100%, occupants prioritize ventilation in the morning to refresh indoor air, improve air quality, and utilize natural light.
- Midday (10:00 AM–2:00 PM): Open 50%, windows are adjusted to balance ventilation with glare and heat control.
- Afternoon (2:00 PM–6:00 PM): Open 30%, heat gain mitigation is the primary concern. Windows are limited to 30% opening to reduce thermal discomfort while still allowing for controlled ventilation.
- Evening (6:00 PM–10:00 PM): Windows are reopened to 75% to take advantage of cooler outdoor air.
| Story | Window 1 (H × W) (m2) | Window 2 (H × W) (m2) | Ventilation/Lighting Impact |
| 1 | 2.4 × 1.70 | 2.4 × 1.70 | Maximizes height for daylight penetration. |
| Behavior pattern: Morning: Fully open to leverage horizontal daylighting and maximize fresh air intake. Midday: Open 60% to balance glare control with moderate ventilation. Afternoon: Open 30% to mitigate heat gain while retaining airflow. Evening: Open 80% to flush warm air and enhance cooling. Night: Fully closed to maintain comfort and privacy. | |||
| 2 | 2.2 × 1.85 | 2.4 × 1.85 | Proportional windows enhance symmetry and light uniformity. |
| Behavior pattern: Morning: Fully open to enhance fresh air intake through taller windows. Midday: Open 60% to optimize balanced light diffusion and ventilation. Afternoon: Open 30% to moderate heat gain while maintaining airflow. Evening: Fully open for effective cross-ventilation and evening cooling. Night: Fully closed to maintain comfort and privacy. | |||
| 3 | 2.0 × 2.05 | 2.0 × 2.05 | Balanced dimensions for airflow and daylight. |
| Behavior pattern: Morning: Fully open for balanced daylighting and ventilation. Midday: Open 60% to manage glare while ensuring adequate airflow. Afternoon: Open 40% to control heat with moderate ventilation. Evening: Fully open to rapidly cool the space. Night: Fully closed to maintain comfort and privacy. | |||
| 4 | 1.8 × 2.30 | 1.8 × 2.30 | Wider windows for horizontal daylight spread. |
| Behavior pattern: Morning: Fully open to maximize horizontal daylight and fresh air. Midday: Open 70% for good light diffusion and tempered airflow. Afternoon: Open 35% to strike a balance between ventilation and reducing heat. Evening: Open 65% to remove residual warmth and improve comfort. Night: Fully closed to maintain comfort and privacy. | |||
| 5 | 1.5 × 2.70 | 1.5 × 2.70 | Shorter windows reduce glare and focus on horizontal daylight spread. |
| Behavior pattern: Morning: Fully open to leverage horizontal daylighting and fresh morning air. Midday: Open 50% to reduce glare and maintain moderate ventilation. Afternoon: Open 20% to manage heat buildup while allowing slight airflow. Evening: Open 70% for evening cooling and horizontal airflow. Night: Fully closed to maintain comfort and privacy. | |||
| 6 | 1.6 × 3.4 | 1.6 × 1.7 | Wider Window 1 prioritizes light and ventilation, while Window 2 offers flexibility for airflow during midday and afternoon. |
| Behavior pattern: Morning: Fully open both windows, using the wider one for increased ventilation. Midday: Window 1 open 50%, Window 2 open 70% for controlled airflow and reduced glare. Afternoon: Window 1 open 30%, Window 2 open 40% to manage heat while keeping fresh air. Evening: Fully open to maximize cross-ventilation and remove daytime heat. Night: Fully closed to maintain comfort and privacy. | |||
| 7 | 1.60 × 2.05 | 1.6 × 3.05 | Wider Window 2 enhances light spread, while Window 1 maintains airflow and complements daylighting needs. |
| Behavior pattern: Morning: Fully open both windows, letting the larger one flood daylight in. Midday: Window 1 open 60%, Window 2 open 40% to balance ventilation and glare. Afternoon: Window 1 open 40%, Window 2 open 25% for limited heat gain and steady airflow. Evening: Fully open both windows to cool the space effectively. Night: Fully closed to maintain comfort and privacy. | |||
| Story | Window 1 (H × W) | Window 2 (H × W) | Ventilation/Lighting Impact |
| 1 | 2.40 × 1.10 m2 | 2.40 × 1.10 m2 | Tall windows maximize vertical daylight penetration. |
| Behavior pattern: Morning: Fully open to optimize vertical airflow and daylight. Midday: Open 50% to balance glare control and ventilation. Afternoon: Open 25% for moderate airflow and heat mitigation. Evening: Open 75% for improved cooling. Night: Fully closed to maintain comfort and privacy. | |||
| 2 | 2.0 × 1.3 m2 | 2.0 × 1.3 m2 | Balanced dimensions optimize ventilation and lighting. |
| Behavior pattern: Morning: Fully open to balance daylight and fresh air. Midday: Open 60% for comfortable light and ventilation. Afternoon: Open 30% to manage heat while ensuring airflow. Evening: Fully open for cross-ventilation and cooling. Night: Fully closed to maintain security and comfort. | |||
| 3 | 1.8 × 1.45 m2 | 1.8 × 1.45 m2 | Wider windows emphasize horizontal daylight spread. |
| Behavior pattern: Morning: Fully open to utilize horizontal daylight and airflow. Midday: Open 70% for strong ventilation and reduced glare. Afternoon: Open 40% for balanced cooling and limited heat gain. Evening: Open 80% to accelerate cooling after daytime heat. Night: Fully closed to maintain comfort and privacy. | |||
| 4 | 1.5 × 1.75 m2 | 1.5 × 1.75 m2 | Shorter windows reduce glare and focus on horizontal daylight. |
| Behavior pattern: Morning: Fully open for airflow and daylight from shorter windows. Midday: Open 50% to control light spread and glare. Afternoon: Open 20% for minimal ventilation and heat management. Evening: Open 70% for effective evening cooling. Night: Fully closed to maintain comfort and privacy. | |||
| 5 | 2.2 × 1.20 m2 | 2.2 × 1.20 m2 | Proportional windows ensure symmetrical and uniform lighting. |
| Behavior pattern: Morning: Fully open to maximize symmetrical light and airflow. Midday: Open 60% to balance ventilation with moderate sunlight. Afternoon: Open 25% to reduce heat gain while maintaining airflow. Evening: Fully open to enhance nighttime cooling. Night: Fully closed to maintain comfort and privacy. | |||
| 6 | 1.6 × 1.1 m2 | 1.6 × 2.2 m2 | Wider window provides better light and ventilation, while Window 1 complements airflow for consistency. |
| Behavior pattern: Morning: Fully open both, with the wider window favoring increased daylight. Midday: Window 1 open 60%, Window 2 open 40% for glare control and airflow. Afternoon: Window 1 open 40%, Window 2 open 25% to manage heat buildup. Evening: Fully open for strong cross-ventilation and cooling. Night: Fully closed to maintain comfort and privacy. | |||
| 7 | 1.6 × 1.3 m2 | 1.6 × 2.0 m2 | Wider Window 2 enhances horizontal daylight spread, complementing ventilation needs from Window 1. |
| Behavior pattern: Morning: Fully open both windows to start the day with fresh air. Midday: Window 1 open 60%, Window 2 open 40% to control glare and maintain airflow. Afternoon: Window 1 open 40%, Window 2 open 25% for heat mitigation while retaining comfort. Evening: Fully open for effective cooling in late hours. Night: Fully closed to maintain comfort and privacy. | |||
- Design Story 2: East–West Window Configuration
- Occupant Behavior Narrative
- Same Behavior pattern:
- Morning (6:00 AM–10:00 AM): Fully open the east-facing window to maximize early sunlight and vertical ventilation. The west-facing window is closed.
- Midday (10:00 AM–2:00 PM): The east-facing window is open 50% to balance daylight and minimize glare. The west-facing window is opened 30% to enhance cross-ventilation and reduce temperature disparities while limiting initial west sun exposure.
- Afternoon (2:00 PM–6:00 PM): The east-facing window is open 40% to reduce solar heat gain while maintaining good indirect light. The west-facing window is significantly reduced to 20% open, prioritizing blocking direct sun and heat gain based on POE findings, providing minimal cooling airflow only if outdoor conditions allow.
- Evening (6:00 PM–10:00 PM): Both windows are fully open to optimize cross-ventilation and cool the indoor space using cooler evening air.
| Story | Window 1 (H × W) | Window 2 (H × W) | Ventilation/Lighting Impact |
| 1 | 2.4 × 3.0 m2 | 2.4 × 2.3 m2 | Tall windows on both sides maximize daylight/ventilation potential. Narrower west window helps manage afternoon heat gain slightly. |
| Behavior pattern: Morning: Fully open the east window for maximum daylight and vertical ventilation. West window remains closed. Midday: East window open 45% to limit glare while maintaining airflow. West window open 25% for cross-ventilation. Afternoon: East window open 35% to reduce heat gain. West window open 15% to cool the space. Evening: Fully open both windows to enhance cooling through cross-ventilation. | |||
| 2 | 2.2 × 3.3 m2 | 2.20 × 2.50 m2 | Balanced mid-height windows ensure optimal light/ventilation distribution while addressing glare/heat gain. |
| Behavior pattern: Morning: Fully open the east window to prioritize airflow and early sunlight. West window remains closed. Midday: East window open 50% to balance light and ventilation. West window open 25% to maintain airflow. Afternoon: East window open 40% to reduce heat gain. West window open 20% to support cooling. Evening: Fully open both windows to promote cross-ventilation. | |||
| 3 | 2.0 × 3.65 m2 | 2.0 × 2.75 m2 | Mid-height windows prioritize horizontal light/airflow; wider east window enhances morning potential. |
| Behavior pattern: Morning: Fully open the taller east-facing window to capture morning light and vertical airflow. West window remains closed. Midday: East window open 55%, minimizing glare. West window open 30% for cross-ventilation. Afternoon: East window open 40% to reduce heat gain. West window open 20% for cooling. Evening: Fully open both windows for cross-ventilation. | |||
| 4 | 1.8 × 4.05 m2 | 1.8 × 3.05 m2 | Low-height, wide windows emphasize horizontal views/airflow; requires careful glare management when open. |
| Behavior pattern: Morning: Fully open the east-facing window for fresh air and daylight. West window remains closed. Midday: East window open 55%, balancing light and ventilation. West window open 35% for airflow. Afternoon: East window open 45% for controlled ventilation. West window open 25% for cooling. Evening: Fully open both windows for evening ventilation. | |||
| 5 | 1.6 × 4.55 m2 | 1.6 × 3.40 m2 | Minimum height, wide windows maximize horizontal connection; potential for low-angle glare/overheating if managed poorly. |
| Behavior pattern: Morning: Fully open the east-facing window to maximize daylight. West window remains closed. Midday: East window open 60% to control glare. West window open 35% for ventilation. Afternoon: East window open 50% for ventilation. West window open 30% for cooling. Evening: Fully open both windows to optimize cross-ventilation. | |||
| 6 | 2.4 × 3.0 m2 | 1.6 × 3.2 m2 | Tall east maximizes AM light/ventilation; low west provides distinct cross-flow path, limiting PM heat gain impact height. |
| Behavior pattern: Morning: Fully open the east-facing window to maximize daylight. West window remains closed. Midday: East window open 45% to control glare. West window open 35% for ventilation. Afternoon: East window open 35% for ventilation. West window open 30% for cooling. Evening: Fully open both windows to optimize cross-ventilation. | |||
| 7 | 2.2 × 3.3 m2 | 1.8 × 3.0 m2 | Tall east window enhances AM light/airflow; lower west window balances cross-ventilation and PM heat management. |
| Behavior pattern: Morning: Fully open the east-facing window to maximize daylight. West window remains closed. Midday: East window open 50% to control glare. West window open 30% for ventilation. Afternoon: East window open 40% for ventilation. West window open 25% for cooling. Evening: Fully open both windows to optimize cross-ventilation. | |||
| 8 | 1.8 × 4.0 m2 | 2.2 × 2.45 m2 | Low east window manages glare; taller west window enhances vertical light/airflow potential in PM (if desired/controlled). |
| Behavior pattern: Morning: Fully open the east-facing window to maximize daylight. West window remains closed. Midday: East window open 60% to control glare. West window open 25% for ventilation. Afternoon: East window open 45% for ventilation. West window open 20% for cooling. Evening: Fully open both windows to optimize cross-ventilation. | |||
| 9 | 1.6 × 4.5 m2 | 2.4 × 2.25 m2 | Low east window maximizes horizontal view; tall west window dominates vertical light/airflow, requires strong PM control. |
| Behavior pattern: Morning: Fully open the east-facing window to maximize daylight. West window remains closed. Midday: East window open 65% to control glare. West window open 20% for ventilation. Afternoon: East window open 50% for ventilation. West window open 15% for cooling. Evening: Fully open both windows to optimize cross-ventilation. | |||
| Story | Window 1 (H × W) | Window 2 (H × W) | Ventilation/Lighting Impact |
| 1 | 2.4 × 1.95 m2 | 1.6 × 2.15 m2 | Tall/narrow east optimizes light on small wall; low/wider west provides distinct cross-flow path, easier PM heat management. |
| Behavior pattern: Morning: Fully open the east-facing window to maximize daylight. West window remains closed. Midday: East window open 50% to control glare. West window open 35% for ventilation. Afternoon: East window open 40% for ventilation. West window open 25% for cooling. Evening: Fully open both windows to optimize cross-ventilation. | |||
| 2 | 2.2 × 2.1 | 1.8 × 1.95 | Balanced heights/widths provide versatile ventilation and daylight spread optimized for smaller walls. |
| Behavior pattern: Morning: Fully open the east-facing window to maximize daylight. West window remains closed. Midday: East window open 50% to control glare. West window open 30% for ventilation. Afternoon: East window open 40% for ventilation. West window open 25% for cooling. Evening: Fully open both windows to optimize cross-ventilation. | |||
| 3 | 1.8 × 2.6 m2 | 2.2 × 1.6 m2 | Low/wide east manages glare easily; taller/narrow west provides focused vertical airflow/light, limiting excessive PM heat gain. |
| Behavior pattern: Morning: Fully open the east-facing window to maximize daylight. West window remains closed. Midday: East window open 60% to control glare. West window open 25% for ventilation. Afternoon: East window open 50% for ventilation. West window open 20% for cooling. Evening: Fully open both windows to optimize cross-ventilation. | |||
| 4 | 1.6 × 2.9 m2 | 2.4 × 1.45 m2 | Minimum height east maximizes horizontal view; tall/narrow west offers focused vertical light/ventilation, good PM heat control. |
| Behavior pattern: Morning: Fully open the east-facing window to maximize daylight. West window remains closed. Midday: East window open 65% to control glare. West window open 20% for ventilation. Afternoon: East window open 55% for ventilation. West window open 15% for cooling. Evening: Fully open both windows to optimize cross-ventilation. | |||
| 5 | 2.4 × 1.9 m2 | 2.4 × 1.45 m2 | Max. height, narrow windows optimize vertical light penetration; careful PM glare/heat control needed due to height. |
| Behavior pattern: Morning: Fully open the east-facing window to maximize daylight. West window remains closed. Midday: East window open 45% to control glare. West window open 20% for ventilation. Afternoon: East window open 35% for ventilation. West window open 15% for cooling. Evening: Fully open both windows to optimize cross-ventilation. | |||
| 6 | 2.2 × 2.1 m2 | 2.2 × 1.55 m2 | Mid-height windows provide balanced light/airflow; narrower west limits PM heat gain effectively. |
| Behavior pattern: Morning: Fully open the east-facing window to maximize daylight. West window remains closed. Midday: East window open 50% to control glare. West window open 25% for ventilation. Afternoon: East window open 40% for ventilation. West window open 20% for cooling. Evening: Fully open both windows to optimize cross-ventilation. | |||
| 7 | 2.0 × 2.3 m2 | 2.0 × 1.7 m2 | Mid-height windows provide balanced light; wider east enhances AM potential compared to narrower west. |
| Behavior pattern: Morning: Fully open the east-facing window to maximize daylight. West window remains closed. Midday: East window open 55% to control glare. West window open 30% for ventilation. Afternoon: East window open 45% for ventilation. West window open 20% for cooling. Evening: Fully open both windows to optimize cross-ventilation. | |||
| Story | Window 1 (H × W) | Window 2 (H × W) | Ventilation/Lighting Impact |
| 8 | 1.8 × 2.55 m2 | 1.8 × 1.8 m2 | Low-height windows emphasize horizontal connection; balanced widths offer consistent airflow potential. |
| Behavior pattern: Morning: Fully open the east-facing window to maximize daylight. West window remains closed. Midday: East window open 60% to control glare. West window open 35% for ventilation. Afternoon: East window open 50% for ventilation. West window open 25% for cooling. Evening: Fully open both windows to optimize cross-ventilation. | |||
| 9 | 1.6 × 2.9 m2 | 1.6 × 2.1 m2 | Minimum height windows maximize horizontal view/airflow when open; wider east enhances AM light/airflow. |
| Behavior pattern: Morning: Fully open the east-facing window to maximize daylight. West window remains closed. Midday: East window open 65% to control glare. West window open 35% for ventilation. Afternoon: East window open 55% for ventilation. West window open 30% for cooling. Evening: Fully open both windows to optimize cross-ventilation. | |||
- Design Story 3: South-Facing Windows
- Occupant Behavior Narrative
- Same Behavior pattern:
- Morning (6:00 AM–10:00 AM): Both windows open 80% to maximize ventilation and bring in fresh air for thermal comfort.
- Midday (10:00 AM–2:00 PM): Windows partially open 40% to balance airflow, daylight penetration, and glare control.
- Afternoon (2:00 PM–6:00 PM): Windows open 30% to minimize heat gain while allowing some ventilation.
- Evening (6:00 PM–10:00 PM): Windows open 70% to cool the space and ensure adequate ventilation.
- Night (10:00 PM–6:00 AM): Fully closed windows to maintain comfort and privacy.
| Story | Window 1 (H × W) | Window 2 (H × W) | Ventilation/Lighting Impact |
| 1 | 1.7 × 3.2 m2 | 1.7× 3.2 m2 | The moderate height and generous width deliver a balanced daylight distribution that minimizes glare. The ample width ensures even airflow across the space, while the height limits excessive vertical solar penetration. |
| Behavior pattern: Morning: Fully open both windows to maximize ventilation and natural light, avoiding early glare. Midday: Windows open 50% to manage heat gain and maintain airflow. Afternoon: Open windows 25% to control glare from the west. Evening: Open both windows 80% to improve nighttime cooling. Night: Fully closed to maintain comfort and privacy. | |||
| 2 | 1.8 × 3.05 m2 | 1.8 × 3.05 m2 | The slightly increased height enhances vertical light diffusion into deeper parts of the room, keeping glare under control. The larger operable area also improves ventilation efficiency, supporting steady airflow throughout the day. |
| Behavior pattern: Morning: Open fully to maximize daylight and fresh air. Midday: Open 50% to manage indoor heat while keeping airflow consistent. Afternoon: Open both windows 30% to maintain cooling without significant heat gain. Evening: Fully open to enhance ventilation. Night: Fully closed to maintain comfort and privacy. | |||
| 3 | 2.0 × 2.7 m2 | 2.0 × 2.7 m2 | With increased height, these windows push daylight deeper into the room’s recesses while maintaining a balanced opening area for air movement. The design is ideal for spaces where diffuse, even light is key and airflow remains consistent. |
| Behavior pattern: Morning: Open both windows fully for maximum fresh air. Midday: Open 60% to control heat gain from sunlight. Afternoon: Open windows 20% open for reduced airflow and glare. Evening: Open fully for nighttime cooling. Night: Fully closed to maintain comfort and privacy. | |||
| 4 | 2.2 × 2.45 m2 | 2.2 × 2.45 m2 | The taller dimensions drive strong vertical light penetration, reducing the need for artificial lighting. The moderate width still provides effective cross-ventilation, creating a design that naturally diffuses both light and air. |
| Behavior pattern: Morning: Fully open both windows for daylight and fresh air. Midday: Open 50% to reduce glare and indoor heat. Afternoon: Open 30% to maintain cooling. Evening: Open fully for better ventilation. Night: Fully closed to maintain comfort and privacy. | |||
| 5 | 2.4 × 2.25 m2 | 2.4 × 2.25 m2 | Maximized height allows light to reach far into the interior, though the relatively narrower width may slightly limit airflow. |
| Behavior pattern: Morning: Fully open for optimal lighting and airflow. Midday: Open 50% to balance heat gain. Afternoon: Open 30% to reduce glare while maintaining cooling. Evening: Fully open to maximize ventilation. Night: Fully closed to maintain comfort and privacy. | |||
| 6 | 1.7 × 2.6 m2 | 1.7 × 3.8 m2 | The dual-window approach uses the larger window to drive deep daylight penetration and robust ventilation, while the smaller window supports localized cross-breezes and glare control. |
| Behavior pattern: Morning: Fully open both windows. Midday: Open the larger window 50% to control glare and heat gain, open the smaller window 80% to maintain airflow. Afternoon: Open the larger window 20% to minimize heat gain from direct sunlight, open the smaller window 30% to ensure gentle airflow. Evening: Fully open both windows for cooling. Night: Fully closed to maintain comfort and privacy. | |||
| 7 | 1.8 m × 2.0 m2 | 1.8 m × 4.0 m2 | The larger window provides the bulk of ventilation and light, reaching into all areas of the room. The smaller window tempers the intensity of direct sunlight, reducing glare. Together, they create a flexible balance between high airflow and controlled light entry. |
| Behavior pattern: Morning: Open both windows fully but prioritize airflow through the larger window to reach all areas of the room. Midday: Open the larger window 60% to control glare and heat, open the smaller window 70% to allow continuous ventilation. Afternoon: Open the larger window 30% to manage glare and overheating, and keep the smaller window 40% open for consistent airflow. Evening: Open the larger window fully to cool down the space and the smaller window 60% open for balanced air exchange. Night: Fully closed to maintain comfort and privacy. | |||
| 8 | 2.0 m × 2.15 m2 | 2.0 m × 3.3 m2 | The larger window is designed to harvest daylight and maximize airflow, while the smaller window acts as a regulating element that limits direct solar exposure, ensuring that heat gain and glare remain under control. |
| Behavior pattern: Morning: Fully open both windows to provide significant ventilation. Midday: Open the larger window 70% to manage indoor heat while opening the smaller window 50% for steady airflow. Afternoon: Open larger window 90% to control glare and overheating and open smaller window 30% for gentle cooling. Evening: Open both windows fully for nighttime cooling. Night: Fully closed to maintain comfort and privacy. | |||
| Story | Window 1 (H × W) | Window 2 (H × W) | Ventilation/Lighting Impact |
| 9 | 2.2 × 1.7 m2 | 2.2 × 3.3 m2 | The larger window dominates in delivering natural light and ventilation, with the smaller window offering a refined control for glare and localized airflow. This pairing supports both effective cooling and light diffusion. |
| Behavior pattern: Morning: Open both windows fully to maximize daylight and ventilation. Midday: Open the larger window 50% to manage heat gain, open the smaller window 70% for ventilation. Afternoon: Open larger window 20%, open smaller window 50% to balance airflow and glare. Evening: Open both windows fully for nighttime cooling. Night: Fully closed to maintain comfort and privacy. | |||
| 10 | 2.4 × 1.8 m2 | 2.4 × 2.75 m2 | Taller overall dimensions mean that the larger window floods the interior with natural light and the smaller window complements this by moderating the influx of direct sunlight. |
| Behavior pattern: Morning: Fully open both windows, taking advantage of the taller height for effective airflow and lighting. Midday: Open the larger window 60% to limit heat gain, open the smaller window 50% for airflow. Afternoon: Open the larger window 30%, open the smaller window 40% open for balanced airflow. Evening: Open both windows fully for night cooling. Night: Fully closed to maintain comfort and privacy. | |||
| Story | Window 1 (H × W) | Window 2 (H × W) | Ventilation/Lighting Impact |
| 1 | 2.0× 1.75 m2 | 2.0× 1.75 m2 | Equal dimensions ensure that daylight and airflow are evenly distributed. |
| Behavior pattern: Morning: Fully open both windows for airflow and daylight. Midday: Open 50% to manage glare and airflow. Afternoon: Open 30% for controlled heat gain. Evening: Open 70% to cool the space. Night: Fully closed to maintain comfort and privacy. | |||
| 2 | 1.8× 1.95 m2 | 1.8× 1.95 m2 | Although slightly shorter, these windows still support good natural light penetration and effective air exchange. |
| Behavior pattern: Morning: Fully open for maximum ventilation. Midday: Open 40% to balance glare and airflow. Afternoon: Open 20% to limit heat gain. Evening: Open 60% for effective cooling. Night: Fully closed to maintain comfort and privacy. | |||
| 3 | 1.75 × 2.0 m2 | 1.75 × 2.0 m2 | Optimized to control excessive glare, the dimensions allow moderate but effective ventilation. |
| Behavior pattern: Morning: Open 70% for airflow and light. Midday: Open 30% to reduce glare. Afternoon: Open 20% for controlled ventilation. Evening: Open 60% to cool the space. Night: Fully closed to maintain comfort and privacy. | |||
| 4 | 2.4 × 1.45 m2 | 2.4 × 1.45 m2 | Emphasizing vertical light entry, these tall windows deliver light deep into the space while their narrow width naturally limits the volume of air exchanged. |
| Behavior pattern: Morning: Fully open to maximize ventilation and light. Midday: Open 50% to balance airflow and light. Afternoon: Open 30% to reduce heat gain. Evening: Open 70% for cooling. Night: Fully closed to maintain comfort and privacy. | |||
| 5 | 2.0 × 1.15 m2 | 2.0 × 2.3 m2 | The wider window offers robust ventilation and abundant natural light, while the narrower one serves to control direct solar penetration and glare. |
| Behavior pattern: Morning: Fully open both windows for airflow. Midday: Open wider window 50% and narrower window 30% to balance airflow and light. Afternoon: Close wider window, open narrower window 20%. Evening: Open both 70% for cooling. Night: Fully closed to maintain comfort and privacy. | |||
| 6 | 1.8 × 1.3 m2 | 1.8 × 2.6 m2 | The larger window is the primary source of light and airflow, whereas the smaller window fine-tunes the interior environment by reducing excessive brightness and managing heat gain. |
| Behavior pattern: Morning: Fully open both windows. Midday: Open larger window 50% and smaller window 30%. Afternoon: Close larger window, open smaller window 20%. Evening: Open both 70% for night cooling. Night: Fully closed to maintain comfort and privacy. | |||
| 7 | 2.4 m × 1.0 m2 | 2.4 m × 2.0 m2 | The tall design encourages deep vertical light diffusion. The smaller window provides additional control, ensuring that high-intensity sunlight does not lead to overheating or glare. |
| Behavior pattern: Morning: Fully open both windows. Midday: Open larger window 60%, open smaller smaller 40%. Afternoon: Open smaller window 30%, close larger window. Evening: Open both 70% for night cooling. Night: Fully closed to maintain comfort and privacy. | |||
| 8 | 1.7 × 1.35 m2 | 1.7 × 2.7 m2 | This combination focuses on horizontal airflow while still allowing sufficient natural light. |
| Behavior pattern: Morning: Fully open both windows. Midday: Open larger window 50% and smaller window 30%. Afternoon: Close larger window, open smaller window 20%. Evening: Open both 60% for night cooling. Night: Fully closed to maintain comfort and privacy. | |||
| 9 | 2.0 × 1.4 m2 | 2.0 × 2.1 m2 | Both windows work in tandem to ensure a balanced mix of daylight and ventilation. |
| Behavior pattern: Morning: Fully open both windows. Midday: Open wider window 50%, open smaller window 30%. Afternoon: Open narrower window 20%, close wider window. Evening: Open both 70% for night cooling time. Night: Fully closed to maintain comfort and privacy. | |||
| 10 | 1.7 × 1.65 m2 | 1.7 × 2.4 m2 | The dimensions ensure that even with limited vertical reach, the room remains properly ventilated through carefully managed opening strategies. |
| Behavior pattern: Morning: Fully open both windows. Midday: Open larger window 40%, open smaller window 30%. Afternoon: Close larger window, open smaller window 20%. Evening: Open both windows 60%. Night: Fully closed to maintain comfort and privacy. | |||
- Design Scenario Four
- North–South Window Configuration
- Occupant Behavior Narrative
- Same Behavioral pattern:
- Morning (6:00 AM–10:00 AM):
- North windows: Fully open to maximize cross-ventilation and bring in fresh air.
- South window: Fully open to enhance air exchange and allow diffuse morning light.
- Midday (10:00 AM–2:00 PM):
- North windows: Open 40% to allow controlled airflow while minimizing glare.
- South window: Open 30% to balance indirect light and heat control.
- Afternoon (2:00 PM–6:00 PM):
- North windows: Open 20% to maintain minimal airflow.
- South window: Closed to block direct sunlight and reduce heat gain.
- Evening (6:00 PM–10:00 PM):
- North windows: Open wider 70% for steady ventilation and cooling.
- South window: Open wider 60% to act as an exhaust for warm air and allow evening breezes.
- Night (10:00 PM–6:00 AM):
- Both fully close for thermal stability and security.
| Story | 2×Window North (H × W) | Window South (H × W) | Ventilation/Lighting Impact |
| 1 | 2.4 × 2.0 m2 | 2.4 × 3.0 m2 | Balanced north windows ensure consistent ventilation, while the tall south window enhances vertical daylight penetration, minimizing reliance on artificial lighting. |
| Behavior pattern: Morning: Fully open all windows to maximize ventilation and bring in fresh air. Midday: Open 50% to balance glare control and airflow. Afternoon: Open 30% to limit solar heat gain while maintaining ventilation. Evening: Open windows 70% to cool the space. Night: Fully closed to maintain comfort and privacy. | |||
| 2 | 2.2 × 2.0 m2 | 2.2 × 3.3 m2 | Slightly shorter south window balances light penetration and glare control. North windows ensure cross-ventilation for thermal comfort. |
| Behavior pattern: Morning: Fully open all windows for maximum ventilation. Midday: Open south window to 50% and north windows to 40% to control glare. Afternoon: Slightly open north windows 30% and keep the south window closed. Evening: Open all windows 70% for cooling. Night: Fully closed to maintain comfort and privacy. | |||
| 3 | 2.0 × 2.3 m2 | 2.0 × 3.6 m2 | Larger north windows emphasize airflow, while the taller south window focuses on warm air exhaust and vertical daylight. |
| Behavior pattern: Morning: Fully open all windows to improve ventilation. Midday: Open north windows 50% and the south window 30% to balance light and airflow. Afternoon: Slightly open the north windows 20% and keep the south window closed. Evening: Open all windows to 70% for effective cooling. Night: Fully closed to maintain comfort and privacy. | |||
| 4 | 1.8 × 2.60 m2 | 1.8 × 4.0 m2 | Compact north windows minimize glare, while the large south window ensures consistent ventilation and daylight penetration. |
| Behavior pattern: Morning: Fully open all windows for maximum airflow. Midday: Open north windows 50% and the south window 30% to control glare. Afternoon: Slightly open 20% north windows while keeping the south window closed. Evening: Open all windows 70% for nighttime cooling. Night: Fully closed to maintain comfort and privacy. | |||
| 5 | 1.6 × 2.80 m2 | 1.6 × 4.60 m2 | Narrow north windows prioritize glare control, while the large south window enhances thermal comfort and daylight distribution. |
| Behavior pattern: Morning: Fully open all windows for cross-ventilation. Midday: Open north windows 50% and south window 30% to minimize glare and control heat. Afternoon: Keep the south window closed and north windows slightly open 20%. Evening: Open all windows 70% for effective cooling. Night: Fully closed to maintain comfort and privacy. | |||
| 6 | 1.6 × 2.90 m2 | 2.2 × 3.3 m2 | Shorter north windows reduce solar heat gain and glare, providing steady cross-ventilation. The taller south window enhances daylight penetration deeper into the room, supporting passive cooling and indirect light. |
| Behavior pattern: Morning: Fully open all windows to promote cross-ventilation and fresh air. Midday: Open north and south window 50% to balance airflow and light. Afternoon: Open north windows 30% and keep the south window closed to reduce solar heat gain. Evening: Open all windows 80% to cool the space naturally. Night: Fully closed to maintain comfort and privacy. | |||
| 7 | 1.7 × 2.7 m2 | 2.4 × 3.0 m2 | Balanced dimensions on the north side ensure consistent airflow and daylight. The taller south window maximizes vertical daylight penetration and facilitates heat exhaust. |
| Behavior pattern: Morning: Fully open all windows for ventilation and fresh air. Midday: Open north windows 50% and south window 30% to maintain thermal comfort. Afternoon: Open north windows 30% and keep the south window mostly closed. Evening: Open all windows 70% for nighttime cooling. Night: Fully closed to maintain comfort and privacy. | |||
| 8 | 1.80 × 2.60 m2 | 2.2 × 3.3 m2 | Taller north windows prioritize ventilation, allowing for improved airflow. The south window enhances daylighting and heat removal, supporting effective passive cooling. |
| Behavior pattern: Morning: Fully open all windows for cross-ventilation. Midday: Open north windows 50% and south window 40% to balance airflow and light control. Afternoon: South window closed, and open the north windows 30%. Evening: Open all windows to 80% for natural cooling. Night: Fully closed to maintain comfort and privacy. | |||
| 9 | 1.6 × 2.90 m2 | 2.4 × 3.0 m2 | Compact north windows provide controlled ventilation and reduce glare. The larger south window supports deep daylight penetration and passive cooling. |
| Behavior pattern: Morning: Fully open all windows for fresh air and ventilation. Midday: Open north windows 50% and south window 40% to balance light and airflow. Afternoon: Open north windows 20% while keeping the south window closed. Evening: Open all windows 70% for cooling. Night: Fully closed to maintain comfort and privacy. | |||
| 10 | 1.7× 2.6 m2 | 2.2 × 3.3 m2 | Proportional heights focus on effective airflow through the north windows. The south window prioritizes passive lighting and enhances natural ventilation. Optimized for spaces requiring steady cross-ventilation and strong passive cooling. |
| Behavior pattern: Morning: Fully open all windows for cross-ventilation and daylight. Midday: Open north windows 50% and south window 30% to manage light and airflow. Afternoon: Slightly open north windows 20% while keeping the south window closed. Evening: Open all windows to 70% for natural cooling. Night: Fully closed to maintain comfort and privacy. | |||
| Story | 2 x Window North (H × W) | Window South (H × W) | Ventilation/Lighting Impact |
| 1 | 2.4 × 1.2 m2 | 2.4 × 1.9 m2 | Balanced dimensions provide consistent ventilation and indirect light. The south window enhances vertical daylight penetration. |
| Behavior pattern: Morning: Fully open all windows to allow fresh air and vertical ventilation. Midday: Open all windows 50% to balance light and airflow. Afternoon: Open 30% north windows and keep the south window closed. Evening: Open all windows 70% for cooling. Night: Fully closed to maintain comfort and privacy. | |||
| 2 | 2.2 × 1.4 m2 | 2.2 × 3.3 m2 | Slightly shorter south window balances light penetration and glare control. North windows ensure cross-ventilation for thermal comfort. Adapted dimensions prioritize glare-free light. |
| Behavior pattern: Morning: Fully open all windows for ventilation. Midday: Open north windows 50% and the south window 40% for light and airflow. Afternoon: Keep the north windows slightly open 20% and close the south window. Evening: Open all windows 70% for cooling. Night: Fully closed to maintain comfort and privacy. | |||
| 3 | 2.2 × 1.4 m2 | 2.0 × 2.40 m2 | South window reduces glare and enhances ventilation. Larger north windows maintain effective cross-ventilation. |
| Behavior pattern: Morning: Fully open all windows for fresh air exchange. Midday: Partially open north windows 40% and south window 30%. Afternoon: Slightly open 20% the north windows; keep the south window closed. Evening: Open all windows 70% for nighttime cooling. Night: Fully closed to maintain comfort and privacy. | |||
| 4 | 1.8 × 1.60 m2 | 1.8 × 2.60 m2 | Narrow north windows minimize solar gain, while the larger south window ensures indirect light and heat exhaust. |
| Behavior pattern: Morning: Fully open all windows for cross-ventilation. Midday: Open smaller north windows 40% and south window 50% for light and airflow. Afternoon: Close the south window and keep the north windows open 20%. Evening: Open all windows 70% for effective nighttime cooling. Night: Fully closed to maintain comfort and privacy. | |||
| 5 | 1.6 × 1.80 m2 | 1.6 × 2.90 m2 | Narrow north windows reduce glare, while the tall south window focuses on indirect light and ventilation. |
| Behavior pattern: Morning: Fully open all windows for ventilation and daylight. Midday: Open north windows 50% and south window 30% to balance heat and light. Afternoon: Keep the north windows slightly open 20%; close the south window. Evening: Open all windows 70% for cooling. Night: Fully closed to maintain comfort and privacy. | |||
| 6 | 1.6 × 1.8 m2 | 2.2 × 2.0 m2 | Shorter north windows reduce solar heat gain and glare, providing steady cross-ventilation. The taller south window enhances daylight. |
| Behavior pattern: Morning: Fully open all windows 100% to allow fresh air and maximize ventilation. Midday: Open north windows 50% and south window 40% to balance airflow and light control. Afternoon: Open north windows 20% and keep the south window closed to reduce solar heat gain. Evening: Open all windows 80% to cool the room naturally. Night: Fully closed to maintain comfort and privacy. | |||
| 7 | 1.7 × 1.7 m2 | 2.4 × 2.0 m2 | Balanced dimensions on the north wall ensure consistent airflow. The taller south window provides deep vertical daylight penetration and supports heat exhaust. |
| Behavior pattern: Morning: Fully open all windows for cross-ventilation and fresh air. Midday: Open north windows 50% and south window 40% to manage glare and thermal comfort. Afternoon: Slightly open north windows 30% and keep the south window closed. Evening: Open all windows 70% for natural cooling. Night: Fully closed to maintain comfort and privacy. | |||
| 8 | 1.80 × 1.7 m2 | 2.2 × 2.10 m2 | Taller north windows prioritize airflow and ventilation efficiency. The south window enhances daylighting and supports passive cooling. |
| Behavior pattern: Morning: Fully open all windows for ventilation. Midday: Open north windows 50% and south window 40% to balance light and airflow. Afternoon: Keep the south window closed and open the north windows slightly 20%. Evening: Open all windows to 80% for nighttime cooling. Night: Fully closed to maintain comfort and privacy. | |||
| 9 | 1.60 × 1.80 m2 | 2.4 × 2.0 m2 | Compact north windows focus on glare control and steady ventilation. The larger south window provides strong daylight penetration and efficient heat exhaust. |
| Behavior pattern: Morning: Fully open all windows for fresh air and ventilation. Midday: Open north windows 50% and south window 30% to balance heat and light control. Afternoon: Slightly open north windows 20% while keeping the south window closed. Evening: Open all windows to 80% for effective cooling. Night: Fully closed to maintain comfort and privacy. | |||
| 10 | 1.7 × 1.7 m2 | 2.2 × 2.2 m2 | Proportional heights focus on optimized cross-ventilation through the north windows. |
| Behavior pattern: Morning: Fully open all windows for cross-ventilation and daylight. Midday: Open north windows 50% and south window 30% to manage light and airflow. Afternoon: Open north windows 20%, keeping the south window closed. Evening: Open all windows 70% for nighttime cooling. Night: Fully closed to maintain comfort and privacy. | |||
- Design Story 5: North—East Windows
- Occupant Behavior Narrative
- In colder seasons, occupants primarily leverage the north-facing window to bring in fresh air and harness passive solar gain when available. When needed, they adjust blinds or shading devices to manage heat buildup or glare, preserving a comfortable indoor environment.
- As outdoor temperatures increase, residents open both the north and east windows to generate a strong cross-ventilation flow. The larger north window naturally draws out warm air, particularly in the afternoon and evening when paired with the east windows, creating a cooler, more comfortable interior. Through this thoughtful use of operable windows and targeted shading, occupants minimize reliance on mechanical cooling and artificial lighting, maintaining a healthy balance between energy efficiency and indoor comfort.
- Same Behavioral pattern:
- Morning (6:00 AM–10:00 AM): Open east 80%, open north 40%. Most fresh air enters from east side, with some cross-flow exiting north.
- Midday (10:00 AM–2:00 PM): East 30%, north 50%.
- Afternoon (2:00 PM–6:00 PM): East 20%, north 60%.
- Evening (6:00 PM–10:00 PM): East 70%, north 70%.
- Night (10:00 PM–6:00 AM): Both fully closed.
| Story | Window North (H × W) | East Windows (Each): (H × W) | Ventilation/Lighting Impact |
| 1 | 2.4 × 3.05 m2 | 2.4 × 1.20 m2 | The east windows provide bright morning light beneficial for occupant alertness. The north window balances daylight later in the day, minimizing harsh direct sun and glare. |
| Behavior pattern: Morning: East windows 100% open, north window 50% open. Midday: East windows 30% open (reduce glare), north window 50% open. Afternoon: East windows 20% open, north window 70% open. Evening: East windows 70% open, north window 70% open. Night: Fully closed to maintain comfort and privacy. | |||
| 2 | 2.2 × 3.30 m2 | 2.2 × 1.35 m2 | Morning sun from the east is strong but can be controlled via partial opening or blinds. The taller north window distributes soft daylight deeper into the room throughout midday/afternoon. |
| Behavior pattern: Morning: East 80% open, north 50% open. Midday: East 40% open, north 50% open. Afternoon: East 20% open, north 60% open. Evening: East 70% open, north 70% open. Night: Fully closed to maintain comfort and privacy. | |||
| 3 | 2.0 × 3.65 m2 | 2.0 × 1.45 m2 | East windows are moderately tall for morning sunlight; the vertical north window yields stable daytime illumination, reducing reliance on electric lighting. |
| Behavior pattern: Morning: East 90% open, north 40% open. Midday: East 30% open, north 60% open. Afternoon: East 20% open, north 70% open. Evening: East 80% open, north 80% open. Night: Fully closed to maintain comfort and privacy. | |||
| 4 | 1.8 × 4.05 m2 | 1.8 × 1.65 m2 | Provides strong vertical air circulation potential. Extended vertical glazing helps light reach deeper. Morning sun from the east can be intense. |
| Behavior ppattern: Morning: East 80% open, north 30% open. Midday: East 30% open, north 50% open. Afternoon: East 20% open, north 70% open. Evening: East 60% open, north 60% open. Night: Fully closed to maintain comfort and privacy. | |||
| 5 | 1.6 × 4.55 m2 | 1.6 × 1.85 m2 | Despite narrower widths, the tall dimension still allows a good vertical spread of daylight. East windows provide strong morning illumination. |
| Behavior pattern: Morning: East 100% open, north 40% open. Midday: East 40% open, north 50% open. Afternoon: East 20% open, north 70% open. Evening: East 80% open, north 80% open. Night: Fully closed to maintain comfort and privacy. | |||
| 6 | 2.2 × 3.30 m2 | 1.6 × 1.85 m2 | Good morning sun from narrower but tall east openings; stable diffuse light from north reduces midday glare. |
| Behavior pattern: Morning: East ~90% open, north 60% open. Midday: East 20% open, north 50% open. Afternoon: East 20% open, north 70% open. Evening: East 70% open, north 70% open. Night: Fully closed to maintain comfort and privacy. | |||
| 7 | 2.4 × 3.05 m2 | 1.7 × 1.70 m2 | East squares provide robust morning brightness; the wide north window ensures consistent light for the rest of the day. |
| Behavior pattern: Morning: East 100% open, north 50% open. Midday: East 40% open, north 60% open. Afternoon: East 20% open, north 70% open. Evening: East 70% open, north 70% open. Night: Fully closed to maintain comfort and privacy. | |||
| 8 | 2.2 × 3.30 m2 | 1.8 × 1.65 m2 | Creates a balanced approach: neither too tall nor too wide. East façade supplies ample morning daylight; the north façade offers an even glow all day. |
| Behavior pattern: Morning: East 80% open, north 60% open. Midday: East 30% open, north 50% open. Afternoon: East 20% open, north 70% open. Evening: East 80% open, north 80% open. Night: Fully closed to maintain comfort and privacy. | |||
| 9 | 2.4 × 3.03 m2 | 1.6 × 1.85 m2 | East windows give solid morning light; the wide north window ensures good illumination across midday/afternoon. |
| Behavior pattern: Morning: East 90% open, north 40% open. Midday: East 30% open, north 60% open. Afternoon: East 20% open, north 70% open. Evening: East 70% open, north 70% open. Fully closed to maintain comfort and privacy. | |||
| 10 | 2.2 × 3.30 m2 | 1.7 × 1.70 m2 | Morning cross-vent can be strong if all are opened wide. East squares let in direct morning light while the north window stabilizes interior illumination through midday. |
| Behavior Pattern: Morning: East 100% open, north 50% open. Midday: East 40% open, north 50% open. Afternoon: East 20% open, north 70% open. Evening: East 80% open, north 80% open. Night: Fully closed to maintain comfort and privacy. | |||
| Story | Window North (H × W) | East Windows (each): (H × W) | Ventilation/Lighting Impact |
| 1 | 2.4 × 1.95 m2 | 2.4 × 1.90 m2 | The north window offers more diffuse daytime light, reducing glare issues midday/afternoon. |
| Behavior pattern: Morning: East 100% open, north 50% open. Midday: East 40% open, north 50% open. Afternoon: East 30% open, north 60% open. Evening: East 70% open, north 70% open. Night: Fully closed to maintain comfort and privacy. | |||
| 2 | 2.2 × 2.15 m2 | 2.2 × 2.05 m2 | A tall north window plus two moderately sized east window deliver cross-vent potential in the morning and evening. East windows supply robust morning sun, the north window ensures stable daylight. |
| Behavior pattern: Morning: East 80% open, north 40% open. Midday: East 30% open, north 50% open. Afternoon: East 20% open, north 60% open. Evening: East 70% open, north 70% open. Night: Fully closed to maintain comfort and privacy. | |||
| 3 | 2.0 × 2.35 m2 | 2.0 × 2.30 m2 | North window pairs with fairly tall east windows for a balanced cross-vent. The tall east windows deliver strong early light. |
| Behavior [attern: Morning: East 90% open, north 40% open. Midday: East 30% open, north 60% open. Afternoon: East 20% open, north 70% open. Evening: East 80% open, north 80% open. Night: Fully closed to maintain comfort and privacy. | |||
| 4 | 1.8 × 2.60 m2 | 1.8 × 2.55 m2 | A taller north window and two tall/wide east windows allows a significant vertical airflow path. East windows produce intense morning light. |
| Behavior pattern: Morning: East 100% open, north 50% open. Midday: East 40% open, north 50% open. Afternoon: East 20% open, north 70% open. Evening: East 70% open, north 70% open. Night: Fully closed to maintain comfort and privacy. | |||
| 5 | 1.6 × 2.95 m2 | 1.6 × 2.85 m2 | Narrower tall dimension brings decent morning sun from the east and stable midday brightness from the north. |
| Behavior pattern: Morning: East 90% open, north 40% open. Midday: East 30% open, north 60% open. Afternoon: East 20% open, north 70% open. Evening: East 80% open, north 80% open. Night: Fully closed to maintain comfort and privacy. | |||
| 6 | 2.2 × 2.15 m2 | 1.6 × 2.85 m2 | Occupants achieve a strong breeze with two large east sashes plus one moderate north sash. |
| Behavior pattern: Morning: East 80% open, north 40% open. Midday: East 20% open, north 50% open. Afternoon: East 20% open, north 70% open. Evening: East 70% open, north 70% open. Night: Fully closed to maintain comfort and privacy. | |||
| 7 | 2.4 × 1.95 m2 | 1.7 × 2.65 m2 | A wide north window plus two tall east windows foster strong cross-vent if opened simultaneously. Lighting: East windows supply bright morning light; wide north window helps fill the space with more diffuse brightness midday onward. |
| Behavior pattern: Morning: East 100% open, north 50% open. Midday: East 40% open, north 50% open. Afternoon: East 20% open, north 60% open. Evening: East 70% open, north 70% open. Night: Fully closed to maintain comfort and privacy. | |||
| 8 | 2.2 × 2.15 m2 | 1.8 × 2.55 m2 | Can quickly exchange air in morning/evening. East side can be bright early. North side remains easy on the eyes throughout the day. |
| Behavior pattern: Morning: East 90% open, north 40% open. Midday: East 30% open, north 60% open. Afternoon: East 20% open, north 70% open. Evening: East 80% open, north 80% open. Night: Fully closed to maintain comfort and privacy. | |||
| 9 | 2.4 × 1.95 m2 | 1.6 × 2.85 m2 | Open them wide in morning/evening for a big flush of air. The east windows let in strong morning sun, the wide north window illuminates midday/afternoon zones without direct glare. |
| Behavior pattern: Morning: East 100% open, north 50% open. Midday: East 40% open, north 50% open. Afternoon: East 20% open, north 70% open. Evening: East 70% open, north 70% open. Night: Fully closed to maintain comfort and privacy. | |||
| 10 | 2.2 × 2.15 m2 | 1.7 × 2.65 m2 | Good synergy for cross-flow ventilation. East orientation is strong in the morning; the north window stays helpful for less direct, glare-free light midday. |
| Behavior pattern: Morning: East 90% open, north 40% open. Midday: East 30% open, north 50% open. Afternoon: East 20% open, north 60% open. Evening: East 80% open, north 80% open. Night: Fully closed to maintain comfort and privacy. | |||
References
- Amasyali, K.; El-Gohary, N.M. A review of data-driven building energy consumption prediction studies. Renew. Sustain. Energy Rev. 2018, 81, 1192–1205. [Google Scholar] [CrossRef]
- Zhan, S.; Zhu, M.; Cheng, S.; Chong, A. Bridging performance gap for existing buildings: The role of calibration and the cascading effect. In Building Simulation; Tsinghua University Press: Beijing, China, 2025; Volume 18. [Google Scholar]
- Menezes, A.C.; Cripps, A.; Bouchlaghem, D.; Buswell, R. Predicted vs. actual energy performance of non-domestic buildings. Appl. Energy 2012, 97, 355–364. [Google Scholar] [CrossRef]
- de Wilde, P. The gap between predicted and measured energy performance of buildings: A framework for investigation. Autom. Constr. 2014, 41, 40–49. [Google Scholar] [CrossRef]
- van Dronkelaar, C.; Dowson, M.; Burman, E.; Spataru, C.; Mumovic, D. A review of the energy performance gap and its underlying causes in non-domestic buildings. Front. Mech. Eng. 2016, 1, 17. [Google Scholar] [CrossRef]
- Far, C.; Ahmed, I.; Mackee, J. Significance of occupant behaviour on the energy performance gap in residential buildings. Architecture 2022, 2, 424–433. [Google Scholar] [CrossRef]
- Hong, T.; Taylor-Lange, S.C.; D’Oca, S.; Yan, D.; Corgnati, S.P. Advances in research and applications of energy-related occupant behavior in buildings. Energy Build. 2016, 116, 694–702. [Google Scholar] [CrossRef]
- Yan, D.; O’Brien, W.; Hong, T.; Feng, X.; Gunay, H.B.; Tahmasebi, F.; Mahdavi, A. Occupant behavior modeling for building performance simulation: Current state and future challenges. Energy Build. 2017, 107, 264–278. [Google Scholar] [CrossRef]
- Andersen, R.V.; Toftum, J.; Andersen, K.K.; Olesen, B.W. Survey of occupant behavior and control of indoor environment in Danish dwellings. Energy Build. 2009, 41, 11–16. [Google Scholar] [CrossRef]
- NatHERS Technical Note (Version October 2024)|Nationwide House Energy Rating Scheme (NatHERS). 2019. Available online: https://www.nathers.gov.au/publications/nathers-technical-note (accessed on 2 May 2025).
- Zhang, Y. Occupant Behavior and Its Impact on Energy Consumption of Urban Residential Buildings. Ph.D. Thesis, The Australian National University, Canberra, Australia, 2021. [Google Scholar]
- Mylonas, A.; Tsangrassoulis, A.; Pascual, J. Modelling occupant behaviour in residential buildings: A systematic literature review. Build. Environ. 2024, 265, 111959. [Google Scholar] [CrossRef]
- D’Oca, S.; Chen, C.F.; Hong, T.; Belafi, Z. Synthesizing building physics with social psychology: An interdisciplinary framework for context and occupant behavior in office buildings. Energy Res. Soc. Sci. 2017, 34, 240–251. [Google Scholar] [CrossRef]
- Schweiker, M.; Fuchs, X.; Becker, S.; Wagner, A. Occupant behavior relation to the connected openings of adjacent spaces in a field study. Build. Environ. 2020, 173, 106749. [Google Scholar]
- O’Brien, W.; Gunay, H.B. The contextual factors contributing to occupants’ adaptive comfort behaviors in offices: A review and proposed modeling framework. Build. Environ. 2014, 77, 77–87. [Google Scholar] [CrossRef]
- Reinhart, C.F.; Voss, K. Monitoring manual control of electric lighting and blinds. Light. Res. Technol. 2003, 35, 243–260. [Google Scholar] [CrossRef]
- Fabi, V.; Andersen, R.V.; Corgnati, S.P.; Olesen, B.W. Occupants’ window opening behaviour: A literature review of factors influencing occupant behaviour and models. Build. Environ. 2012, 58, 188–198. [Google Scholar] [CrossRef]
- Haldi, F.; Robinson, D. On the unification of thermal perception and adaptive actions. Build. Environ. 2010, 45, 2440–2457. [Google Scholar] [CrossRef]
- Gunay, H.B.; O’Brien, W.; Beausoleil-Morrison, I. Implementation and comparison of existing occupant behavior models in EnergyPlus. J. Build. Perform. Simul. 2016, 9, 567–589. [Google Scholar] [CrossRef]
- Pourtangestani, M.; Izadyar, N.; Jamei, E.; Vrcelj, Z. Linking occupant behavior and window design through post-occupancy evaluation: Enhancing natural ventilation and indoor air quality. Buildings 2024, 14, 1638. [Google Scholar] [CrossRef]
- Arethusa, M.T.; Kubota, T.; Angung, M.; Sri, N.; Antaryama, I.; Tomoko, U. Factors influencing window opening behaviour in apartments of Indonesia. In Proceedings of the 30th International PLEA Conference. Sustainable Habitat for Developing Societies: Choosing the Way Forward, Ahmedabad, India, 16–18 December 2014; Volume 1, pp. 239–246. [Google Scholar]
- Chelliah, N.S.; Gnanasambandam, N.S.; Tadepalli, S. Influence of window design and environmental variables on the window opening behavior of occupants and energy consumption in residential buildings. Trans. Energy Syst. Eng. Appl. 2025, 6, 583. [Google Scholar] [CrossRef]
- IEA. The Role of Buildings in the Post-COVID Recovery; International Energy Agency: Paris, France, 2021. [Google Scholar]
- Rouleau, J.; Gosselin, L. Impact of COVID-19 lockdown on building energy consumption and GHG emissions: The case of Québec, Canada. Energy Build. 2021, 240, 110924. [Google Scholar]
- Ferreira, A.; Barros, N. COVID-19 and Lockdown: The Potential Impact of Residential Indoor Air Quality on the Health of Teleworkers. Int. J. Environ. Res. Public Health 2022, 19, 6079. [Google Scholar] [CrossRef]
- Heiselberg, P.; Svidt, K.; Nielsen, P.V. Characteristics of airflow from open windows. Build. Environ. 2001, 36, 859–869. [Google Scholar] [CrossRef]
- Qi, H.; Sha, D.; Zhang, Y. A review of high-rise ventilation for energy efficiency and safety. Sustain. Cities Soc. 2020, 52, 101841. [Google Scholar]
- Yang, Q.; Liu, M.; Shu, C.; Mmereki, D.; Uzzal Hossain Md Zhan, X. Impact Analysis of Window-Wall Ratio on Heating and Cooling Energy Consumption of Residential Buildings in Hot Summer and Cold Winter Zone in China. J. Eng. 2015, 2015, 538254. [Google Scholar] [CrossRef]
- Goia, F. Search for the optimal window-to-wall ratio in office buildings in different European climates and the implications on total energy-saving potential. Sol. Energy 2016, 132, 467–495. [Google Scholar] [CrossRef]
- Song, G.; Ai, Z.; Liu, Z.; Zhang, G. A systematic literature review on smart and personalized ventilation using CO2 concentration monitoring and control. Energy Rep. 2022, 8, 6504–6519. [Google Scholar] [CrossRef]
- Bramiana, C.N.; Aminuddin, A.M.R.; Ismail, M.A.; Widiastuti, R.; Pramesti, P.L. The Effect of Window Placement on Natural Ventilation Capability in a Jakarta High-Rise Building Unit. Buildings 2023, 13, 1141. [Google Scholar] [CrossRef]
- US Department of Energy. Natural Ventilation. Available online: https://www.energy.gov/energysaver/natural-ventilation (accessed on 21 June 2025).
- Davenport, A.G.; Wilson, D.J. Wind engineering for natural ventilation design. J. Wind. Eng. Ind. Aerodyn. 1996, 65, 1–12. [Google Scholar]
- Sacht, H.; Lukiantchuki, M.A. Windows Size and the Performance of Natural Ventilation. Procedia Eng. 2017, 196, 972–979. [Google Scholar] [CrossRef]
- Xu, P.; Shen, Y.; Zhang, X. Energy performance optimization of windows in hot climates: A parametric study. Energy Build. 2015, 103, 15–25. [Google Scholar]
- Schulze, T.; Eicker, U. Controlled natural ventilation for energy efficient buildings. Energy Build. 2013, 56, 221–232. [Google Scholar] [CrossRef]
- Vanhoutteghem, L.; Skarning, G.C.J.; Hviid, C.A.; Svendsen, S. Impact of window design on energy performance in residential buildings. Energy Build. 2015, 92, 141–151. [Google Scholar]
- Roetzel, A.; Tsangrassoulis, A.; Dietrich, U.; Busching, S. On the influence of window design on energy efficiency in different climates. Build. Environ. 2010, 45, 1263–1275. [Google Scholar]
- Yang, Z.; Liao, K.; Jiang, W.; Yang, Y.; Zhou, J. The influence of natural wind patterns on the thermal and humidity comfort of the “one seal” building in Yunnan, China. J. Asian Archit. Build. Eng. 2025, 24, 1351–1373. [Google Scholar] [CrossRef]
- Feng, X.; Yan, D.; Wang, C. Simulation of occupancy in buildings. Energy Build. 2015, 87, 348–360. [Google Scholar] [CrossRef]
- D’Oca, S.; Hong, T. Occupancy schedules learning process through a data mining framework. Energy Build. 2015, 88, 395–408. [Google Scholar] [CrossRef]
- Langevin, J.; Wen, J.; Gurian, P.L. Simulating the human-building interaction: Development and validation of an agent-based model of office occupant behaviors. Build. Environ. 2015, 88, 27–45. [Google Scholar] [CrossRef]
- Gaetani, I.; Hoes, P.J.; Hensen, J.L.M. Estimating the influence of occupant behavior on building heating and cooling energy in one simulation run. Appl. Energy 2016, 216, 372–383. [Google Scholar] [CrossRef]
- Wang, Y.; Wang, X.; Yu, S. Understanding the role of occupant behavior in residential building energy consumption: A review of recent advances. Energy Build. 2023, 301, 113938. [Google Scholar]
- Li, C.; Skitmore, M.; He, T. The post-occupancy dilemma in green-rated buildings: A performance gap analysis. J. Green Build. 2022, 17, 259–278. [Google Scholar] [CrossRef]
- Gram-Hanssen, K.; Georg, S. Energy performance gaps: Promises, people, and practices. Build. Cities 2022, 3, 51–64. [Google Scholar] [CrossRef]
- Rupp, R.F.; Fornari, R.M.; Ghisi, E. Adaptive thermal comfort models for naturally ventilated buildings: A critical review and future directions. Build. Environ. 2022, 218, 109149. [Google Scholar]
- Wu, Z.; Li, N.; Wargocki, P.; Peng, J.; Li, J.; Cui, H. Adaptive thermal comfort in naturally ventilated dormitory buildings in Changsha, China. Energy Build. 2019, 201, 109400. [Google Scholar] [CrossRef]
- Elsayed, M.; Pelsmakers, S.; Pistore, L. Post-occupancy evaluation in residential buildings: A systematic literature review of current practices in the EU. Build. Environ. 2023, 234, 110755. [Google Scholar] [CrossRef]
- Anderson, K.; Lee, S.H. An empirically grounded model for simulating normative energy use feedback interventions. Appl. Energy 2016, 173, 272–282. [Google Scholar] [CrossRef]
- Artan, D.; Ergen, E.; Kula, B.; Guven, G. Rateworkspace: BIM integrated post-occupancy evaluation system for office buildings. J. Inf. Technol. Constr. 2022, 27, 441–485. [Google Scholar] [CrossRef]
- Heiselberg, P.; Bjørn, E. Experimental investigation of airflow and temperature distribution in a room with natural ventilation. Int. J. Vent. 2002, 1, 55–68. [Google Scholar]
- Saadi, S.; Hayati, A.; Salmanzadeh, M. Optimization of Window-to-Wall Ratio for Buildings Located in Different Climates: An IDA-Indoor Climate and Energy Simulation Study. Energies 2021, 14, 1974. [Google Scholar] [CrossRef]
- Veillette, D.; Rouleau, J.; Gosselin, L. Impact of Window-to-Wall Ratio on Heating Demand and Thermal Comfort When Considering a Variety of Occupant Behavior Profiles. Front. Sustain. Cities 2021, 3, 700794. [Google Scholar] [CrossRef]
- Ali, D.M.T.E.; Motuzienė, V.; Džiugaitė-Tumėnienė, R. Al-driven innovations in building energy management systems: A review of potential applications and energy savings. Energies 2023, 17, 4277. [Google Scholar] [CrossRef]
- Dai, X.; Liu, J.; Zhang, X. A review of studies applying machine learning models to predict occupancy and window-opening behaviours in smart buildings. Energy Build. 2020, 223, 110159. [Google Scholar] [CrossRef]
- Cao, Q.; Li, X.; Zhang, Y. Predictive analytics for occupant behavior in smart buildings: A review of machine learning techniques. Build. Environ. 2023, 245, 110892. [Google Scholar]
- Lu, W.; Zhang, L.; Liu, Y. Evaluation of Urban Complex Utilization Based on AHP and MCDM Analysis: A Case Study of China. Buildings 2024, 14, 2179. [Google Scholar] [CrossRef]
- Das, P.; Chalabi, Z.; Jones, B.; Milner, I.; Shrubsole, C.; Davies, M.; Wilkinson, P. Multi-objective methods for determining optimal ventilation rates in dwellings. Build. Environ. 2016, 109, 170–181. [Google Scholar] [CrossRef]
- Jiang, Y.; Li, N.; Yongga, A.; Yan, W. Short-term effects of natural view and daylight from windows on thermal perception, health, and energy-saving potential. Build. Environ. 2022, 219, 109146. [Google Scholar] [CrossRef]
- Aries, M.B.C.; Aarts, M.P.J.; van Hoof, J. Daylight and health: A review of the evidence and consequences for the built environment. Light. Res. Technol. 2015, 47, 6–27. [Google Scholar] [CrossRef]
- Tomrukcu, G.; Ashrafian, T. Climate-resilient building energy efficiency retrofit: Evaluating climate change impacts on residential buildings. Energy Build. 2024, 316, 114315. [Google Scholar] [CrossRef]
- Mesloub, A.; Alnaim, M.M.; Albagawi, G.; Alsolami, B.M.; Mahboub, M.S.; Tsangrassoulis, A.; Doulos, L.T. The visual comfort, economic feasibility, and overall energy consumption of tubular daylighting device system configurations in deep plan office buildings in Saudi Arabia. J. Build. Eng. 2023, 68, 106100. [Google Scholar] [CrossRef]
- Burman, E.; Mumovic, D.; Kimpian, J. Towards measurement and verification of energy performance under the framework of the European directive for energy performance of buildings. Energy 2014, 77, 153–163. [Google Scholar] [CrossRef]
- Delzendeh, E.; Wu, S.; Lee, A.; Zhou, Y. The impact of occupants’ behaviours on building energy analysis: A research review. Renew. Sustain. Energy Rev. 2017, 80, 1061–1071. [Google Scholar] [CrossRef]
- Schmidt, M.; Crawford, R.H.; Warren-Myers, G. Quantifying Australia’s life cycle greenhouse gas emissions for new homes. Energy Build. 2020, 190, 110287. [Google Scholar] [CrossRef]
- Australian Building Codes Board. National Construction Code 2022; ABCB: Canberra, Australia, 2022. [Google Scholar]
- Dalton, T. Australian Suburban House Building: Industry Organisation, Practices, and Constraints; AHURI Positioning Paper No. 143; Australian Housing and Urban Research Institute: Melbourne, Australia, 2011. [Google Scholar]
- Australian Institute of Refrigeration, Air Conditioning and Heating (AIRAH). The Australian HVAC&R Industry Guide. 2019. Available online: https://www.airah.org.au/ (accessed on 13 June 2025).
- Climate Statistics for Australian Locations: Melbourne Monthly Climate Statistics. Available online: http://www.bom.gov.au/climate/averages/tables/cw_086071.shtml (accessed on 13 June 2025).
- Xu, X.; Yu, C.; Li, H. Energy performance of window systems in buildings: A review. Energy Build. 2020, 214, 109842. [Google Scholar]

| Parameter Type | Fixed Inputs | Description |
|---|---|---|
| Building dimensions | Typical living room, ceiling height 2.4 m | Living room with wider and smaller wall dimensions, which match standard dimensions for Melbourne homes |
| Wall construction | Brick veneer, air cavity, reflective sarking, plasterboard | Standard local wall construction |
| Window specifications | Double-glazed low-E glass, thermally broken aluminum frames | U-value: 2.8–3.2 W/m2·K; SHGC: 0.40–0.50 |
| Weather data | Hourly temperature, humidity, wind speed, and solar radiation | Melbourne climate, Typical Meteorological Year |
| Design Story | Orientation | Configuration | WWR | Configuration Rationale |
|---|---|---|---|---|
| Story 1 | North | Dual window | 45% |
|
| Story 2 | East–west | Single window | E 40% W 30% |
|
| Story 3 | South | Dual window | 30% each |
|
| Story 4 | North and south | Dual north, single south | S 40% N 25% each |
|
| Story 5 | North and east | Single north, dual east | N 40% E 25% each |
|
| Design Story | Orientation | Scenario A | Scenario B | SB Rationale | PB Rationale |
|---|---|---|---|---|---|
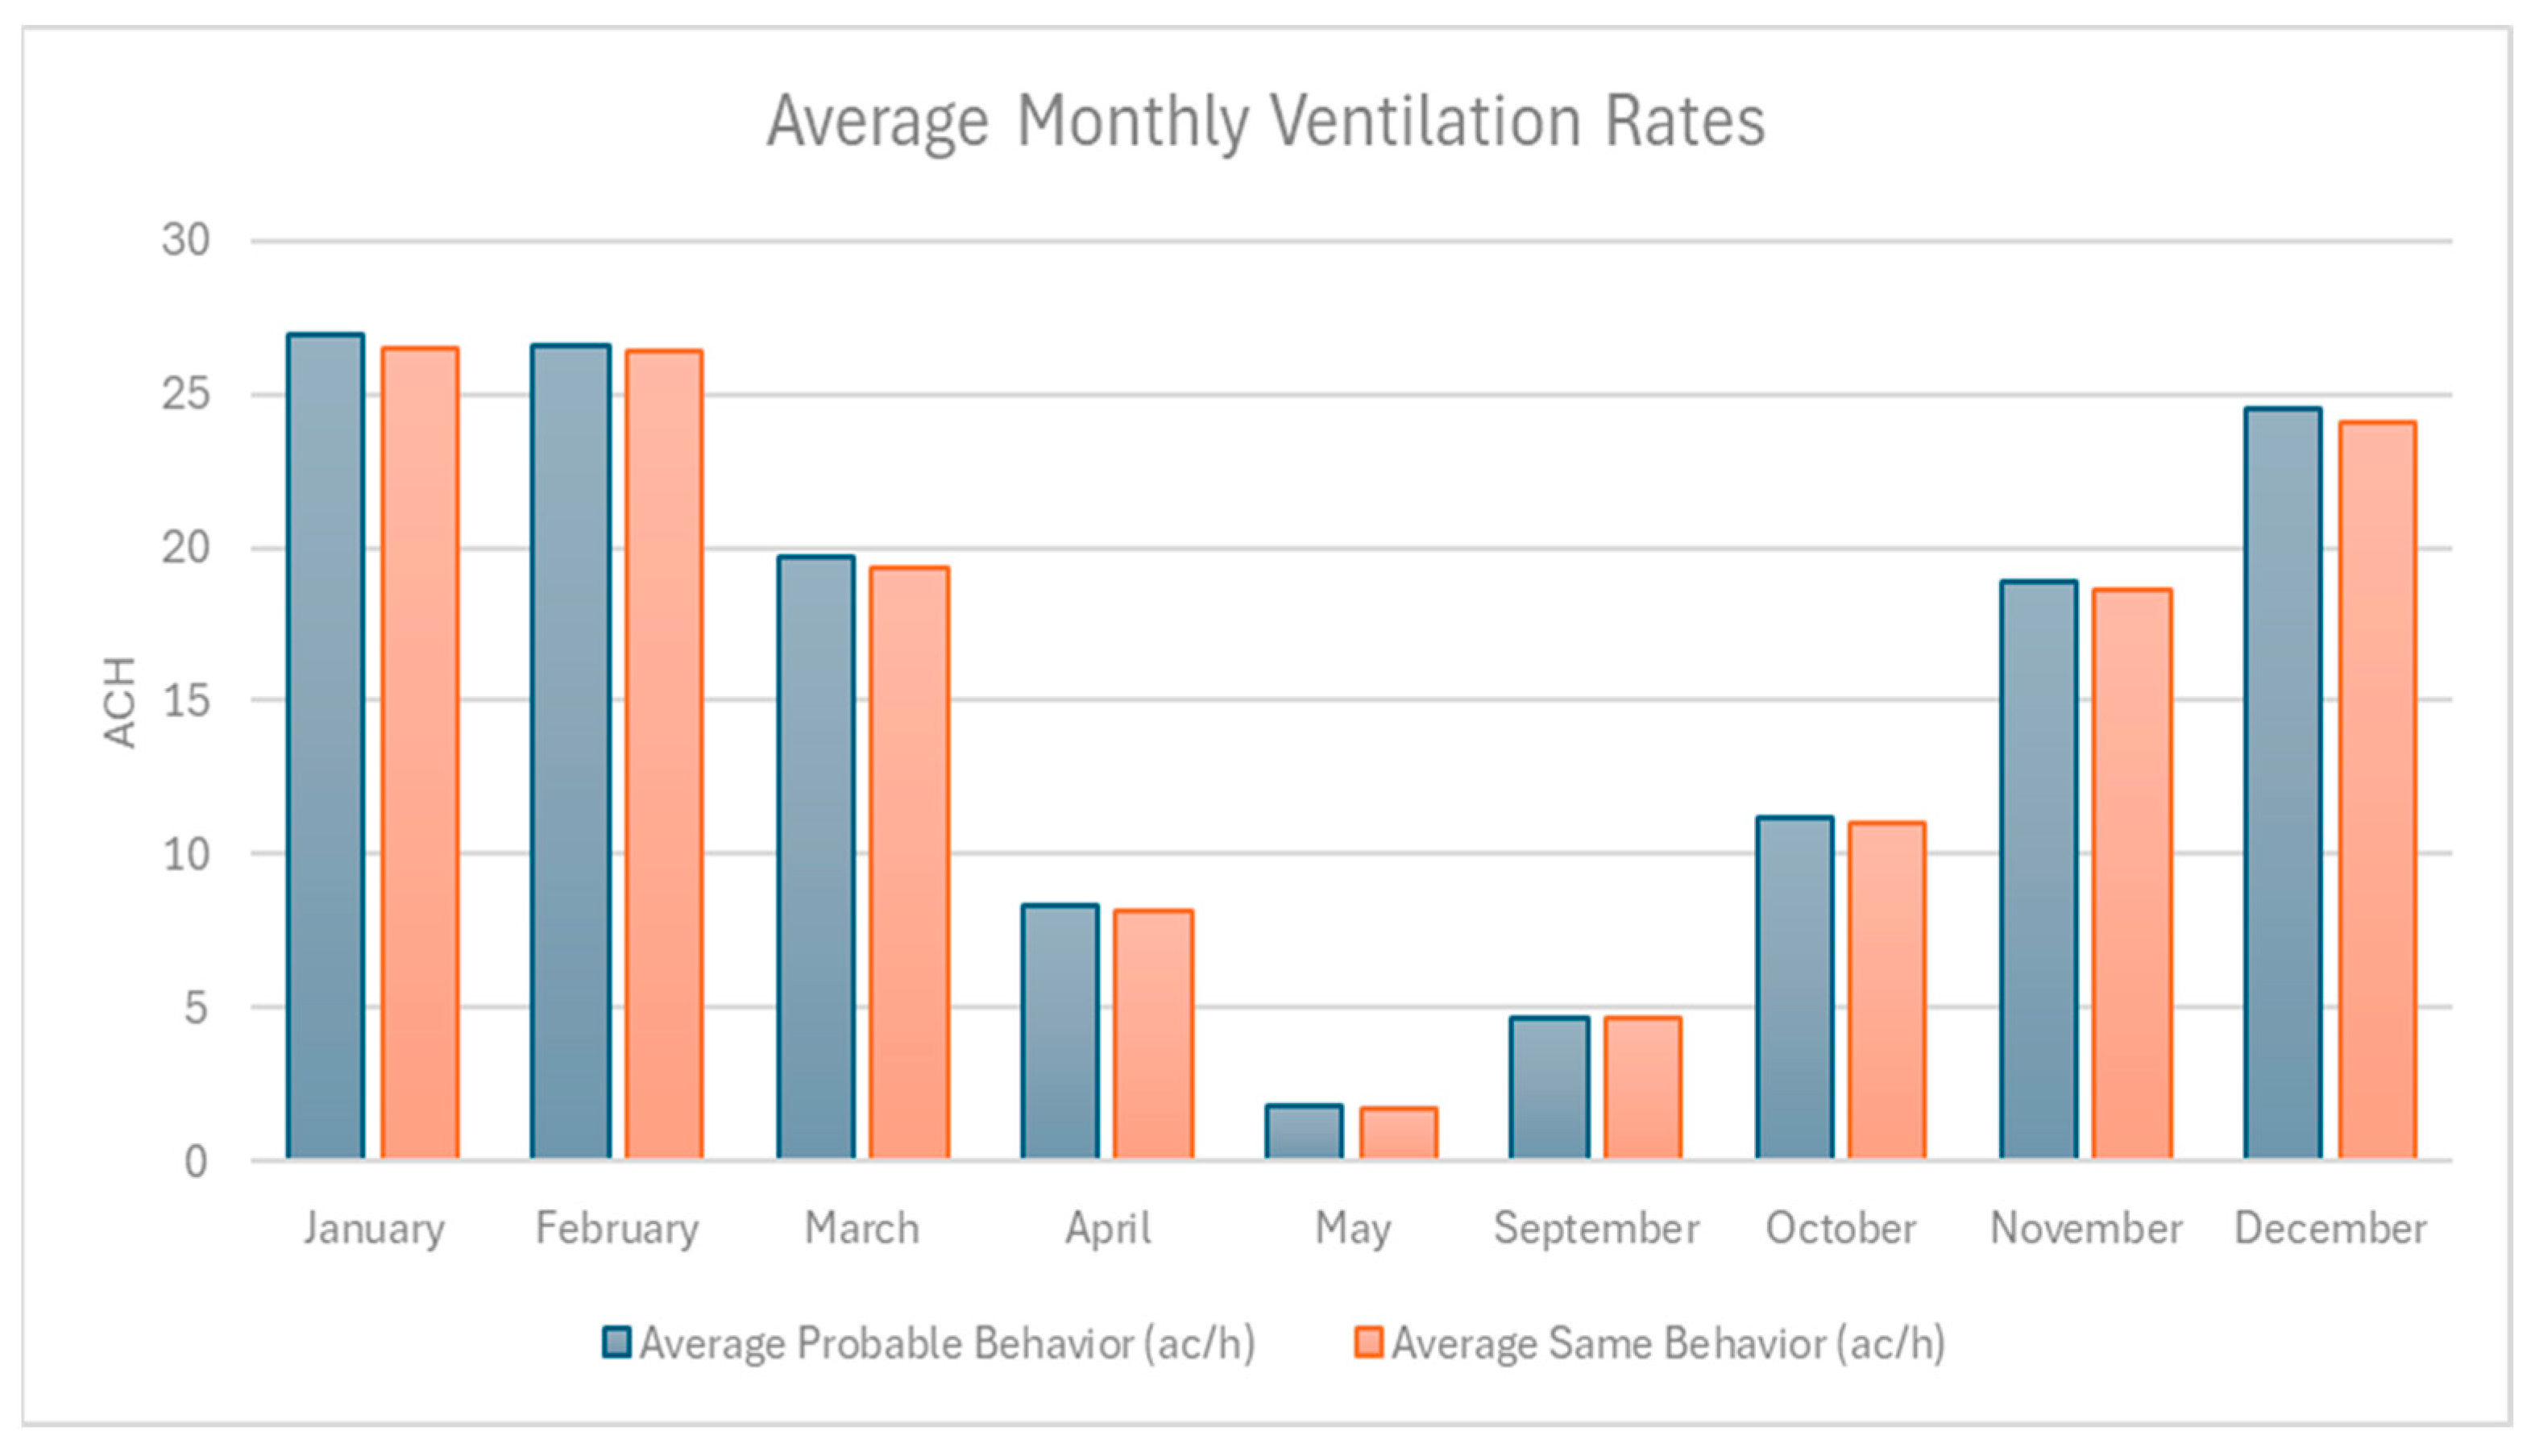
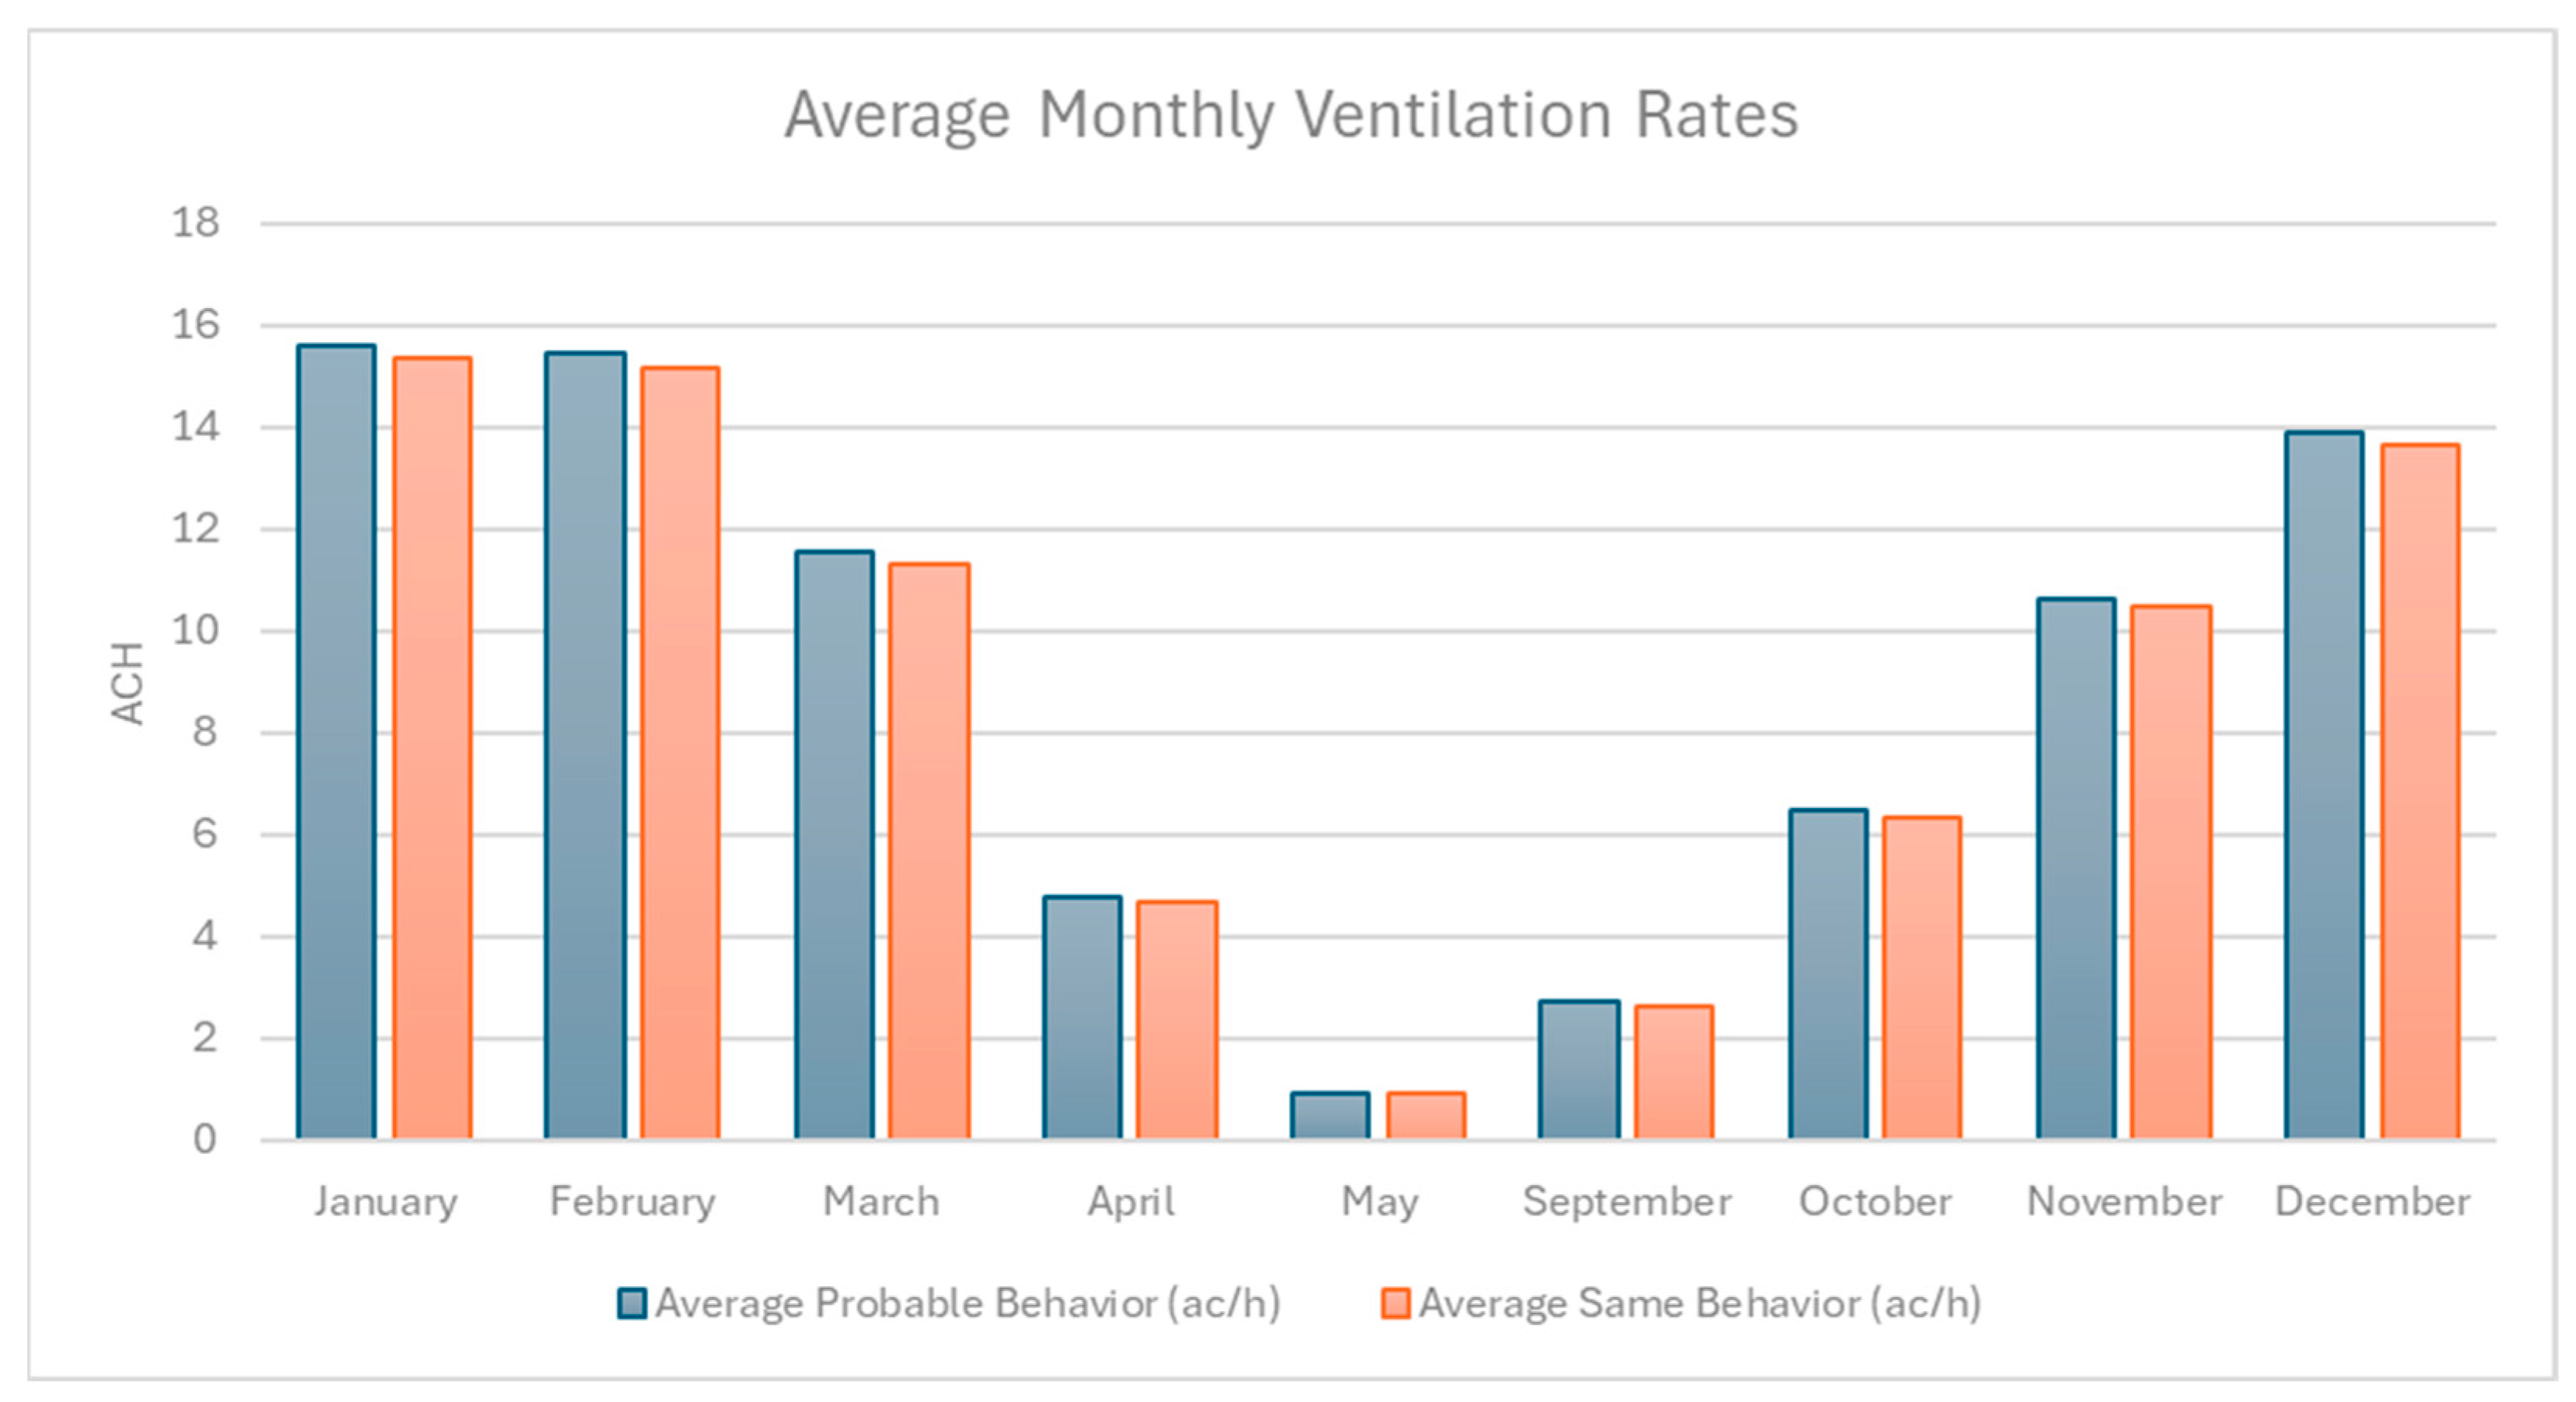
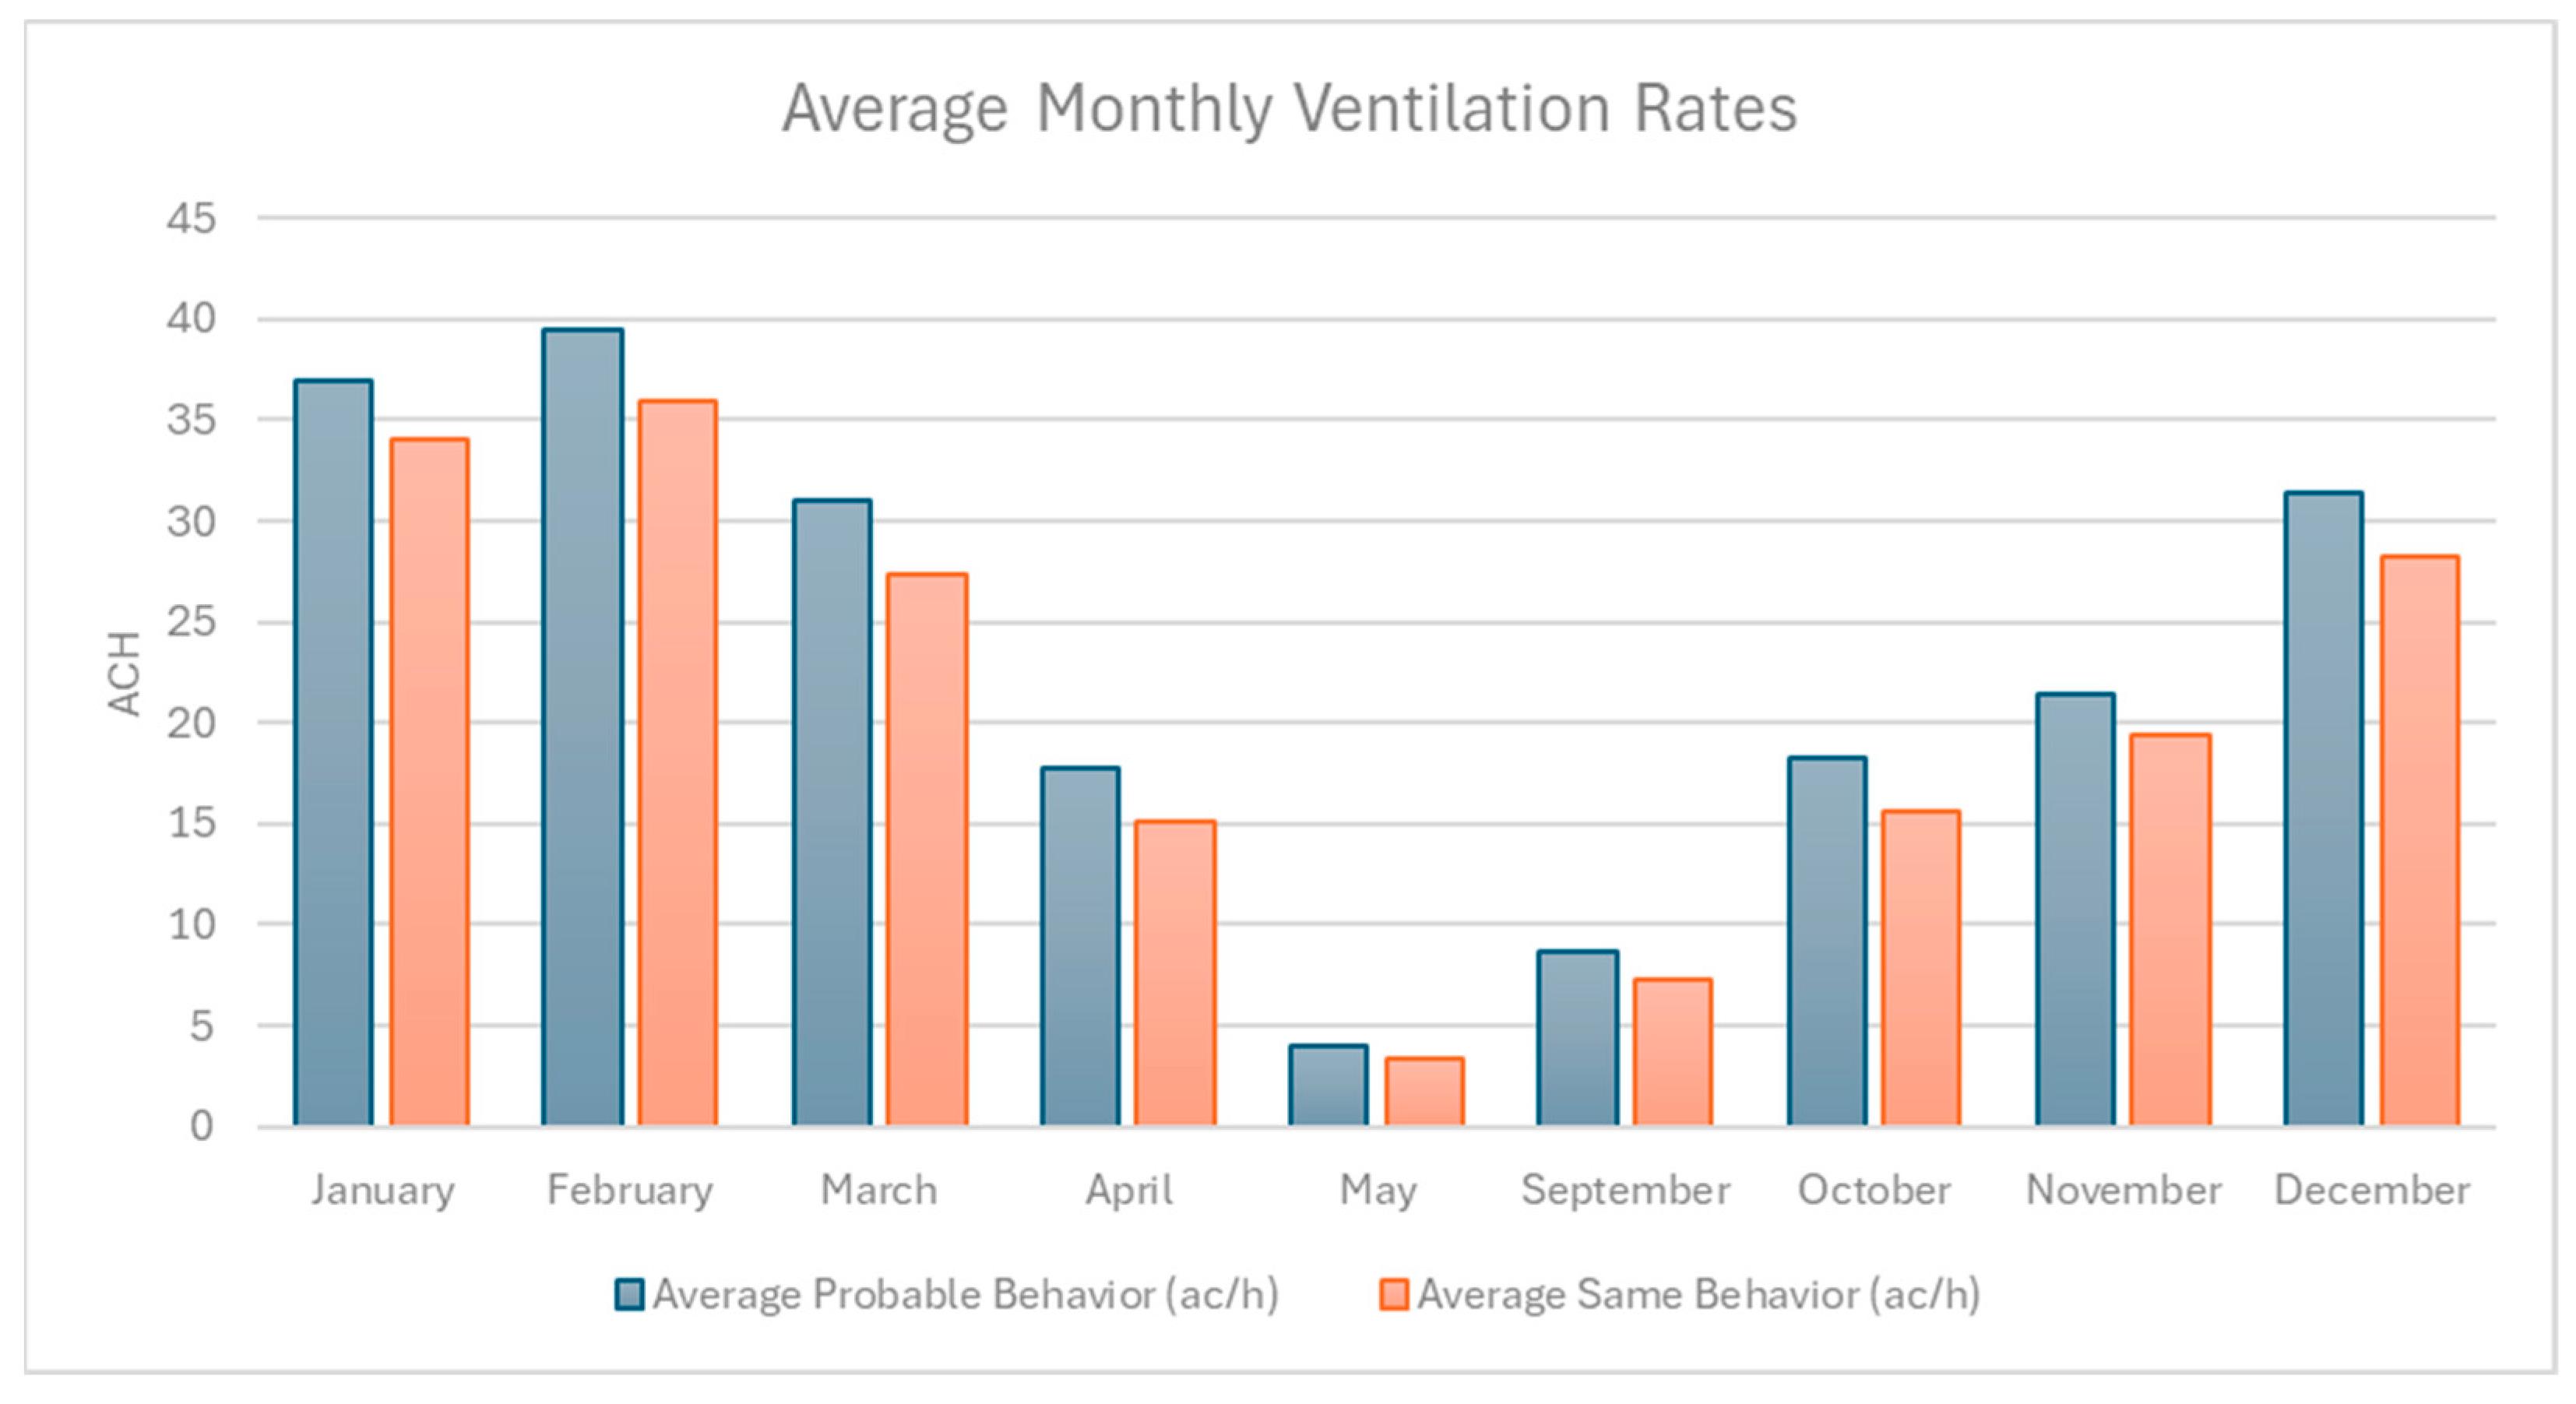
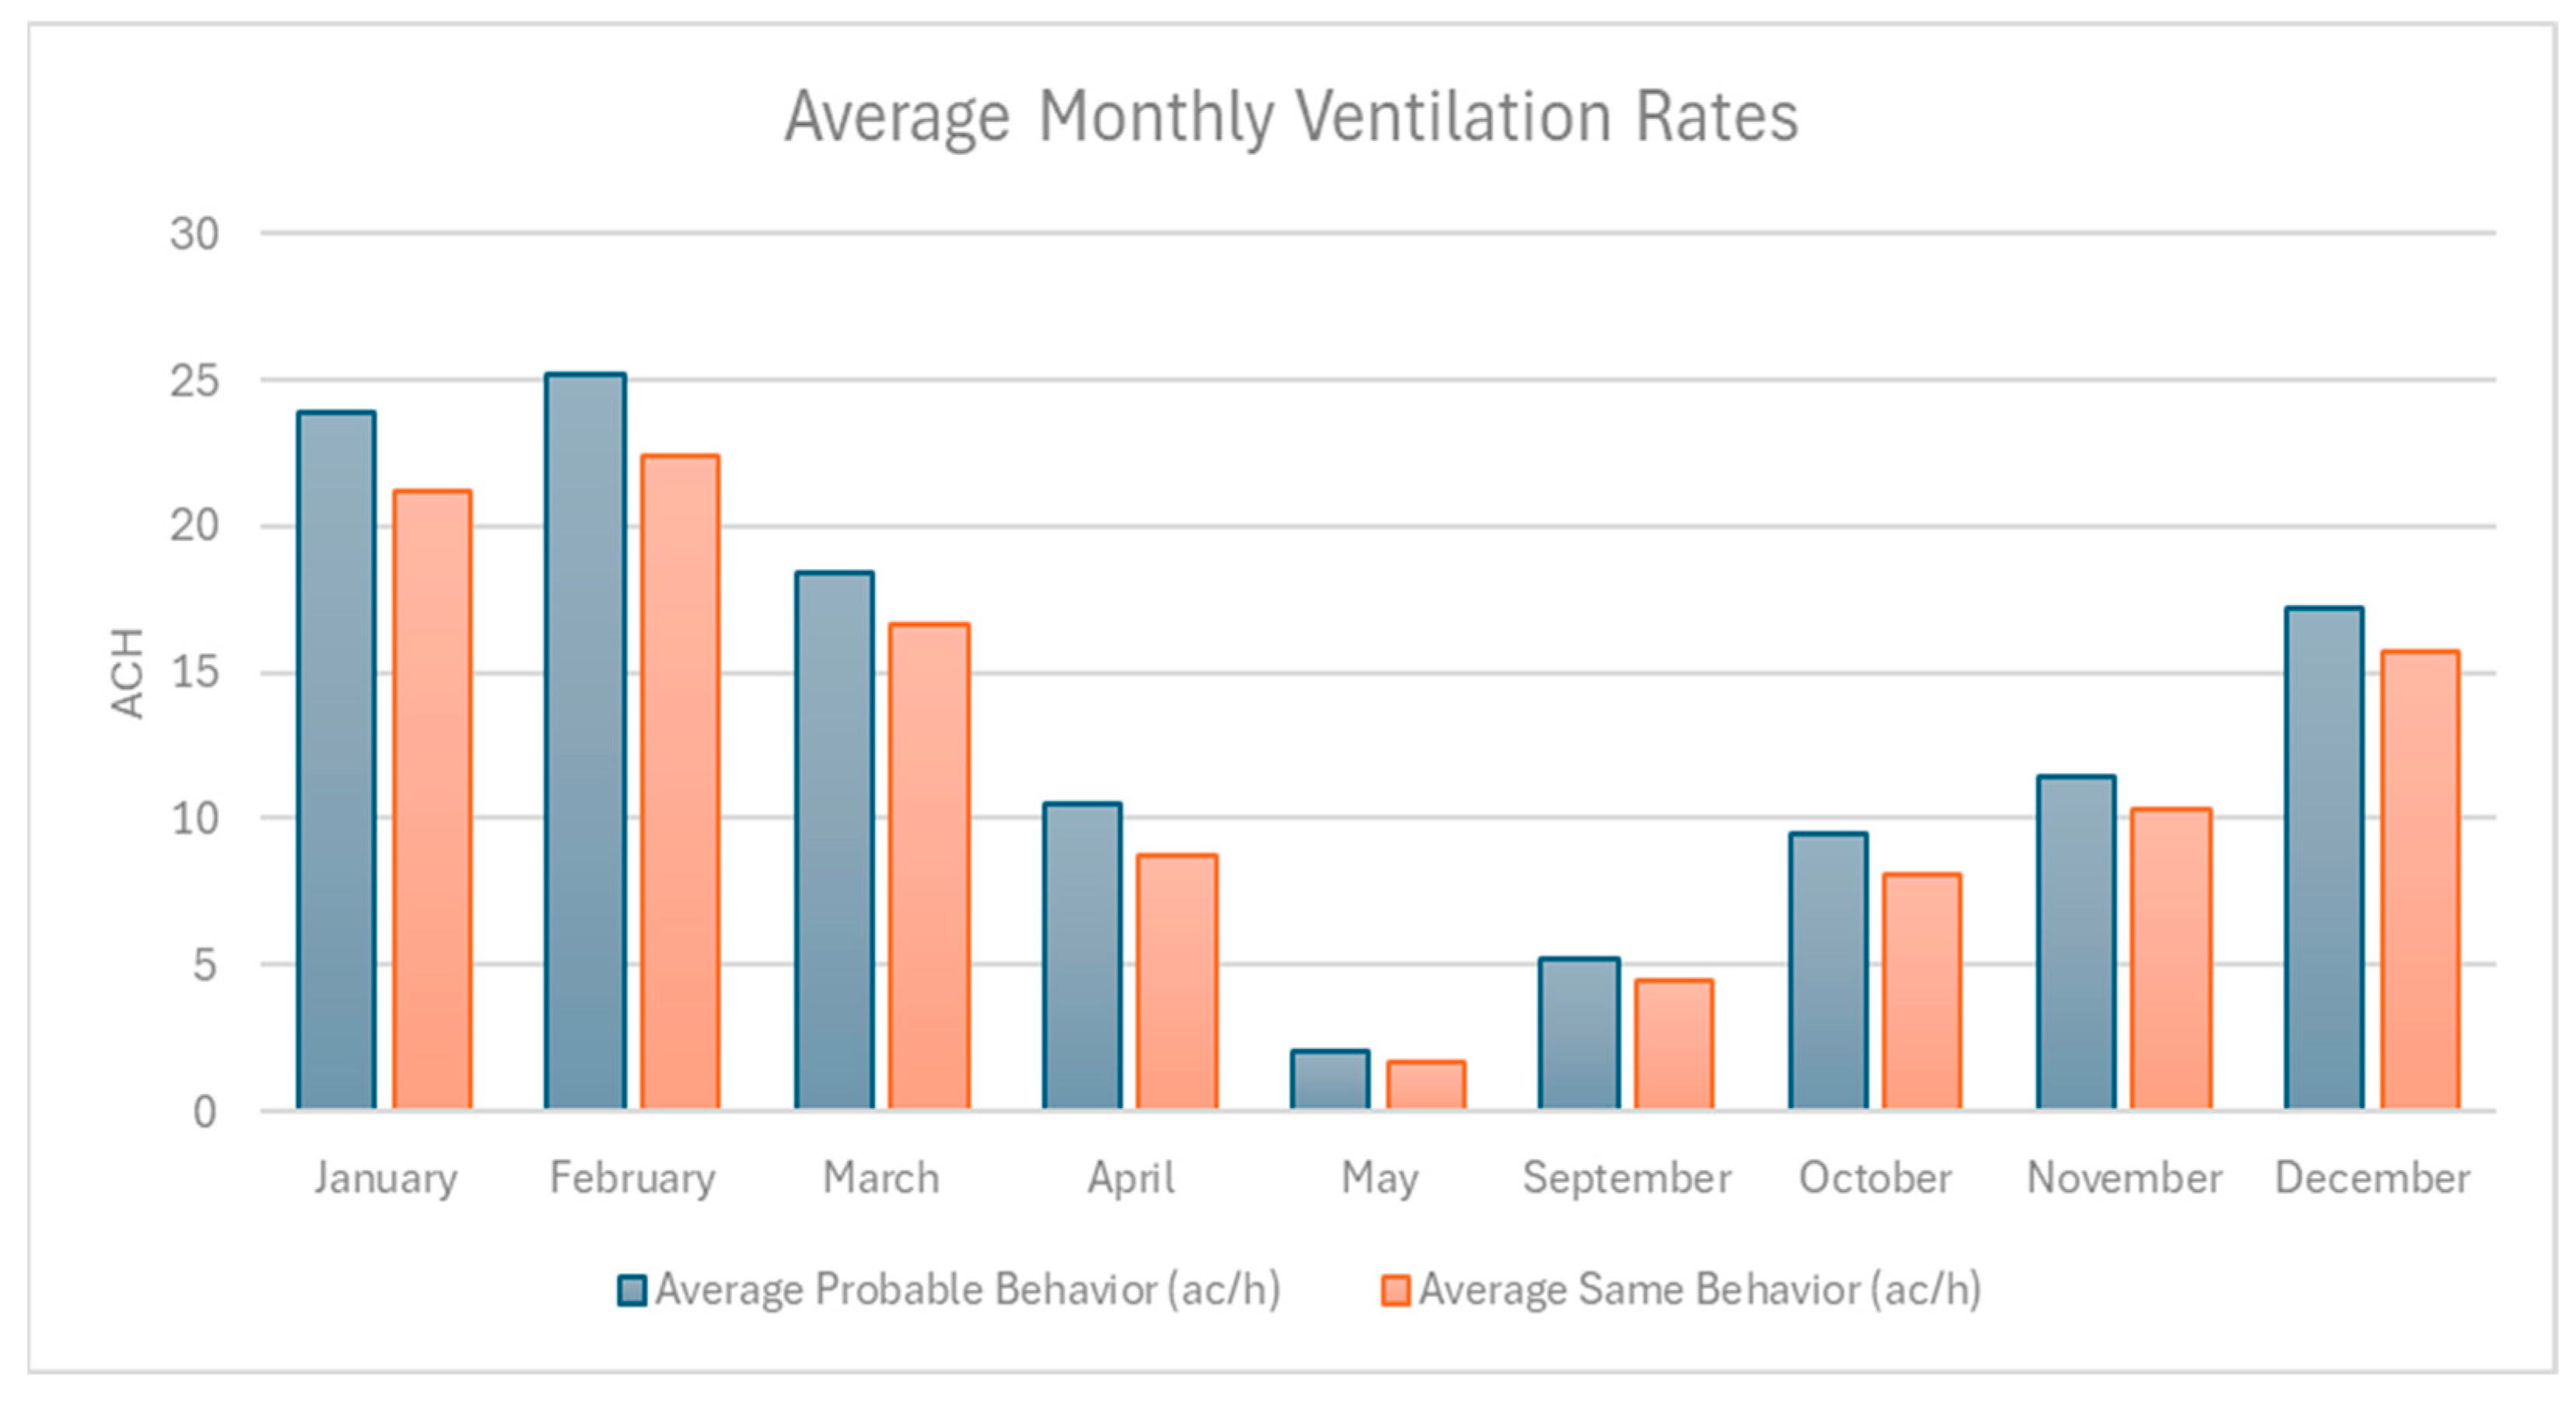
| Story 1 | North |  |  | Regular morning and evening openings. | On wider walls, it increases morning openings for wind; on smaller walls, less frequent due to limited airflow. |
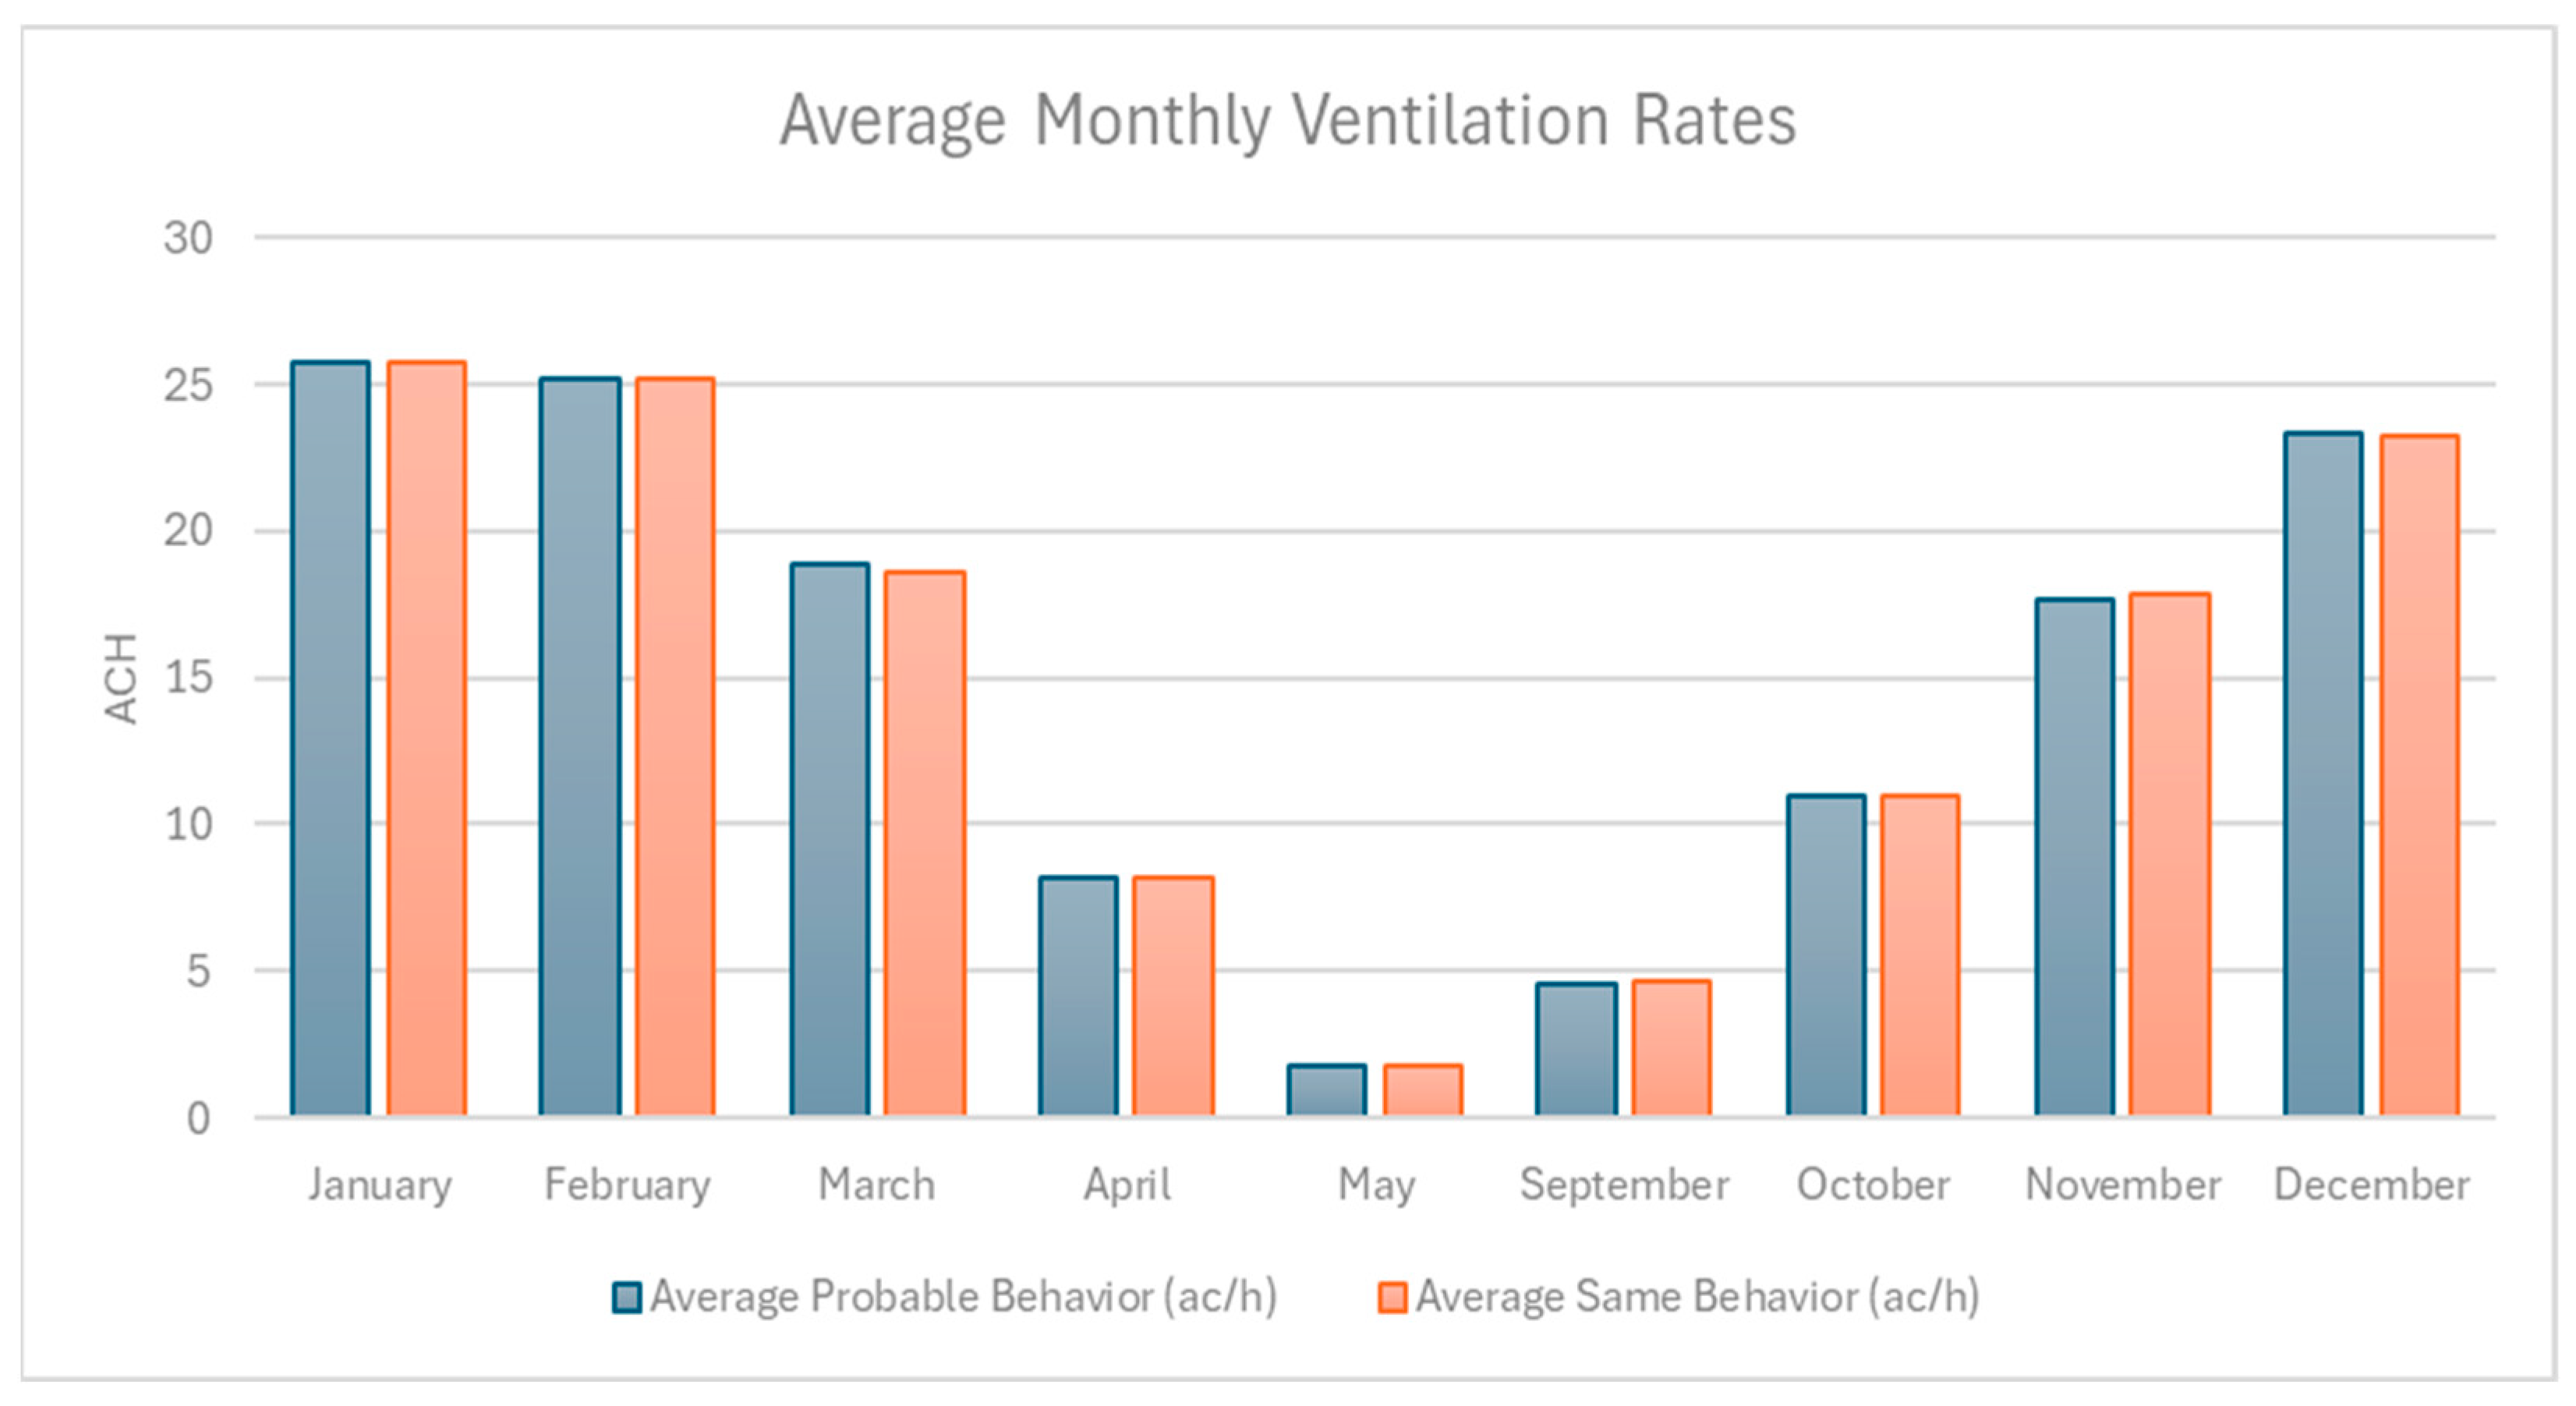
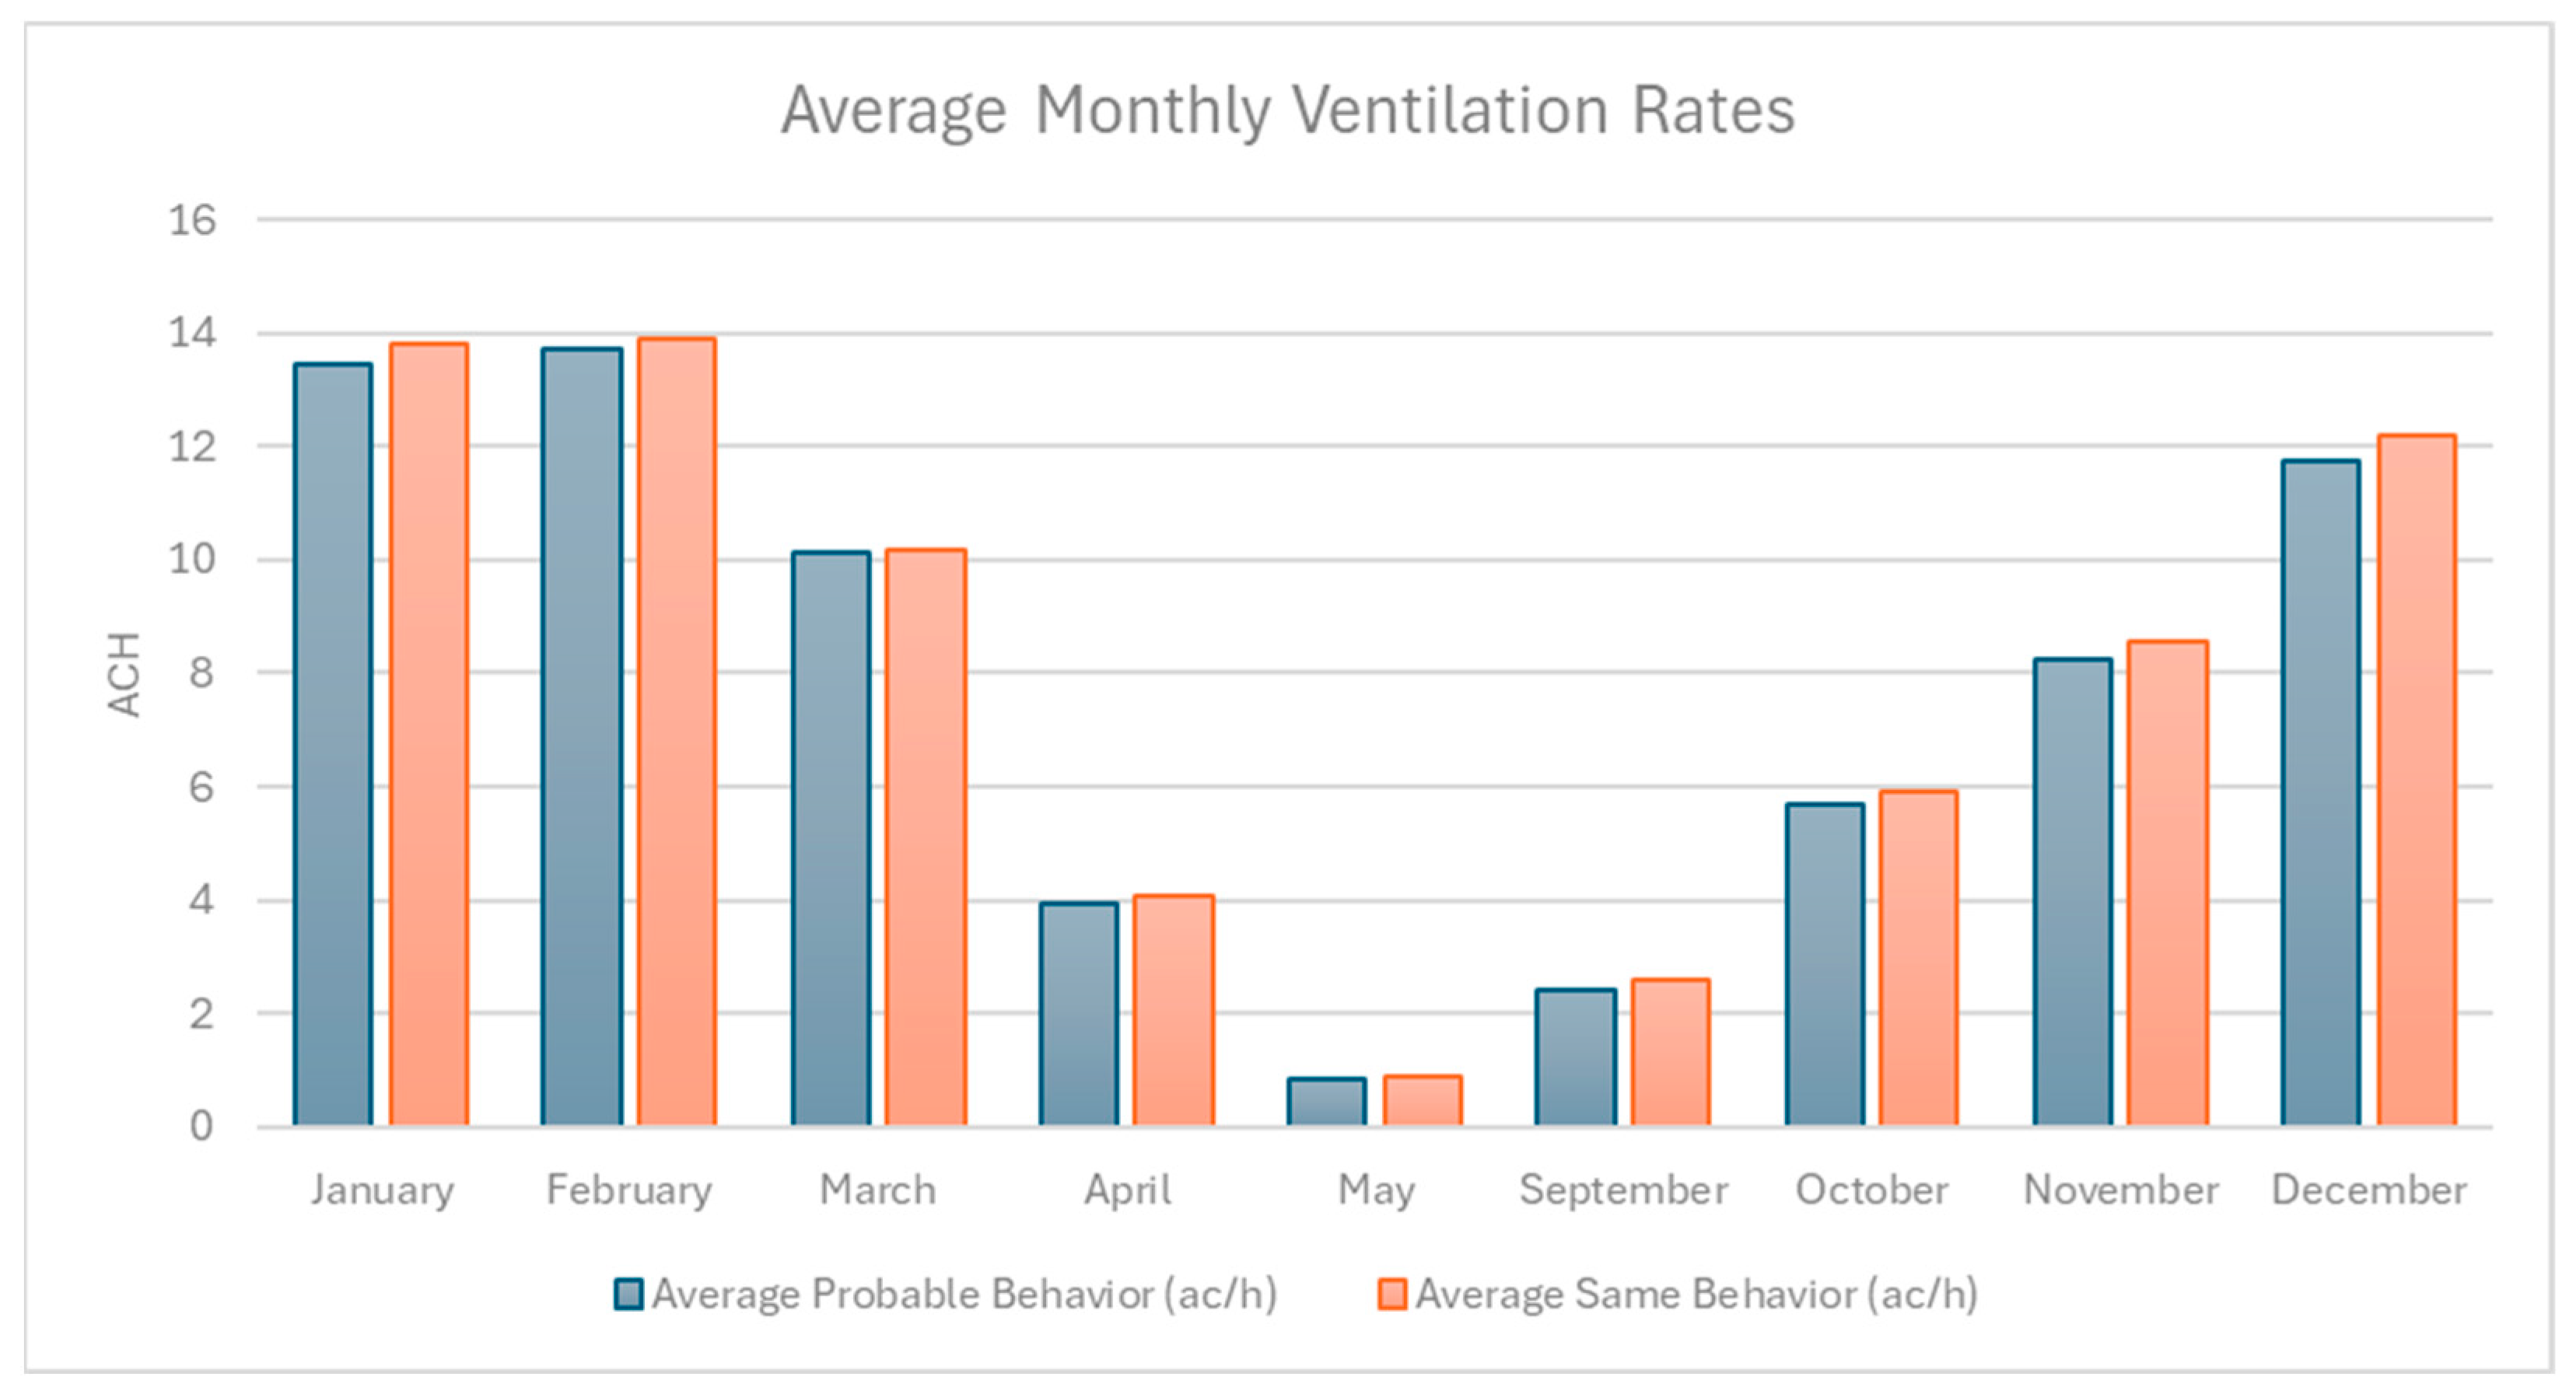
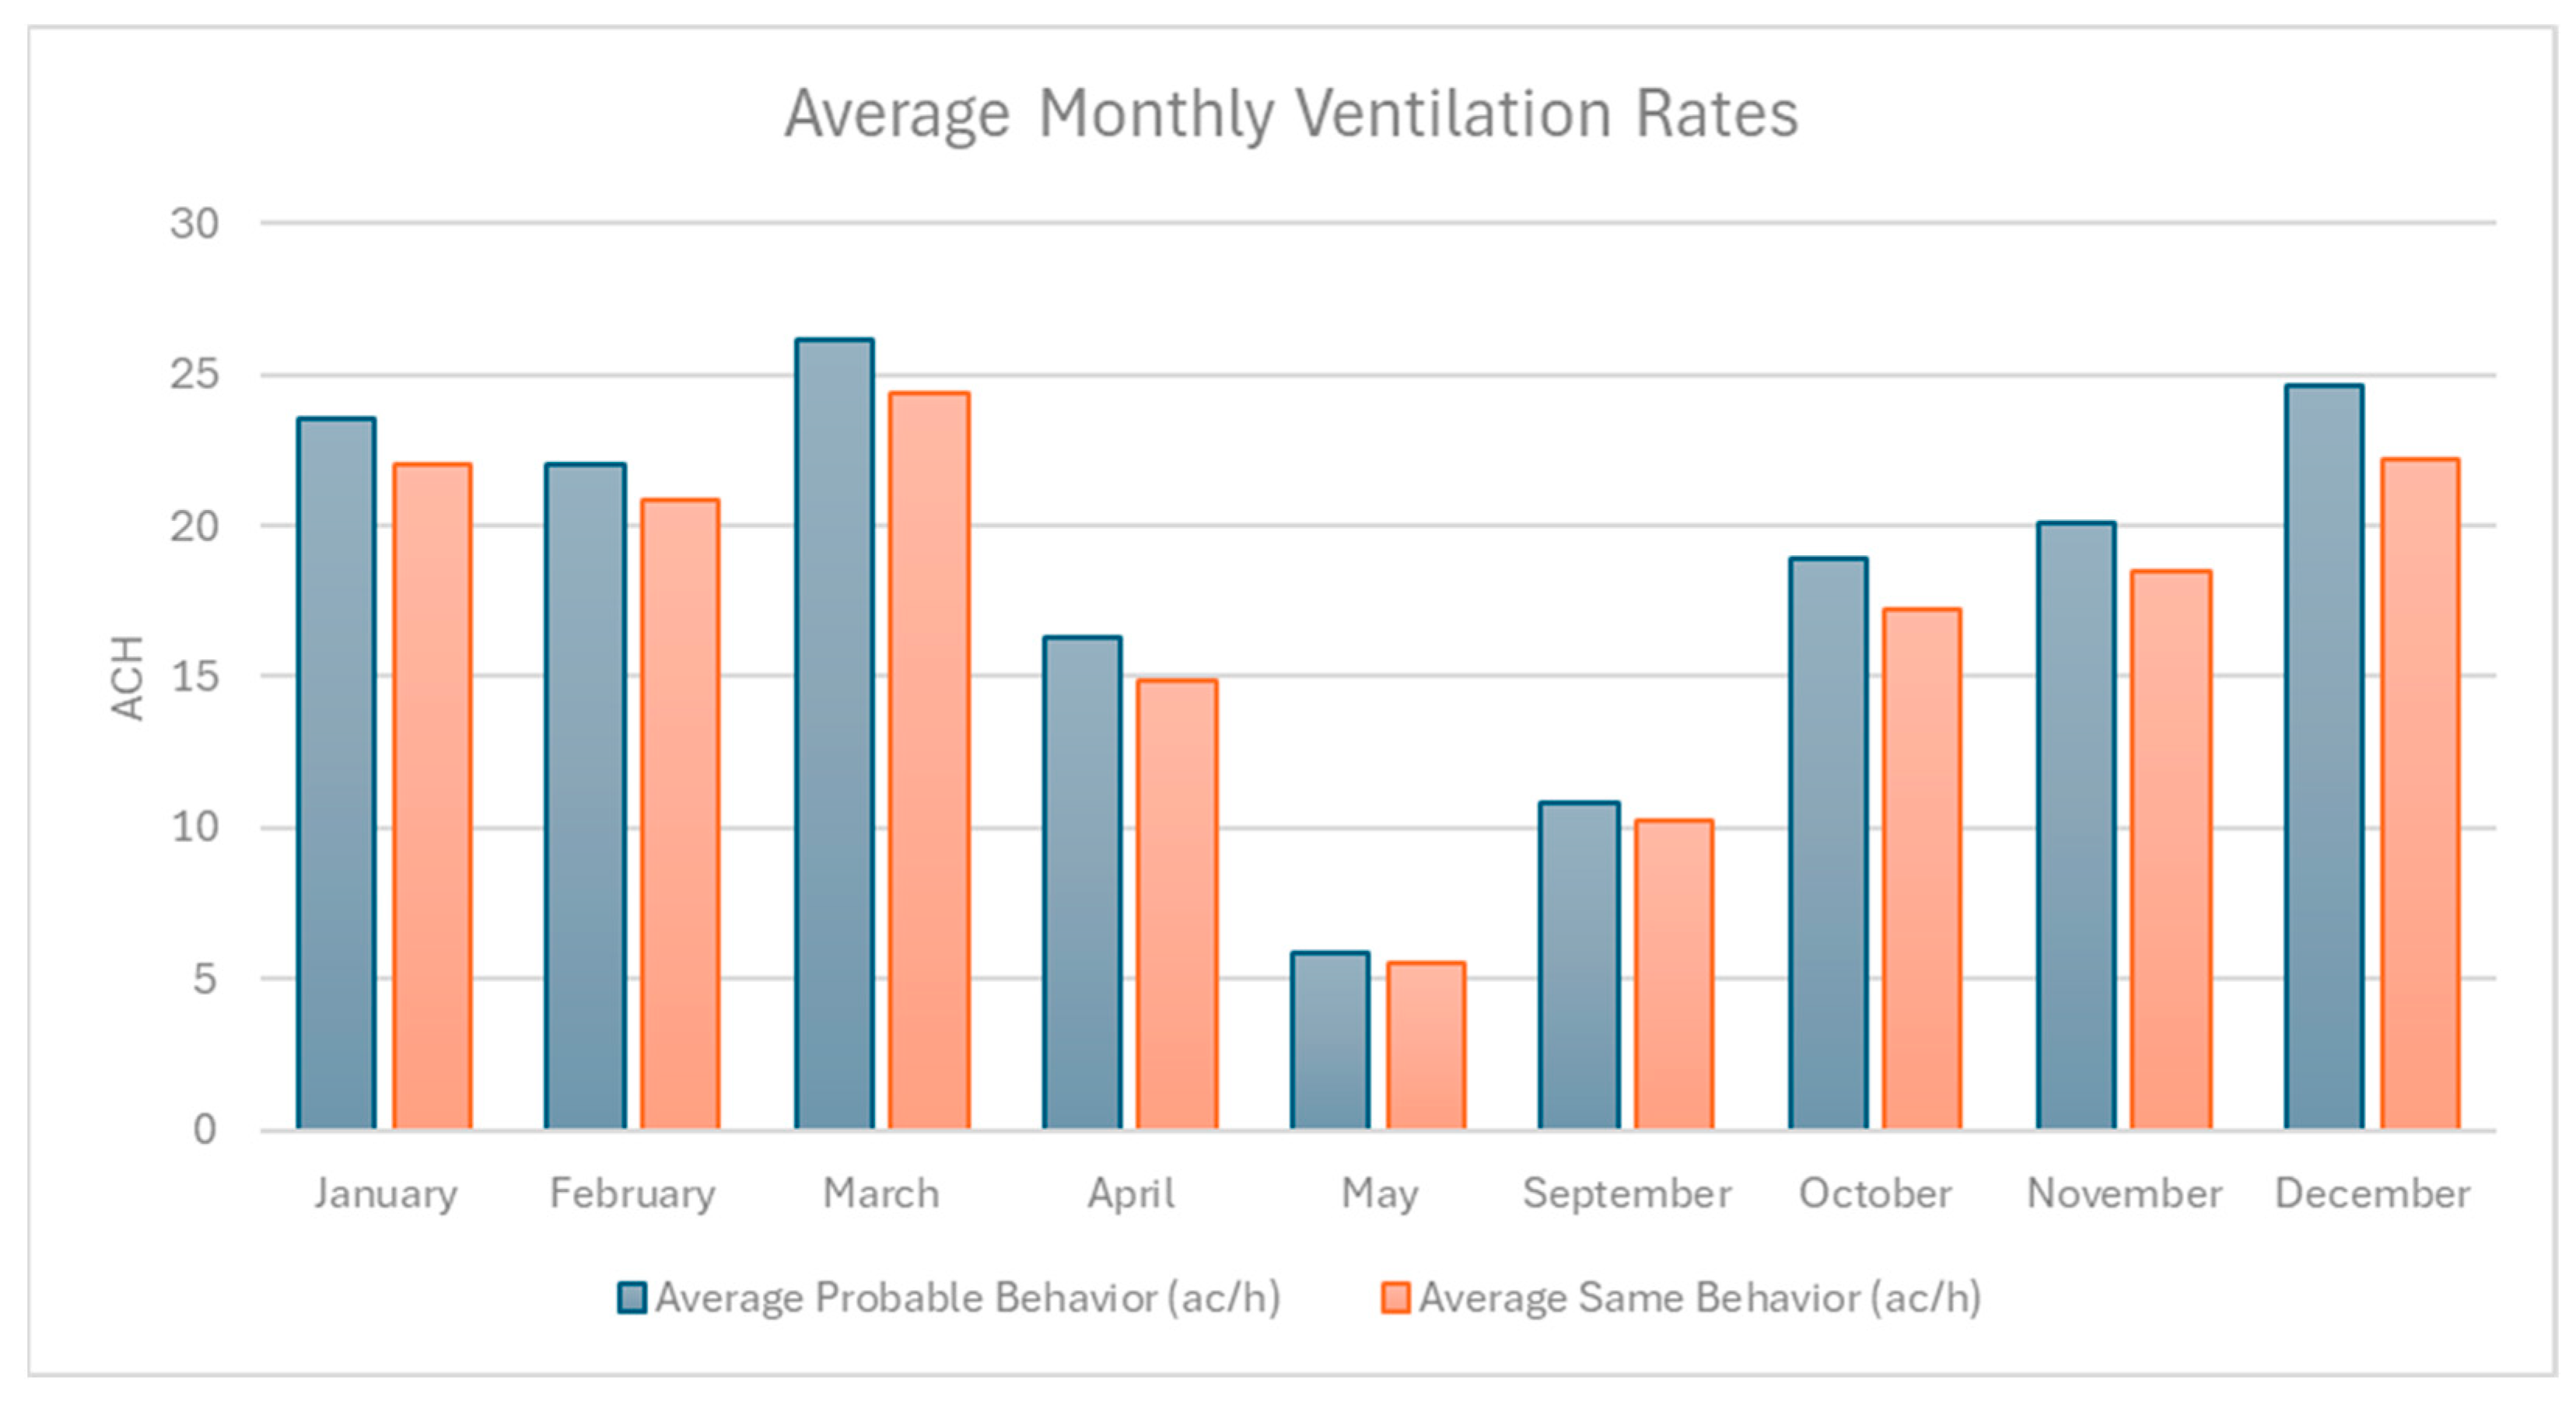
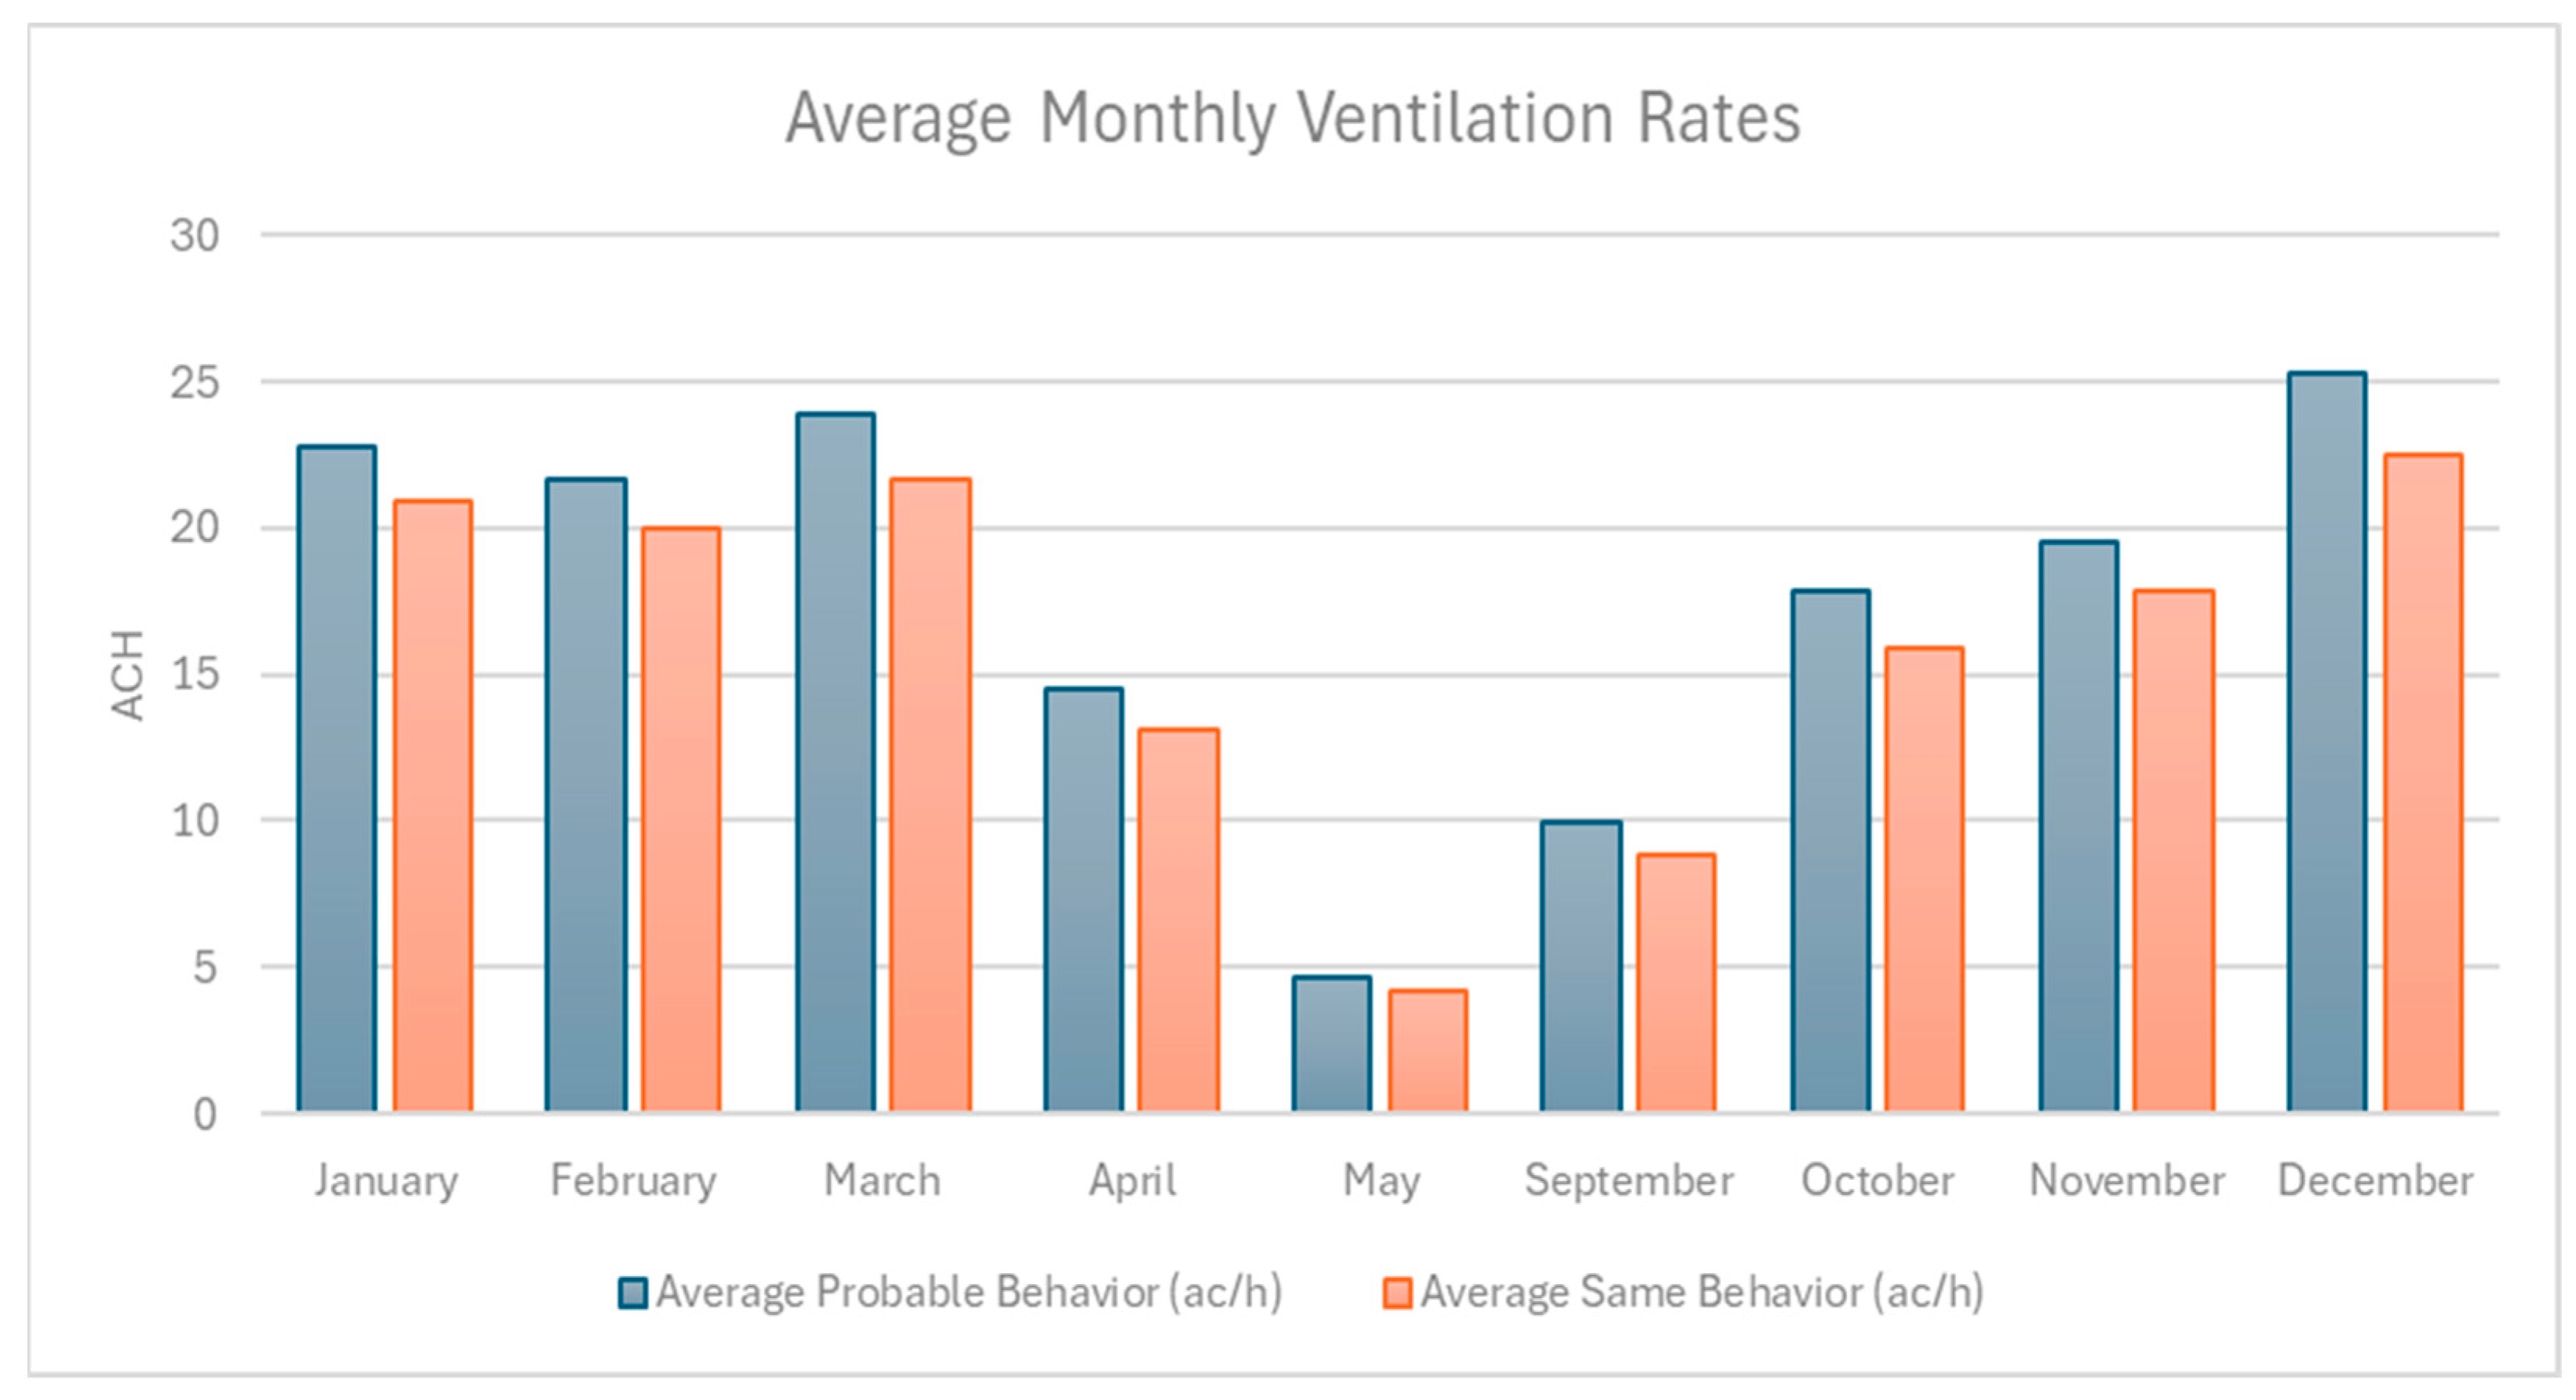
| Story 2 | East and west |  |  | Morning openings (east), evening openings (west). | On wider walls, boosts east morning openings for light; on smaller walls, reduces west midday openings for heat control. |
| Story 3 | South |  |  | Less frequent openings due to limited wind exposure. | On wider walls, reduce midday openings to manage heat; on smaller walls, further limited due to weaker ventilation potential. |
| Story 4 | North and south |  |  | Frequent openings for cross-ventilation, especially mornings. | On wider walls, enhances morning cross-ventilation; on smaller walls, reduces south midday openings for heat control. |
| Story 5 | North–east |  |  | East morning openings for light, north for steady ventilation. | On wider walls, boosts east morning openings; on smaller walls, adjusts north for consistent airflow throughout the day. |
| Config | Window 1 (H × W, m) | Window 2 (H × W, m) | Ventilation/Lighting Impact |
|---|---|---|---|
| 1 | 2.4 × 1.70 | 2.4 × 1.70 | Maximizes daylight penetration; high ACH due to tall windows. |
| 2 | 2.2 × 1.85 | 2.4 × 1.85 | Proportional windows enhance light uniformity and cross-ventilation. |
| 3 | 2.0 × 2.05 | 2.0 × 2.05 | Balanced dimensions for airflow and daylight; moderate ACH. |
| 4 | 1.8 × 2.30 | 1.8 × 2.30 | Wider windows spread horizontal daylight; good ventilation. |
| 5 | 1.5 × 2.70 | 1.5 × 2.70 | Shorter windows reduce glare; lower ACH due to height. |
| 6 | 1.6 × 3.4 | 1.6 × 1.7 | Wider Window 1 boosts ventilation; Window 2 aids flexibility. |
| 7 | 1.6 × 2.05 | 1.6 × 3.05 | Wider Window 2 enhances light spread; balanced airflow. |
| Config | Window 1 (H × W, m) | Window 2 (H × W, m) | Ventilation/Lighting Impact |
|---|---|---|---|
| 9 | 2.4 × 1.10 | 2.4 × 1.10 | Tall windows maximize vertical daylight; high ACH. |
| 10 | 2.0 × 1.3 | 2.0 × 1.3 | Balanced dimensions optimize ventilation and lighting. |
| 11 | 1.8 × 1.45 | 1.8 × 1.45 | Wider windows emphasize horizontal daylight spread. |
| 12 | 1.5 × 1.75 | 1.5 × 1.75 | Shorter windows reduce glare; focus on horizontal daylight. |
| 13 | 2.2 × 1.20 | 2.2 × 1.20 | Proportional windows ensure symmetrical lighting; good ACH. |
| 14 | 1.6 × 1.1 | 1.6 × 2.2 | Wider Window 2 boosts light and ventilation; Window 1 complements. |
| 15 | 1.6 × 1.3 | 1.6 × 2.0 | Wider Window 2 enhances horizontal daylight; steady airflow. |
| Configuration | Peak (ACH) (Month) | Lowest (ACH) (Month) | Average (ACH) |
|---|---|---|---|
| 1 | 4.67 (March) | 1.95 (May) | 3.47 |
| 2 | 4.52 (March) | 1.89 (May) | 3.36 |
| 3 | 4.40 (March) | 1.89 (May) | 3.31 |
| 4 | 4.31 (March) | 1.86 (May) | 3.23 |
| 5 | 3.95 (March) | 1.72 (May) | 2.97 |
| 6 | 4.06 (March) | 1.78 (May) | 3.06 |
| 7 | 4.06 (March) | 1.77 (May) | 3.06 |
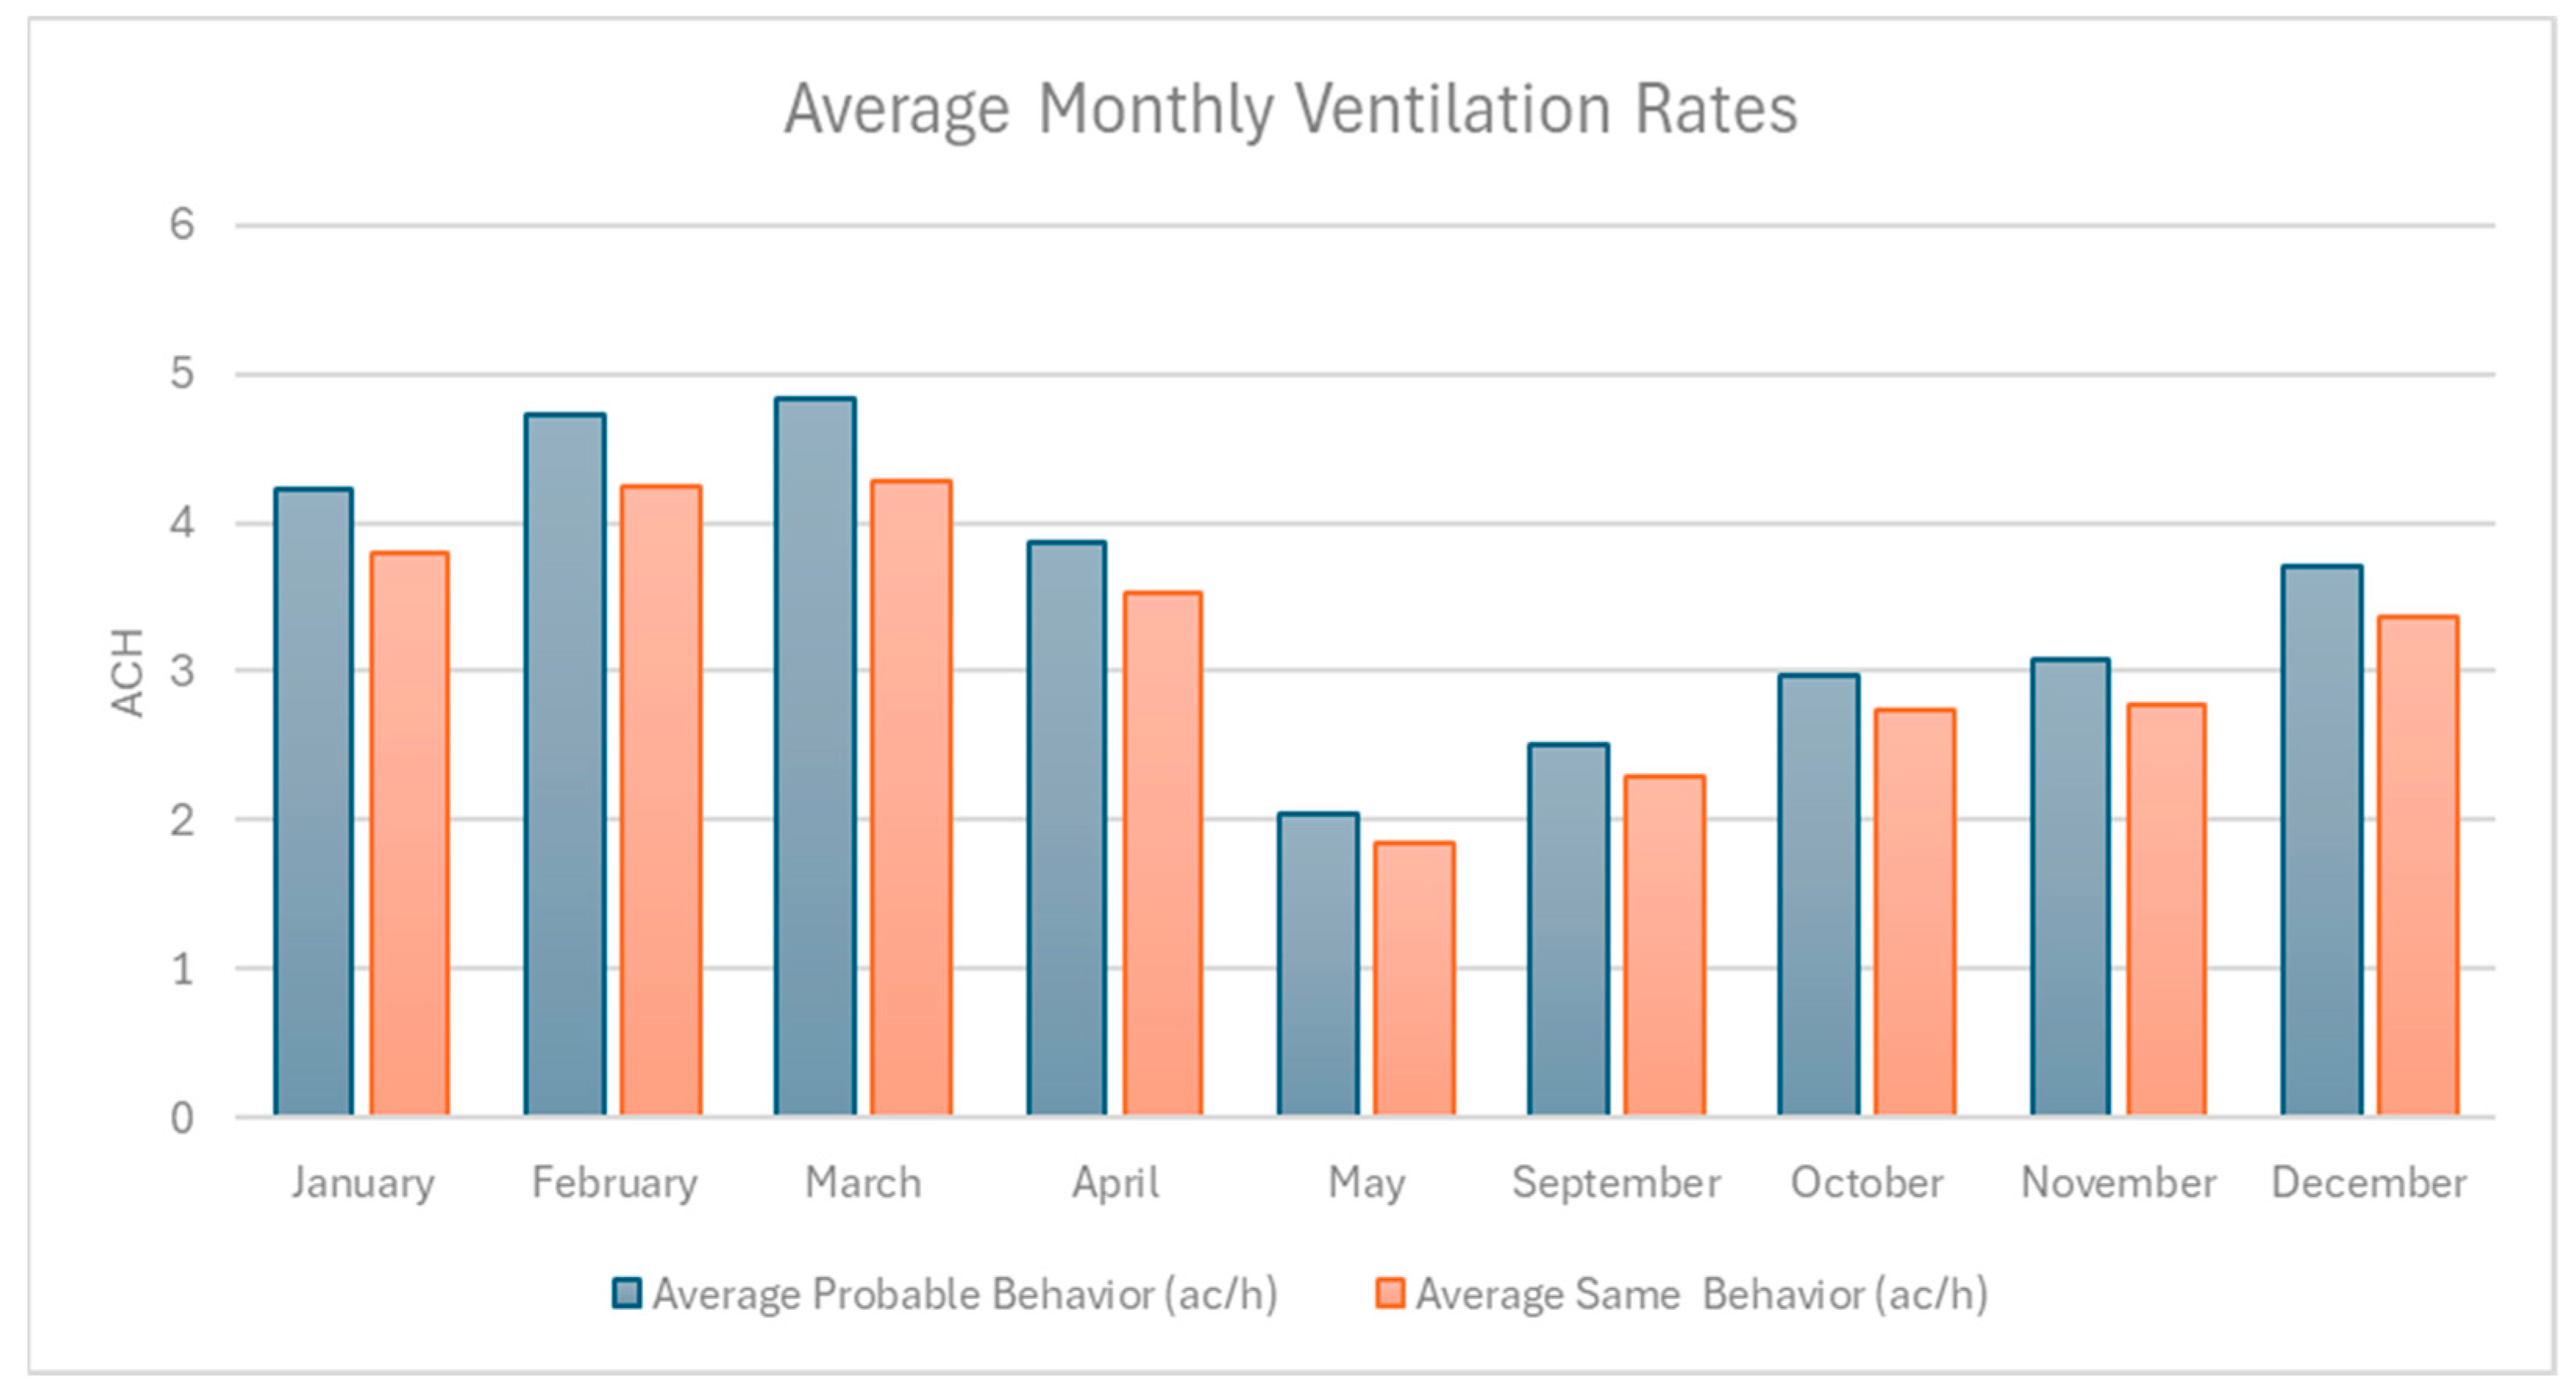
| Month | Highest NV Probable (ACH) (Config.) | Lowest NV Probable (ACH) (Config.) | Avg. NV Same (ACH) | Avg. NV Probable (ACH) | % Change | Avg. Solar Gain (kWh) | Peak Solar Gain (kWh) (Config.) | Lowest Solar Gain (kWh) (Config.) |
|---|---|---|---|---|---|---|---|---|
| Jan | 4.12 (1) | 3.49 (5) | 3.80 | 4.23 | +11.2% | 228.15 | 238.93 (4) | 219.66 (1) |
| Feb | 4.63 (1) | 3.90 (5) | 4.24 | 4.72 | +11.3% | 235.29 | 275.27 (4) | 219.66 (1) |
| Mar | 4.67 (1) | 3.95 (5) | 4.28 | 4.83 | +12.7% | 294.62 | 408.14 (4) | 219.66 (1) |
| Apr | 3.80 (1) | 3.27 (5) | 3.52 | 3.86 | +9.6% | 291.09 | 404.11 (4) | 219.66 (1) |
| May | 1.95 (1) | 1.72 (5) | 1.84 | 2.05 | +11.3% | 298.98 | 436.76 (4) | 219.66 (1) |
| Sep | 2.41 (1) | 2.16 (5) | 2.29 | 2.51 | +9.5% | 237.18 | 404.32 (4) | 219.66 (1) |
| Oct | 2.92 (1) | 2.55 (5) | 2.74 | 2.97 | +8.7% | 246.09 | 336.10 (4) | 219.66 (1) |
| Nov | 3.00 (1) | 2.60 (5) | 2.78 | 3.08 | +10.8% | 228.13 | 242.85 (4) | 219.66 (1) |
| Dec | 3.67 (1) | 3.13 (5) | 3.37 | 3.70 | +9.6% | 223.04 | 223.81 (4) | 219.52 (2) |
| Configuration | Peak (ACH) (Month) | Lowest (ACH) (Month) | Average (ACH) |
|---|---|---|---|
| 9 | 2.86 (February) | 1.00 (May) | 2.09 |
| 10 | 2.67 (February) | 0.96 (May) | 1.97 |
| 11 | 2.58 (February) | 0.95 (May) | 1.92 |
| 12 | 2.44 (February) | 0.92 (May) | 1.84 |
| 13 | 2.79 (February) | 1.00 (May) | 2.06 |
| 14 | 2.52 (February) | 0.95 (May) | 1.89 |
| 15 | 2.52 (February) | 0.94 (May) | 1.89 |
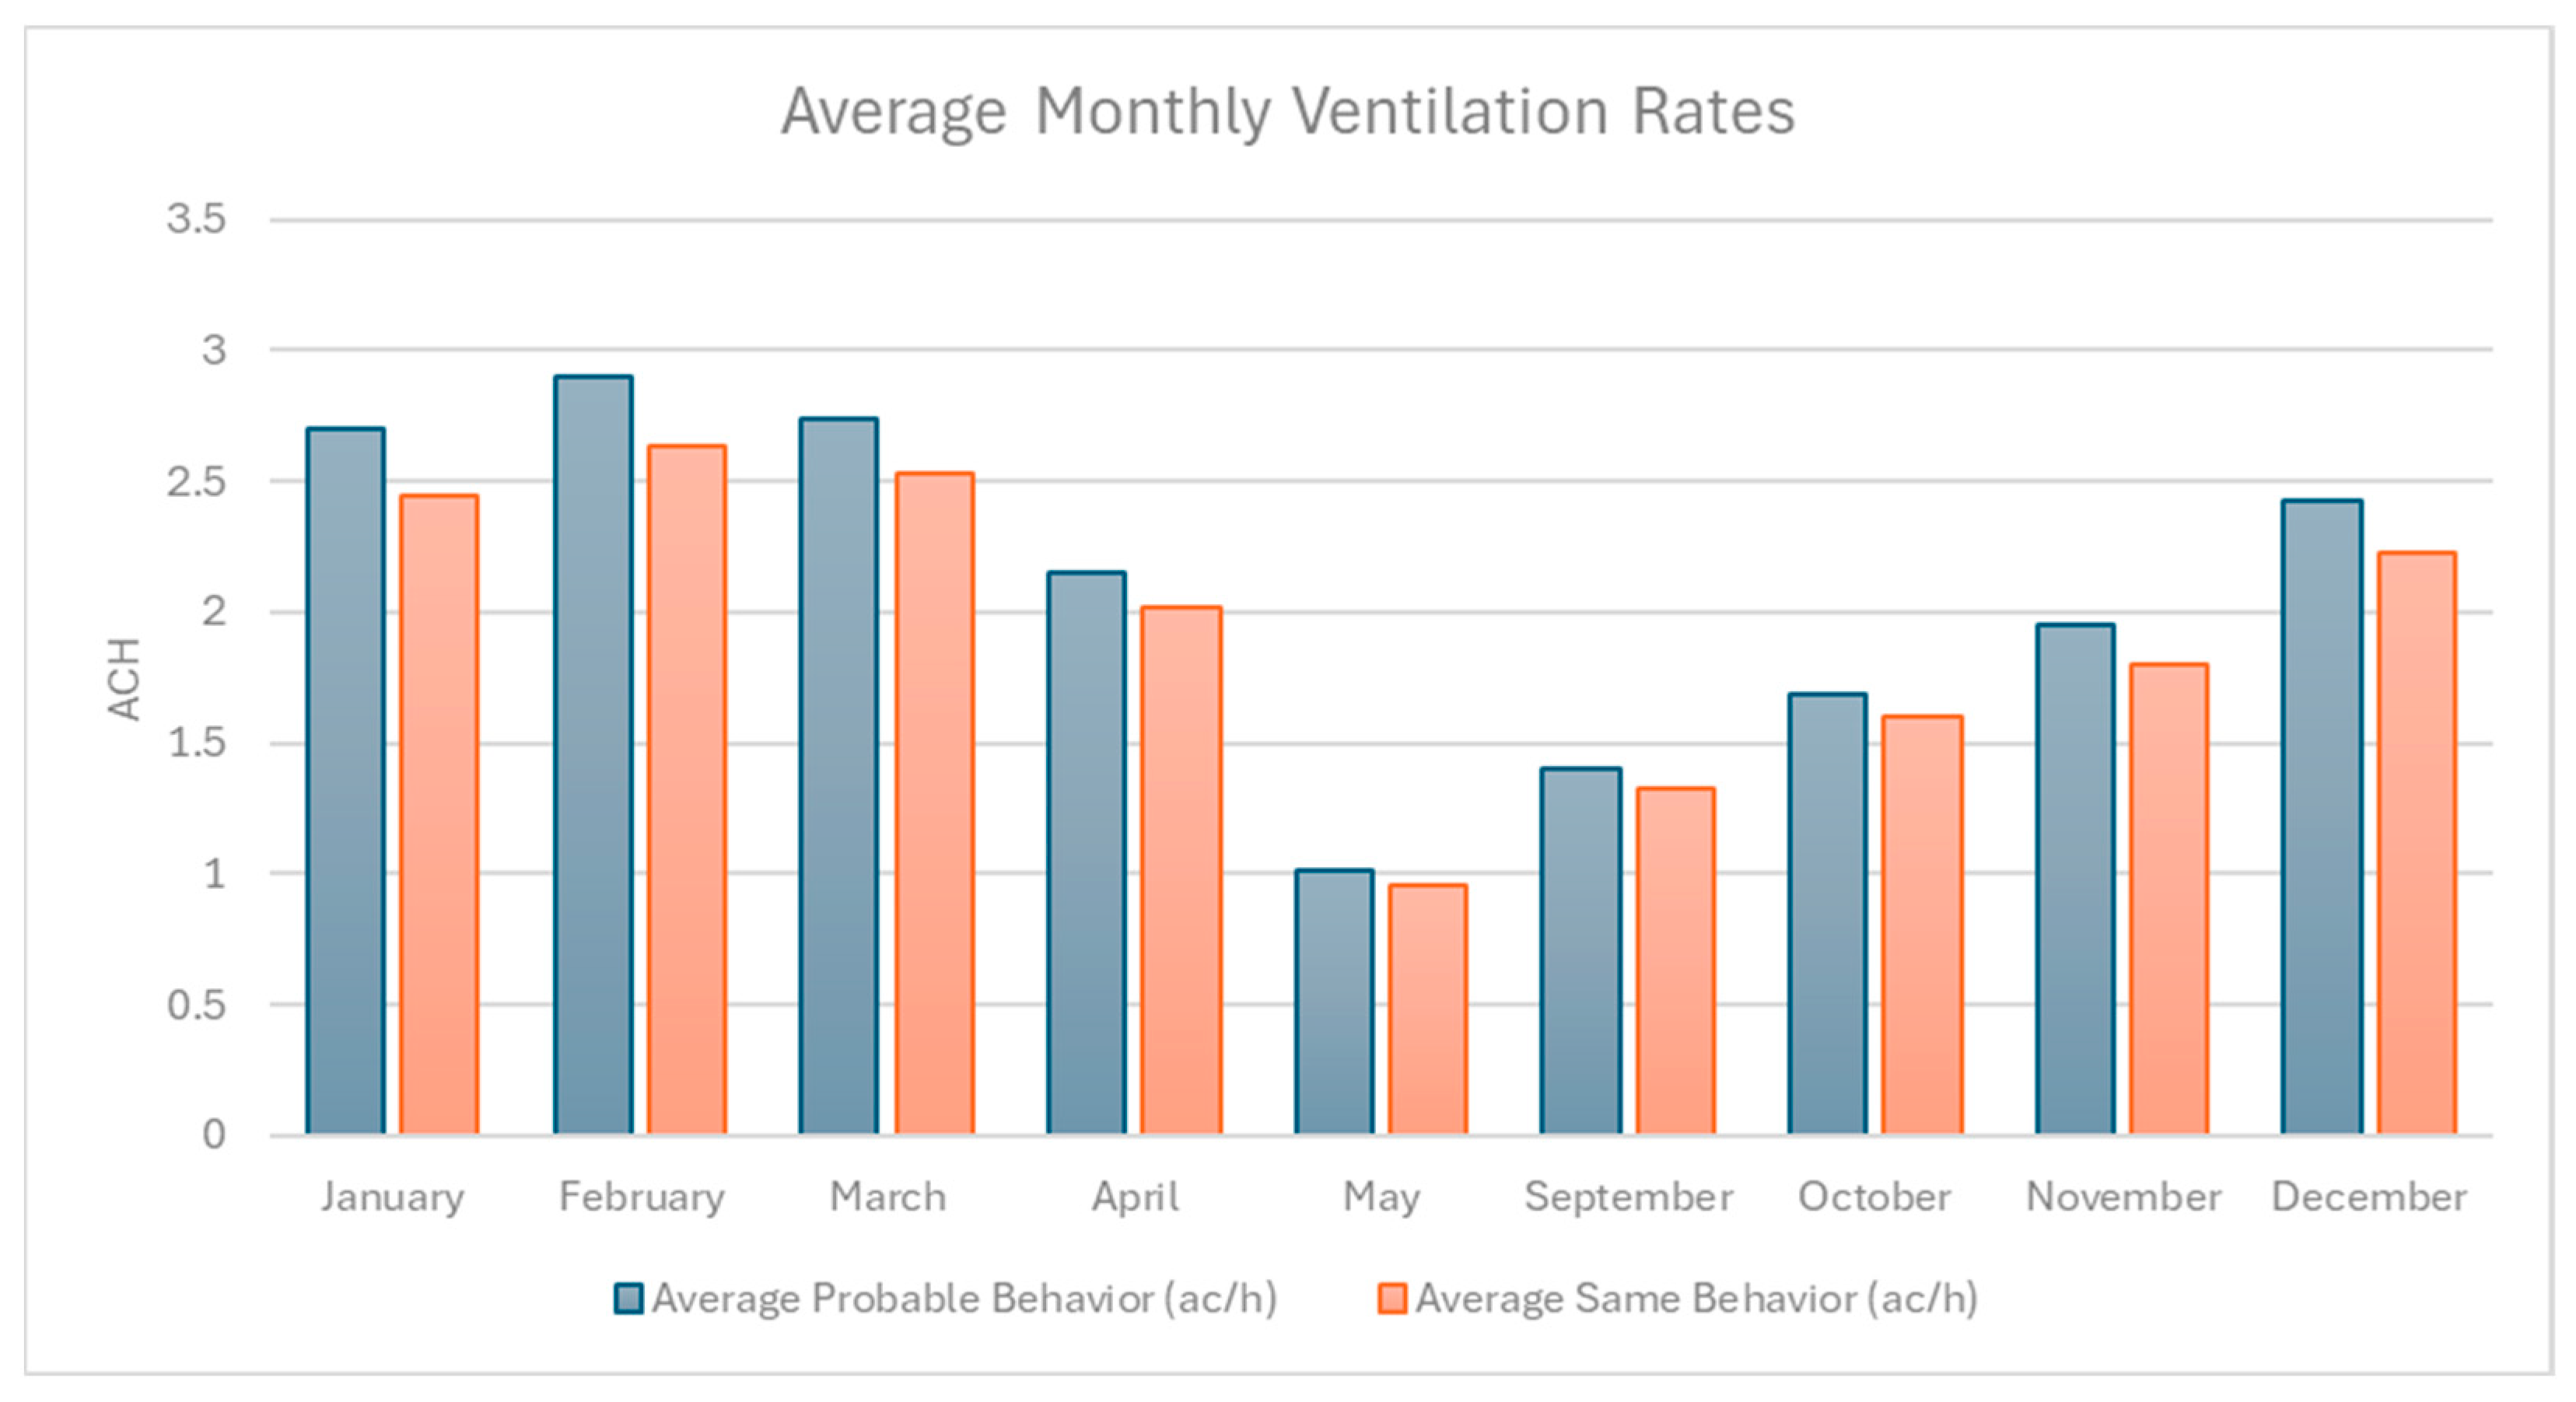
| Month | Highest NV Probable (ACH) (Config.) | Lowest NV Probable (ACH) (Config.) | Avg. NV Same (ACH) | Avg. NV Probable (ACH) | % Change | Avg. Solar Gain (kWh) | Peak Solar Gain (kWh) (Config.) | Lowest Solar Gain (kWh) (Config.) |
|---|---|---|---|---|---|---|---|---|
| Jan | 2.65 (9) | 2.28 (12) | 2.44 | 2.70 | +10.6% | 148.05 | 149.23 (15) | 146.07 (10) |
| Feb | 2.86 (9) | 2.44 (12) | 2.63 | 2.90 | +10.3% | 171.27 | 171.63 (15) | 168.05 (10) |
| Mar | 2.75 (9) | 2.37 (12) | 2.53 | 2.74 | +8.1% | 251.70 | 254.26 (15) | 248.99 (10) |
| Apr | 2.14 (9) | 1.91 (12) | 2.02 | 2.15 | +6.4% | 249.46 | 251.69 (15) | 246.49 (10) |
| May | 1.00 (9) | 0.92 (12) | 0.96 | 1.01 | +5.1% | 269.41 | 271.97 (15) | 266.36 (10) |
| Sep | 1.41 (9) | 1.29 (12) | 1.33 | 1.40 | +5.2% | 249.51 | 251.86 (15) | 246.65 (10) |
| Oct | 1.70 (9) | 1.51 (12) | 1.60 | 1.69 | +5.5% | 207.85 | 209.49 (15) | 205.12 (10) |
| Nov | 1.92 (9) | 1.70 (12) | 1.80 | 1.95 | +8.6% | 150.15 | 151.62 (15) | 148.42 (10) |
| Dec | 2.40 (9) | 2.10 (12) | 2.23 | 2.43 | +9.0% | 148.62 | 149.94 (15) | 136.96 (10) |
| Config. | East Window (H × W, m) | West Window (H × W, m) | Ventilation/Lighting Impact |
|---|---|---|---|
| 1 | 2.4 × 3.0 | 2.4 × 2.3 | Tall windows maximize daylight/ventilation; narrow west manages heat. |
| 2 | 2.2 × 3.3 | 2.2 × 2.5 | Balanced windows optimize light/ventilation; glare control. |
| 3 | 2.0 × 3.65 | 2.0 × 2.75 | Wider east enhances morning light; moderate ACH. |
| 4 | 1.8 × 4.05 | 1.8 × 3.05 | Wide windows emphasize horizontal airflow. Glare management needed. |
| 5 | 1.6 × 4.55 | 1.6 × 3.4 | Wide windows maximize horizontal connection; risk of overheating. |
| 6 | 2.4 × 3.0 | 1.6 × 3.2 | Tall east maximizes morning light; low west limits PM heat. |
| 7 | 2.2 × 3.3 | 1.8 × 3.0 | Tall east enhances AM light; lower west balances heat. |
| 8 | 1.8 × 4.0 | 2.2 × 2.45 | Low east manages glare; taller west aids PM ventilation. |
| 9 | 1.6 × 4.5 | 2.4 × 2.25 | Low east maximizes view; tall west needs PM control. |
| Config. | East Window (H × W, m) | West Window (H × W, m) | Ventilation/Lighting Impact |
|---|---|---|---|
| 1 | 2.4 × 1.95 | 1.6 × 2.15 | Tall east optimizes AM light; low west aids PM heat control. |
| 2 | 2.2 × 2.1 | 1.8 × 1.95 | Balanced heights ensure versatile ventilation and light. |
| 3 | 1.8 × 2.6 | 2.2 × 1.6 | Low east manages glare; tall west provides focused airflow. |
| 4 | 1.6 × 2.9 | 2.4 × 1.45 | Low east maximizes view; tall west offers good PM control. |
| 5 | 2.4 × 1.9 | 2.4 × 1.45 | Tall, narrow windows optimize vertical light; PM control needed. |
| 6 | 2.2 × 2.1 | 2.2 × 1.55 | Mid-height windows balance light/airflow; west limits heat. |
| 7 | 2.0 × 2.3 | 2.0 × 1.7 | Wider east enhances AM light; narrower west balances heat. |
| 8 | 1.8 × 2.55 | 1.8 × 1.8 | Low windows emphasize horizontal connection; consistent airflow. |
| 9 | 1.6 × 2.9 | 1.6 × 2.1 | Low windows maximize view/airflow; east enhances AM light. |
| Configuration | Peak (ACH) | Lowest (ACH) | Average (ACH) |
|---|---|---|---|
| 1 | 26.83 (January) | 1.81 (May) | 13.83 |
| 2 | 26.82 (January) | 1.79 (May) | 13.79 |
| 3 | 26.74 (January) | 1.79 (May) | 13.77 |
| 4 | 26.58 (January) | 1.73 (May) | 13.54 |
| 5 | 27.22 (January) | 1.80 (May) | 14.02 |
| 6 | 25.40 (January) | 1.65 (May) | 12.70 |
| 7 | 26.44 (January) | 1.74 (May) | 13.45 |
| 8 | 26.31 (January) | 1.74 (May) | 13.38 |
| 9 | 26.46 (January) | 1.77 (May) | 13.43 |
| Month | Highest NV (ACH) (Config.) | Lowest NV (ACH) (Config.) | Avg. NV Same (ACH) | Avg. NV Probable (ACH) | % Change | Avg. Solar Gain (kWh) | Peak Solar Gain (kWh) (Config.) | Lowest Solar Gain (kWh) (Config.) |
|---|---|---|---|---|---|---|---|---|
| Jan | 27.22 (5) | 25.40 (6) | 26.53 | 26.94 | +1.5% | 675.85 | 692.78 (5) | 651.07 (6) |
| Feb | 27.08 (5) | 25.27 (6) | 26.37 | 26.62 | +0.9% | 588.15 | 602.76 (5) | 567.72 (6) |
| Mar | 19.90 (5) | 18.44 (6) | 19.30 | 19.65 | +1.8% | 502.96 | 515.37 (5) | 484.88 (6) |
| Apr | 8.29 (3) | 7.83 (6) | 8.16 | 8.36 | +2.5% | 324.56 | 332.28 (5) | 313.24 (6) |
| May | 1.80 (5) | 1.65 (6) | 1.76 | 1.83 | +4.0% | 252.71 | 259.14 (5) | 243.35 (6) |
| Sep | 4.75 (3) | 4.35 (6) | 4.64 | 4.70 | +1.3% | 426.45 | 437.02 (5) | 412.11 (6) |
| Oct | 11.34 (5) | 10.60 (6) | 11.05 | 11.22 | +1.5% | 531.93 | 543.68 (5) | 514.41 (6) |
| Nov | 19.00 (5) | 17.90 (6) | 18.63 | 18.85 | +1.2% | 624.50 | 638.66 (5) | 603.80 (6) |
| Dec | 24.93 (5) | 23.05 (6) | 24.11 | 24.51 | +1.7% | 691.49 | 707.88 (5) | 667.50 (6) |
| Configuration | Peak (ACH) (Month) | Lowest (ACH) (Month) | Average (ACH) (Sep–May) |
|---|---|---|---|
| 1 | 15.52 (January) | 0.90 (May) | 7.90 |
| 2 | 15.55 (January) | 0.91 (May) | 7.96 |
| 3 | 15.71 (January) | 0.93 (May) | 8.07 |
| 4 | 15.40 (January) | 0.90 (May) | 7.87 |
| 5 | 15.45 (January) | 0.92 (May) | 7.87 |
| 6 | 15.26 (January) | 0.91 (May) | 7.80 |
| 7 | 15.21 (January) | 0.90 (May) | 7.74 |
| 8 | 14.87 (January) | 0.89 (May) | 7.60 |
| 9 | 15.18 (January) | 0.90 (May) | 7.73 |
| Month | Highest NV Probable (ACH) (Config.) | Lowest NV Probable (ACH) (Config.) | Avg. NV Same (ACH) | Avg. NV Probable (ACH) | % Change | Avg. Solar Gain (kWh) | Peak Solar Gain (kWh) (Config.) | Lowest Solar Gain (kWh) (Config.) |
|---|---|---|---|---|---|---|---|---|
| Jan | 15.71 (3) | 14.87 (8) | 15.35 | 15.62 | +1.8% | 421.33 | 428.61 (3) | 411.11 (8) |
| Feb | 15.49 (3) | 14.65 (8) | 15.14 | 15.45 | +2.0% | 367.55 | 373.29 (3) | 358.56 (8) |
| Mar | 11.64 (3) | 11.04 (8) | 11.31 | 11.54 | +2.0% | 313.62 | 318.93 (3) | 306.37 (8) |
| Apr | 4.84 (3) | 4.52 (8) | 4.67 | 4.79 | +2.6% | 202.74 | 206.07 (3) | 198.15 (8) |
| May | 0.93 (3) | 0.89 (8) | 0.91 | 0.94 | +3.3% | 157.65 | 160.58 (3) | 153.94 (8) |
| Sep | 2.72 (5) | 2.55 (9) | 2.64 | 2.71 | +2.7% | 266.40 | 270.89 (3) | 260.51 (8) |
| Oct | 6.50 (3) | 6.12 (8) | 6.33 | 6.47 | +2.2% | 332.32 | 337.49 (3) | 325.42 (8) |
| Nov | 10.78 (3) | 10.14 (8) | 10.49 | 10.64 | +1.4% | 389.68 | 395.90 (3) | 381.66 (8) |
| Dec | 14.06 (3) | 13.18 (8) | 13.64 | 13.89 | +1.8% | 431.23 | 438.28 (3) | 421.61 (8) |
| Config | Window 1 (H × W, m) | Window 2 (H × W, m) | Ventilation/Lighting Impact |
|---|---|---|---|
| 1 | 1.7 × 3.2 | 1.7 × 3.2 | Balanced daylight; even airflow with wide windows. |
| 2 | 1.8 × 3.05 | 1.8 × 3.05 | Slightly taller windows enhance light diffusion; good ACH. |
| 3 | 2.0 × 2.7 | 2.0 × 2.7 | Taller windows push daylight deeper; consistent airflow. |
| 4 | 2.2 × 2.45 | 2.2 × 2.45 | Tall windows reduce artificial lighting needs; effective ventilation. |
| 5 | 2.4 × 2.25 | 2.4 × 2.25 | Maximized height for deep light penetration; moderate ACH. |
| 6 | 1.7 × 2.6 | 1.7 × 3.8 | Larger window drives deep light; smaller aids cross-breezes. |
| 7 | 1.8 × 2.0 | 1.8 × 4.0 | Larger window boosts ventilation; smaller controls glare. |
| 8 | 2.0 × 2.15 | 2.0 × 3.3 | Larger window maximizes airflow; smaller regulates light. |
| 9 | 2.2 × 1.7 | 2.2 × 3.3 | Larger window dominates light/ventilation; smaller controls glare. |
| 10 | 2.4 × 1.8 | 2.4 × 2.75 | Taller windows flood light; smaller moderates sunlight. |
| Config | Window 1 (H × W, m) | Window 2 (H × W, m) | Ventilation/Lighting Impact |
|---|---|---|---|
| 1 | 2.0 × 1.75 | 2.0 × 1.75 | Equal dimensions ensure even daylight and airflow. |
| 2 | 1.8 × 1.95 | 1.8 × 1.95 | Shorter windows support light penetration; moderate ACH. |
| 3 | 1.75 × 2.0 | 1.75 × 2.0 | Optimized for glare control; effective ventilation. |
| 4 | 2.4 × 1.45 | 2.4 × 1.45 | Tall windows deliver deep light; narrow width limits airflow. |
| 5 | 2.0 × 1.15 | 2.0 × 2.3 | Wider window boosts ventilation; narrower controls glare. |
| 6 | 1.8 × 1.3 | 1.8 × 2.6 | Larger window drives light/airflow. |
| 7 | 2.4 × 1.0 | 2.4 × 2.0 | Tall design aids light diffusion; smaller controls sunlight. |
| 8 | 1.7 × 1.35 | 1.7 × 2.7 | Larger window focuses on airflow; smaller manages heat. |
| 9 | 2.0 × 1.4 | 2.0 × 2.1 | Balanced windows ensure daylight and ventilation. |
| 10 | 1.7 × 1.65 | 1.7 × 2.4 | Larger window aids ventilation; smaller controls light. |
| Story | Peak (ACH) (Month) | Lowest (ACH) (Month) | Average (ACH) |
|---|---|---|---|
| Story 1 | 24.79 (January) | 1.70 (May) | 13.40 |
| Story 2 | 24.76 (January) | 1.69 (May) | 13.38 |
| Story 3 | 24.08 (January) | 1.63 (May) | 12.96 |
| Story 4 | 24.99 (January) | 1.73 (May) | 13.57 |
| Story 5 | 30.07 (January) | 2.27 (May) | 16.67 |
| Story 6 | 23.21 (January) | 1.58 (May) | 12.49 |
| Story 7 | 27.82 (January) | 1.91 (May) | 15.27 |
| Story 8 | 27.60 (January) | 1.94 (May) | 15.17 |
| Story 9 | 21.76 (January) | 1.57 (May) | 11.68 |
| Story 10 | 28.18 (January) | 1.91 (May) | 15.42 |
| Month | Highest NV Probable (ACH) (Config.) | Lowest NV Probable (ACH) (Config.) | Avg. NV Same (ACH) | Avg. NV Probable (ACH) | % Change | Avg. Solar Gain (kWh) | Peak Solar Gain (kWh) (Config.) | Lowest Solar Gain (kWh) (Config.) |
|---|---|---|---|---|---|---|---|---|
| Jan | 30.07 (5) | 21.76 (9) | 25.75 | 25.70 | −0.2% | 626.69 | 708.39 (5) | 535.21 (9) |
| Feb | 29.64 (5) | 21.46 (9) | 25.20 | 25.22 | +0.1% | 547.62 | 603.69 (5) | 466.66 (9) |
| Mar | 21.86 (5) | 15.92 (9) | 18.61 | 18.89 | +1.5% | 467.46 | 515.69 (5) | 398.63 (9) |
| Apr | 9.62 (5) | 7.00 (9) | 8.16 | 8.18 | +0.2% | 302.59 | 332.61 (5) | 257.57 (9) |
| May | 2.27 (5) | 1.57 (9) | 1.79 | 1.78 | −0.6% | 233.97 | 259.52 (5) | 199.95 (9) |
| Sep | 5.47 (5) | 3.87 (9) | 4.64 | 4.56 | −1.7% | 398.31 | 437.60 (5) | 338.82 (9) |
| Oct | 12.84 (5) | 9.20 (9) | 10.98 | 11.00 | +0.2% | 499.50 | 543.92 (5) | 423.22 (9) |
| Nov | 20.99 (5) | 14.89 (9) | 17.82 | 17.66 | −0.9% | 585.16 | 638.89 (5) | 496.55 (9) |
| Dec | 27.36 (5) | 19.46 (9) | 23.27 | 23.36 | +0.4% | 645.04 | 708.39 (5) | 548.90 (9) |
| Configuration | Peak (ACH) (Month) | Lowest (ACH) (Month) | Average (ACH) (Sep–May) |
|---|---|---|---|
| 10 | 15.61 (February) | 0.88 (May) | 8.92 |
| 11 | 15.59 (February) | 0.87 (May) | 8.90 |
| 12 | 16.63 (February) | 0.88 (May) | 8.94 |
| 13 | 15.62 (February) | 0.88 (May) | 8.93 |
| 14 | 15.63 (February) | 0.85 (May) | 8.94 |
| 15 | 15.61 (February) | 0.88 (May) | 8.92 |
| 16 | 15.60 (February) | 0.87 (May) | 8.91 |
| 17 | 16.18 (February) | 0.88 (May) | 8.92 |
| 18 | 15.62 (February) | 0.88 (May) | 8.93 |
| Month | Highest NV Probable (ACH) (Config.) | Lowest NV Probable (ACH) (Config.) | Avg. NV Same (ACH) | Avg. NV Probable (ACH) | % Change | Avg. Solar Gain (kWh) | Peak Solar Gain (kWh) (Config.) | Lowest Solar Gain (kWh) (Config.) |
|---|---|---|---|---|---|---|---|---|
| Jan | 16.47 (12) | 15.95 (17) | 13.82 | 13.47 | −2.5% | 369.65 | 424.69 (3) | 334.32 (5) |
| Feb | 16.63 (12) | 16.18 (17) | 13.91 | 13.74 | −1.2% | 322.39 | 370.33 (3) | 291.50 (5) |
| Mar | 11.89 (12) | 11.49 (17) | 10.17 | 10.11 | −0.6% | 275.41 | 316.28 (3) | 249.11 (5) |
| Apr | 4.76 (12) | 4.59 (17) | 4.09 | 3.92 | −4.2% | 178.04 | 204.54 (3) | 161.06 (5) |
| May | 0.88 (10) | 0.88 (17) | 0.88 | 0.85 | −3.4% | 138.41 | 158.99 (3) | 125.21 (5) |
| Sep | 2.99 (12) | 2.89 (17) | 2.57 | 2.41 | −6.2% | 234.12 | 268.99 (3) | 211.78 (5) |
| Oct | 6.86 (12) | 6.63 (17) | 5.90 | 5.68 | −3.7% | 292.26 | 335.83 (3) | 264.34 (5) |
| Nov | 9.98 (12) | 9.65 (17) | 8.56 | 8.25 | −3.6% | 342.86 | 393.87 (3) | 309.99 (5) |
| Dec | 14.25 (12) | 13.76 (17) | 12.20 | 11.75 | −3.7% | 378.88 | 435.32 (3) | 342.72 (5) |
| Config | 2× North Windows (H × W, m) | South Window (H × W, m) | Ventilation/Lighting Impact |
|---|---|---|---|
| 1 | 2.4 × 2.0 | 2.4 × 3.0 | Balanced north windows; tall south enhances daylight/ventilation. |
| 2 | 2.2 × 2.0 | 2.2 × 3.3 | Shorter south balances light; north ensures cross-ventilation. |
| 3 | 2.0 × 2.3 | 2.0 × 3.6 | Larger north aids airflow; tall south exhausts heat. |
| 4 | 1.8 × 2.6 | 1.8 × 4.0 | Compact north minimizes glare; large south ensures ventilation. |
| 5 | 1.6 × 2.8 | 1.6 × 4.6 | Narrow north controls glare; large south enhances comfort. |
| 6 | 1.6 × 2.9 | 2.2 × 3.3 | Shorter north reduces heat; taller south aids daylight. |
| 7 | 1.7 × 2.7 | 2.4 × 3.0 | Balanced north airflow; tall south maximizes light/ventilation. |
| 8 | 1.8 × 2.6 | 2.2 × 3.3 | Taller north prioritizes ventilation; south enhances daylight. |
| 9 | 1.6 × 2.9 | 2.4 × 3.0 | Compact north controls glare; large south aids ventilation. |
| 10 | 1.7 × 2.6 | 2.2 × 3.3 | Proportional north aids airflow; tall south enhances cooling. |
| Config | 2× North Windows (H × W, m) | South Window (H × W, m) | Ventilation/Lighting Impact |
|---|---|---|---|
| 1 | 2.4 × 1.2 | 2.4 × 1.9 | Balanced dimensions ensure ventilation; south aids light. |
| 2 | 2.2 × 1.4 | 2.2 × 3.3 | Shorter south balances light; north ensures ventilation. |
| 3 | 2.2 × 1.4 | 2.0 × 2.4 | South reduces glare; north maintains ventilation. |
| 4 | 1.8 × 1.6 | 1.8 × 2.6 | Narrow north minimizes gain; south ensures light. |
| 5 | 1.6 × 1.8 | 1.6 × 2.9 | Narrow north reduces glare; tall south aids ventilation. |
| 6 | 1.6 × 1.8 | 2.2 × 2.0 | Shorter north reduces heat; taller south enhances light. |
| 7 | 1.7 × 1.7 | 2.4 × 2.0 | Balanced north airflow; tall south aids light/ventilation. |
| 8 | 1.8 × 1.7 | 2.2 × 2.1 | Taller north prioritizes ventilation; south enhances light. |
| 9 | 1.6 × 1.8 | 2.4 × 2.0 | Compact north controls glare; south aids ventilation. |
| 10 | 1.7 × 1.7 | 2.2 × 2.2 | Proportional north aids airflow; south enhances cooling. |
| Configurations | Peak (ACH) (Month) | Lowest (ACH) (Month) | Average (ACH) |
|---|---|---|---|
| A1 | 36.24 (February) | 3.38 (May) | 21.48 |
| A2 | 35.95 (February) | 3.33 (May) | 21.21 |
| A3 | 36.18 (February) | 3.35 (May) | 21.56 |
| A4 | 36.05 (February) | 3.33 (May) | 21.33 |
| A5 | 35.82 (February) | 3.30 (May) | 21.01 |
| A6 | 35.92 (February) | 3.33 (May) | 21.14 |
| A7 | 35.93 (February) | 3.36 (May) | 21.14 |
| A8 | 36.10 (February) | 3.35 (May) | 21.36 |
| A9 | 35.76 (February) | 3.34 (May) | 21.07 |
| A10 | 35.75 (February) | 3.32 (May) | 20.93 |
| Month | Highest NV Probable (ACH) (Config.) | Lowest NV Probable (ACH) (Config.) | Avg. NV Same (ACH) | Avg. NV Probable (ACH) | % Change | Avg. Solar Gain (kWh) | Peak Solar Gain (kWh) (Config.) | Lowest Solar Gain (kWh) (Config.) |
|---|---|---|---|---|---|---|---|---|
| Jan | 35.90 (1) | 35.75 (10) | 34.04 | 37.00 | +8.7% | 423.94 | 427.89 (3) | 420.58 (10) |
| Feb | 36.24 (1) | 35.75 (10) | 35.97 | 39.41 | +9.6% | 421.31 | 426.44 (3) | 418.49 (10) |
| Mar | 25.60 (1) | 25.40 (10) | 27.31 | 31.00 | +13.5% | 547.37 | 553.22 (3) | 541.82 (10) |
| Apr | 10.25 (1) | 10.15 (10) | 15.09 | 17.71 | +17.4% | 515.99 | 521.83 (3) | 510.71 (10) |
| May | 3.38 (1) | 3.32 (10) | 3.34 | 4.06 | +21.6% | 534.33 | 541.11 (3) | 529.02 (10) |
| Sep | 8.55 (1) | 8.45 (10) | 7.29 | 8.64 | +18.5% | 532.32 | 538.21 (3) | 526.98 (10) |
| Oct | 15.35 (1) | 15.25 (10) | 15.63 | 18.28 | +16.9% | 487.98 | 493.01 (3) | 483.56 (10) |
| Nov | 22.50 (1) | 22.30 (10) | 19.39 | 21.38 | +10.3% | 419.25 | 423.27 (3) | 415.71 (10) |
| Dec | 30.20 (1) | 30.00 (10) | 28.22 | 31.37 | +7.6% | 431.23 | 434.96 (3) | 428.02 (10) |
| Configuration | Peak (ACH) (Month) | Lowest (ACH) (Month) | Average (ACH) (Sep–May) |
|---|---|---|---|
| A1 | 21.41 (January) | 1.87 (May) | 11.22 |
| A2 | 22.58 (February) | 1.63 (May) | 11.45 |
| A3 | 22.30 (February) | 1.64 (May) | 11.05 |
| A4 | 22.44 (February) | 1.72 (May) | 11.33 |
| A5 | 20.87 (February) | 1.60 (May) | 10.47 |
| A6 | 23.75 (February) | 1.77 (May) | 12.09 |
| A7 | 22.12 (February) | 1.64 (May) | 10.88 |
| A8 | 22.57 (February) | 1.75 (May) | 11.28 |
| A9 | 22.26 (February) | 1.66 (May) | 11.11 |
| Month | Highest NV (ACH) (Config.) | Lowest NV (ACH) (Config.) | Avg. NV Same (ACH) | Avg. NV Probable (ACH) | % Change | Avg. Solar Gain (kWh) | Peak Solar Gain (kWh) (Config.) | Lowest Solar Gain (kWh) (Config.) |
|---|---|---|---|---|---|---|---|---|
| Jan | 22.42 (6) | 19.65 (5) | 21.23 | 23.86 | +12.4% | 269.77 | 280.93 (6) | 263.57 (1) |
| Feb | 23.75 (6) | 20.87 (5) | 22.36 | 25.18 | +12.6% | 268.43 | 277.28 (6) | 261.87 (1) |
| Mar | 17.48 (6) | 15.56 (5) | 16.67 | 18.43 | +10.6% | 346.27 | 356.11 (6) | 338.75 (1) |
| Apr | 9.13 (6) | 8.52 (10) | 8.78 | 10.52 | +19.8% | 326.68 | 333.73 (6) | 318.47 (1) |
| May | 1.87 (1) | 1.60 (5) | 1.72 | 2.05 | +19.2% | 338.21 | 344.38 (6) | 329.53 (1) |
| Sep | 4.58 (6) | 4.31 (5) | 4.48 | 5.22 | +16.5% | 337.44 | 345.46 (6) | 329.07 (1) |
| Oct | 8.41 (6) | 7.76 (5) | 8.12 | 9.48 | +16.7% | 309.82 | 318.88 (6) | 302.05 (1) |
| Nov | 10.96 (6) | 9.75 (5) | 10.36 | 11.41 | +10.1% | 266.79 | 277.31 (6) | 260.43 (1) |
| Dec | 16.63 (6) | 14.91 (5) | 15.74 | 17.21 | +9.3% | 274.85 | 287.18 (6) | 268.53 (1) |
| Config | North Window (H × W, m) | East Windows (Each, H × W, m) | Ventilation/Lighting Impact |
|---|---|---|---|
| 1 | 2.4 × 3.05 | 2.4 × 1.2 | East provides bright AM light; north balances daylight. |
| 2 | 2.2 × 3.3 | 2.2 × 1.35 | Tall north distributes soft light; east controls AM sun. |
| 3 | 2.0 × 3.65 | 2.0 × 1.45 | Moderately tall east aids light; north stabilizes illumination. |
| 4 | 1.8 × 4.05 | 1.8 × 1.65 | Extended north glazing aids light depth; east needs control. |
| 5 | 1.6 × 4.55 | 1.6 × 1.85 | Narrow north controls glare; east provides strong AM light. |
| 6 | 2.2 × 3.3 | 1.6 × 1.85 | Narrow east aids AM light; north reduces midday glare. |
| 7 | 2.4 × 3.05 | 1.7 × 1.7 | Wide north ensures consistent light; east boosts AM brightness. |
| 8 | 2.2 × 3.3 | 1.8 × 1.65 | Balanced north glow; east supplies ample AM daylight. |
| 9 | 2.4 × 3.03 | 1.6 × 1.85 | Wide north illuminates midday; east aids AM light. |
| 10 | 2.2 × 3.3 | 1.7 × 1.7 | Strong cross-ventilation; north stabilizes light. |
| Config | North Window (H × W, m) | East Windows (Each, H × W, m) | Ventilation/Lighting Impact |
|---|---|---|---|
| 1 | 2.4 × 1.95 | 2.4 × 1.9 | North offers diffuse light; east boosts AM brightness. |
| 2 | 2.2 × 2.15 | 2.2 × 2.05 | Tall north and east ensure cross-ventilation; balanced light. |
| 3 | 2.0 × 2.35 | 2.0 × 2.3 | Tall east delivers AM light; north stabilizes illumination. |
| 4 | 1.8 × 2.6 | 1.8 × 2.55 | Tall windows aid vertical airflow; east produces intense AM light. |
| 5 | 1.6 × 2.95 | 1.6 × 2.85 | Narrow windows bring AM sun; north stabilizes light. |
| 6 | 2.2 × 2.15 | 1.6 × 2.85 | Large east sashes aid breeze; north moderates light. |
| 7 | 2.4 × 1.95 | 1.7 × 2.65 | Wide north fosters ventilation; east boosts AM light. |
| 8 | 2.2 × 2.15 | 1.8 × 2.55 | Quick air exchange; east bright in AM, north glare-free. |
| 9 | 2.4 × 1.95 | 1.6 × 2.85 | Wide north illuminates midday; east aids AM light. |
| 10 | 2.2 × 2.15 | 1.7 × 2.65 | Strong cross-ventilation; north stabilizes light. |
| Configuration | Peak (ACH) (Month) | Lowest (ACH) (Month) | Average (ACH) |
|---|---|---|---|
| A1 | 23.81 (March) | 5.36 (May) | 16.22 |
| A2 | 25.39 (March) | 5.89 (May) | 17.32 |
| A3 | 23.86 (March) | 5.39 (May) | 16.25 |
| A4 | 24.09 (March) | 5.38 (May) | 16.37 |
| A5 | 23.66 (March) | 5.30 (May) | 15.95 |
| A6 | 24.08 (March) | 5.38 (May) | 16.29 |
| A7 | 23.73 (March) | 5.38 (May) | 16.07 |
| A8 | 25.18 (March) | 5.87 (May) | 16.92 |
| A9 | 24.06 (March) | 5.43 (May) | 16.24 |
| A10 | 24.73 (March) | 5.82 (May) | 16.58 |
| Month | Highest NV Probable (ACH) (Config.) | Lowest NV Probable (ACH) (Config.) | Avg. NV Same (ACH) | Avg. NV Probable (ACH) | % Change | Avg. Solar Gain (kWh) | Peak Solar Gain (kWh) (Config.) | Lowest Solar Gain (kWh) (Config.) |
|---|---|---|---|---|---|---|---|---|
| Jan | 22.72 (2) | 21.29 (5) | 22.00 | 23.57 | +7.1% | 485.17 | 502.49 (2) | 472.70 (5) |
| Feb | 21.77 (2) | 20.38 (5) | 20.88 | 22.05 | +5.6% | 491.50 | 510.64 (2) | 479.15 (5) |
| Mar | 25.39 (2) | 23.66 (5) | 24.36 | 26.18 | +7.5% | 578.86 | 605.23 (2) | 564.66 (5) |
| Apr | 15.63 (2) | 14.42 (5) | 14.90 | 16.28 | +9.3% | 506.61 | 531.74 (2) | 494.55 (5) |
| May | 5.89 (2) | 5.30 (5) | 5.55 | 5.86 | +5.6% | 501.00 | 527.52 (2) | 488.48 (5) |
| Sep | 10.63 (2,10) | 9.93 (5) | 10.23 | 10.79 | +5.5% | 548.05 | 575.75 (2) | 536.79 (5) |
| Oct | 17.83 (2,8) | 16.58 (5) | 17.24 | 18.89 | +9.6% | 543.71 | 566.28 (2) | 530.11 (5) |
| Nov | 19.19 (2) | 18.04 (7) | 18.50 | 20.05 | +8.4% | 492.50 | 510.21 (2) | 479.97 (5) |
| Dec | 23.01 (2) | 21.00 (5) | 22.16 | 24.61 | +11.1% | 493.05 | 509.82 (2) | 480.14 (5) |
| Configuration | Peak (ACH) (Month) | Lowest (ACH) (Month) | Average (ACH) |
|---|---|---|---|
| 1 | 20.62 (January) | 4.18 (May) | 15.47 |
| 2 | 20.92 (January) | 4.23 (May) | 15.56 |
| 3 | 21.87 (March) | 4.20 (May) | 15.99 |
| 4 | 21.73 (March) | 4.14 (May) | 15.85 |
| 5 | 22.94 (December) | 4.12 (May) | 15.93 |
| 6 | 20.87 (January) | 4.21 (May) | 15.48 |
| 7 | 21.43 (March) | 4.11 (May) | 15.32 |
| 8 | 20.98 (January) | 4.19 (May) | 15.54 |
| 9 | 20.47 (January) | 4.13 (May) | 15.41 |
| 10 | 20.80 (January) | 4.19 (May) | 15.50 |
| Month | Highest NV Probable (ACH) (Config.) | Lowest NV Probable (ACH) (Config.) | Avg. NV Same (ACH) | Avg. NV Probable (ACH) | % Change | Avg. Solar Gain (kWh) | Peak Solar Gain (kWh) (Config.) | Lowest Solar Gain (kWh) (Config.) |
|---|---|---|---|---|---|---|---|---|
| Jan | 21.32 (5) | 20.34 (7) | 20.89 | 22.80 | +9.1% | 555.42 | 564.86 (1) | 548.82 (9) |
| Feb | 20.42 (3) | 19.66 (7) | 20.02 | 21.61 | +8.0% | 532.91 | 541.37 (1) | 526.73 (9) |
| Mar | 21.87 (3) | 21.43 (7) | 21.70 | 23.91 | +10.2% | 552.50 | 559.62 (1) | 546.51 (9) |
| Apr | 13.22 (3) | 12.87 (7) | 13.09 | 14.52 | +11.0% | 441.47 | 446.34 (1) | 436.76 (9) |
| May | 4.23 (2) | 4.11 (7) | 4.17 | 4.67 | +12.0% | 403.35 | 406.77 (1) | 399.15 (9) |
| Sep | 8.92 (4) | 8.67 (7) | 8.83 | 9.92 | +12.3% | 509.27 | 516.59 (1) | 504.76 (9) |
| Oct | 16.22 (4) | 15.43 (7) | 15.90 | 17.84 | +12.2% | 561.58 | 569.92 (1) | 555.23 (9) |
| Nov | 18.09 (3) | 17.55 (7) | 17.81 | 19.53 | +9.7% | 564.13 | 573.79 (1) | 557.46 (9) |
| Dec | 22.99 (3) | 22.06 (9) | 22.52 | 25.31 | +12.4% | 582.15 | 592.25 (1) | 574.96 (9) |
| Orientation | Window-Design Strategy | Key Parameters | Behavioral Insight | Simulation Outcome | Final Recommendation |
|---|---|---|---|---|---|
| North | Two windows (equal size) | 45% WWR | Frequent opening due to glare-free daylight | High ventilation, low solar gain | ✅ Recommend for daylight + ventilation |
| One large central window | 45% WWR, high placement | Less use due to unreachable height | Medium ventilation, better view | ⚠️ Only if view is priority | |
| South | One large window + two side windows | Total 65% WWR | Overheating during afternoon, limited opening | High solar gain, glare issues | ❌ Not ideal without shading |
| Two medium windows | 45% WWR | Balanced use, easy to open | Moderate ventilation and daylight | ✅ Preferred for comfort | |
| East | Large ceiling-height window | 40% WWR | Low opening frequency in morning | Glare issues in early hours | ⚠️ Use only with shading |
| East | Smaller west-facing window | 30% WWR | Opened more in late day | Supports cross-ventilation | ✅ Good for morning–evening balance |
| West | One large window | 40% WWR | Often kept shut due to heat | Poor thermal comfort | ❌ Avoid large west-facing glass |
| West | Two smaller split windows | 45% total WWR | More likely to be opened | Better airflow, lower overheating | ✅ Recommended with shading |
| Orientation | Recommended Window Dimensions | Additional Considerations |
|---|---|---|
| North |
|
|
| East |
|
|
| West |
|
|
| South |
|
|
Disclaimer/Publisher’s Note: The statements, opinions and data contained in all publications are solely those of the individual author(s) and contributor(s) and not of MDPI and/or the editor(s). MDPI and/or the editor(s) disclaim responsibility for any injury to people or property resulting from any ideas, methods, instructions or products referred to in the content. |
© 2025 by the authors. Licensee MDPI, Basel, Switzerland. This article is an open access article distributed under the terms and conditions of the Creative Commons Attribution (CC BY) license (https://creativecommons.org/licenses/by/4.0/).
Share and Cite
Pourtangestani, M.; Izadyar, N.; Jamei, E.; Vrcelj, Z. Integrating Occupant Behavior into Window Design: A Dynamic Simulation Study for Enhancing Natural Ventilation in Residential Buildings. Buildings 2025, 15, 2193. https://doi.org/10.3390/buildings15132193
Pourtangestani M, Izadyar N, Jamei E, Vrcelj Z. Integrating Occupant Behavior into Window Design: A Dynamic Simulation Study for Enhancing Natural Ventilation in Residential Buildings. Buildings. 2025; 15(13):2193. https://doi.org/10.3390/buildings15132193
Chicago/Turabian StylePourtangestani, Mojgan, Nima Izadyar, Elmira Jamei, and Zora Vrcelj. 2025. "Integrating Occupant Behavior into Window Design: A Dynamic Simulation Study for Enhancing Natural Ventilation in Residential Buildings" Buildings 15, no. 13: 2193. https://doi.org/10.3390/buildings15132193
APA StylePourtangestani, M., Izadyar, N., Jamei, E., & Vrcelj, Z. (2025). Integrating Occupant Behavior into Window Design: A Dynamic Simulation Study for Enhancing Natural Ventilation in Residential Buildings. Buildings, 15(13), 2193. https://doi.org/10.3390/buildings15132193