Abstract
This study presents the development and characterization of sustainable bio-bricks incorporating agricultural residues—specifically coffee husks and bovine excreta—as partial substitutes for cement. A mixture design optimized through response surface methodology (RSM) identified the best-performing formulation, namely 960 g of cement, 225 g of lignin (extracted from coffee husks), and 315 g of bovine excreta. Experimental evaluations included compressive and flexural strength, water absorption, density, thermal conductivity, transmittance, admittance, and acoustic transmission loss. The optimal mixture achieved a compressive strength of 1.70 MPa and a flexural strength of 0.56 MPa, meeting Colombian technical standards for non-structural masonry. Its thermal conductivity (~0.19 W/(m×K)) and transmittance (~0.20 W/(m2×K)) suggest good insulation performance. Field tests in three Colombian climate zones confirmed improved thermal comfort compared to traditional clay brick walls, with up to 8 °C internal temperature reduction. Acoustic analysis revealed higher sound attenuation in bio-bricks, especially at low frequencies. Chemical and morphological analyses (SEM-EDS, FTIR, and TGA) confirmed favorable thermal stability and the synergistic interaction of organic and inorganic components. The findings support bio-bricks’ potential as eco-efficient, low-carbon alternatives for sustainable building applications.
1. Introduction
The construction industry is a major contributor to greenhouse gas emissions across the entire lifecycle of materials, from extraction to disposal. In light of climate change and increasing energy demands, there is growing interest in adopting sustainable materials that reduce CO2 emissions. Among these, agricultural residues have emerged as a promising, eco-friendly alternative to conventional construction materials. These residues lower the environmental impact and enhance the thermal properties of bricks, improving energy efficiency in buildings. Simulations of bio-bricks incorporating materials, such as rice straw and sugarcane, have demonstrated energy savings of approximately 7% and 12%, respectively, underscoring their potential to reduce energy consumption and carbon emissions [1].
Organic waste management remains a significant environmental challenge, especially in developing countries where landfilling remains the predominant disposal method. This practice not only degrades ecosystems but also poses serious public health risks due to insect infestation and the spread of disease. One promising strategy to address this issue is integrating organic waste into construction materials, offering a low-cost and sustainable solution. Cement, as a key material in civil engineering, has evolved through decades of improvements in composition and performance to meet the practical needs of modern infrastructure [1].
Biomass, the biodegradable fraction of waste and residues from agriculture, forestry, and livestock, has gained attention in recent years as a sustainable resource for the construction industry. Due to its renewable nature and versatile properties, biomass has been widely explored in various applications, such as biocomposites and engineering materials [2]. Agricultural residues, like sugarcane bagasse, corn stalks, bamboo, coconut fibers, and coffee husks, offer low density, renewability, and favorable mechanical properties that compete with synthetic reinforcements, such as glass and carbon fibers [3,4,5,6].
The use of natural fibers to reinforce cement-based materials has shown considerable potential. Fibers derived from banana, bamboo, rice husk, and coffee husks have been successfully used to improve the mechanical performance of concrete and mortar, aligning with environmental sustainability goals [7,8]. Among these, coffee husks stand out due to their high cellulose content, an abundant byproduct of coffee processing. However, their improper disposal has led to environmental issues, particularly soil and water pollution, highlighting the importance of finding sustainable applications for this residue in construction [9].
Rapid urban growth and the environmental consequences it entails have driven the search for alternative materials with mechanical properties comparable to conventional masonry units. These alternatives aim to meet the demands of sustainable housing projects by promoting eco-efficient construction [10]. In this context, plant fibers have drawn increasing attention for their low cost and ability to reinforce polymeric and cementitious matrices effectively. Studies have explored a wide range of agricultural wastes as reinforcement materials, including banana [11], bamboo [12], rice husk [13,14], coconut [15], fly ash [15], sisal, jute, palm, and linseed [16]. Note that the recovery of this plant waste in the construction sector has several objectives, namely economic, technical, and environmental [17].
1.1. Related Research
Parece et al., 2022 [18] examined how circular economy strategies—such as reuse, recycling, and waste transformation—can convert local urban and industrial waste into sustainable building materials. Using Ashby’s method and the M-MACBETH tool, 35 partition wall types made from various waste sources were evaluated. Several demonstrated strong thermal and acoustic performance, coating suitability, or structural potential, highlighting the promise of waste-based materials for sustainable construction. Ganasen et al., 2023 [19] evaluated the use of raw rice husk, fly ash, and hydrated lime as replacements for fine aggregate and cement in the production of raw rice husk–concrete bricks, with different mix ratios (1:5:0.1 to 1:8.57:0). The objective was to optimize the compressive strength, water absorption, and dry density of the concrete brick containing recycled aggregates using response surface methodology (RSM) [20,21].
The development of materials used in residential construction has diversified considerably in recent years. According to Jonnala, 2022 [22], bricks and building components now span from conventional clay and concrete to more advanced alternatives, such as fly ash bricks, aerated concrete, and recycled variants. This study assesses these materials’ mechanical, thermal, and environmental performance, considering various factors, like sustainability and local resource availability. Among the options, cellular lightweight concrete (CLC) bricks stand out, showing 30–40% compressive strength increases over traditional bricks and enhanced lateral load capacity and ductility. Additionally, including coconut and basalt fibers in their composition led to an approximate 17.4% improvement in thermal insulation, with minimal thermal degradation. These insights provide a solid basis for selecting efficient, eco-friendly materials in residential construction projects.
Korjakins et al., 2025 [23] explored the use of wood composites as sustainable acoustic materials through a review, emphasizing their integration with advanced manufacturing methods. Recent innovations combining wood with materials, like expanded polystyrene (EPS) and natural fibers, have shown promising results, including high sound absorption (α up to 0.9) and improved transmission loss. Designs using waste-based components, such as rubber and agricultural byproducts, enhance acoustic performance and support environmental sustainability, positioning wood composites as a viable carbon-neutral solution for green building applications.
Acuña-Portocarrero et al., 2025 [24] conducted a study in the rural settlement of Cana Edén, Satipo, Peru, to evaluate how different building materials affect thermal comfort in local housing. The research found that dwellings built with industrial materials, such as concrete and calamine, exhibited significantly greater thermal discomfort than those constructed with natural or mixed materials. Using tools, like the Givoni bioclimatic chart and Mahoney tables, the study assessed environmental conditions and evaluated materials based on thermal conductivity, transmittance, and admittance. Also, the authors reported that rural dwellings constructed with industrial materials exhibited significantly lower thermal comfort levels than those built with natural or mixed materials. The study, conducted on 30 homes, demonstrated that thermal properties—such as conductivity and transmittance—directly impact indoor comfort. These findings highlight the importance of selecting building materials according to local climatic conditions and support using natural alternatives to enhance habitability and promote sustainability in tropical housing design.
Despite growing interest in using agricultural waste in construction, most studies have focused primarily on the mechanical or physical properties of bio-bricks, often overlooking their comprehensive performance in terms of thermal and acoustic behavior. Research, such as that by Rautray, Roy, and Eisenbart 2023 [25], concentrated on the compressive strength of agro-waste bricks for structural applications using 25% rice husk and 20% bovine excreta, while Liu et al., 2021 [26] explored resistance improvements against water erosion through fiber reinforcement and microbial treatments using 0.3% synthetic fiber and 0.3% coconut coir fiber, increasing until it comprised 2.3% of the flexure strength.
1.2. Aim of This Work
While there is substantial literature on the use of agro-industrial waste in construction, a critical gap remains in studies that simultaneously assess the mechanical, thermal, and acoustic properties of bio-bricks—an integrated performance profile essential for sustainable housing solutions. No previous study has specifically investigated bio-bricks made from coffee husks and bovine excreta in terms of their combined mechanical strength, thermal conductivity, and acoustic insulation capabilities to the best of our knowledge. This integrated approach is crucial for validating these materials not just as structural alternatives, but as holistic solutions for energy-efficient, low-cost, and comfortable housing.
In response to this gap, the present study evaluates the feasibility of using coffee husks and bovine excreta as sustainable raw materials for bio-brick production. By examining their thermal, acoustic, physical, and mechanical behavior, this work provides a comprehensive analysis of their performance. Ultimately, the research aims to contribute to the development of high-quality, eco-efficient building materials that address both environmental and economic challenges in the construction sector.
2. Materials and Methods
Biomaterials in construction are a new line of innovation, allowing for advances in the development of new elements applied to architecture and construction [27]. For this research, biomaterials, such as lignin and bovine excreta, were characterized, thus evaluating the mechanical properties of the optimal mixture for the elaboration of the biomaterial. Figure 1 shows the flowchart step-by-step methodology employed in this study to evaluate bio-bricks’ performance, statistically considering different dosages used in experimental work. Note that, in terms of efficiency, it is important to evaluate properties in materials or products for the construction sector [18], such as mechanical resistance, humidity, and thermal and acoustic performance [28].
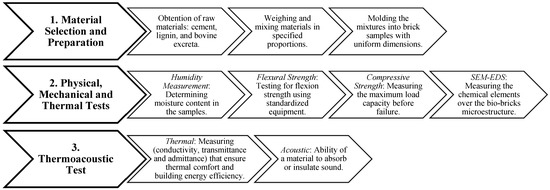
Figure 1.
Step-by-step methodology employed.
2.1. Selection and Preparation of Materials
The raw materials used in this study included ordinary Portland cement (OPC Type I, 42.5R), coffee husks, and bovine excreta. The cement was sourced from a local supplier in Ocaña, Colombia, and complies with the requirements of NTC-121 (Colombian Technical Standard) [29], serving as the primary binder in the bio-brick formulation due to its high reactivity and structural contribution.
Coffee husks, an abundant agricultural byproduct from coffee processing, were dried, ground, and sieved using a 200-mesh sieve to obtain a fine lignocellulosic powder (see Figure 2) [9]. Although coffee husks were not subjected to thermal activation (i.e., calcination), they contain a significant proportion of amorphous silica and polyphenolic compounds. These components can contribute to partial pozzolanic activity under alkaline conditions, as reported by several studies, particularly when combined with cementitious binders. However, their reactivity is lower compared to thermally activated pozzolans.
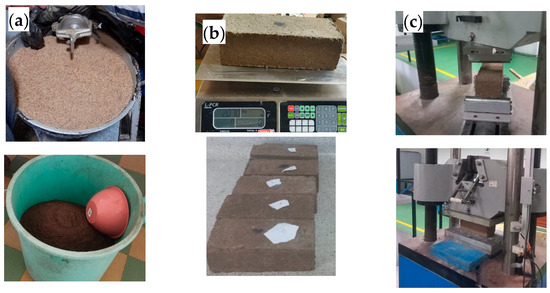
Figure 2.
(a) Biomaterials preparation (lignin and excreta), (b) development of bio-bricks, and (c) experimental tests.
Bovine excreta was collected from a local cattle farm in Ocaña and subjected to a lime stabilization process to ensure hygienic safety and reduce pathogenic load. The treatment was conducted by mixing bovine excreta with 10 wt.% of hydrated lime (Ca(OH)2), following the ratio used in biosanitation processes for organic waste. Note that 3 kg of lime and 25 kg of bovine excreta were used. This treatment also contributed to the initial alkalinity of the mixture, which may enhance the reactivity of organic compounds.
These organic components—coffee husks and bovine excreta—are traditionally used in vernacular construction techniques, such as bareque, and were selected for their low environmental impact and their potential cohesive and insulating properties. Notably, using uncalcined coffee husks avoids the high CO2 emissions associated with furnace processing, aligning with sustainable construction practices and reducing the carbon footprint of the final product. Notably, the incorporation of lignin into concrete has been shown to significantly enhance compressive strength due to its pozzolanic activity when used as an additive, forming calcium hydroxide (Ca(OH)2. However, in this study, lignin was utilized in its natural form as a coffee husk without undergoing calcination in industrial furnaces, since such processes contribute to increased greenhouse gas emissions and exacerbate global warming [30].
2.2. Experimental Mix Design and Optimization
The mixture proportions were established using experimental design to systematically investigate the effects of varying cement, lignin, and bovine excreta contents on the material properties. Ordinary Portland cement (OPC) Type I content was maintained within a fixed range of 59–64% by weight based on preliminary tests and the literature recommendations to ensure sufficient binder availability for structural integrity. The proportions of lignin and bovine excreta were varied accordingly within the remaining fraction (0–100% of the non-cement components).
Mixture experiments were conducted to evaluate the physical–mechanical properties and interactions among components. The optimal formulation was identified as 960 g of cement, 225 g of lignin, and 315 g of bovine excreta, which yielded the highest compressive strength (~1.7 MPa), with a density of approximately 0.893 g/cm3, as was previously determined in [31]. The elemental mix compositions are presented in Table 1.

Table 1.
Experimental mix compositions for bio-brick.
A step-by-step process was followed for homogenization and compaction. The materials were mixed with 390 g of water and compacted in successive layers to minimize porosity and ensure structural integrity. The production of bio-bricks involved several carefully controlled steps, as shown in Figure 3. These steps were as follows:

Figure 3.
(a) Material processing (grinding and sieving), (b) measuring the ingredients, (c) mixing of dry and wet components, (d) layer compaction and casting, and (e) sun drying of molded bricks.
- Biomaterials preparation: All raw materials were pre-weighed according to the selected formulation.
- Mixing: Dry components (cement, ground coffee husks, and lime-treated bovine excreta) were first homogenized manually for 2 min. Then, water was added gradually, and the mixture was mechanically stirred using a concrete mixer for 8–10 min until a uniform and workable consistency was achieved.
- Compaction: The fresh mixture was placed into metal molds (24 cm × 10 cm × 7 cm) in three successive layers, each compacted manually using a steel tamper to minimize porosity and ensure uniform density. No vibration table was used.
- Molding and demolding: Molds were left to rest for 24 h at room temperature before demolding to ensure adequate setting.
- Curing: After demolding, the samples were cured by natural air drying under shade for 28 days in a covered and ventilated space, avoiding direct sunlight and rain. Ambient curing conditions were approximately 25–30 °C and 60–70% relative humidity.
As Goos et al., 2016 [32] described, mixture design entails analyzing the ratios of each component within the formulation. The type and behavior of these variables determine the appropriate regression models and experimental strategies to be employed. Such designs are intended to forecast the response or optimal formulation by exploring a range of combinations, beginning with an initial mix and introducing controlled variations through probabilistic methods to enhance the biomaterial’s performance. Acceptable limits for each variable were defined through iterative testing and replication, enabling assessment of how changes influence material properties. The resulting data allowed the development of predictive relationships between strength and component proportions. Compressive strength exhibited a linear relationship with cement, lignin, and bovine excreta quantities. In line with the recommendations by Goel et al. (2017) [33], this study adopted proportion adjustments of 5%, 10%, 15%, and 20% to evaluate effects on compressive and flexural strength, water absorption, and apparent density.
2.3. Fabrication of Bio-Bricks
The manufacturing process involved five key steps, namely the collection of materials, preparation and sieving, homogenization, molding, and sun drying. Each mixture was blended with 390 g of water and compacted into layers to avoid porosity and ensure uniformity. The final brick dimensions were 24 cm × 10 cm × 7 cm (see Figure 4). Compacting pressure, layer thickness, and curing time were optimized based on mechanical performance.
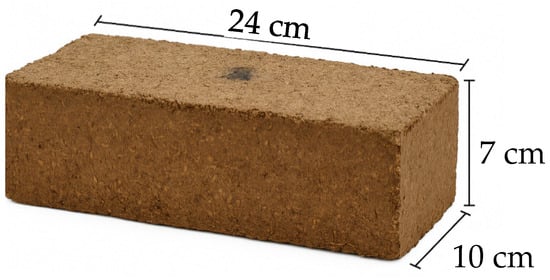
Figure 4.
Biomaterial sample.
2.4. Mechanical and Physical Characterization
For all cases, measurements were conducted under controlled conditions (humidity > 50% and environmental temperature of ~28 °C), and thermal conductivity values were obtained by observing steady-state heat transfer through the sample. Also, each test was replicated at least five times to guarantee the statistical significance of the results obtained.
Also, the samples made from biomaterial’s were subjected to compressive and flexural strength considering the Colombian standards NTC-4017 and NTC-4205 [34,35]. Note that, in these Colombian standards, a procedure to develop the final moisture absorption was considered. However, the density was obtained following the guidelines proposed in [36].
The porosity test was used to determine the capacity of the biomaterial to absorb water, a property directly related to its durability and resistance to external environmental conditions. The procedure follows the standard method described in [37] and consists of the following steps:
Sample selection: A representative sample from the produced batch of biomaterial was selected. All samples were ensured to be completely dry and free from surface residues before testing.
Initial weighing (dry weight): The dry sample was placed on a precision balance to determine its dry weight (Pdry).
Water immersion: The dry biomaterial sample was submerged in water for 24 h to ensure complete saturation of its internal pore structure.
Saturated weighing: After immersion, the sample was removed from the water, and its surface was gently wiped with a damp cloth to eliminate excess surface water. The saturated weight (Psat) was then measured using the same precision balance.
Pore volume calculation: This process was developed using the following Equation (1):
where is the pore volume of the biomaterial (cm3), is the saturated weight (g), is the dry weight (g), and is the density of water (1 g/cm3).
Porosity calculation: The porosity percentage PPP was calculated using the following Equation (2), based on the total volume of the biomaterial:
where P is the porosity (%), is the pore volume (cm3), and : is the total volume of the biomaterial sample (cm3).
2.5. Thermal Characterization
Thermal Analysis
Thermal properties are crucial in understanding how materials respond to temperature changes, especially in energy-efficient construction and passive building design. This section analyzes three key thermal properties, namely conductivity, transmittance, and admittance. These properties determine how well materials conduct, transmit, and absorb heat, influencing their effectiveness in regulating indoor climate. Thermal conductivity (λ) measures the material’s ability to transfer heat, while thermal transmittance (U) quantifies the rate at which heat passes through a material layer. On the other hand, thermal admittance (Y) evaluates a material’s capacity to absorb and release heat in response to fluctuating environmental temperatures. Each property was experimentally determined through standardized methods, and the results were discussed regarding their implications for sustainable building practices.
Thermal conductivity (K) is a fundamental property that measures a material’s ability to conduct heat. It was experimentally determined using a steady-state heat flow method, employing a heat flow meter or similar device [38]. In this work, the following Equation (3) was used to estimate K values:
where Q is the heat transfer rate (W), K is the thermal conductivity value of the material (W/(m×K)), A is the area normal to the direction of heat flow (m2), and dT/dx is the temperature gradient (K/m). In other cases, the thermal conductivity (λ) is calculated based on Fourier’s law of heat conduction, as is shown in the following Equation (4):
where Q is the heat flow (W), e is the material thickness (m), A is the cross-sectional area of the material (m2), and ΔT is the temperature difference across the material (°C or K). The measurements were taken under controlled conditions, and the thermal conductivity was determined by observing the steady-state heat transfer through the material sample.
Thermal transmittance (U) represents the heat transfer rate through a material layer per unit area per unit temperature difference. U was calculated using the following Equation (5) derived from Fourier’s law:
where λ is the thermal conductivity (W/(m×K)) and e is the thickness of the material layer (m). This formula assumes steady-state heat conduction and estimates how well a material allows heat to pass through it. A higher transmittance value indicates that the material allows more heat flow.
Thermal admittance (Y) measures a material’s ability to absorb and release heat in response to temperature fluctuations. It is particularly useful for evaluating materials in passive building design, where rapid heat exchange is necessary for maintaining comfort. The thermal admittance is calculated using the following Equation (6):
where λ is the thermal conductivity (W/(m×K)), ρ is the material density (kg/m3), c is the material-specific heat capacity (J/kg×K), and e is the material layer thickness (m). This equation accounts for the material’s capacity to store heat (through density and specific heat) and its ability to conduct heat. A higher value of thermal admittance means the material will absorb and release heat more slowly, contributing to thermal lag, while lower values suggest quicker response times, which are beneficial in climates with large daily temperature variations.
2.6. Chemical Characterization
2.6.1. Micrographs of the Mixture by SEM-EDS Technique
The microstructural and elemental characterization of the bio-brick composite was carried out using scanning electron microscopy coupled with energy-dispersive X-ray spectroscopy (SEM-EDS). Micrographs of the mixture were obtained using a JEOL JCM-6000 operating at 15 kV with an Ultradry EDS detector, as is shown in Figure 5. Samples were gold-coated before analysis to ensure surface conductivity [39,40].

Figure 5.
Procedure used for the SEM-EDS test. (a) Sample placement, (b) analysis initiation, (c) sample focusing, (d) detection process, and (e) data collection.
SEM analysis allowed visualization of the morphology, porosity, and particle distribution within the cementitious matrix, highlighting the interaction between organic and inorganic phases. The fibrous structures of coffee husks and the dense cementitious phases were distinguishable, indicating good adhesion and integration. EDS was employed to determine the elemental composition of the sample. This analysis provides both qualitative and semi-quantitative data on the chemical elements present. The main detected elements were oxygen (O), calcium (Ca), carbon (C), silicon (Si), and aluminum (Al), which are associated with cement hydration products and organic components. The EDS spectra confirmed the presence of calcium-rich phases (e.g., Ca(OH)2 and CaCO3) and carbon-rich regions corresponding to the coffee husk and manure.
2.6.2. Fourier Transform Infrared Spectroscopy (FTIR)
The FTIR test was carried out using a spectrometer, an instrument designed to analyze the chemical composition of a sample, as illustrated in Figure 6. This technique enables the detection of chemical components by measuring the absorption of infrared radiation emitted by the molecules. Additionally, the test evaluates the instrument’s performance at temperatures ranging from 0 to 800 °C. For this analysis, a Binder brand FTIR spectrometer from the University of Antioquia was used to assess the composition of the coffee husk. The equipment features a digital interface that facilitates monitoring and recording the data collected during the experiment, simplifying subsequent analysis.

Figure 6.
Equipment used for the FITR test. (a) Placing the sample in the reader, (b) starting the FTIR analysis, and (c) analysis results.
2.6.3. Thermogravimetric Analysis (TGA)
TGA is widely used across various fields, including chemistry, materials science, pharmacology, and in the food industry [41]. For the development of this analysis, a TGA-Q500/V20-13-Build-39 instrument was used, following the guidelines established by ASTM standard E-1131-08, as shown in Figure 7. Additionally, the test was conducted under the following controlled gas flow conditions: N2 balance at 40 mL/min, O2 furnace at 60 mL/min, N2 at 60 mL/min, and synthetic air at 60 mL/min.

Figure 7.
Procedure used for the TGA test. (a) Sample preparation, (b) sample placement in the crucible, (c) beginning of analysis, and (d) results analysis.
Regarding the temperature, a mass change is observed due to the standard magnetic transition of Ni. The extrapolated experimental temperature (Te) at the endpoint of the transition is determined and compared to the material’s theoretical transition temperature (Tt), yielding Tt = 346.94 °C and Te = 360.00 °C. The mass change generated during the magnetic transition of Ni is caused by the shift from a magnetic to a paramagnetic phase in the presence of a magnetic field.
2.7. Thermal and Acoustic Results
Thermoacoustic behavior was evaluated through laboratory and field studies. In the lab, transmission loss was analyzed using a reverberation chamber (ISO 16283-3:2016) [42], with measurements across one-third octave bands (387–10,000 Hz) using a calibrated BK 732 sound level meter and a PreSonus Eris E4.5 speaker.
Field tests were conducted in three cities (Aguachica, Bello, El Peñol) representing different Colombian thermal zones (warm, temperate, and cold), as was previously mentioned. Two 1.0 m3 test modules (one built with the bio-brick and the other with clay brick) were instrumented with HOBO data loggers to monitor dry-bulb temperature and relative humidity over a one-week period. These results were used to assess thermal comfort and energy performance.
2.7.1. Thermal Insulation Analysis
The thermal insulation capacity of a material is defined by its thermal conductivity coefficient (λ), which, in the case of wall systems, varies depending on apparent density, similar to its mechanical properties [43]. The relevance of thermal insulation lies in the current emphasis on sustainability and energy efficiency in buildings. Effective insulation and well-designed systems help reduce energy consumption, lower CO2 emissions, and improve user comfort. Thermal comfort, as defined by ISO 7730:2005 [44], is a state of mind that expresses satisfaction with the thermal environment and requires subjective evaluation.
Two free-standing cubic modules of 1.0 m3 were built for this analysis with walls (dividing elements). The first was constructed with biomaterial blocks, and the second was made of Catalan brick. Both modules had an 8.0 cm-thick expanded polystyrene (EPS) roof slab. They were placed in a location where direct solar radiation in the afternoon would strike the reference wall directly, in the municipalities of Aguachica, Bello, and El Peñol—each at different altitudes above sea level and representing different climatic conditions, namely hot and humid (Aguachica), temperate (Bello), and cold (El Peñol), as shown in Figure 8 and Figure 9.
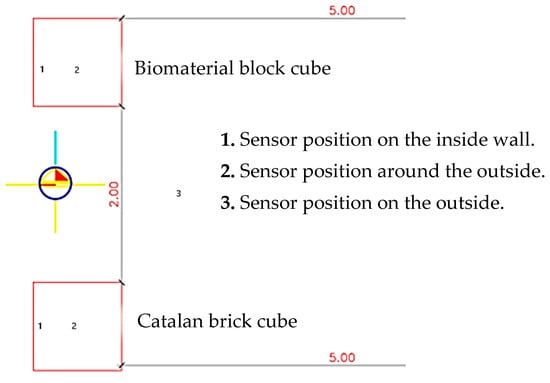
Figure 8.
Configuration of sensors for thermal tests.
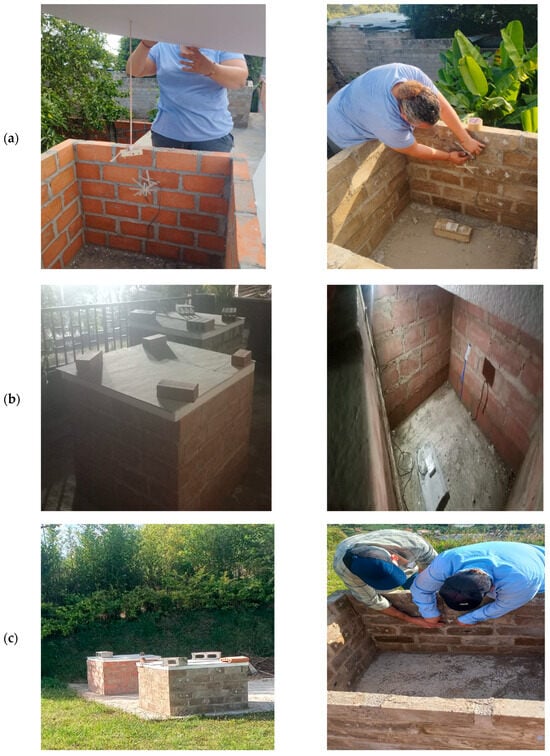
Figure 9.
Construction and installation of sensors in: (a) Aguachica—Cesar, (b) Bello, Antioquia, and (c) El Peñol, Antioquia.
Two sensors were installed inside each module to measure dry-bulb temperature and relative humidity. Measurements were taken every 5 min for one week to collect real data that could be averaged and compared to identify trends in the thermal behavior inside the constructed modules. A third external sensor complemented this information to measure dry temperature and relative humidity.
Thermal comfort depends on physical activity levels and the type of clothing worn by building occupants. Generally, thermal comfort is achieved between 21 °C and 25 °C, with relative humidity ranging from 20% to 75% [45]. Other influencing factors include clothing insulation, activity type, vapor pressure, and air velocity. Various models exist to assess thermal comfort, among which Fanger’s model is widely recognized [46].
The thermal characterization of buildings involves a set of procedures based on available technology for measuring climatic variables, an understanding of the phenomena under study, and control of factors that may compromise the reliability of the results. This experimental thermal analysis aims to identify the thermal performance of two housing construction systems. Programmable remote sensors are used to automate the measurement of dry-bulb temperature and relative humidity inside wall cubes exposed to outdoor conditions across three representative thermal floors, namely warm (0–1000 m.a.s.l), temperate (1000–2000 m.a.s.l.), and cold (above 2000 m.a.s.l.). The resulting data will allow a comparison of thermal performance and the development of synthetic climate files for simulation software input [47].
Figure 10 presents a bioclimatic chart that correlates climatic variables, such as air temperature, relative humidity, solar radiation, wind, and evaporation. These variables interact to determine human thermal comfort based on environmental conditions. The diagram highlights the following zones:
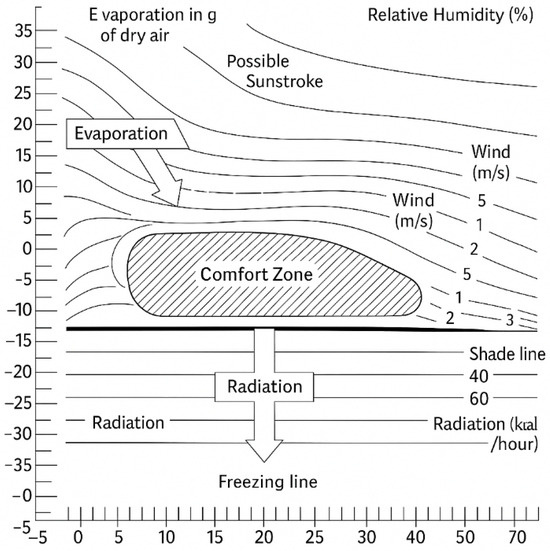
Figure 10.
Bioclimatic diagram. Source: modified from [48].
- Comfort zone: A shaded area in the center representing the optimal combination of temperature, humidity, and wind speed for moderate activity levels.
- Evaporation: Shows how increased evaporation facilitates body cooling in hot and humid climates.
- Radiation: Illustrates the impact of solar radiation on thermal perception, potentially intensifying heat or causing discomfort due to sun exposure.
- Wind: Indicates the role of wind in enhancing ventilation and dissipating body heat under warm conditions.
- Shadow line and freezing line: Mark the extremes of solar radiation and low temperatures that affect human comfort.
Other relevant thermal variables that need to be measured for the method’s application include air temperature, mean radiant temperature, relative humidity, and air velocity. In this study, the two measurable factors are mean radiant temperature (MRT) and relative humidity, which were obtained on-site and used for the analysis.
The mean radiant temperature of an indoor space is defined as the uniform temperature of an imaginary enclosure where the heat exchange by radiation between a person and the enclosure is equal to that in the actual space with real surface temperatures [49]. Relative humidity, however, is the ratio of the actual water vapor content in the air to the maximum it can hold at a given temperature. Since cooler air holds less moisture, changes in air temperature can alter relative humidity even if absolute humidity remains constant [50]. Additionally, operative temperature is the uniform temperature of an imaginary black enclosure in which an occupant would exchange the same heat by radiation and convection as in the actual non-uniform environment. It is calculated as a weighted average of the mean radiant temperature and the air dry-bulb temperature, factoring in the respective heat transfer coefficients for radiation and convection [51].
In Colombian regulations, thermal comfort is not currently addressed in building legislation (Decree 1077 of 2015; Law 400 of 1997), largely due to the subjective nature of this factor, which complicates standardization. However, in recent years, sustainable construction projects promising higher performance and environmental integration have emerged, pointing toward the need for future regulations. Thermal performance is increasingly relevant in residential construction.
2.7.2. Thermoacoustic Analysis
Bioclimatic architecture represents a design approach that prioritizes harmony and balance with the environment. It considers local climate and environmental conditions to achieve indoor thermal comfort through passive strategies, such as building orientation, geometry, and material selection [52]. This architectural approach seeks to minimize mechanical systems’ use, treating them as supplementary. It integrates site conditions, solar path, prevailing winds, and native vegetation into the spatial layout, window placement, and overall architectural design to enhance energy efficiency. Rather than relying on novel inventions, bioclimatic design aims to maximize the utility of natural resources through intelligent application [53].
Sustainable construction complements bioclimatic principles by incorporating passive and active measures in building design and construction to meet minimum energy and water savings standards, as established in Resolution 549 of 2015. The objective is to enhance occupants’ quality of life and promote environmentally and socially responsible practices [54]. A sustainable building operates harmoniously with its surroundings, utilizing resources efficiently while ensuring indoor comfort and health. Common sustainable building features include energy and water efficiency, low-embodied energy materials, indoor environmental quality, site sustainability, and integration with the urban environment.
Current trends in construction emphasize the development and adaptation of materials that provide improved economic, social, and environmental benefits. Traditional rigid and heavy components are being replaced by simpler, lightweight materials with comparable structural performance [55]. In this context, using regionally sourced materials from Norte de Santander, combined with traditional construction techniques, offers promising alternatives with enhanced energy absorption—an essential property for effective thermal and acoustic insulation. Thermal and acoustic insulators reduce temperature transmission, providing protection against heat and cold, thereby promoting indoor thermal comfort when used in wall construction [56].
Given the importance of thermal and acoustic insulation, this study evaluates a bio-based material’s thermal conductivity and sound absorption/transmission performance using both laboratory testing and field measurements. These evaluations were conducted in the Bioclimatic Architecture Laboratory of the Faculty of Architecture at the National University of Colombia (Medellín campus) and in three Colombian municipalities with diverse climates, namely Aguachica (warm), Bello (temperate), and El Peñol (cold). The goal was to assess the material’s performance across different climatic conditions.
Noise, a complex physical phenomenon, poses a significant challenge due to its omnidirectional wave propagation and potentially disruptive impact on communities. Urban elements, such as street sections, building materials, and architectural forms, significantly influence acoustic quality. Accurately identifying environmental noise sources and their characteristics is essential for optimal residential space planning [57].
Sound pressure and frequency are two key noise components, and their combination defines the acoustic disturbance that needs to be mitigated. According to Resolution 627 of 2006 from the Ministry of Environment, Housing, and Territorial Development, the permissible noise emission levels for residential areas are 55 dB(A) at night and 65 dB(A) during the day. For ambient noise, the limits are 50 dB(A) at night and 65 dB(A) during the day. However, the regulation lacks specifications by frequency ranges, which is critical for effective mitigation—e.g., traffic noise typically falls within low frequencies (125–500 Hz), whereas human speech is in the mid-frequency range (500–2000 Hz). Therefore, ensuring appropriate acoustic insulation in buildings is fundamental for achieving habitable and efficient environments [58].
Acoustic transmission and the transmission loss index (STC) can be evaluated through the simple transmission loss (STL) method using a scaled anechoic chamber following ISO 140-1:1997 standard procedures [59]. Measurements are made using a calibrated BK Precision 732 sound level meter and a loudspeaker emitting frequencies across the spectrum [60]. Sound pressure levels are reduced in a receiving room separated by a partition incorporating the test material. These measurements follow the ISO 16283-3:2016 standard [42] for in situ acoustic insulation assessment.
The experimental setup includes an anechoic chamber with a sound source (F), a test specimen mounted in a flexible, airtight mass–air–mass frame with a standard STC rating of 50 (Figure 11), and a calibrated measurement system. Frequencies used for testing include one-third octave bands from 387 Hz to 10,079 Hz at 90 dBA. Note that Hobo brand datalogger-type sensors were used.
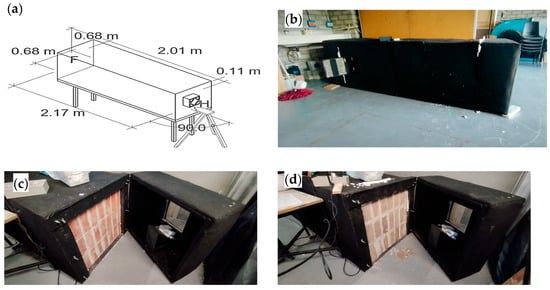
Figure 11.
Acoustic transmission chamber. (a) Geometry and (b) actual model of the test equipment. (c) Absorbent chamber, Catalan brick wall, and (d) biomaterial wall.
The reverberation chamber method based on UNE-EN ISO 354:2004 was employed to determine the sound absorption coefficient of each sample. The process involves the following steps:
- ⮚
- Step 1. Calibration: Perform baseline measurements with the empty chamber and each test sample. Per technical guidelines, the reverberation time (TR) should be approximately 1.0 s. The absorption coefficient (α), which ranges between 0 and 1, is calculated using the following Equation (7):where V is the room volume (m3) and A is the total absorption area, given by , where As is the surface area and Ca is the absorption coefficient.
- ⮚
- Step 2. Sine sweep: Apply the impulse response method using a sine sweep signal, as specified in UNE-EN ISO 354:2004. Use two sound source positions and six random microphone positions per source.
- ⮚
- Step 3. Data processing: Use Audacity-V3 software to generate the test signals and record reverberation times. Data was organized by one-third octave bands for enhanced accuracy and standardization. Using the T30 method, results are averaged to obtain the sound absorption coefficient for each sample.
This frequency-based organization allows for more precise characterization of the acoustic performance of building materials across a wide range of sound frequencies, supporting informed design decisions for sustainable and habitable architecture (see Figure 12).
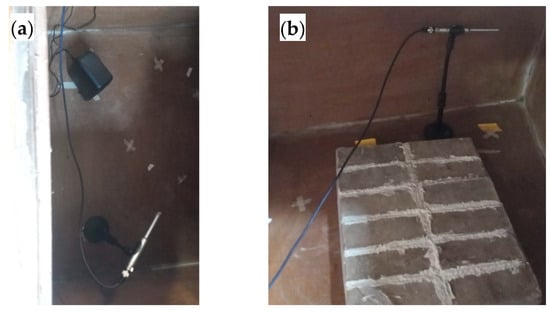
Figure 12.
(a) Acoustic transmission test and (b) transmission index.
3. Results and Discussion
3.1. Mechanical, Physical, and Thermal Results
3.1.1. Compression Strength Results
The compressive strength test results are presented in Table 2, and it was observed that the biomaterial formulated with a 5% mixture exhibited the lowest strength value (1.56 MPa) compared to conventional fired clay bricks (5.91 MPa). Notably, the 20% mixture yielded the highest compressive strength among the bio-brick samples (1.84 MPa); however, during the curing process, the material showed detachment and cracking, which resulted in a lower maximum load capacity (44.5 kN). It is important to note that the fired clay bricks used for comparison were commercially sourced from a hardware store in Ocaña City. Furthermore, when comparing the results with the Colombian technical standard NTC 4205, it was confirmed that both the conventional fired clay bricks produced in Ocaña, Norte de Santander, and the experimental bio-bricks met the minimum compressive strength requirement of 1.4 MPa established for non-structural masonry units made of fired clay [61,62]. Note that coffee husk (as a lignin source) was partially replaced in the mix, with cement and lime-stabilized bovine excreta making up the remaining proportion.

Table 2.
Compression test averages under different coffee husk dosages.
Figure 13 shows that the bio-brick exhibits a type 2 failure pattern characterized by conoidal fractures at one end of the specimen. This behavior is consistent with the failure modes defined in the technical specifications of the Colombian Road Institute (INV-E-410-13).
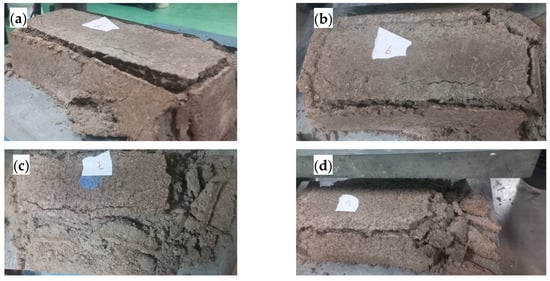
Figure 13.
Bricks tested in terms of compression on a universal machine. (a) Deformation of the brick on the top face, (b) separation of the brick’s side face, (c) failure by crushing depending on the resulting deformation, and (d) preservation of the brick core.
Figure 14 shows that among all bio-aggregates, T.R.A (treated recycled aggregate) exhibited the highest compressive strength (~75 MPa), surpassing standard concrete and fired clay. Other materials, like recycled aggregate (R.A) and recycled concrete (R.C) also performed well (~70 MPa and ~45 MPa, respectively). In contrast, agricultural residues, such as sunflower stem, cornstalk, and sunflower pith, showed much lower strengths (3–10 MPa), making them suitable only for insulating or non-structural applications unless modified or reinforced [63].
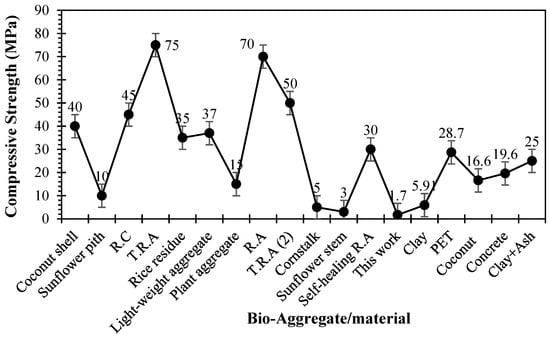
Figure 14.
Comparison of the compressive strength. Source: obtained from [36,40,64,65].
The compressive strength values obtained for the bio-bricks ranged between 1.56 MPa and 1.84 MPa, complying with the minimum requirement established by the Colombian technical standard NTC 4205 (≥1.4 MPa) for non-loadbearing masonry units. The 20% coffee husk mixture exhibited the highest compressive strength at 1.84 MPa, likely due to its higher fibrous content, which may have improved internal cohesion and compaction. However, visible cracking and detachment during curing were observed in these samples, possibly resulting from material shrinkage and reduced binder efficacy at high organic contents.
Conversely, the 15% mixture was more balanced, reaching 1.70 MPa without visible deterioration. This behavior suggests that moderate additions of lignocellulosic material, such as coffee husk, promote effective stress distribution through enhanced particle interlocking and internal bonding. The interaction of organic fibers with cement and lime likely facilitates secondary pozzolanic reactions, contributing to mechanical strength over time. The reference samples made from ceramic fire bricks exhibited a compressive strength of 5.91 MPa, which is within the expected range for traditional ceramic masonry units.
In this context, the coffee husk and bovine excreta composite (1.70 MPa) positions itself as a moderate-performing material, which is promising for eco-efficient, lightweight, non-loadbearing applications where thermal insulation and environmental impact are critical. While other materials, such as PET (20–30 MPa), coconut fiber composites, and clay–ash bricks, provide higher mechanical resistance, they may lack bio-based alternatives’ sustainability or thermal benefits.
3.1.2. Flexural Strength and Modulus of Rupture Test
The flexural strength (or modulus of rupture) of the bio-bricks was evaluated according to the procedures established in the Colombian seismic design code NSR-2010, Title D—Structural Masonry, using Table D.5.8-1 from Section D.5.8 as the reference for minimum performance requirements [34]. The standard defines a minimum modulus of rupture of 0.41 MPa for masonry samples.
As shown in Table 3, the 20% husk mixture reached the highest flexural strength value of 0.63 MPa, exceeding the minimum regulatory threshold. However, its high fiber content resulted in poor workability, molding difficulties, and higher failure pattern variability. Consequently, the 15% mixture reached 0.56 MPa and was selected for further experimentation due to its more favorable handling and stability.

Table 3.
Averages of the flexural test under different dosages of coffee husk.
The increased flexural strength with rising fiber content can be attributed to coffee husk fibers acting as micro-reinforcement. These fibers can bridge microcracks and delay crack propagation, improving post-cracking behavior. Additionally, they enhance the tensile zone of the specimen by promoting a more ductile failure mode. However, beyond 15–20%, excessive fiber content introduces heterogeneity, increased porosity, and moisture retention, which may negatively affect the matrix continuity and bonding. These aspects were observed in the demolding phase, where samples with 20% CC exhibited surface defects and edge deterioration.
In contrast, the ceramic brick sample showed the highest overall value (1.08 MPa), which is expected due to its dense, sintered microstructure and brittle behavior under flexural load. However, its failure mode was sudden and catastrophic, unlike the more gradual shear-related failures observed in the biomaterial blocks.
These results suggest that moderate fiber addition (10–15%) optimizes the balance between mechanical strength, workability, and durability. The coffee husk acts as a partial aggregate and contributes to energy dissipation through its fibrous, rough morphology, aligning with trends in other studies on lignocellulosic additives.
3.1.3. Final Moisture Absorption Test
This test was conducted following the procedures established in the Colombian Technical Standard NTC-4017 [34], which outlines the methodology for sampling and testing masonry units and other clay products. The water absorption capacity was evaluated by measuring the weight difference between dry and saturated specimens. The results are presented in Table 4.

Table 4.
Averages of the moisture absorption test under different dosages of coffee husk.
The 20% coffee husk mixture showed the highest water absorption value (37.26%) and partially disintegrated during testing, indicating poor structural cohesion and excessive porosity. In contrast, the 15% mixture exhibited 22.47% water absorption, a value comparable to those of the 5% and 10% mixtures (21.94% and 20.61%, respectively), suggesting that the matrix remains stable and better consolidated at these lower fiber dosages. According to NTC-4205 [35], the maximum acceptable water absorption for fired clay bricks intended for exterior use is 14%, a threshold that ensures resistance against environmental degradation. None of the tested biomaterial samples met this requirement, primarily due to the intrinsic properties of the organic components.
The increase in water absorption correlates strongly with two factors, namely decreased density and increased porosity. As the proportion of coffee husk rises, the total mass decreases, while the internal pore volume increases due to the organic particles’ irregular shape and fibrous nature. This results in a more open matrix that facilitates capillary absorption. The 20% mixture had the lowest dry density and the highest porosity, making it the most hydrophilic and least dimensionally stable.
Moreover, lignocellulosic materials, such as coffee husks, are naturally hygroscopic and tend to retain and absorb water through surface interaction and internal micro-capillaries. Although this may be advantageous for thermal insulation, it is a disadvantage in applications with critical dimensional stability and durability under moisture exposure.
The ceramic brick reference showed an absorption rate of 14.63%, just above the regulatory threshold, typical of industrial masonry units made from fired clay. Its dense and sintered microstructure allows it to limit water absorption effectively, unlike the more porous biomaterial bricks. Note that moderate inclusion of organic matter (≤15%) maintains structural integrity and controls moisture absorption within acceptable limits for specific interior applications. However, higher dosages result in critical porosity and performance loss, limiting their use in environments with high moisture exposure [62].
The water absorption of the 15% coffee husk mixture (22.47%) exceeds the 14% limit established by NTC-4205 for exterior masonry, mainly due to its increased porosity and the hygroscopic nature of lignocellulosic fibers. To address this, several strategies are proposed, including applying hydrophobic surface coatings (such as silanes or polymer emulsions) to reduce moisture ingress while maintaining vapor permeability; incorporating hydrophobic additives (like calcium stearate or paraffin wax) during mixing to lower capillary absorption; and using densification techniques, including higher compaction or pozzolanic additives (e.g., rice husk ash), to reduce porosity and improve cohesion. A combined approach of densification and hydrophobic treatment is recommended for optimal durability, especially in humid environments, with further studies needed to evaluate long-term performance.
3.1.4. Physical Results
The Abrams cone test determined that the slump was 1.5 cm, within the allowable slump range for the test, where the value should be less than or equal to one inch. Additionally, it is important to note that, due to the organic and unconventional nature of the biomaterial components, the workability results may vary significantly compared to traditional clay bricks or concrete.
Density Test Result
This test evaluated the bulk density of the biomaterial blocks by measuring the ratio between mass and volume for each sample. Organic materials, such as coffee husks and bovine excreta, possess inherently lower densities than mineral components, such as clay or sand, and their inclusion significantly influences the final density of the bio-bricks.
As shown in Table 5, the density of the specimens decreased progressively with increasing coffee husk content. The optimal mixture (15% coffee husk) recorded the lowest density at 0.9137 g/cm3, approximately 42% lower than the reference clay brick (1.574 g/cm3). The 10% mixture unexpectedly showed a higher density (1.6120 g/cm3), which may be attributed to experimental variability or better compaction during that specific batch.

Table 5.
Averages of the density test under different dosages of coffee husk.
The reduction in density is primarily explained by the following two interrelated factors: (1) The low specific gravity of bio-additives: Coffee husks and bovine excreta are composed of fibrous, porous organic matter with lower intrinsic mass per unit volume. Their substitution of denser components, like cement or clay, reduces the overall density of the mix. (2) Increased internal porosity: As the proportion of bio-additives increases, the microstructure becomes more heterogeneous and porous. These pores, whether interparticle or intraparticle, trap air and reduce the adequate solid volume, resulting in a lower measured density.
These changes are relevant in construction, as lower-density blocks reduce the dead load applied to structural elements, which can be advantageous for specific architectural applications. However, this benefit must be balanced against mechanical performance and durability, especially in loadbearing scenarios. The ceramic brick, used as a benchmark, demonstrated a density of 1.574 g/cm3, consistent with its compact and fired microstructure, which ensures low porosity and high mass concentration.
Biomaterials offer a viable alternative for lightweight, non-structural applications (dividing elements), with the added benefit of reducing construction material weight and facilitating handling and transportation. However, their higher organic content (>15%) may compromise mechanical performance, as seen in parallel strength and absorption tests, and, thus, should be carefully optimized.
Table 6 presents the mechanical and physical properties of various biomaterials used in bio-bricks, highlighting their suitability for different construction applications. When compared to conventional clay bricks, the coffee husk and bovine excreta composite (15%) shows significantly lower compressive strength (1.70 ± 0.11 MPa) and flexural strength (0.56 ± 0.10 MPa) while also having a much lower density (913.7 kg/m3), which makes it lighter. Conventional clay bricks, in contrast, have much higher compressive strength (5.91 ± 0.36 MPa) and flexural strength (1.08 ± 0.23 MPa), with a higher density of 1574 kg/m3, making them heavier and less suitable for reducing dead loads in buildings. However, the coffee husk composite exhibits a much higher water absorption rate (22.47%) than clay bricks (14.63%), indicating that while it offers a lighter weight, it requires further improvements to be more durable, especially for exterior applications. Other biomaterials, such as the wood–cement composite and modified wood–cement composite, show significantly higher mechanical performance and densities, making them more suitable for structural applications. In contrast, while offering good eco-efficiency, plant waste composites also exhibit high water absorption, challenging their durability unless treated.

Table 6.
Mechanical and physical properties of some biomaterial in bio-bricks.
Although the mechanical properties of the proposed composite (compressive strength ≈ 1.70 MPa; flexural strength ≈ 0.56 MPa) satisfy the minimum requirements for non-structural masonry applications according to Colombian guidelines (e.g., NSR-10). However, according to ASTM-C90 [66] (the Standard Specification for Loadbearing Concrete Masonry Units), the minimum compressive strength for individual units is 13.1 MPa (1900 psi), which significantly exceeds the values obtained in this work. Similarly, [67] (the European Standard for clay masonry units) specifies that category I units must have characteristic compressive strengths ranging from 5 MPa to over 30 MPa, depending on the application and geometry. Thus, compared with these international standards, the proposed composite does not yet meet the loadbearing structural application threshold. However, its low density (≈913.7 kg/m3) and high porosity provide a compelling case for its use in non-structural elements, particularly in thermal or acoustic insulation, interior partitioning, or in applications where weight reduction and sustainability are prioritized over strength.
Porosity Test Results
The porosity test provides insight into the material’s capacity to absorb water and is closely related to its internal structure, durability, and resistance to environmental degradation. The results presented in Table 7 correspond to the bio-bricks’ total (or bulk) porosity, calculated as the ratio between the pore volume and the total sample volume.

Table 7.
Averages of the porosity test under different dosages of coffee husk.
The results reveal that wet weight (Ph) increases with coffee husk content up to 10%, reaching 2719.690 ± 751.318 g, then decreasing sharply to 15% (1541.678 ± 273.394 g). This variation suggests that adding organic matter, such as coffee husk, significantly alters the microstructure of the composite, affecting its water retention capacity. The initial increase in water absorption can be attributed to coffee husk particles’ hydrophilic and porous nature, which promote water uptake within the internal matrix. However, at 15%, the lower wet weight may reflect poor cohesion, excessive voids, or the collapse of internal channels, reducing the material’s ability to retain water effectively.
The pore volume (Vp) follows a similar trend, increasing to 11.707 ± 3.078 cm3 at 10% CC and dropping to 6.562 ± 0.814 cm3 at 15%. This trend indicates that moderate bio-aggregate inclusion enhances pore connectivity, while excessive amounts may disrupt the matrix integrity and collapse pore networks. In contrast, the solid volume (Vs) remains constant at 1,680 cm3, confirming that the structural core of the sample does not change; rather, the porosity is governed by the behavior of Vp and the added organic fraction.
Porosity (%), calculated as the ratio between pore volume and total volume (Equation (3)), ranges from 0.578 ± 0.186% (5%) to 0.692 ± 0.179% (10%) and then drops to 0.390 ± 0.048% (15%). These values are unusually low, which suggests two possibilities, as follows: (1) the results represent apparent porosity limited to accessible voids saturated by water, not total microscopic porosity, and (2) the dense cementitious matrix dominates the sample volume, minimizing measurable water-absorbent pores.
Despite the natural porosity of coffee husks, their effectiveness in increasing overall porosity appears to peak at around 10%, beyond which the material becomes structurally unstable or less water-absorbent. The unexpected drop in porosity at 15% may be related to particle agglomeration, resulting in blocked or disconnected pore pathways.
Finally, adding 10% coffee husk optimizes porosity and water absorption, while 15% may hinder performance due to material compaction, irregular distribution, or internal channel disruption. The results also raise the need to differentiate between apparent and true porosity, especially when dealing with fibrous and heterogeneous materials.
3.1.5. Thermal Analysis Results
The results obtained from this study align closely with those reported in the literature [6], particularly in terms of thermal conductivity and transmittance. Some materials, like concrete (1.70 W/(m×K)) and brick (0.63 W/(m×K)), demonstrated relatively high conductivity values, reflecting limited thermal resistance. In contrast, natural and organic materials, such as bamboo (0.07 W/(m×K)), paja (0.06 W/(m×K)), wood (0.14 W/(m×K)), and estera (0.12 W/(m×K)), exhibited much lower thermal conductivity, highlighting their potential as effective insulators (see Figure 15), while others, like calamine, had superior K values until (50 W/(m×K)). These findings are corroborated by our experimental analysis of coffee husk with bovine excreta (this work), which yielded a thermal conductivity value of approximately 0.19 ± 0.02 W/(m×K), reinforcing its classification as a low-conductivity material suitable for thermal insulation. According to [68], materials with low thermal conductivity are essential in applications that limit heat transfer, such as in eco-efficient construction systems designed for thermal comfort.
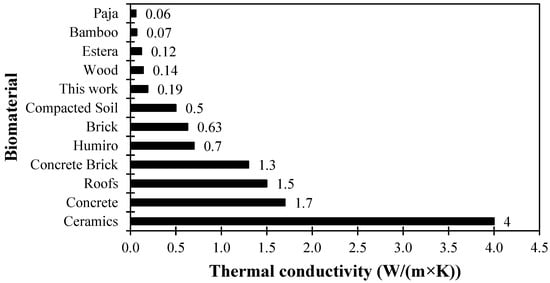
Figure 15.
Thermal conductivity of biomaterials in construction. Source: obtained from [24].
Note that the thermal conductivity value of 0.19 W/(m×K) obtained in this study is encouraging and places the coffee husk–bovine excreta composite among the low-conductivity materials suitable for thermal insulation. However, conventional insulation materials, such as mineral wool and expanded polystyrene, typically exhibit thermal conductivities of 0.03 to 0.04 W/(m×K), which are lower but in the same order of magnitude.
The comparison in Table 8 outlines the thermal performance of conventional and alternative construction materials, emphasizing their suitability for energy-efficient building envelopes. Industrial materials, like calamine and concrete, exhibit high thermal conductivity and admittance, meaning they quickly absorb heat and release it slowly, making them unsuitable for passive thermal design. In contrast, natural materials, such as straw, bamboo, and coffee husk composites, offer lower conductivity and transmittance, providing superior insulation.

Table 8.
Comparative thermal properties of conventional and natural construction materials.
The composite material developed in this study—combining coffee husk and bovine excreta—demonstrates a thermal conductivity of 0.19 W/(m×K), a thermal transmittance of 0.20 W/(m2×K), and a thermal admittance of 2.10 W/(m2×K). This behavior makes it a viable and sustainable alternative for construction in rural or tropical areas. Its low conductivity and moderate admittance balance ensure efficient insulation while maintaining responsiveness to daily thermal cycles, thus enhancing passive cooling strategies and improving indoor comfort. When considering thermal transmittance, calamine exhibits the poorest performance at 5.70 W/m2×K, followed by concrete brick (2.08 W/(m2×K)) and traditional brick (1.93 W/(m2×K)), indicating their inefficiency in minimizing heat transfer. On the other hand, other materials, like humiro (0.08 W/(m2×K)), straw (0.08 W/(m2×K)), and bamboo (1.00 W/(m2×K)), perform significantly better in terms of insulation, aligning with their low thermal conductivities. In terms of thermal admittance, calamine (10 W/(m2×K)), concrete (6 W/(m2×K)), and brick (5 W/(m2×K)) show the highest values, implying that these materials absorb and release heat slowly, which could contribute to indoor overheating. Conversely, bamboo and wood, with admittance values around 2 W/(m2×K), react more quickly to temperature changes, offering advantages for passive thermal regulation in tropical and subtropical climates.
These findings, consistent with the existing literature, underscore the potential of biogenic and agricultural waste materials—such as coffee husk—as sustainable building alternatives. Not only do these materials enhance thermal performance, but they also promote local resource use, reduce environmental impact, and decrease reliance on mechanical cooling systems. Their integration into passive design strategies is particularly beneficial in rural or tropical regions, where thermal comfort, energy efficiency, and cost-effectiveness are crucial.
Although the formulation includes a significant proportion of ordinary Portland cement (OPC) to ensure adequate structural and thermal performance, this study represents an initial step toward the development of more sustainable composite materials. Cement was used as a binding agent to stabilize the organic components and ensure the material’s integrity during testing. However, we recognize that high cement content affects the environmental footprint of the product. Future research will focus on reducing cement dosage by incorporating supplementary cementitious materials (SCMs), such as fly ash, calcined clays, or rice husk ash, and by enhancing the reinforcing effect of bio-based fibers to maintain mechanical performance while lowering environmental impact.
3.1.6. Thermogravimetric Analysis TGA Test
The thermogram of the optimal mixture (15%) (Figure 16), composed of coffee husk, bovine excreta, and cement, reveals three key stages of thermal degradation. The first, at around 180.54 °C, with a mass loss of 5.776%, is associated with removing moisture and volatile compounds in the organic materials. Between 200 °C and 600 °C, peaks are observed in the DTG curve, indicating the thermal decomposition of organic matter, primarily cellulose and lignin from the coffee husk and components from the bovine excreta. Finally, at temperatures close to 800 °C, a loss of 27.71% is recorded, attributed to the decomposition of carbonates and mineral phases of the cement. These results demonstrate the thermal stability of the mixture and the contribution of each component to its behavior at high temperatures, which is relevant for its use in sustainable construction materials [69].
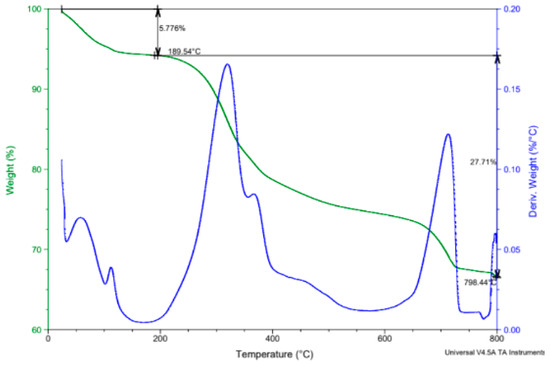
Figure 16.
Representative thermogram for the optimal mixture (15% CC).
3.2. Biomaterial Chemical Characterization
3.2.1. SEM-EDS Results
The scanning electron microscopy technique with energy dispersive X-ray spectroscopy (SEM-EDS) provides the opportunity to characterize materials by evaluating their morphology and elemental composition, as highlighted by [70]. SEM allows detailed observation of the texture, porosity, and elemental distribution in the tested sample. The signals generated by the interaction between electrons and sample atoms are captured to create high-resolution images [71].
During the SEM scan, EDS analysis is performed. In this laboratory analysis, incident electrons stimulate the emission of X-rays characteristic of the elements present in the sample collected by the EDS detector. Through spectrometric analysis, elements are identified, and their relative concentration is estimated. The experimental data collected for the optimal mixture allow for the possibility of creating a largely automated method for identifying and morphometrically measuring the various phases of materials that compose the biomaterial’s microstructure. This result reveals the diversity of information obtained and provides a detailed understanding of these materials, serving as a solid foundation for developing and improving fired clay bricks by applying micromechanical models. Additionally, correlations could be made with the biomaterial generated in this study.
In Figure 17, the constituent elements of the mortar tested for the EDS-SEM analysis are shown, and the chemical elements are shown in Table 8, with the corresponding percentage of content present in the sample.
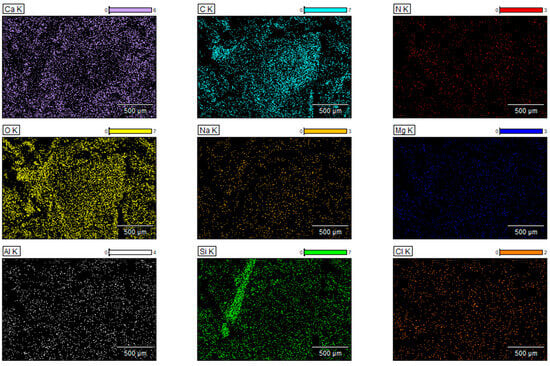
Figure 17.
SEM-EDS analysis.
From Table 9, it was observed that oxygen (O) is the predominant element, accounting for 42.13 wt.% and 53.09 at.%, reflecting the significant presence of oxygenated compounds, such as hydroxides and carbonates, derived from cement, lime, and manure. Calcium (Ca), with 35.14 wt.% and 17.68 at.%, is the second most abundant element, confirming its key structural role within the biomaterial matrix. Carbon (C), at 9.44 wt.% and 15.84 at.%, originates mainly from organic materials, such as coffee husk and manure, contributing to the cohesion and flexibility of the material.

Table 9.
Percentage concentration of the elements presents in the biomaterial.
Moreover, the presence of elements, such as silicon (Si) and aluminum (Al), though in smaller proportions, suggests that the incorporation of aluminosilicate compounds may enhance mechanical strength and thermal stability. The low sodium (Na) and chlorine (Cl) content indicates minimal levels of soluble salts, which is favorable for the durability of the biomaterial. Overall, this balanced composition demonstrates the effective integration of organic and inorganic materials in the mixture.
Additionally, a morphological analysis was performed on a powdered sample of the optimal mixture to identify its main characteristics, based on the SEM-EDS results of the composite biomaterial materials. Figure 18 shows the cement, coffee husk, lime, and bovine excreta compounds used to produce the studied biomaterials from the optimal mixture (15%).
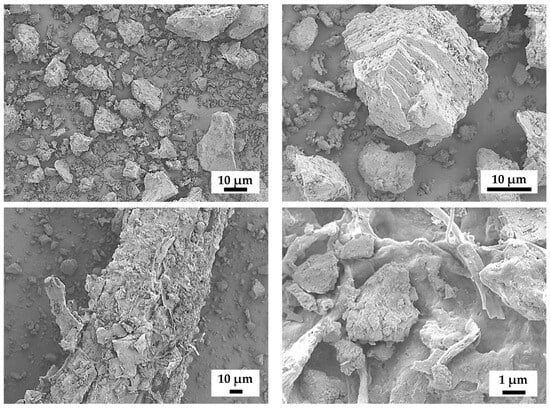
Figure 18.
Micrographs obtained for optimal mixing of the biomaterial.
The micrographs reveal a heterogeneous but well-integrated distribution of mineral particles and organic fibers. Cement and lime particles exhibit surface roughness and close contact with the fibrous components, which promotes cohesion and stress transfer within the matrix. The fibers derived from coffee husk and manure act as reinforcement, providing dimensional stability and enhancing the material’s flexural strength. This structural balance suggests a synergistic interaction among the components that contributes to the mechanical performance of the biomaterial.
Note that the composite biomaterial’s SEM images show fibers well embedded within the cementitious matrix, indicating good interfacial bonding. The micrographs reveal close contact between the coffee husk fibers, bovine excreta particles, and mineral components, such as cement and lime, which suggest effective stress transfer across the interface. No clear signs of fiber pull-out or interfacial debonding were observed in the SEM images, supporting the notion of strong adhesion between the organic fibers and the mineral matrix. This good bonding likely contributes to the improved flexural strength of the material by allowing the fibers to act as effective reinforcement, enhancing dimensional stability and resistance to cracking.
3.2.2. Fourier Transform Infrared (FTIR) Test
FTIR is an advanced method to identify the chemical composition and molecular interactions in construction materials. According to [72], providing a detailed description of the functional groups present in conventional clay bricks and how they interact with the matrix is crucial. This behavior could allow for a corresponding correlation with the biomaterial under investigation. Identifying the peaks and their relationship with functional groups is essential in advancing the development of enhanced materials and understanding the properties of construction materials, thus making the test a key component. In [72], researchers conducted a study where the spectra of various samples, including clay bricks and different forms of clay found in the region, were analyzed. Atomic emission spectrometry with inductively coupled plasma determined the samples’ main and trace elements.
Figure 19 shows the FTIR spectrum corresponding to the optimal mixture, which reveals different absorption bands characteristic of the functional groups present in the material. Below is an analysis of each region and band.
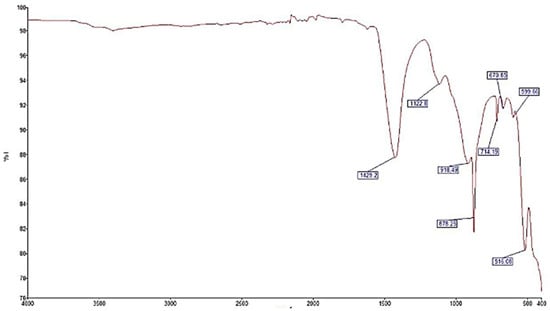
Figure 19.
FTIR spectrum for the sample for the optimal mixture (15% of coffee husk).
Region around 1400 cm−1: An absorption band is observed, which appears to have greater intensity than other regions. This band can be attributed to the C=C bond associated with aromatic groups, suggesting the presence of aromatic or polyaromatic structures in the mixture. This type of bond is common in organic compounds with benzene rings, which could indicate materials derived from polymers or additives with these characteristics.
Band around 1000 cm−1: This band is representative of C-X bonds, specifically related to functional groups containing fluorine (C-F). The intensity and position of this band could be influenced by the nature of the fluoride present and its interaction with other components of the mixture.
Peaks between 900 and 690 cm−1: These signals are associated with C-H bonds from aromatic groups, particularly out-of-plane deformations. This absorption type is typical in aromatic systems, and the presence of these bands further reinforces the identification of aromatic structures in the optimal mixture.
Region between 480 and 530 cm−1: The peaks observed in this region are related to ClO3 (chlorate) groups. The presence of these bands suggests that the material contains inorganic compounds with chlorine atoms in specific oxidation states. This result could indicate the incorporation of additives or interaction with chemical agents during the processing of the mixture.
In conclusion, the FTIR spectrum provides clear evidence of the chemical composition of the optimal mixture, highlighting the coexistence of aromatic, halogenated, and possibly inorganic functional groups, suggesting a complex interaction between the components. A complementary analysis, such as the quantitative integration of the bands, or additional techniques, like Raman spectroscopy, could confirm and complement these findings, offering a deeper understanding of the chemical interactions present.
3.2.3. Thermogravimetric Results
The thermogram of the optimal mixture (15%) (Figure 20), composed of coffee husk, bovine excreta, and cement, reveals three key stages of thermal degradation. The first, around 180.54 °C, with a mass loss of 5.776%, is associated with eliminating moisture and volatile compounds in the organic materials. Between 200 °C and 600 °C, peaks are observed in the DTG curve, indicating the thermal decomposition of organic matter, mainly cellulose, and lignin, from the coffee husks and components of the bovine excreta. Finally, at temperatures close to 800 °C, a loss of 27.71% is recorded, attributed to the decomposition of carbonates and mineral phases of the cement. These results demonstrate the thermal stability of the mixture and the contribution of each component to its behavior at high temperatures, which is relevant for its use in sustainable construction materials [69].
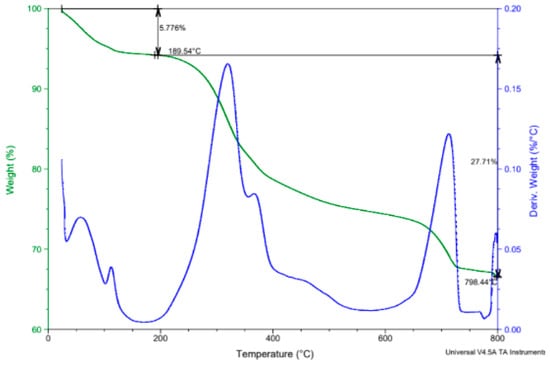
Figure 20.
TGA spectrum for the sample for the optimal mixture (15% of coffee husk).
3.3. Thermal and Acoustic Characteristics
Heat transfer was measured under free evolution conditions of the wall construction system using biomaterial blocks. A comparison was made with the traditional Catalan brick construction system to evaluate the heat flow from one side to the other in a natural environment rather than in a laboratory setting, as Catalan brick is the most commonly used material for housing construction in the Santander region.
3.3.1. Thermal Tests Development
Furthermore, for the data collected in the municipality of Aguachica, Cesar, inside the biomaterial block wall during July, Figure 21a shows the highest temperatures exceeding 35 °C and the lowest temperatures approaching 26 °C. The relative humidity remains high and constant, at above 92%, affecting the measurements’ accuracy. As observed in Figure 21b, the relative humidity inside the cube built with biomaterial blocks on the first day of measurements remained very high, close to air saturation, between 92% and 96%. The internal temperature on day 1 reached values near 30 °C, with a minimum of 27 °C recorded during the early morning and a maximum of 35 °C in the afternoon. For Bello, Antioquia, the lowest temperature was recorded at dawn, with a value of 26 °C. The highest temperatures, above 35 °C, occurred between 1:00 P.M. and 6:00 P.M., peaking around 3:00 P.M. Temperatures below 30 °C were observed from 6:00 to 10:00 A.M. and again after 6:00 P.M. The relative humidity remained near saturation levels, exceeding 95%, as shown in Figure 21c [73].
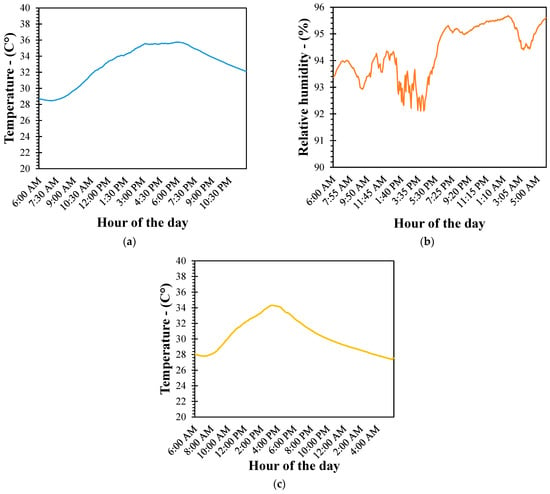
Figure 21.
For the city of Aguachica—Cesar: (a) Temperature measurement throughout the measured days, (b) relative humidity throughout the measured days, and (c) temperature measurement inside the block (average day).
In Figure 22a, the average data for Aguachica, Cesar, are presented. It can be observed that for the average exterior temperature curve of the location (which includes the temperature of the interior wall located to the west, referred to as “interior wall,” and the temperature at the center of the cube, representing the radiant temperature from all walls, referred to as “interior”), the minimum temperature of 26 °C is recorded during the early morning, from 3:00 a.m. to 7:00 a.m. The maximum temperature is close to 45 °C around midnight, between 12:00 p.m. and 2:00 a.m. Additionally, temperatures between 9:00 a.m. and 4:00 p.m. were recorded. Temperatures lower than 30 °C were observed from 7:00 p.m. to 7:00 a.m. The relative humidity fluctuated between 50% and 90%, with notable levels below 60% during the peak temperature hours, between 8:00 a.m. and 4:00 p.m. Furthermore, humidity values exceeding 80% were recorded from noon (12:00 p.m.) until 7:00 a.m. In the internal wall of the Aguachica block, temperatures above 30 °C were observed from 9:00 a.m. to 9:00 p.m., with increases above 35 °C from 1:00 p.m. to 9:00 p.m., reaching a maximum of 36 °C from 2:00 p.m. to 5:00 p.m., and a minimum of 26 °C at 5:00 a.m. As observed, the relative humidity in the internal wall of the block remained stable, with values around 85%.
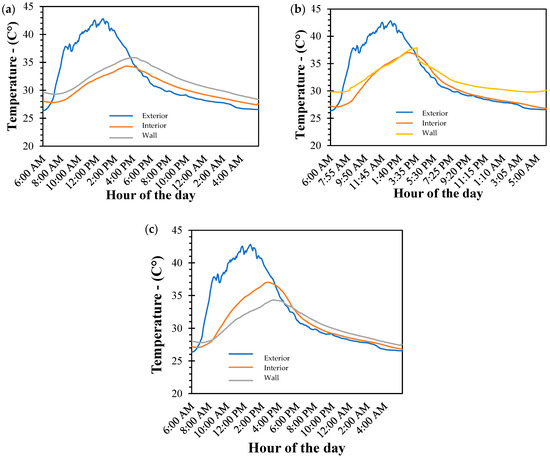
Figure 22.
Aguachica—Cesar: (a) Behavior of the biomaterial block, (b) comparison with a conventional brick wall, and (c) comparison with the biomaterial.
In Figure 22b, it can be seen that the wall heating time is approximately one and a half hours, which is the time it takes from sunrise until all three sensors record the same temperature value at all positions (indicating the same temperature inside and outside the cube, around 30 °C). The internal wall temperature of the cube is slightly higher at all times compared to the interior temperature. The temperature inside the block remains very stable, with increases not exceeding 6 °C, maintaining temperature differences of up to 10 °C compared to the exterior, indicating very good performance. At 3:45 a.m., the exterior temperature equalizes with the interior at approximately 35 °C, and from that point onward, the interior temperature remains higher, progressively decreasing by about 2.0 °C compared to the exterior temperature throughout the night. This procedure is repeated for the brick wall and the measurements in each of the cubes built in the different municipalities where the exercise takes place—Bello and El Peñol, in our case. Due to space limitations, these are not detailed in this report but are summarized in tables and considered for performance comparisons of both walls in the final chapter.
Finally, in Figure 22c, the thermal performance of the brick wall in Aguachica, Cesar, is similar to the biomaterial block wall, with a slightly faster heating time of about one hour. The following graphs present the results of an average day in Aguachica during July 2024, where exterior temperatures are compared to the interior temperatures of the two cubes constructed from biomaterial blocks and Catalan brick. Aguachica, with its warm climate, experiences high temperatures above 35 °C between 1:00 p.m. and 6:00 p.m., with a maximum recorded at 3:00 p.m. Low temperatures, near 26 °C, are recorded in the early morning, and the relative humidity fluctuates between 40% and 90%, reaching nearly 95% inside the cubes due to water vapor condensation. The block exhibits a more efficient thermal behavior than the brick, taking up to half an hour longer to heat up and remaining more stable and cooler during the morning. It also takes longer in the afternoon to cool down and maintains a higher internal temperature at night. The biomaterial block maintains temperatures approximately 8 °C below the exterior temperature, showing better performance than the Catalan brick, which exhibits a maximum apparent reduction of 6 °C. It is noteworthy that the brick cools down faster during the night than the block.
For the thermal analysis conducted in the cities of Bello—Antioquia and El Peñol—Antioquia, shown in Figure 23, outdoor temperatures ranged between 18 °C and 25 °C, with a maximum temperature of 27 °C at 2:00 p.m. The thermal performance of the biomaterial block was still slightly better than that of the brick. However, the data showed a higher rate of warming of the interior wall of the Catalan brick. El Peñol exhibited a more stable behavior of both materials in the morning, and the biomaterial block showed greater efficiency at night, as it took longer to cool down. Similarly, with a couple of degrees lower thermal efficiency than the biomaterial block, the brick displayed an interior surface that heated up and cooled down more quickly.
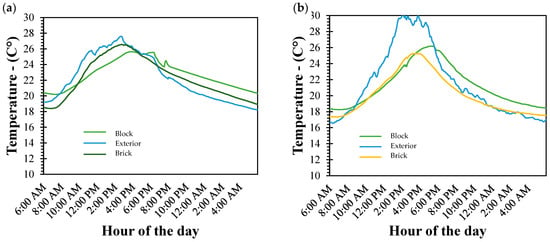
Figure 23.
Temperatures during the test days in (a) Bello—Antioquia, and (b) El Peñol—Antioquia.
In the comparative analysis conducted in Bello and El Peñol, it was observed that outdoor temperatures ranged between 18 °C and 25 °C, reaching maximums of 27 °C at 2:00 p.m. Although both materials, namely the biomaterial block and the Catalan brick, showed similar behavior in response to external thermal variations, significant differences were evident. The biomaterial block demonstrated better thermal performance in terms of thermal inertia, meaning it took longer to heat up and cool down, translating into greater interior thermal comfort. On the other hand, the Catalan brick exhibited greater variability in the temperature of its interior surface, responding more rapidly to external changes. The biomaterial block could be more suitable for climates with large thermal amplitudes because it provides greater interior thermal stability.
3.3.2. Acoustic Test Results
In Figure 24, which compares the acoustic performance between different types of walls, it was observed that the wall constructed with biomaterial blocks exhibits superior acoustic attenuation performance compared to the Catalan brick wall. The following synthesis of the information was obtained:

Figure 24.
Acoustic transmission as a function of octave voltage frequency.
- Biomaterial block wall: This wall showed acoustic attenuation values of approximately 25 dBA for low and mid frequencies, with even better performance at high frequencies, reducing sound energy close to 30 dBA. These results suggest that biomaterial blocks offer a greater capacity to dissipate sound, primarily due to their porous microstructure and lower density, which increase internal friction and viscous losses when sound waves propagate through the material. The interconnected pores and heterogeneous internal composition act as sound absorbers by converting acoustic energy into heat, thus reducing transmitted sound. Additionally, the compliance (flexibility) of the biomaterial can lead to enhanced damping of vibrations, further contributing to sound attenuation. These mechanisms align with classical acoustic theory on porous absorbers and are consistent with findings reported by [23].
- Catalan brick wall: Although it presents similar behavior to the biomaterial block at low frequencies, its acoustic performance decreases from mid to high frequencies. Acoustic attenuation remains in the 25 dBA range, which, although acceptable, is lower than that achieved by the biomaterial block at high frequencies. This difference could be related to the higher density and rigidity of the Catalan brick, which limits internal friction and reduces the material’s ability to absorb sound energy, causing more sound waves to be reflected rather than absorbed. At higher frequencies, stiff and dense materials tend to transmit vibrations more effectively, resulting in lower attenuation.
Furthermore, raw transmission loss values were obtained during the measurements, which directly reflect the acoustic efficiency of the evaluated walls in reducing sound energy transmission. These values confirm that biomaterial blocks perform on par with Catalan bricks at low frequencies but significantly outperform them at mid and high frequencies. This positions biomaterial blocks as a more effective alternative for applications requiring enhanced acoustic insulation.
Transmission loss (TL) is a key parameter used to evaluate the acoustic insulation properties of building materials. It measures the reduction in sound energy as it passes through a material, expressed in decibels (dB). A higher TL value indicates better sound insulation performance, which is particularly relevant for building materials used in urban or residential environments where noise control is essential for comfort and well-being.
In wall materials, TL depends on several factors including the density, thickness, porosity, and stiffness of the material. According to the mass law of acoustics, the TL increases by approximately 6 dB for every doubling of mass per unit area, provided the frequency is sufficiently high and the material behaves as a limp barrier. However, porous or fibrous materials, such as those containing agricultural residues, may exhibit different behaviors due to their ability to absorb sound energy and dampen vibrations, rather than merely blocking transmission.
In this study, transmission loss values were measured across a range of frequencies (e.g., 100 Hz to 5000 Hz) using a two-room impedance tube setup in accordance with the ISO 10140 standard. The results demonstrated that the bio-bricks made with coffee husks and bovine excreta exhibited TL values comparable to or exceeding those of conventional fired clay bricks in the mid-to-high frequency ranges (e.g., TL > 35 dB at 1000 Hz), primarily due to their heterogeneous internal structure and high porosity, which promote energy dissipation through friction and internal scattering.
3.4. Thermal Comfort Assessment Based on Bioclimatic Parameters
Figure 25 shows Olgyay’s and Givoni’s bioclimatic charts, which are essential for evaluating thermal comfort and identifying passive architectural strategies tailored to climatic conditions.
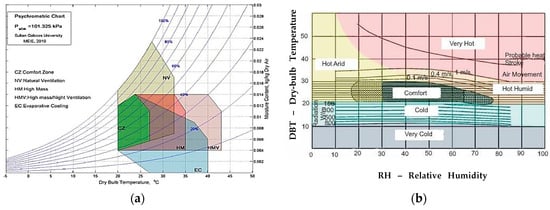
Figure 25.
(a) Givoni’s bioclimatic chart, and (b) Olgyay’s bioclimatic chart. Source: Obtained from [74,75].
In Figure 25a, Olgyay’s chart identifies a comfort zone (CZ) generally bounded between 20 °C and 30 °C dry-bulb temperature and 30% to 70% relative humidity. This zone assumes indoor clothing levels and moderate activity. Beyond this zone, additional strategies are recommended. For instance, shading becomes necessary just above 30 °C, while solar heating can extend comfort to approximately 10 °C, particularly under sunny conditions. Similarly, increased air velocity (above 0.5 m/s) can compensate for temperatures rising to 10 °C above the comfort threshold. Evaporative cooling (EC) is suggested for hot-dry conditions exceeding 35 °C where relative humidity remains below 30%. Other zones in the chart—NV (natural ventilation), HM (high mass), and HMV (high mass with night ventilation)—highlight passive solutions appropriate for varying combinations of heat and humidity. Figure 25b, derived from Givoni’s work, presents a complementary perspective by emphasizing the combined effect of dry-bulb temperature and relative humidity. The comfort zone is a shaded band extending roughly from 22 °C to 32 °C across a humidity range of 20% to 80%. The chart also includes airflow curves at 0.1, 0.4, and 1.0 m/s, showing how increased air movement can broaden comfort levels in hotter conditions. At higher temperatures exceeding 35–40 °C, the chart identifies risk zones, such as “probable heat stroke,” reinforcing the importance of mechanical cooling or thermal mass strategies.
Bio-bricks present lower values than those built with conventional clay bricks under peak heat conditions in Aguachica, where outdoor dry-bulb temperatures frequently exceeded 35 °C with relative humidity below 30%. According to Olgyay’s diagram, this scenario falls into the evaporative cooling (EC) or shading-required zone, yet the bio-brick walls allowed the interior to remain within the 24–28 °C range, overlapping with the defined comfort zone (CZ). Similarly, in temperate conditions in Bello, bio-brick enclosures stabilized indoor temperatures within 21–26 °C, despite external fluctuations, aligning with Givoni’s comfort band of 22–32 °C. The bio-bricks’ low thermal conductivity (~0.19 W/(m×K)) and increased thermal lag minimized rapid heat gain, functioning analogously to the high mass (HM) and high mass with night ventilation (HMV) strategies highlighted in both diagrams.
Additionally, the material’s moderate water absorption (~22.5%) contributed to indoor humidity regulation, helping to maintain relative humidity within the 45–65% range, ideal for passive comfort. In El Peñol, a colder zone, bio-brick walls retained sufficient internal warmth during nighttime, maintaining interior temperatures above 18 °C, partially benefiting from daytime solar gain, like the solar heating recommendation in Olgyay’s chart for environments near 10 °C. These results confirm that using bio-bricks, in addition to reducing energy demands, enhances occupant comfort by passively modulating indoor temperature and humidity by climate-responsive design principles.
4. Conclusions
This research on Bio-Bricks provides valuable insights into advancing sustainability in the construction industry, as highlighted in the following paragraphs:
- ⮚
- This study demonstrates the technical and environmental viability of producing bio-bricks using agricultural waste—specifically coffee husks and bovine excreta—as partial substitutes for cement in masonry units. The optimized mixture (960 g of cement, 225 g of lignin, and 315 g of bovine excreta) achieved a compressive strength of 1.70 MPa and a flexural strength of 0.56 MPa, complying with the minimum standards for non-loadbearing walls established by Colombian regulations. Despite the increased water absorption (~22.5%), the thermal conductivity (0.19 W/(m×K)) and acoustic attenuation (~25 dBA) of the bio-bricks reveal superior insulation behavior compared to conventional clay bricks.
- ⮚
- Thermal and acoustic field evaluations conducted across three distinct Colombian climate zones confirmed the ability of the bio-bricks to reduce indoor temperature fluctuations and attenuate external noise more effectively than traditional masonry materials. The results also indicate a significant reduction in material density (~0.91 g/cm3), which may contribute to lighter structural loads and improved construction logistics.
- ⮚
- Morphological and chemical analyses (SEM-EDS, FTIR, and TGA) validated the integration and compatibility of organic and inorganic components within the composite matrix, contributing to the bio-brick’s overall thermal stability and performance. These findings support the potential for the large-scale application of bio-based masonry units in sustainable construction, particularly in tropical and rural regions where local resources and climate responsiveness are critical.
Author Contributions
R.A.G.-L.: Formal Analysis, Analysis Tools, Funding Acquisition, Sources, Writing—Original Draft, and Writing—Review and Editing. H.Y.J.: Investigation, Collected Data, Analysis Tools, Funding Acquisition, and Other Contributions. R.Z.-G. and A.A.-C. Analysis Tools, Contributed Data, and Other Contributions. All authors have read and agreed to the published version of the manuscript.
Funding
This work was supported by the research grant 158-08-037 of the Universidad Francisco de Paula Santander Ocaña.
Data Availability Statement
The original contributions presented in the study are included in the article, further inquiries can be directed to the corresponding author.
Conflicts of Interest
The authors declare that they have no known competing financial interest or personal relationships that could have appeared to influence the work reported in this paper.
References
- Mori, D.; Uday, K.V. 12—Innovations toward bio-brick. In Woodhead Publishing Series in Civil and Structural Engineering; Choudhury, T., Raviteja, K.V.N.S., Singh, L., Bertolesi, E., Eds.; Woodhead Publishing: Sawston, UK, 2024; pp. 203–213. [Google Scholar] [CrossRef]
- Anitha, K.; Senthilselvan, S. Agricultural Waste Materials Applications in Building Industry—An Overview. ECS Trans. 2022, 107, 2371. [Google Scholar] [CrossRef]
- De Lucas, A.; Taranco, C.; Rodrígez, E.; Paniagua, P. Biomasa, Biocombustibles Y Sostenibilidad; Centro Tecnológico Agrario y Agroalimentario: Palencia, Spain, 2012; Volume 13. [Google Scholar]
- Jeguirim, M.; Salah, J.; Khiari, B. Sustainable Biomass Resources for Environmental, Agronomic, Biomaterials. C. R. Chim. 2020, 23, 583–587. [Google Scholar] [CrossRef]
- Dungani, R.; Karina, M.; Subyakto; Sulaeman, A.; Hermawan, D.; Hadiyane, A. Agricultural waste fibers towards sustainability and advanced utilization: A review. Asian J. Plant Sci. 2016, 15, 42–55. [Google Scholar] [CrossRef]
- Gbadeyan, O.J.; Sibiya, L.; Mpongwana, N.; Linganiso, L.Z.; Linganiso, E.C.; Deenadayalu, N. Manufacturing of building materials using agricultural waste (sugarcane bagasse ash) for sustainable construction: Towards a low carbon economy. A review. Int. J. Sustain. Eng. 2023, 16, 368–382. [Google Scholar] [CrossRef]
- Dungani, R.; Khalil, H.A.; Sumardi, I.; Suhaya, Y.; Sulistyawati, E.; Islam, M.N.; Suraya, N.L.M.; Aprilia, N.S. Non-wood Renewable Materials: Properties Improvement and Its Application. In Biomass and Bioenergy: Applications; No. April 2016; Springer: Berlin/Heidelberg, Germany, 2014; pp. 1–397. [Google Scholar] [CrossRef]
- Salleh, S.Z.; Kechik, A.A.; Yusoff, A.H.; Taib, M.A.A.; Nor, M.M.; Mohamad, M.; Tan, T.G.; Ali, A.; Masri, M.N.; Mohamed, J.J.; et al. Recycling food, agricultural, and industrial wastes as pore-forming agents for sustainable porous ceramic production: A review. J. Clean. Prod. 2021, 306, 127264. [Google Scholar] [CrossRef]
- Acchar, W.; Dultra, E.J.V.; Segadães, A.M. Untreated coffee husk ashes used as flux in ceramic tiles. Appl. Clay Sci. 2013, 75, 141–147. [Google Scholar] [CrossRef]
- Montoya, G. Hacia Una Construcción Sostenible en Colombia. Asobancaria. Available online: https://www.asobancaria.com/wp-content/uploads/2022/05/1329_BE.pdf (accessed on 11 May 2025).
- Prabhakar, C.G.; Babu, K.A.; Kataraki, P.S.; Reddy, S. A review on natural fibers and mechanical properties of banyan and banana fibers composites. Mater. Today Proc. 2022, 54, 348–358. [Google Scholar] [CrossRef]
- Kumar, P.; Gautam, P.; Kaur, S.; Chaudhary, M.; Afreen, A.; Mehta, T. Bamboo as reinforcement in structural concrete. Mater. Today Proc. 2021, 46, 6793–6799. [Google Scholar] [CrossRef]
- Zhang, Z.; Liu, S.; Yang, F.; Weng, Y.; Qian, S. Sustainable high strength, high ductility engineered cementitious composites (ECC) with substitution of cement by rice husk ash. J. Clean. Prod. 2021, 317, 128379. [Google Scholar] [CrossRef]
- Bouasker, M.; Belayachi, N.; Hoxha, D.; Al-Mukhtar, M. Physical characterization of natural straw fibers as aggregates for construction materials applications. Materials 2014, 7, 3034–3048. [Google Scholar] [CrossRef]
- Uday Kiran, G.; Nakkeeran, G.; Roy, D. Thermal distribution of paver block with machine learning optimized design with alternative eco-friendly materials. Innov. Infrastruct. Solut. 2025, 10, 24. [Google Scholar] [CrossRef]
- Hejazi, S.M.; Sheikhzadeh, M.; Abtahi, S.M.; Zadhoush, A. A simple review of soil reinforcement by using natural and synthetic fibers. Constr. Build. Mater. 2012, 30, 100–116. [Google Scholar] [CrossRef]
- Bustos, C.A.P.; Pumarejo, L.G.F.; Cotte, É.H.S.; Quintana, H.A.R. Construction demolition waste (CDW), a perspective of achievement for the city of Barranquilla since its management model. Ing. Y Desarrollo 2017, 35, 533–555. [Google Scholar] [CrossRef]
- Parece, S.; Rato, V.; Resende, R.; Pinto, P.; Stellacci, S. A Methodology to Qualitatively Select Upcycled Building Materials from Urban and Industrial Waste. Sustainability 2022, 14, 3430. [Google Scholar] [CrossRef]
- Ganasen, N.; Krishnaraj, L.; Onyelowe, K.C.; Alaneme, G.U.; Otu, O.N. Soft computing techniques for predicting the properties of raw rice husk concrete bricks using regression-based machine learning approaches. Sci. Rep. 2023, 13, 14503. [Google Scholar] [CrossRef]
- Nakkeeran, G.; Krishnaraj, L.; Shakor, P.; Alaneme, G.U.; Otu, O.N. Mechanical properties optimization and cost analysis of agricultural waste as an alternative in brick production. Sci. Rep. 2024, 14, 24075. [Google Scholar] [CrossRef]
- Ganasen, N.; Krishnaraj, L.; Onyelowe, K.C.; Stephen, L.U. Machine learning optimization of bio-sandcrete brick modelling using response surface methodology. Sci. Rep. 2024, 14, 3438. [Google Scholar] [CrossRef]
- Jonnala, S.N.; Gogoi, D.; Devi, S.; Kumar, M.; Kumar, C. A comprehensive study of building materials and bricks for residential construction. Constr. Build. Mater. 2024, 425, 135931. [Google Scholar] [CrossRef]
- Korjakins, A.; Sahmenko, G.; Lapkovskis, V. A Short Review of Recent Innovations in Acoustic Materials and Panel Design: Emphasizing Wood Composites for Enhanced Performance and Sustainability. Appl. Sci. 2025, 15, 4644. [Google Scholar] [CrossRef]
- Acuña-Portocarrero, G.; Soto-Chahua, J.; Otárola-Santiváñez, J. Evaluation of Building Materials and Proposal to Improve Thermal Comfort in Rural Housing. Civ. Eng. Archit. 2025, 13, 118–143. [Google Scholar] [CrossRef]
- Rautray, P.; Roy, A.; Eisenbart, B. Application of Bio-Bricks and its Benefits. Proc. Des. Soc. 2023, 3, 603–612. [Google Scholar] [CrossRef]
- Liu, S.; Du, K.; Huang, W.; Wen, K.; Amini, F.; Li, L. Improvement of erosion-resistance of bio-bricks through fiber and multiple MICP treatments. Constr. Build. Mater. 2021, 271, 121573. [Google Scholar] [CrossRef]
- Cruz, J.S. Estudio Comparativo de Materiales Sostenibles Aislantes en Arquitectura. 2019. Available online: https://riunet.upv.es:443/handle/10251/137334 (accessed on 14 September 2023).
- García-León, R.A.; Acevedo-Peñaloza, C.; Rojas-Suarez, J.P. Metodología Para la Fabricación del Bloque H-10 Para la Industria Cerámica de Norte de Santander; ECOE, Ed.; Universidad Francisco de Paula Santander: Bogota, Colombia, 2019. [Google Scholar]
- NTC-121; Performance Specification for Hydraulic Cement. Norma Técnica Colombiana. ICONTEC: Bogota, Colombia, 2021.
- Carvalho, V.R.; Costa, L.C.B.; Baeta, B.E.L.; Peixoto, R.A.F. Lignin-Based Admixtures: A Scientometric Analysis and Qualitative Discussion Applied to Cement-Based Composites. Polymers 2023, 15, 1254. [Google Scholar] [CrossRef]
- Jaramillo, H.Y.; Vasco-Echeverri, O.; López-Barrios, R.; García-León, R.A. Optimization of Bio-Brick Composition Using Agricultural Waste: Mechanical Properties and Sustainable Applications. Sustainability 2025, 17, 1914. [Google Scholar] [CrossRef]
- Goos, P.; Jones, B.; Antwerpen, U.; Syafitri, U. I-optimal design of mixture experiments. J. Am. Stat. Assoc. 2016, 111, 899–911. [Google Scholar] [CrossRef]
- Goel, G.; Kalamdhad, A.S. An investigation on use of paper mill sludge in brick manufacturing. Constr. Build. Mater. 2017, 148, 334–343. [Google Scholar] [CrossRef]
- NTC-4017:2018; Métodos Para Muestreo y Ensayos de Unidades de Mampostería y Otros Productos de Arcilla. Norma Técnica Colombiana. ICONTEC: Bogota, Colombia, 2005; pp. 1–30.
- NTC 4205-1:2009; Unidades de Mamposteria de Arcilla Cocida. Ladrillos y Bloques Ceramicos. ICONTEC: Bogota, Colombia, 2000.
- García-León, R.A.; Trigos-Caceres, J.; Castilla-Quintero, N.; Afanador-García, N.; Gómez-Camperos, J. Experimental and Statistical Analysis of Concrete Eco-Cobble Using Organic and Synthetic Fibers. Processes 2024, 12, 1936. [Google Scholar] [CrossRef]
- Khalaf, F.M.; DeVenny, A.S. New Tests for Porosity and Water Absorption of Fired Clay Bricks. J. Mater. Civ. Eng. 2002, 14, 334–337. [Google Scholar] [CrossRef]
- García-León, R.A.; Flórez-Solano, E.; Espinel-Blanco, E. Conductividad térmica de polvos de arcillas utilizadas en la industria cerámica en Ocaña Norte de Santander y la región. Ingenio UFPSO 2017, 13, 29–37. [Google Scholar] [CrossRef]
- García-León, R.A.; Camperos, J.G.; Jaramillo, H.Y. Physical, chemical and thermal characterization of a Colombian clay. Int. J. Mech. Mechatron. Eng. 2020, 20, 225–234. [Google Scholar]
- Jaramillo, H.Y.; Vasco-Echeverri, O.H.; Moreno-Pacheco, L.A.; García-León, R.A. Biomaterials in Concrete for Engineering Applications: A Bibliometric Review. Infrastructures 2023, 8, 161. [Google Scholar] [CrossRef]
- García-León, R.A.; Solano, E.F.; Peñaloza, C.A. Caracterización térmica de mezclas de arcillas utilizadas en la fabricación de productos de mampostería para la construcción. In Revista Colombiana de Tecnologias de Avanzada (Rcta); Universidad de Pamplona: Pamplona, Colombia, 2018. [Google Scholar] [CrossRef]
- UNE-EN ISO-16283-3; Acoustics—Field Measurement of Sound Insulation in Buildings and of Building Elements—Part 3. International Organization for Standardization: Geneva, Switzerland, 2016.
- Belén, A.; Romero, C.; Pérez, M.E.C.; Francisca, F.M. Evaluación del Comportamiento Térmico de Una Edificación Reemplazando el Material de la Envolvente Por SUELO-Cemento. 2016. Available online: https://www.researchgate.net/publication/315764135 (accessed on 11 May 2025).
- ISO-7730; Ergonomics of the Thermal Environment—Analytical Determination and Interpretation of Thermal Comfort Using Calculation of the PMV and PPD Indices and Local Thermal Comfort Criteria. International Organization for Standardization: Geneva, Switzerland, 2005.
- Van Hoof, J. Forty years of Fanger’s model of thermal comfort: Comfort for all? Indoor Air 2008, 18, 182–201. [Google Scholar] [CrossRef] [PubMed]
- Mohan, M.; Gupta, A.; Bhati, S. A Modified Approach to Analyze Thermal Comfort Classification. Atmos. Clim. Sci. 2014, 4, 7–19. [Google Scholar] [CrossRef][Green Version]
- Muñoz, N.; Marino, B.M.; Thomas, L.P. Caracterización Térmica De Edificios Aplicando El Modelo De Regresión Lineal Múltiple. Av. En Energías Renov. Y Medio Ambiente 2016, 20, 5–21. [Google Scholar]
- Basantes, A.C.N.; García, E.H. Altitude, climate variables and people’s length of stay in Ecuador squares. Urbe 2018, 10, 414–425. [Google Scholar] [CrossRef]
- Rincón-Martínez, J.C. Confort térmico en edificios educativos naturalmente ventilados: Un estudio en bioclima templado-seco. Rev. De Arquit. 2023, 25, 12–24. [Google Scholar] [CrossRef]
- De, J.P.O.; Aemet, G. Caracterización del Contenido de Vapor de Agua Atmosférico; Spanish Meteorological Association: Madrid, Spain, 2013. [Google Scholar]
- Guillén, B.L. Evaluación del Bienestar Térmico A Través de la Temperatura Operativa. Available online: https://www.carm.es/web/descarga?ARCHIVO=FT-4.pdf&ALIAS=ARCH&IDCONTENIDO=78385&IDTIPO=60&RASTRO=c721$m6645#:~:text=La%20temperatura%20operativa%20es%20una,de%20calor%20radiante%20y%20convectivo (accessed on 27 December 2024).
- Del Cisne Conforme-Zambrano, G.I.; Castro-Mero, J.I.L. Arquitectura bioclimática Bioclimatic architecture Arquitetura bioclimática. Polo del Conocimiento 2020, 5, 751–779. Available online: https://polodelconocimiento.com/ojs/index.php/es/article/view/1381 (accessed on 25 December 2024).
- Unión Europea. El Proyecto BIOURB. Available online: https://www.biourb.net/proyecto-biourb/ (accessed on 25 December 2024).
- Ariza, M.A.M. Construcción Sostenible en Colombia: Aproximaciones, Indicadores, y Aplicación al Caso de Estudio del Centro Cívico de la Universidad de Los Andes. 2020. Available online: https://repositorio.uniandes.edu.co/entities/publication/afcdafea-15d5-469b-9fc2-9e87603184c7 (accessed on 25 December 2024).
- Ochoa, J.A.G.; Rodríguez, J.C.Q.; Moreno, J.A.P. Análisis de la Huella de Carbono en la Construcción y su Impacto Sobre el Ambiente; Universidad Cooperativa de Colombia: Bogota, Colombia, 2021. [Google Scholar]
- Serrano, A.; Molina, F.Q.; Catalán, M.L.; Guillén-Mena, V.; Orellana, D.S. Sobre la Evaluación de la Sostenibilidad de Materiales de Construcción. 2015. Available online: https://www.researchgate.net/publication/316492577 (accessed on 11 May 2025).
- Chaudruc, K.V.D.; Arévalo, E.P.; Escorcia, R.S.; Pallares, R.R. Impacto De La Contaminación Auditiva Sobre El Ambiente Y La Salud Aguachica (Cesar). Mundo FESC 2023, 13, 7–20. [Google Scholar] [CrossRef]
- Vivienda y Desarrollo Territorial. Ministerio de Ambiente. Resolución 0627. April 2006. Available online: https://www.minambiente.gov.co/wp-content/uploads/2021/10/Resolucion-0627-de-2006.pdf (accessed on 11 May 2025).
- ISO-140-1; Acoustics—Measurement of Sound Insulation in Buildings and of Building Elements—Part 1. International Organization for Standardization: Geneva, Switzerland, 1997.
- Cálculo de la Pérdida de Transmisión Acústica y de Contrapresión en Silenciadores, Mediante el Método de Los Elementos Finitos. 2016. Available online: www.aenor.es (accessed on 11 May 2025).
- Toapanta, Á.R.I. Evaluación de la Fabricación de Bioladrillos Utilizando Materiales Alternativos Plástico Pet y Cascarilla de Arroz Para Disminuir el Impacto Ambiental en la Microempresa Pilicita en el Cantón Saquisili; Universidad Técnica de Cotopaxi: Latacunga, Ecuador, 2019. [Google Scholar]
- García-Léon, R.A.; Florez-Solano, E.; Guerrero-Gomez, G. Determinación de la Mezcla Óptima de Arcilla del Bloque H-10 Para la Industria Cerámica; ECOE, Ed.; Universidad Francisco de Paula Santander: Bogota, Colombia, 2020. [Google Scholar]
- Poornima, V.; Venkatasubramani, R.; Sreevidya, V.; Chandrasekar, P. Study on properties of bio-bricks. Mater. Today Proc. 2022, 49, 2103–2109. [Google Scholar] [CrossRef]
- Manoharan, A.; Raja, R.; Sharma, H.; Kumar, S. Recent Advances in Bio-Based Concrete Materials: A Critical In-Depth Review. World Sci. Annu. Rev. Funct. Mater. 2024, 2. [Google Scholar] [CrossRef]
- García-León, R.A.; Sanchez-Torrez, A.; Rincon-Cardenas, W.; Afanador-García, N.; Moreno-Pacheco, L.; Lanziano-Barrera, M. Experimental study about the improvement of the mechanical properties of a concrete cobble using recyclable additives. DYNA 2023, 90, 45–55. [Google Scholar] [CrossRef]
- ASTM-C90; Standard Specification for Loadbearing Concrete Masonry Units. American Society for Testing and Materials: West Conshohocken, PA, USA, 2022.
- EN-771-1; Specification for Masonry Units—Part 1: Clay Masonry Units. Asociación Española de Normalización: Madrid, Spain, 2016.
- Salazar, J. Dosificación de hormigones ligeros con cascarilla de café. In Ingeniería E Investigación; Fundación Dialnet: Logroño, Spain, 1984. [Google Scholar]
- Zapata, C.P.S. Impacto del Uso de Cascarilla de Arroz en Propiedades Mecánicas y Microestructurales de Morteros de Mampostería. 2023. Available online: https://orcid.org/0000-0003-1344-1895 (accessed on 11 May 2025).
- Clayton, T.; Pearce, R.B. Rapid chemical analysis of the <2 μm clay fraction using an SEM/EDS technique. Clay Miner. 2007, 42, 549–562. [Google Scholar] [CrossRef]
- McManis, A.; Ferrell, K.; Arman, R.E.Y. Interpretación de las propiedades físicas de una arcilla mediante técnicas de microanálisis. Rev. Pruebas Geotécnicas 1983, 87–92. [Google Scholar]
- Nayak, P.S.; Singh, B.K. Instrumental characterization of clay by FTIR, XRF, BET and, TPD-NH3. Bull. Mater. Sci. 2007, 30, 235–238. [Google Scholar] [CrossRef]
- París, J.M.F. Influencia del medio ambiente en los materiales de construcción II. La Humedad. Mater. De Constr. 1976, 26, 49–58. [Google Scholar] [CrossRef][Green Version]
- Al-Azri, N.; Zurigat, Y.; Al-Rawahi, N. Development of bioclimatic chart for passive building design in Muscat-Oman. Int. J. Sustain. Energy 2012, 32, 713–723. [Google Scholar] [CrossRef]
- Gupta, J.; Dhobekar, N. Using Appropriate Technology in Designing Climate Responsible Architecture: A study in hot-dry climate of Aurangabad. Compr. Adv. Spec. Summ. Stud. 2022, 5, 1–26. [Google Scholar]
Disclaimer/Publisher’s Note: The statements, opinions and data contained in all publications are solely those of the individual author(s) and contributor(s) and not of MDPI and/or the editor(s). MDPI and/or the editor(s) disclaim responsibility for any injury to people or property resulting from any ideas, methods, instructions or products referred to in the content. |
© 2025 by the authors. Licensee MDPI, Basel, Switzerland. This article is an open access article distributed under the terms and conditions of the Creative Commons Attribution (CC BY) license (https://creativecommons.org/licenses/by/4.0/).