Abstract
With accelerating urbanization, the outdoor thermal environment has become a critical factor affecting the thermal comfort of public spaces, particularly in high-density commercial districts and pedestrian-concentrated areas. To enhance thermal comfort and livability in public outdoor space, this study proposes a thermal demand-responsive design approach that integrates thermal conditions with pedestrian flow dynamics. A commercial pedestrian mall featuring semi-open public spaces and air-conditioned interior retail areas was selected as a case study. Computational Fluid Dynamics (CFD) simulations were conducted based on design-phase documentation and field measurements to model the thermal environment. The Universal Thermal Climate Index (UTCI) was employed to assess thermal comfort levels, and thermal discomfort was further quantified using the Heat Discomfort Index (HI). Simultaneously, pedestrian density distribution (λ) was analyzed using the agent-based simulation software MassMotion (Version 11.0). A demand of thermal comfort (DTC) index was developed by coupling UTCI-based thermal conditions with pedestrian density, enabling the spatial quantification of thermal demand across the whole commercial pedestrian mall. For example, in a sidewalk area parallel to the main street, several points exhibited high discomfort levels (HI = 0.95) but low pedestrian volume, resulting in DTC values approximately 0.2 units lower than adjacent zones with lower discomfort levels (HI = 0.7) but higher foot traffic. Such differences demonstrate how DTC can reveal priority areas for intervention. Key zones requiring thermal improvement were identified based on DTC values, providing a quantitative foundation for outdoor thermal environment design. This method provides both a theoretical foundation and a practical tool for the sustainable planning and optimization of urban public spaces.
1. Introduction
Extreme weather conditions caused by global warming, coupled with the urban heat island effect, have significantly reduced residents’ willingness to participate in outdoor activities [1]. As a result, shopping malls and commercial pedestrian streets have become primary recreational spaces where urban residents engage in daily leisure activities. Previous research based on the investigation of city residents’ mobile signal data from Guangzhou, which features hot and humid weather conditions, has provided evidence that, as key leisure environments, residents’ interest in visiting shopping malls and pedestrian streets exhibits lower sensitivity to meteorological variations compared with parks during hot summer days [2]. This may be due to the fact that shopping malls and pedestrian streets offer a cooler and more comfortable thermal environment than other public open spaces during hot summers.
However, these thermally favorable environments come at a high cost. Due to the large scale of commercial buildings and the prolonged operation time of air conditioning systems, the energy consumption of commercial buildings in China is estimated to be 10 to 20 times higher than that of residential buildings [3], with approximately 30% of the total energy consumption attributed to air conditioning [4]. In response, newly constructed shopping malls in some cities with relatively mild climates or distinctive local weather characteristics, such as coastal areas benefiting from sea breezes, have adopted semi-open designs. In these malls, semi-open public spaces are left naturally ventilated, while individual commercial stores remain air-conditioned. Although this approach effectively reduces the total area requiring mechanical cooling, it introduces a new challenge: thermal discomfort in semi-open and open public spaces. These areas, while partially sheltered, are still exposed to fluctuating outdoor environmental conditions such as high temperatures, solar radiation, and limited airflow, which may compromise occupant comfort, especially during peak summer periods.
Compared with indoor environments, outdoor spaces present an even greater challenge for thermal management due to the substantial spatial variability of environmental parameters. Variables such as air temperature, wind conditions, and radiant intensity display substantial spatial variations in open spaces. For instance, a study utilizing mobile sensing technology detected a spatial difference of up to 3 °C in dry-bulb air temperature between the major and secondary roads within a university campus [5]. Similarly, regarding wind environment heterogeneity, a simulation study of an urban seashore area spanning 3.5 km × 2.4 km revealed that wind speed variations within this region could reach 8.0 m/s [6]. Among these environmental parameters, solar radiation exhibits the highest degree of heterogeneity. Differences between sunlit and shaded areas can result in mean radiant temperature variations exceeding 30 °C [7]. Beyond the heterogeneity of the thermal environment, the most fundamental difference between indoor and outdoor thermal conditions lies in the presence of controlled boundaries, such as building envelopes. In outdoor spaces, the absence of these boundaries results in continuous heat exchange between thermally improved areas and their surroundings. Consequently, any positive thermal adjustments achieved through active cooling devices are quickly mitigated by unrestricted heat transfer with adjacent areas. These characteristics highlight the importance of adopting a need-based control perspective in outdoor thermal design, which balances thermal comfort benefits with energy efficiency by targeting interventions where they are most needed.
While the concept of need-based control has long been applied in indoor settings, particularly in large-volume buildings such as airports and atria [8], its application to outdoor environments remains limited. In indoor contexts, researchers have advanced occupant-centric strategies that respond to spatial heterogeneity by deploying localized sensing and localized control technologies. From the environmental sensing perspective, mobile robots have been used to generate real-time thermal maps to provide more accurate control for spatially targeted ventilation strategies [8]. On the control side, radiant-convective terminals have evolved to deliver heating or cooling to specific zones [9] or even individual occupants [10]. In highly dynamic spaces such as airport terminals, recent studies have incorporated occupant movement patterns into thermal need assessments [11], forming a comprehensive framework for real-time, demand-driven indoor thermal optimization.
In outdoor environments, however, the concept of need-based control has mainly been implemented through localized cooling strategies designed for stationary users: for example, misting systems at semi-open bus stops [12] or radiant panels at transit hubs [13]. While these solutions improve comfort in small zones, they are typically designed for static conditions and do not address the dynamic thermal needs of mobile users such as pedestrians. Even in studies focused on pedestrian comfort, evaluations are often based on uniform environmental assessments across the entire study area rather than tailored to spatial–temporal patterns of pedestrian movement [14].
In the research field of pedestrian thermal comfort, three main directions have been summarized by several recent review articles: physical strategies and their effects on improving pedestrian thermal comfort [15]; the influence of physiological and psychological factors on pedestrian thermal perception [16]; and thermal comfort models specifically developed for pedestrians [17]. Research on physical strategies includes investigations into the effects of green, blue, and white surfaces, building orientation and geometry, and the application of modern materials in urban canyons. It also encompasses active cooling approaches such as radiative and spray cooling, as mentioned above. Outdoor thermal sensation models have been developed to evaluate both the needs for and the effectiveness of thermal comfort improvements [7]. However, when considering the distinctive characteristics of outdoor thermal environments and the inherent mobility of pedestrians, evaluating thermal comfort conditions solely based on environmental parameters remains inefficient. For example, certain areas may exhibit poor thermal conditions, but if pedestrians rarely pass through them, targeted interventions in such locations may have minimal practical impact.
Recent studies have begun to address this gap by incorporating pedestrian mobility into outdoor thermal comfort research. For example, Vanos et al. [18] assessed microclimatic variations along the 2020 Tokyo Olympic marathon route using sky view factor and thermal measurements, identifying comfort hotspots for targeted interventions. Vasilikou and Nikolopoulou [19] examined walking routes in Rome and London, highlighting the thermal implications of spatial transitions. Lau et al. [20] demonstrated that thermal sensation during walking correlated strongly with short-term solar exposure windows of 2–3 min. Xie et al. [16] found that the exposure sequence and short-term thermal history within 30 s have a large influence on current thermal sensation and comfort. Yu et al. [21] introduced the concept of thermal respite for pedestrians in overheated urban environments by drawing an analogy between thermal discomfort and a capacitor, where discomfort accumulates (“charges”) and dissipates (“discharges”) over time. In this model, the thermal discomfort capacitor is considered to charge with a 0.4 °C increase in mean body temperature and discharge at a rate of approximately 0.7 °C per minute. Peng et al. [22]’s urban climate walk experiment emphasizes the importance of incorporating spatial and social contexts into the investigation of pedestrian thermal comfort. Although these studies provide valuable insights, they largely focus on post hoc assessments and are limited in their ability to inform early-stage thermal design.
To overcome this limitation, researchers have increasingly turned to agent-based models to simulate pedestrian movement and integrate it into thermal design frameworks. Ma et al. [23] used agent-based models to evaluate route choices influenced by the thermal environment and perceived travel time. Yıldız and Çağdaş [24] adopted fuzzy logic to introduce the attractiveness values of urban space components as attract forces on an agent-based simulation model to simulate user behaviors. Li et al. [25] used PedSim to simulate micro-level pedestrian behavior and optimize neighborhood-scale urban morphology. While these studies have advanced the integration of human movement into urban design, they primarily focus on either behavioral modeling or morphological optimization, often without a direct linkage to the spatial heterogeneity of thermal comfort demands.
Building on these developments, the present study proposes a new thermal demand-responsive design framework that integrates simulated pedestrian movement with thermal environment assessment to inform targeted, user-centric thermal environment improvements. Unlike previous studies, our approach introduces a new index, the Thermal Comfort Demand Index: Demand of thermal comfort (DTC), to quantify the spatial and temporal intensity of thermal comfort demand across public spaces based on the convergence of pedestrian density and thermal stress levels. The thermal environment is accessed by field measurements and CFD simulations, and pedestrian behavior is simulated by MassMotion (Version 11.0) simulations. A new index of the demand of thermal comfort is introduced to quantify the need for thermal comfort improvements in concerned public spaces. This study will provide a new design framework for the optimization of user-centric outdoor thermal environments.
2. Method
The method section introduces a user-centric framework for optimizing the outdoor thermal environment. A commercial pedestrian mall in Nanchong, Sichuan Province, China, is used as a case study to demonstrate the application of this framework. The proposed approach quantifies the need for thermal environment improvements by integrating both thermal conditions and pedestrian-based user demands. Thermal conditions are evaluated using Computational Fluid Dynamics (CFD) simulations with PHOENICS 2016, while user requirements are captured through pedestrian flow modeling with MassMotion (Version 11.0). A differentiated thermal demand model is developed in this study, enabling the quantification of thermal optimization needs from a user-centered perspective.
2.1. Site Characterization
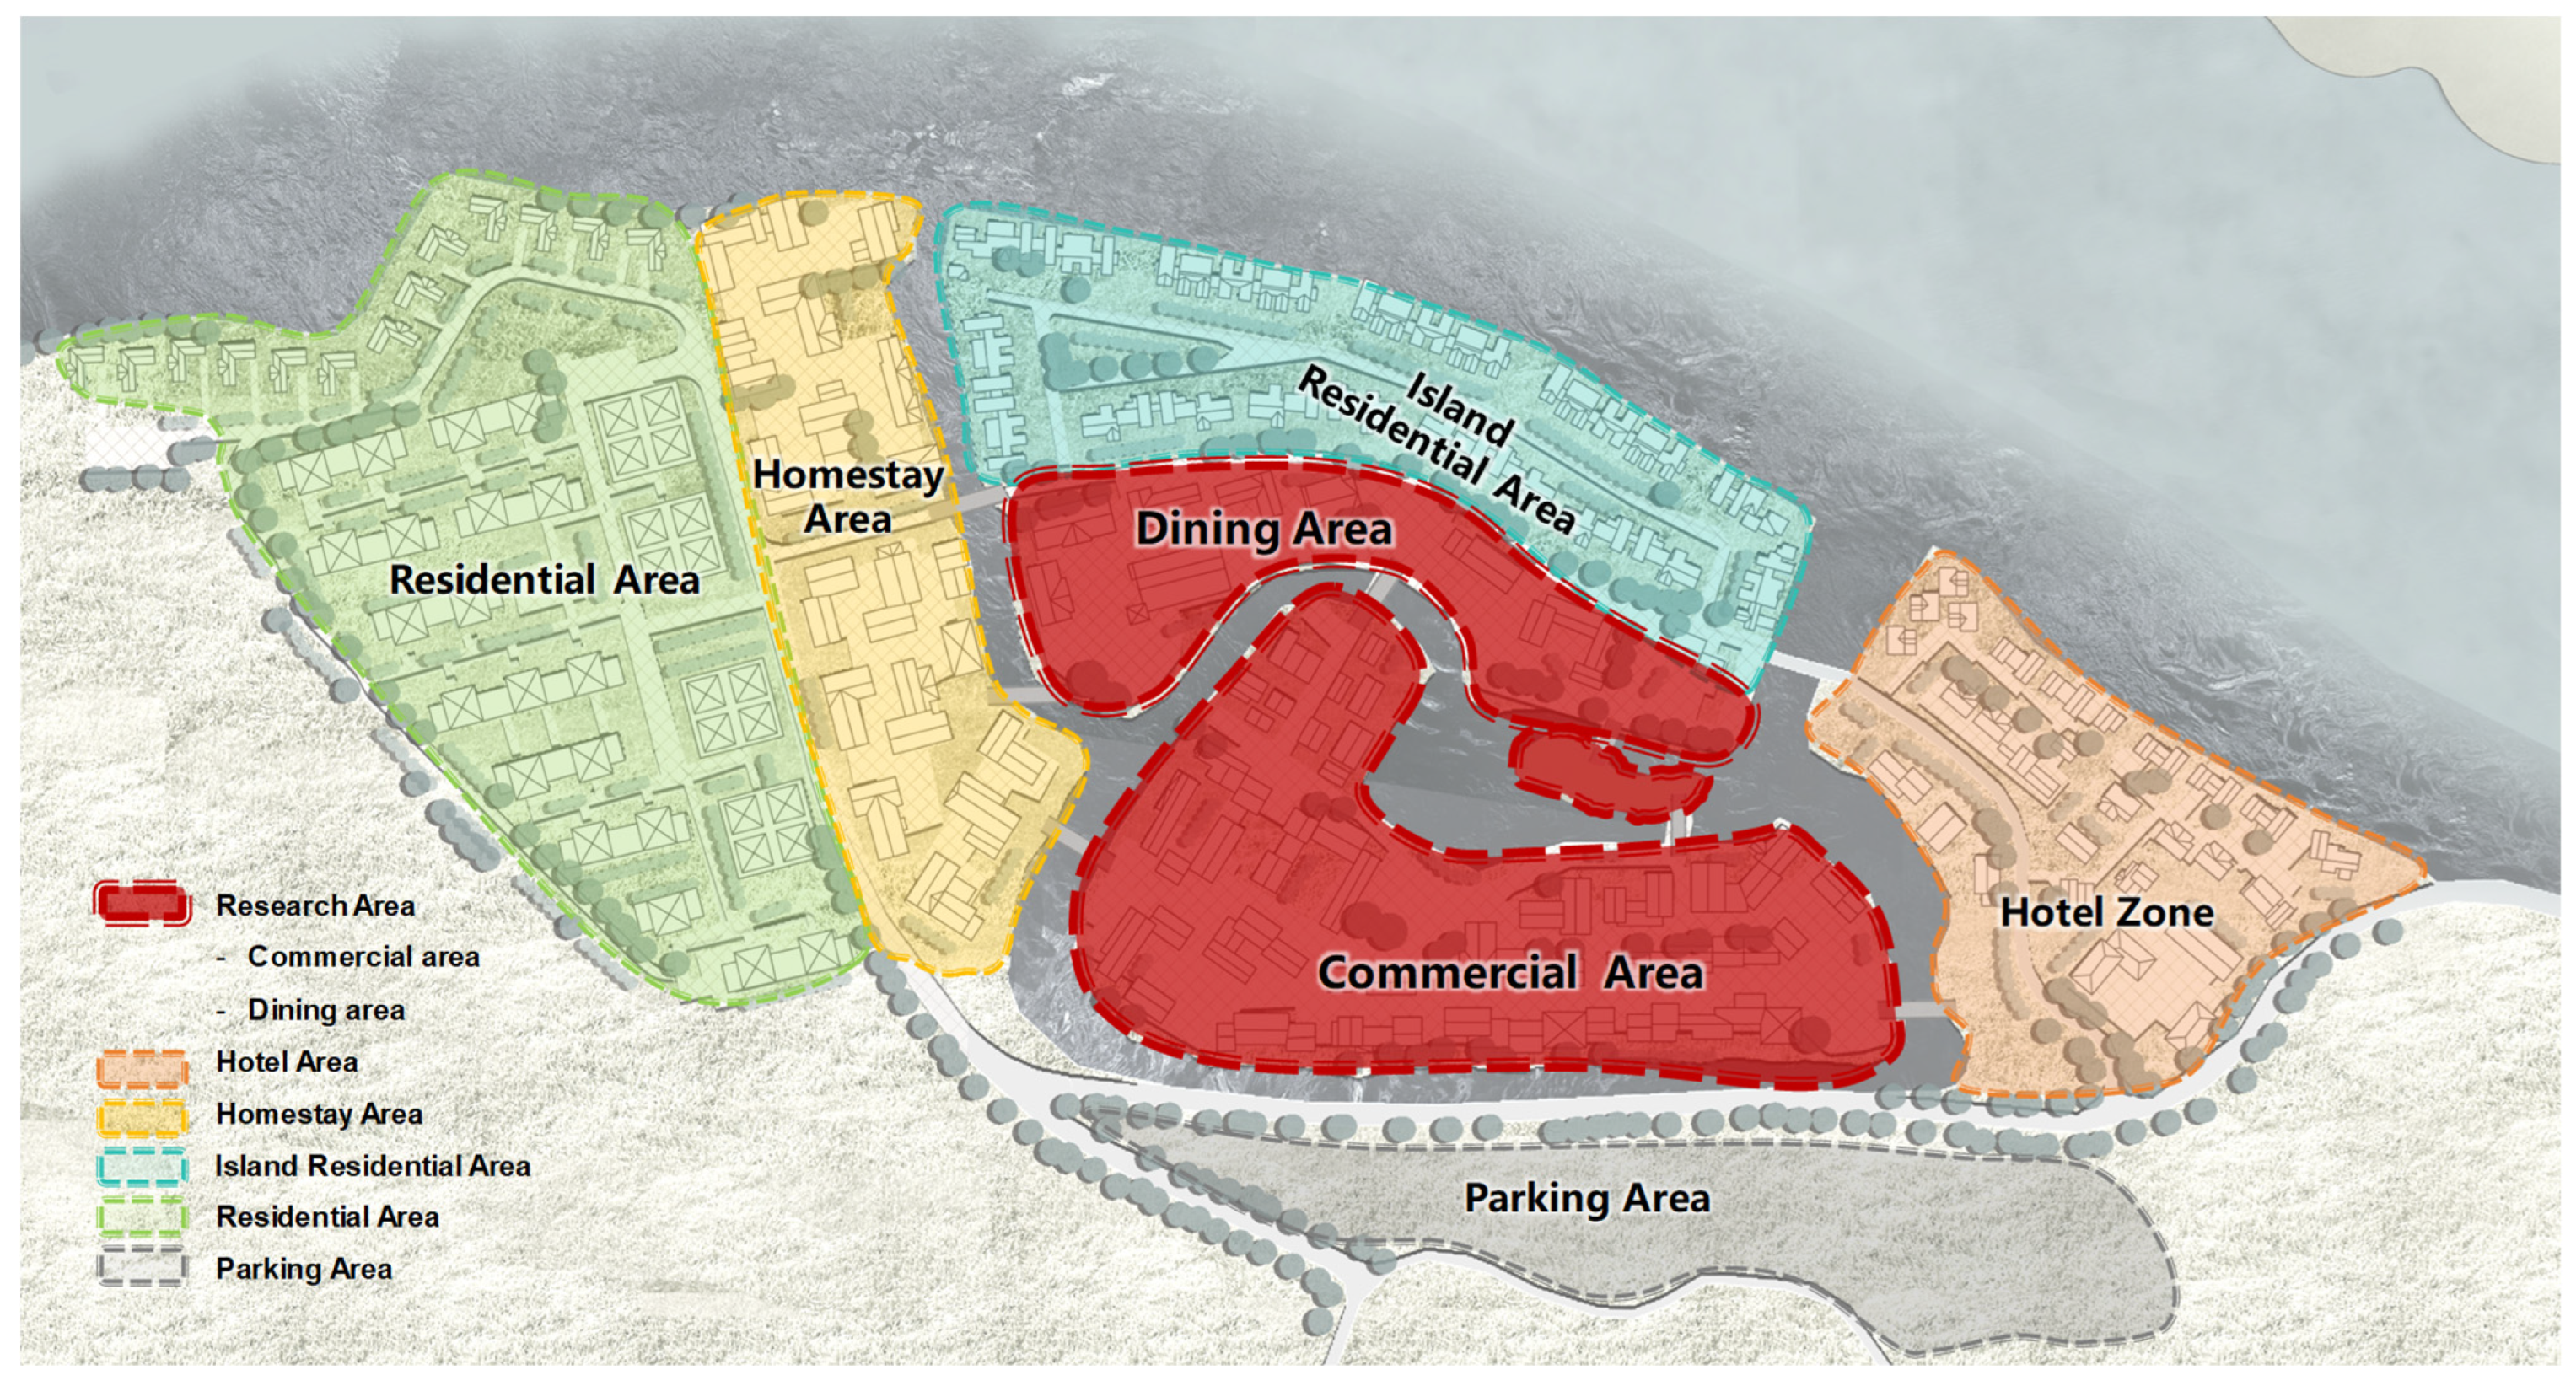
The study focuses on a planned commercial pedestrian mall in Nanchong, Sichuan, China (30.78° N, 106.08° E), designed as a mixed-use tourism hub integrating commercial, dining, and accommodation facilities (Figure 1). In this study, the term “commercial pedestrian mall” refers to an outdoor or semi-open urban retail corridor that is restricted to pedestrian traffic and typically lined with shops, restaurants, and leisure spaces. Our study focuses on the commercial pedestrian mall, which includes two primary functional zones: a commercial area and a dining area. The commercial area spans approximately 300 m in walking distance, while the dining area covers roughly 210 m. The width of the pedestrian walkways varies between 7 and 14 m.
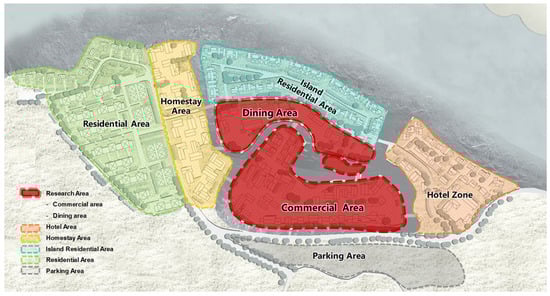
Figure 1.
Site layout diagram.
This case site is located in northeast Sichuan, which belongs to a subtropical monsoon climate zone characterized by hot and humid summers. Due to Sichuan’s topographical basin effect, the site is characterized by stagnant airflow. Additionally, its proximity to the Jialing River Basin results in relatively higher humidity compared with other urban areas in Sichuan. As a designated commercial pedestrian mall, the site provides extensive public spaces in open and semi-open areas for tourists. Consequently, apart from the time spent inside shops, pedestrians are predominantly exposed to outdoor conditions, where they may experience discomfort due to high air temperatures, elevated humidity levels, and low wind speeds during summer. These conditions create an urgent need to address thermal discomfort for outdoor users during summer.
2.2. Optimization Framework
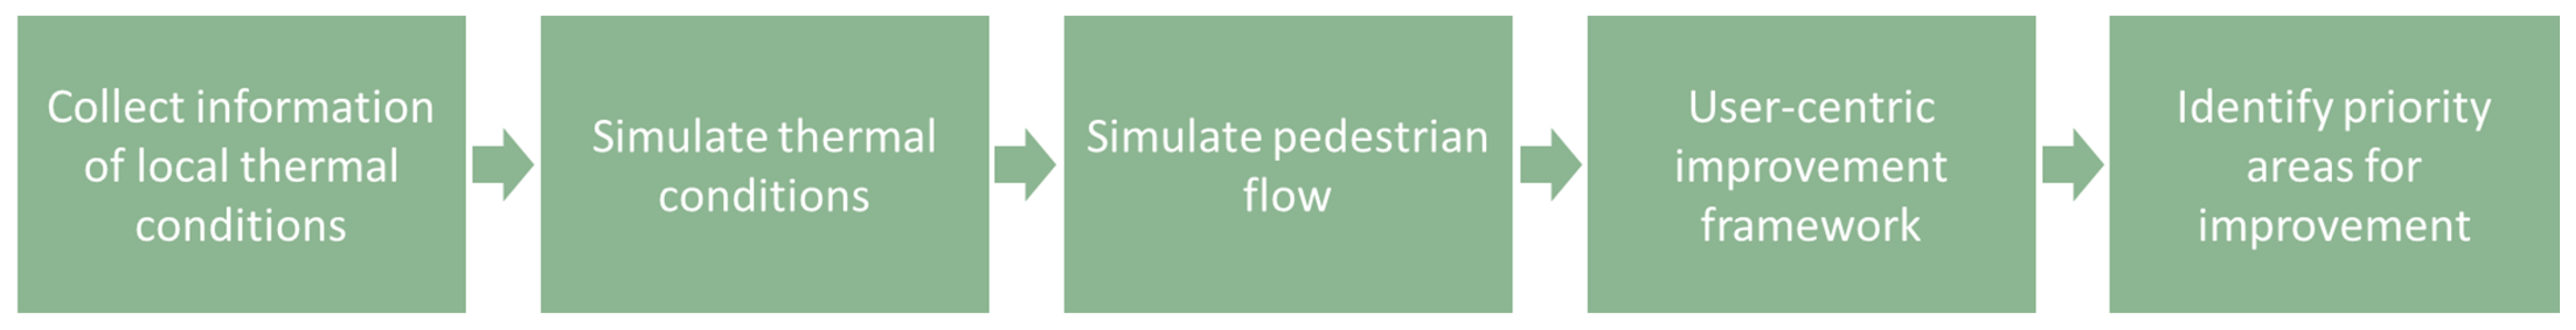
Traditional thermal optimization strategies, effective in indoor environments due to controlled boundaries (e.g., building envelopes), struggle in outdoor settings where continuous heat exchange occurs between the thermally improved area and its surroundings. Conventional methods prioritize environmental metrics (e.g., temperature reduction) but fail to account for dynamic human–environment interactions. Without spatial or functional boundaries to isolate the “improvement zones”, heat transfer from adjacent areas undermines mitigation efforts. This necessitates a paradigm shift toward user-centered optimization, which prioritizes human activity patterns and localized thermal needs. The optimization framework is shown in Figure 2. Firstly, the boundary conditions were obtained from local standards and verified from field measurements during the design stage. Then, CFD simulations were used to predict pedestrian-level microclimate conditions using the defined boundary conditions. A commercial pedestrian flow simulation software MassMotion (Version 11.0) was used to simulate the pedestrian movement flow in this commercial pedestrian mall based on local tourism data. A user-centric framework was then developed to identify priority areas for intervention based on a quantification method cross-referencing thermal stress data with pedestrian flow patterns.

Figure 2.
Optimization framework.
2.3. Microclimate Monitoring
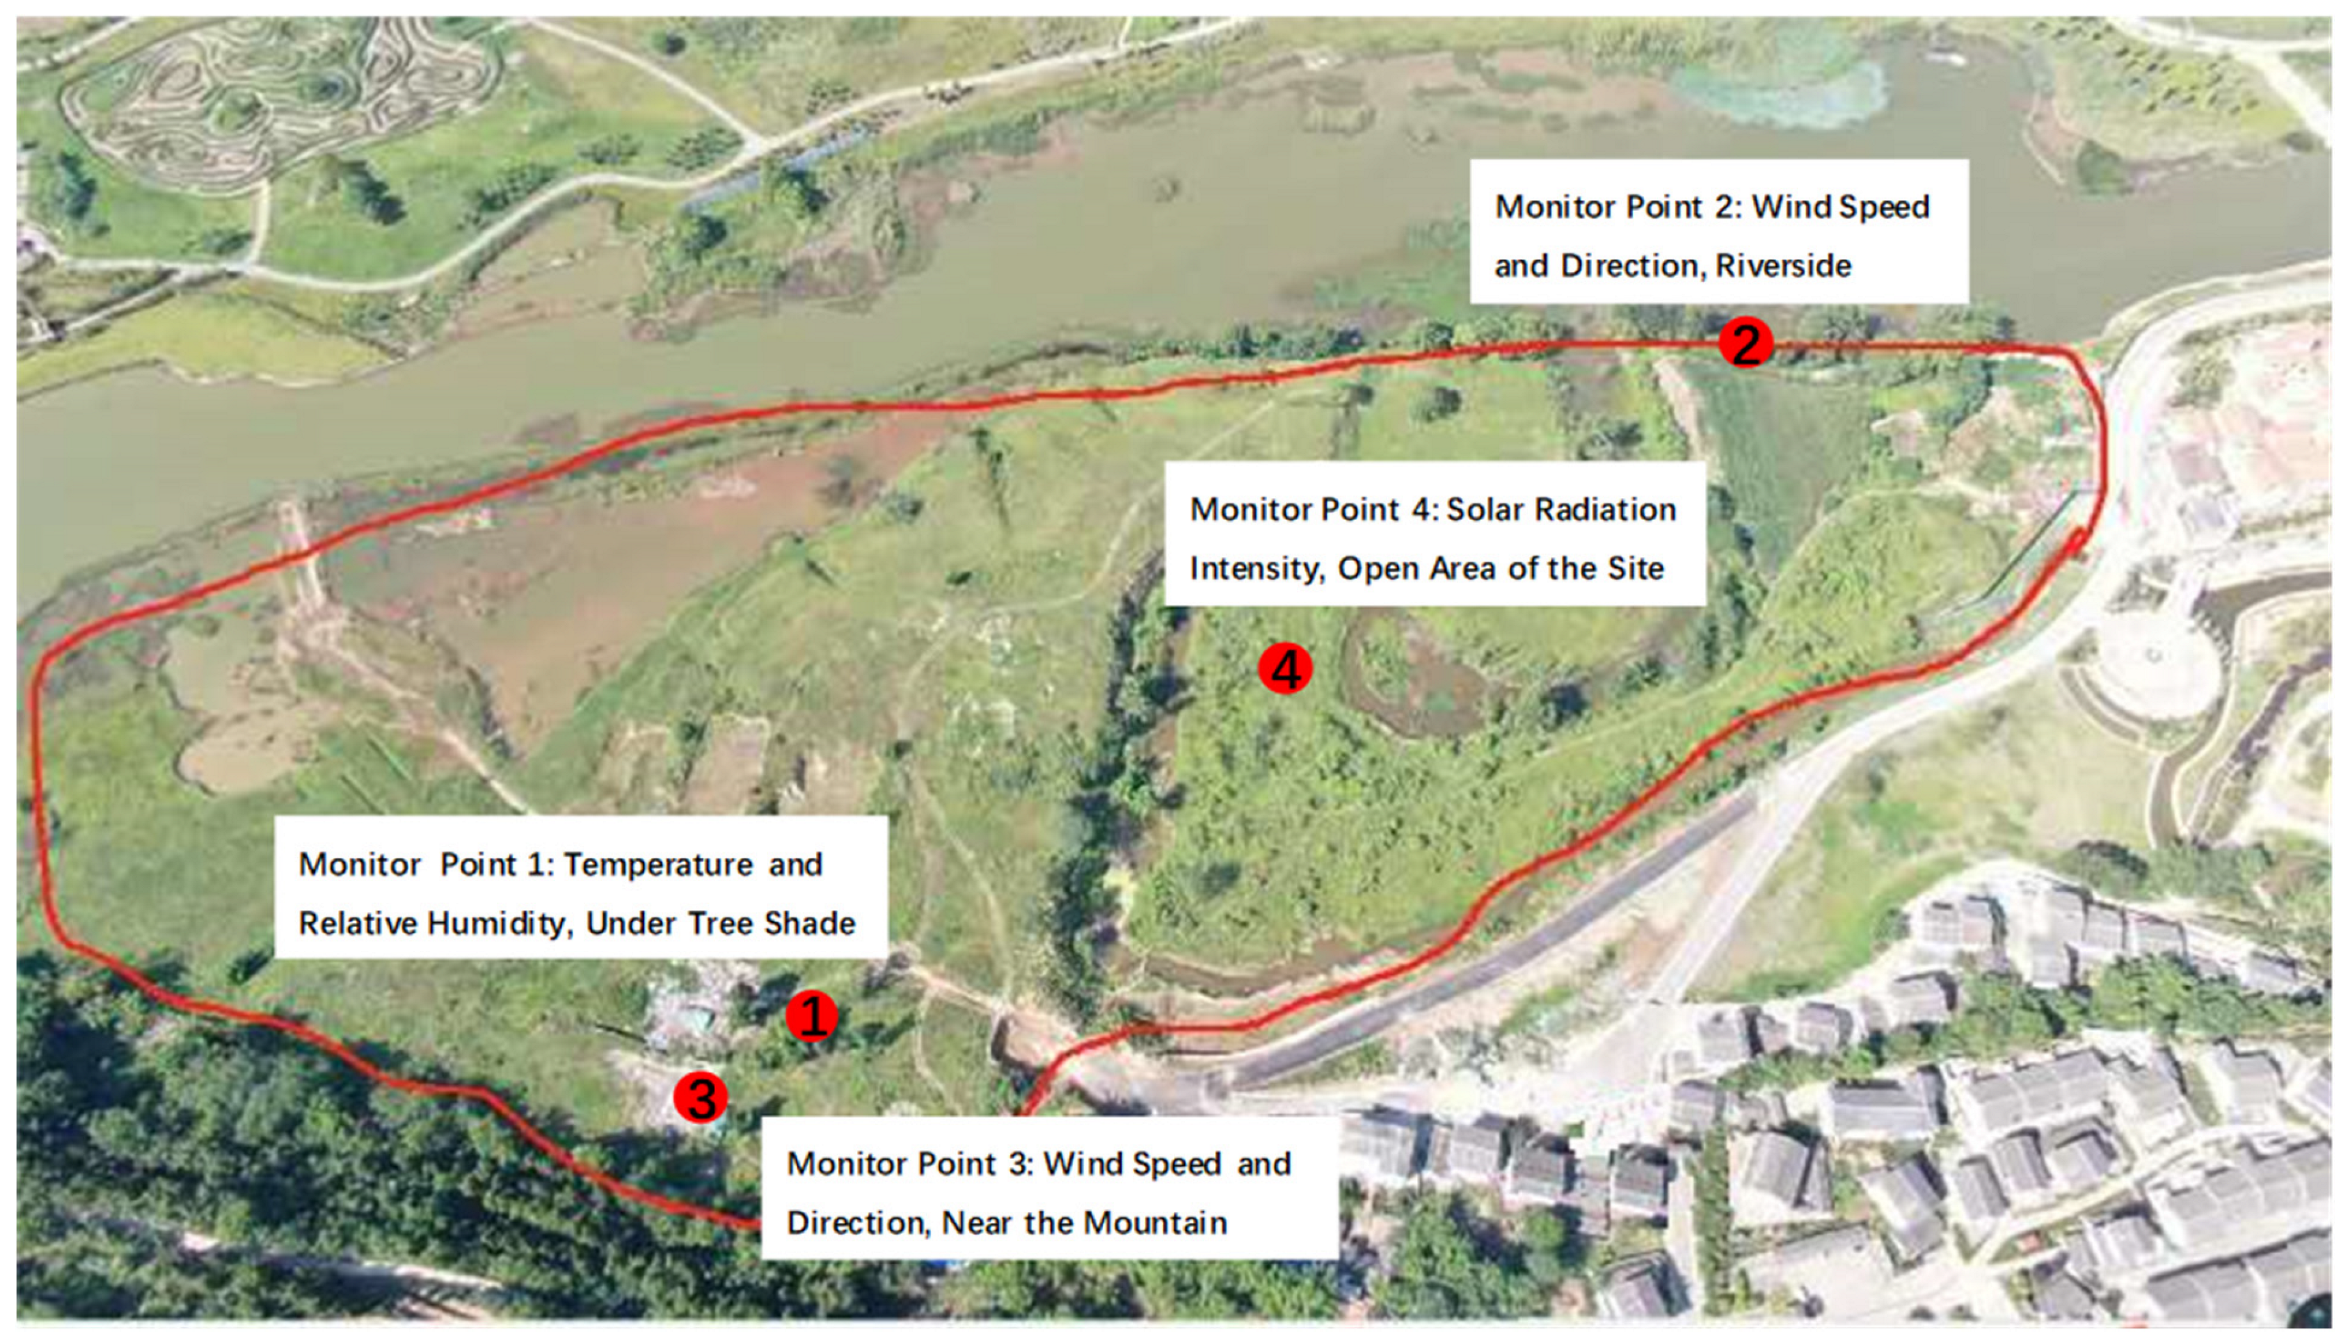
Boundary conditions for the CFD model were derived through a hybrid approach combining on-site microclimate measurements and regional meteorological data. During the design phase, field measurements were conducted on 28 July 2020 at the experimental site to capture pedestrian-level microclimate parameters. The technical details of measurement devices are listed in Table 1. Measurement points were strategically distributed across the commercial pedestrian mall (Figure 3), with sensors positioned at 1.5 m height to reflect human thermal exposure. The dry-bulb air temperature and relative humidity were measured at P1 under tree shade. To represent the wind environment near the mountain and riverside, wind direction and wind speed were measured at P2 and P3. Total radiation was measured at P4. The field measurement data were cross-validated against weather data obtained from the Nanchong Meteorological Bureau and design standards of China (GB50180-2018 [26] and JGJ/T449-2018 [27]).

Table 1.
Measurement devices and technical information.
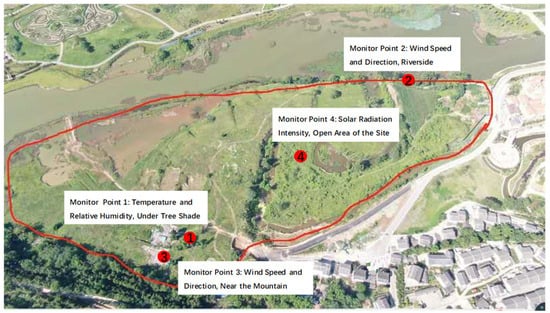
Figure 3.
Measurement locations of microclimate parameters.
2.4. CFD Simulation Settings
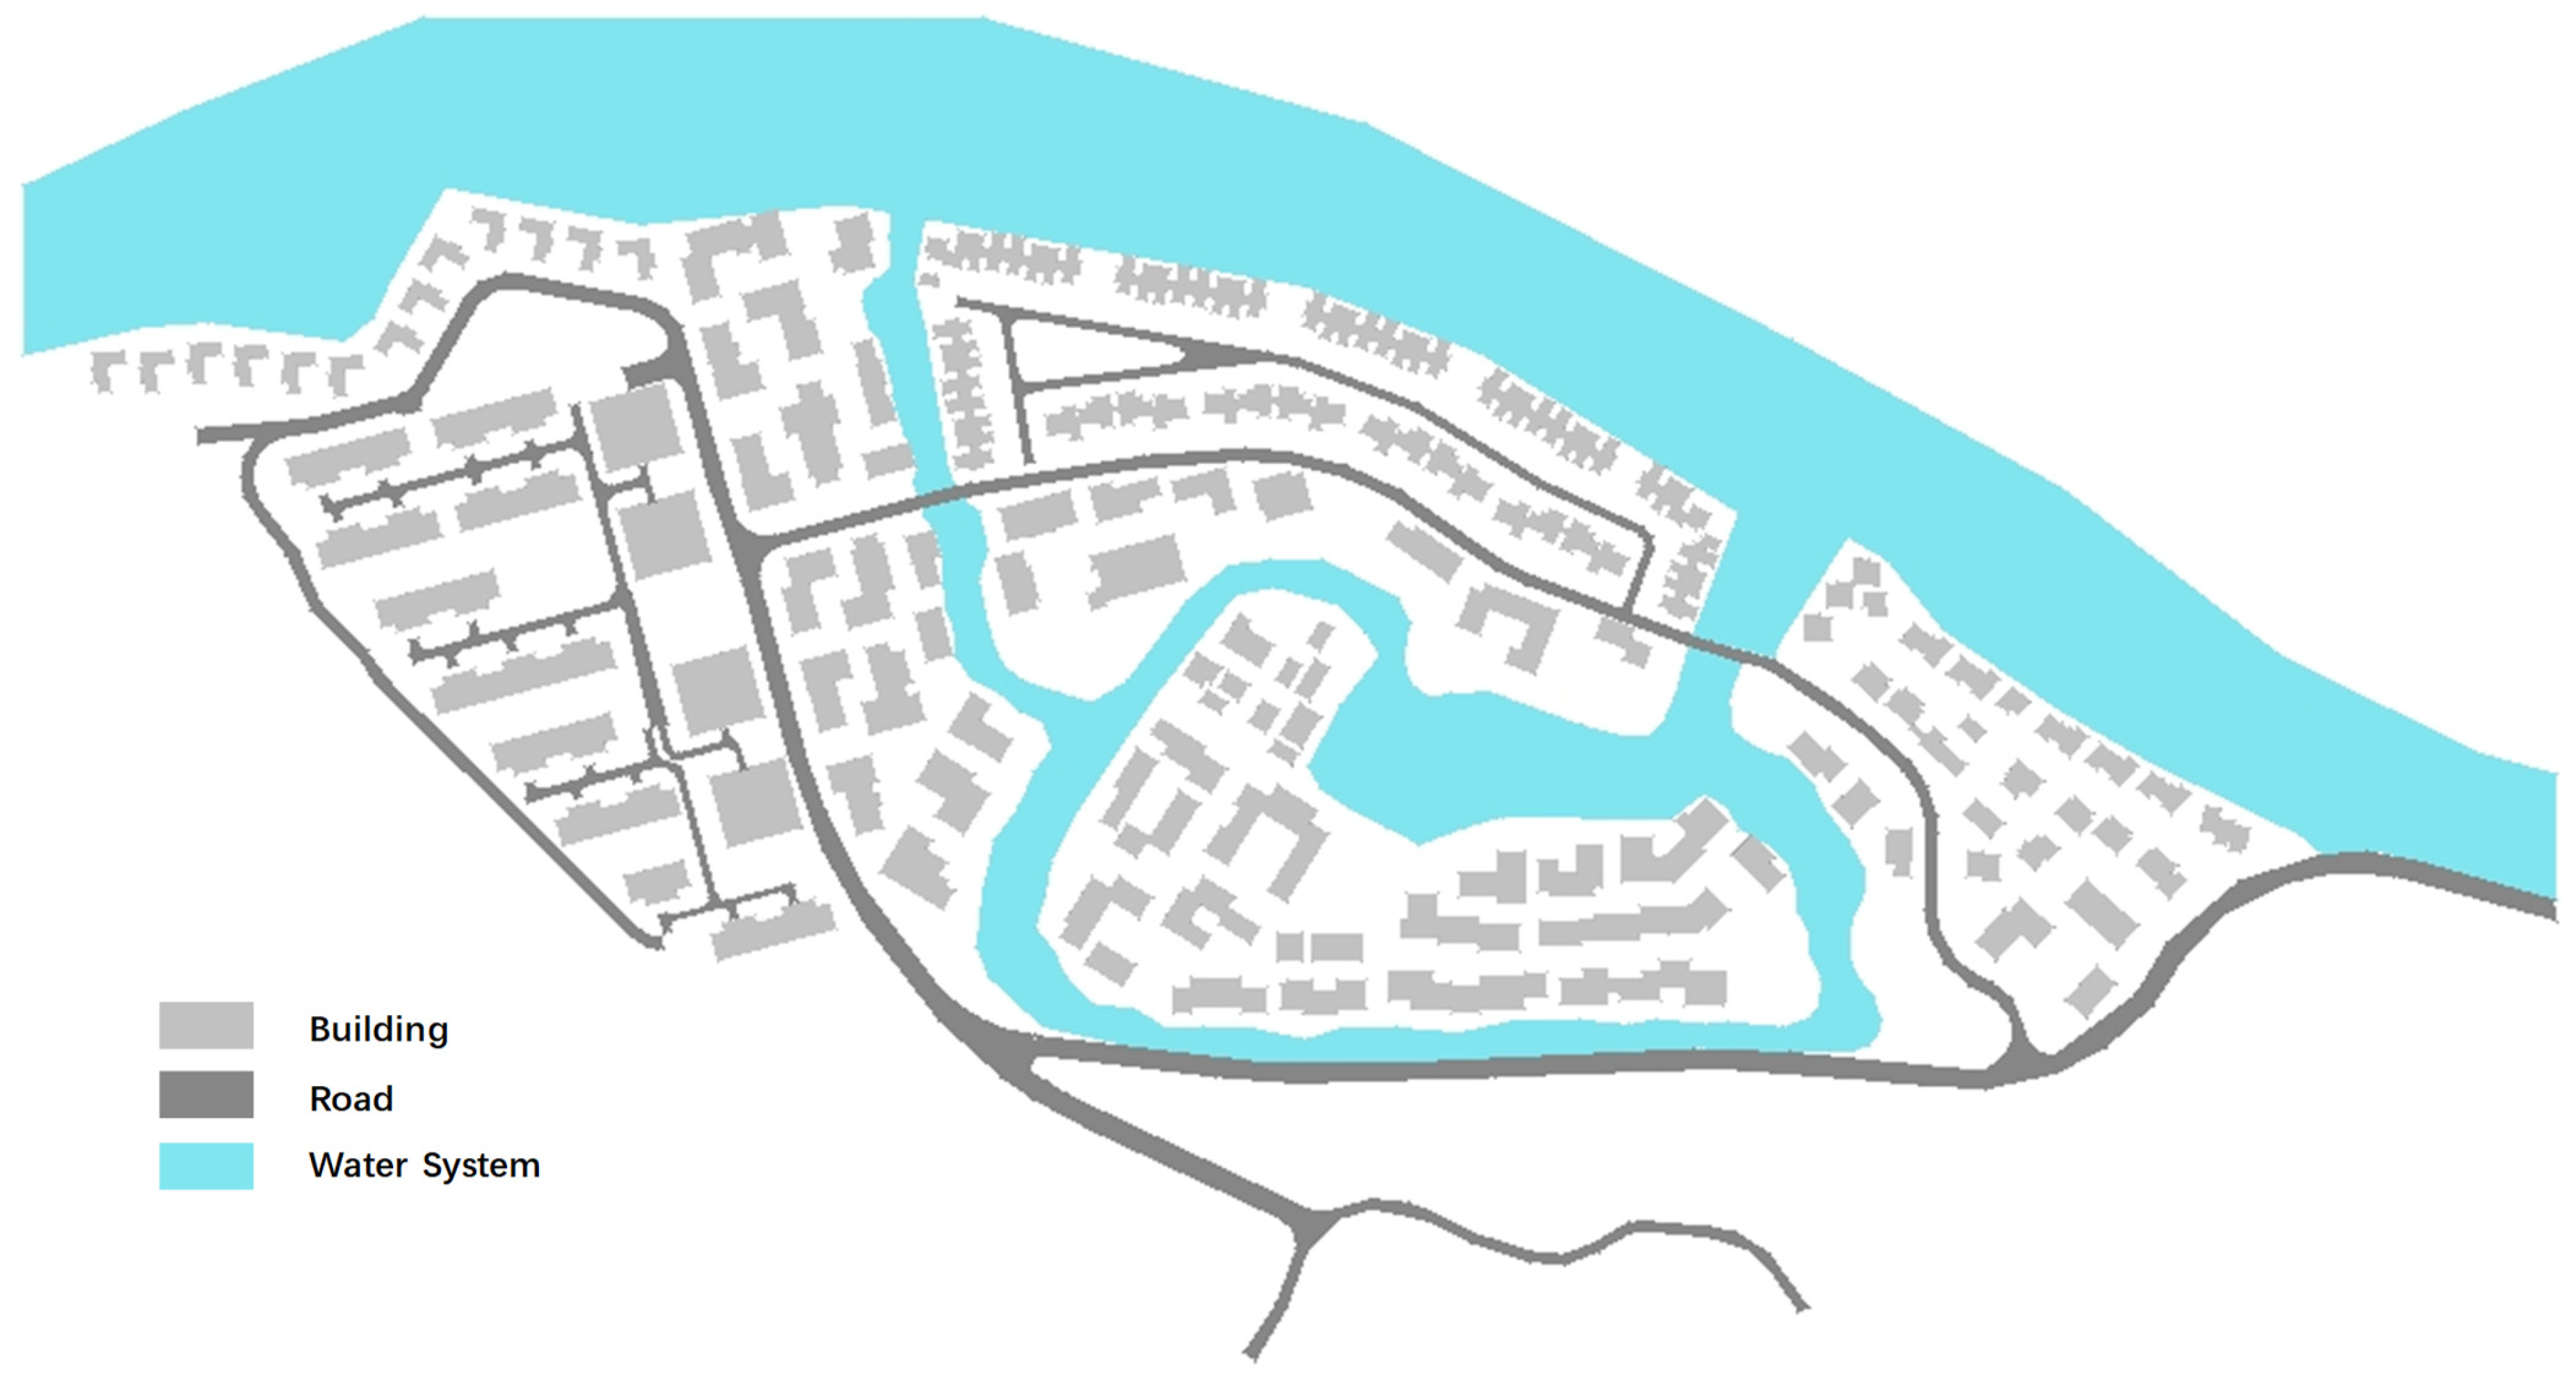
The site’s thermal conditions were analyzed using CFD simulations based on commercial software PHOENICS 2018. A three-dimensional massing model was developed based on the actual design dimensions of building clusters, incorporating architectural structures, road networks, and water elements. Strategic geometric simplifications were applied to the physical model (Figure 4) to optimize computational efficiency while maintaining essential flow characteristics, thereby accelerating solution convergence without compromising simulation accuracy.

Figure 4.
Physics model used in PHOENICS.
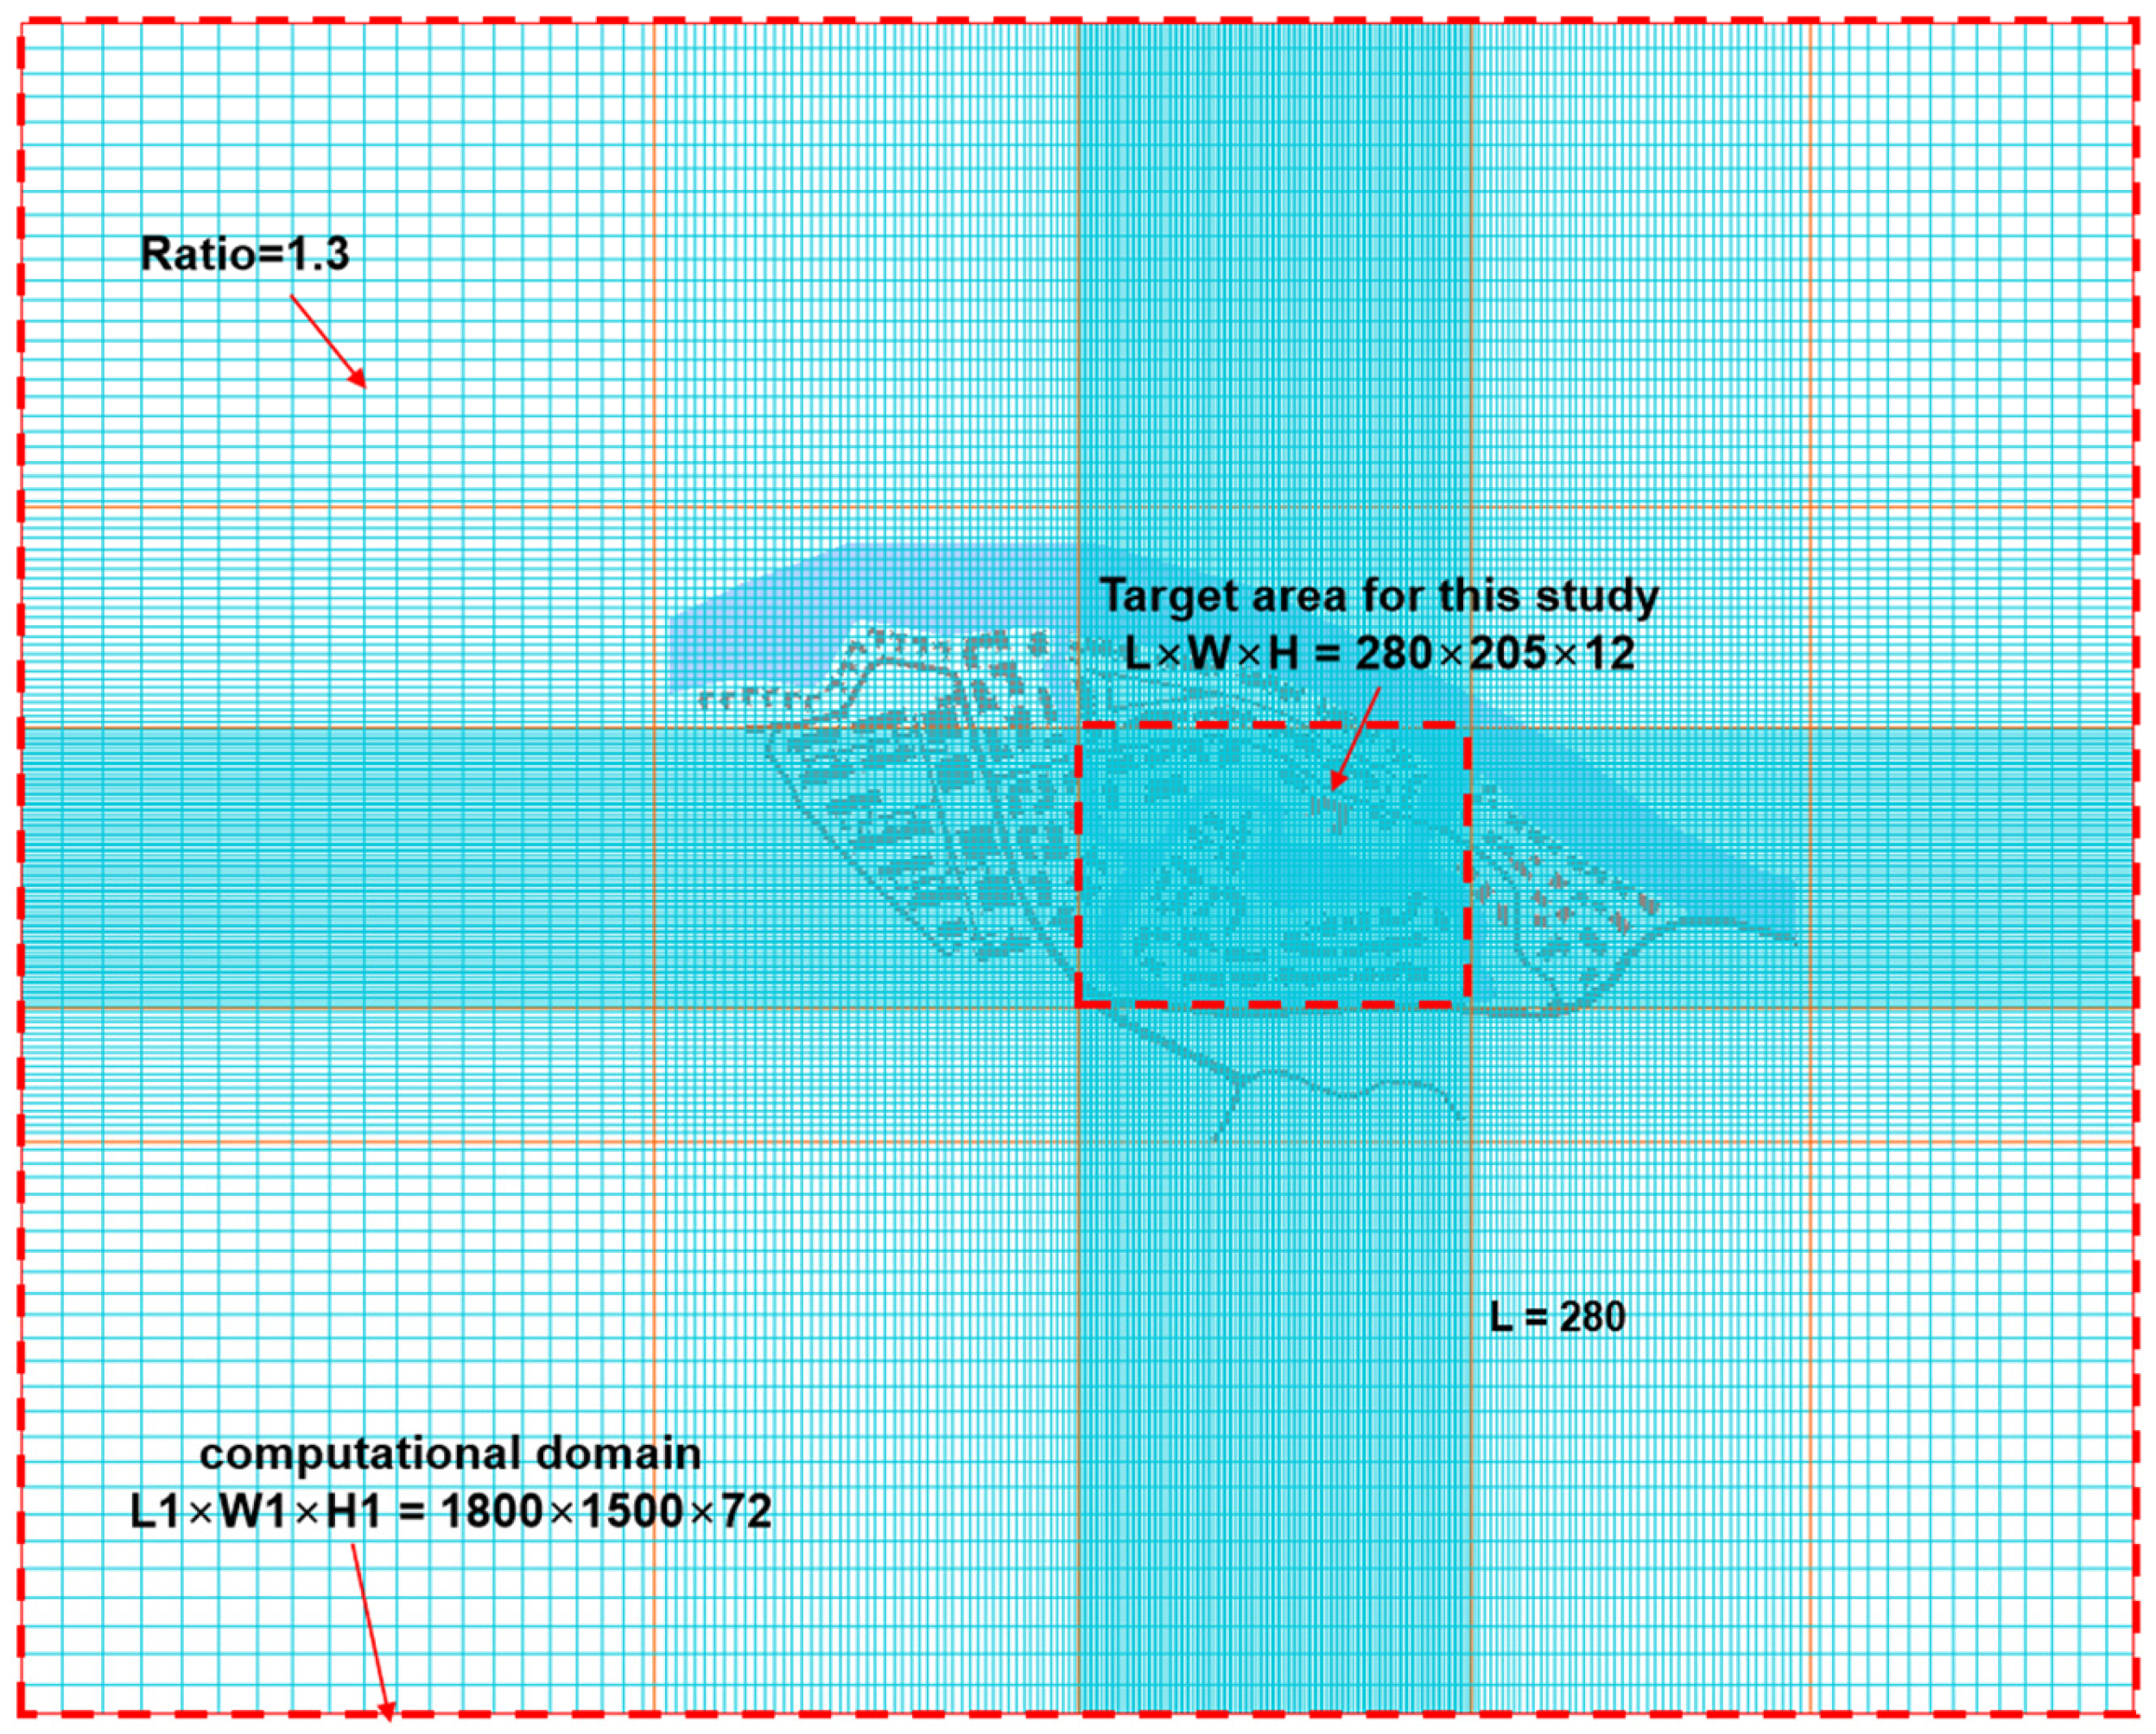
The computational domain and mesh generation were designed in compliance with the requirements of calculating outdoor physics environment from the Standard for Green Performance Calculation of Civil Buildings (JGJ/T449-2018) [27]. Table 2 presents the requirements from this standard related to this case and the simulation settings. All simulation settings used in this study comply with the requirements specified in the JGJ/T 449-2018 Standard. The blockage ratio was set as 2.59%. The height was defined as the highest building inside the domain (H). The vertical and horizontal distances between the edge of building clusters and the computational domain was set as 5H, 54H, and 54H, respectively. The grid number between the ground and the pedestrian-level height was set as 3. The mesh transition ratio was set as no larger than 1.3. Figure 5 presents the computational domain and mesh distribution in this case.
Table 2.
Requirements from Standard related to this case and the simulation settings.
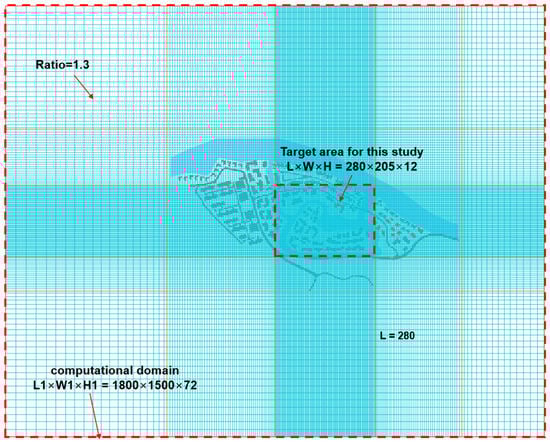
Figure 5.
Computational domain and mesh distribution.
The standard k-ε turbulence model was adopted for this study. This model is widely recognized for its robustness and computational efficiency in simulating outdoor airflow. As a two-equation model, it offers a good balance between accuracy and computational cost, particularly when predicting Reynolds-averaged characteristics of urban wind environments with moderate complexity. This selection aligns with the comparative analysis by Li et al. [28], which demonstrated minimal deviations (<8%) between the standard k-ε model predictions and empirical data across diverse outdoor wind environment simulations. The underlying surface is set as large urban/suburban areas with a roughness exponent α of 0.16.
Based on the field measurement results and data from the local weather bureau, the recommended inflow wind temperature of 31.3 °C in JGJ/T 449-2018 was deemed suitable for this simulation. The inflow wind speed was set at 1.5 m/s, originating from the northwest (from the water surface toward the land), consistent with the measured pedestrian-level wind speed at monitoring point MP2. MP2 is located in the upstream area of the prevailing wind direction and is not obstructed by surrounding topography, such as the adjacent mountain. Therefore, it was considered an appropriate reference point for determining the wind speed input in the simulation. The total solar radiation intensity was set at 694 W/m2 to align with the field measurement results at 10:00 AM, representing the business hours of the commercial street. The absorptivity properties of building surfaces, soil, street surfaces, and the water system were assigned as 0.5, 0.6, 0.8, and 0.9, respectively, based on typical material properties.
2.5. Pedestrian Flow Simulation
A pedestrian movement analysis method was introduced to identify key nodes where people tend to pass by and stay. This analysis was conducted using the MassMotion software, which is based on the social force model proposed by Helbing et al. [29] and is grounded in Newton’s second law. MassMotion is a simulation tool that integrates 3D environments with human behavior analysis and is widely used for pedestrian path planning and evacuation modeling [30,31,32].
A 3D building outline was constructed in MassMotion based on the street layout. To enhance computational efficiency, given the focus of this study is on pedestrian behavior in outdoor environments, buildings within the simulation district were simplified into block models.
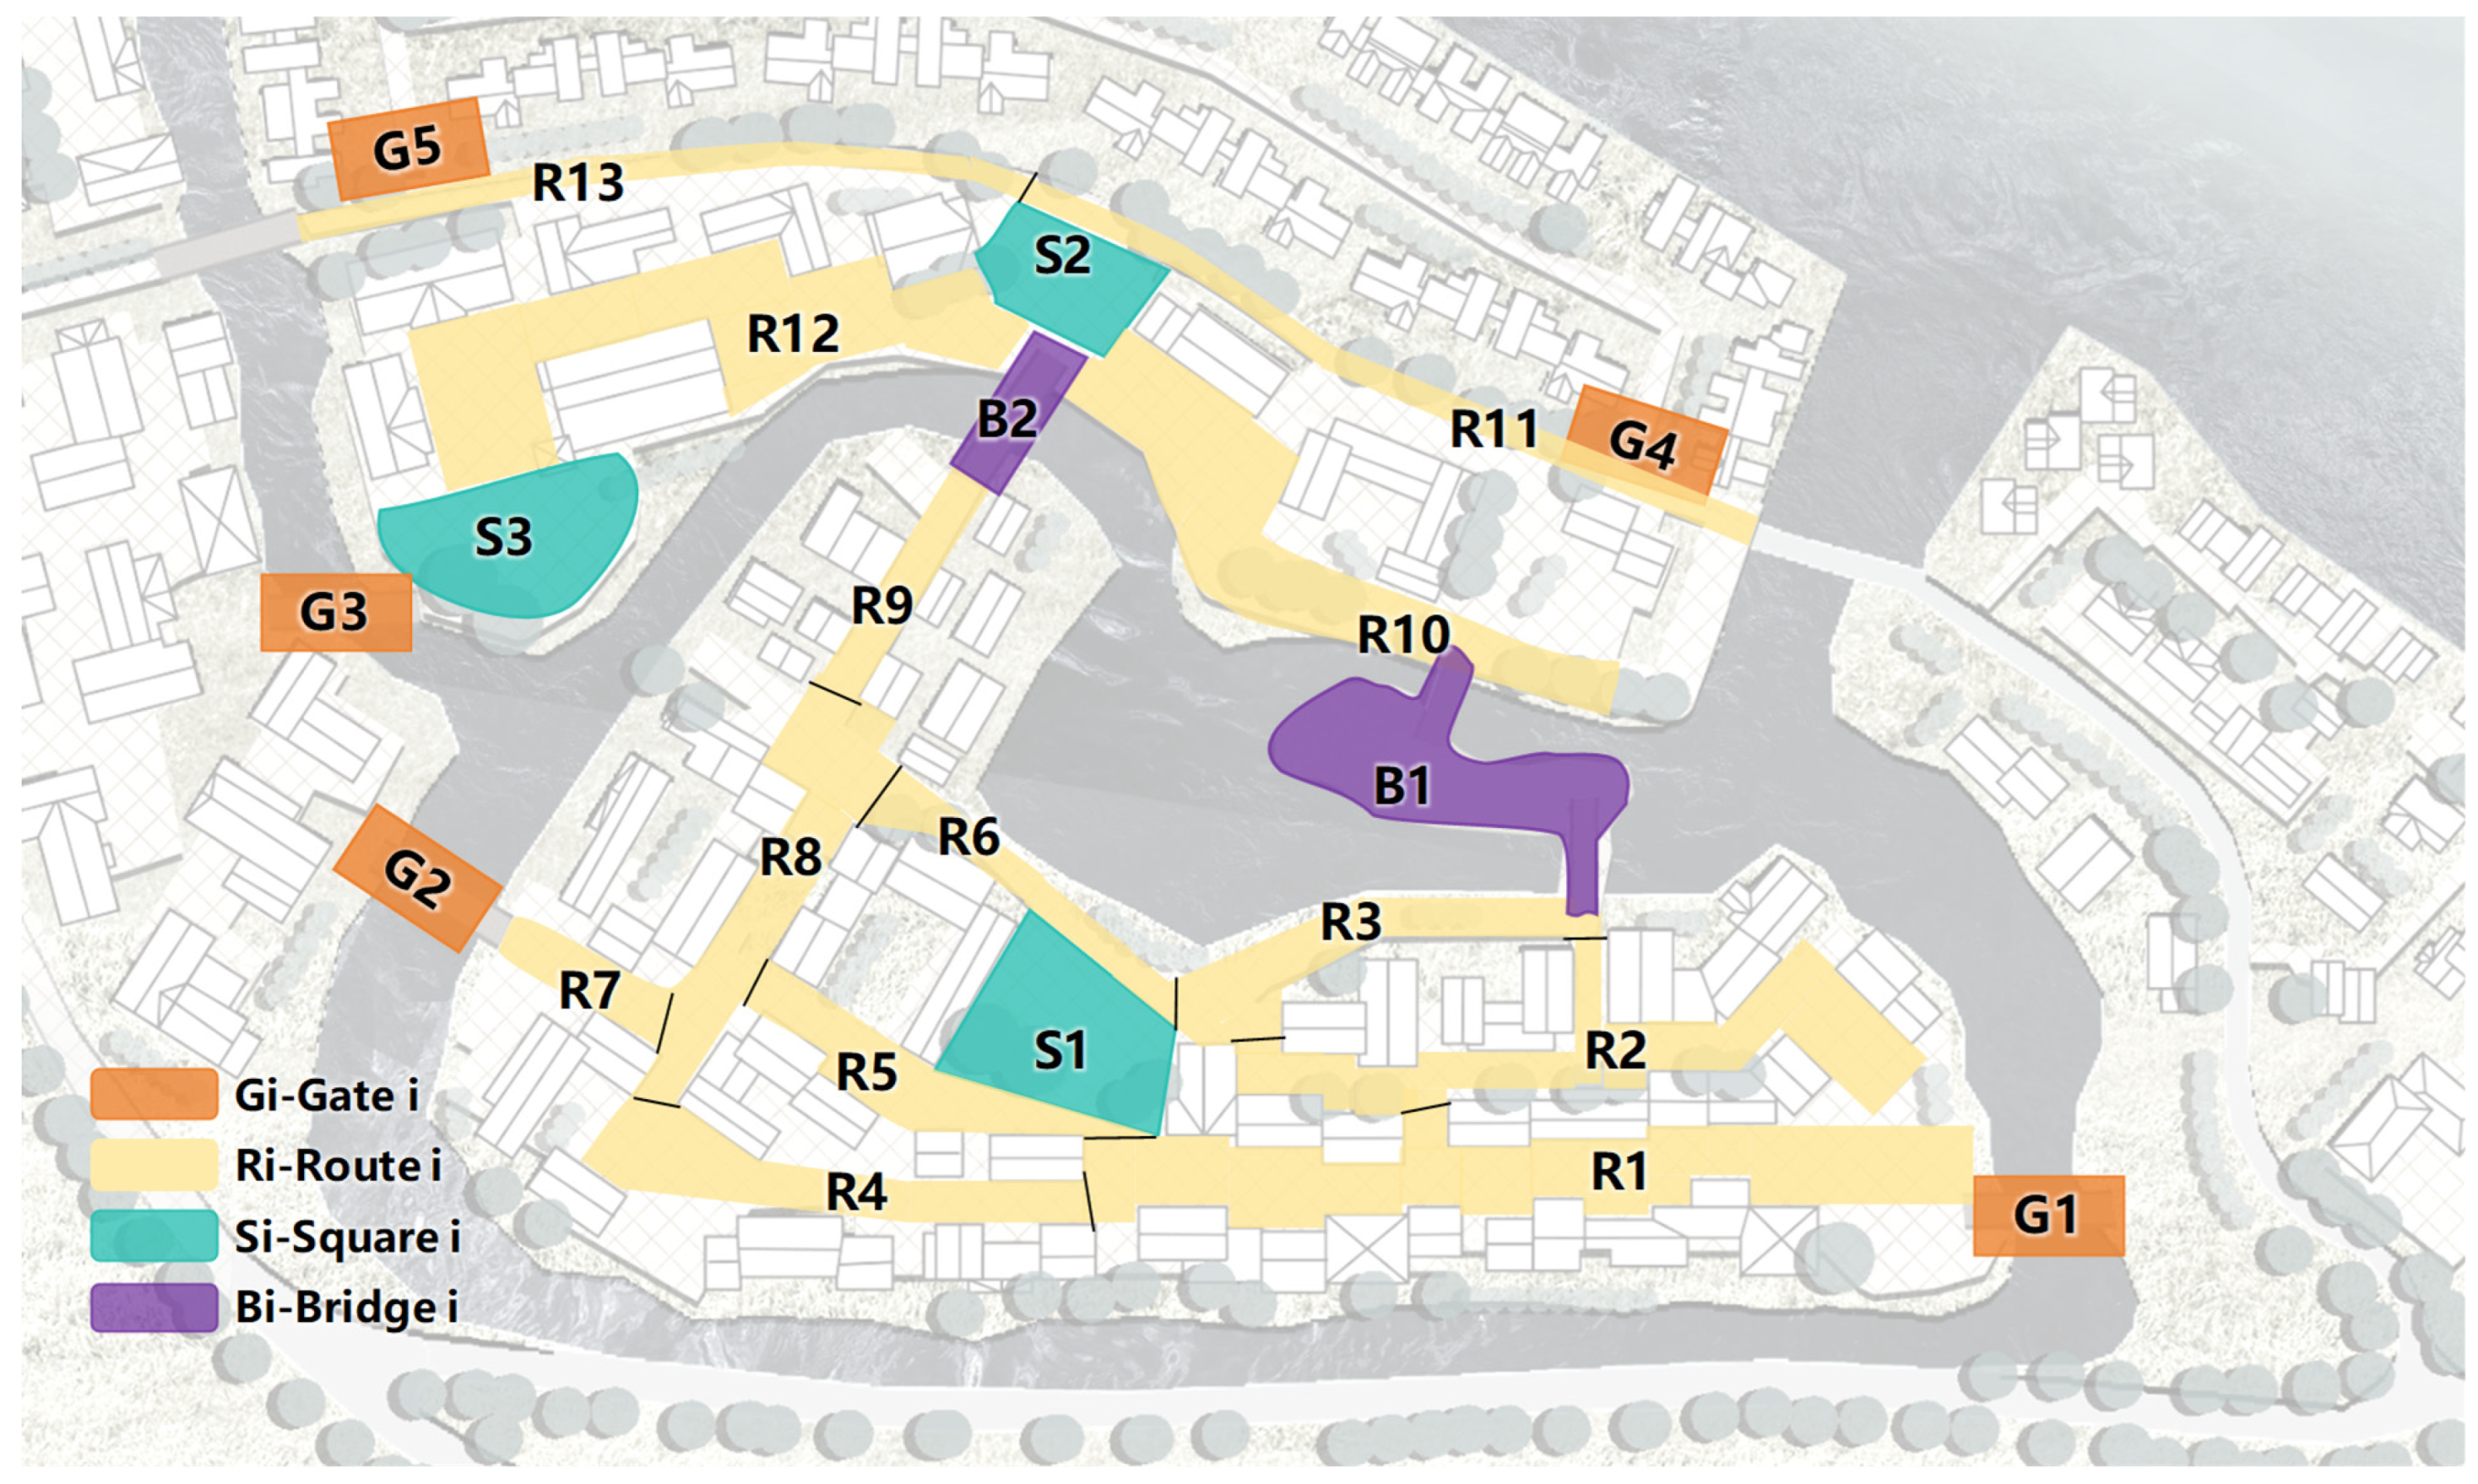
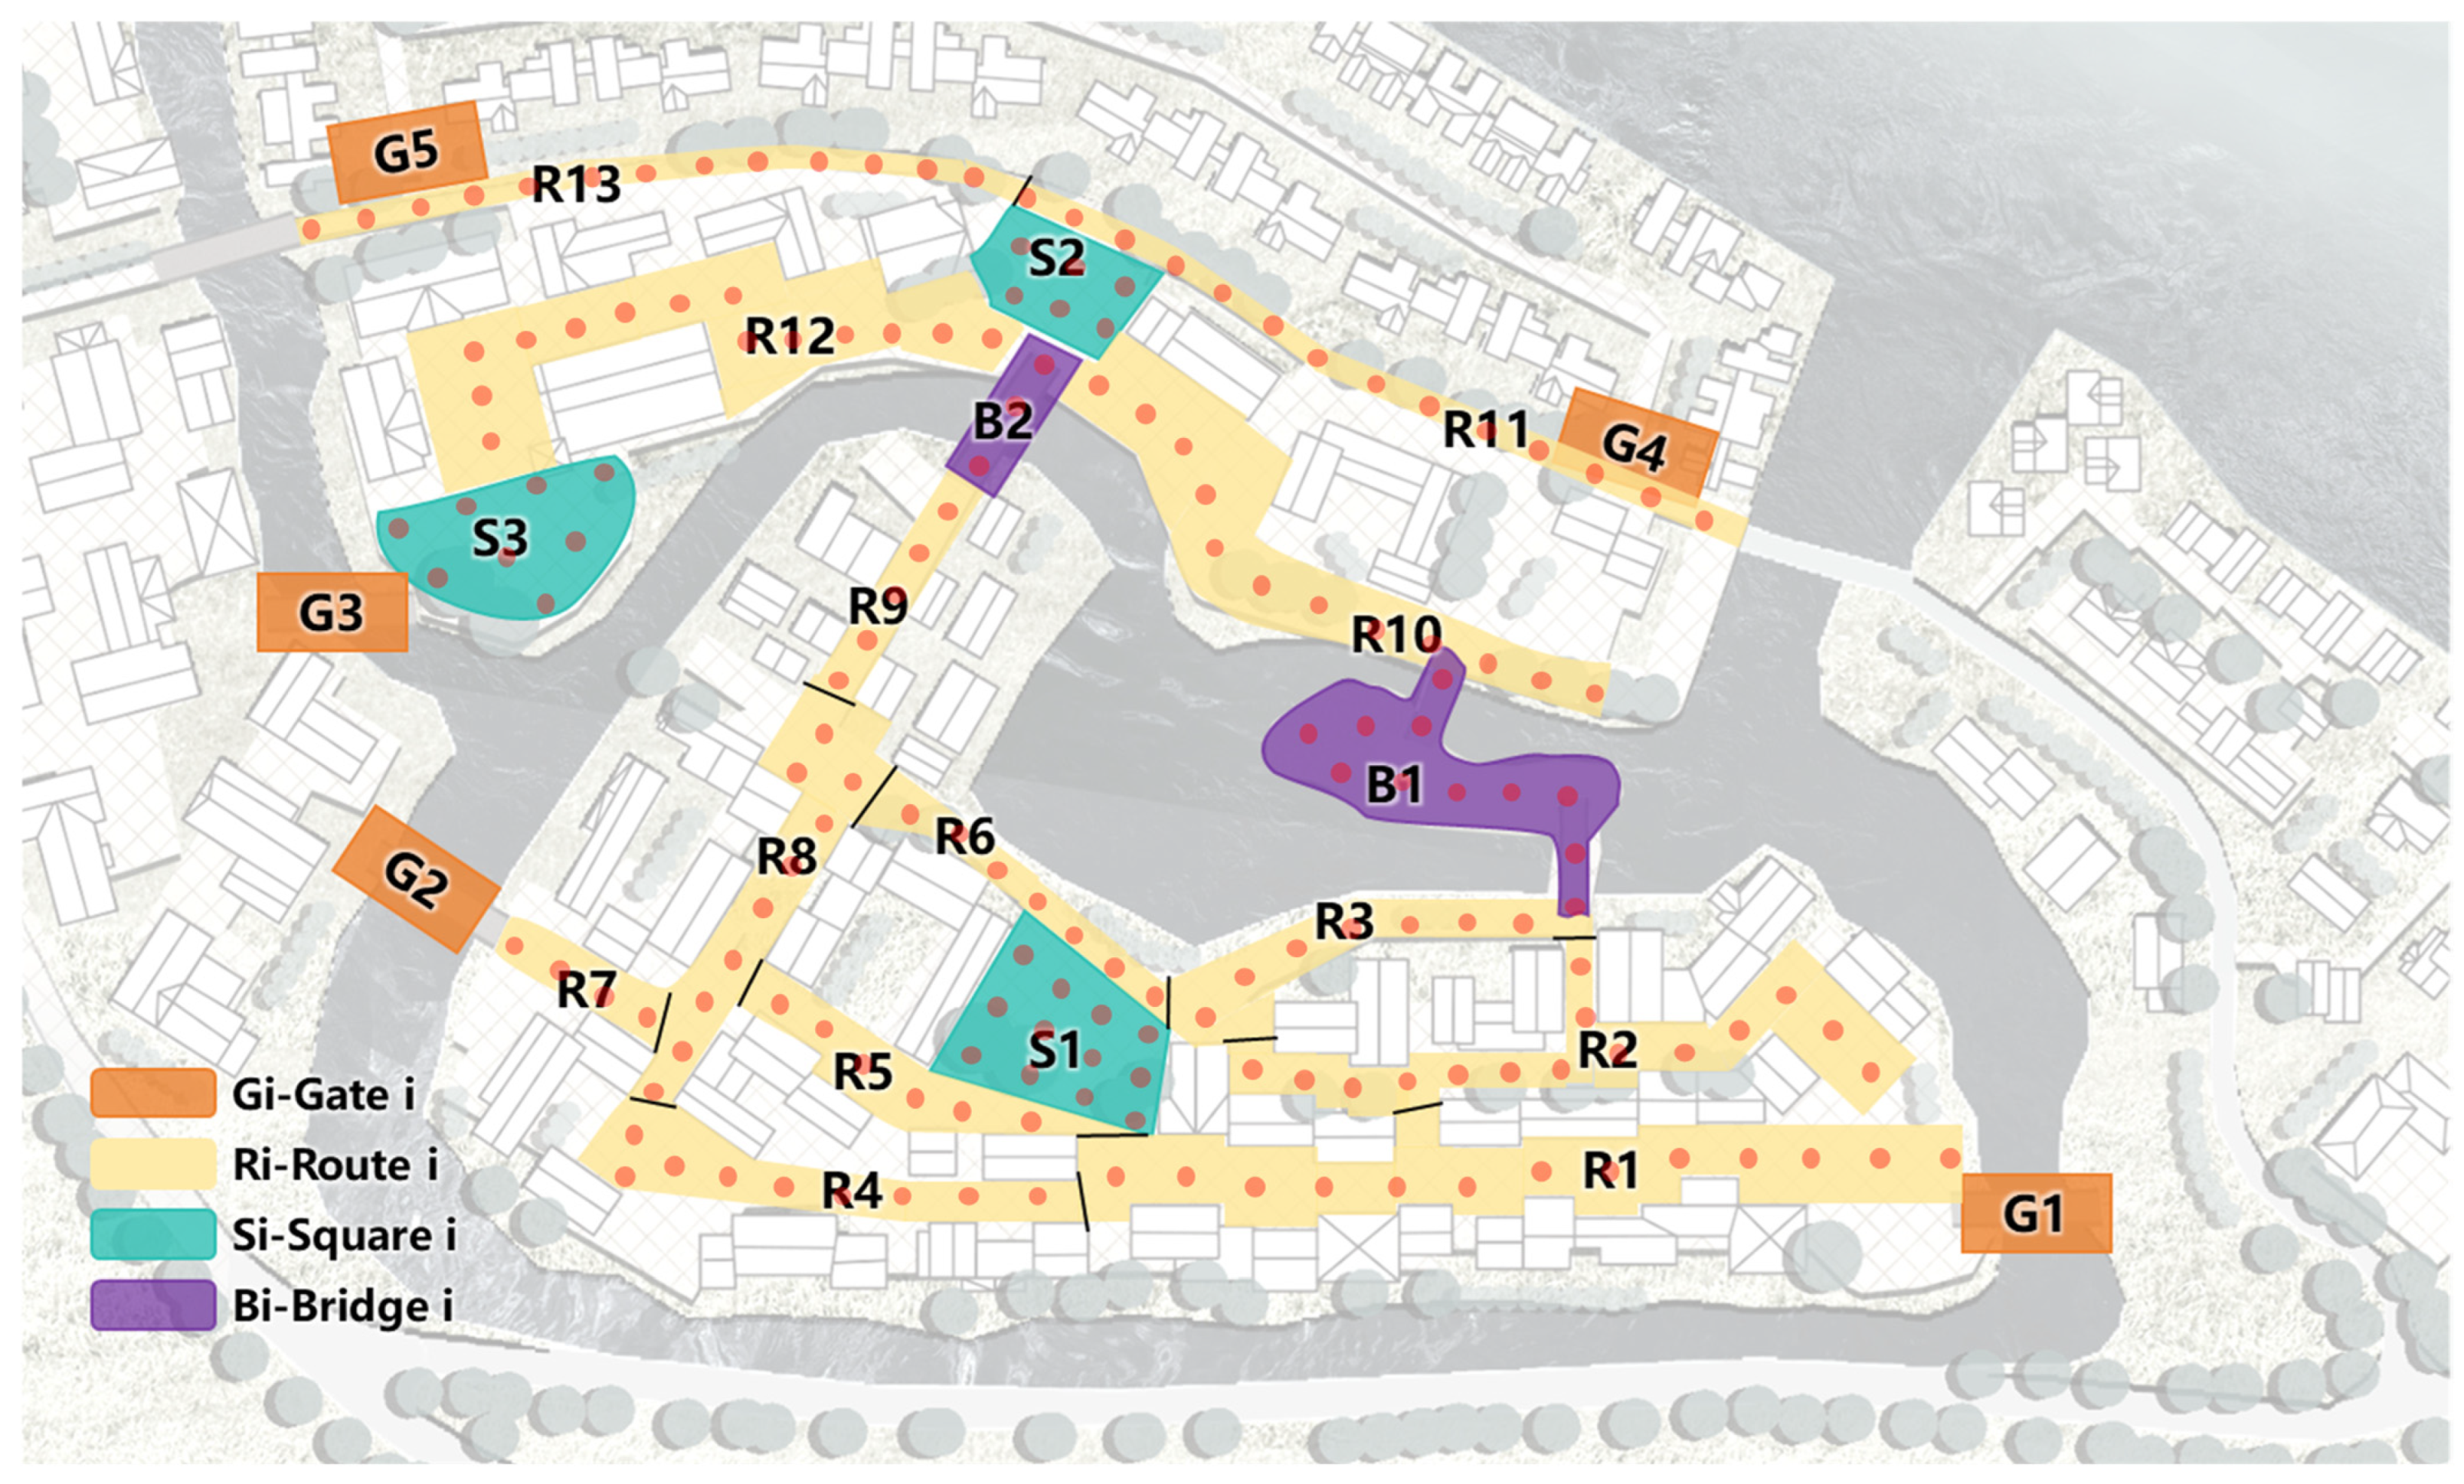
The instantaneous maximum carrying capacity of the district was set at 1000 people based on the design capacity of other 4A-level tourist attractions in Sichuan province, according to China’s national tourist attraction rating system. Figure 6 illustrates the schematic layout of entrances and exits (represented as Gates), streets (represented as Routes), connecting bridges (represented as Bridges), and outdoor plazas (represented as Squares) within this commercial pedestrian mall. As the design allows several entrances and exits to the study area serving different purposes, Table 3, Table 4 and Table 5 present the general details of tourist numbers. Table 3 provides the number of tourists entering the district through major entrances during business hours. Table 4 and Table 5 present the proportional distribution of final destination visits, with these initial values set according to the preliminary design.
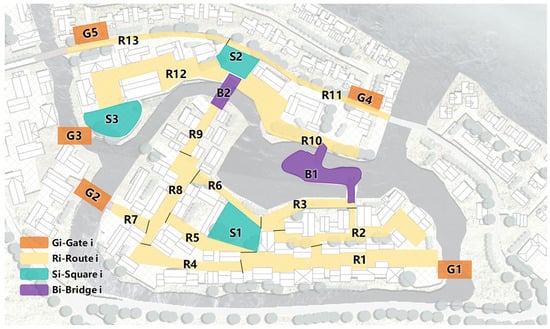
Figure 6.
Schematic diagram of entrances and exits, roads, connecting bridges, and outdoor plazas within the research area.
Table 3.
Percentage distribution of tourists entering through each entrance.
Table 4.
Percentage distribution of tourists (coming from main entrance) entering each destination.
Table 5.
Percentage distribution of tourists (coming from home-stay and hotel area) entering each destination.
As the target group of the research area consists of general tourists covering a large age range, and given that MassMotion assumes a normal distribution for pedestrian walking speeds based on different individual categories, the maximum speed was set at 2.05 m/s, the minimum at 0.65 m/s, with a mean of 1.35 m/s and a standard deviation of 0.25 m/s. In the simulation, tourists were randomly assigned to enter different buildings within the district and subsequently exit the simulation area according to the predefined proportions of their final destinations.
2.6. Selection Principles of Spots for Improvement
This study proposed a thermal demand-responsive method to identify key spots for outdoor thermal environment improvement based on thermal conditions and pedestrian flow. The workflow of this design method is illustrated in Figure 7. First, the outdoor space targeted for thermal environment adjustment was divided into multiple grid regions, where the horizontal coordinate was denoted as i and the vertical coordinate as j. Then, the PHOENICS 2016 was used to calculate the thermal discomfort level () of each grid. The thermal discomfort level was assigned based on the UTCI heat stress index according to Bröde et al. [33]. A correlation was established between the heat stress level and the thermal discomfort coefficient () (as shown in Table 6). As this study concerns thermal discomfort only in summer, only the warm-biased conditions are shown in Table 6, but similar methods can also be adopted to cool-biased conditions. To unify the effect of thermal conditions, HI was assigned values from 0 to 1. Subsequently, pedestrian flow density distribution calculated by MassMotion was assigned to each grid (), with values ranging from a minimum of 0 to a maximum of 1 (Equation (1)). Next, the pedestrian flow density of each grid, , was used as a weighting factor to quantify the demand of thermal comfort in each grid (). This was multiplied by the corresponding grid’s thermal discomfort coefficient to derive the thermal comfort improvement demand (Equation (2)). A higher numerical value indicated a greater priority for thermal environment enhancement in that grid, meaning optimization measures should be prioritized accordingly. Finally, by summing up the thermal comfort improvement demand across all grid regions (), the overall demand level for thermal comfort enhancement in the given outdoor space () was determined (Equation (3)).
: Number of pedestrians in each grid;
: Total number of pedestrians used in the simulation;
: The pedestrian flow density calculated by MassMotion;
: Thermal discomfort coefficient in each grid;
: Demand of thermal comfort in each grid;
: Total demand of thermal comfort in the given outdoor space.
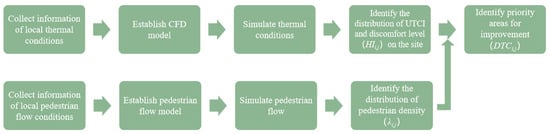
Figure 7.
Selection principles of spots for improvement.
Figure 7.
Selection principles of spots for improvement.
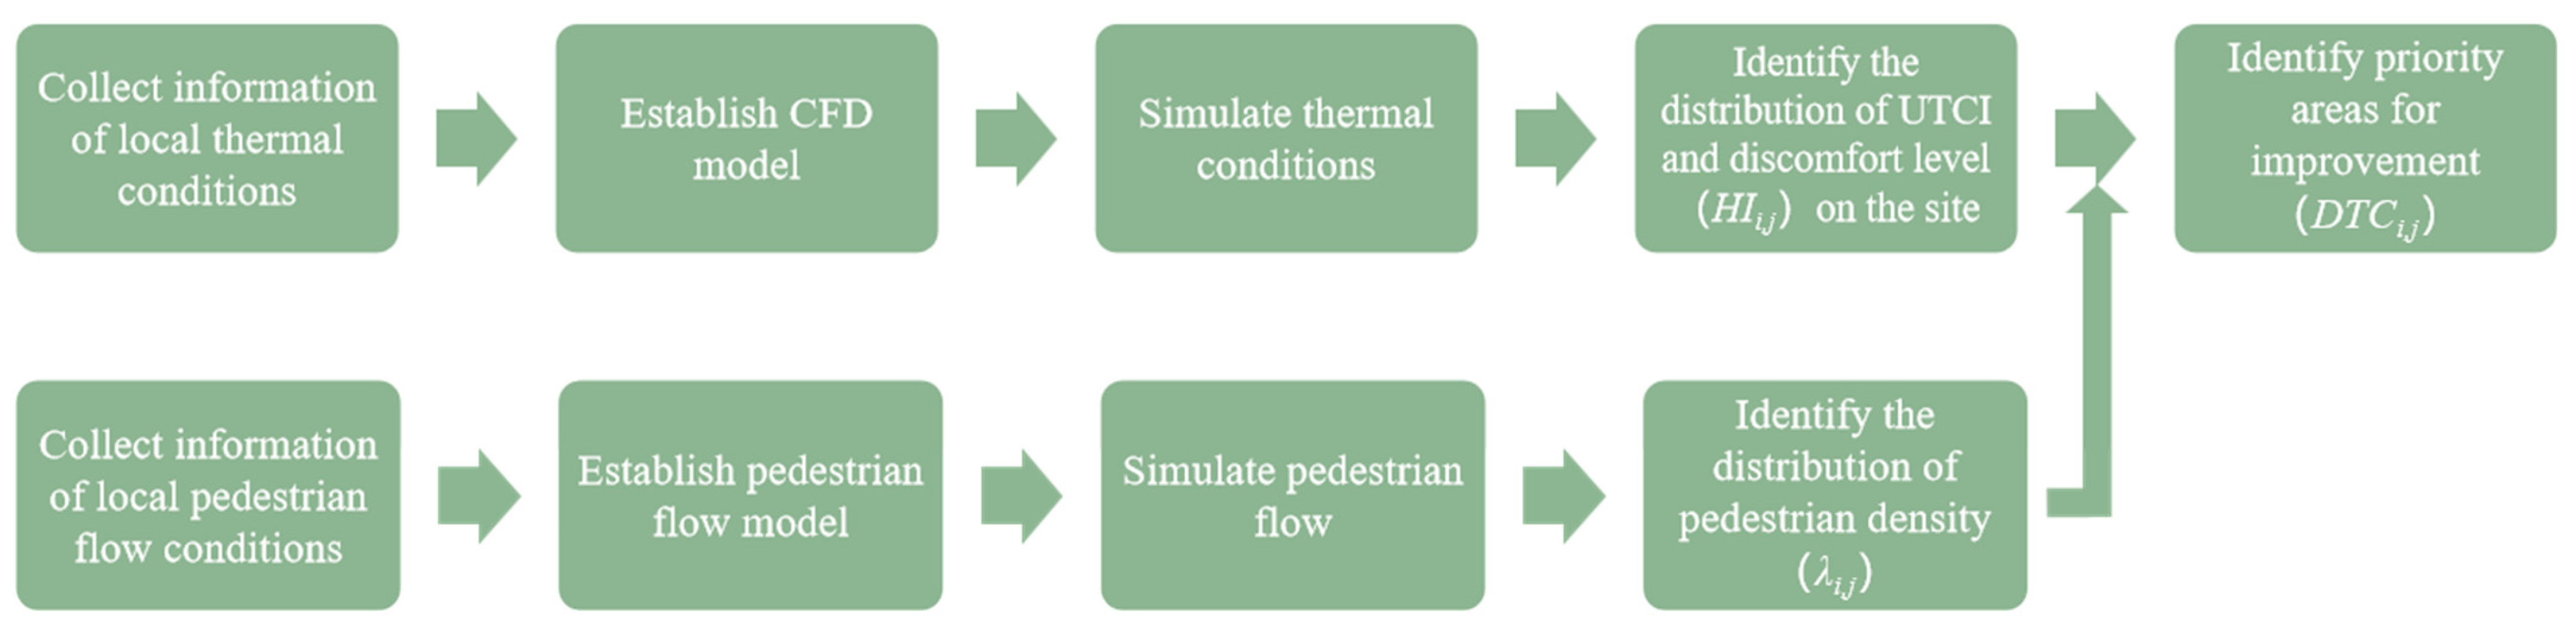
Table 6.
The correlation between the UTCI and the thermal discomfort coefficient.
Table 6.
The correlation between the UTCI and the thermal discomfort coefficient.
| UCTI Equivalent Temperature (°C) | Heat Stress Level [33] | Thermal Discomfort Coefficient (HI) |
|---|---|---|
| 38~46 | Very strong heat stress | 1.0 |
| 35~38 | Strong heat stress | 0.8 |
| 32~35 | 0.6 | |
| 29~32 | Moderate heat stress | 0.4 |
| 26~29 | 0.2 | |
| 0~26 | No thermal stress | 0.0 |
3. Results and Discussion
3.1. Meteorological Parameters Comparison
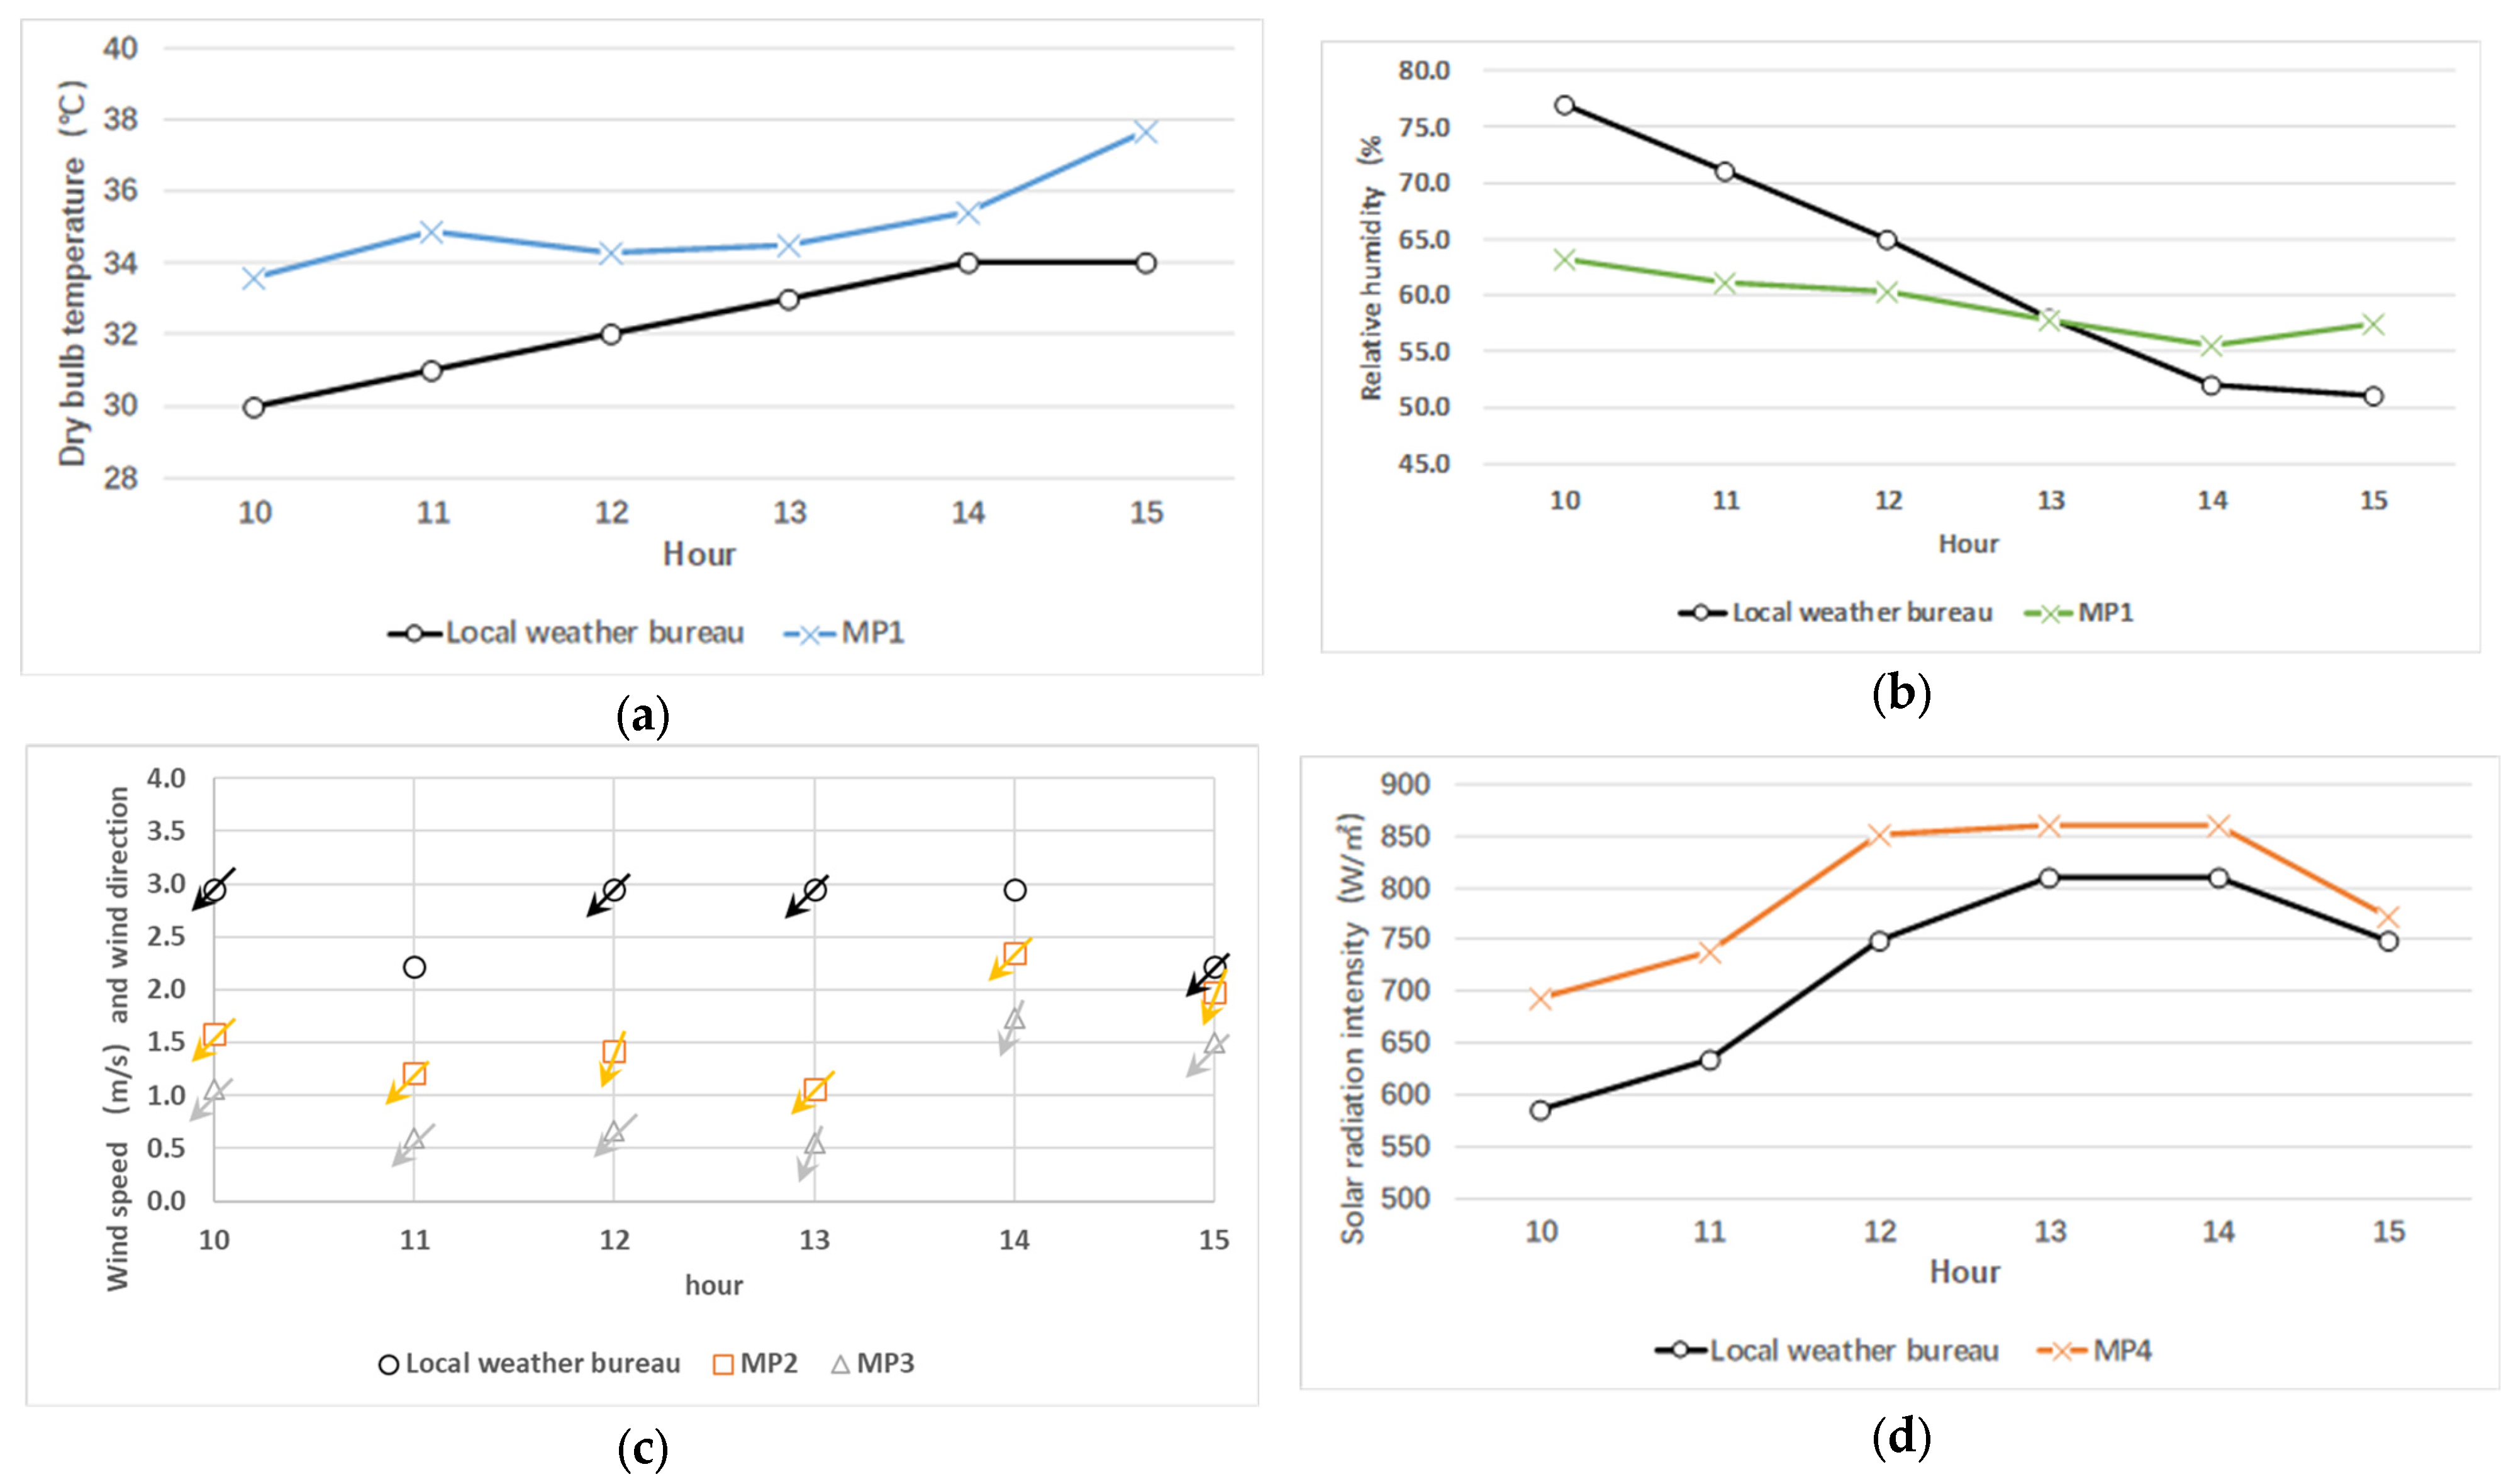
A comparison of field-measured meteorological parameters with data from the local weather bureau is analyzed to provide a general understanding of the local weather characteristics of this experimental site (Figure 8). The parameters analyzed include dry-bulb air temperature, relative humidity, pedestrian-level wind speed and direction, and solar radiation. Since the measurements were conducted between 10:00 and 15:00 on a typical summer day in July, they are representative of local summer weather conditions. Figure 8 illustrates that while the field measurement data and the local weather bureau data exhibit similar trends over the measurement period, slight differences are observed in the absolute values.
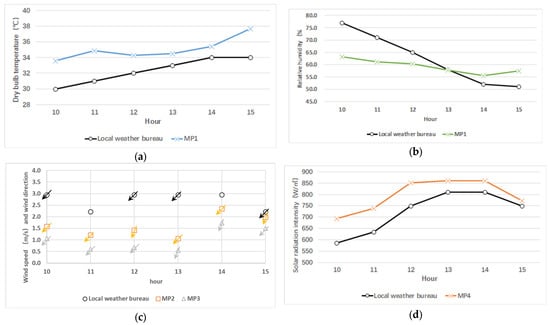
Figure 8.
Field measurement results and comparison with local weather bureau data. (a) Comparison of dry-bulb air temperature. (b) Comparison of relative humidity. (c) Comparison of pedestrian-level wind speed and direction. (d) Comparison of solar radiation data.
Figure 8a shows that the dry-bulb air temperature recorded at the local weather bureau increased from 30 °C at 10:00 to 34 °C at 15:00. Despite being located in an open area near a river, the field measurement site recorded air temperatures 2 to 3 °C higher than those from the local weather bureau. This suggests that under low wind speed conditions, the river had no significant cooling effect on the site’s air temperature. This can be attributed to the relatively low wind speed observed at the site. Although the local weather bureau recorded wind speeds exceeding 3.0 m/s at 1.5 m height during the measurement period, the pedestrian-level wind speed at the site ranged from approximately 0.5 to 2.3 m/s (Figure 8c). As the wind predominantly blew from the northeast, measurements from MP2 (riverside) showed relatively higher wind speeds compared with MP3 (near the mountain), where the wind was partially obstructed by the terrain.
The measured relative humidity ranged from 55% to 63% and exhibited a decreasing trend as the dry-bulb air temperature rose during the measurement period (Figure 8b). The results also indicate that the relative humidity at the site was lower than the corresponding data from the local weather bureau. This may be attributed to the relatively higher solar radiation intensity recorded at the site. The measured solar radiation intensity was 694 W/m2 at 10:00 and increased to 850 W/m2 in the afternoon. The difference between the two datasets was most pronounced in the morning, exceeding 100 W/m2, whereas in the afternoon, the gap narrowed to approximately 50 W/m2 between 13:00 and 14:00 and further reduced to 20 W/m2 by 15:00.
Overall, the microclimatic trends at the site are generally consistent with those recorded at the nearby meteorological station, although some variations are evident due to the influence of local topography and landform features. Given that the field measurement was conducted during a day of extreme high-temperature weather, which does not represent typical summer conditions at the experimental site, the typical local weather data of dry-bulb air temperature from JGJ/T 449-2018 provides more representative data for typical summer settings. This simulation adopts dry-bulb air temperature data from the standard. Other parameters, including pedestrian-level wind speed, wind direction, and total solar radiation intensity, were derived directly from field measurement data taken at 10:00 to ensure the simulation accurately reflected the microclimatic conditions of the site during business hours.
3.2. Thermal Environment Simulation Results from CFD
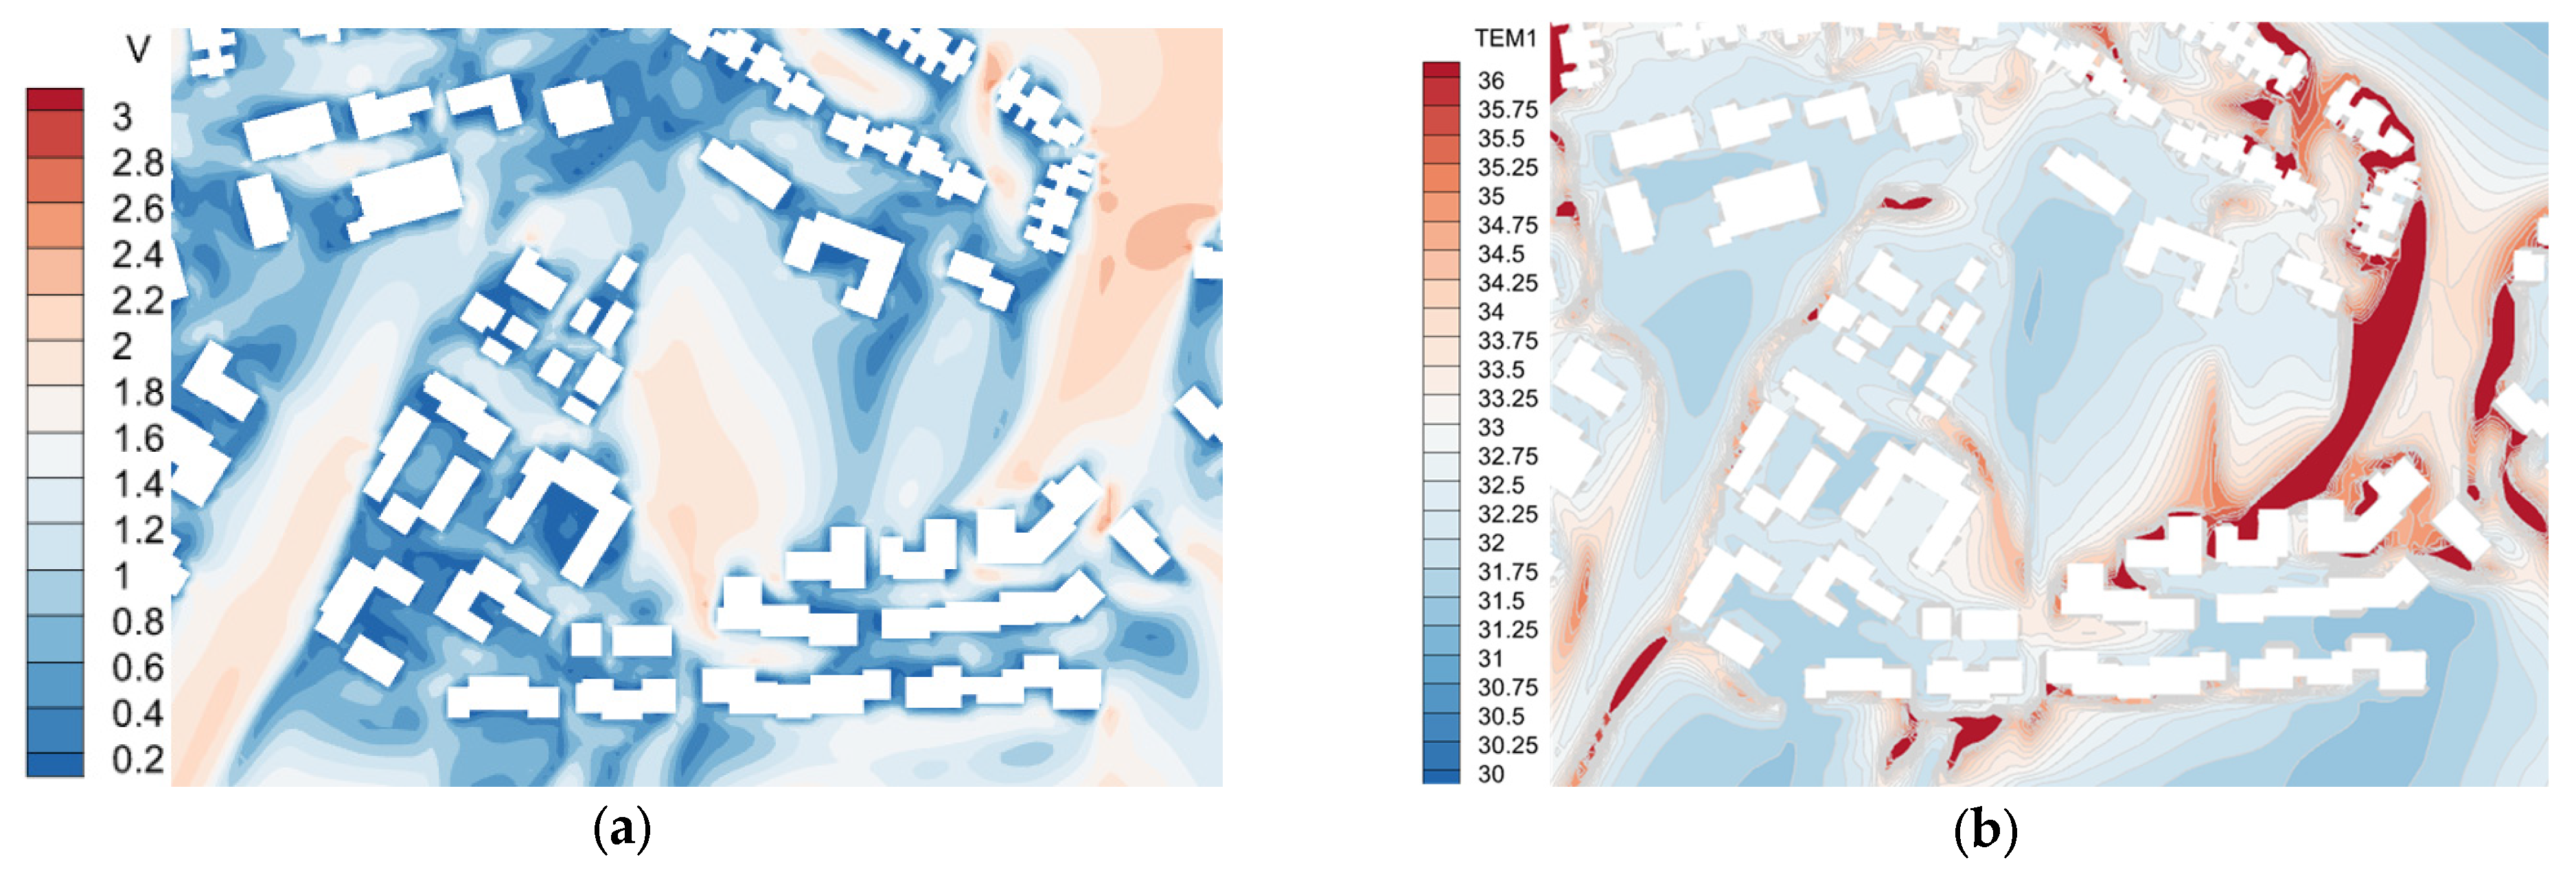
As this study aims to provide recommendations for improving outdoor thermal comfort through landscape design and active cooling strategies, the simulation was conducted during the early design stage, considering only the main building blocks, pavements, and water bodies. The simulated dry-bulb air temperature and wind speed distributions at the pedestrian level are shown in Figure 9. The site already experiences weak wind conditions, which are further reduced by newly constructed buildings (Figure 9a). Within the study area, given the prevailing northwest wind and the northwest–southeast orientation of the hotel buildings, these structures act as wind barriers. Many buildings feature enclosed or semi-enclosed layouts, with some oriented perpendicular to the prevailing wind, obstructing natural ventilation and creating multiple leeward zones. As a result, wind speeds in most outdoor spaces remain below 1.1 m/s, classified as “calm” or “light air” according to the Beaufort scale [34]. The planned building layout further diminishes wind flow to a level where it is barely perceptible to pedestrians.
Figure 9.
The simulated results in pedestrian level from CFD. (a) Wind speed distribution. (b) Dry-bulb air temperature distribution.
Figure 9b illustrates the simulated air temperature distribution at the pedestrian level, ranging from 31.5 °C to 36.0 °C within the study area. Weak wind conditions and minimal building shading are the primary contributors to elevated temperatures. With buildings limited to two or three stories, shading effects are insufficient at 10:00. Consequently, despite the presence of extensive water bodies, large areas still experience temperatures exceeding 33.0 °C. This indicates that under low wind speed conditions, the evaporative cooling effect of the water bodies is not effectively diffused, restricting cooling to areas immediately adjacent to the water. According to the Chinese standard JGJ 286, Design Standard for Thermal Environment of Urban Residential Areas [35]—the only existing guideline in China addressing outdoor thermal conditions—the upper design limit for outdoor air temperature is 33.0 °C. Thus, most outdoor spaces in the study area require thermal environment improvements to enhance comfort during summer.
In this study, the well-established Universal Thermal Climate Index (UTCI) is used to assess outdoor thermal comfort for pedestrians in the study area. The UTCI accounts for the human body’s thermoregulatory processes under various ambient thermal conditions using an advanced thermo-physiological model [36]. The UTCI value is calculated based on air temperature (Ta), wind speed, relative humidity (RH), and mean radiant temperature (Tmrt) at the pedestrian level. Figure 10a presents the UTCI distribution, ranging from 28.0 °C to 48.25 °C. The results indicate that open areas without building clusters generally exhibit lower air temperatures compared with built-up areas, with a temperature difference of approximately 5 °C. The largest differences occur on building facades directly exposed to solar radiation. The highest UTCI value is observed around the coordinates (200, 75), where both direct sunlight exposure and extremely low wind speeds (below 1.0 m/s) contribute to intensified thermal stress. Additionally, southwest-facing building facades tend to have higher UTCI values compared with other orientations. Enclosed building clusters, such as O-shaped and U-shaped configurations (e.g., around coordinates (50, 75) to (125, 100)), also exhibit relatively higher UTCI values, with differences of approximately 5 °C compared with more open areas.
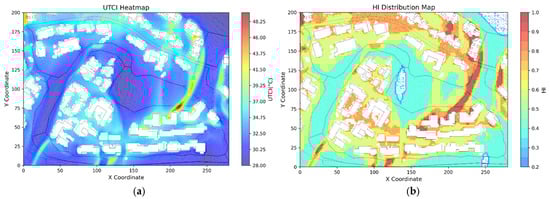
Figure 10.
The simulated results of thermal comfort index. (a) The UTCI distribution of the case site. (b) Distribution of HI.
Based on the relationship between UTCI ranges and Heat Index (HI) levels, the corresponding HI distribution is presented in Figure 10b. HI is a normalized index ranging from 0 to 1, developed to identify areas with relatively severe thermal conditions within the study site. Its spatial variation closely follows that of UTCI.
3.3. Analysis of Pedestrian Flow Simulation
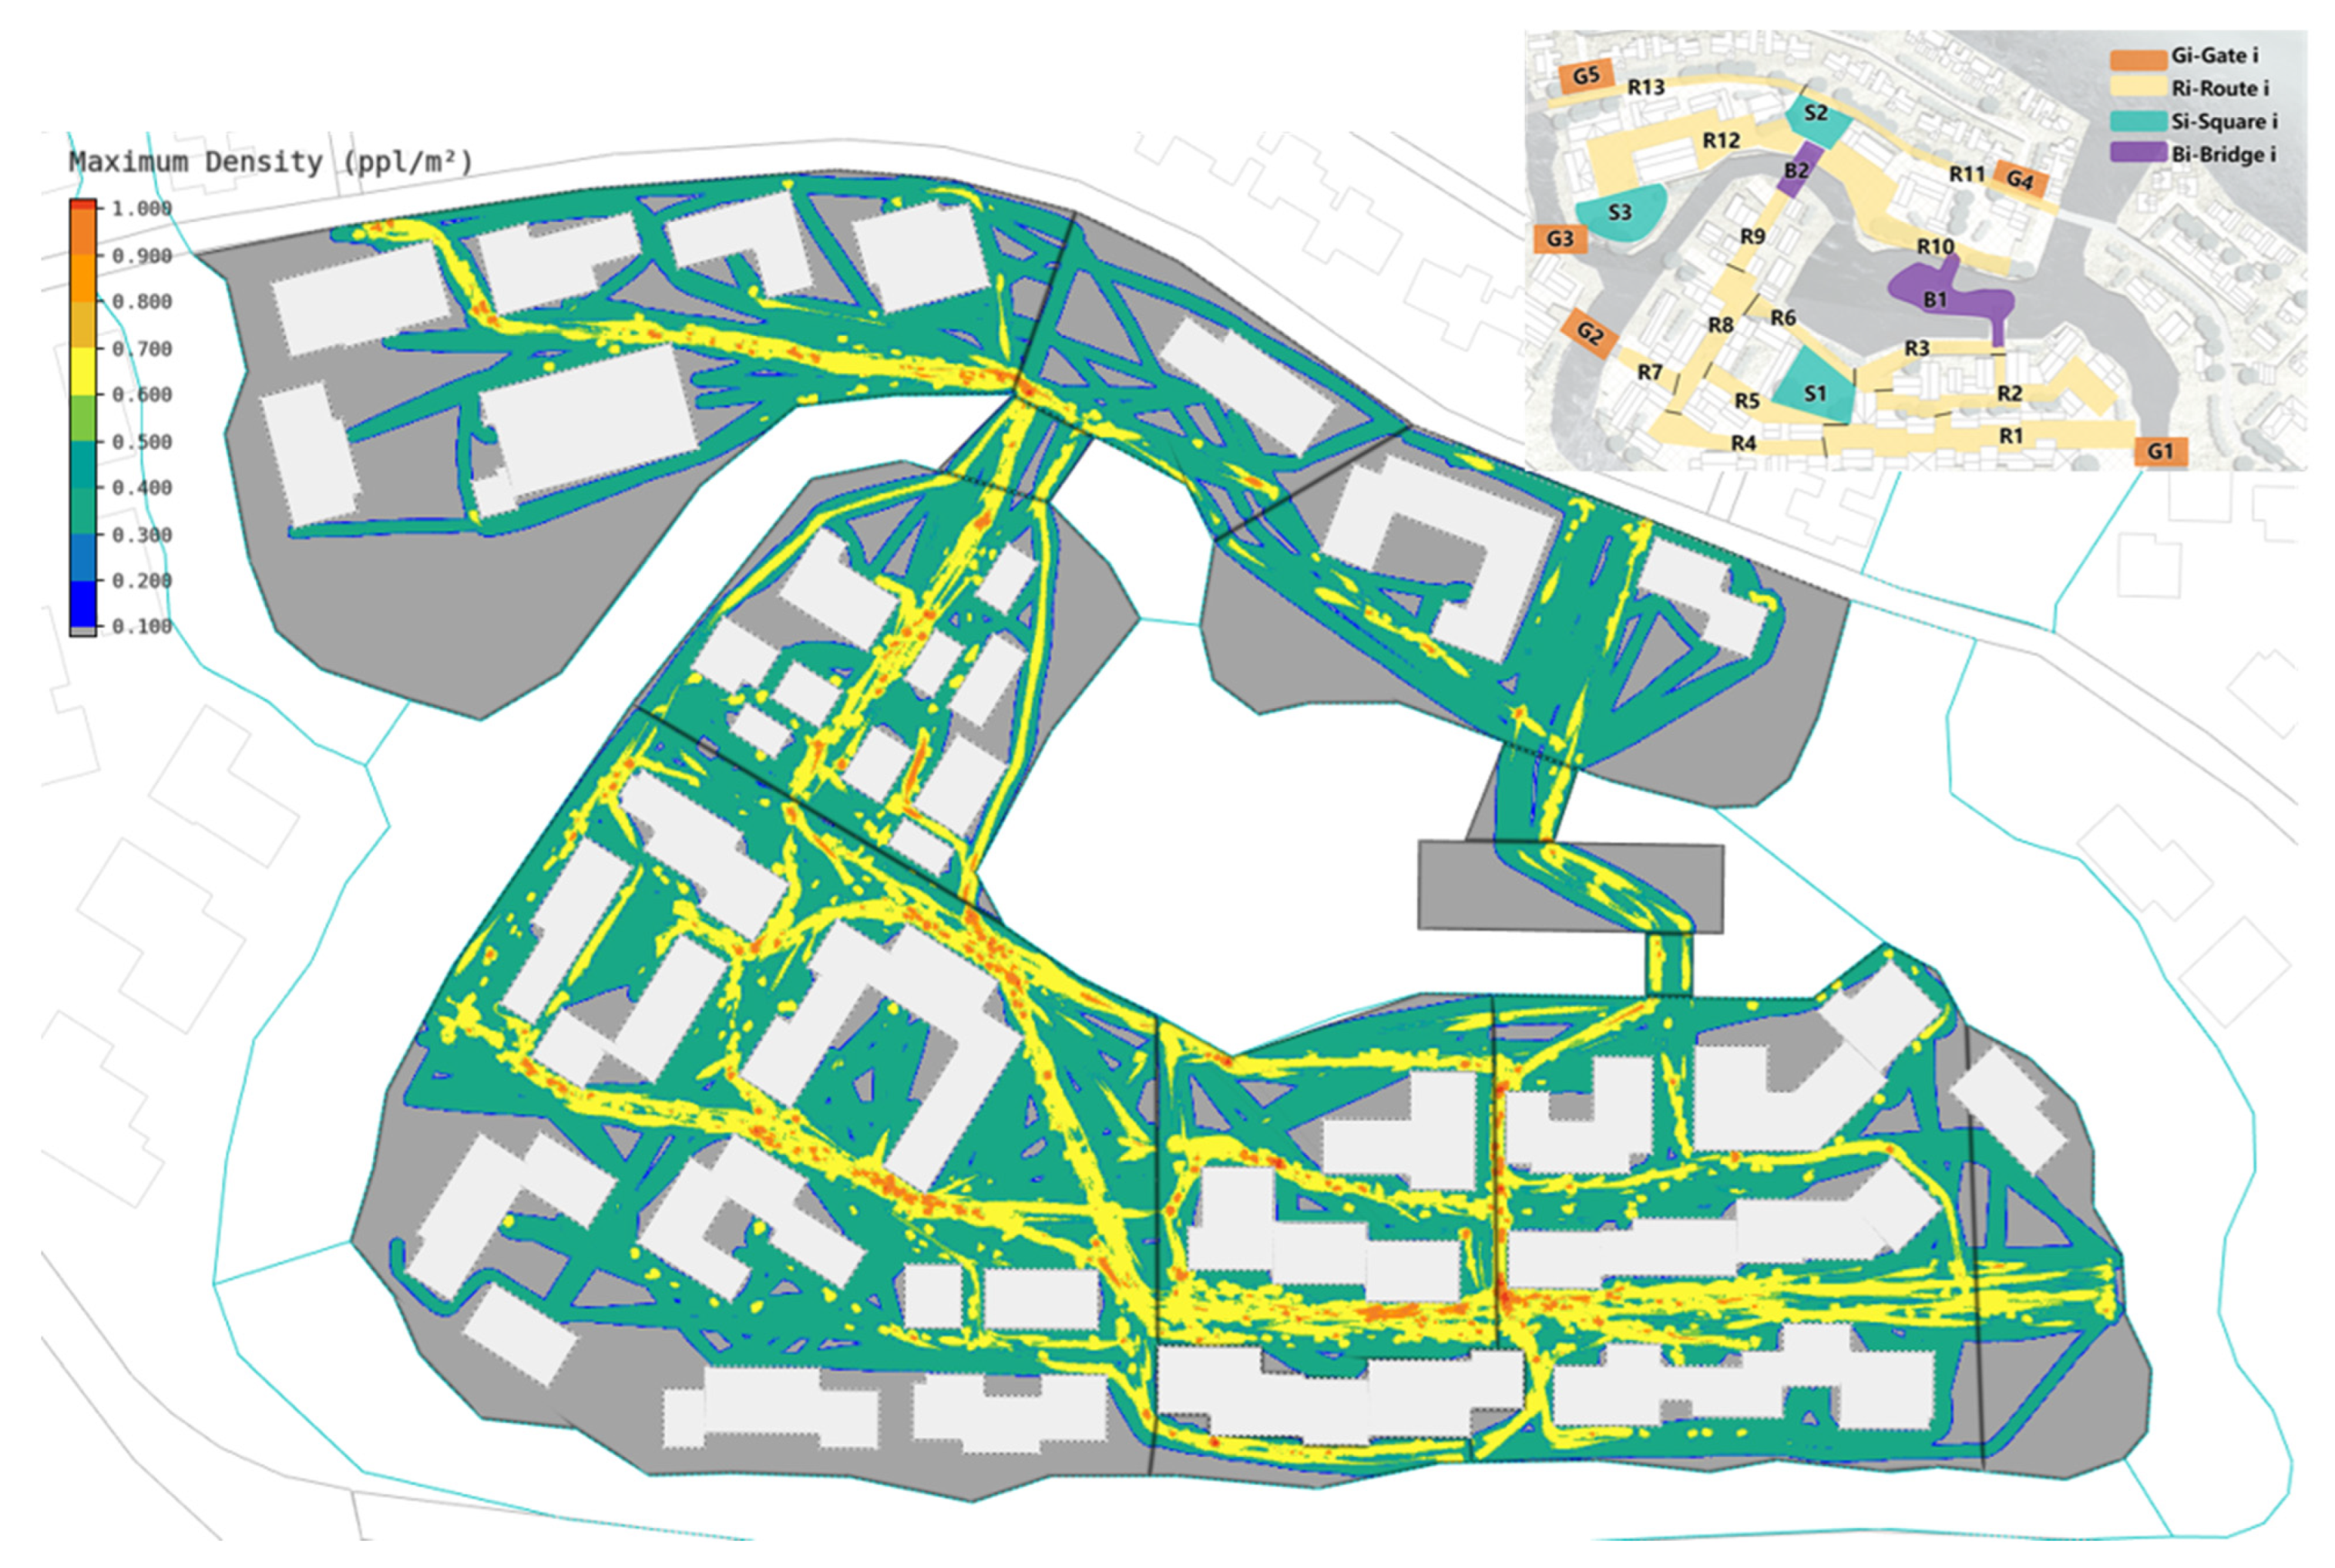
The pedestrian flow density at various outdoor locations within the study area was obtained using MassMotion. Figure 11 presents the maximum pedestrian density distribution within the research area, with different colors representing varying density levels, measured in persons/m2. Redder areas indicate higher pedestrian density, while bluer areas correspond to lower density. The results reveal significant differences in pedestrian flow across different streets.
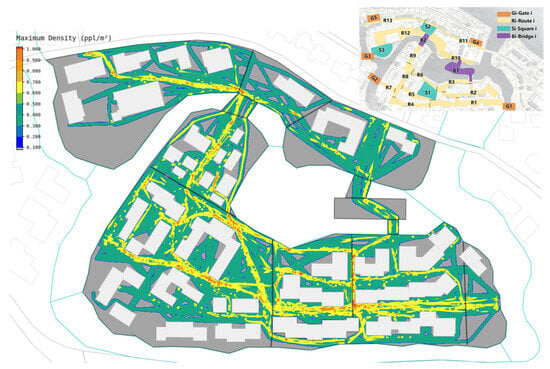
Figure 11.
The pedestrian distribution density within the study area.
Among the parallel streets R1, R2, and R3, which are close to the main entrance (G1), notable variations in pedestrian volume are observed. R1 experiences the highest pedestrian flow due to its proximity to the main entrance (G1) and the entrance to the home-stay and commercial area (G2) as well as the larger number of street-facing shops, which attract more tourists. In contrast, R2 and R3 exhibit relatively lower pedestrian densities, mainly within the range of 0.16–0.32 persons/m2. However, the transitional area between R2 and bridge B1 shows a relatively higher pedestrian flow, with multiple locations reaching densities of 0.32–0.48 persons/m2. As the simulation does not include outdoor areas designated for rest, the pedestrian density in plazas (S1) primarily reflects passing foot traffic. The results indicate that the path from S1 and R6 to R9 has relatively low pedestrian density, whereas the path from R5 and R8 to R9 shows a higher density, particularly in areas where pedestrian density exceeds 0.8 persons/m2. R9, as the main route leading to B2, also exhibits high pedestrian flow. After crossing B2, pedestrians tend to congregate in the S2 plaza, where they pause before choosing a route to continue their tour. The simulation results further show that the left-side main road from S2 (R12) has a larger area with pedestrian densities exceeding 0.32 persons/m2 compared with the right-side main road (R10). Meanwhile, the secondary roads R11 and R13, which are parallel to R10 and R12, experience significantly lower pedestrian flow. As key connections between the two commercial areas, bridges B1 and B2 exhibit the highest pedestrian density per unit area. Overall, the outdoor roads with the highest pedestrian flow, in descending order, are R1, R5, R6, R9, R12, B1, and B2. The ranking of pedestrian density is as follows: B2 > B1 > R1 > R5 ≈ R6 > R9 > R12.
3.4. Analysis of Prioritizing Spots for Improvement
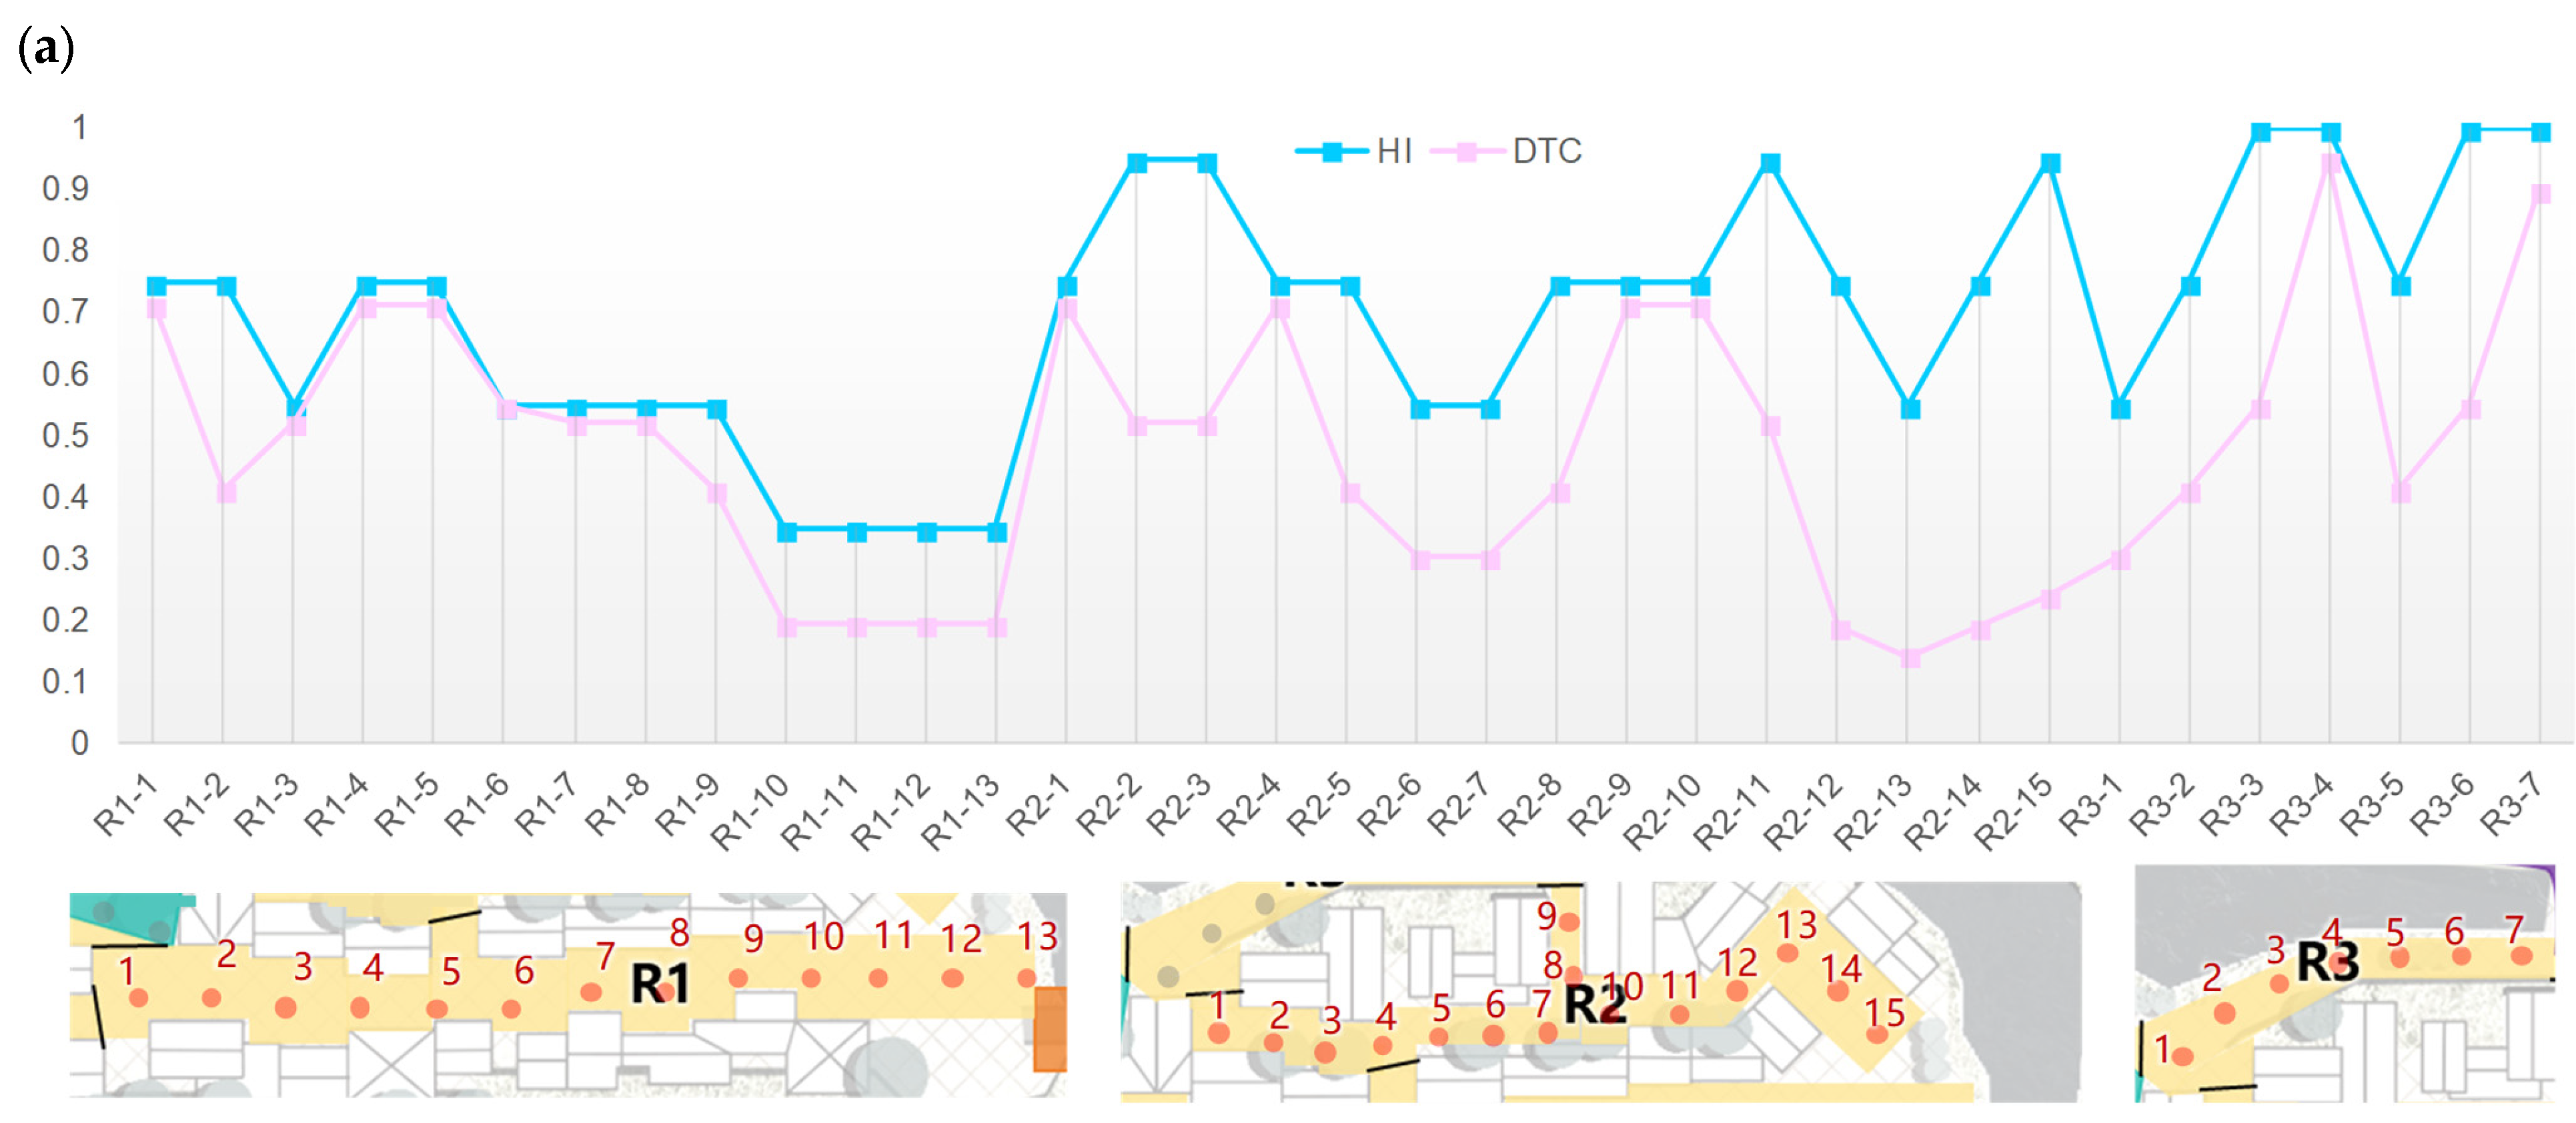
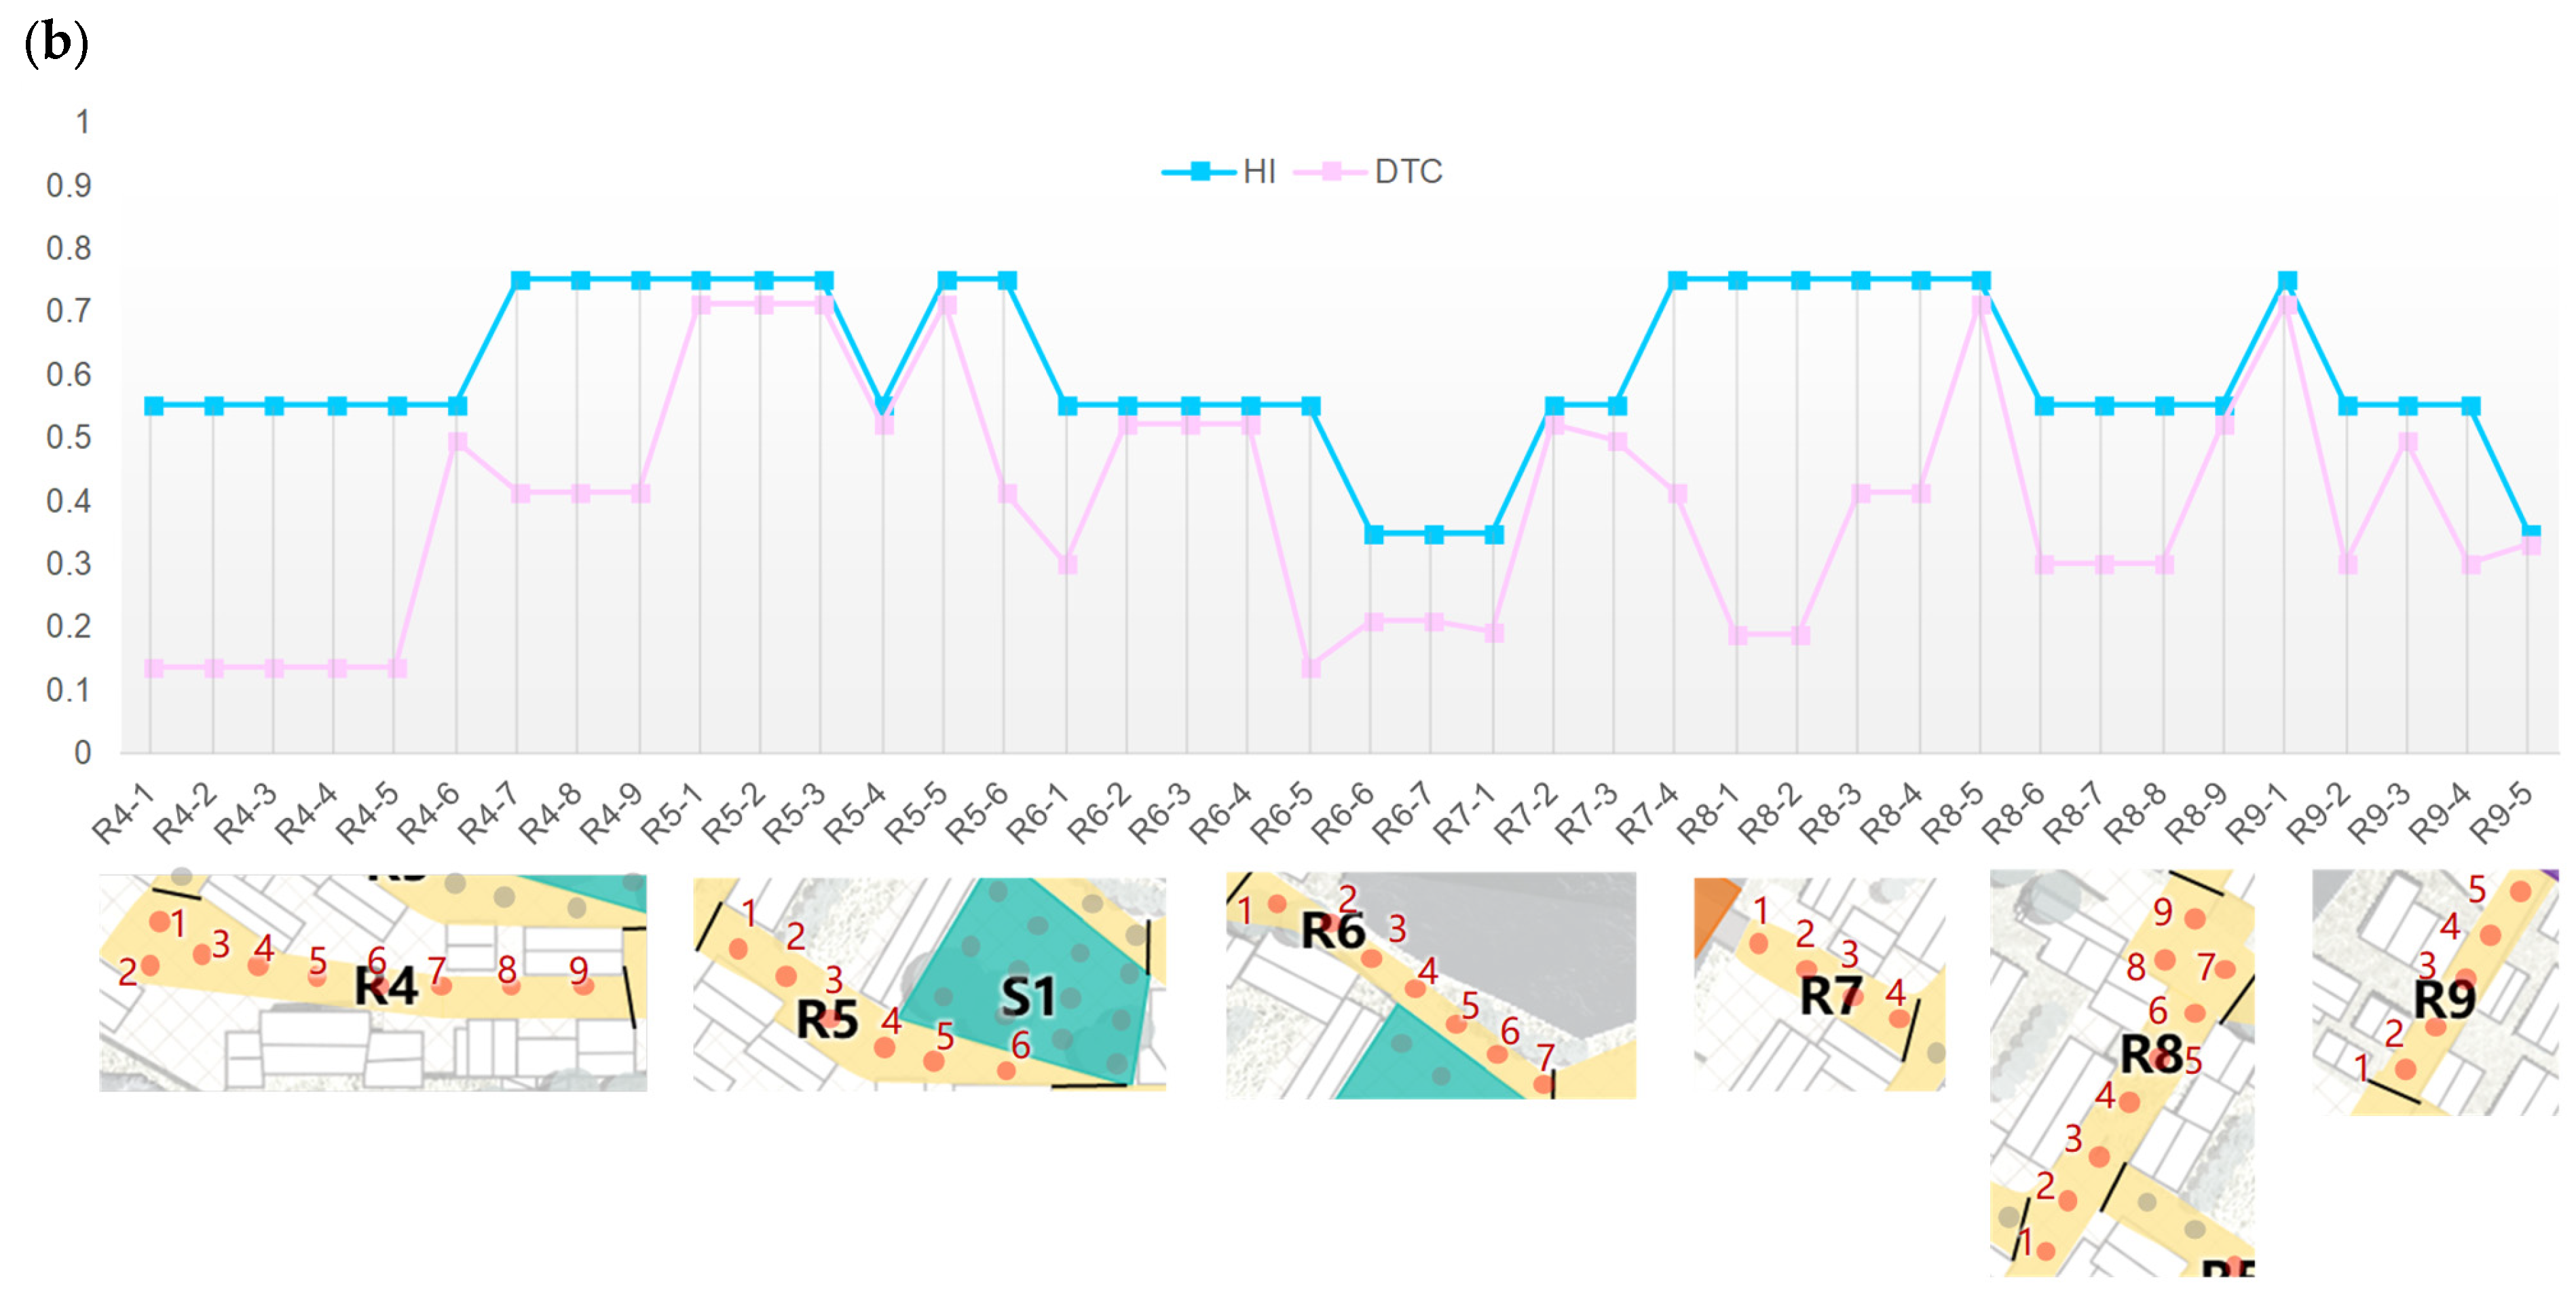
Measurement points were selected at a 10 m interval along the streets, with their spatial distribution shown in Figure 12. Figure 13, Figure 14, Figure 15 and Figure 16 illustrate the detailed measurement points and the corresponding HI and DTC data for the commercial, dining, plaza, and bridge connection areas, respectively.
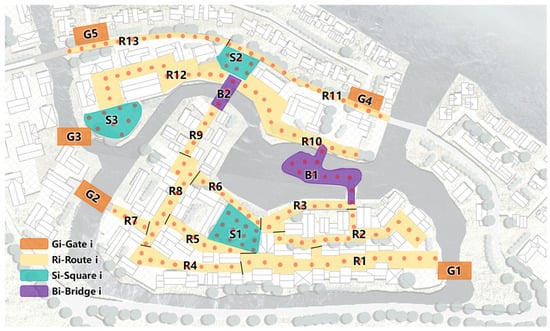
Figure 12.
Schematic diagram of measurement points in the study area.
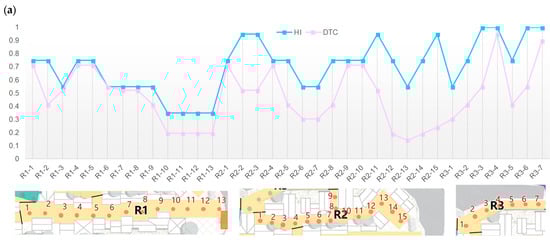
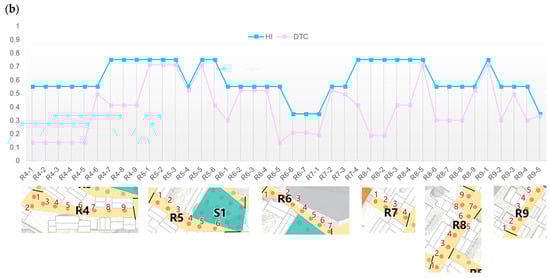
Figure 13.
HI and DTC at measurement points in the commercial area: (a) Routes R1 to R3; (b) Routes R4 to R9.
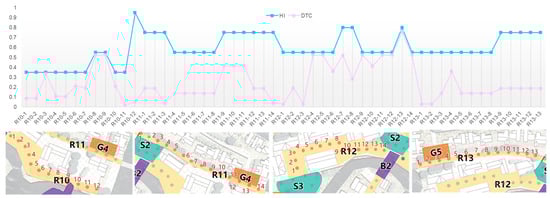
Figure 14.
HI and DTC at measurement points in the dining area.
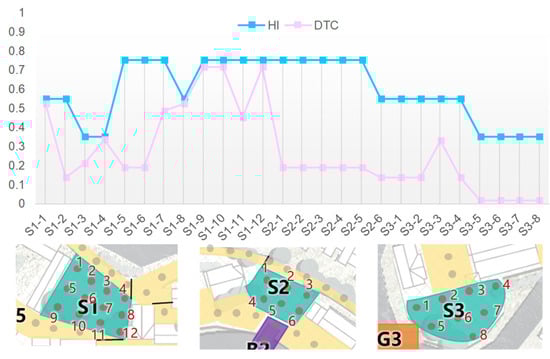
Figure 15.
HI and DTC at measurement points in the plaza area.
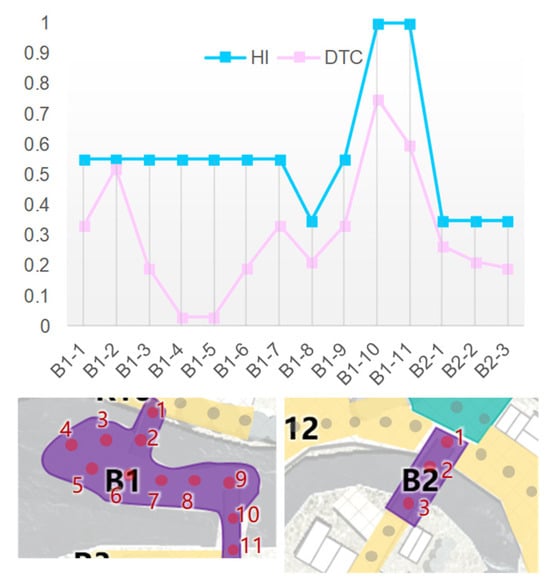
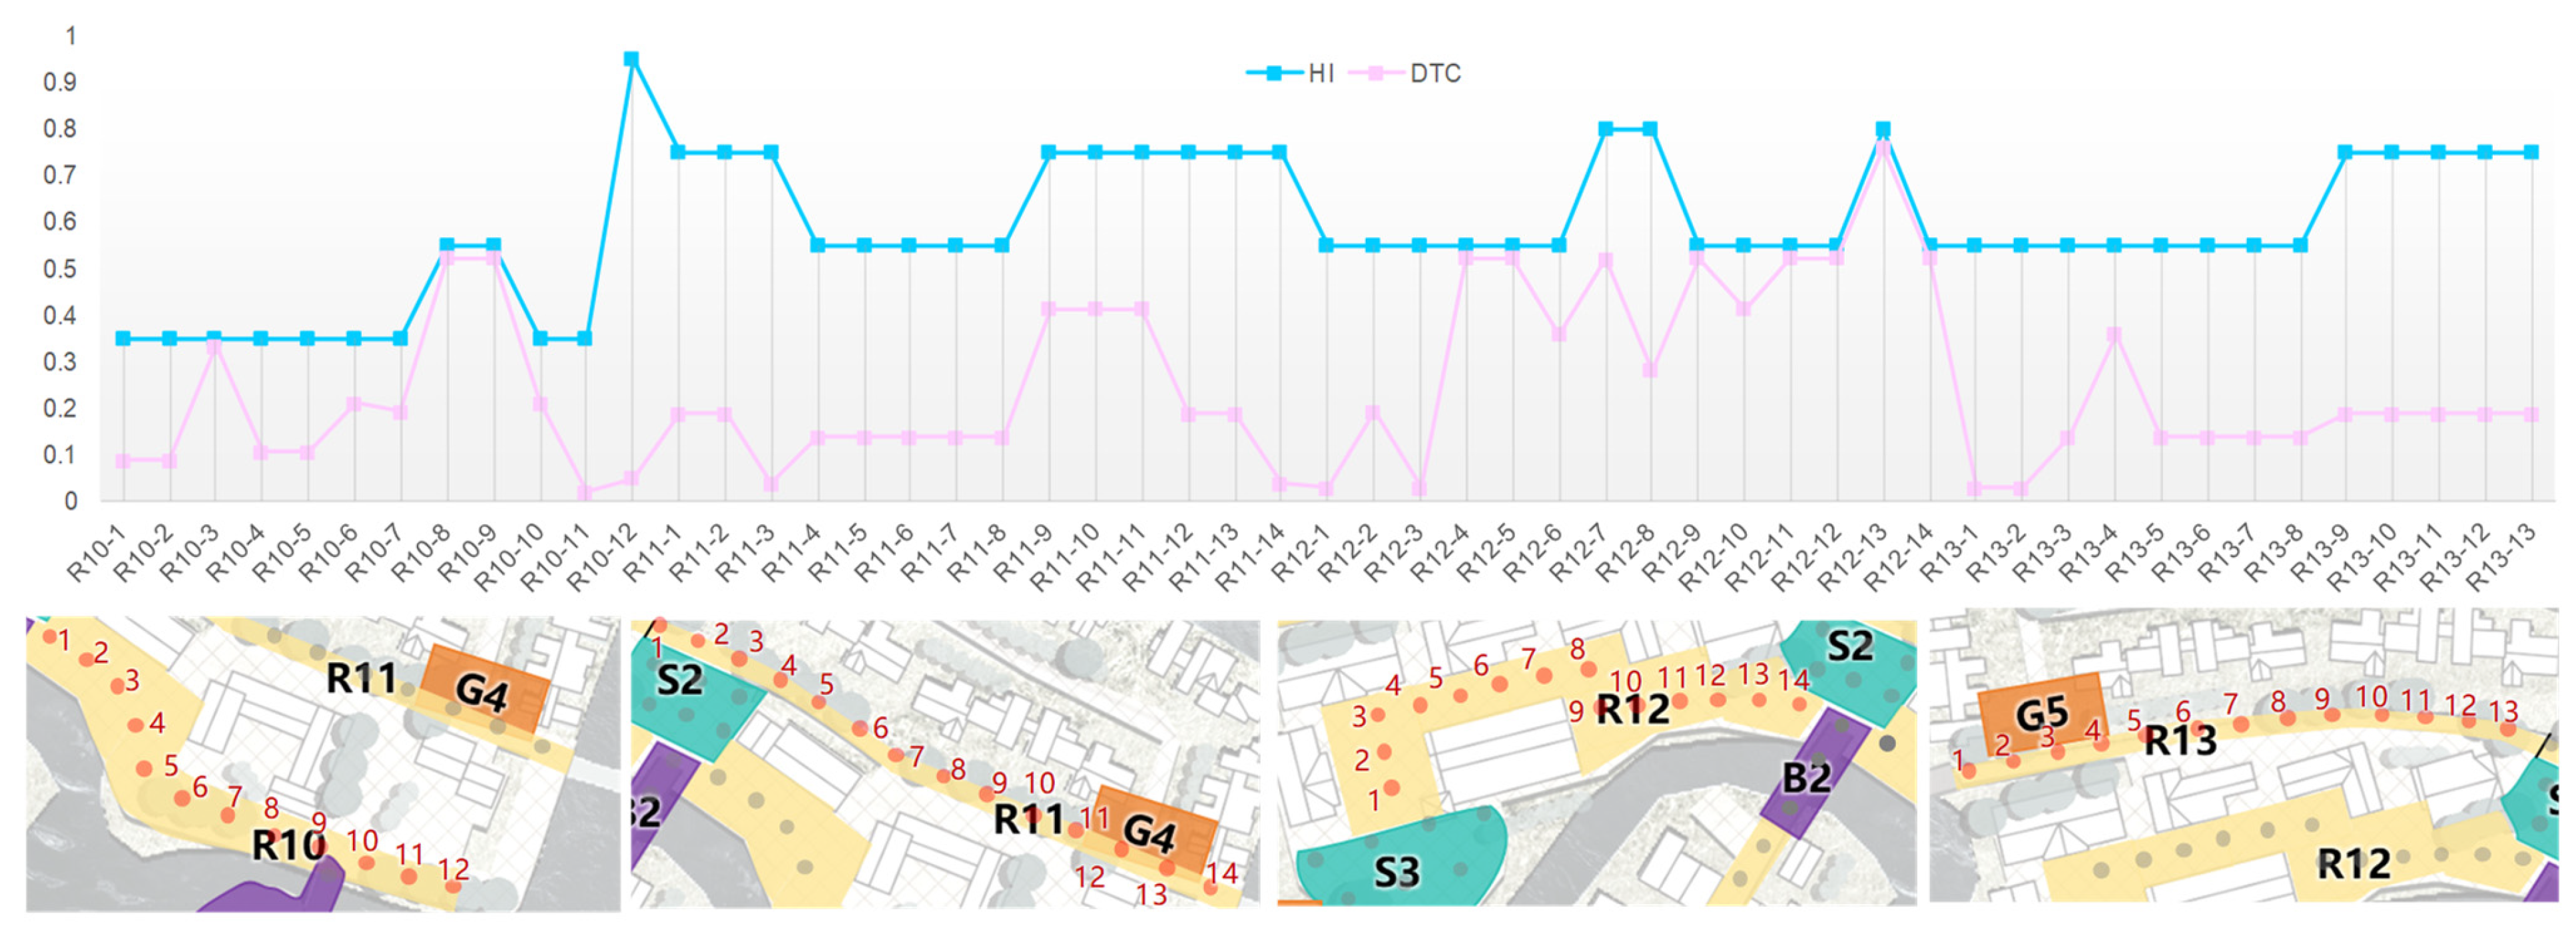
Figure 16.
HI and DTC at measurement points in the bridge connection area.
It is important to note that the highest HI value is assigned a maximum of 1 in the classification system used in this study to represent the relative thermal condition within the research area. Similarly, the pedestrian flow density (λ) is normalized to a maximum value of 1. Therefore, the calculated DTC in this study represents a relative value for the demand of thermal condition improvement of the concerned area, ranging from 0 to 1. In other words, the DTC value at a given point reflects the relative level of thermal comfort improvement demand compared with the maximum possible demand. Previous studies suggest that when the Universal Thermal Climate Index (UTCI) exceeds 32 °C, indicating the onset of strong heat stress, interventions such as shading, misting, or ventilation should be considered [37]. In our normalized HI scale, this corresponds approximately to HI > 0.4. If this threshold is applied uniformly across the study area, it would suggest that cooling resources should be activated along all pedestrian pathways within the experimental site (as shown in Figure 10).
However, when λ is also considered, a more nuanced understanding of thermal demand emerges. Similar to the fixed threshold for HI, where HI = 0.4 corresponds approximately to the onset of strong heat stress (UTCI > 32 °C), a preliminary threshold for DTC can be proposed. For instance, if HI = 0.4 and λ = 0.5, the resulting DTC would be 0.25. This value may serve as a reference point for triggering local cooling interventions. However, unlike HI, which is based on well-acknowledged publications [33], the threshold for pedestrian flow density (λ) may be adjusted depending on the needs and priorities of stakeholders. In this study, we use λ = 0.5 as an illustrative example to demonstrate how varying pedestrian densities influence DTC values.
For example, as shown in Figure 13a, in the commercial area, measurement point R2-2 has an HI value of 0.95, which is higher than point R2-4 (HI = 0.75). However, when considering the influence of pedestrian flow density (λ), the thermal demand DTC at R2-2 is 0.52, which is lower than that at R2-4 (DTC = 0.71). This phenomenon highlights the limitations of evaluating thermal demand solely based on HI. Although point R2-2 exhibits a higher HI value, indicating a relatively more uncomfortable thermal environment than R2-4, the lower pedestrian flow density at this location results in a lower demand for thermal comfort improvement. In contrast, point R2-4, despite having a lower HI value and a relatively more comfortable thermal environment, experiences higher pedestrian density, leading to a larger priority in thermal comfort enhancement. This example underscores the critical role of pedestrian flow density in assessing thermal comfort demand, demonstrating that thermal comfort needs are influenced not only by the thermal environment itself but also by pedestrian distribution.
Moreover, although the dining (Figure 14) and commercial (Figure 13) areas exhibit similar outdoor thermal conditions, differences in pedestrian density result in notable variations in thermal demand (DTC). The simulation was conducted for 10:00, which corresponds to peak activity in the commercial area but not in the dining area. As a result, the commercial area, characterized by higher pedestrian density during peak hours, shows a relatively high DTC, whereas the dining area, with lower pedestrian density, exhibits a lower DTC. As shown in Figure 14, only a few points—specifically R10-3, R10-8, R10-9, and points along R12—exceed the DTC threshold of 0.25 and therefore require activation of local cooling resources. Most monitoring points in the dining area at 10:00 do not meet this threshold, indicating that energy-intensive cooling interventions are not necessary in those locations during that time.
This distinction highlights the importance of dynamically managing active cooling strategies by allocating resources to areas with higher real-time thermal demand. As DTC varies both spatially and temporally, a responsive and adaptive approach is essential for optimizing outdoor thermal comfort.
Figure 15 and Figure 16 present the simulation results for the plaza and bridge connection areas. Although Square 1 (S1) exhibits lower overall HI values compared with S2, its significantly higher pedestrian density results in a much greater overall DTC. Within S1, substantial spatial variation in DTC is observed, ranging from 0.1 to 0.7. Measurement points S1-9 to S1-12 show notably higher DTC values, primarily due to their proximity to R5, which is closely connected to R1, thereby attracting higher pedestrian flow. In contrast, S3 demonstrates the lowest priority for cooling resource allocation among the three squares. Similarly, while Bridge 1 (B1 in Figure 16) spans a large area as a footbridge, pedestrian behavior must be considered, particularly with the consideration of brief pass-through movement only. For instance, points B1-4 and B1-5 show no need for cooling intervention, while B1-10 represents a higher priority for cooling resource deployment.
These findings suggest that incorporating pedestrian flow density into the evaluation process provides a more accurate method for improving thermal comfort and better informs the optimization of thermal comfort interventions. Ultimately, the overall thermal comfort demand levels (TDTC) for the commercial, dining, plaza, and bridge connection areas are 32.3, 12.9, 7.1, and 4.2, respectively.
4. Limitations and Future Work
The DTC index proposed in this study is based on typical daily operational conditions of the case study park and demonstrates clear guidance value at the planning and design stage (e.g., a TDTC of 32.3 in the commercial area indicates a need for prioritized cooling interventions). Importantly, because both the Heat Index (HI) and pedestrian density (λ) used in the DTC calculation are normalized, unitless values ranging from 0 to 1, the index can be adapted for use in other urban contexts and climate zones to assess the relative priority of local cooling strategies. While the current study focuses on heat mitigation in a hot summer climate, the HI component can be recalibrated to reflect different thermal stress indicators relevant to other climatic conditions. For instance, the HI in this study corresponds to a subset of the UTCI range skewed toward warm-biased conditions, representing the most critical scenario for this site. However, in colder environments, the HI could be redefined to capture cold-stress conditions using the same UTCI framework or other appropriate indices.
It is worth noting that the MassMotion pedestrian simulation was constrained by the fact that the site was still under construction at the time of the study and therefore not open to tourists. As such, actual pedestrian numbers and behavior patterns could not be empirically observed or validated. Instead, pedestrian flow was estimated based on the site’s intended visitor capacity and the functional zoning outlined in planning documents. We acknowledge that this introduces a degree of uncertainty into the simulation outcomes. Future work should incorporate real-time observational data, such as Wi-Fi probe counts [38] or CCTV-based pedestrian tracking, to calibrate and validate the behavioral simulation model, thereby enhancing its accuracy and credibility.
More broadly, to achieve long-term optimization of the outdoor thermal environment in the park, it is necessary to establish a full-cycle closed-loop system encompassing “design–dynamic monitoring–evaluation–regulation.” Dynamic monitoring can be realized through two complementary pathways. The first is the deployment of a smart monitoring network, including IoT-based sensor systems for real-time pedestrian flow tracking and microclimate monitoring stations to capture microthermal conditions. The second pathway includes the implementation of mobile inspection robots equipped with multi-dimensional sensing and intelligent diagnostic capabilities [39]. This system can be expanded into a digital twin platform that tightly integrates real-time DTC data with the BIM model, enabling intelligent management functionalities such as thermal risk early warning, smart tourist redirection to cooler routes [25], and intelligent equipment control that triggers cooling responses when reaching the DTC threshold. Together, these components contribute to the formation of a comprehensive management chain for outdoor thermal environments.
5. Conclusions
This study presents an integrated thermal demand-responsive framework that combines CFD-based thermal environment simulations with pedestrian flow modeling using MassMotion to assess and prioritize outdoor thermal comfort interventions in a commercial street setting. By introducing a differentiated thermal demand design approach, the methodology accounts for both environmental conditions and human spatial behavior, offering a practical and adaptive tool for optimizing the allocation of cooling resources in complex urban spaces.
The main conclusions are as follows:
(1) This study introduces a methodological framework that couples CFD-based thermal simulations with pedestrian flow analysis to quantify thermal demand across different urban zones. This approach addresses a key limitation in conventional thermal design, which often overlooks behavioral factors such as pedestrian density and movement patterns.
(2) The proposed DTC index offers a normalized, spatially explicit tool for evaluating thermal comfort improvement demand. For example, in the commercial area, point R2-2 had a higher HI value (0.95) than R2-4 (0.75), yet, a lower DTC value (0.52 vs. 0.71) due to lower pedestrian density. This highlights the limitations of relying solely on environmental metrics and demonstrates the added value of integrating human movement data.
(3) By setting an appropriate threshold for DTC and dynamically adjusting local cooling strategies, thermal comfort interventions can be deployed more precisely and efficiently. In the simulation focusing on thermal environment of the target site at 10:00, although the dining area experienced elevated heat stress, most monitoring points did not surpass the DTC threshold, indicating that active cooling was unnecessary in those locations at that time. This finding demonstrates the potential of the framework to reduce energy consumption while maintaining thermal comfort.
Future studies could extend this method to other types of urban spaces—such as residential neighborhoods, industrial parks, or cultural/public venues—to examine how pedestrian flow affects thermal conditions in varied contexts. Such extensions would help validate the model’s broader applicability and provide a practical framework for diverse urban planning scenarios, ultimately contributing to more inclusive and responsive thermal comfort strategies.
Author Contributions
Conceptualization, G.L., B.L. and Y.X.; Methodology, D.Z., K.K., X.C., S.S. and Y.X.; Software, D.Z.; Validation, Y.X.; Formal analysis, D.Z.; Investigation, S.S. and D.Z.; Resources, K.K., X.C. and S.S.; Writing—original draft, D.Z.; Writing—review & editing, G.L., B.L. and Y.X.; Visualization, D.Z.; Supervision, G.L., B.L. and Y.X. All authors have read and agreed to the published version of the manuscript.
Funding
The work was supported by the National Natural Science Foundation of China (Grants No. 52308121, 52130803, 52394223, 52425801).
Data Availability Statement
Data will be made available on request.
Conflicts of Interest
Author Kaifa Kang was employed by the company Sichuan Waterfront Urban and Rural Development Co., Ltd. Authors Xin Chen and Shu Sun were employed by the company Sichuan Jiangyuan Engineering Consulting Co., Ltd. The remaining authors declare that the research was conducted in the absence of any commercial or financial relationships that could be construed as a potential conflict of interest.
References
- Chen, L.; Mak, C.M.; Hang, J.; Dai, Y. Influence of elevated walkways on outdoor thermal comfort in hot-humid climates based on on-site measurement and CFD modeling. Sustain. Cities Soc. 2024, 100, 105048. [Google Scholar] [CrossRef]
- Zou, Y.; Xie, W.; Lou, S.; Zhang, L.; Huang, Y.; Xia, D.; Yang, X.; Feng, C.; Li, Y. How weather impacts the citizens’ activity patterns in southern China? Enlightenment from large-scale mobile phone signaling data of Guangzhou. Urban Clim. 2023, 52, 101700. [Google Scholar] [CrossRef]
- Zhao, S.; Yang, L.; Gao, S.; Li, M.; Yan, H.; Zhai, Y. Field investigation on the thermal environment and thermal comfort in shopping malls in the cold zone of China. Build. Environ. 2022, 214, 108892. [Google Scholar] [CrossRef]
- Building Energy Research Center. Annual Report on China Building Energy Efficiency (2020 Report); Tsinghua University: Beijing, China, 2020. [Google Scholar]
- Zhang, Y.; Yu, D.; Zhao, H.; Zhang, B.; Li, Y.; Zhang, J. Chasing the heat: Unraveling urban hyperlocal air temperature mapping with mobile sensing and machine learning. Sci. Total Environ. 2024, 927, 172168. [Google Scholar] [CrossRef]
- Wang, J.; Wang, L.; You, R. Evaluating a combined WRF and CityFFD method for calculating urban wind distributions. Build. Environ. 2023, 234, 110205. [Google Scholar] [CrossRef]
- Jiang, Y.; Xie, Y.; Liang, H.; Zhang, H.; Goto, T.; Niu, J. Developing a physiological-parameter-based thermal sensation model for warm-biased outdoor settings: The steady-state part. Sustain. Cities Soc. 2025, 118, 106020. [Google Scholar] [CrossRef]
- Geng, Y.; Yuan, M.; Tang, H.; Wang, Y.; Wei, Z.; Lin, B.; Zhuang, W. Robot-based mobile sensing system for high-resolution indoor temperature monitoring. Autom. Constr. 2022, 142, 104477. [Google Scholar] [CrossRef]
- Wu, Y.; Zhao, H.; Wu, S.; Duan, M.; Sun, H.; Lin, B.; Liu, X. Evaluation methods of intermittent heating at the individual scale: From theory to terminal application. Appl. Energy 2025, 377, 124649. [Google Scholar] [CrossRef]
- Duan, M.; Sun, H.; Wu, Y.; Wu, S.; Lin, B.; Zhao, D.; Shi, W.; Yang, H. Occupant-centric dynamic heating demand in residential buildings based on a temporal-spatial combined quantification method. Build. Environ. 2024, 258, 111625. [Google Scholar] [CrossRef]
- Tang, H.; Yu, J.; Geng, Y.; Liu, X.; Huang, Z.; Yang, Y.; Wang, Z.; Chen, Y.; Lin, B. Enhancing occupant-centric ventilation control in airport terminals: A predictive optimization framework integrating agent-based simulation. Build. Environ. 2025, 276, 112829. [Google Scholar] [CrossRef]
- Kyogoku, S.; Takebayashi, H. Experimental Verification of Mist Cooling Effect in Front of Air-Conditioning Condenser Unit, Open Space, and Bus Stop. Atmosphere 2023, 14, 177. [Google Scholar] [CrossRef]
- Yang, J.; Liang, Y.; Zhong, Z.; Dharmasastha, K.; Xie, Y.; Niu, J.-L. Thermal comfort investigation of membrane-assisted radiant cooling in outdoor settings. Sustain. Cities Soc. 2024, 113, 105634. [Google Scholar] [CrossRef]
- Detommaso, M.; Gagliano, A.; Marletta, L.; Nocera, F. Sustainable Urban Greening and Cooling Strategies for Thermal Comfort at Pedestrian Level. Sustainability 2021, 13, 3138. [Google Scholar] [CrossRef]
- Nasrollahi, N.; Ghosouri, A.; Khodakarami, J.; Taleghani, M. Heat-Mitigation Strategies to Improve Pedestrian Thermal Comfort in Urban Environments: A Review. Sustainability 2020, 12, 10000. [Google Scholar] [CrossRef]
- Xie, Y.; Wang, X.; Wen, J.; Geng, Y.; Yan, L.; Liu, S.; Zhang, D.; Lin, B. Experimental study and theoretical discussion of dynamic outdoor thermal comfort in walking spaces: Effect of short-term thermal history. Build. Environ. 2022, 216, 109039. [Google Scholar] [CrossRef]
- Enescu, D. A review of thermal comfort models and indicators for indoor environments. Renew. Sustain. Energy Rev. 2017, 79, 1353–1379. [Google Scholar] [CrossRef]
- Vanos, J.K.; Kosaka, E.; Iida, A.; Yokohari, M.; Middel, A.; Scott-Fleming, I.; Brown, R.D. Planning for spectator thermal comfort and health in the face of extreme heat: The Tokyo 2020 Olympic marathons. Sci. Total Environ. 2019, 657, 904–917. [Google Scholar] [CrossRef]
- Vasilikou, C.; Nikolopoulou, M. Outdoor thermal comfort for pedestrians in movement: Thermal walks in complex urban morphology. Int. J. Biometeorol. 2020, 64, 277–291. [Google Scholar] [CrossRef]
- Lau, K.K.-L.; Shi, Y.; Ng, E.Y.-Y. Dynamic response of pedestrian thermal comfort under outdoor transient conditions. Int. J. Biometeorol. 2019, 63, 979–989. [Google Scholar] [CrossRef]
- Yu, Y.; de Dear, R. Thermal respite for pedestrians in overheated urban environments–Introduction of a dynamic analysis of outdoor thermal comfort. Sustain. Cities Soc. 2022, 86, 104149. [Google Scholar] [CrossRef]
- Peng, Z.; Bardhan, R.; Ellard, C.; Steemers, K. Urban climate walk: A stop-and-go assessment of the dynamic thermal sensation and perception in two waterfront districts in Rome, Italy. Build. Environ. 2022, 221, 109267. [Google Scholar] [CrossRef]
- Ma, F.; Jin, Y.; Baek, S.; Yoon, H. Influence of path design cooling strategies on thermal conditions and pedestrian walkability in high-rise residential complexes. Urban For. Urban Green. 2023, 86, 127981. [Google Scholar] [CrossRef]
- Yıldız, B.; Çağdaş, G. Fuzzy logic in agent-based modeling of user movement in urban space: Definition and application to a case study of a square. Build. Environ. 2020, 169, 106597. [Google Scholar] [CrossRef]
- Li, X.; Lu, W.; Peng, Z.; Zhang, Y.; Huang, J. Generative design of walkable urban cool spots using a novel heuristic GAN×GAN approach. Build. Environ. 2024, 266, 112027. [Google Scholar] [CrossRef]
- GB 50180-2018; Standard for Urban Residential Area Planning and Design. Ministry of Housing and Urban-Rural Development: Beijing, China, 2018.
- JGJ/T449-2018; Standard for Green Performance Calculation of Civil Buildings. Ministry of Housing and Urban-Rural Development: Beijing, China, 2018.
- Li, Q.; Mochida, A.; Meng, Q.L.; Zhao, L.H. Comparison of turbulence models for numerical simulation of outdoor wind environment around building. Huanan Ligong Daxue Xuebao/J. South China Univ. Technol. (Nat. Sci.) 2011, 39, 121–127. [Google Scholar]
- Helbing, D.; Molnar, P. Social force model for pedestrian dynamics. Phys. Rev. E 1995, 51, 4282. [Google Scholar] [CrossRef]
- Yang, X.; Zhang, R.; Pan, F.; Yang, Y.; Li, Y.; Yang, X. Stochastic user equilibrium path planning for crowd evacuation at subway station based on social force model. Phys. A Stat. Mech. Its Appl. 2022, 594, 127033. [Google Scholar] [CrossRef]
- Yang, X.; Yang, Y.; Li, Y.; Yang, X. Path planning for guided passengers during evacuation in subway station based on multi-objective optimization. Appl. Math. Model. 2022, 111, 777–801. [Google Scholar] [CrossRef]
- Xiao, L.; Zhang, D.; Cheng, W. Research on Traffic Organisation Design Strategies for Commercial Buildings Based on Depthmap and MassMotion. In Proceedings of the 3rd International Conference on Digital Economy and Computer Application (DECA 2023), Shanghai, China, 22–24 September 2023; Chen, C., Singh, S.N., Saxena, S., Wheeb, A.H., Eds.; Atlantis Press International BV: Dordrecht, The Netherlands, 2023; Volume 17, pp. 169–182. [Google Scholar]
- Broede, P.; Fiala, D.; Blazejczyk, K.; Holmer, I.; Jendritzky, G.; Kampmann, B.; Tinz, B.; Havenith, G. Deriving the operational procedure for the Universal Thermal Climate Index (UTCI). Int. J. Biometeorol. 2012, 56, 481–494. [Google Scholar] [CrossRef]
- Forrester, F.H. How Strong is the Wind?: The Origin of the Beaufort Scale. Weatherwise 1986, 39, 147–151. [Google Scholar] [CrossRef]
- JGJ 286-2013; Design Standard for Thermal Environment of Urban Residential Areas. Ministry of Housing and Urban-Rural Development: Beijing, China, 2013.
- Jendritzky, G.; de Dear, R.; Havenith, G. UTCI-Why another thermal index? Int. J. Biometeorol. 2012, 56, 421–428. [Google Scholar] [CrossRef] [PubMed]
- Hwang, R.-L.; Weng, Y.-T.; Huang, K.-T. Considering transient UTCI and thermal discomfort footprint simultaneously to develop dynamic thermal comfort models for pedestrians in a hot-and-humid climate. Build. Environ. 2022, 222, 109410. [Google Scholar] [CrossRef]
- Huang, W.; Lin, Y.; Lin, B.; Zhao, L. Modeling and predicting the occupancy in a China hub airport terminal using Wi-Fi data. Energy Build. 2019, 203, 109439. [Google Scholar] [CrossRef]
- Hu, Y.; Long, H.; Chen, M. The analysis of pedestrian flow in the smart city by improved DWA with robot assistance. Sci. Rep. 2024, 14, 11456. [Google Scholar] [CrossRef]


Disclaimer/Publisher’s Note: The statements, opinions and data contained in all publications are solely those of the individual author(s) and contributor(s) and not of MDPI and/or the editor(s). MDPI and/or the editor(s) disclaim responsibility for any injury to people or property resulting from any ideas, methods, instructions or products referred to in the content. |
© 2025 by the authors. Licensee MDPI, Basel, Switzerland. This article is an open access article distributed under the terms and conditions of the Creative Commons Attribution (CC BY) license (https://creativecommons.org/licenses/by/4.0/).