Article

Development and Numerical Implementation of Plastic Damage Constitutive Model for Concrete Under Freeze–Thaw Cycling

1
School of Architectural & Civil Engineering, Shenyang University, Shenyang 110044, China
2
Northeast Geological S&T Innovation Center of China Geological Survey, Shenyang 110044, China
3
School of Civil Engineering, Shandong Jianzhu University, Jinan 250101, China
*
Author to whom correspondence should be addressed.
Buildings 2025, 15(13), 2155; https://doi.org/10.3390/buildings15132155
Submission received: 17 May 2025 / Revised: 18 June 2025 / Accepted: 19 June 2025 / Published: 20 June 2025

Abstract

The predictive modeling of concrete degradation under freeze–thaw cycling remains a challenge due to complex damage mechanisms and limited simulation accuracy. A plastic damage constitutive model for fly ash concrete under freeze–thaw conditions was established based on experimental data and implemented via the concrete damage plasticity (CDP) model in ABAQUS. A modified stress–strain relationship and damage factor were introduced to describe mechanical deterioration across various freeze–thaw stages. Macro- and mesoscale finite element simulations were applied to simulate the stress–strain evolution, plastic deformation, and damage development. A validation against experimental data indicated a relatively high accuracy, with prediction errors of 1.61% at the macroscale and 5.81% at the mesoscale. The macroscale model effectively captures global stiffness degradation and strength loss, while the mesoscale model reveals the internal freeze–thaw damage mechanisms, including crack initiation and propagation. The results demonstrate the applicability of the proposed model for assessing freeze–thaw-induced damage in concrete structures exposed to cold environments.

1. Introduction

Infrastructure in cold regions has long been adversely affected by the concrete deterioration under freeze–thaw cycling. This multi-physics degradation mechanism not only induces typical damage modes, such as surface spalling, crack propagation, and durability loss, but also results in reducing structural serviceability and escalating maintenance costs, presenting significant engineering challenges for civil infrastructure sustainability [1]. In response, researchers have undertaken systematic investigations to enhance the frost resistance of concrete, with a focus on optimizing the material composition, elucidating environmental action mechanisms, and regulating curing processes. In this context, innovative materials such as chemically modified concrete with admixtures, blended systems with mineral additives, and fiber-reinforced concrete have demonstrated significantly improved frost resistance in experimental investigations [2]. Nevertheless, compared with full-scale experimental research, numerical investigations employing the finite element method (FEM) to simulate the evolution of concrete mechanical properties under freeze–thaw cycling remain relatively limited, which hinders a deeper understanding of the multi-factor coupling mechanisms involved.
ABAQUS (v2024) finite element analysis software demonstrates excellent applicability in solving nonlinear problems and exhibits significant advantages in simulating the constitutive behavior of concrete materials [3,4]. The built-in concrete damage plasticity (CDP) model, derived from the nonlinear constitutive theory proposed by Lubliner [5], integrates damage mechanics with plasticity theory to accurately characterize the coupling mechanism between the compressive/tensile damage evolution and the plastic deformation of concrete under complex stress states. Researchers have made continuous efforts to refine the theoretical framework of the CDP model. Based on Lubliner’s work, Lee et al. [6] innovatively incorporated stiffness recovery effects into the constitutive equations. Shi Xinyu et al. [7] conducted systematic sensitivity analyses, established a calibration method through uniaxial tension and compression tests, and revealed the influence of mesh discretization errors on load-displacement characteristics. Yao Zeliang et al. [8] reconstructed the entire damage evolution process (initiation, propagation, and ultimate failure) in recycled concrete, using ABAQUS combined with the Sidoroff energy equivalence principle. Zhang Fei et al. [9] discussed the selection and adjustment methods of parameters in the concrete principal model based on plastic damage. The stress–strain relationship expressions provided by the current specification and ABAQUS software were compared and analyzed, and the rationalization of the parameter selection for the CDP model was proposed. Zhou Zhengfeng et al. [10] investigated the stress concentration and plastic damage development of concrete around concrete pavement joint transmission bars under different axial loads by introducing a concrete damage plasticity model, which proved that the CDP model can accurately simulate the damage plasticity behavior of concrete. Chen et al. [11] proposed several coupled constitutive models, experimentally validated these formulations, and demonstrated stress-path prediction errors below 5%. Sun et al. [12] proposed a concrete damage plasticity (CDP) model based on the energy release rate, in which the introduction of a cohesion degradation parameter significantly enhanced the accuracy of simulating damage evolution and plasticity development in concrete subjected to freeze–thaw cycles and mechanical loading. Qiu et al. [13] developed a damage constitutive model for concrete based on the Concrete Damaged Plasticity (CDP) theory. The results showed that, after 125 freeze–thaw cycles, the discrepancy between the simulated and experimental peak stress was 8.5%, and the difference in initial stiffness was 9.2%. The CDP-based model accurately captured the stress–strain curves under varying numbers of freeze–thaw cycles, demonstrating a good agreement between the simulation and experimental data. While the CDP model has matured in simulating the nonlinear behavior of concrete under conventional loading conditions, and substantial research has investigated its plastic damage characteristics of concrete under various loads, a research gap persists regarding damage evolution simulations under combined freeze–thaw cycles and mechanical loading conditions.
Based on experimental results and multi-scale numerical simulations, this study systematically investigates the mechanical behavior of fly ash concrete under freeze–thaw environmental conditions. A novel multi-scale modeling framework is developed, integrating complementary macroscale and mesoscale models. Taking the fly ash concrete characterized in [14] as the prototype material, a plastic damage model is established for 0, 25, 50, and 75 freeze–thaw cycles by introducing a damage factor. The computational methods for key parameters, including actual compressive stress, inelastic strain, and the damage factor, are proposed. Finite element simulations are utilized to analyze and compare the evolution of full stress–strain relationships and damage accumulation mechanisms of concrete subjected to different numbers of freeze–thaw cycles. The fundamental mechanism of freeze–thaw damage is revealed, and the reliability of the plastic damage model is validated through a cross-verification approach combining experimental data and numerical simulation results. This work establishes theoretical foundations and provides methodological guidelines for conducting a nonlinear finite element analysis of concrete structures under combined freeze–thaw and mechanical loading scenarios.

2. CDP Model Development and Parameter Selection

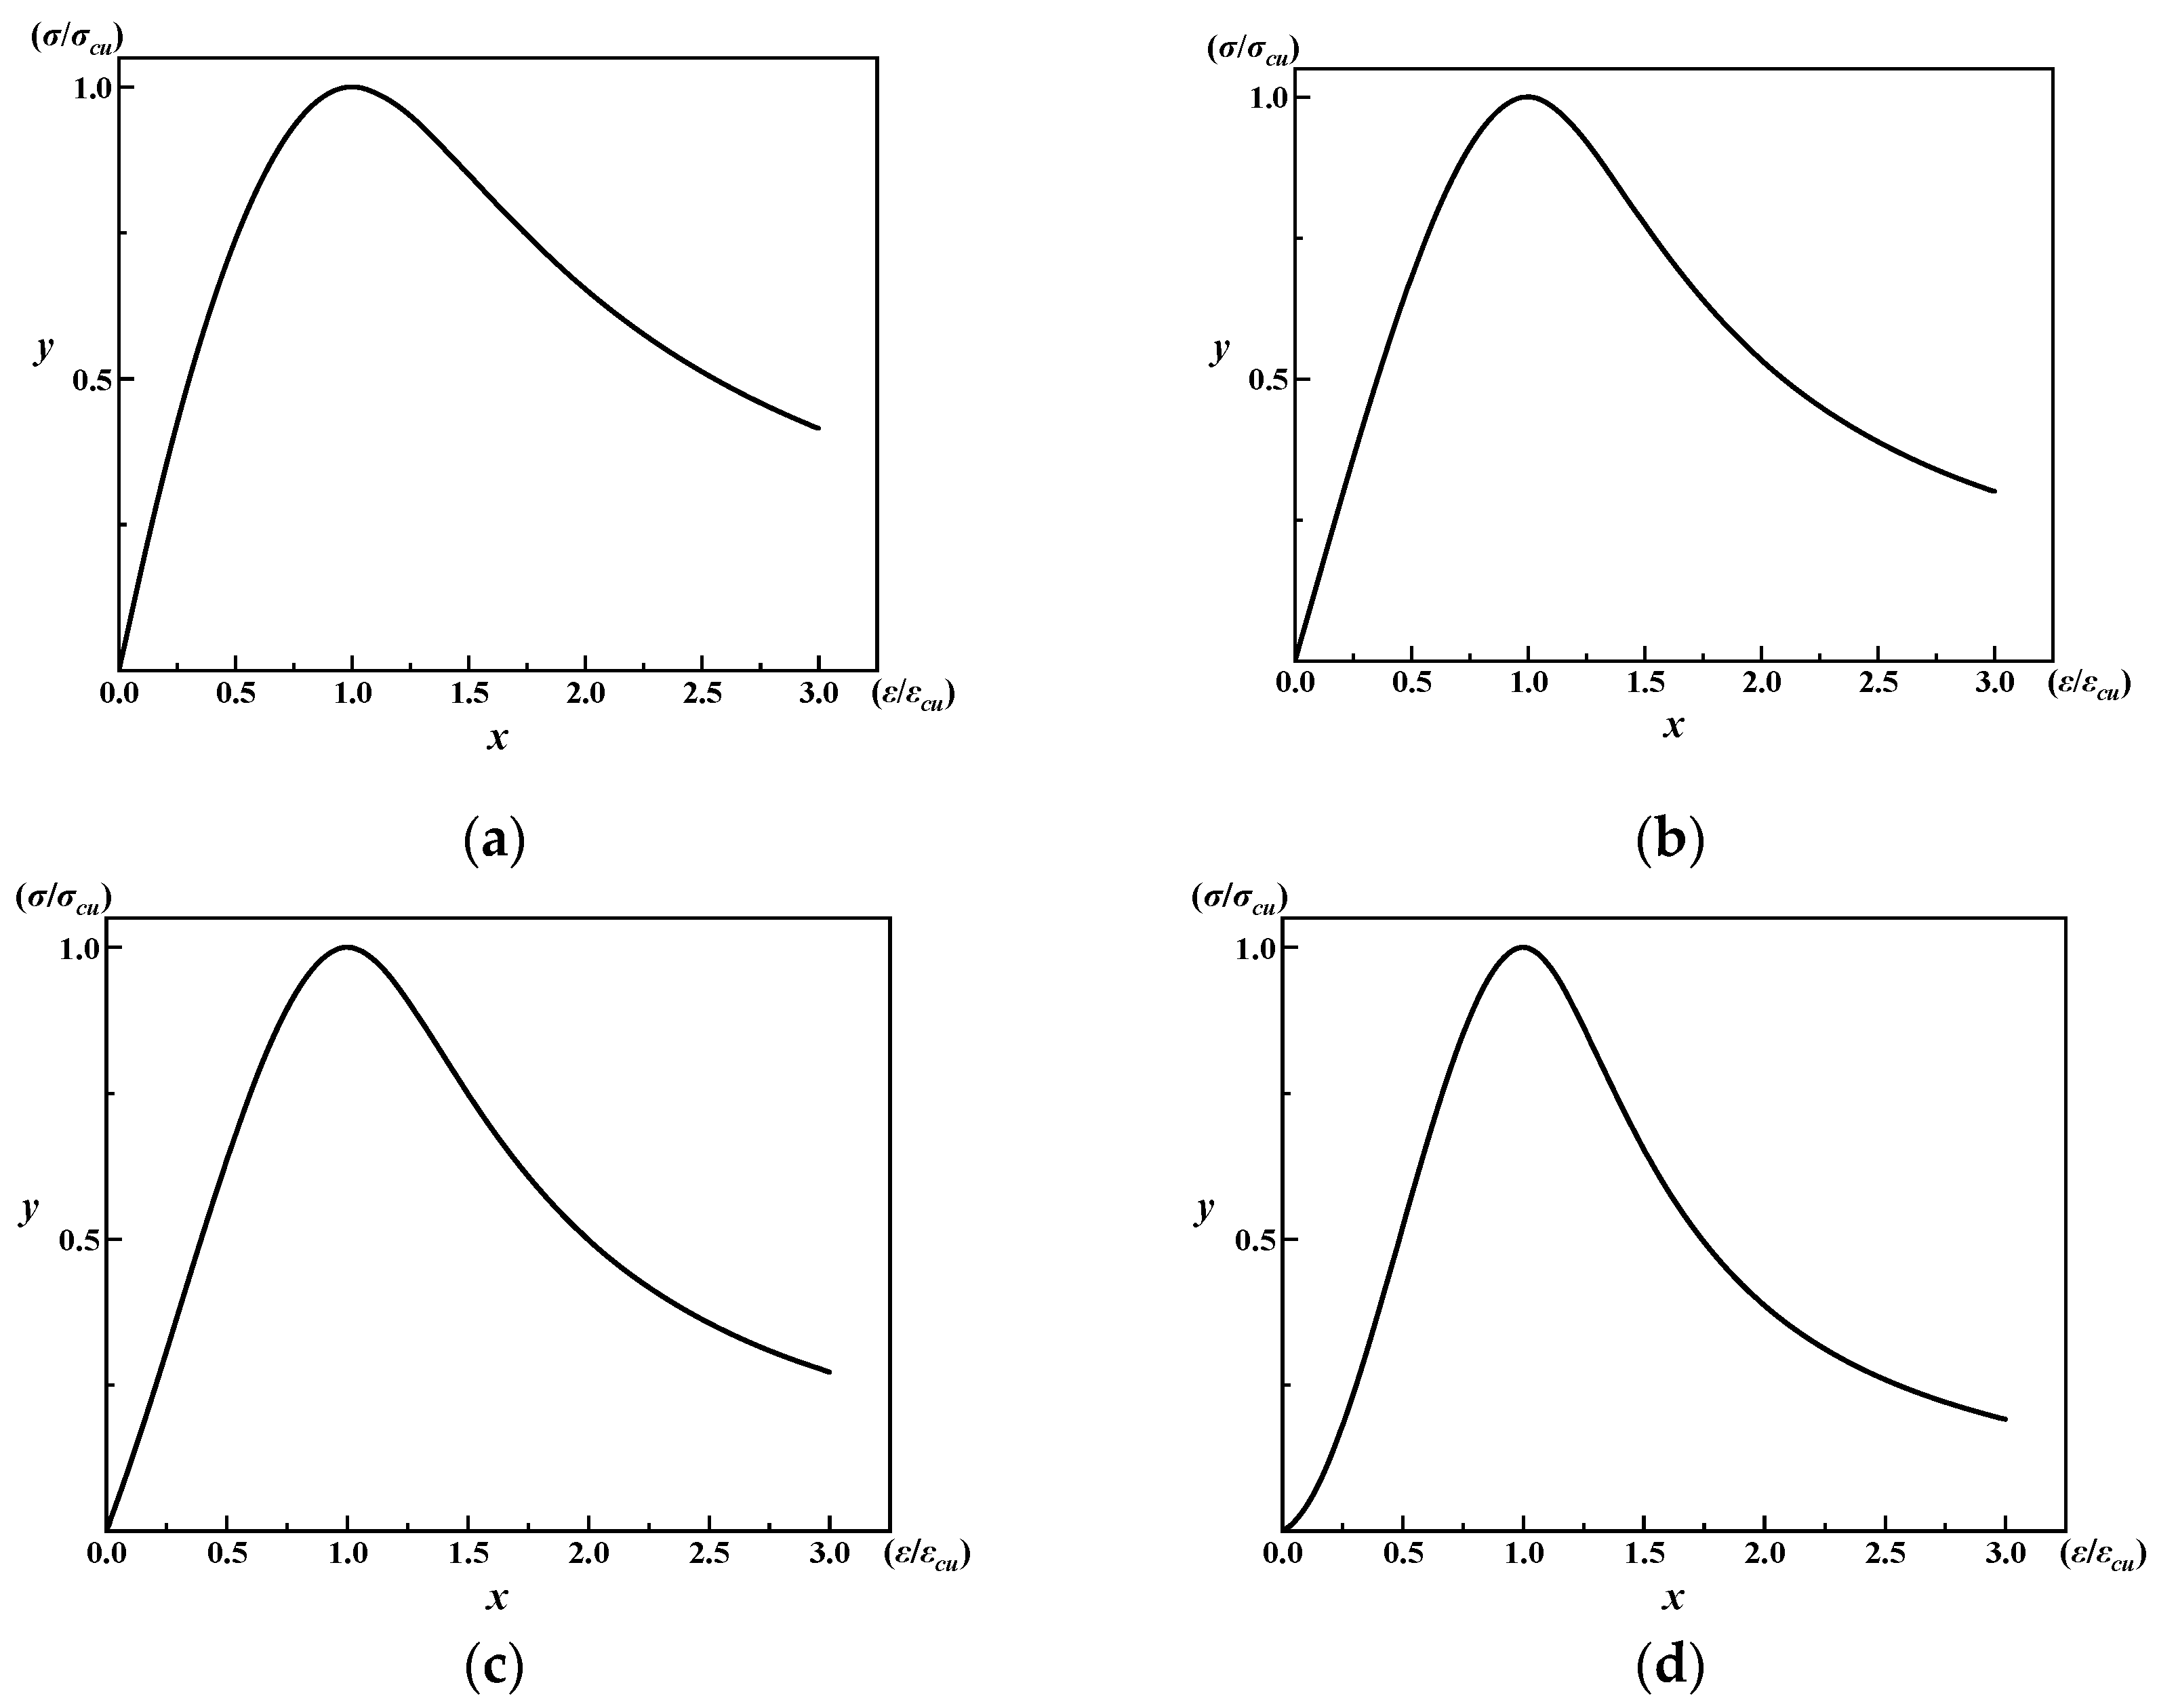
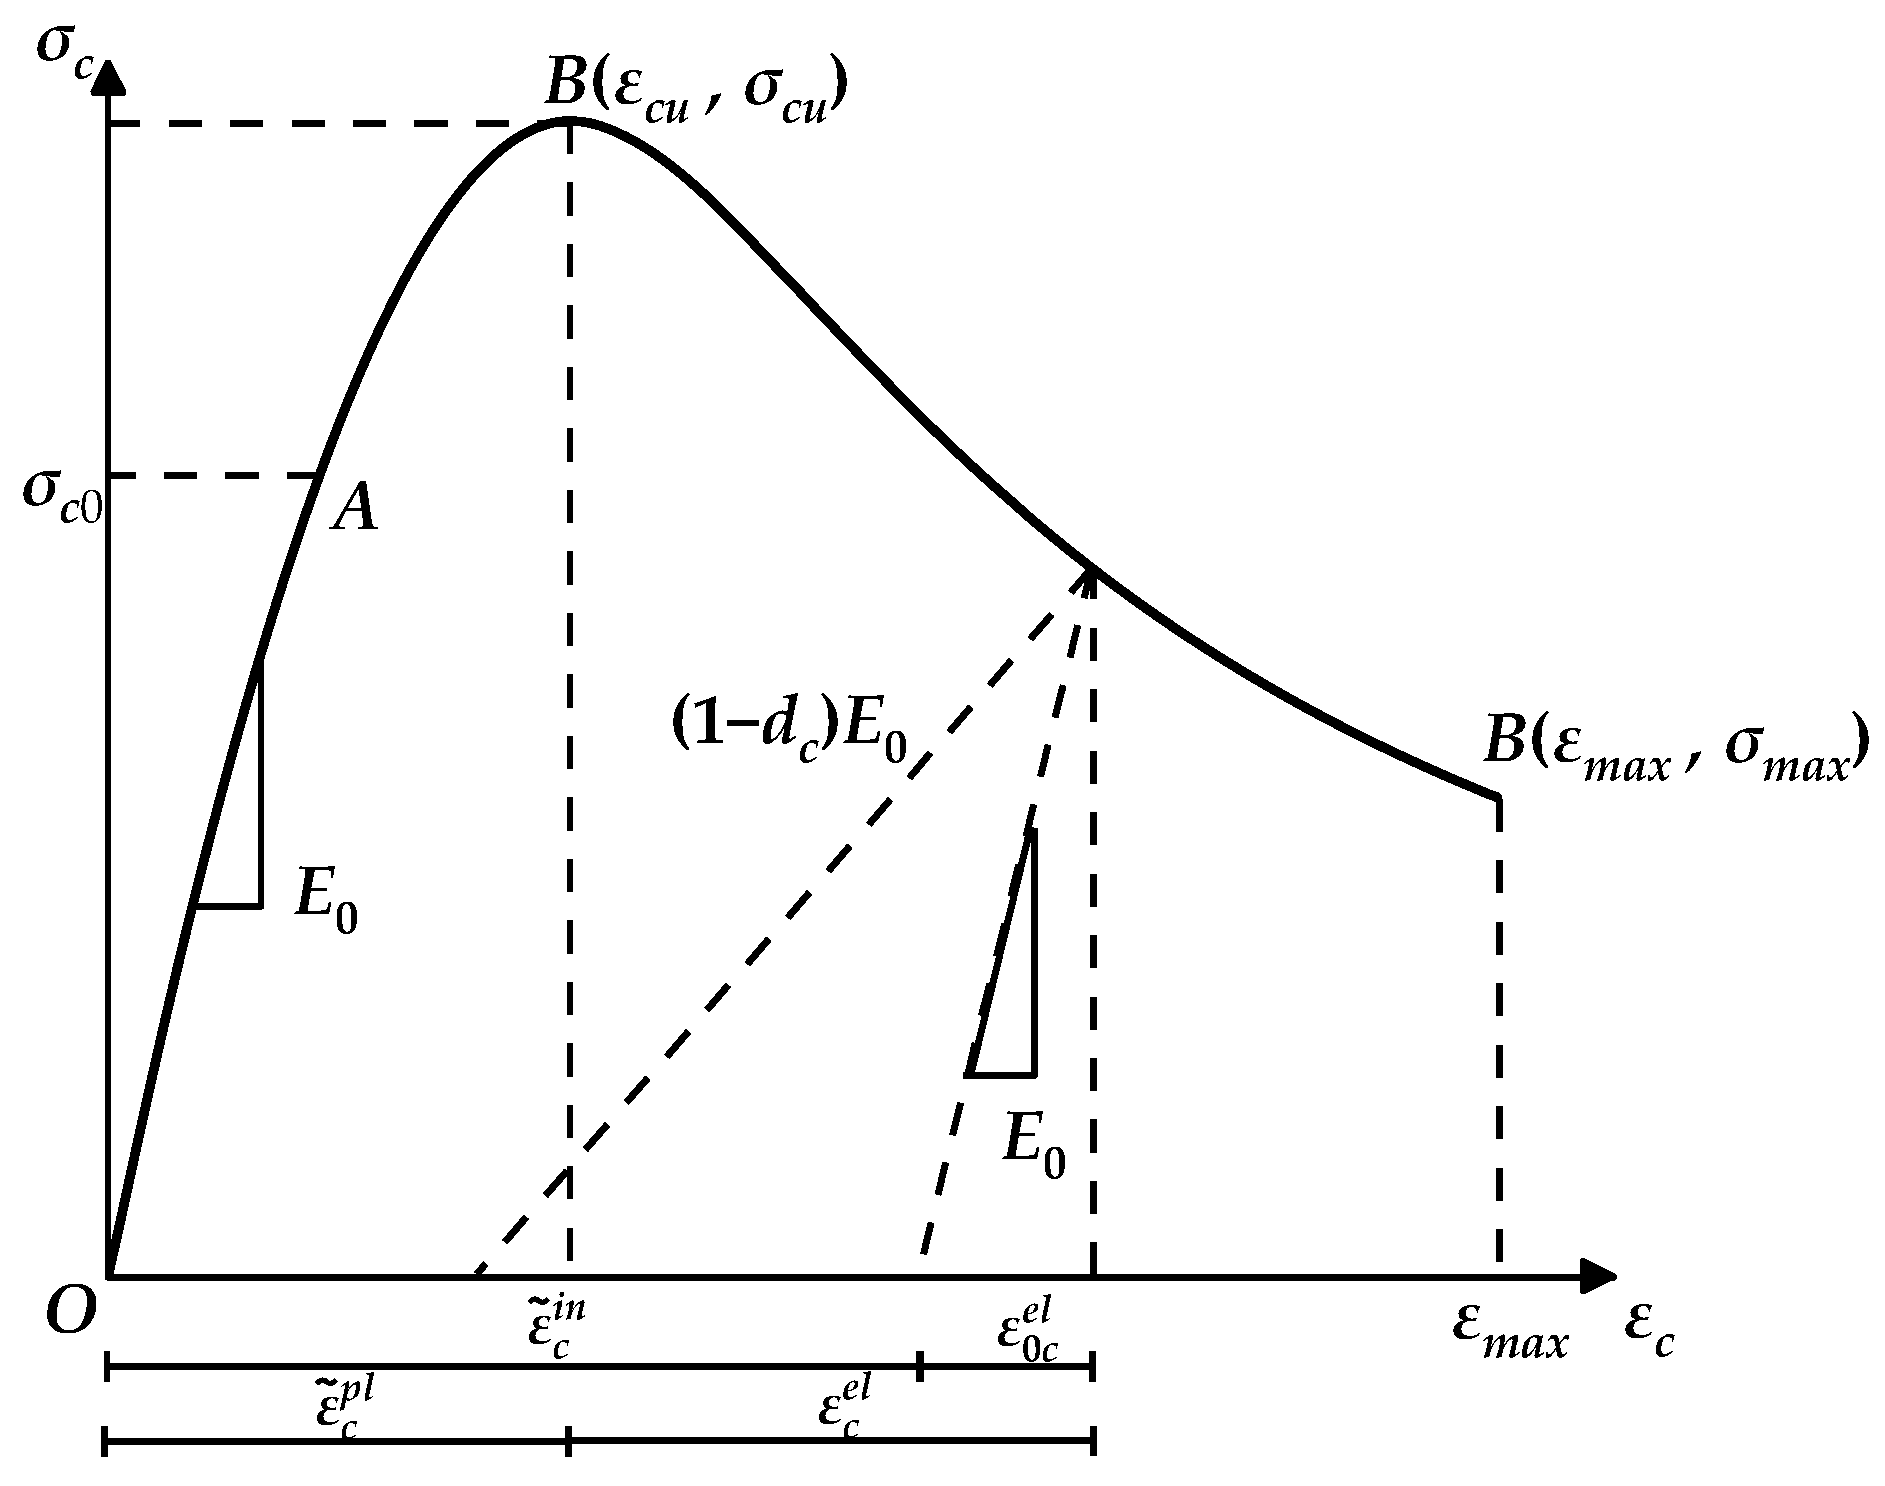
2.1. Axial Compressive Stress–Strain Relationship of Concrete

The accuracy of the concrete constitutive relationship is a fundamental prerequisite for implementing the Concrete Damaged Plasticity (CDP) model, as it requires user-defined uniaxial stress–strain parameters. Various empirical formulas proposed by current standards, such as the Code for Design of Concrete Structures (GB/T 50010-2010) [15], and researchers (Guo Zhenhai [16], Ding Faxing [17,18], Li Yiqiang [19], Saenz [20,21], Hordijk [22], and Hognestad [23]) provide a theoretical basis for the constitutive modeling of concrete with different strength grades. Based on the experimental data reported in reference [14], axial compression tests were carried out in this study on C30 fly ash concrete under different freeze–thaw cycles (0, 25, 50 and 75), which were completed according to the GB/T 50082-2009 specification [24]. These investigations enabled the construction of characteristic stress–strain relationships quantifying freeze–thaw induced damage progression. The experimental results for the axial compressive stress–strain behavior are shown in Table 1.
Each data point presented in Table 1 was obtained by averaging the results of three replicate prismatic specimens (100 mm × 100 mm × 300 mm) under the same freeze–thaw condition, in accordance with the methodology reported in reference [14]. These averaged values were used to construct the calibrated stress–strain curves and to validate the numerical simulation results. The ascending and descending phase of the axial stress–strain relationship of concrete, as reported in reference [14], were represented through the Guo Zhenhai model [16]. The equations describing the ascending and descending phases are given in Equations (1) and (2), respectively.
y = ax + ( 3     2 a ) x 2 + ( a   2 ) x 3                                                                                                                               0 x     1
y = x b ( x 1 ) 2 + x                                                                                                                                                                                                     x > 1
Reference [14] conducted a comprehensive investigation into the progressive deterioration of concrete’s mechanical characteristics induced by freeze–thaw cycling. This work introduced the relative dynamic elastic modulus W, together with the full-curve control parameters a and b, to reflect their interdependence, as shown in Equations (3) and (4).
a   = 0.05431 w     3.4589
b   = 0.0563 w   + 7.57819
The fitted values of the control parameters a and b for concrete under different numbers of freeze–thaw cycles are summarized in Table 2.
By substituting the parameters a and b, the fitted stress–strain relationships of concrete under different numbers of freeze–thaw cycles damage were obtained, as illustrated in Figure 1.

2.2. Correction of Axial Compressive Stress–Strain Relationship of Concrete

The compressive stress–strain relationship used in the CDP model consists of three characteristic stages, as shown in Figure 2:
(1)
Elastic stage (OA segment): represented by a linear elastic constitutive model;
(2)
Hardening stage (AB segment): exhibits nonlinear strengthening behavior;
(3)
Softening stage (BC segment): post-peak stiffness degradation reflects the accumulation of damage.
When σ > σc0, the concrete initiates the damage evolution phase, during which the elastic modulus degradation is triggered, governed by Equation (5):
E   = ( 1   d c ) E 0
where E0 is the initial elastic modulus of the concrete; dc is the plastic damage factor under compression, with a range of 0 ≤ d ≤ 1; and a value of 0 indicates the undamaged initial concrete, while a value of 1 represents complete failure.
Furthermore, the stress–strain relationship of concrete is illustrated in Figure 2, and the calculation formulas for the inelastic strain are provided in Equations (6)–(8).
ε ~ c in =   ε c , true ε 0 c el
ε 0 c el = σ c , true E 0
ε ~ c pl =   ε ~ c in d c ( 1 d c ) σ c , true E 0
where ε ~ c in is the inelastic compressive strain, which corresponds to the output of the Concrete Damaged Plasticity (CDP) model in ABAQUS; ε 0 c el is the elastic compressive strain associated with the initial elastic modulus; and ε ~ c pl is the plastic strain under compression, which must increase progressively with the compressive damage factor and remain more significant than zero, to avoid computational errors in ABAQUS. The values εc,true and σc,true correspond to the true strain and stress derived from experimental data in reference [14], requiring a conversion from the original nominal measurements. Since the CDP model in ABAQUS requires the input of accurate stress–strain data, Equations (9) and (10) are applied.
σ c , true = σ ( 1 + ε )
ε c , true = ln ( 1   + ε )
To satisfy the convergence requirements of the CDP model, the constitutive curve was modified accordingly through three critical enhancements. (1) The initial elastic modulus E0 was defined as the secant modulus corresponding to 0.6σcu and (2) the yield threshold was set as σc0 = 0.6σcu, according to reference [7]. Taking undamaged concrete as an example, the constitutive model is defined by Equations (11)–(13), with a piecewise function describing distinct mechanical stages.
y =   E 0 ε c σ c x                                                                                                                                                                                 0     x     0.378
y = ax + ( 3     2 a ) x 2 + ( a   2 ) x 3                                                                                                                 0.378 x 1
y = x b ( x 1 ) 2 + x                                                                                                                                                                                               x > 1
The constitutive response demonstrates two distinct regimes:
(i)
linear elasticity prevails within 0 ≤ x ≤ 0.378;
(ii)
damage initiates beyond the critical threshold of x > 0.378.
Under freeze–thaw conditions, the threshold of the linear elastic range increases monotonically with different cycles, quantified as follows:
(a)
25 cycles: 0–0.431;
(b)
50 cycles: 0–0.470;
(c)
75 cycles: 0–0.553.
The final modified constitutive relationships are shown in Figure 3, which presents the proper stress–strain relationships after the correction for different numbers of freeze–thaw cycles.

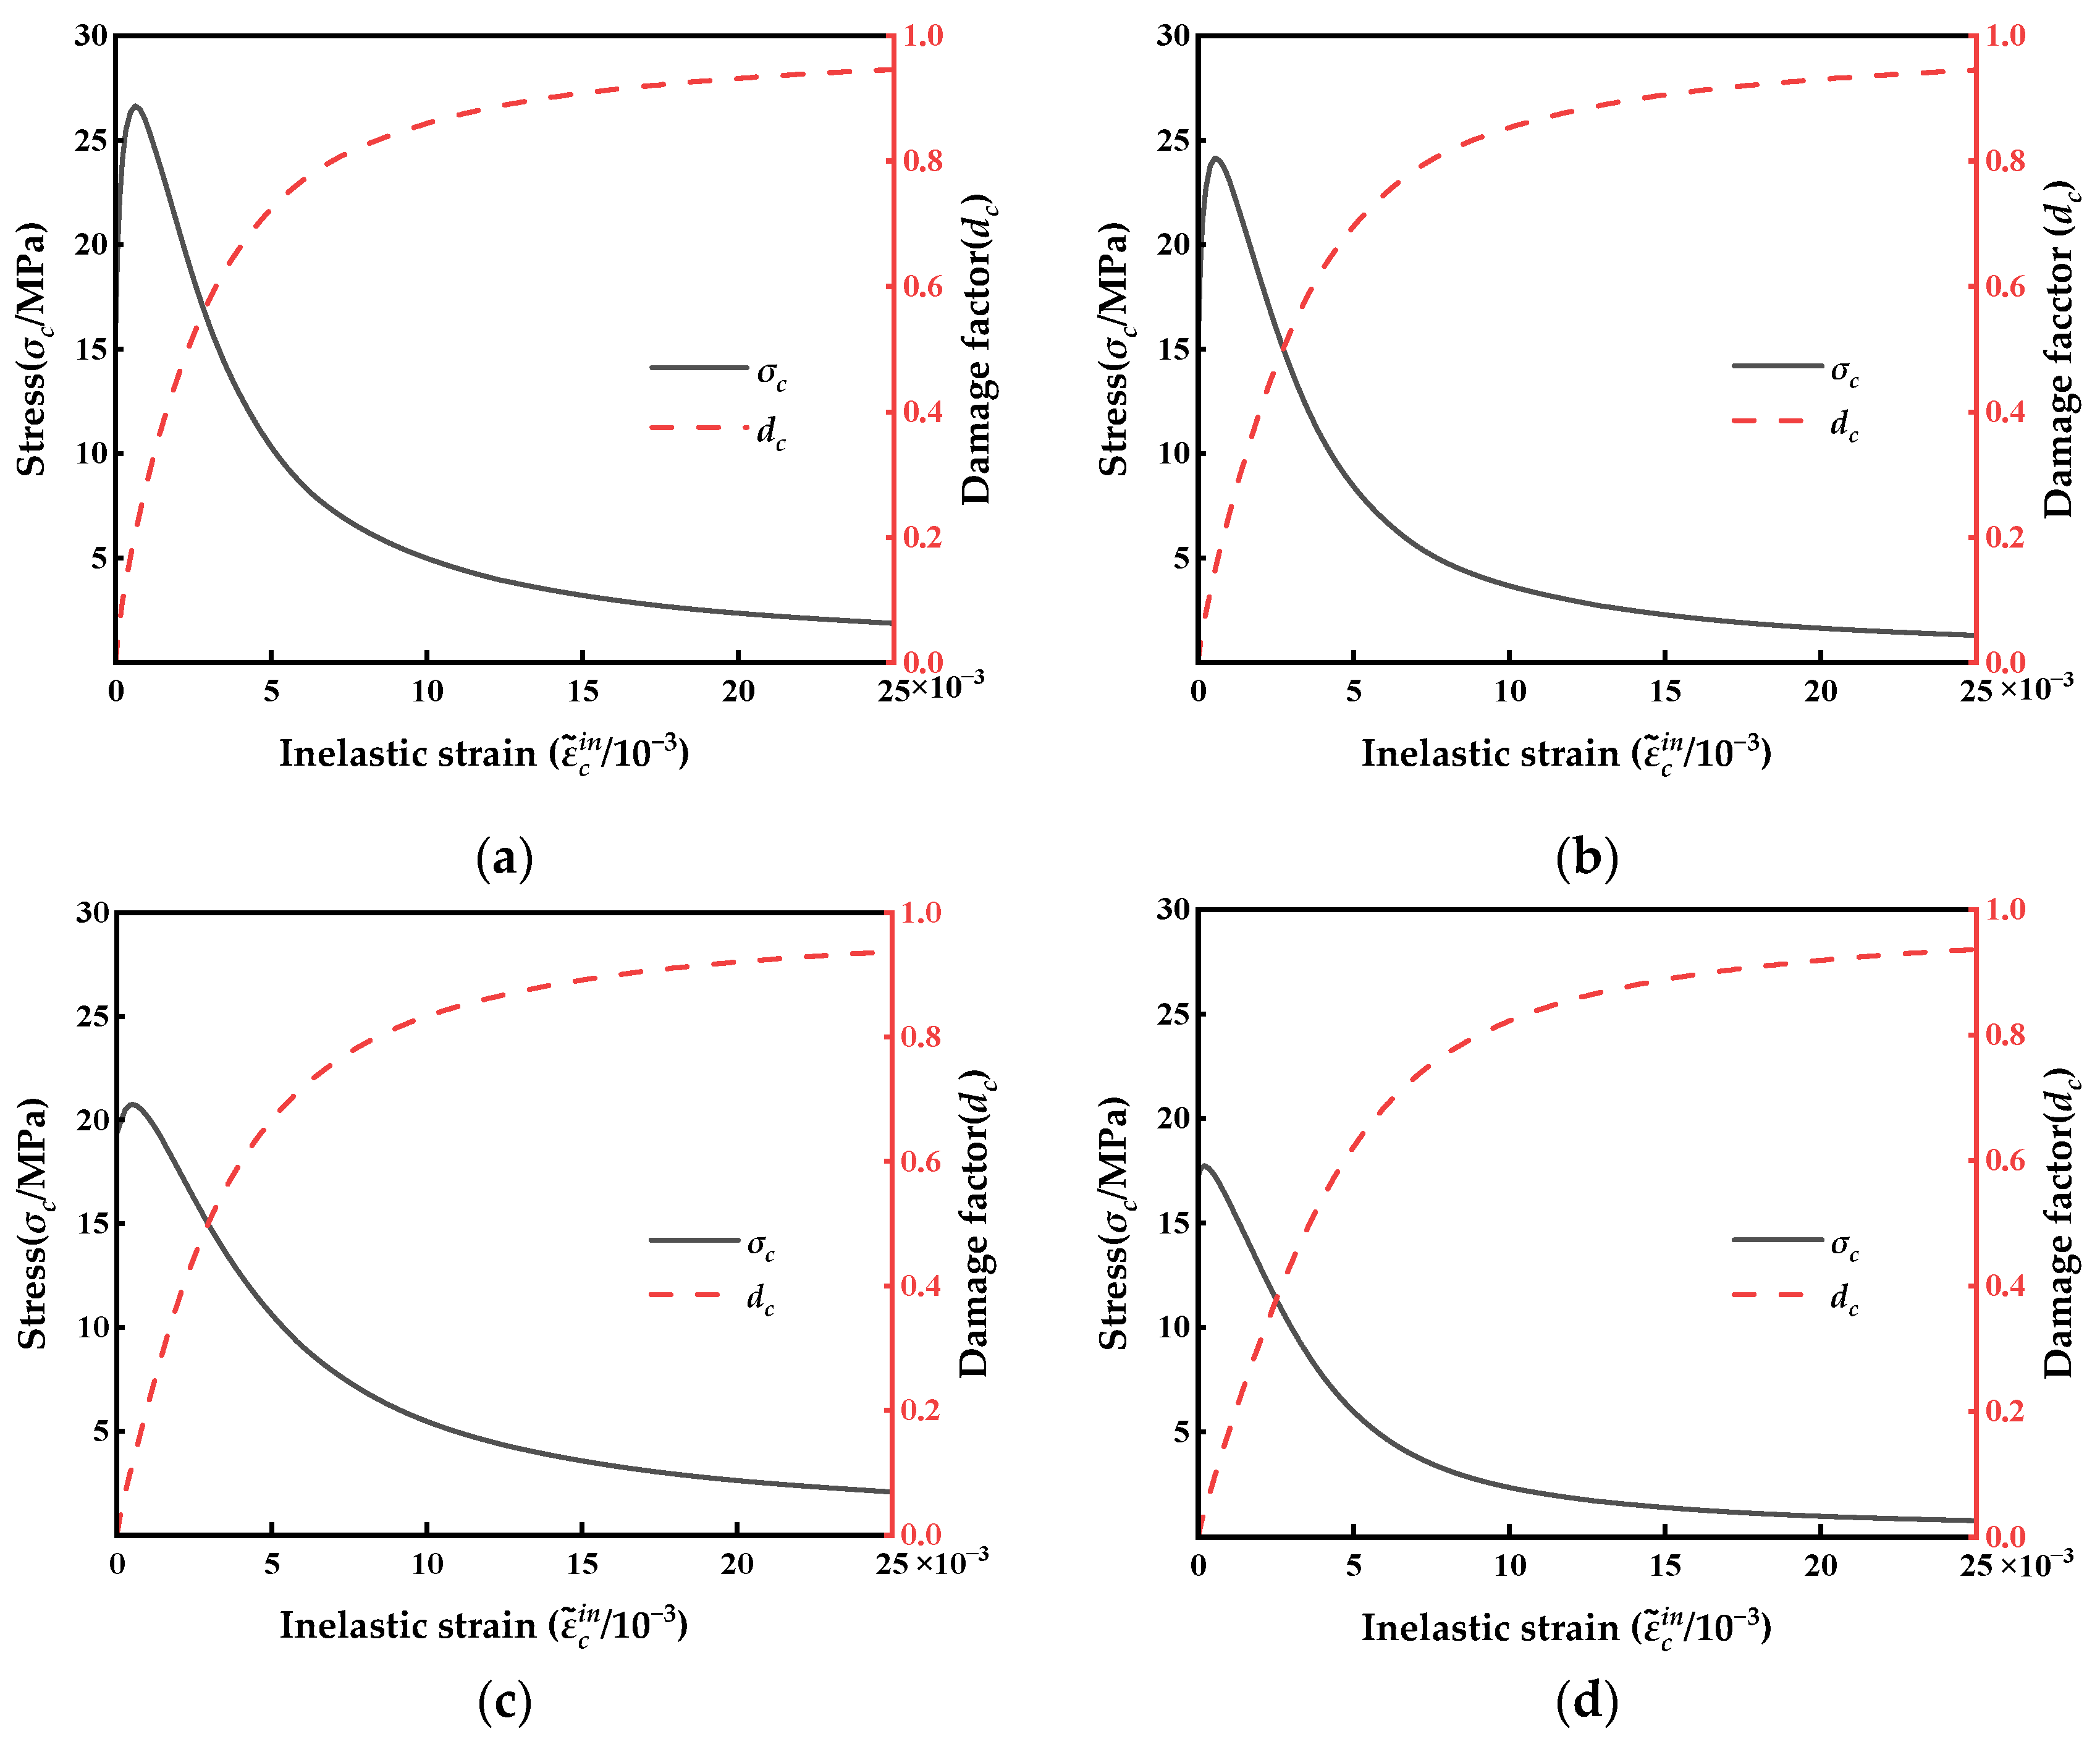
2.3. Plastic Damage Factor Determination

When the compressive stress exceeds the elastic yield point, micro-pores/cracks begin to initiate and develop within the concrete, initiating the evolution of material damage. Given the difficulty of experimentally quantifying the damage state, a factor is introduced to characterize the extent of the damage across loading phases. Among existing damage constitutive theories, the approaches proposed by Najar [25], Wang–Yu [26], Sidoroff [27], and the energy equivalence principle developed by Sidoroff [27] have been widely recognized and gained an extensive application due to its computational efficiency and strong applicability. The principle of energy equivalence states that the elastic residual energy produced by stress acting on a damaged material is the same in form as that produced by stress acting on an undamaged material. It only requires replacing the stress with the equivalent stress or the elastic modulus with the elastic modulus at the time of the damage, as shown in Equations (14)–(16). It should be noted that the damage factor represents the damage evolution during mechanical loading, not the freeze–thaw damage itself. The effect of the freeze–thaw is embedded in the stress–strain response via fitted parameters, not directly through.
The elastic strain energy of an undamaged material is defined by:
W 0 e = σ 2 2 E 0
The elastic strain energy of a damaged material is defined by:
W D e = σ 2 2 E D = σ ¯ 2 2 E 0
where ED is the degraded elastic modulus, and σ ¯ represents the equivalent stress defined through:
σ ¯ = σ 1 d c
From Equations (14)–(16), it follows that E D =   E 0 ( 1 d ) 2 , from which the constitutive relationship of the material can be derived, and Equation (17) is obtained:
σ = E 0 ( 1 d ) 2 ε
Normalization is performed to form segmented functions. From x = ε ε cu , y = σ σ cu , one obtains y =   ( 1 d ) 2 ρ c x , where ρ c = σ cu E 0 ε cu . Combining this with Equations (11)–(13), the compressive damage factor, the dc of concrete without freeze–thaw cycles, can be calculated.
d c = 0                                                                                                                                                                                           0     x     0.378  
d c = 1   ρ c a + ( 3 2 a ) x + ( a 2 ) x 2                                                                                 0.378 x 1
d c = 1   ρ c b ( x 1 ) 2 + x                                                                                                                                                               x > 1
Following this methodology, the compressive damage factor, dc, was systematically evaluated for concrete specimens undergoing 25, 50, and 75 freeze–thaw cycles. Table 3 demonstrates the damage factor versus the normalized strain relationship.
The corresponding curves of the compressive stress–strain and damage factor–strain are illustrated in Figure 4.

2.4. Plasticity Parameters Calibration

In addition to the previously defined damage parameters (includes true stress σc,true, damage factor dc, and plastic strain ε ~ c in ), the CDP model requires the specification of the flow potential function and yield surface characteristics, including the dilation angle ψ, eccentricity e, biaxial/uniaxial compressive strength ratio fb0/fc0, stress invariant ratio K, and viscosity parameter μ. Among these, the parameters e, fb0/fc0, and K were assigned default values.

2.4.1. Yield Condition

In a complex state of stress, when plastic deformation starts to occur at some point in the body, the state of stress must satisfy the yield condition [10]. The CDP model uses effective stresses to show the yield condition, expressed as Equations (21)–(25).
1 1 α ( q ¯   3 α p ¯ + β σ ¯ ^ m γ σ ¯ ^ m ) σ ¯ = 0
σ ¯ ^ m = ( σ ¯ ^ m + | σ ¯ ^ m | ) / 2
α   = σ b 0 σ 0 1 2 σ b 0 σ 0 1
β   = σ ¯ c ε ~ c p σ ¯ t ε ~ t p 1   α 1 + α
γ   = 3 1   K C 2 K C   1
p ¯ is the effective hydrostatic pressure; q ¯ is the Mises equivalent stress; σ ¯ ^ m is the maximum principal effective stress; <> is the Macauley operator; α, β, and γ are the parameters; σb0 and σc0 are the biaxial and uniaxial compressive strengths of the concrete, respectively, and the ratios of these two values are taken as 1.16 [28]; σ ¯ c ε ~ c p and σ ¯ t ε ~ t p are the uniaxial effective compressive stress and effective tensile stress of the concrete at the time of equivalent plastic stresses ε ~ c p and ε ~ t p , respectively; and KC is the ratio of the second stress invariant at the tensile and compressive meridians, which is taken to be 2/3.

2.4.2. Expansion Angle and Eccentricity

In ABAQUS’ CDP model, which describes the concrete damage plasticity model assuming an uncorrelated potential plastic flow, the flow potential G used is the Drucker–Prager hydrostatic Equation (26):
G = ε σ t 0 tan ψ 2 + q ¯ 2 p ¯ tan ψ
where ψ is the expansion angle at high peripheral pressure in the radial plane; σt0 is the uniaxial tensile stress at failure; and ε is the eccentricity of the potential function, which is used to eliminate the sharp angle of the radial line, taken as 0.1. The theoretical range of the dilation angle Ψ is from 0° to 56.31° and is closely related to the material’s constitutive behavior. The selected value lies within the commonly accepted range (25–40°) reported in the literature. Given the engineering context of underground structural applications, and based on the methodology of reference [29], ψ = 36° was deemed appropriate for this study.
In addition, the viscosity parameter μ substantially influences the solution accuracy, computational efficiency, and iterative convergence stability. To balance computational efficiency and accuracy, a minimal value strategy was employed, and μ = 0.0005 was selected according to reference [30]. The specific values assigned to the plasticity parameters are presented in Table 4.

3. Macroscopic Modeling Analysis of Freeze–Thaw Induced Compressive Response

3.1. The Development of the Macroscopic Model

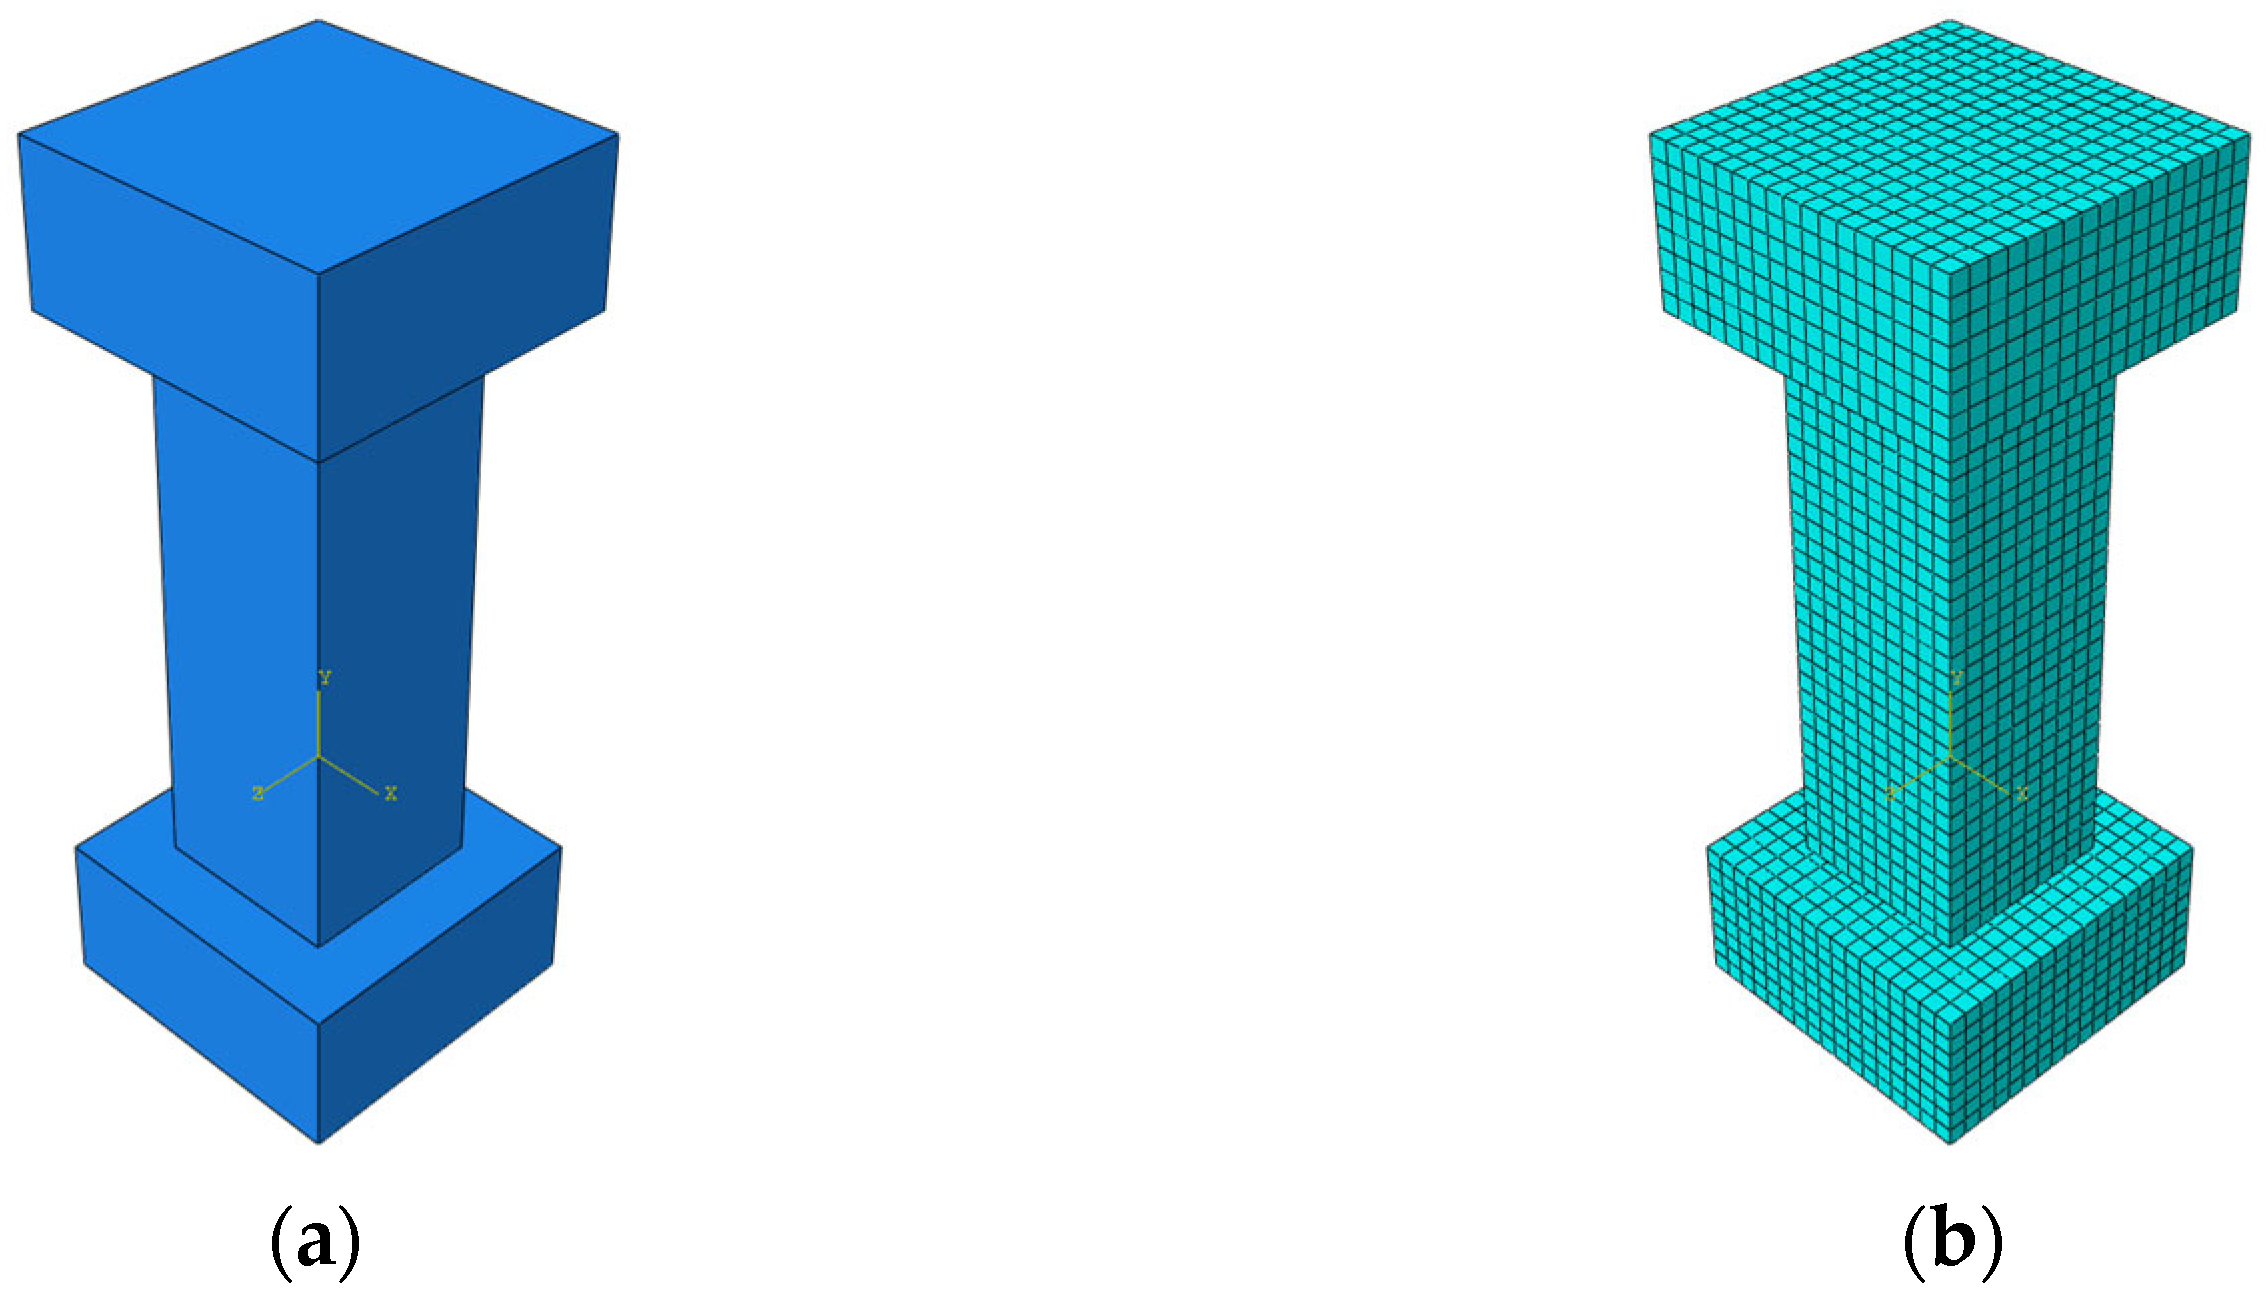
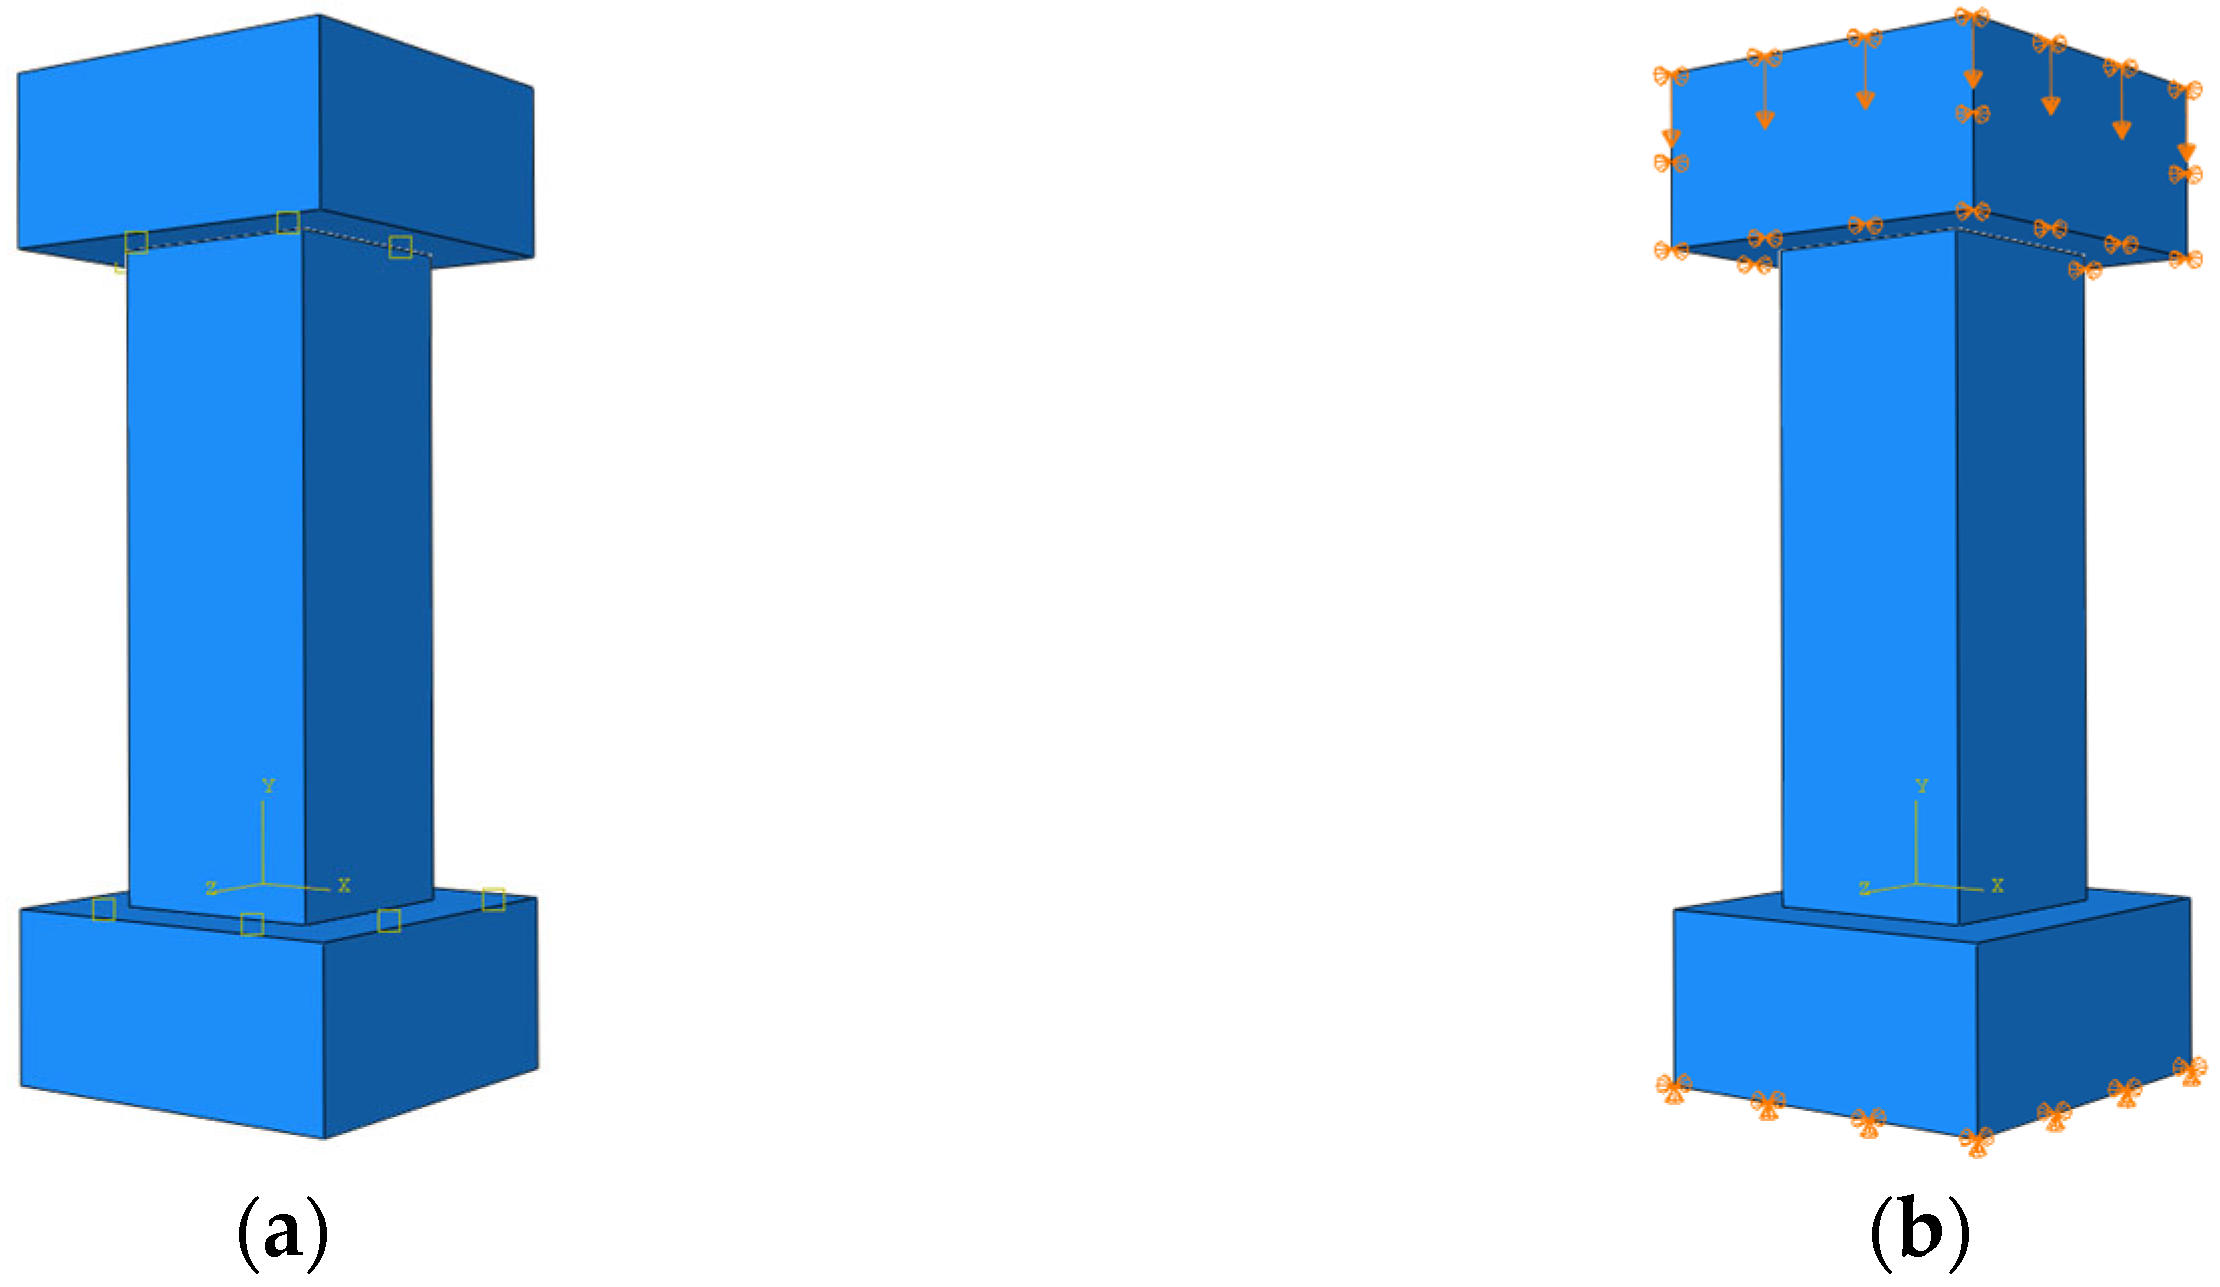
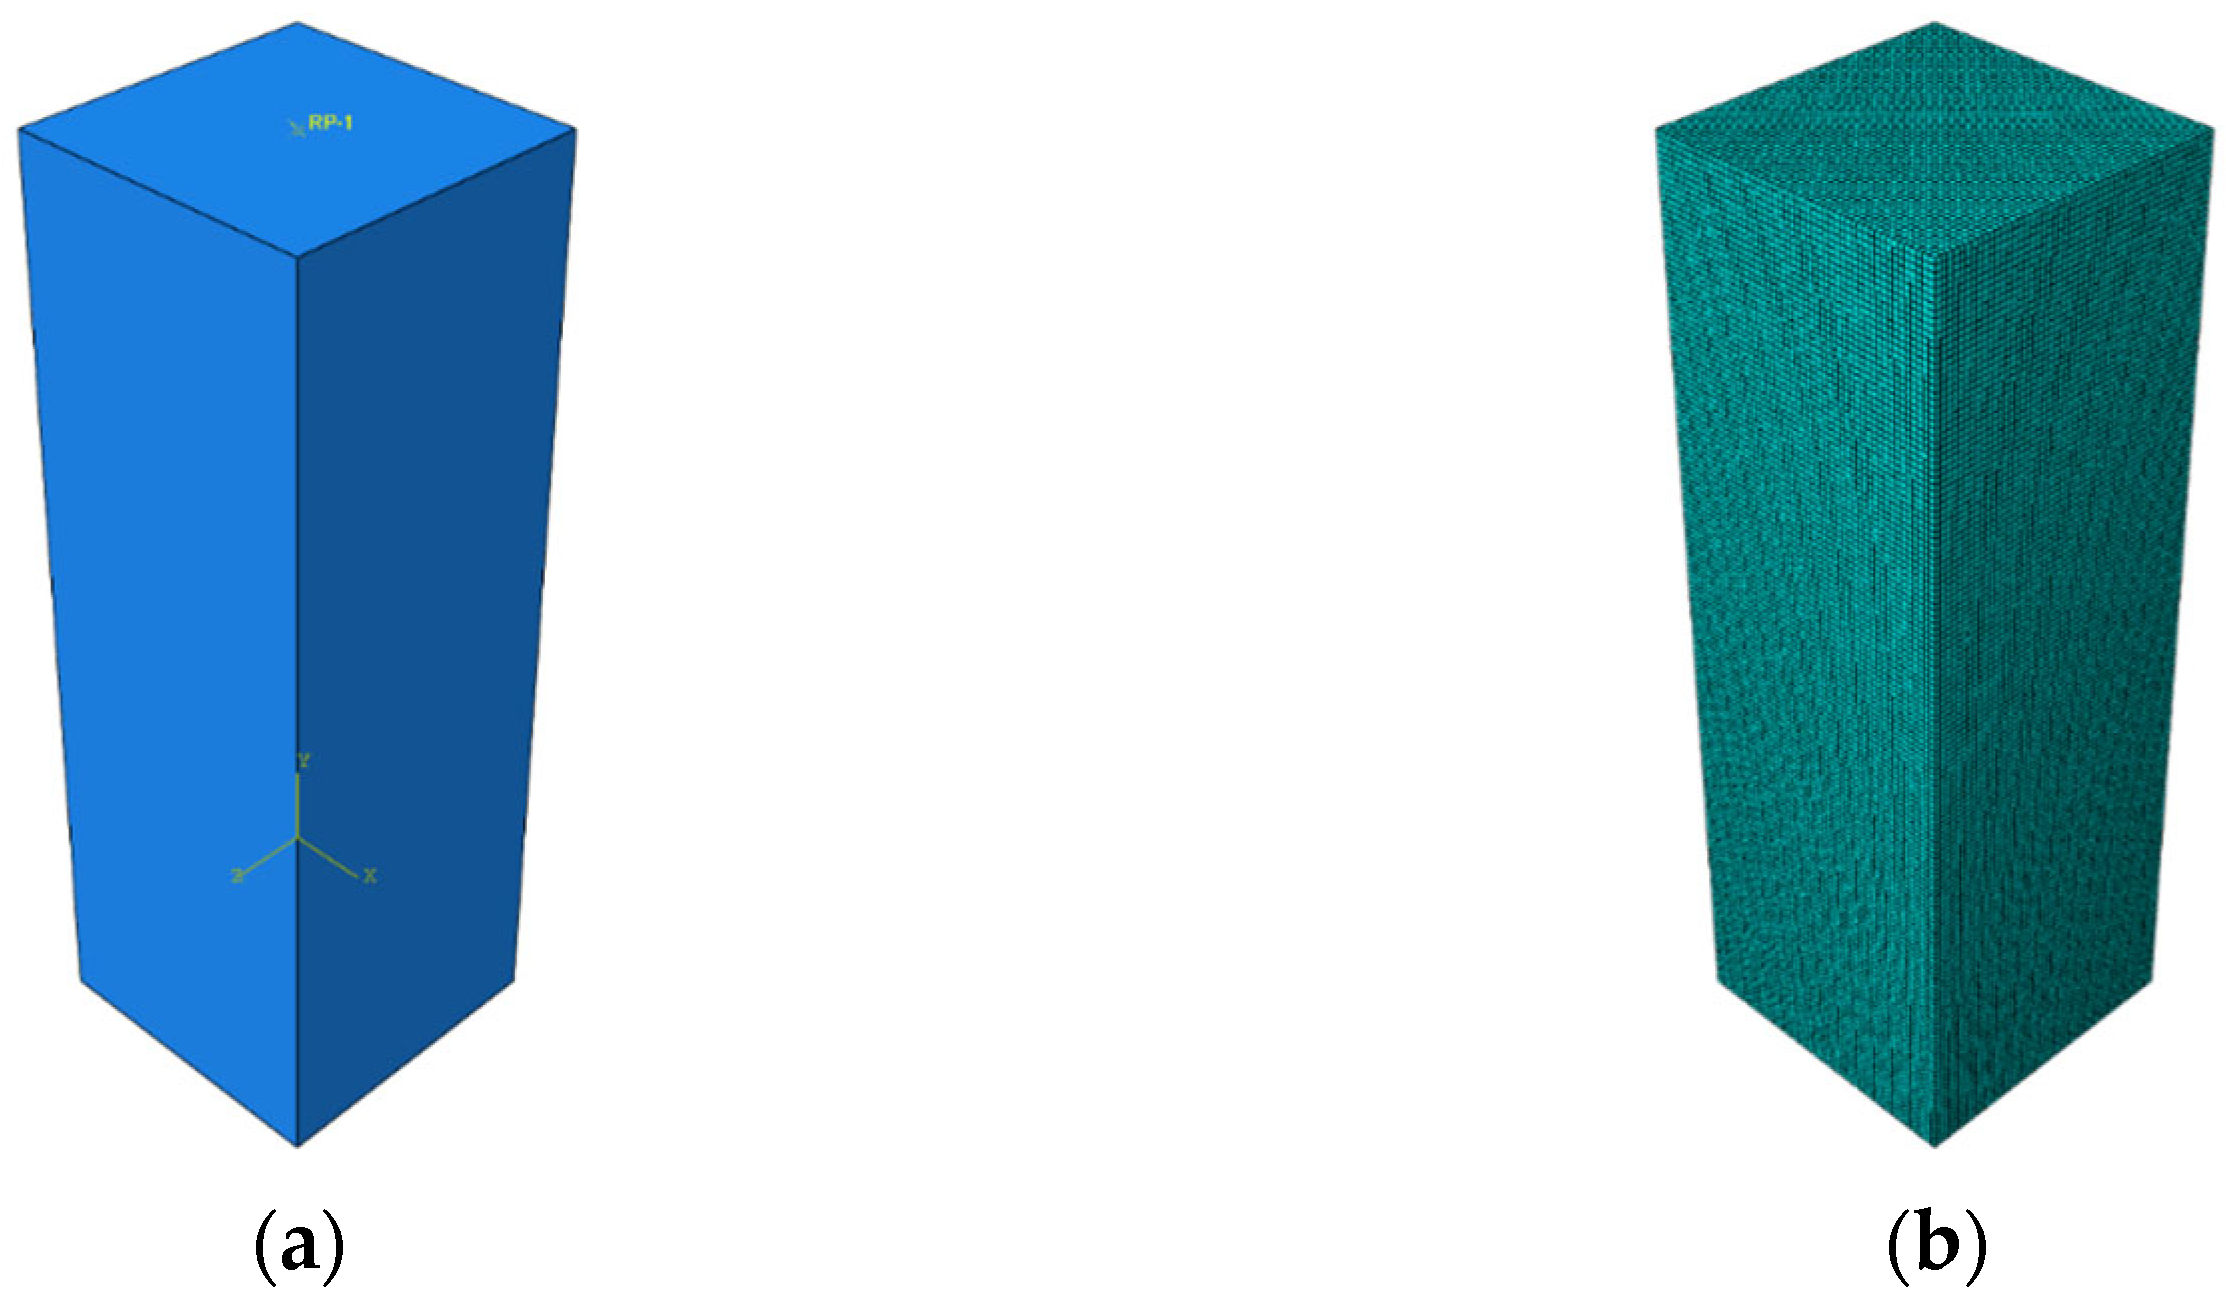
3.1.1. Modeling and Meshing

In macroscopic simulations, concrete is idealized as a continuous and homogeneous medium. The core principle of this modeling approach lies in the deliberate omission of its intrinsic mesoscale heterogeneities—such as the aggregate distribution, the pore structure, and the interfacial transition zone (ITZ) between the aggregate and mortar—in order to significantly enhance computational efficiency and maintain compatibility with the framework of continuum mechanics.
The prismatic specimen geometry (100 mm × 100 mm × 300 mm) was discretized using 8-node linear brick elements (C3D8R) with a convergence-optimized mesh density, yielding 7624 elements in total, as shown in Figure 5.
The plasticity parameters for the Concrete Damaged Plasticity (CDP) model are summarized in Table 3. The compressive behavior of concrete integrates Equations (11)–(13), and compressive damage parameters of the concrete were derived by Equations (18)–(20). Details under different numbers of freeze–thaw cycles are presented in Table 5.
The actual compressive stress of the concrete σc,true, the inelastic strain ε ~ c in , and the damage factor dc were input into the CDP model. Through the control variable method, the tensile behavior and associated tensile damage parameters were prescribed according to GB/T 50010-2010 [15], thereby minimizing the influence of secondary variables.

3.1.2. Implementation of Freeze–Thaw Damage

In the macroscopic model, the freeze–thaw degradation of concrete is indirectly represented through the adjustment of the constitutive model parameters in the Guo Zhenhai stress–strain formulation. The full-curve control parameters vary with the number of freeze–thaw cycles. The control parameters a and b are shown in Equations (3) and (4) and Table 2. These parameters capture the loss of stiffness and strength caused by the freeze–thaw exposure. Therefore, while the compressive damage factor reflects the evolution of the mechanical damage under loading, the underlying material degradation due to freeze–thaw cycles has already been embedded in the constitutive curve itself through experimentally derived stress–strain data.

3.1.3. Boundary Conditions and Loading Mode

The simulation was conducted using a static analysis step. To replicate mechanical coupling, rigid plates were applied to the top and bottom surfaces of the specimen, with a friction coefficient of 0.2. The bottom plate was fully constrained, while a vertical displacement control load of −5 in the axial direction (U2) was imposed on the top plate. Additionally, a smoothed amplitude curve was used to regulate the loading process. The defined interaction and boundary conditions are illustrated in Figure 6.

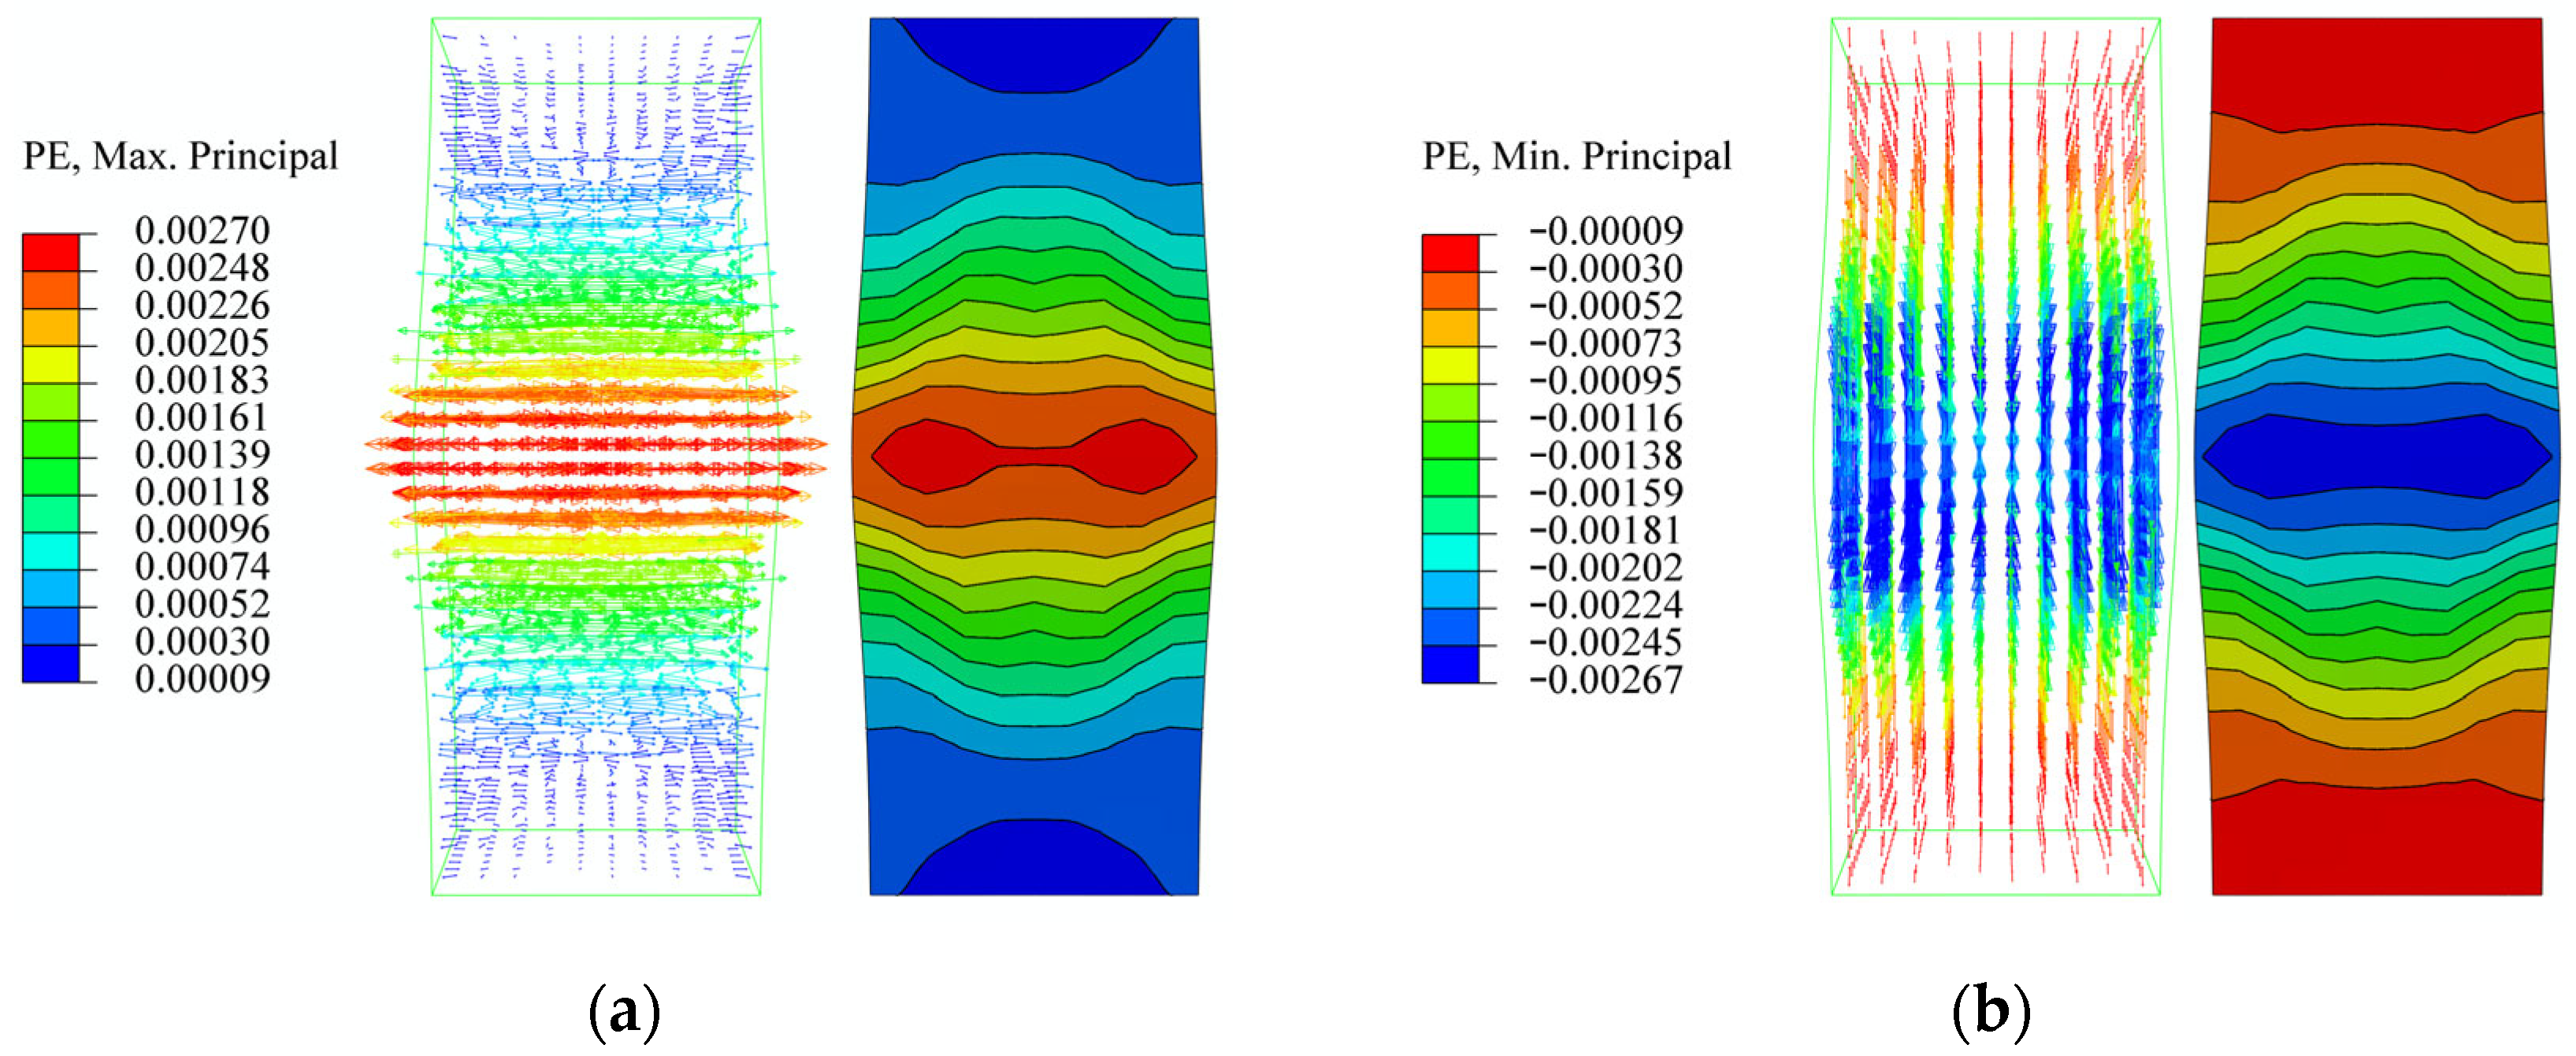
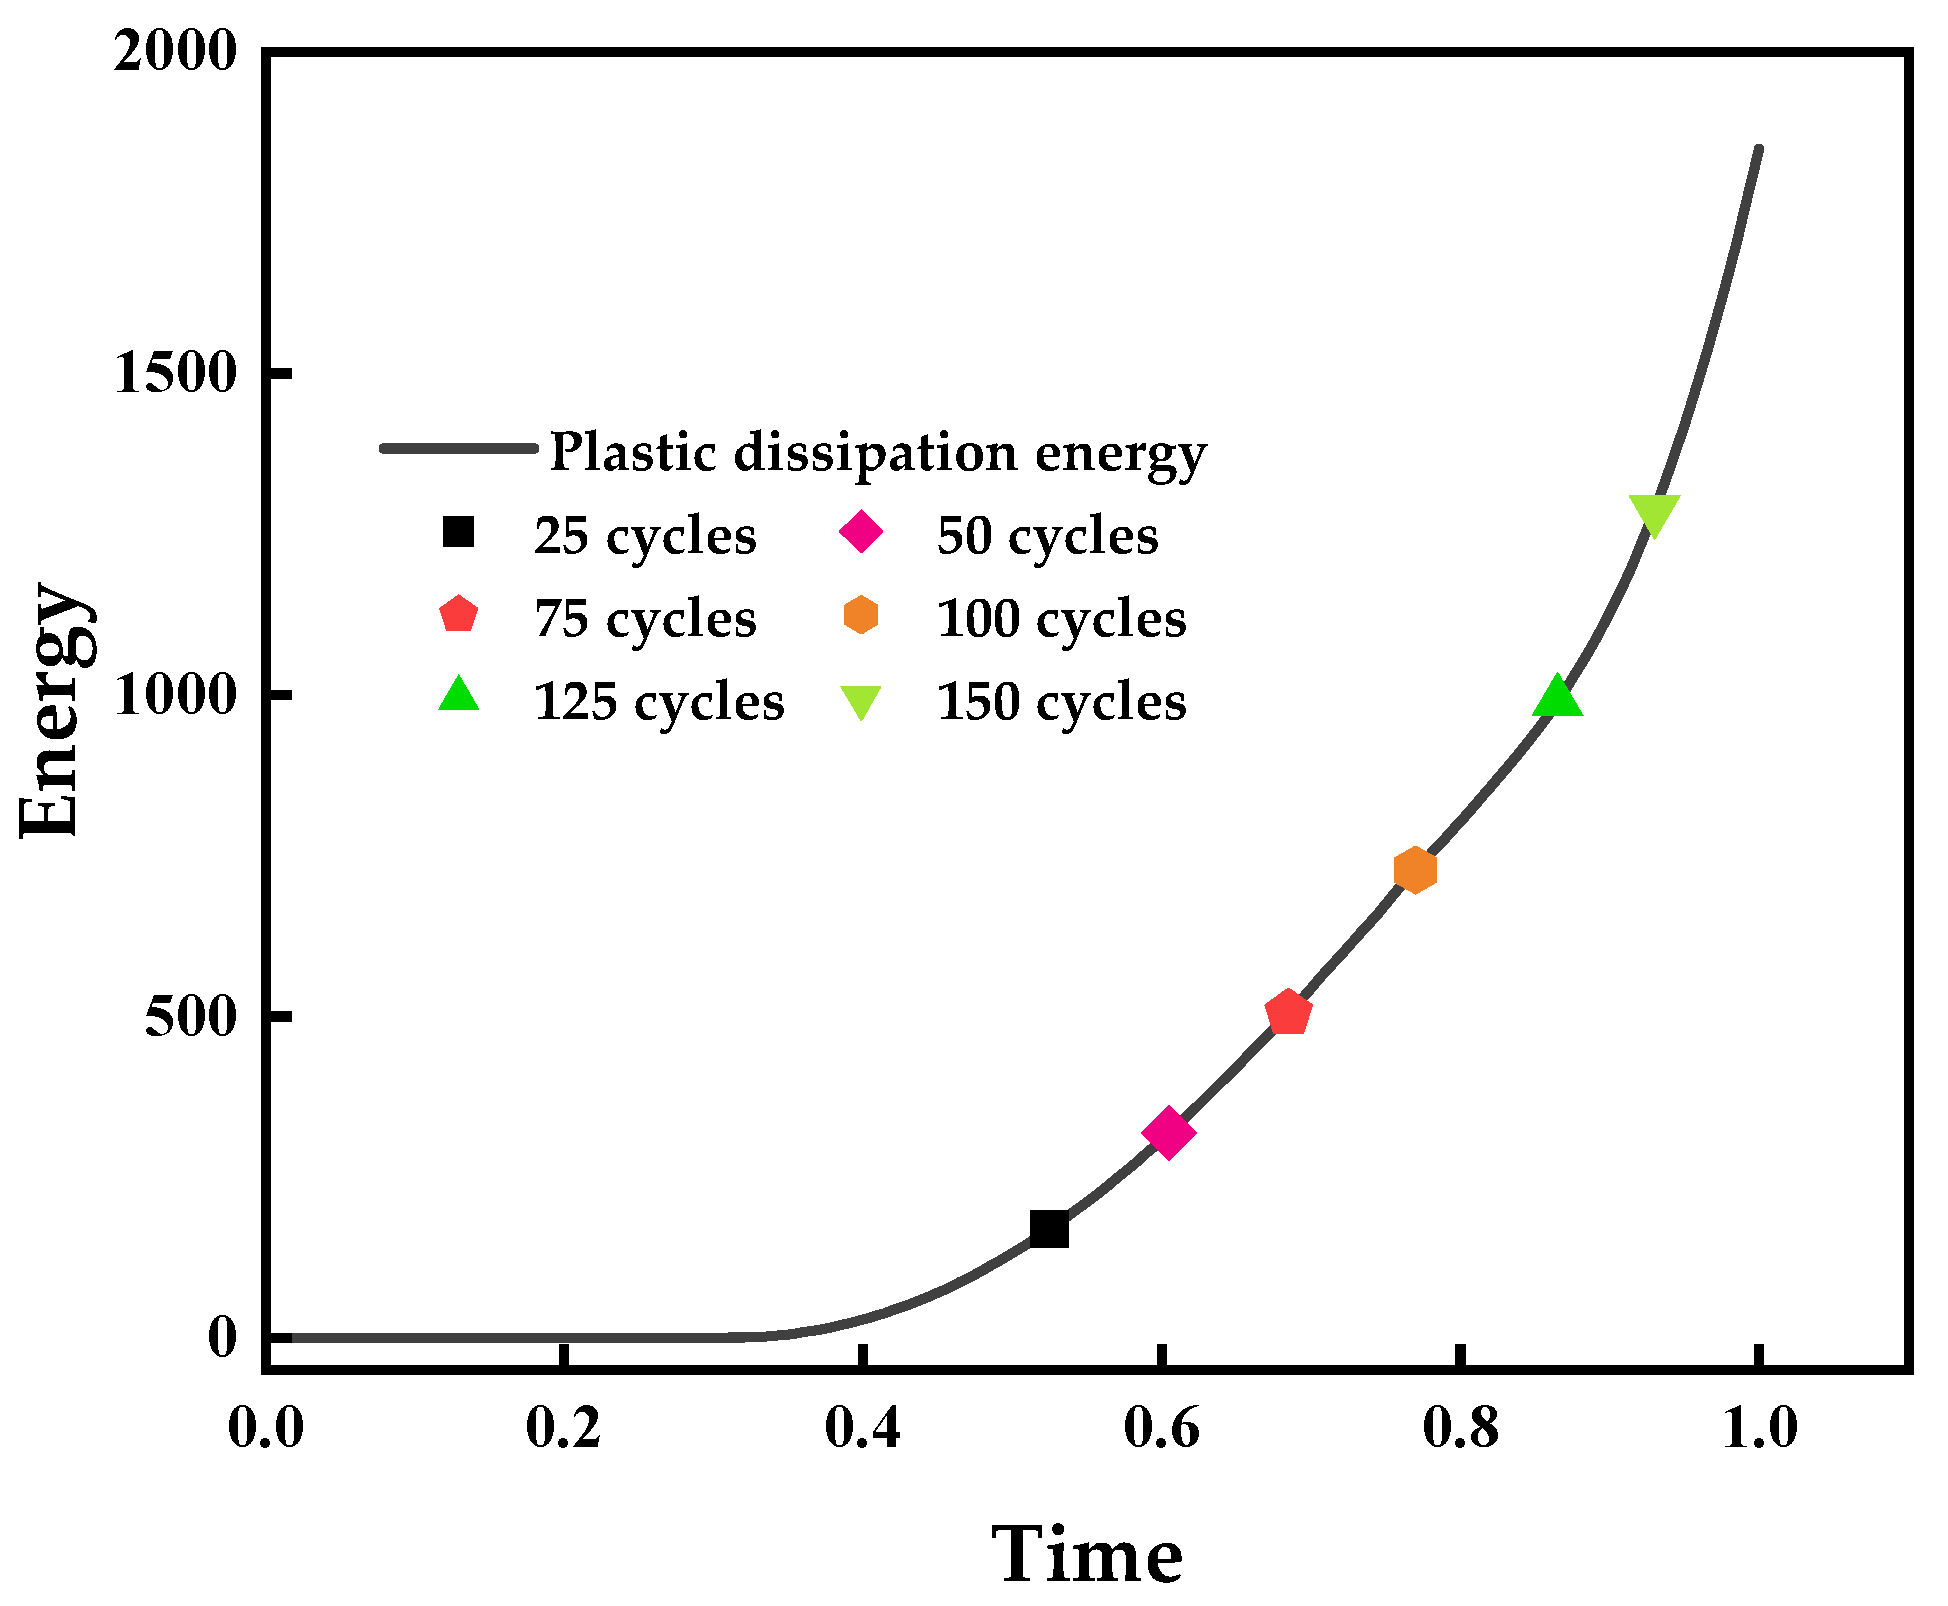
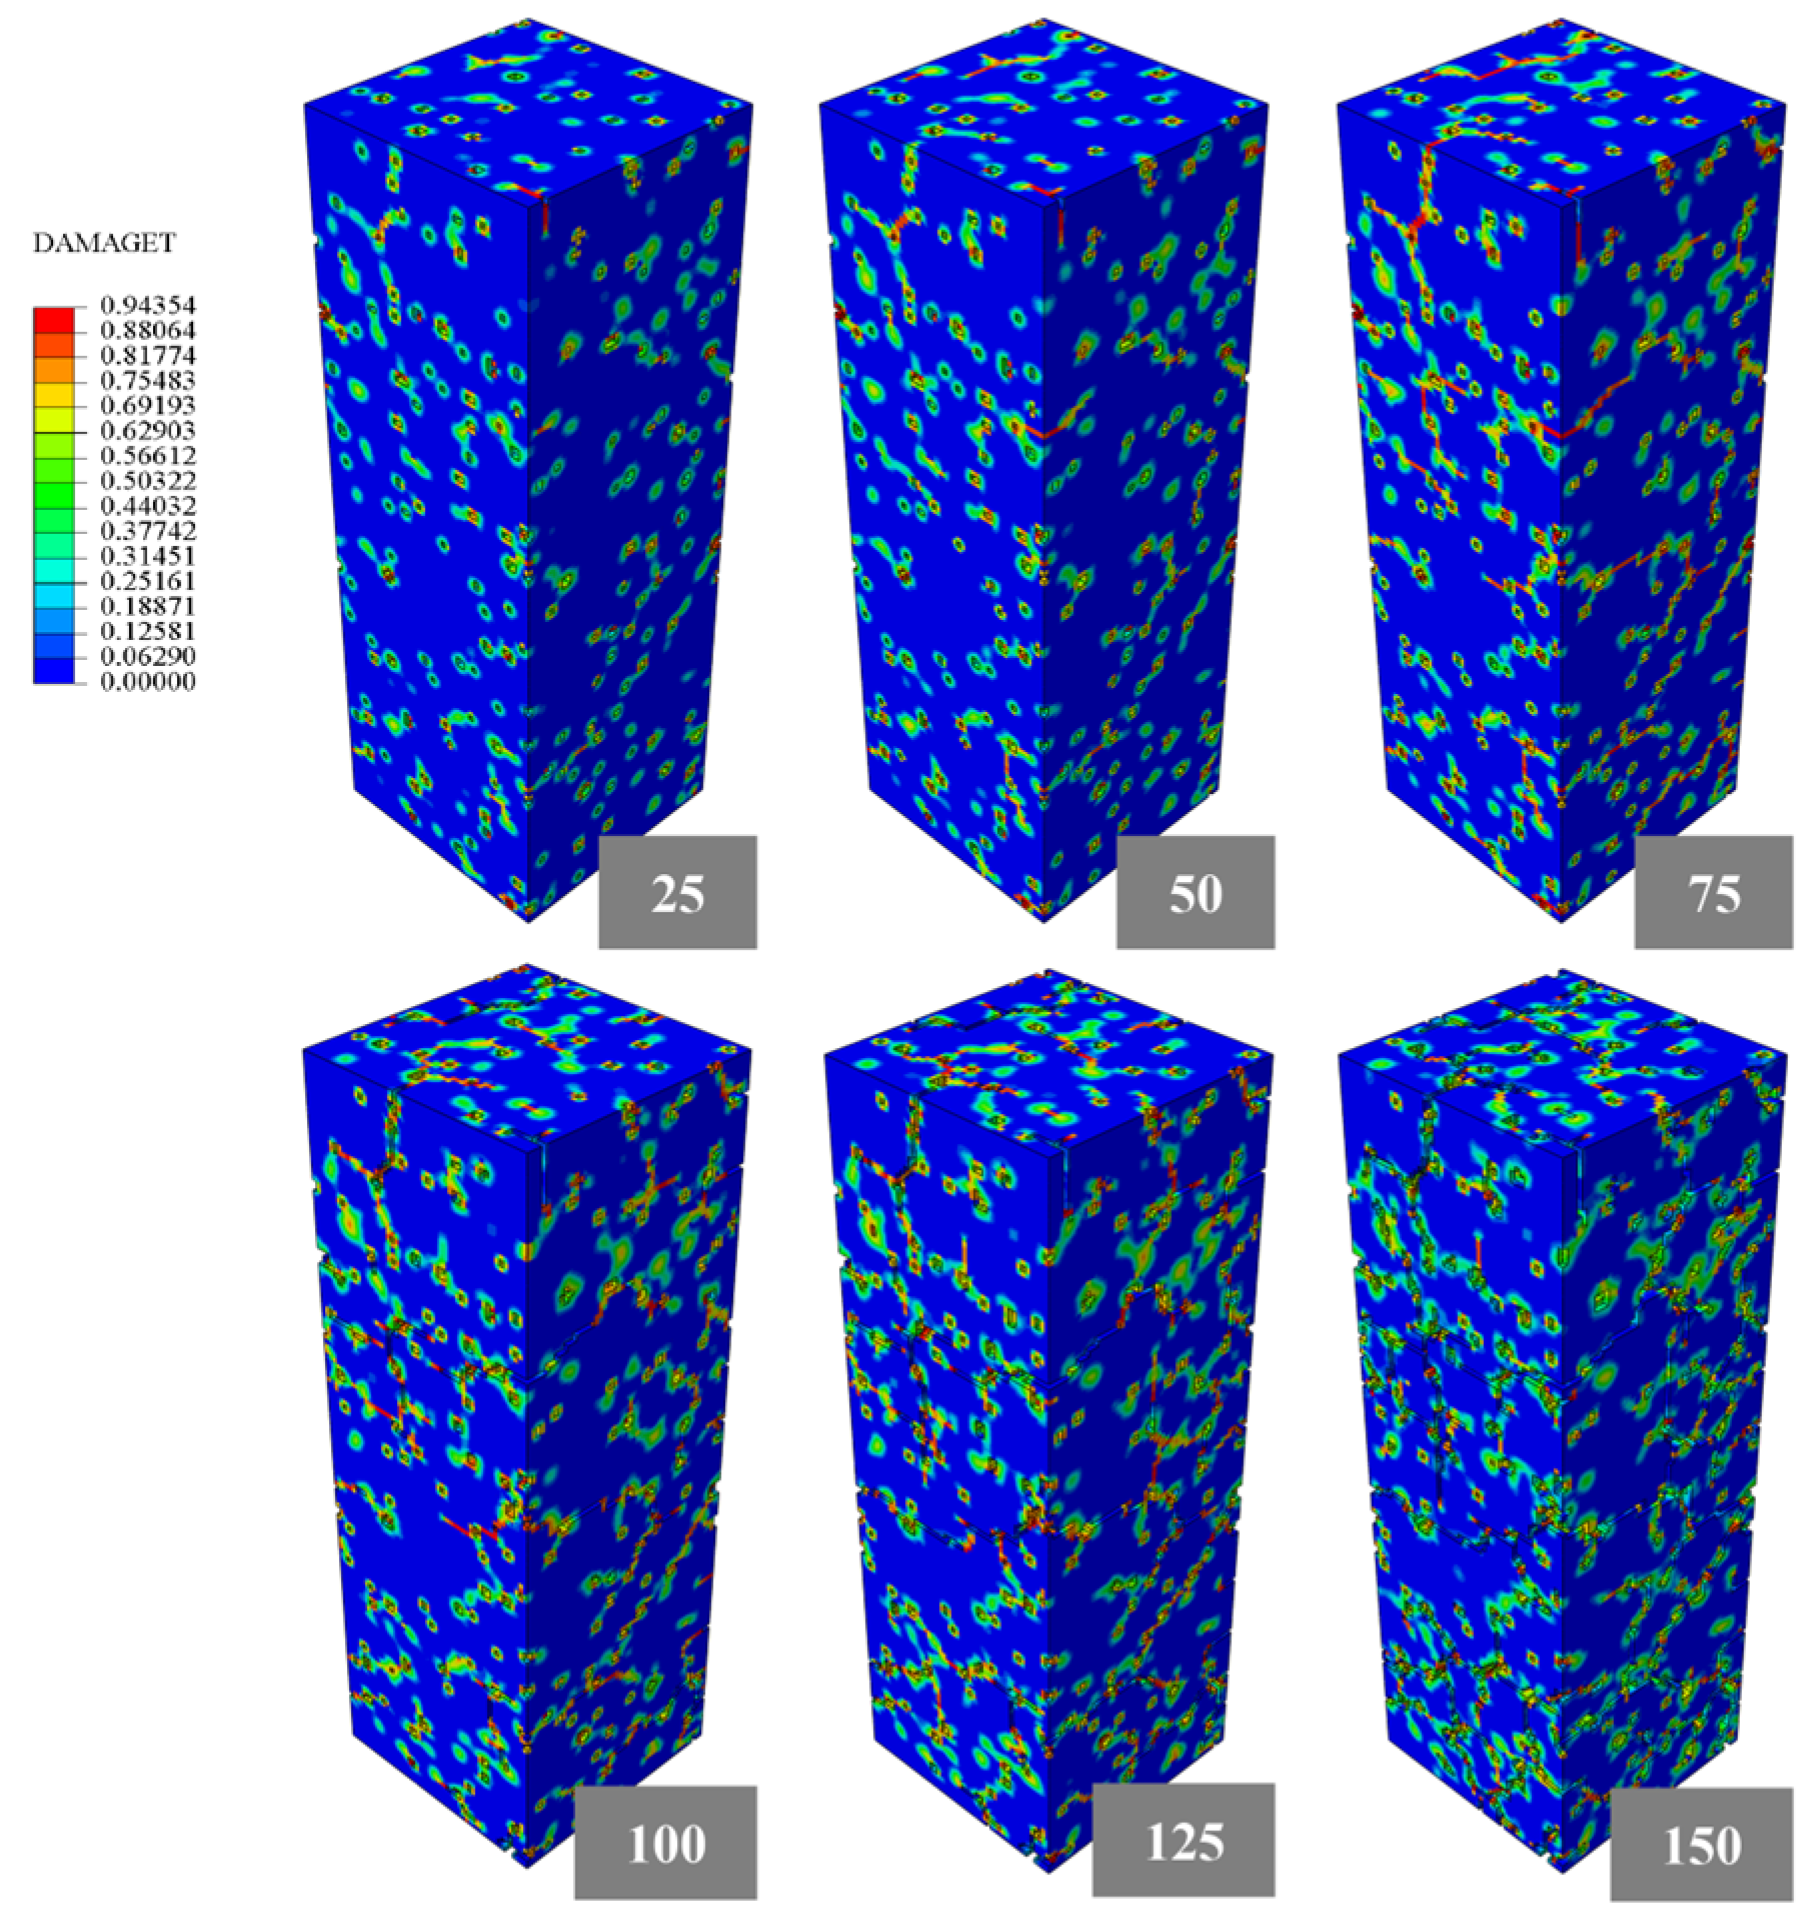
3.2. Macroscopic Simulation Results

According to GB/T 50010-2010 [13], the ultimate compressive strain εcu is defined as the strain at 0.5σcu in the descending branch of the concrete stress–strain relationship. The plastic strain distribution of concrete without freeze–thaw is shown in Figure 7.
It can be observed that the direction of the maximum plastic strain is aligned with that of the maximum principal stress. The direction of the minimum plastic strain corresponds to the crack propagation paths, which is consistent with the failure mode described in reference [14], indicating that the simulation results are reliable.
Figure 8 presents distributions of the longitudinal section of the compressive damage factor in concrete under different numbers of freeze–thaw cycles.
The results show that at failure, the maximum damage factor is concentrated in the center of the specimen and gradually decreases toward the ends, exhibiting a radially decaying distribution. Freeze–thaw cycling induces progressive material degradation and a reduction in load capacity. The central compression-induced damage zone continues to expand, and the damage factor becomes increasingly concentrated around the center. The maximum damage factor shows a monotonically increasing trend.

4. Mesoscale Modeling Analysis of Freeze–Thaw-Induced Compressive Response

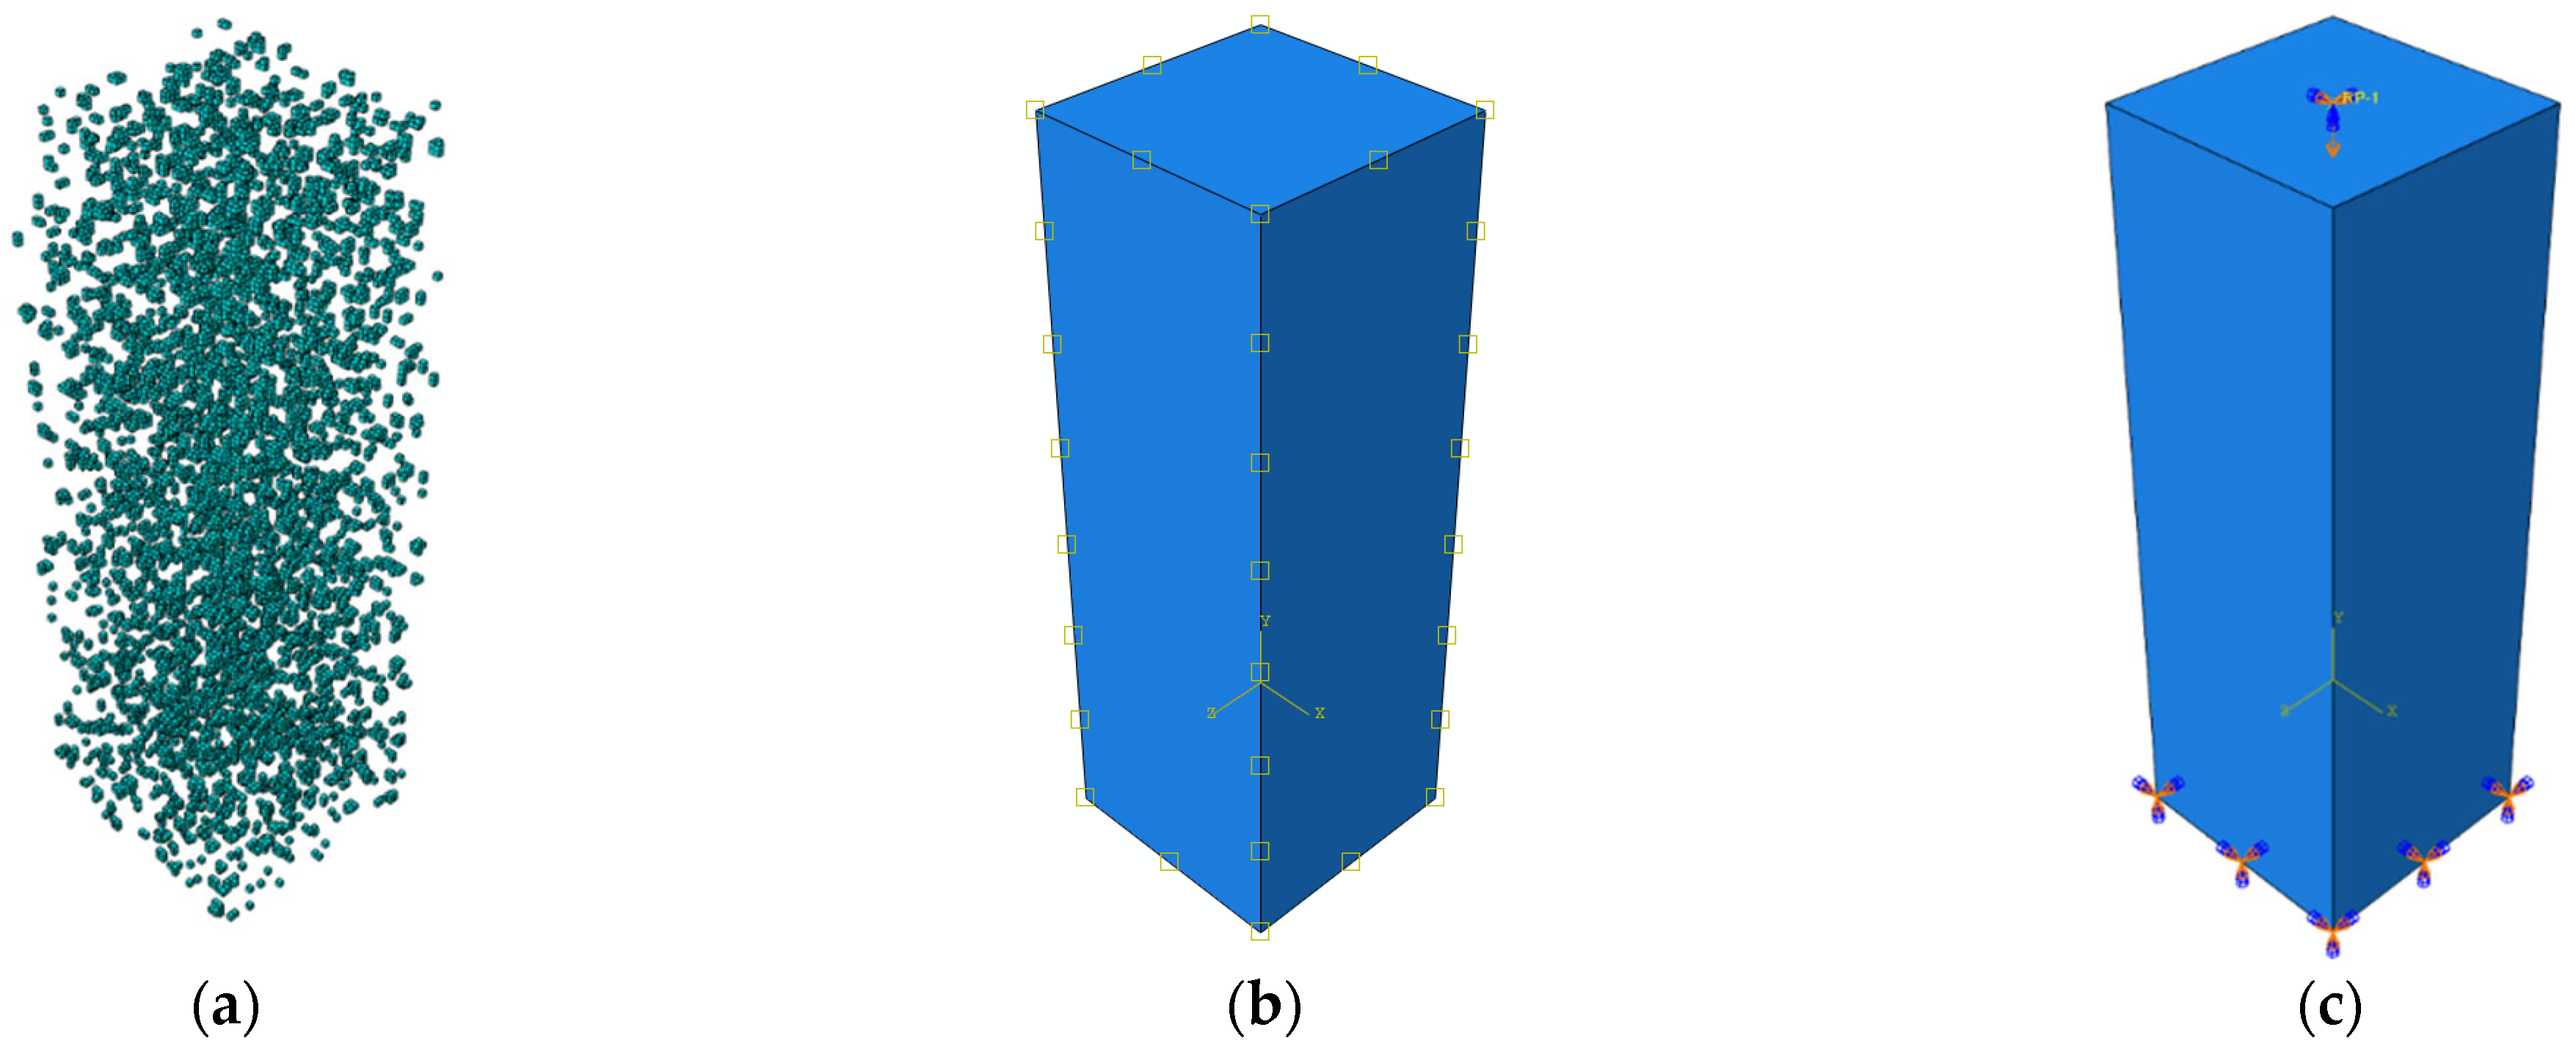
4.1. Development of Mesoscale Model

Unlike macroscopic simulations that treat concrete as a homogeneous medium, mesoscale simulations significantly enhance the accuracy of representing the multi-scale freeze–thaw damage evolution by explicitly modeling the internal constituents of concrete—such as aggregates, mortar, pores, and the interfacial transition zone (ITZ)—as well as their complex physicochemical interactions. This mesoscopic approach enables the detailed capture of the full dynamic process of the microcrack initiation, propagation, and coalescence into macrocracks during freeze–thaw cycles.
The prismatic specimen geometry (100 mm × 100 mm × 300 mm) was discretized using 8-node linear brick elements (C3D8R) with a convergence-optimized mesh density. Compared to the macroscopic model, the mesh size is refined to 2 mm, resulting in 375,000 elements, as shown in Figure 9.
The concrete material behavior is defined using the Concrete Damaged Plasticity (CDP) model, with plastic parameters listed in Table 4. The compressive behavior and damage parameters of the concrete without freeze–thaw cycles are provided in Table 5. The process of damage and failure is directly simulated using ABAQUS finite element software, coupling the freeze–thaw cycling and mechanics. It is important to emphasize that in the mesoscale model, the damage factor derived from the CDP model is solely used to characterize the mechanical damage of the concrete under axial compression. The material degradation caused by freeze–thaw cycles is directly simulated using the equivalent plastic dissipation energy method.

4.1.1. Advanced Freeze–Thaw Modeling Methodology

Conventional simulations of concrete under freeze–thaw conditions commonly adopt sequential thermo-mechanical coupling approaches. However, these constitutive models only consider the evolution of the thermal stress induced by temperature changes, while neglecting the expansive damage mechanism caused by the transition and migration of pore water during the freezing and thawing process [31,32,33]. To address this limitation, this work adopts the equivalent plastic dissipation energy method proposed by Rong-xin Peng et al. [34]. Based on the theory of hydrostatic and osmotic pressure, this method reveals that the essence of freeze–thaw damage arises from the expansive effect induced by pore water migration during the freezing phase. Accordingly, a two-stage modeling simplification is proposed: (1) the thawing phase damage can be ignored and (2) N freeze–thaw cycles are considered equivalent to quasi-static expansion loads. The complex cyclic process is thus transformed into a monotonic loading sequence. A quantitative relationship is established between the freeze–thaw damage evolution and fracture energy release. The relationship between freeze–thaw cycles and the plastic dissipation energy density is expressed in Equation (27).
D ped = 0.0101 n 2   +   1.1966 n   +   21.535
In the mesoscopic model, the CDP parameters of unfrozen concrete (0 cycles) were kept constant. Then the freeze–thaw damage is introduced into the model by the equivalent plastic dissipated energy method (Equation (27)), which transforms the N freeze–thaw cycles into a single cumulative damage field and realizes the simulation of the freeze–thaw damage process.

4.1.2. Pore Water Assignment and Boundary Implementation

Concrete’s mechanical performance is intricately governed by the pore water saturation content. Although the weight of the pore water is less than 10%, its volume proportion exceeds 20%, significantly affecting the material’s mechanical behavior and durability [35]. In this study, a mesoscale simplified modeling approach is used to simulate the distribution of pore water via a Python (v3.14)-based algorithm. Only the pore water is explicitly modeled within the concrete, while all other internal components are treated as a homogeneous concrete matrix. Aggregates, mortar, and the interfacial transition zone (ITZ) are neglected to achieve a simplified mesoscopic model. The pore size is specified within the range of 2–4 mm, and the volume proportion of the pore water under saturated conditions is controlled at 15%. As shown in Figure 10, the numerical model successfully reproduces the non-uniform distribution characteristics of the pore water.
A transient heat transfer analysis was performed using a dynamic explicit algorithm under quasi-static conditions, with a mass scaling factor empirically set to 10,000. The analysis output included the plastic dissipation variable (ALLPD). A predefined temperature field was applied, monotonically and smoothly decreasing to –25 °C, to simulate the freeze–thaw environment and investigate the evolution of the pore structure. The equivalent plastic dissipation energy approach was used to characterize the damage state of the concrete under different numbers of freeze–thaw cycles. The boundary conditions used in the heat transfer analysis are illustrated in Figure 10b.
The compressive behavior of concrete after freeze–thaw cycles was also simulated using an explicit dynamic analysis approach. A restart analysis was employed, in which the results of the preceding heat transfer analysis were imported as predefined fields. In the mesoscale model, the upper and lower rigid pads were removed; instead, the bottom surface was fully constrained, and a displacement-controlled loading scheme of −0.3 axial U2 was applied on the top surface. This approach was adopted to avoid additional fracture energy effects caused by non-periodic freezing. The boundary conditions for the compression simulation are illustrated in Figure 10c. Moreover, the USDFLD subroutine was used to simulate concrete cracking. A plastic strain threshold was defined to trigger the element failure criterion, thereby eliminating the residual load-bearing capacity of failed elements and improving the accuracy of the numerical solution.

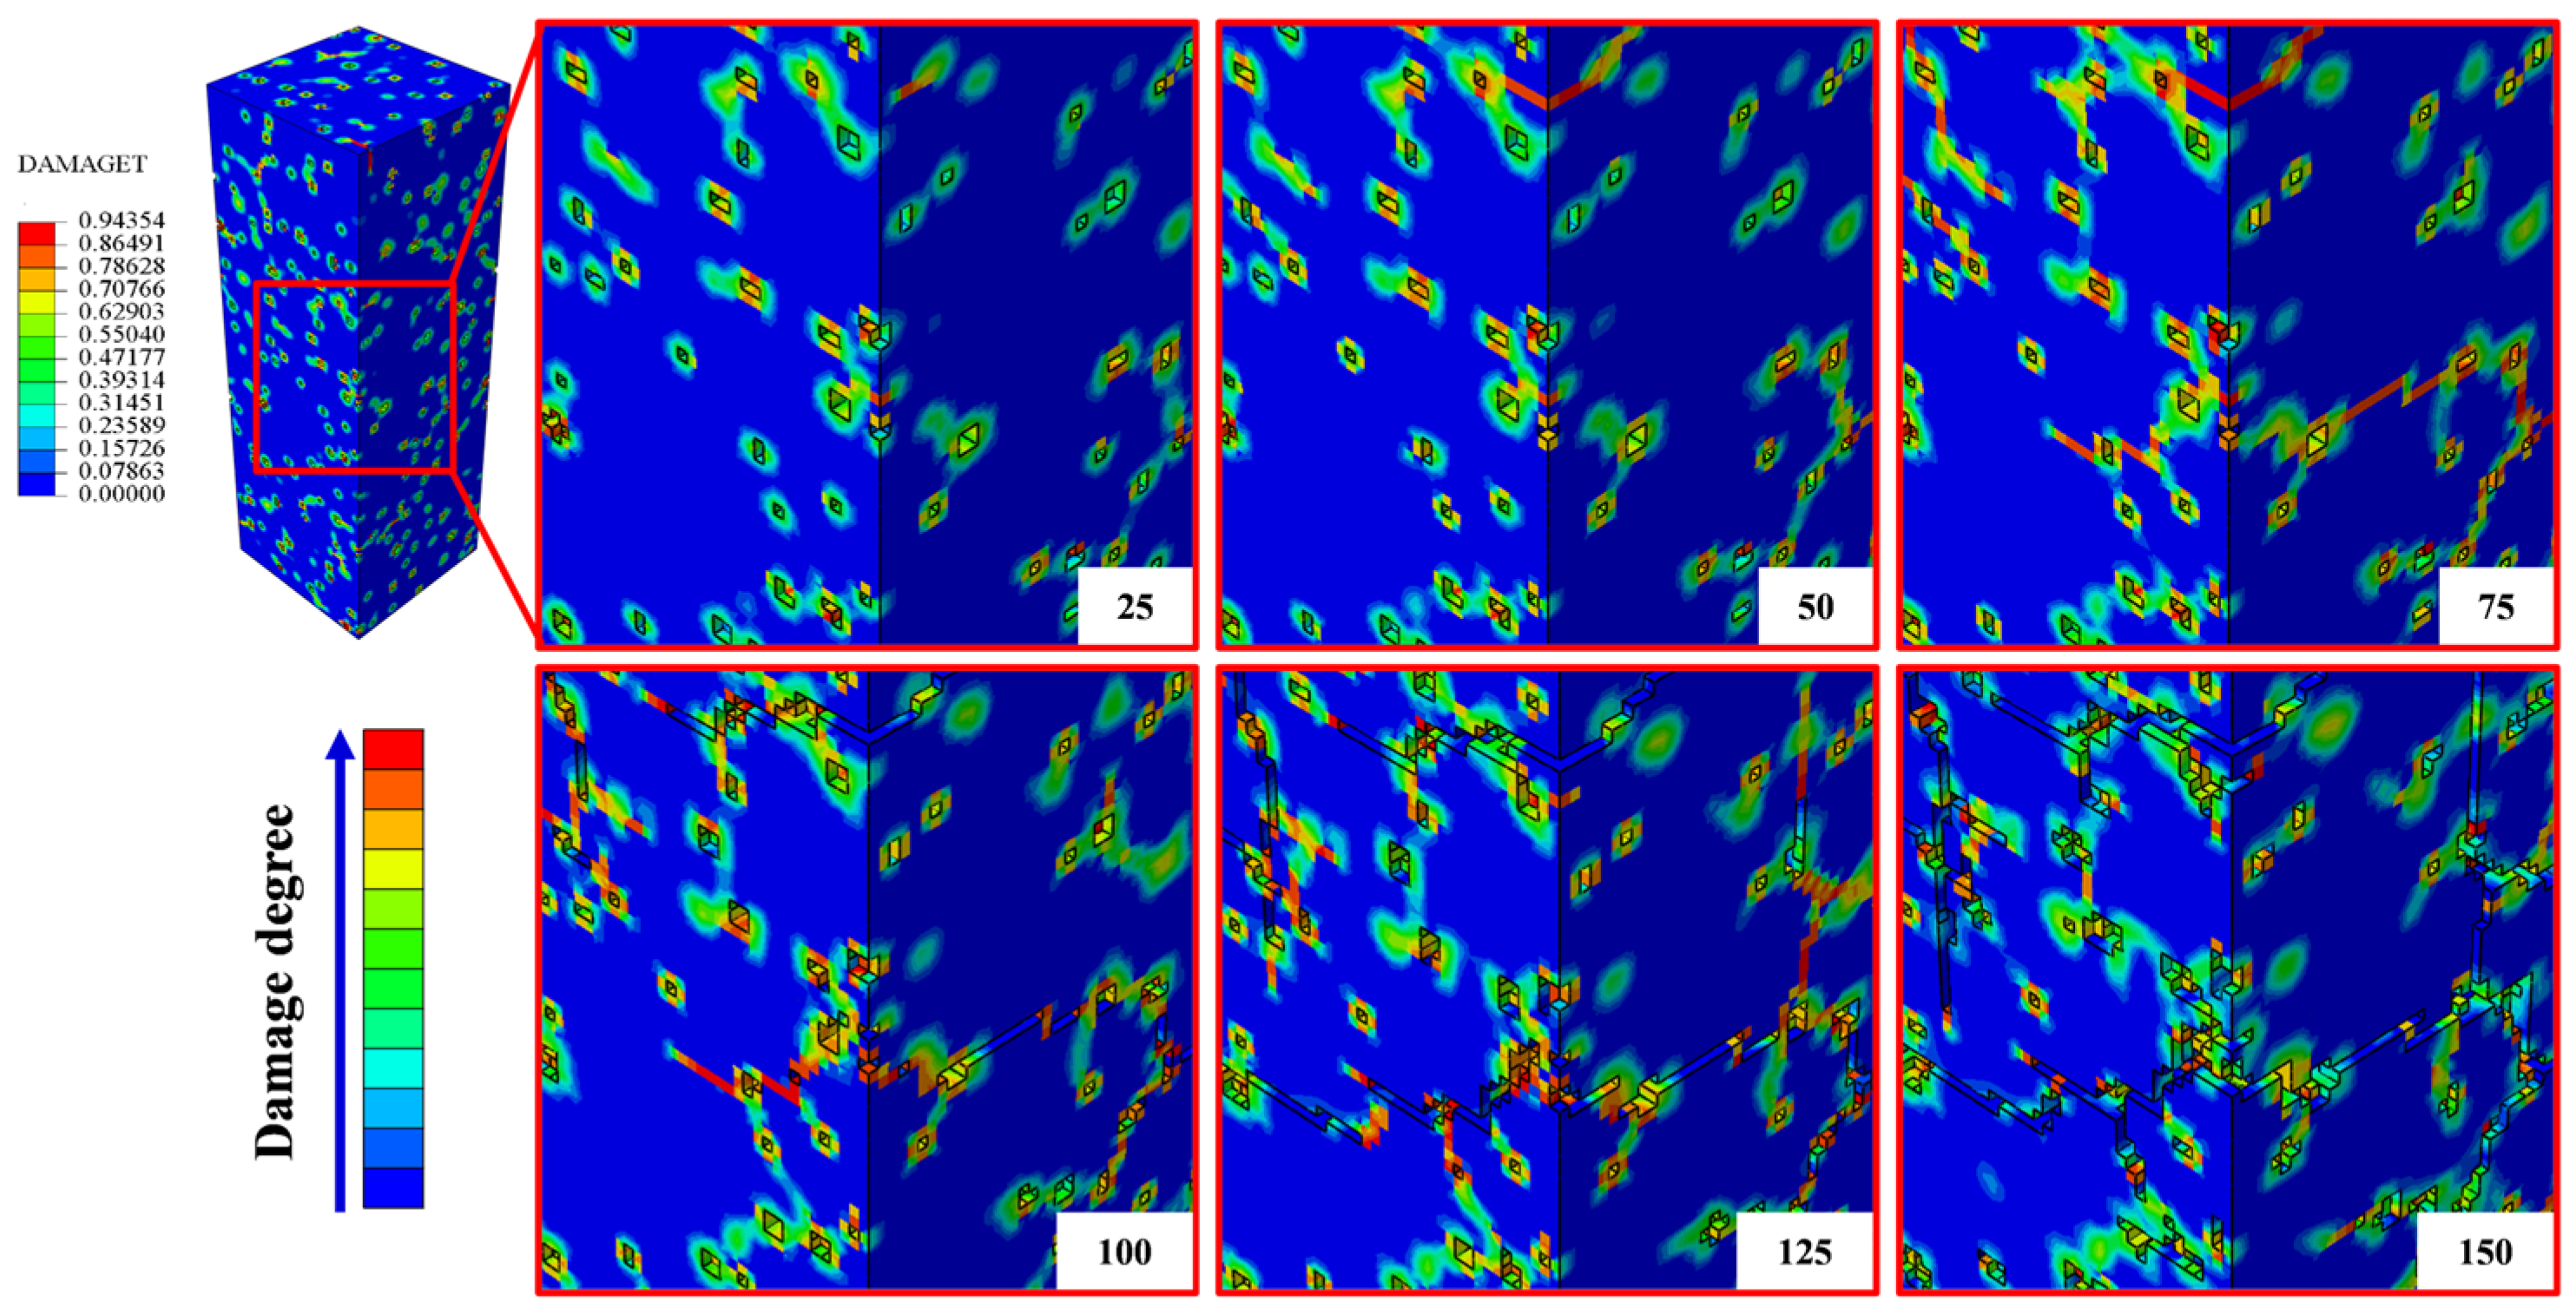
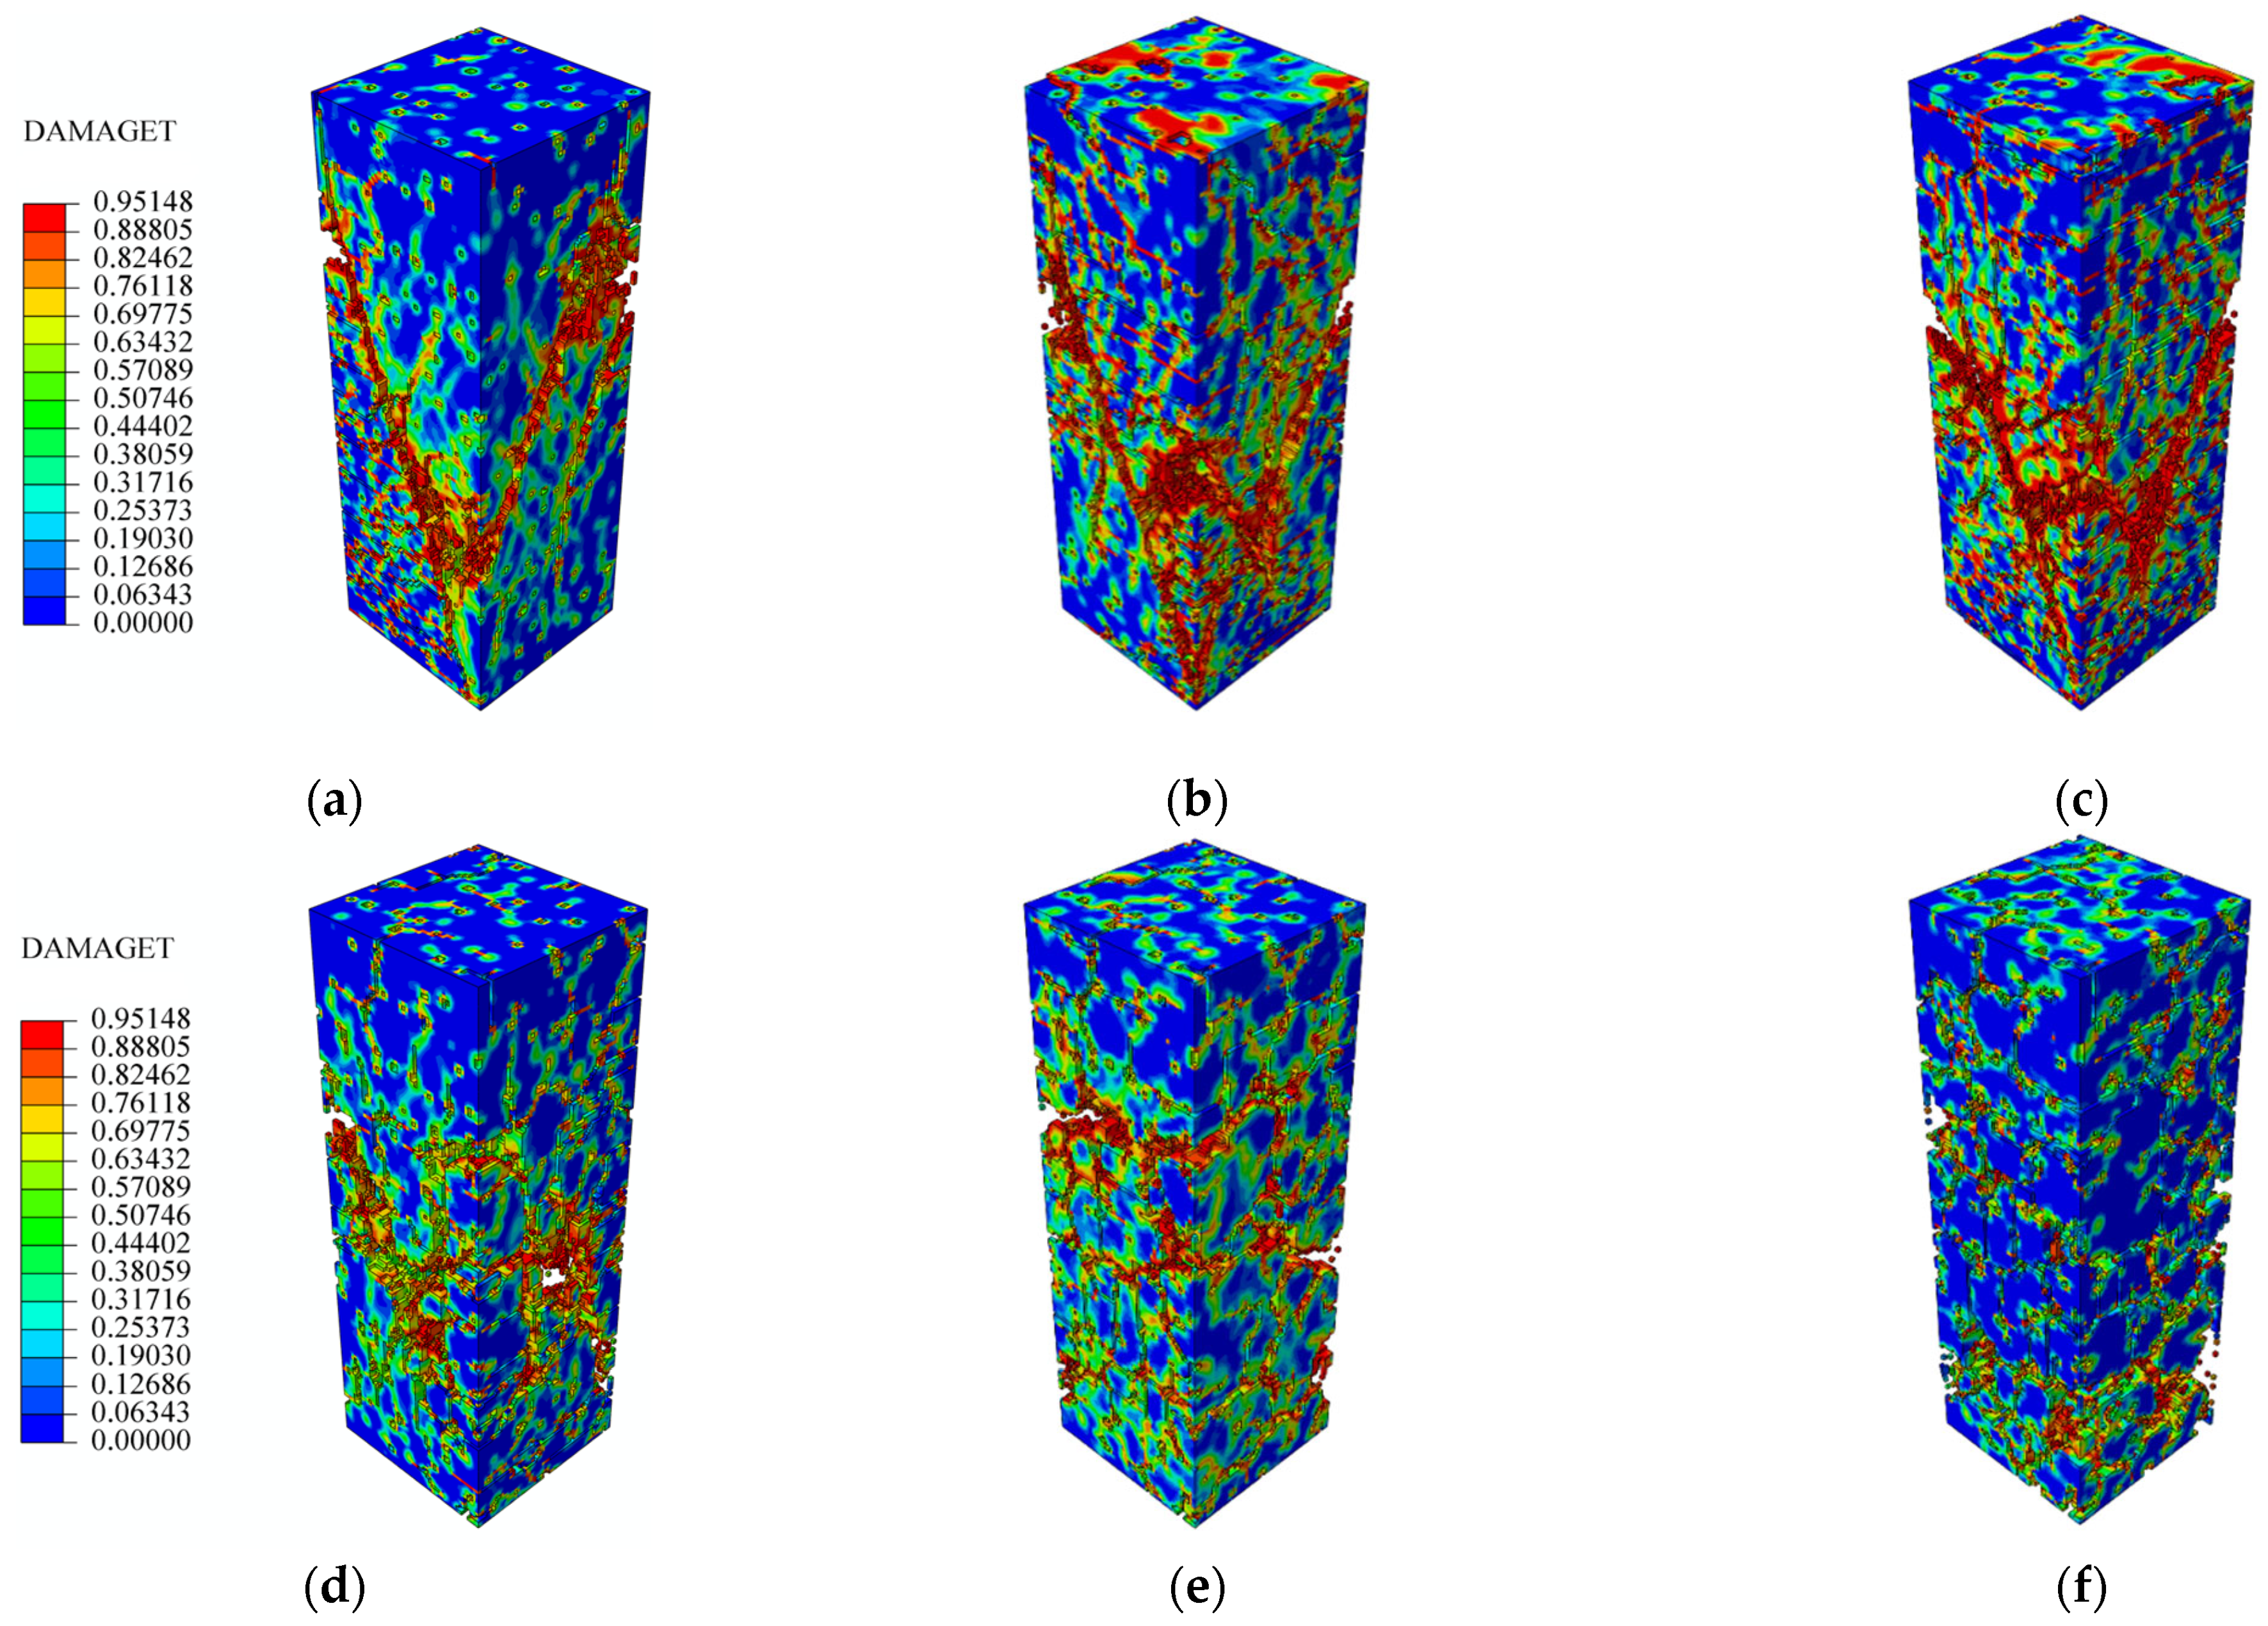
4.2. Mesoscopic Simulation Results

The plastic dissipation energy data were extracted using the ABAQUS post-processing module. The volume conversion was computed using Equation (21), and the transformation results of plastic dissipation energy are shown in Figure 11.
The results reveal that the phase transition and migration of the pore water induce cracking and expansion effects under a temperature gradient, triggering the microcrack initiation and multi-scale propagation. This leads to a monotonically increasing trend in the equivalent plastic dissipation energy.
Under freeze–thaw cycles, the damage progression of concrete exhibits significant heterogeneity, as shown in Figure 12 and Figure 13.
The internal damage develops through three stages, including the microcrack density, crack extension, and linking of cracks, with the increase in freeze-thaw cycles. This is attributed to the accumulation of frost heave pressure in the pore water, which degrades the microstructure. The surface damage evolves more rapidly, following a progressive failure mode characterized by “surface roughness—microcrack formation—macroscopic spalling”. Stress concentrations at corner regions cause failure first. Both numerical simulations and experimental observations indicate that the numbers of freeze–thaw cycles exceed 100, and the specimens enter an accelerated degradation phase, during which their structural load-bearing capacity progressively decreases.
The microstructural states of concrete after different numbers of freeze–thaw cycles were imported into a predefined field for the mesoscopic axial compression simulation. Figure 14 presents the cloud diagrams of failure mechanisms under axial compression corresponding to different freeze–thaw cycles.
Damage expands from the center of the specimen toward the upper and lower ends, with a gradually decreasing intensity. The principal crack extends along the axial path, forming a penetrating crack from the top to the bottom. Beyond 100 freeze–thaw cycles, the stiffness of the specimen declines sharply, and the region of the maximum damage factor becomes significantly concentrated towards the geometric center. At this stage, the local damage of the concrete occurs, leading to a severe reduction in load-bearing capacity. As freeze–thaw cycles increase, compressive damage expends from the local to the whole, and the specimens show irregular failure.

5. Comparison Between Simulations and Experiment

To verify the applicability of the Concrete Damaged Plasticity (CDP) model under freeze–thaw conditions, this study conducted a comprehensive evaluation of the damage accumulation characteristics and the stress–strain evolution of concrete subjected to various numbers of freeze–thaw cycles. The model validation was performed using the averaged experimental results from three specimens for each freeze–thaw stage, allowing for a consistent comparison with numerical predictions at both macro- and mesoscales.

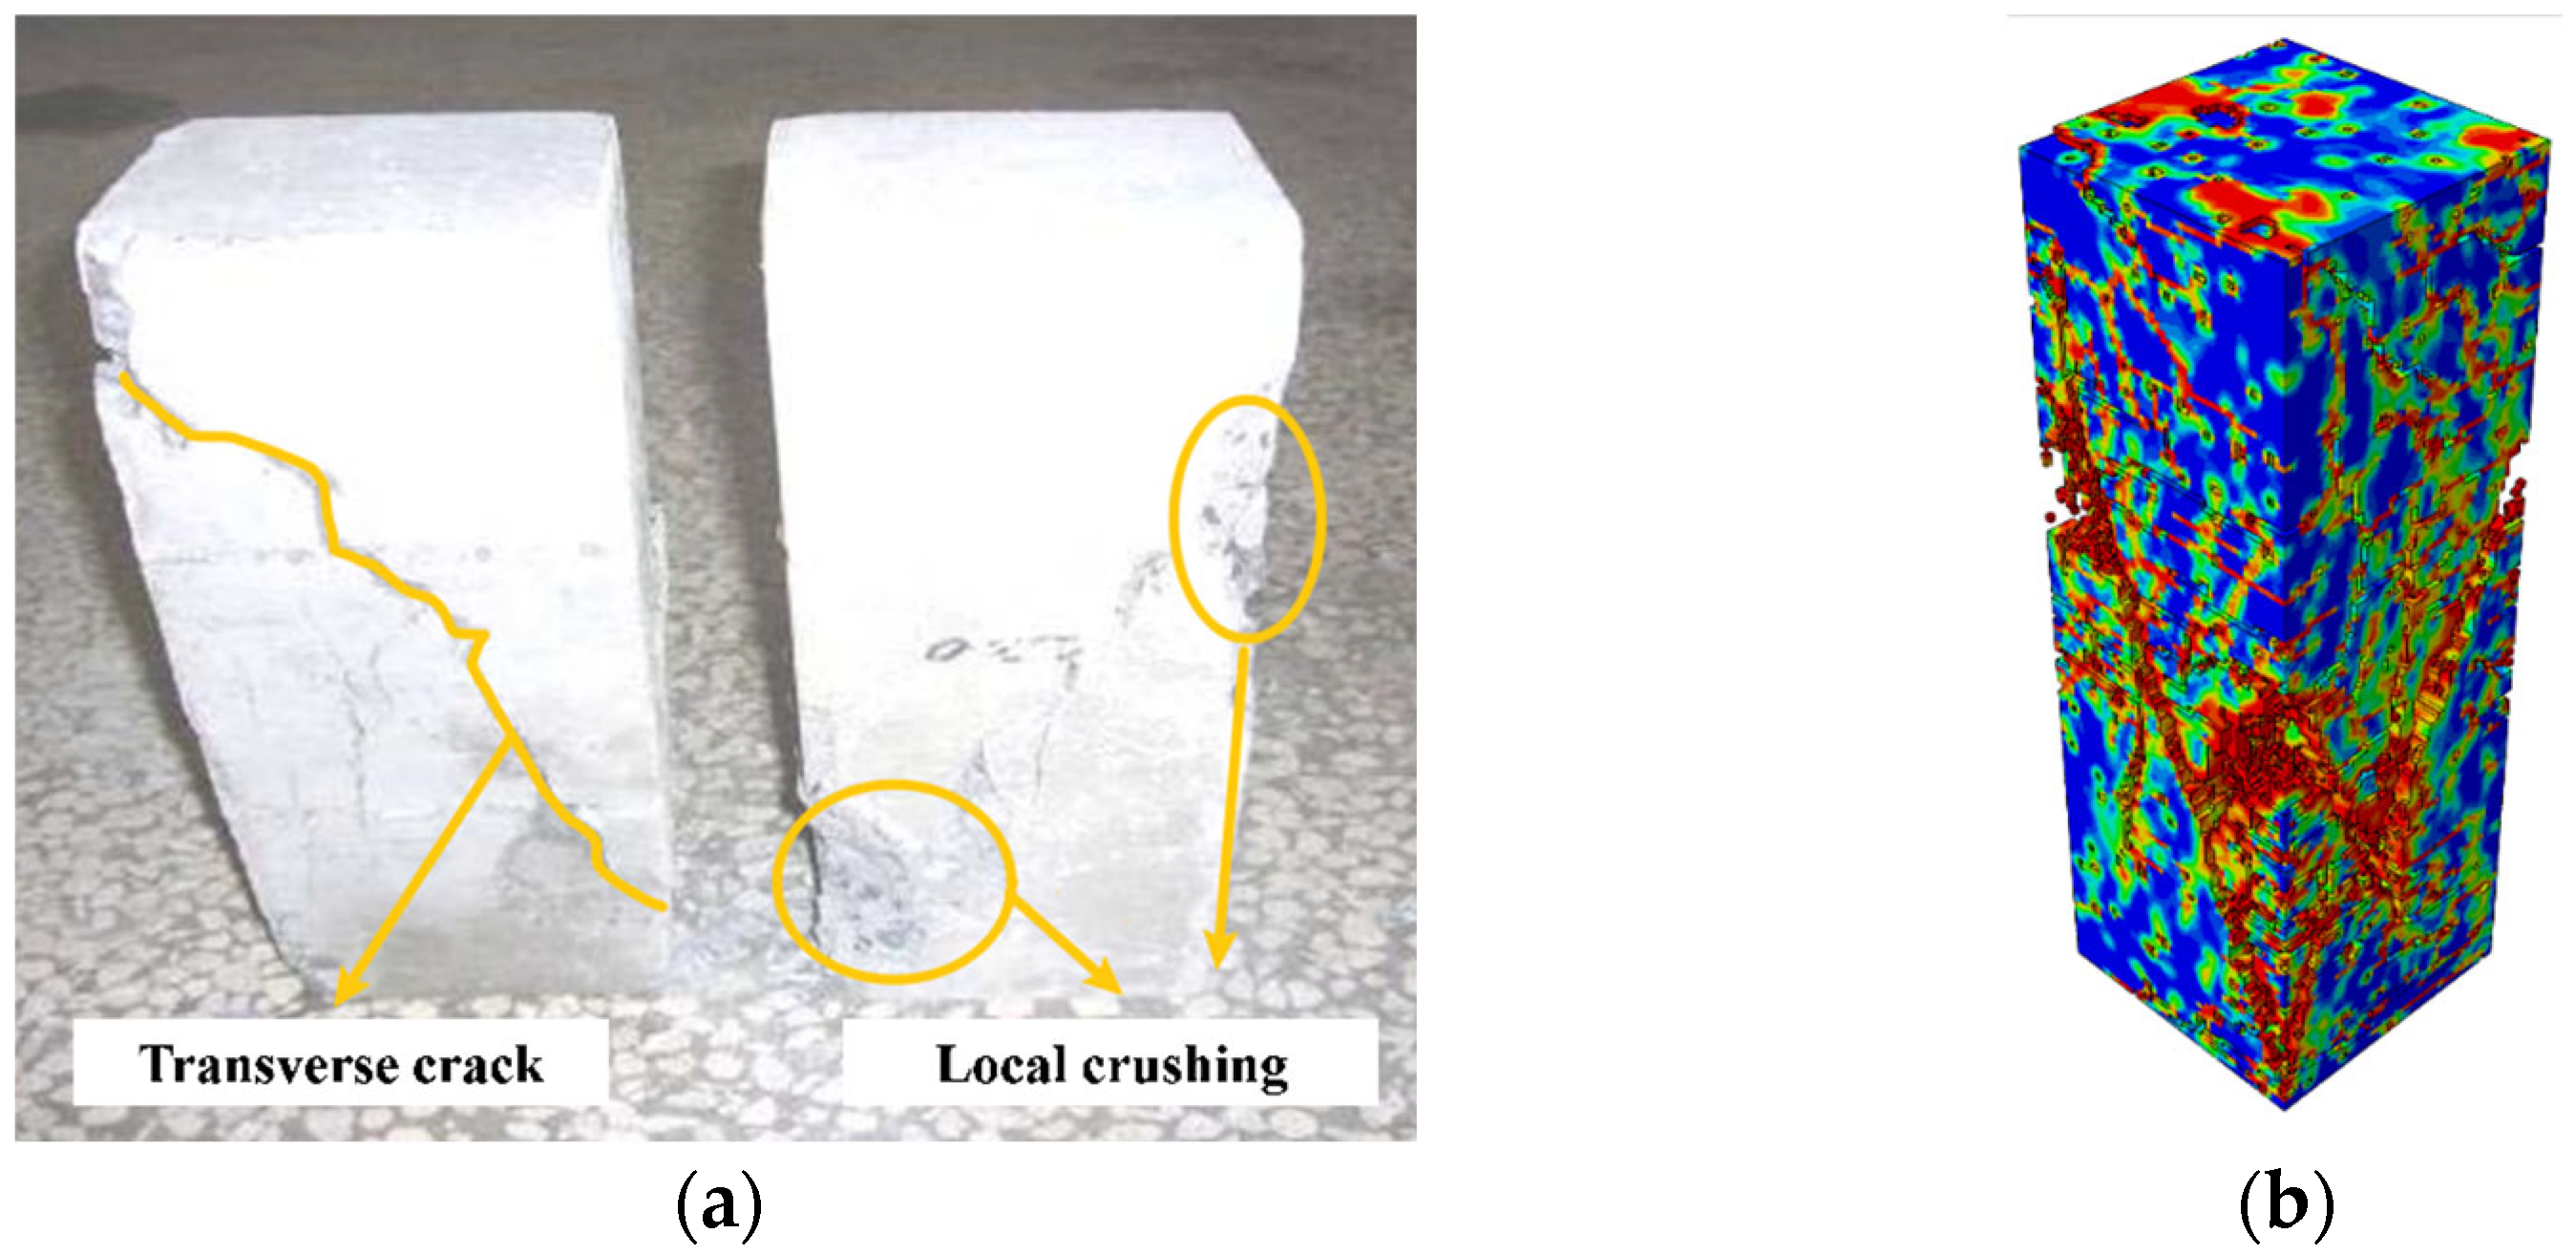
5.1. Damage Evolution and Failure Pattern Comparison

The damage evolution process obtained from the mesoscale model is shown in Figure 15. Comparatively, the actual freeze–thaw damage progression in experiments is shown in Figure 16. The experimental findings in reference [14] found that the freeze–thaw damage process of concrete is a three-stage deterioration pattern.
Figure 16 presents the experimental failure morphologies of concrete specimens subjected to 25, 50, and 75 freeze–thaw cycles. The observed damage evolution indicates a progressive surface deterioration process, which is particularly evident in the transition from 25 to 50 cycles. After 25 freeze–thaw cycles, the concrete surface shows localized scaling and minor flaking, primarily concentrated at the specimen corners and edges. With 50 cycles, the extent of the surface spalling becomes more widespread and severe, but no significant through-thickness or penetrating cracks are observed at this stage, implying that the damage remains predominantly superficial. This degradation pattern suggests that during the early- and mid-term freeze–thaw damage, the primary damage mechanism is the progressive accumulation of frost-induced tensile stresses near the surface due to the phase transition of the pore water. These stresses gradually weaken the cement paste–aggregate interface and cause the repeated detachment of surface layers. Only after 75 cycles do macroscopic longitudinal and transverse cracks begin to emerge, indicating that the internal damage has propagated and linked into a continuous fracture network.
The experimental observations in Figure 16 are consistent with the mesoscale simulation results shown in Figure 15 and Figure 17, where surface-layer elements demonstrate an early failure and plastic strain concentration, followed by a deeper damage penetration with increasing cycles. This alignment confirms that the multi-scale model reliably captures the sequence of the damage initiation, accumulation, and transition from surface degradation to structural failure under freeze–thaw conditions, and the comparison of the failure modes is presented in Figure 16.

5.2. Analysis of Axial Compressive Stress–Strain

To assess the accuracy of the macroscopic model, the peak stress and strain from the macroscopic simulation were compared with experimental results. Table 6 shows that the relative error of the peak stress is between 0.61% and 1.49%, with an average error of 0.89%. The relative error of the peak strain is between 1.07% and 2.1%, with an average error of 1.61%. Notably, the numbers of freeze–thaw cycles are more than 50, and a negative plastic strain ( ε ~ c p l < 0) is observed near the elastic yield point. To ensure numerical convergence, the damage parameter was set up to be slightly higher than 0.6σcu.
Moreover, the descending portion is significantly influenced by the plastic parameters of the CDP model and the size of the mesh, as shown in Figure 18.
To evaluate the predictive capability of the mesoscale model, an error analysis was conducted to rigorously assess the mesoscale simulated peak stress. The comparison was performed within a stable uniaxial compression region under the initial freeze–thaw damage field. As shown in Table 7, the relative errors between the mesoscale simulation and the experimental results under different freeze–thaw cycles were 8.03% after 25 cycles, 6.16% after 50 cycles, and 3.25% after 75 cycles, with an overall average error of 5.81%.
As quantitatively depicted in Figure 19, the multi-scale validation reveals a statistically significant consistency between numerical predictions and experimental measurements. The aggregate muti-scale discrepancy remains below a 3.28% relative error. We compared and analyzed the simulated prediction error results and existing simulated knot study predictions and showed that our average error was much smaller. These findings confirm that the multi-scale model could accurately capture the degradation behavior of concrete’s mechanical properties under freeze–thaw cycling, based on the constitutive fly ash concrete from reference [14].

5.3. Result Analysis

At the macroscale, a constitutive model was developed to quantify the degradation relationship between freeze–thaw cycles (0–100) and mechanical response parameters. With an average stress–strain prediction error of 5.81%, the model effectively captures the degradation of the stiffness and the reduction in the load-bearing capacity, making it suitable for the freeze–thaw damage assessment of structures. At the mesoscale, the damage mapping is realized through the equivalent plastic dissipation energy density conversion theory. Combined with the USDFLD subroutine, the whole crack evolution process—including the microcrack density, crack extension, and linking of cracks—is accurately simulated. The validation error is as low as 3.28%, successfully replicating the evolution of the pore structure and crack paths in fly ash concrete. This approach provides essential insights into frost resistance mechanisms through microstructural analysis. The comparative analysis reveals that the macroscale model focuses on predicting global mechanical behavior. In contrast, the mesoscale model reveals the muti-scale evolution of the damage—from localized degradation to whole failure—through the visual reconstruction of crack propagation paths. The research on the freeze–thaw damage formed by the two models revealed complementary advantages.
It is noted that this study focused on monotonic compression to isolate the mechanical degradation induced by freeze–thaw cycles. While this approach enables the accurate modeling of strength and stiffness reductions, it does not capture the hysteresis behavior typically observed under cyclic loading. Therefore, future extensions of this work could incorporate cyclic loading schemes to better simulate the energy dissipation, stiffness degradation, and irreversible deformation under repeated service conditions.

6. Conclusions

This article presents an experimental study of a constitutive model of concrete under freeze–thaw conditions, based on the framework of elastoplastic damage mechanics. By incorporating the Sidoroff energy equivalence damage factor, the stress–strain relationship of concrete was reformulated, and a coupled macro–meso analysis framework was developed. The damage and failure modes of concrete under various freeze–thaw cycles and the material’s uniaxial compressive mechanical characteristics were systematically analyzed. The following conclusions can be drawn from this study:
(1)
Based on experimental data, the constitutive relationship was refined to define the elastic yield point (σc0 = 0.6σcu) and initial modulus (E0), yielding a model applicable to 0–75 freeze–thaw cycles. A mathematical relationship between the compressive damage factor (dc) and stress–inelastic strain was derived, and the proper calibration of dc significantly improved the model’s convergence and suitability for the finite element analysis.
(2)
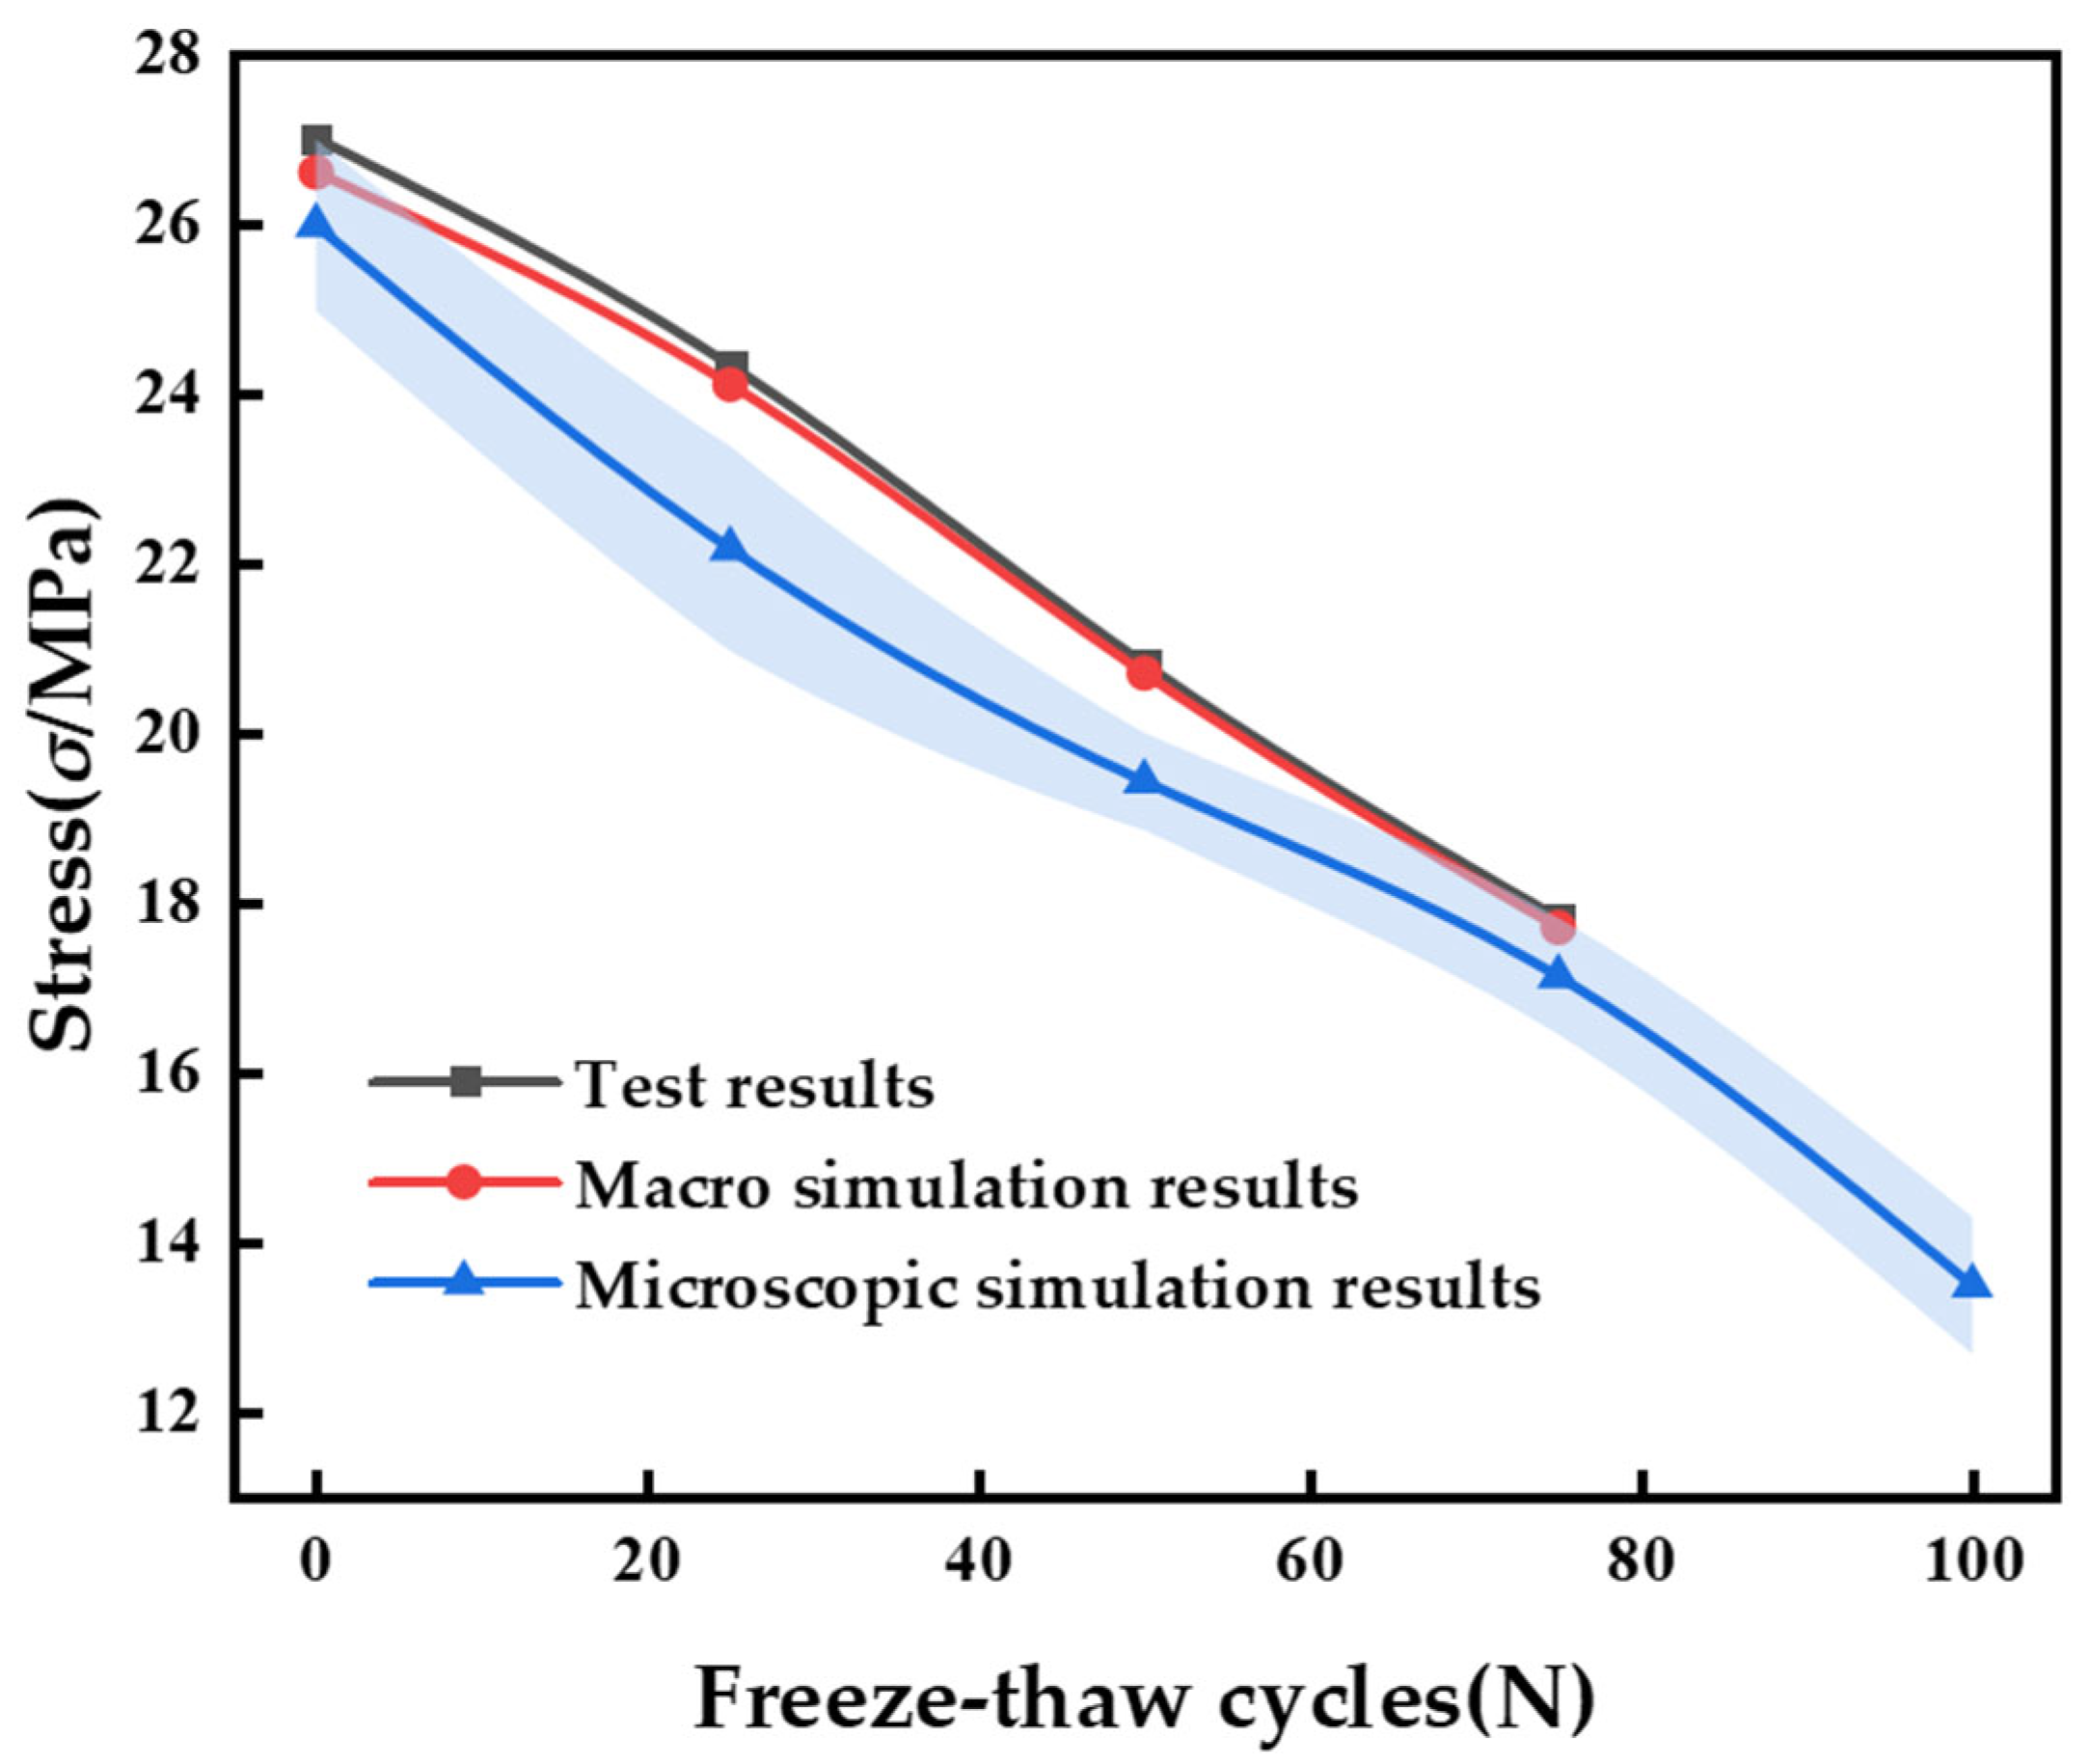
The macroscale model accurately captured the global mechanical response of concrete after varying freeze–thaw cycles, with a relative error of 1.61%. Meanwhile, the mesoscale model successfully reproduced the internal damage evolution and crack propagation using equivalent plastic dissipation energy, achieving an average error of 5.81%. This confirms the effectiveness of the CDP model in both types of finite element simulations and its accuracy in characterizing the freeze–thaw damage evolution, with an improved accuracy compared to the results of existing simulation studies, validating its applicability to freezing environments.
(3)
The macroscale and mesoscale models demonstrate complementary analytical capabilities: the macroscale model is primarily used to investigate the macrostructural mechanical response of concrete after freeze–thaw cycling, while the mesoscale model is more suitable for exploring the material’s microstructure and freezing resistance mechanisms. Moreover, model parameters exhibit a significant sensitivity on simulation results. The further optimization of plastic parameters and the mesh sensitivity analysis will be the focus of future research.

Author Contributions

Conceptualization, Y.L. and Z.W.; methodology, Z.W. and X.S.; software, Z.W.; validation, Z.W. and Y.L.; formal analysis, Z.W. and Y.L.; investigation, Z.W. and X.S.; resources, Z.W., X.S. and Y.L.; data curation, Z.W. and Y.L.; writing—original draft preparation, Z.W.; writing—review and editing, Z.W., Y.L. and X.L.; visualization, Z.W.; supervision, X.L. and J.H.; project administration, Y.L., X.L. and J.H.; funding acquisition, Y.L. All authors have read and agreed to the published version of the manuscript.

Funding

This research was funded by the National Natural Science Foundation of China (Grant No. 52078306); Basic Scientific Research Project of Liaoning Provincial Department of Education, China (LJ212411035014, JYTQN2023279); and Funding Project of Northeast Geological S&T Innovation Center of China Geological Survey (No. QCJJ2023-44).

Data Availability Statement

Data were curated by the authors and are available upon request.

Conflicts of Interest

The authors declare no conflicts of interest.

Abbreviation

The following abbreviation is used in this manuscript:
CDPConcrete Damaged Plasticity

References

  1. Ebrahimi, K.; Daiezadeh, M.J.; Zakertabrizi, M.; Zahmatkesh, F.; Habibnejad Korayem, A. A Review of the Impact of Micro- and Nanoparticles on Freeze-Thaw Durability of Hardened Concrete: Mechanism Perspective. Constr. Build. Mater. 2018, 186, 1105–1113. [Google Scholar] [CrossRef]
  2. Liu, J.; Wang, M.; Yang, Y.; Liu, Q.; Chen, Z.; Shi, C. Freeze–Thaw Durability of Concrete—A Short Review. J. Chin. Ceram. Soc. 2025, 53, 190–211. [Google Scholar] [CrossRef]
  3. Mobaraki, B.; Ma, H.; Lozano Galant, J.A.; Turmo, J. Structural Health Monitoring of 2D Plane Structures. Appl. Sci. 2021, 11, 2000. [Google Scholar] [CrossRef]
  4. Mobaraki, B.; Vaghefi, M. The Effect of Protective Barriers on the Dynamic Response of Underground Structures. Buildings 2024, 14, 3764. [Google Scholar] [CrossRef]
  5. Lubliner, J.; Oliver, J.; Oller, S.; Oñate, E. A Plastic-Damage Model for Concrete. Int. J. Solids Struct. 1989, 25, 299–326. [Google Scholar] [CrossRef]
  6. Lee, J.; Fenves, G.L. Plastic-Damage Model for Cyclic Loading of Concrete Structures. J. Eng. Mech. 1998, 124, 892–900. [Google Scholar] [CrossRef]
  7. Shi, X.; Yao, Y.; Wang, L.; Zhang, C. The influence of CDP model parameters based on the numerical simulation of uniaxial loading test. Build. Struct. 2021, 51, 999–1007. [Google Scholar]
  8. Yao, Z.; Cui, T.; Dang, F.; Wen, S.; Linghu, T.; Qi, Y. Plastic Damage Performance of Recycled Concrete Based on ABAQUS. J. Yangtze River Sci. Res. Inst. 2022, 39, 131–136, 143. [Google Scholar]
  9. Zhang, F.; Ma, J.; Nan, Y. Parameters Selection and Verification Calculation of Concrete Plastic Damage Model. China Concr. Cem. Prod. 2021, 29, 7–11. [Google Scholar] [CrossRef]
  10. Zhou, Z.; Luo, J.; Kang, Y. Damaged plastic analysis of concrete around dowel bars at joint in cement pavement. J. Traffic Transp. Eng. 2022, 22, 117–127. [Google Scholar] [CrossRef]
  11. Chen, X.; Yang, S.; Han, M. Uniaxial compression simulation of concrete under the coupled actions of sulfate, dry-wet cycles and freeze-thaw cycles. Sci. Technol. Eng. 2023, 23, 6158–6166. [Google Scholar]
  12. Sun, M.; Xin, D.; Zou, C. Damage Evolution and Plasticity Development of Concrete Materials Subjected to Freeze-Thaw during the Load Process. Mech. Mater. 2019, 139, 103192. [Google Scholar] [CrossRef]
  13. Qiu, W.-L.; Teng, F.; Pan, S.-S. Damage Constitutive Model of Concrete under Repeated Load after Seawater Freeze-Thaw Cycles. Constr. Build. Mater. 2020, 236, 117560. [Google Scholar] [CrossRef]
  14. Yang, Z. Reaserch about Uniaxial Compression Performance of Concrete Under Freeze-Thaw Cycle. Master’s Thesis, Yangzhou University, Yangzhou, China, 2010. [Google Scholar]
  15. GB 50010-2010; Code for Design of Concrete Structures. Ministry of Housing and Urban-Rural Development of the People’s Republic of China. China Architecture & Building Press: Beijing, China, 2014.
  16. Guo, Z.; Zhang, X.; Zhang, D.; Wang, R. Experimental Investigation of The Complete Stress-strain relationship of Concrete. J. Build. Struct. 1982, 1, 1–12. [Google Scholar] [CrossRef]
  17. Yu, Z.; Ding, F. Unified calculation method of compressive mechanical properties of concrete. J. Build. Struct. 2003, 24, 41–46. [Google Scholar]
  18. Ding, F.; Yu, Z. Unified Calculation Method of Mechanical Properties of Concrete in Tension. J. Civ. Eng. Manag. 2004, 21, 29–34. [Google Scholar]
  19. Li, Y.; Wang, X.; Chen, S. Comparison of Stress-strain relationships for Concrete under Uniaxial Stresses. J. Highw. Transp. Res. Dev. 2005, 10, 75–78. [Google Scholar]
  20. Popovics, S. A Numerical Approach to the Complete Stress-strain relationship of Concrete. Cem. Concr. Res. 1973, 3, 583–599. [Google Scholar] [CrossRef]
  21. Ortiz, M. A Constitutive Theory for the Inelastic Behavior of Concrete. Mech. Mater. 1985, 4, 67–93. [Google Scholar] [CrossRef]
  22. Hordijk, D.A. Tensile and Tensile Fatigue Behaviour of Concrete; Experiments, Modelling and Analyses. Heron 1992, 37, 79. [Google Scholar]
  23. Zhang, J.; Ren, H.; Wang, S. Finite element analysis for confinement behavior of hybrid FRP tube-concrete-steel tube composite bushing. J. Dalian Univ. Technol. 2016, 56, 375–381. [Google Scholar]
  24. GB/T 50082-2009; Standard for Test Methods for Long-Term Performance and Durability of Concrete. China Standards Press (CSP): Beijing, China, 2009.
  25. Krajcinovic, D.; Lemaitre, J. (Eds.) Continuum Damage Mechanics Theory and Application; Springer: Vienna, Austria, 1987; ISBN 978-3-211-82011-7. [Google Scholar]
  26. Wang, Z.; Yu, Z. Concrete Damage Model Based on Energy Loss. J. Build. Mater. 2004, 7, 365–369. [Google Scholar] [CrossRef]
  27. Sidoroff, F. Description of Anisotropic Damage Application to Elasticity. In Physical Non-Linearities in Structural Analysis, Proceedings of the Symposium, Senlis, France, 27–30 May 1980; Hult, J., Lemaitre, J., Eds.; Springer: Berlin/Heidelberg, Germany, 1981; pp. 237–244. [Google Scholar]
  28. Birtel, V.; Mark, P. Parameterised Finite Element Modelling of RC Beam Shear Failure. In Proceedings of the ABAQUS Users’ Conference, Providence, RI, USA, 16 November 2006; Volume 14. [Google Scholar]
  29. Wang, G.; Liu, Q.; Wang, H.; Wang, J.; Dong, F. Preliminary analysis of mechanical properties of subway station under fire after earthquake. Chin. J. Geotech. Eng. 2022, 44, 30–35. [Google Scholar]
  30. Lei, T.; Qian, J.; Liu, C. Application of Damaged Plasticity Model for Concrete. Struct. Eng. 2008, 24, 22–27. [Google Scholar] [CrossRef]
  31. Lan, W. Study on the Numerical Simulation of Freeze-Thaw Cycles for Concrete. Master’s Thesis, Hebei Agricultural University, Hebei, Shijiazhuang, China, 2014. [Google Scholar]
  32. Liang, K. Research on Freeze-thaw Damage Model and Numerical Simulation of Concrete in High Cold Area. Master’s Thesis, Xi’an Technological University, Xi’an, China, 2022. [Google Scholar]
  33. Zhou, Y. Dynamic Numerical Simulation Analysis of Concrete Under Freeze-Thaw Environment. Master’s Thesis, Dalian University of Technology, Dalian, China, 2019. [Google Scholar]
  34. Peng, R.; Qiu, W.; Teng, F. Three-Dimensional Meso-Numerical Simulation of Heterogeneous Concrete under Freeze-Thaw. Constr. Build. Mater. 2020, 250, 118573. [Google Scholar] [CrossRef]
  35. Hover, K.C. The Influence of Water on the Performance of Concrete. Constr. Build. Mater. 2011, 25, 3003–3013. [Google Scholar] [CrossRef]
Figure 1. Fitted axial compressive stress–strain relationships of concrete after freeze–thaw cycles. (a) 0 cycles; (b) 25 cycles; (c) 50 cycles; and (d) 75 cycles.
Buildings 15 02155 g001
Figure 2. The compressive stress–strain relationship in the CDP model.
Buildings 15 02155 g002
Figure 3. Corrected axial compressive true stress–strain relationships of concrete under different freeze–thaw cycles.
Buildings 15 02155 g003
Figure 4. Compressive stress−inelastic strain and damage factor–inelastic strain curves of concrete under different freeze–thaw cycles: (a) 0 freeze–thaw cycle stress, damage factor–inelastic strain curve; (b) 25 freeze–thaw cycle stress, damage factor–inelastic strain curve; (c) 50 freeze–thaw cycle stress, damage factor–inelastic strain curve; and (d) 75 freeze–thaw cycle stress, damage factor–inelastic strain curve.
Buildings 15 02155 g004
Figure 5. Three-dimensional model of macroscale prismatic concrete. (a) Three-dimensional model and (b) mesh subdivision.
Buildings 15 02155 g005
Figure 6. Interaction and boundary conditions of the macroscale model. (a) The interaction and (b) boundary condition.
Buildings 15 02155 g006
Figure 7. Symbol map and contour plot of concrete plastic strain. (a) Maximum plastic strain and (b) minimum plastic strain.
Buildings 15 02155 g007
Figure 8. Nephogram and contour plot of concrete compression damage factor under different freeze–thaw cycles: (a) 0 cycles; (b) 25 cycles; (c) 50 cycles; and (d) 75 cycles.
Buildings 15 02155 g008
Figure 9. Three-dimensional mesoscopic model of prismatic concrete. (a) Three-dimensional model and (b) mesh subdivision.
Buildings 15 02155 g009
Figure 10. Pore water and boundary conditions. (a) Pore water distribution; (b) boundary conditions for heat transfer analysis; and (c) boundary conditions for compressive processes.
Buildings 15 02155 g010
Figure 11. Plastic dissipated energy curve during concrete freezing.
Buildings 15 02155 g011
Figure 12. Evolution of internal damage in concrete under freeze–thaw cycles.
Buildings 15 02155 g012
Figure 13. Evolution of surface damage in concrete under freeze–thaw cycles.
Buildings 15 02155 g013
Figure 14. Nephogram of mesoscopic axial compression failure in concrete under different freeze−thaw cycles: (a) 25 cycles; (b) 50 cycles; (c) 75 cycles; (d) 100 cycles; (e) 125 cycles; and (f) 150 cycles.
Buildings 15 02155 g014
Figure 15. Overall damage evolution of concrete under freeze–thaw cycles.
Buildings 15 02155 g015
Figure 16. Damage and failure of concrete under freeze–thaw cycles. Data from reference [14]: (a) 25 cycles; (b) 50 cycles; and (c) 75 cycles.
Buildings 15 02155 g016
Figure 17. Comparison of axial compression failure patterns in freeze–thaw-affected concrete. (a) Test failure mode. Adapted from reference [14] and (b) meso-simulation of failure morphology.
Buildings 15 02155 g017
Figure 18. Comparison of stress–strain relationships: (a) 0 cycles; (b) 25 cycles; (c) 50 cycles; and (d) 75 cycles.
Buildings 15 02155 g018
Figure 19. Peak stress error curve of concrete under freeze–thaw cycles.
Buildings 15 02155 g019
Table 1. Various indicators of concrete prismatic specimens under different freeze–thaw cycles. Data from reference [14].
Freeze–Thaw Cycles (N)Peak Compressive Stress (MPa)Peak Compression StrainUltimate Compressive Strain
026.60.0017080.004083
2524.10.0020420.004292
5020.70.0023750.004792
7517.70.0027080.004917
Table 2. Control parameters of uniaxial compressive stress–strain relationships of concrete under different freeze–thaw cycles. Data from reference [14].
Freeze–Thaw Cycles (N)0255075
Control Parameter
a1.911.451.090.18
b1.061.752.013.18
Table 3. Quantitative relationship between damage factor and normalized strain.
Freeze–Thaw Cycles (N)Normalized Strain (x = ε/εcu)Damage Factor (dc)StageKey Parameters
00.000–0.3780.000Elastic stagea = 1.91, b = 1.06
ρc = 0.630
0.378–1.000 d c = 1   ρ c a + ( 3 2 a ) x + ( a 2 ) x 2 Hardening stage
>1.000 d c = 1   ρ c b ( x 1 ) 2 + x Softening stage
250.000–0.4310.000Elastic stagea = 1.45, b = 1.75
ρc = 0.719
0.431–1.000 d c = 1   ρ c a + ( 3 2 a ) x + ( a 2 ) x 2 Hardening stage
>1.000 d c = 1   ρ c b ( x 1 ) 2 + x Softening stage
500.000–0.4700.000Elastic stagea = 1.09, b = 2.01
ρc = 0.784
0.470–1.000 d c = 1   ρ c a + ( 3 2 a ) x + ( a 2 ) x 2 Hardening stage
>1.000 d c = 1   ρ c b ( x 1 ) 2 + x Softening stage
750.000–0.5530.000Elastic stagea = 0.18, b = 3.18
ρc = 0.922
0.553–1.000 d c = 1   ρ c a + ( 3 2 a ) x + ( a 2 ) x 2 Hardening stage
>1.000 d c = 1   ρ c b ( x 1 ) 2 + x Softening stage
Table 4. Plastic parameters of the CDP model.
Expansion Angle ψ/(°)Eccentricityfb0/fc0Kμ
360.11.160.6670.0005
Table 5. Compressive behavior and compressive damage parameters of concrete after different freeze–thaw cycles.
Freeze–Thaw Cycles (N)σc ε ~ c in dc
015.970270.000000.00000
19.667530.000000.03514
25.494180.000330.13177
26.645430.000630.20622
21.536290.001860.43611
15.763170.003110.58880
12.003750.004290.68209
4.172410.011720.88188
2.547840.018510.92662
1.613710.028560.95326
2514.472630.000000.00000
18.994760.000070.02873
22.748940.000250.07966
24.149210.000570.15204
20.140750.001630.34579
12.905830.003290.56212
8.897270.004750.68132
3.688800.009930.85239
1.457280.022120.93782
1.040710.030110.95518
5013.186010.000000.00000
17.679610.000070.02232
20.366910.000300.07477
20.749160.000500.11416
16.889150.001800.32487
12.123930.003170.49577
7.881120.004970.64818
5.665080.006590.73339
1.382460.021030.92449
0.786290.034930.95620
7517.275070.000000.00000
17.624470.000080.01786
17.747930.000200.03944
16.055620.000980.16621
13.031200.001940.30475
8.347750.003680.50951
5.778260.005120.63108
4.314760.006410.70691
1.605190.013220.87150
Table 6. Comparison between macroscopic simulation and experimental results.
Freeze–Thaw Cycles (N)Peak Stress (σ/MPa)Peak Strain (ε)
Test ResultsModeling ResultsRelative Error (%)Test ResultModeling ResultsRelative Error (%)
026.627.0011.49%0.0017080.0017331.44%
2524.124.3230.92%0.0020420.0020641.07%
5020.720.8090.52%0.0023750.0023232.1%
7517.717.8100.61%0.0027080.0026581.84%
Table 7. Comparison between mesoscopic simulation and experimental results.
Freeze–Thaw Cycles (N)Peak Stress (σ/MPa)
Test ResultsSimulated Mean ResultsRelative Error (%)
026.625.9752.35%
2524.122.1658.03%
5020.719.4246.16%
7517.717.1253.25%
100-13.482-
Disclaimer/Publisher’s Note: The statements, opinions and data contained in all publications are solely those of the individual author(s) and contributor(s) and not of MDPI and/or the editor(s). MDPI and/or the editor(s) disclaim responsibility for any injury to people or property resulting from any ideas, methods, instructions or products referred to in the content.

