Abstract
The collapsibility of loess in the northwest region poses a significant threat to infrastructure stability. Current research predominantly separates macroscopic mechanical behaviour from mesoscopic structural characteristics, lacking a systematic methodology to quantify their interdependence. This study integrates consolidation tests, laser particle size analysis, mercury intrusion porosimetry (MIP) tests, and fractal theory to propose a multi-scale evaluation framework for assessing the structural potential of collapsible loess in strength, with on-site verification conducted. This framework quantitatively links grain size, pore potential, and connection potential to the collapsibility of loess. The experimental results indicate that loess’s high compressibility and collapsibility are primarily governed by grain size and pore potential. In contrast, the connection potential of soluble salts mitigates structural instability through ionic bonding. Field verification demonstrates a strong correlation between the three structural potentials and the subsidence coefficient (R2 = 0.92, p < 0.01), validating the framework’s effectiveness in evaluating structural stability. A ternary evaluation system has been established based on fractal dimension, void ratio, and soluble salt content. These research findings provide predictive tools for managing collapse risks in loess-related projects, enabling fixed-point design of loess foundations and early warning of collapse risks.
1. Introduction
The structural characteristics of loess significantly influence its engineering properties, such as collapsible deformation and subsidence, which profoundly impact infrastructure construction and safety in loess regions [1,2,3]. The structural behaviour of soil manifests through the arrangement of soil particles/aggregates, pore morphology, and their interactions, representing critical factors governing its mechanical behaviour [4]. The structural nature of loess directly determines its engineering characteristics, posing substantial threats to the stability and safety of infrastructure in northwestern China [5]. Current research predominantly focuses on isolated analyses of either macroscopic mechanical properties or mesoscopic structural parameters, lacking quantitative descriptions of macro–meso correlation mechanisms. This limitation hinders the establishment of intrinsic connections between structural evolution and macroscopic mechanical responses. Therefore, systematically revealing the coupling mechanism between macro–meso structures in loess and constructing theoretical models that correlate microstructural parameters with macroscopic mechanical indices constitutes a crucial scientific challenge for enhancing the prevention and control capabilities of loess-related engineering hazards.
In recent decades, scholars worldwide have conducted extensive investigations into the macroscopic mechanical characteristics and microstructural features of loess, yielding substantial research achievements [6,7,8,9,10]. Wu et al. [6] proposed that introducing structural parameters into the dynamic stress–strain relationship of undisturbed loess can better characterize its dynamic characteristics based on triaxial test and meso image analysis. LV et al. [7] studied the changes in macro mechanical strength and microstructure of Yili Valley loess under freeze–thaw cycles and their correlation mechanism. Jiang et al. [8] employed discrete element modelling to simulate direct shear tests of unsaturated structured loess under varied suction levels and vertical stresses, revealing that moisture content and vertical stress conditions modulate shear strength and deformation behaviour. Asadoullahtabar et al. [9] demonstrated through chemical stabilization experiments that nano-titanium significantly reduces the loess collapse index and enhances compressive strength while offering environmental sustainability benefits. Pan et al. [10] investigated collapsible loess’s structural strength and compressibility parameters under varying initial water contents and proposed evaluation models to assess these loess characteristics.
A few scholars have explained the collapsibility mechanism of loess from a microscopic perspective [11,12,13,14,15,16,17,18,19,20]. Li et al. [11] demonstrated that loess samples with a high content of nearly spherical clay particles and uniform particle size distribution exhibit enhanced shear strength and positive contact forces. Wei et al. [12] demonstrated that structural integrity and particle cementation in intact loess significantly enhance strength compared to remoulded samples, as revealed by microstructural analysis of unsaturated loess. Zheng et al. [13] studied the erosion characteristics of loess under different dry densities and water content, divided the erosion process into four stages, analyzed the erosion and micro mechanism, and revealed the internal erosion mechanism from the microstructure perspective. Additionally, Miao et al. [14] demonstrated that wetting–drying cycles significantly enhance the development of intra-aggregate pores, with interparticle pores and porosity as a critical bridging link between microstructural parameters and macroscopic shear strength parameters. Some researchers [15,16,17] have carried out a qualitative investigation into the morphology and spatial distribution of loess particles/aggregates, as well as their porous framework characteristics. Other researchers [18,19,20] performed quantitative evaluations of soil structure utilizing morphological features extracted from SEM images and examined variations in these features under varying conditions.
A few scholars have attempted to establish a quantitative relationship between micro and microstructural parameters and macroscopic mechanical properties [21,22,23,24,25,26,27]. Chen et al. [21,22] showed that confining pressure controls saturated loess dynamics through microstructure rearrangement. Strong linear relationships were found between dynamic modulus and three microstructural parameters: pore size, particle sphericity, and Voronoi fractal dimension. Xie et al. [23,24] developed a constitutive law incorporating soil structural properties and established quantitative relationships between structural parameters and deformation/strength characteristics. Chen et al. [25,26] studied the relationship between soil structural parameters and strength in loess deposits, establishing a structure–function model based on depositional age and mechanical indices for slope stability analysis.
Although the above studies conducted in-depth research on loess’s macroscopic mechanical properties and microscopic structural characteristics, quantitative research on loess’s microstructure and macroscopic mechanical properties (compressibility and collapsibility) is scarce. Microscopic research has only focused on one parameter and ignored the coupling of multiple factors, thus being unable to characterize loess’s complex mechanical structure foundation comprehensively [27]. In this study, the structural potential of loess is further subdivided into three types of meso-structural potentials: grain size potential, pore potential, and connection potential. These meso-structural potentials are characterized by the fractal dimension of soil particle size, the ratio of large to medium pores, and the content of soluble salts. Through experimental testing and theoretical analysis, the relationship between these meso-structural potentials and the comprehensive structural potential of loess and other macroscopic mechanical indicators was investigated. A method for determining the structural potential strength of loess based on the macro–meso correlation was proposed. Their relationships with the comprehensive structural potential and other mechanical indicators were studied by examining the fractal dimension of soil particle size, the ratio of large to medium pores, and the content of soluble salts. The proposed method offers a new perspective and approach for evaluating loess structures, providing important theoretical support for the design and construction of loess engineering projects.
2. Materials and Methods
2.1. Test Materials
The loess used in this research was obtained from a building foundation pit in the southern suburbs of Chang’an District, Xi’an, Shaanxi Province. The depth of soil extraction ranges from 4.5 to 5 m and is located in the collapsible loess layer, as shown in Figure 1. The soil type is Malan loess, brownish-yellow, intricate, and uniform in texture. During sampling, the whole loess was cut into soil samples of about 40 cm × 40 cm × 40 cm and tightly wrapped with plastic bags and tapes to mark the upper and lower parts of the soil samples, and its physical properties were measured via laboratory tests, as shown in Table 1. The mineral composition of the loess samples was determined by X-ray diffraction, and the test results are shown in Table 2.
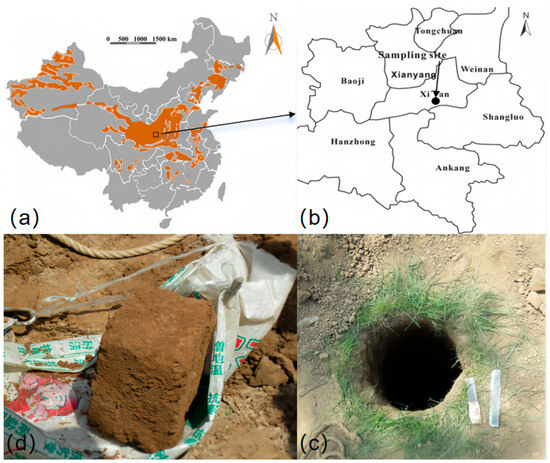
Figure 1.
Sampling sites: (a) loess distribution area; (b) sampling location; (c) drilling location (d) soil samples.

Table 1.
Physical properties of loess in the study area.

Table 2.
Mineral composition of loess in the study area.
The Bettersize 2000 laser particle size distribution analyzer (Bettersize Instruments Ltd., Dandong, China) was used to test and analyze the naturally air-dried loess samples. It can be seen that the content of fine sand (2–50 μm) is the highest, which is 75.07%. The content of clay (<2 μm) was second, accounting for 15.89%, and the content of sand (>~50 μm) was the lowest, accounting for 9.04%. The loess was classified by the particle size classification method [28], and it was concluded that the loess collected in this study belonged to silty loess. The uniformity coefficient Cu > 5 and curvature coefficient Cc are in the range of 1–3, indicating that loess samples in the study area were taken from well-graded soil.
2.2. Sample Preparation
Preparation steps for reshaped loess consolidation test specimens were as follows: firstly, the soil sample was dried and ground, then screened using a 1 mm sieve; a certain mass of the dry soil was weighed according to the set dry density and the fixed volume size of the cutting ring (height of 20 mm and diameter of 79.8 mm). Then, the required amount of water was calculated based on the target moisture content and was mixed uniformly with the dry soil. After mixing, the moist soil was pressed into the cutting ring. Each specimen was allowed to stand sealed in a plastic bag for 72 h. Before the test, the moisture content of the specimen was checked, and the soil specimen flat was trimmed at both ends for testing; we used the cuttings to determine the moisture content. If a significant deviation in moisture content was found, the soil sample was remoulded and the above steps were repeated to ensure the accuracy of the initial specimen conditions.
2.3. Test Method
2.3.1. Consolidation Test
This study did not consider dry density’s influence on loess’s mechanical properties. Therefore, the dry density of all prepared soil samples was uniformly set at 1.51 g/c3 to study the effects of moisture content and vertical pressure on the deformation and failure of loess. The standard consolidation test was conducted according to the standard GB/T 50123-2019 “Test Methods for Geotechnical Engineering” [29]. According to the moisture content gradient set by Wu [30] in the research, the moisture content of the reshaped loess samples in the consolidation test was set at 5%, 10%, 15%, 20%, and 25%, respectively. The prepared specimens were placed in the consolidation test device. The cutting ring restricted the lateral displacement of the specimens. Then, the stepwise pressure was carried out by referring to the stepwise pressure levels (12.5 kPa, 25 kPa, 50 kPa, 100 kPa, 200 kPa, 400 kPa, 800 kPa) applied by Wang [31] in the consolidation test. After each pressure level is applied, consolidation treatment is carried out according to the standard requirements, that is, consolidation for one day at each pressure level or until the deformation rate of the sample is less than 0.01 mm/h. After recording the stable reading, the next pressure level was applied until the test was completed. Repeated tests were conducted for each moisture content to compare and ensure the accuracy of the data.
2.3.2. Particle Analysis Test
In order to analyze the effects of different moisture contents and pressure on the particle composition and micro-morphology of reshaped loess, this study employed a Bettersize 2000 laser particle size distribution instrument to conduct particle analysis tests on reshaped loess with moisture contents of 5%, 10%, 15%, 20%, and 25%; all particle size distribution measurements were conducted after unloading to eliminate the influence of stress on particle structure during pressure and ensure that the measurement results reflected the particle distribution characteristics in a stable state. The test process and sample preparation followed ASTM standards [28] to ensure accuracy and reproducibility. By comparing the particle size distribution patterns of reshaped loess samples under the duplicate moisture content with different pressures and under the same pressure with different moisture contents, the micro-structure of reshaped loess at varying moisture contents was studied and analyzed.
During the experiment, specimens with varying moisture content levels—5%, 10%, 15%, 20%, and 25%—were consistently exposed to a vertical stress of 800 kPa. Additionally, samples with a 15% moisture content were subjected to vertical stresses of 100 kPa, 200 kPa, 400 kPa, and 800 kPa. The Bettersize 2000 laser particle size analyzer was employed to ascertain the cumulative percentage of particles within specific size distributions for the loess samples at identical vertical stresses but different moisture levels. Subsequently, a particle size distribution curve was constructed to examine the patterns of variation.
2.3.3. MIP Test
In order to study the micromorphology and micropore size of reshaping loess with different moisture content under different levels of confining pressure, according to ASTM standard [28], the selected reshaped loess with 15% moisture content was tested using a BDHg-60 direct injection mercury porosimeter.
2.3.4. Verification of Test Procedures
For the consolidation test, the stability standard for each pressure level was a deformation rate of <0.01 mm/h and the error of parallel samples was controlled within 5%. Each sample was measured three times repeatedly for the particle size test, and the result with an average particle size deviation of less than 3% was taken. The measurement error of pore volume in the MIP test is less than 2%, and the error of large pore volume is less than 8%. The reliability of all the above-mentioned test steps meets the specification requirements [28,29], ensuring the standardization of the test steps and the reliability of the results.
3. Results and Analysis
3.1. Consolidation Test Analysis
The e-p curves of reshaped loess samples with different moisture contents are plotted, as shown in Figure 2, which shows the correlation between the void ratio (e) of loess samples with varying moisture contents and the applied vertical pressure (p). The e-p curves of loess samples with different moisture contents exhibit a clear concave pattern, indicating that the void ratio (e) gradually decreases with the increase in vertical pressure (p). When the moisture content w is 5%, e decreases gently with the rise in p. When the pressure is 800 kPa, e changes by less than 0.1, indicating that low moisture loess has higher stiffness and a stronger ability to resist deformation caused by vertical pressure. As the moisture content increases, the void ratio changes significantly within the pressure range 200~400 kPa, and a clear inflection point can be observed. When the moisture content w is 25%, e rapidly decreases with the increase in p. When the pressure reaches 800 kPa, the change is close to 0.5, about 6 times the change in the sample when the moisture content w is 5%. Under high water content, the dissolution of soluble salts and the loss of matrix suction lead to the apparent reduction in soil structural strength. Under the pressure of 800 kPa, soil aggregates or larger particles are more likely to be decomposed into finer particles and filled into the large and medium-sized pores between soil particles, resulting in the apparent reduction in pore ratio. This is consistent with the discovery of Wang [32].
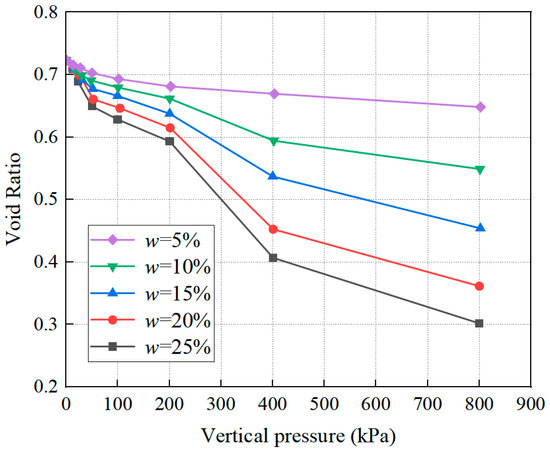
Figure 2.
e-p curve of loess.
3.2. Particle Analysis Test Analysis
Figure 3 is the particle gradation curve of reshaped loess with moisture content w = 15% under different vertical pressures p. The following can be found: (1) On the whole, the distribution law of the particle gradation curve of the reshaped loess sample with moisture content w = 15% is basically the same, and the cumulative percentage is significantly increased at the median particle size, finally reaching 100%. (2) When the vertical pressure p is 100 kPa, the median particle size is 11.25 μm, and with the increase in the vertical pressure p, the median particle size gradually decreases, and when the vertical pressure p is 800 kPa, the median particle size is only 10.67 μm. (3) With the increase in vertical pressure p, the medium silt (2–50 μm) particle content in the reshaped loess with moisture content w = 15% gradually decreases, while the clay (<2 μm) content gradually increases, indicating that under the influence of vertical pressure, the medium particles in the loess are gradually compressed into small particles, and the vertical pressure leads to the disintegration of the structure of silt aggregates and the release of the clay wrapped inside, which reduces the content of medium silt and increases the apparent content of clay. This is consistent with the microscopic model of Liu [19].
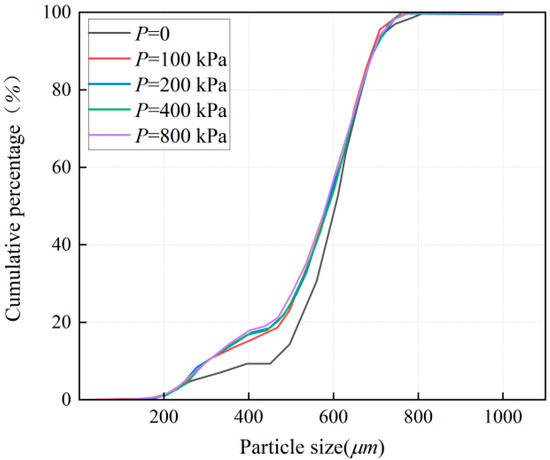
Figure 3.
Particle gradation curves of 15% moisture content specimens under different pressure.
Figure 4 is the particle gradation curve of the reshaping of the loess with different initial moisture content under the vertical pressure p of 800 kPa. It can be found that, on the whole, the distribution law of the particle gradation curves of the reshaped loess samples with different moisture contents under the vertical pressure p of 800 kPa is basically the same, and the cumulative percentage is significantly increased at the median particle size and finally reaches 100%. When the moisture content w is 5%, the median particle size of the sample is 8.19 μm; when the moisture content w is 15%, the median particle size of the sample is 10.67 μm; when the moisture content w is 25%, the median particle size of the sample was 10.58 μm, indicating that the median particle size of the sample would decrease with an increase or decrease in the moisture content compared with the natural moisture content. The decrease in the moisture content had a more significant effect on the reduction in the median particle size of the sample.
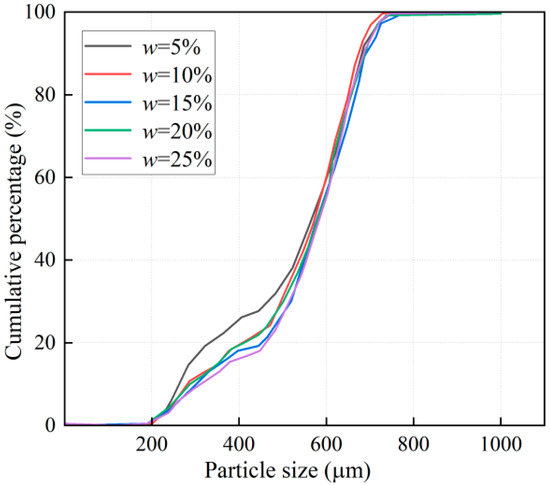
Figure 4.
Particle gradation curves of samples with different moisture contents at 800 kPa.
3.3. MIP Assay Analysis
Figure 5 presents the cumulative pore volume curve of reshaped loess with 15% moisture content. The study shows that the pore diameter range of the mercury intrusion test is 5 nm–350 μm, and the pore diameter distribution of loess is relatively uniform. Based on this result, the cumulative pore volume change curve and pore fractal classification characteristic curve of the reshaping of the loess before and after the shear test shown in Figure 5 are displayed. The analysis shows that from Figure 5a, it can be seen that, in general, the total cumulative pore volume of the reshaping of the loess samples with natural moisture content (w = 15%) decreases after shear failure compared with before the test. This is partly consistent with Yu’s conclusion [33].
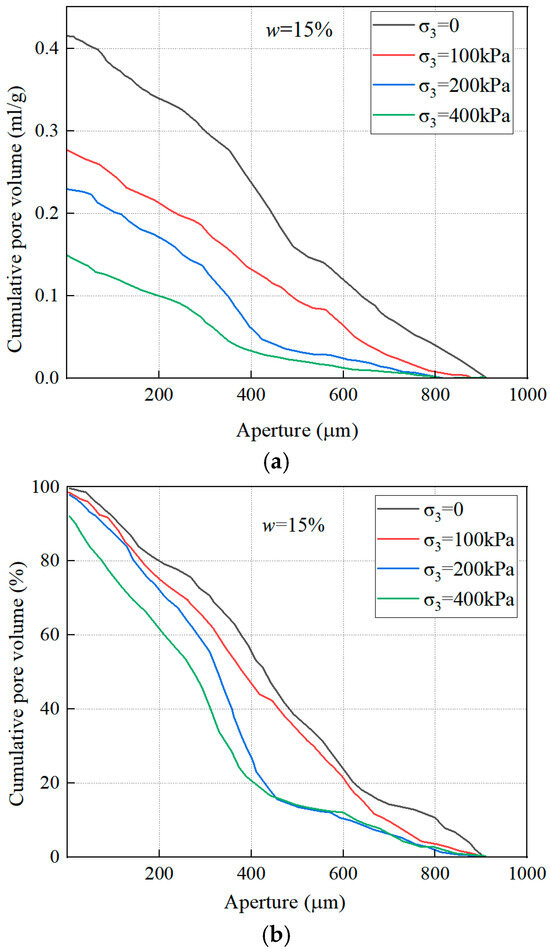
Figure 5.
Accumulated pore volume curve of reshaped loess with a 15% moisture content: (a) The cumulative curve of pore volume of reshaped loess with a moisture content of 15%. (b) Fractal classification characteristic curve of porosity in reshaped loess with a moisture content of 15%.
It can be seen from Figure 5b that with the gradual increase in horizontal confining pressure σ3, the cumulative pore volume of the sample changes gradually, obviously, and the changing trend of small pores and medium pores is particularly prominent. The pore accumulation volume of the reshaped loess with an initial water content of 15% was sheared under 100 kPa and 200 kPa horizontal confining pressure, and the pore accumulation volume decreased by 0.1430 mL/g and 0.1888 mL/g, respectively. This change is due to the lateral expansion and bending of the specimen during the shearing process. As a result, the cumulative pore volume measured by the mercury intrusion test of the sample decreases slightly.
4. Grain Fraction Potential, Pore Potential, and Connection Potential of Loess
4.1. Determination of the Grain Fraction Potential of Loess
4.1.1. Study on Fractal Dimension Characteristics of Loess Particles
Formula (1) is the calculation formula for the porosity part of Tao [34] derived from the defined Sierpinski model. By taking the logarithm of Equation (1), the fractal dimension of the number of particles can be calculated. ln(1 − η) is used as the ordinate and ln(r/L2) is used as the abscissa. In this case, the slope is (2 − k), where k is the value of the slope and the fractal dimension D of the number of particles is (2 − k). In practical applications, ln (r/L2) can be replaced with lnr because ln (r/L2) is written as lnr − lnL2, which is a constant term [19]. This replacement only causes the scatter points to shift along the horizontal axis, thus affecting only the intercept and not the slope; that is, it will not impact the fractal dimension. This mathematical property has been widely applied in the fractal analysis of soil particles.
where r represents the observed diameter of the grid particle size, η represents the proportion of particles to the total particle content when the particle size is not less than r, L2 represents the observation range, and D represents the fractal dimension of the particle size in the soil sample.
It can be seen from Figure 6 that the fitting curve formula of the fractal dimension of the number of particles when the moisture content w = 15% specimen is vertically pressured is y = 0.3429x + 0.7458, the fractal dimension D = 2 − 0.3429 = 1.6571, and the fractal dimension fitting curve formula of the particle number when the moisture content w = 15% of the sample is axially pressured, and the formula of the fractal dimension is y = 0.1219x + 0.2295, and the fractal dimension D = 2 − 0.1219 = 1.8781. Compared with the vertical pressure, the axial pressure has a more obvious damage degree to the reshaping of the loess with a particle size greater than 50 μm.
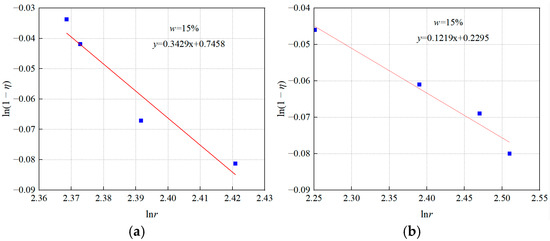
Figure 6.
Fitting curve of pressure fractal dimension of 15% water content sample: (a) fitting curve of the vertical pressure fractal dimension of the 15% moisture content sample; (b) fitting curve of the fractal dimension of the 15% moisture content sample.
4.1.2. Research on the Method of Determining the Particle Size Potential of Loess
The grain size potential of soil indicates the quality of the arrangement and combination of soil particles or soil particles, which is directly related to the non-uniformity (gradation) of soil particles. The fractal dimension of soil particle size (D) can directly reflect the gradation of soil particles. The quality of gradation is the prerequisite for soil samples to be fully compressed, so the strength of grain size potential is the basic condition for the strength of comprehensive structure potential. In this section, the grain size potential of loess is comprehensively analyzed according to the fractal dimension D of soil samples with different initial water content obtained by test and the grade division of grain size potential of uniformity coefficient Cu and curvature coefficient Cc.
The steps for calculating and judging grain size potential are as follows:
- (1)
- The particle size of the sample was characterized using either experimental techniques or a laser particle size analyzer, and the resulting distribution curve was illustrated. The horizontal coordinate was the particle size r, and the vertical coordinate was the proportion of the cumulative quantity of the particle η, where the unit of r was mm.
- (2)
- The particle size potential of soil can be represented by the distribution characteristics of the cumulative number of particles (1 − η) greater than or equal to a specific particle size (r). Specifically, it is reflected by the morphological characteristics of the r − (1 − η) curve. It is worth noting that there is a power function correspondence between r and (1 − η), as shown in Equation (2):
- (3)
- The fractal dimension of particle size D was calculated. The horizontal coordinate of the double-logarithmic coordinate system was defined as the particle size r. The vertical coordinate was the proportion of particles larger than the particle size to the total particle number (1 − η). The fractal dimension D is calculated by fitting the slope of the line with a one-time function. Equation (2) is converted to Equation (3), and k is the constant term after the logarithm of Equation (2):
Table 3 presents the calculation results, indicating that the fractal dimension D of the sample with 15% moisture content post-consolidation is 1.6571.

Table 3.
Fitting parameters of Fractal dimension of reshaped loess under pressure.
- (4)
- The granularity fractal dimension D is classified according to Table 4.
 Table 4. Classification of particle size potential.
The scientific basis for the classification of grain size potential in Table 4 is as follows: the fractal dimension value of soil particle size D has a similar meaning to the uniformity coefficient Cu and curvature coefficient Cc. The evaluation method of Cu and Cc is applied to the classification of fractal dimension D in a logarithmic form, in which the soil with Cu ≥ 5 and Cc = 1–3 is well graded.
For well-graded soil, we calculate its slope in logarithmic coordinates. Let D = k; then D ≤ 1.11; similarly, D ≥ 0.37 is computed from.
Therefore, the particle size fractal dimension D of well-graded soil is within the range [0.37, 1.11], and its particle size potential is low-grade. The middle-grade and high-grade increase or decrease by 0.37 each time, and the high-grade is greater than 1.85.
For the reshaping, the loess in the study area, the particle size fractal dimension values obtained by consolidation and the consolidation test were 1.6571, and the average particle size fractal dimension values were 1.7661 under the condition of natural moisture content of 15%, respectively. These values were within the high-grade grain grade potential range [1.48, 1.85], indicating that the reshaped loess in the study area was well-graded.
4.2. Determination of the Pore Potential of Loess
The pore potential of soil indicates the size and quality of pores between soil particles or soil particles. Loess pores can be generally divided into small (intergranular), medium (overhead), and large pores. Macropores and overhead pores are primarily supported by salt crystal cementation. External forces can effectively remove macropores and overhead pores, while external forces cannot significantly change intergranular pores. Therefore, the number of large and medium pores reflects the size of the maximum compression space of the loess, which represents the collapsibility or settlement potential of the loess. In this section, according to the large and medium pore volume ratio n of soil samples with different initial water content obtained by experimental tests and according to the compressibility division of soil and the collapsibility deformation division of loess, the grades of the large and medium pore volume ratio of loess are divided. Then, the pore potential of loess is comprehensively analyzed through the changes in n of different samples.
The steps for calculating and judging pore potential are as follows:
- (1)
- A mercury injection instrument tests the pore distribution of different soils. The horizontal coordinate is equivalent to pore size R, and the vertical coordinate is the proportion of pore size R in the total pore volume and the pore size distribution.
- (2)
- A length of 8 μm is identified as the boundary between overhead pores and intergranular pores. Then, the pore potential of the soil can be characterized by the large and medium pore ratios of the soil, and the pores of different equivalent pore sizes can be summed up or read directly by the instrument. The proportion of large and medium pore ratios can be expressed by Equation (4) as follows:
- (1)
- Equation (4) is used to compute the percentage of large and medium pore volumes, denoted as n, and the computed outcomes are presented in Table 5.
 Table 5. Proportion of large and medium pore volume in reshaped loess.
The large and medium pore volume n of the 15% moisture content sample in the natural state is 76.2%.
- (2)
- Table 6 serves as the basis for categorizing the percentage of large and medium pore volumes, denoted as n.
 Table 6. Classification of pore potential levels.
The scientific basis for the classification of pore potential in Table 6 is as follows: the deformation of loess is mainly compressive deformation before water immersion and collapsible deformation after water immersion. In engineering, the compressibility of soil is usually distinguished by the compressibility coefficient of soil a, and the collapsibility coefficient δs is used to distinguish the collapsible deformation amount of soil after water immersion under pressure. Table 7 serves as classification of compressibility levels of soil. Table 8 serves as classification of collapsibility levels of loess. The sum of the two is the maximum deformation amount of the soil sample under pressure. The proportion of large and medium pore volume of the soil sample in the study area is classified. If the compression grade of the soil sample is high and the collapsibility grade is strong, the pore structure potential of the soil sample is high. If the compression grade of the soil sample is low and the collapsibility grade is slight, the pore structure potential corresponding to the soil sample is low.

Table 7.
Classification of compressibility levels of soil.

Table 8.
Classification of collapsibility levels of loess.
Because the external force mainly compresses the large and medium pores of the soil and has no noticeable effect on the small and micro pores, it is assumed that the above two deformations come from the compression of the large and medium pores of the soil. Referring to the relevant specifications, it is assumed that the compression deformation at 100–200 kPa and the collapsible deformation at 200 kPa is from large and medium pores, and 80% of the large and medium pores are eliminated. When the compressibility of the soil is high and the collapsibility is strong, the large and medium pores account for a large proportion, and the pore potential is very high. When the compressibility of the soil is low, and there is no collapsibility, the proportion of large and medium pores is tiny, and the pore potential is low. This is consistent with the results of the research and analysis of the compression deformation characteristics of reshaped loess in Section 3.1 and Section 3.3.
4.3. Determination of the Connection Potential of Loess
The connection potential of soil indicates the size of the interaction among soil particles, which is crucial for understanding soil structure and behaviour. The size of the soil particle connection reflects the ability of the loess to resist compression and deformation, and the connection potential is essentially a microscopic manifestation of stability in the comprehensive structural potential of the loess. Forces among loess particles include the van der Waals force, Coulomb force, and cementation force. The van der Waals force and the Coulomb force refer to the gravitational attraction between molecules, and their size is mainly related to the mineral composition and particle size of loess. Cementing force plays the most important role in the connection of soil particles. The cementing material in loess mainly includes soluble salt (salt crystal) and clay minerals, among which the salt crystal is mainly composed of calcium carbonate, which encapsulates small particles such as powder particles and aggregates to form larger aggregate structure and further causes the large and medium pore structure of loess, as shown in Figure 7. Therefore, this section intends to focus on the connections due to the cementing force among loess particles; the interaction among soil particles, particularly the influence of calcium carbonate content on the cementing force of loess, is crucial for understanding soil structure and behaviour.
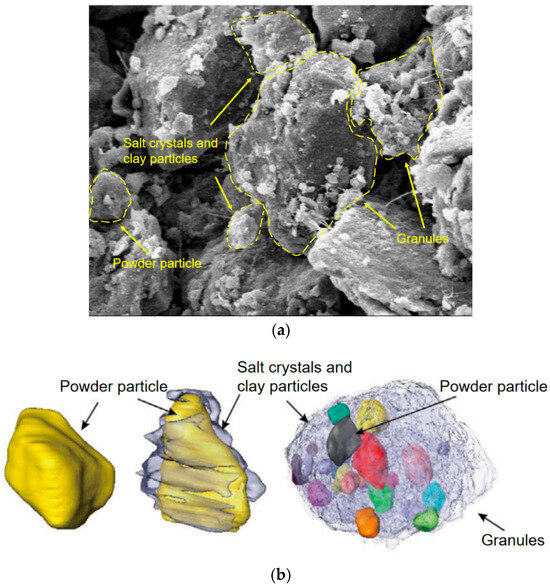
Figure 7.
(a) SEM images of micro section of loess; (b) 3D structural diagram of loess particles and aggregates.
In this study, the soluble salt content of loess was measured by X-ray diffractometer. The results are shown in Table 2, which shows that calcite is the main carbonate mineral in the natural loess in the study area, accounting for 9.8%, quartz for 42.4%, plagioclase for 20.5%, and clay mineral for 23.5%.
The content of soluble salts is classified according to Table 9.

Table 9.
Classification of connection potential levels.
The scientific basis for the classification of soluble salts is given in Table 9.
The connections between loess particles are mainly due to the van der Waals force, Coulomb force, and cementation force. The levels of the van der Waals force and Coulomb force is much smaller than that of the cementing force. To facilitate engineering applications, the van der Waals force and Coulomb force are ignored, and only the cementing force represents the size of the connection potential.
The cementing materials in soil include clay minerals and salt crystal cementation, and the content of clay minerals in loess is low, so it is ignored. Therefore, the division of the connection potential of loess is simplified to the division of salt crystal cement and (clay) content in the soil. Soluble salts in loess mainly include CaCO3, MgSO4, Na2SO4, Na2CO3, NaCl, and CaSO4. According to the proportion of soluble salts in loess (Table 10), the connection potential of loess is divided into four grades.

Table 10.
Soluble salt content in self-weight-collapsible loess and non-self-weight-collapsible loess (%).
For the reshaped loess in the study area, when the natural water content is 15%, the carbonate minerals in the soil are mainly calcite, and the soluble salt content accounts for 9.8%, which is within the range of medium-grade connection potential (5–10%). This indicates that the reshaping of the loess in the study area has a medium soluble salt content and a moderate grade of connection potential. This is consistent with the results of the X-ray diffraction test (XRD test) analysis of the reshape of the loess in Section 2.1.
4.4. Comprehensive Determination of Structural Potential of Loess
The comprehensive structural potential of a single soil sample is mainly determined by the above three kinds of meso-structural potential, so the strength of the structural potential of a single soil sample needs to be calculated and judged separately from the three kinds of meso-structural potential. In engineering sites, geological conditions such as topography, soil depth, and other geological conditions significantly influence soil structure. Therefore, the structural potential evaluation and grade determination of loess sites can also be determined by selecting at least three symbolic points on the site. If the uniformity of soil in the site is not high, the number of sampling points can be appropriately increased. For each symbolic point, a sampling point is taken every 3–5 m from the top to the bottom of the loess layer. The sampling method is shown in the schematic diagram of sampling points in Figure 8, and the connection potential and pore potentialof each soil sample are calculated and evaluated.
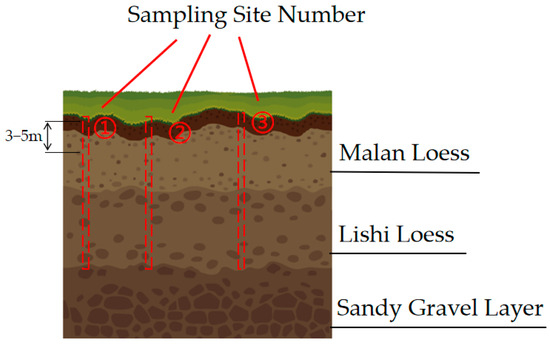
Figure 8.
Diagram of selected sampling points. Malan loess is a loose-textured loess deposited during the Late Pleistocene, widely distributed in the Loess Plateau. Lishi loess is an important stratigraphic unit of Quaternary aeolian accumulation in the Loess Plateau of China.
5. Judgment Method Test
The above method is universal and can be widely used to determine loess structural potential in most engineering sites comprehensively. A case study of the collapsible site near the Chuhuang Canal in Dali County, Shaanxi Province, is given to illustrate the method. As shown in Figure 9, collapsible loess layers from 1.5 to 20.0 m of Wells 1, 2, and 3 were selected in the in situ site, and one sample was taken every 3 m. Its microstructural indicators were tested and calculated according to the above methods, and the results are shown in Table 11. The experiment tests each sampling point’s macroscopic mechanical index-collapse coefficient and determines its grade, as shown in Table 12. By comparing Table 11 and Table 12, it can be found that the pore potential grade of the soil layer tested and divided according to this method is in good agreement with the collapsibility grade of the soil layer, indicating that the collapsibility coefficient of loess, a physical index, is mainly related to the large and medium void ratio of loess, and the determination method is accurate.
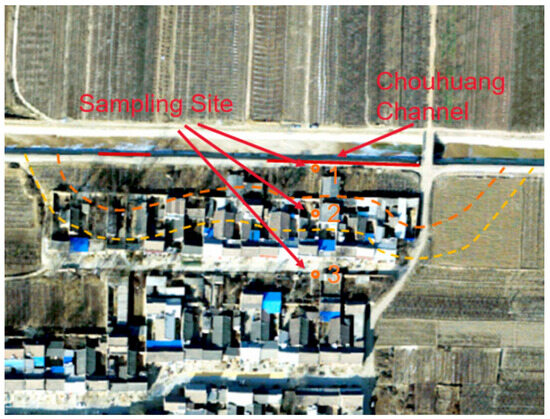
Figure 9.
Sketch of sampling points near Chouhuang channel.

Table 11.
Classification of the microscopic structural potential of the loess stratum in the drainage.

Table 12.
Collapse level of loess n.
Linear regression analysis elucidates the quantitative relationship between three structural potentials and the collapsibility coefficient. Univariate regression analysis revealed that pore potential exhibits the strongest correlation with the collapsibility coefficient, with an R2 value of 0.89 (p < 0.001), confirming the predominant role of pore structure in controlling collapsible deformation, in line with the research hypothesis. The particle size potential demonstrated a moderate positive correlation (R2 = 0.45, p < 0.01), suggesting that inadequate particle size distribution indirectly enhances collapsibility potential by compromising structural integrity. Conversely, the connection potential displayed a weak negative correlation (R2 = 0.38, p < 0.05), aligning with the finding that carbonates mitigate structural instability through ionic bonding. A multivariate regression model integrating these three structural potentials further improved predictive accuracy, achieving an R2 value of 0.92 (p < 0.01). The high degree of agreement between pore potential levels and collapsibility levels presented in Table 11 and Table 12 validates the framework’s effectiveness in linking microstructural characteristics to macroscopic mechanical behaviour, offering a reliable tool for assessing collapsibility risks in loess engineering.
6. Conclusions
Based on the definition of soil structure, the structural potential of soil is subdivided into three kinds of meso-structural potential, namely, grain size potential, pore potential, and connection potential. The correlation between them and comprehensive structural potential and other macroscopic mechanical indexes was studied through the fractal dimension of particle size, the ratio of large to medium pores, and the soluble salt content of soil particles. The main conclusions are as follows.
- (1)
- Based on the experimental results of reshaped loess particle analysis, it was found that the interval percentage curves of reshaped loess under different water content and pressure conditions all reached the peak point at the median particle size, with a “double peak” situation. The proportion of powder particles (2–50 μm) was the largest, the proportion of clay particles (<2 μm) was the second, and the proportion of sand particles (>50 μm) was the least. When the external pressure is constant, the change in water content has no noticeable effect on the particle distribution in the soil.
- (2)
- Based on Xie’s definition of structural quantitative index-comprehensive structural potential theory, soil structural potential is subdivided into three kinds of meso-structural potential: grain size, pore, and connection potential. The correlation between soil structural potential, comprehensive structural potential, and other macroscopic mechanical indexes was studied through the fractal dimension value of particle size, the ratio of large and medium pores, and the soluble salt content of soil particles.
- (3)
- A new method for evaluating the structural potential strength of loess based on macro and micro correlation was proposed. The method has the characteristics of macro and micro correlation, simplicity, high operability, and high accuracy. Under natural conditions, the reshaping of the loess in the test area has a high grain size potential, high pore potential, and medium connection potential. The soil samples show good gradation, high compressibility, strong collapsibility, and moderate soluble salt content.
This study still has certain limitations: The experimental samples were only taken from the Guanzhong area of Shaanxi Province and did not fully cover the loess types with different mineral compositions and soil-forming environments, which may affect the universality of our conclusions. Environmental factors only consider moisture content and pressure and do not involve complex conditions such as freeze–thaw cycles and long-term pressures. Dry density fixation may also limit the applicability of the frame to soils in different compaction states. Future research can further enhance the universality and prediction accuracy of the evaluation framework by expanding sample diversity and introducing multi-field coupling experiments and machine learning models.
Author Contributions
Conceptualization, Y.Z. and G.L.; methodology, M.S.; writing—original draft, C.C.; validation, Y.Z.; writing—review and editing, M.S.; funding acquisition, Y.Z. All authors have read and agreed to the published version of the manuscript.
Funding
This study was supported by the Shaanxi Provincial Department of Education Service Local Special Research Program Project (22JE018, 23JE018, 23JE019), the Open Research Fund of the Yangtze River Academy of Sciences (CKWV20231170/KY)), and the Young Talent Fund of the Association for Science and Technology in Shaanxi (20220719).
Data Availability Statement
Data are contained within the article.
Conflicts of Interest
Author Yao Zhang was employed by the company Northwest Engineering Corporation Limited at the time the research was conducted. The remaining authors declare that the research was conducted in the absence of any commercial or financial relationships that could be construed as a potential conflicts of interest.
References
- Weng, X.; Sun, Y.; Zhang, Y.; Niu, H.; Liu, X.; Dong, Y. Physical modeling of wetting-induced collapse of shield tunneling in loess strata. Tunn. Undergr. Space Technol. 2019, 90, 208–219. [Google Scholar] [CrossRef]
- Chen, Y.; Zhang, R.; Zi, J.; Han, J.; Liu, K. Evaluation of the treatment variables on the shear strength of loess treated by microbial induced carbonate precipitation. J. Mount. Sci. 2025, 22, 1075–1086. [Google Scholar] [CrossRef]
- Tang, K.; Qiu, J.; Lai, J.; Xue, F.; Wang, Z.; Li, X. Experimental investigation on deformation-failure mechanisms of a shallow-bias large-section loess tunnel induced by rainfall. Tunn. Undergr. Space Technol. 2025, 157, 106253. [Google Scholar] [CrossRef]
- Chen, Y.; Dong, M.; Cheng, C.; Han, J.; Zhao, Y.; Jia, P. Experimental and analytical study on the bearing capacity of caisson foundation subjected to V-H combined load. Mar. Georesour. Geotechnol. 2025, 1–13. [Google Scholar] [CrossRef]
- Ma, L.; Zhang, L.; Hou, X.; Guo, S.; Qi, S. Three-Dimensional Microstructure and Structural Representative Volume Element of the Intact and Remolded Loess. Appl. Sci. 2025, 15, 3120. [Google Scholar] [CrossRef]
- Wu, Z.; Xu, S.; Chen, D.; Zhao, D.; Zhang, D. An experimental study of the influence of structural parameters on dynamic characteristics of loess. Soil Dyn. Earthq. Eng. 2020, 132, 106067. [Google Scholar] [CrossRef]
- Lv, Q.; Sui, W.; Zhang, Z.; Gulmira, A. Macro–micro correlation analysis on the loess from Ili River Valley subjected to freeze–thaw cycles. Sci. Rep. 2024, 14, 19322. [Google Scholar] [CrossRef]
- Jiang, M.; Zhang, H.; Sun, R. Investigating the shear behaviors of unsaturated structured loess in direct shear test by the discrete element method. Jpn. Geotech. Soc. Spec. Publ. 2020, 8, 294–298. [Google Scholar] [CrossRef][Green Version]
- Asadoullahtabar, S.R.; Asgari, A.; Tabari, M.M.R. Assessment, identifying, and presenting a plan for the stabilization of loessic soils exposed to scouring in the path of gas pipelines, case study: Maraveh-Tappeh city. Eng. Geol. 2024, 342, 107747. [Google Scholar] [CrossRef]
- Li, X.A.; Sun, J.; Ren, H.; Lu, T.; Ren, Y.; Pang, T. The effect of particle size distribution and shape on the microscopic behaviour of loess via the DEM. Environ. Earth Sci. 2022, 81, 290. [Google Scholar] [CrossRef]
- Wei, Y.Z.; Yao, Z.H.; Chong, X.L.; Zhang, J.H.; Zhang, J. Microstructure of unsaturated loess and its influence on strength characteristics. Sci. Rep. 2022, 12, 1502. [Google Scholar] [CrossRef] [PubMed]
- Zheng, H.; Li, X.A.; Deng, Y.H.; Hao, Z.T.; Wen, F. Study on the influence of initial state on loess erosion characteristics and microscopic mechanism. Sustainability 2023, 15, 4676. [Google Scholar] [CrossRef]
- Pan, L.; Zhu, J.G.; Zhang, Y.F. Evaluation of structural strength and parameters of collapsible loess. Int. J. Geomech. 2021, 21, 04021066. [Google Scholar] [CrossRef]
- Miao, F.; Zhao, F.; Wu, Y.; Li, L.; Ding, Y.; Meng, J. Macro and micro connections for slip zone soils of landslide under wetting–drying cycles in the Three Gorges Reservoir area. Landslides 2024, 21, 737–752. [Google Scholar] [CrossRef]
- Li, P.; Xie, W.; Pak, R.Y.; Vanapalli, S.K. Microstructural evolution of loess soils from the Loess Plateau of China. Catena 2019, 173, 276–288. [Google Scholar] [CrossRef]
- Li, X.A.; Li, L.; Song, Y.; Hong, B.; Wang, L.; Sun, J. Characterization of the mechanisms underlying loess collapsibility for land-creation project in Shaanxi Province, China—A study from a micro perspective. Eng. Geol. 2019, 249, 77–88. [Google Scholar] [CrossRef]
- Li, Y.; Zhang, T.; Zhang, Y.; Xu, Q. Geometrical appearance and spatial arrangement of structural blocks of the Malan loess in NW China: Implications for the formation of loess columns. J. Asian Earth Sci. 2018, 158, 18–28. [Google Scholar] [CrossRef]
- Ng, C.W.W.; Sadeghi, H.; Hossen, S.B.; Chiu, C.F.; Alonso, E.E.; Baghbanrezvan, S. Water retention and volumetric characteristics of intact and re-compacted loess. Can. Geotech. J. 2016, 53, 1258–1269. [Google Scholar] [CrossRef]
- Liu, Z.; Liu, F.; Ma, F.; Wang, M.; Bai, X.; Zheng, Y.; Zhang, G. Collapsibility, composition, and microstructure of loess in China. Can. Geotech. J. 2016, 53, 673–686. [Google Scholar] [CrossRef]
- Li, Y.; Zhang, W.; Aydin, A.; Deng, X. Formation of calcareous nodules in loess–paleosol sequences: Reviews of existing models with a proposed new “per evapotranspiration model”. J. Asian Earth Sci. 2018, 154, 8–16. [Google Scholar] [CrossRef]
- Chen, H.; Jiang, Y.; Niu, C.; Leng, G.; Tian, G. Dynamic characteristics of saturated loess under different confining pressures: A microscopic analysis. Bull. Eng. Geol. Environ. 2019, 78, 931–944. [Google Scholar] [CrossRef]
- Chen, H.; Jiang, Y.; Gao, Y.; Yuan, X. Structural characteristics and its influencing factors of typical loess. Bull. Eng. Geol. Environ. 2019, 78, 4893–4905. [Google Scholar] [CrossRef]
- Xie, D.Y.; Qi, J.L.; Zhang, Z.Z. A constitutive law considering soil structural properties. China Civ. Eng. J. 2000, 33, 35–41. [Google Scholar]
- Xie, D.Y.; Qi, J.L.; Zhu, Y.L. Soil structure parameter and its relations to deformation and strength. J. Hydraul. Eng. 1999, 30, 1–6. [Google Scholar]
- Chen, C.L.; Shao, S.J.; Deng, G.H. Relationship between soil structural parameters and strength and its application in slope stability analysis. Journal of Central South University. Sci. Technol. 2010, 41, 328–334. [Google Scholar]
- Luo, F.; Zhang, G.; Yao, Y. Macro-micro tests of cohesive soil under varied normal and shear stresses subjected to drying-wetting cycles. J. Rock Mech. Geotech. Eng. 2024, in press. [Google Scholar] [CrossRef]
- Li, Y.; Wang, Y.; Aydin, A. Loess structure: Evolution and a scale-based classification. Earth Sci. Rev. 2024, 249, 104665. [Google Scholar] [CrossRef]
- ASTM. Annual Book of ASTM Standards; ASTM International, American Society for Testing Materials: West Conshohocken, PA, USA, 2009. [Google Scholar]
- GB/T 50123-2019; Standard for Geotechnical Testing Method. Construction Ministry of PRC: Beijing, China, 2019.
- Wu, J.; Yang, N.; Li, P.; Yang, C. Influence of moisture content and dry density on the compressibility of disturbed loess: A case study in Yan’an City, China. Sustainability 2023, 15, 6212. [Google Scholar] [CrossRef]
- Wang, J.D.; Li, P.; Ma, Y.; Vanapalli, S.K. Evolution of pore-size distribution of intact loess and remolded loess due to consolidation. J. Soils Sediments 2019, 19, 1226–1238. [Google Scholar] [CrossRef]
- Wang, H.; Ni, W.; Liu, H.; Huang, M.; Yuan, K.; Li, L.; Li, X. Study of the repeated collapsibility of undisturbed loess in Guyuan, China. Bull. Eng. Geol. Environ. 2021, 80, 6321–6330. [Google Scholar] [CrossRef]
- Yu, B.; Fan, W.; Dijkstra, T.A.; Wei, Y.N.; Deng, L.S. Pore structure evolution due to loess collapse: A comparative study using MIP and X-ray micro-CT. Geoderma 2022, 424, 115955. [Google Scholar] [CrossRef]
- Tao, G.L. Fractal Approach on Pore Structure of Rock and Soil Porous Media and Its Applications. Ph.D. Thesis, Wuhan University of Technology, Wuhan, China, 2010. [Google Scholar]
Disclaimer/Publisher’s Note: The statements, opinions and data contained in all publications are solely those of the individual author(s) and contributor(s) and not of MDPI and/or the editor(s). MDPI and/or the editor(s) disclaim responsibility for any injury to people or property resulting from any ideas, methods, instructions or products referred to in the content. |
© 2025 by the authors. Licensee MDPI, Basel, Switzerland. This article is an open access article distributed under the terms and conditions of the Creative Commons Attribution (CC BY) license (https://creativecommons.org/licenses/by/4.0/).