Article

Experimental and Finite Element Study on Wooden Joints Strengthened by Detachable Steel Sleeves

1
Department of Civil Engineering, Jiangsu University of Science and Technology, Changhui Road, Dantu District, Zhenjiang 212100, China
2
Guizhou Zhongjian Weiye Construction (Group) Co., Ltd., Kaili 556000, China
3
Department of Civil Engineering, Kaili University, Kaiyuan Road, Economic Development Zone, Kaili 556011, China
*
Authors to whom correspondence should be addressed.
Buildings 2025, 15(12), 2139; https://doi.org/10.3390/buildings15122139
Submission received: 8 May 2025 / Revised: 2 June 2025 / Accepted: 5 June 2025 / Published: 19 June 2025
(This article belongs to the Section Building Structures)

Abstract

We designed detachable steel sleeves to reinforce wooden joints and improve their integrity under earthquake action and investigated their mechanical properties. Monotonic bending tests were performed on a half-tenon pure wooden joint and a joint strengthened by a detachable steel sleeve. More obvious tenon pulling-out failure was observed in the pure wood joint; in comparison, only slight extrusion fracture of wooden beams and extrusion deformation of steel sleeves occurred in the wood joint reinforced by a detachable steel sleeve. Our test results showed that the initial rotational stiffness of the strengthened joint, JG1, was increased by 495.4% compared with that of the unstrengthened joint, JG0. The yield bending moment increased by 425.9%, and the ultimate bending moment increased by 627.5%, which indicated that the mechanical performance was significantly improved when the joint was reinforced by a detachable steel sleeve. Numerical simulations of different components were performed with finite element analysis software to analyze the mechanical performance of the reinforced joint. It was found that the stiffness and ultimate flexural performance of the joint could be increased by setting stiffeners on the steel sleeve and connecting the wooden column with self-tapping screws. The results of the tests were compared with those obtained through finite element analysis, and a high degree of accuracy was achieved, which could provide a theoretical basis for the reinforcement of timber structural buildings.

1. Introduction

Over time, the wooden structures of ancient buildings in China have suffered severe damage to their components and degradation of material properties due to natural and human factors. As a result, the seismic performance and security design of joints in such buildings face significant challenges. Some of these buildings are at high risk of collapse and require urgent repair and protection. Mortise–tenon joints play a significant role in shock absorption; the reinforcement of mortise–tenon connectors is thus of particular importance in such buildings.
At present, the number of studies on the wooden structures of ancient buildings is increasing rapidly, both on domestic and international fronts, and research directions such as assessing the mechanical properties of mortise and tenon joints, the reinforcement of timber structures, and numerical simulations and analysis are receiving increasing attention from experts and scholars through theoretical analyses and experiments. Relevant achievements in this regard are now collated to provide references and insights for subsequent research. The results presented in the current article not only successfully enrich the understanding of the performance characteristics of ancient wooden building structures but also provide robust theoretical underpinnings and practical guidelines for the preservation and inheritance of China’s precious cultural heritage.
For the reinforcement of mortise–tenon joints in timber structure systems, iron components are commonly used to improve the load-bearing capacity and seismic performance of the otherwise purely wooden joints.
The authors of References [1,2] employed three different composite materials to reinforce wooden beams and performed bending tests, the results of which demonstrated that wooden beams reinforced with carbon fiber-reinforced plastic (CFRP) strips and special reinforced polyester (SRP) strips suffered no damage; in comparison, wooden beams reinforced with CFRP sheets were damaged via the fracture of carbon fibers. Of note, CFRP reinforcement can reduce the amount of tenon pull-out visibly at mortise–tenon joints.
In other studies, low-carbon steel bolts, self-tapping screws, and CFRP have been used to reinforce wooden beams, and the mechanical properties of such beams under monotonic loading have been examined in depth. Based on the results of a number of in-depth experiments, it was demonstrated that the mechanical performance of wooden beams dramatically improved when these methods were employed [3].
The authors of [4,5] established that building frames can be transformed and reinforced using steel with a low yield point to enhance the seismic performance of buildings.
Flexural test studies on rectangular wooden beams reinforced by fiber-reinforced plastics (FRPs) were meticulously conducted in [6,7,8]. The test results showed that the expansion of the original cracks in the wooden beams could be effectively inhibited by FRP during the bending process, the integrity and stability of the wooden beams were notably well maintained, and the flexural bearing capacity and stiffness of the wooden beams could be significantly improved.
In other studies, it was found that an obviously synergistic effect was present in the combination of steel and different materials and that the mechanical properties of joints could be effectively improved through this combination action [9,10,11].
A scheme for optimizing the friction effect in the finite element method was proposed in [12], and the calculation deviation caused by ignoring friction was successfully avoided.
The finite element analysis software ABAQUS was employed in [13,14] to conduct a simulation analysis of the compression–bending performance of wooden beams strengthened with CFRP. A linear elastic isotropic model was adopted for CFRP, whereas an orthotropic model was utilized for wood, and a nonlinear finite element analysis method for strengthening wooden beams was proposed.
The authors of [15] used the discrete element method (EDEM) to successfully develop a dynamic load analysis program. A traditional Japanese timber structure building at a scale of 1:9 was simulated to investigate its failure mechanism under dynamic loads.
The joints of wooden beams and columns were reinforced with different materials through experiments in [16,17,18], and a large amount of highly effective data was obtained. A steel tube was reinforced with a new type of foam material and subjected to pseudostatic tests to investigate its mechanical performance after being filled with foam. It was concluded that the deformation capacity of the steel tube significantly increased [19,20].
The structural properties of materials can be fully and effectively utilized to improve the ultimate bearing capacity and seismic performance of composite joints through the use of various materials, such as steel and CFRP, to reinforce wooden joints. Their safety and reliability can be enhanced when the composite joints bear external loads. The joint connection methods used in ancient wooden structures in the Qiandongnan region mostly comprise mortise and tenon joints. Due to the imperfect research and maintenance methods used for reinforcing wooden nodes with steel, a detachable steel sleeve was designed in this study to reinforce wooden joints effectively and facilitate the maintenance of the joints in subsequent use based on existing research on steel–timber composite structures. Monotonic bending tests were, respectively, performed on unreinforced pure wooden joints and joints reinforced with a detachable steel sleeve, and moment–rotation curves were obtained to compare the mechanical properties. Lastly, numerical simulation and comparative analysis of the tests were performed using finite element software to verify the feasibility of our numerical analysis results.

2. Test for Bending Performance

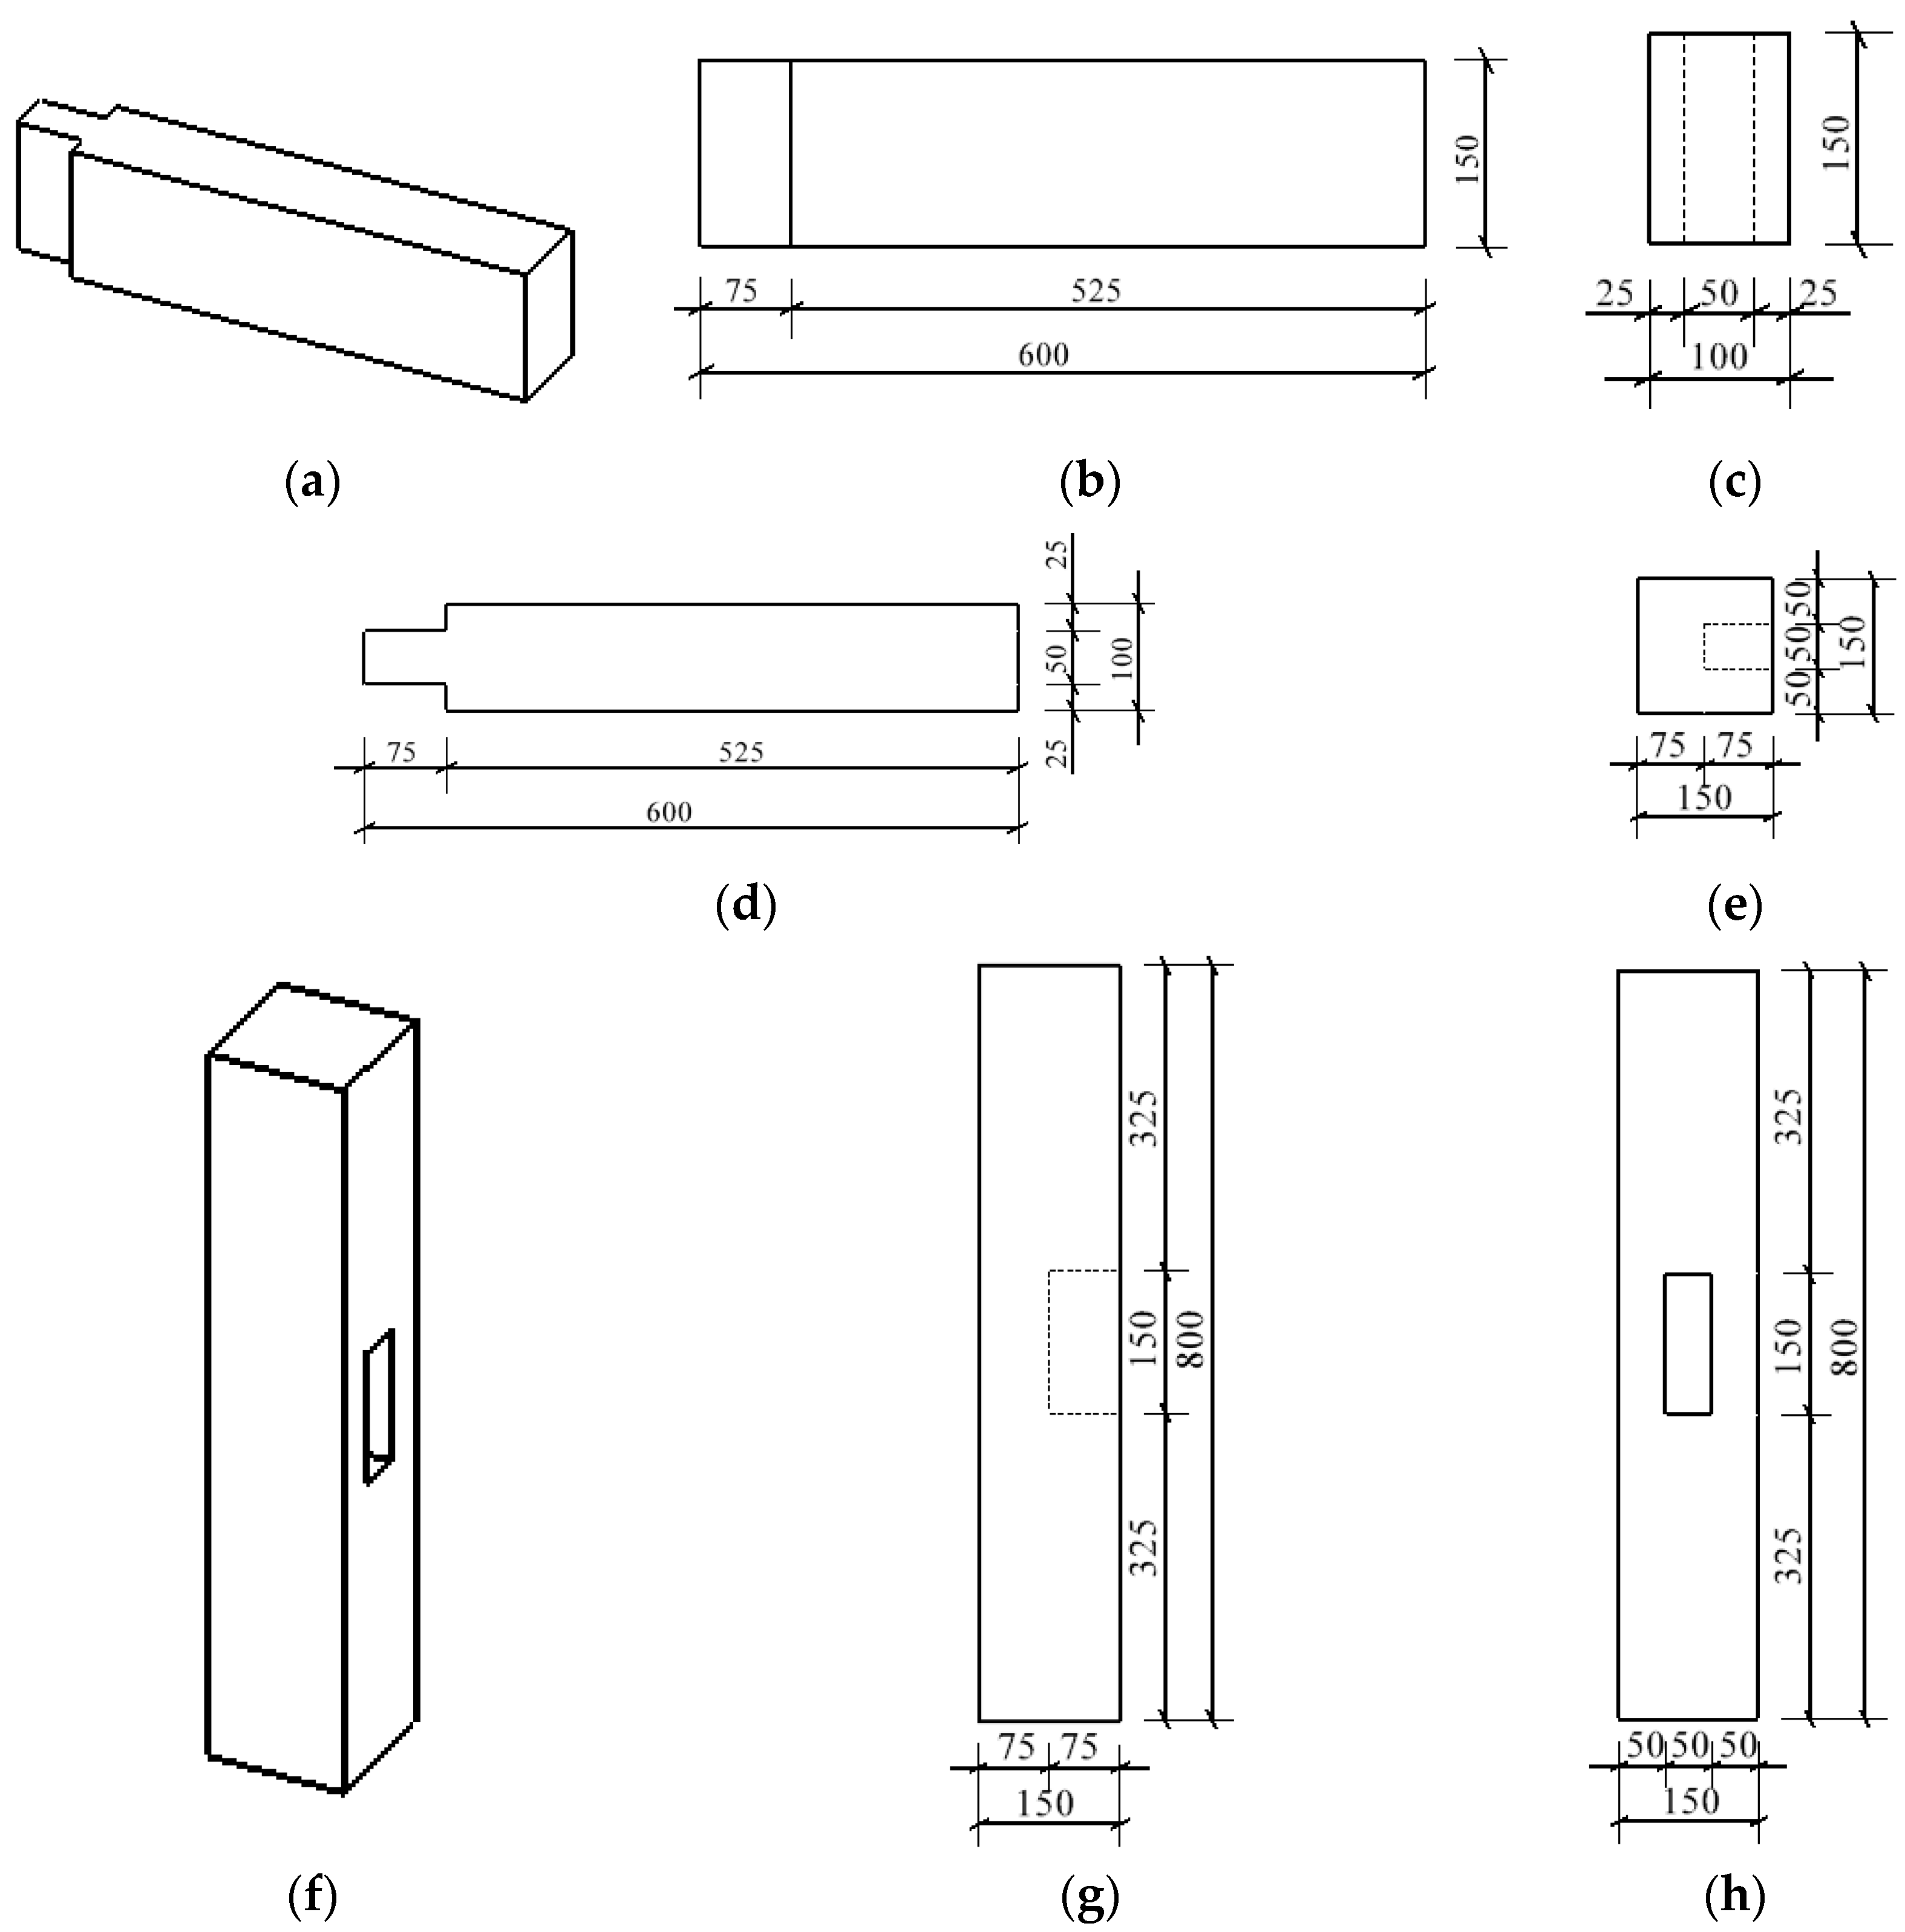
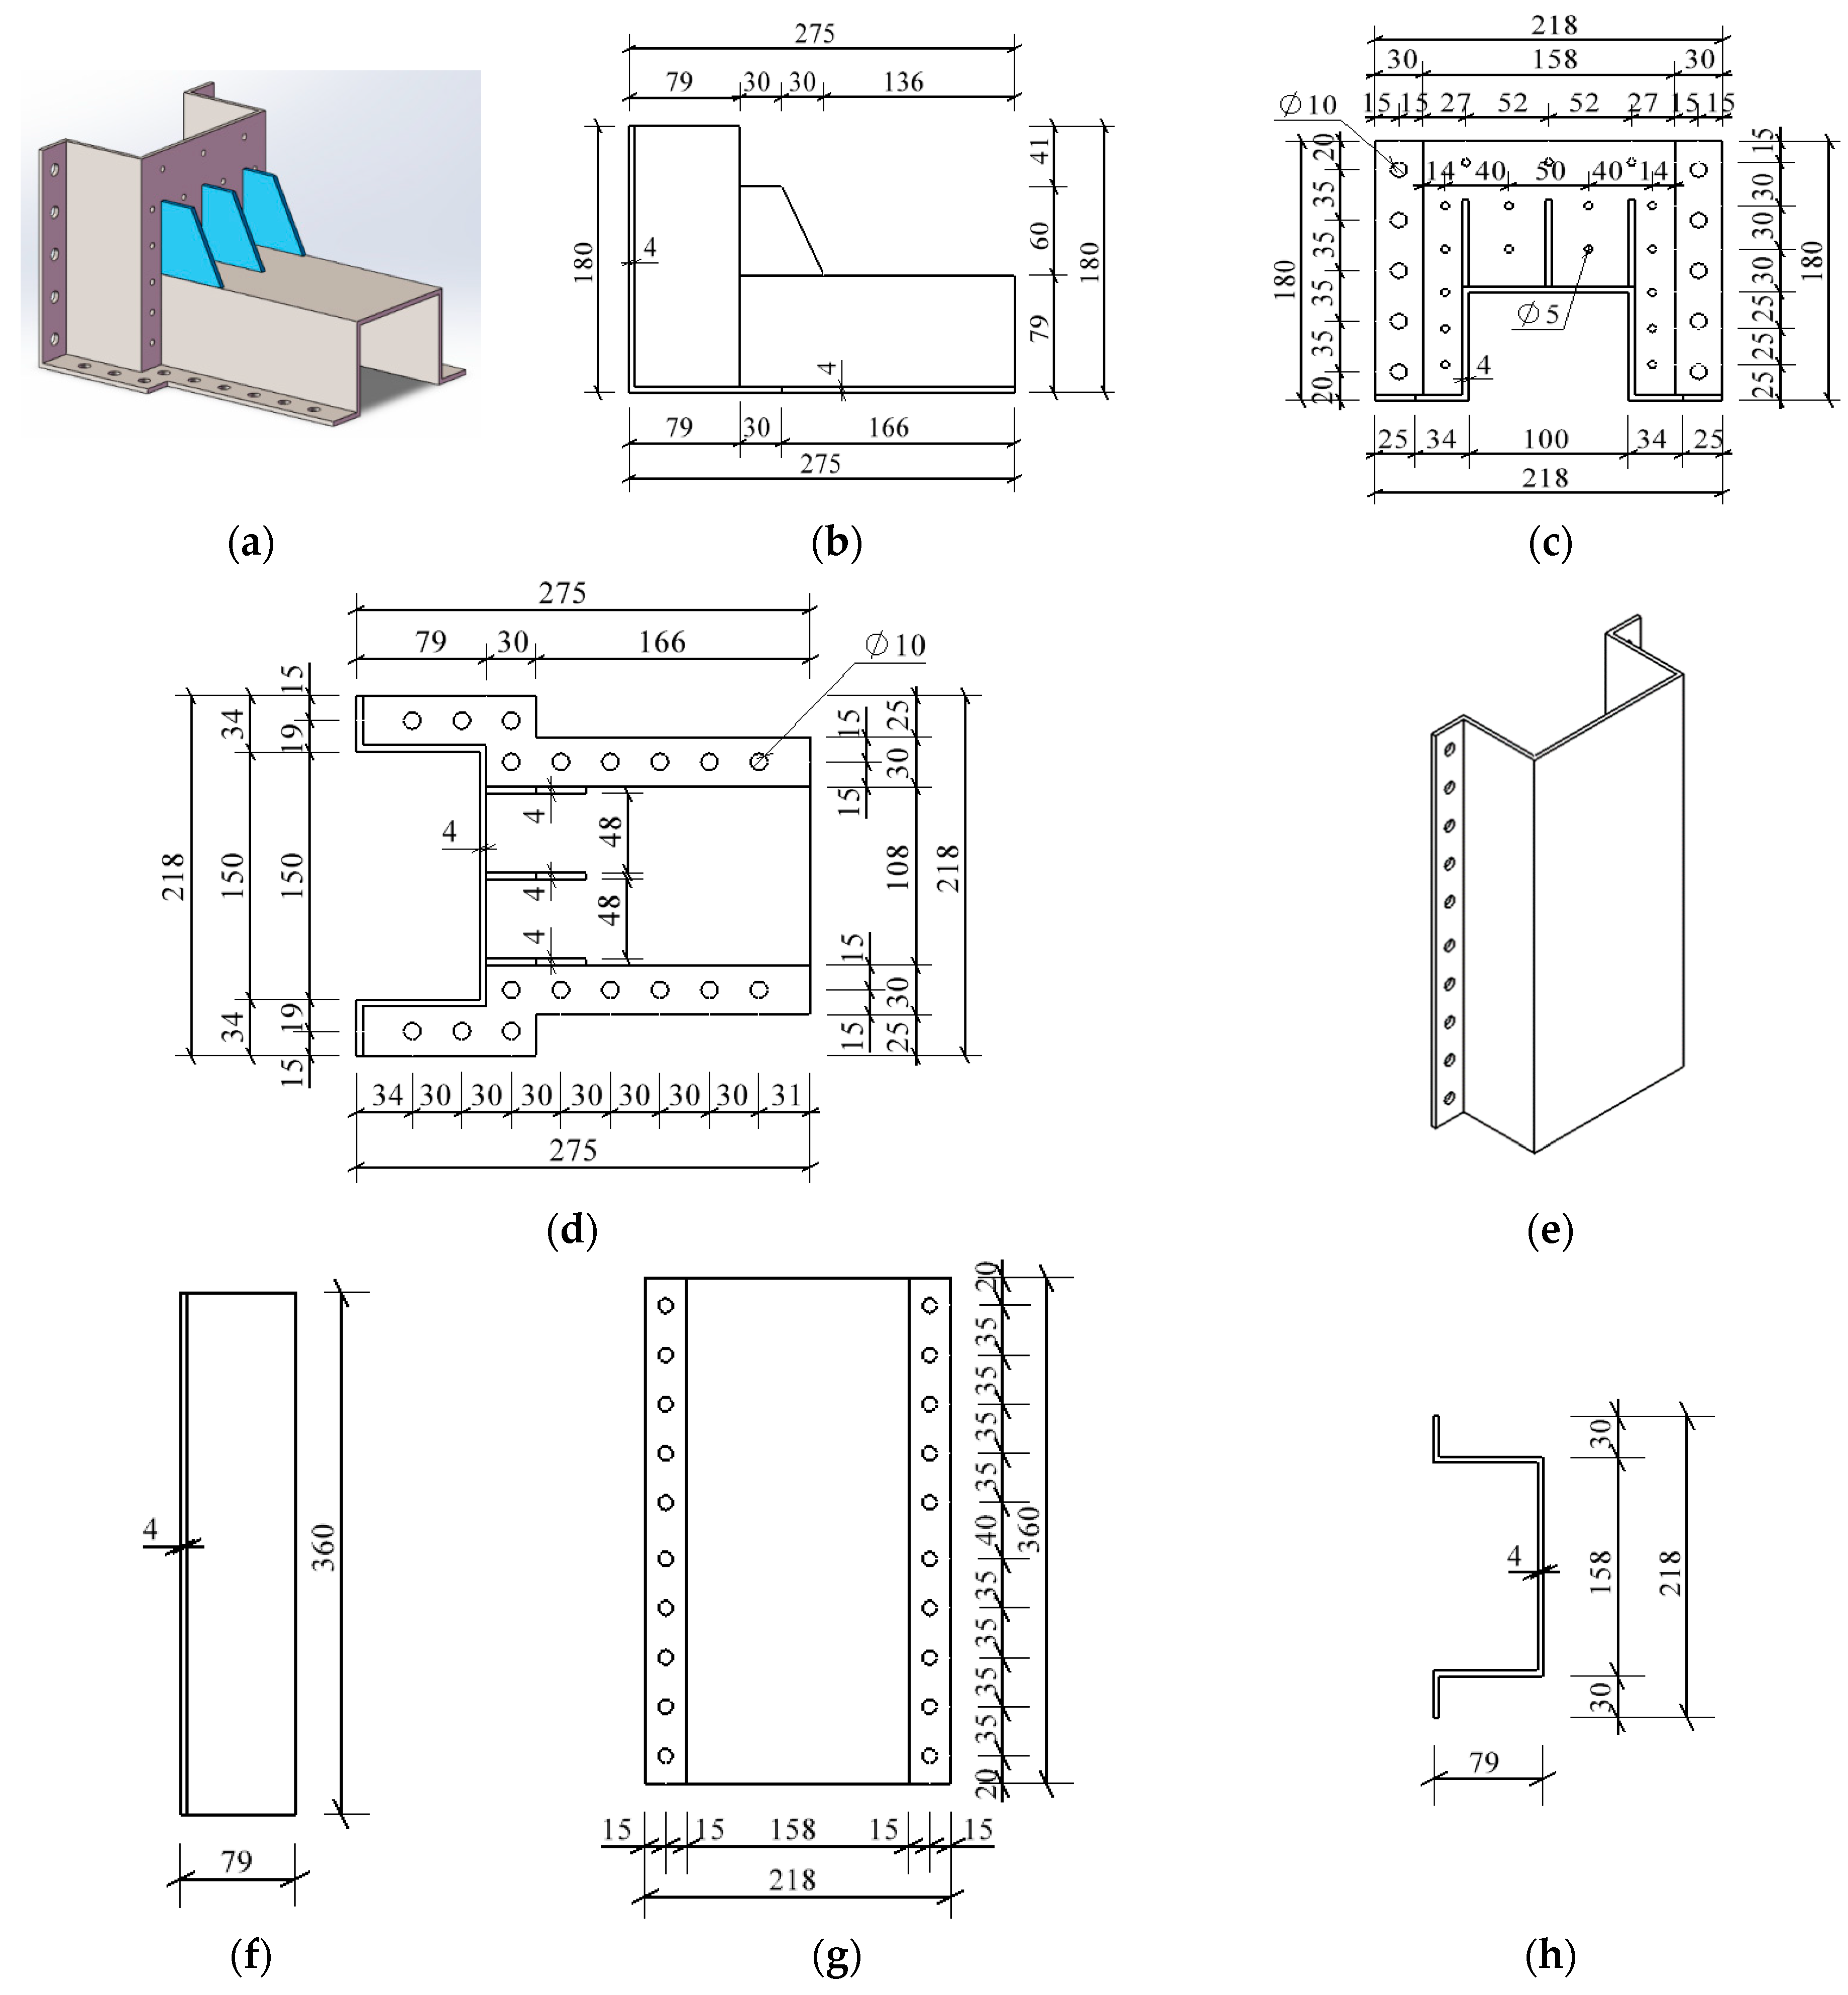
2.1. Specimen Design

(1)
Specimen Dimension
In this study, based on the traditional half-tenon wooden joints in the Qiandongnan region of Guizhou, the dimensions of the two different types of joints were meticulously designed; thereafter, two half-tenon wooden joint specimens were fabricated. The type of wood adopted was fir (Dantu District Xincheng Shuxin Building Materials Business Department, Zhenjiang, China). Of these joints, one was an unstrengthened pure wooden joint specimen, JG0, used for the comparison of mechanical performance, and the other was a wooden joint specimen, JG1, strengthened with a detachable steel sleeve. As shown in Figure 1, a square column with a cross-sectional dimension of 150 mm × 150 mm and a length of 600 mm was manufactured by utilizing the wooden material. A square beam with a cross-sectional dimension of 100 mm × 150 mm and a length of 800 mm was also fabricated using the same wood. The mortise in the wooden column was regarded as having a typical dimension of 50 mm × 150 mm and a depth of 75 mm. The tenon of the wooden beam had a cross-sectional dimension of 50 mm × 150 mm and a length of 75 mm.
All steel plates used in the test were Q235 grade steel, and the steel sleeve was intricately designed to be detachable and divided into three sections, including the column steel sleeve and the upper and lower steel sleeves of the beam, which were connected by bolts in the test. The cold-formed thin-walled steel was selected as the material for the steel plates of the sleeve, with a thickness of 4 mm. The stiffeners adopted were right trapezoidal cross-sectional plates with a thickness of 4 mm, as shown in Figure 2b, which were effectively arranged at the upper and lower steel sleeves of the beam and firmly connected through welding.
(2)
Fabrication of the specimen joints
Based on the processing dimensions of the designed components, fabrication of components, such as the beam–column and the steel sleeve, was, respectively, carried out in wood and steel processing plants. The single-component processing drawings, installation process, and finished joint are, respectively, presented in Figure 3.

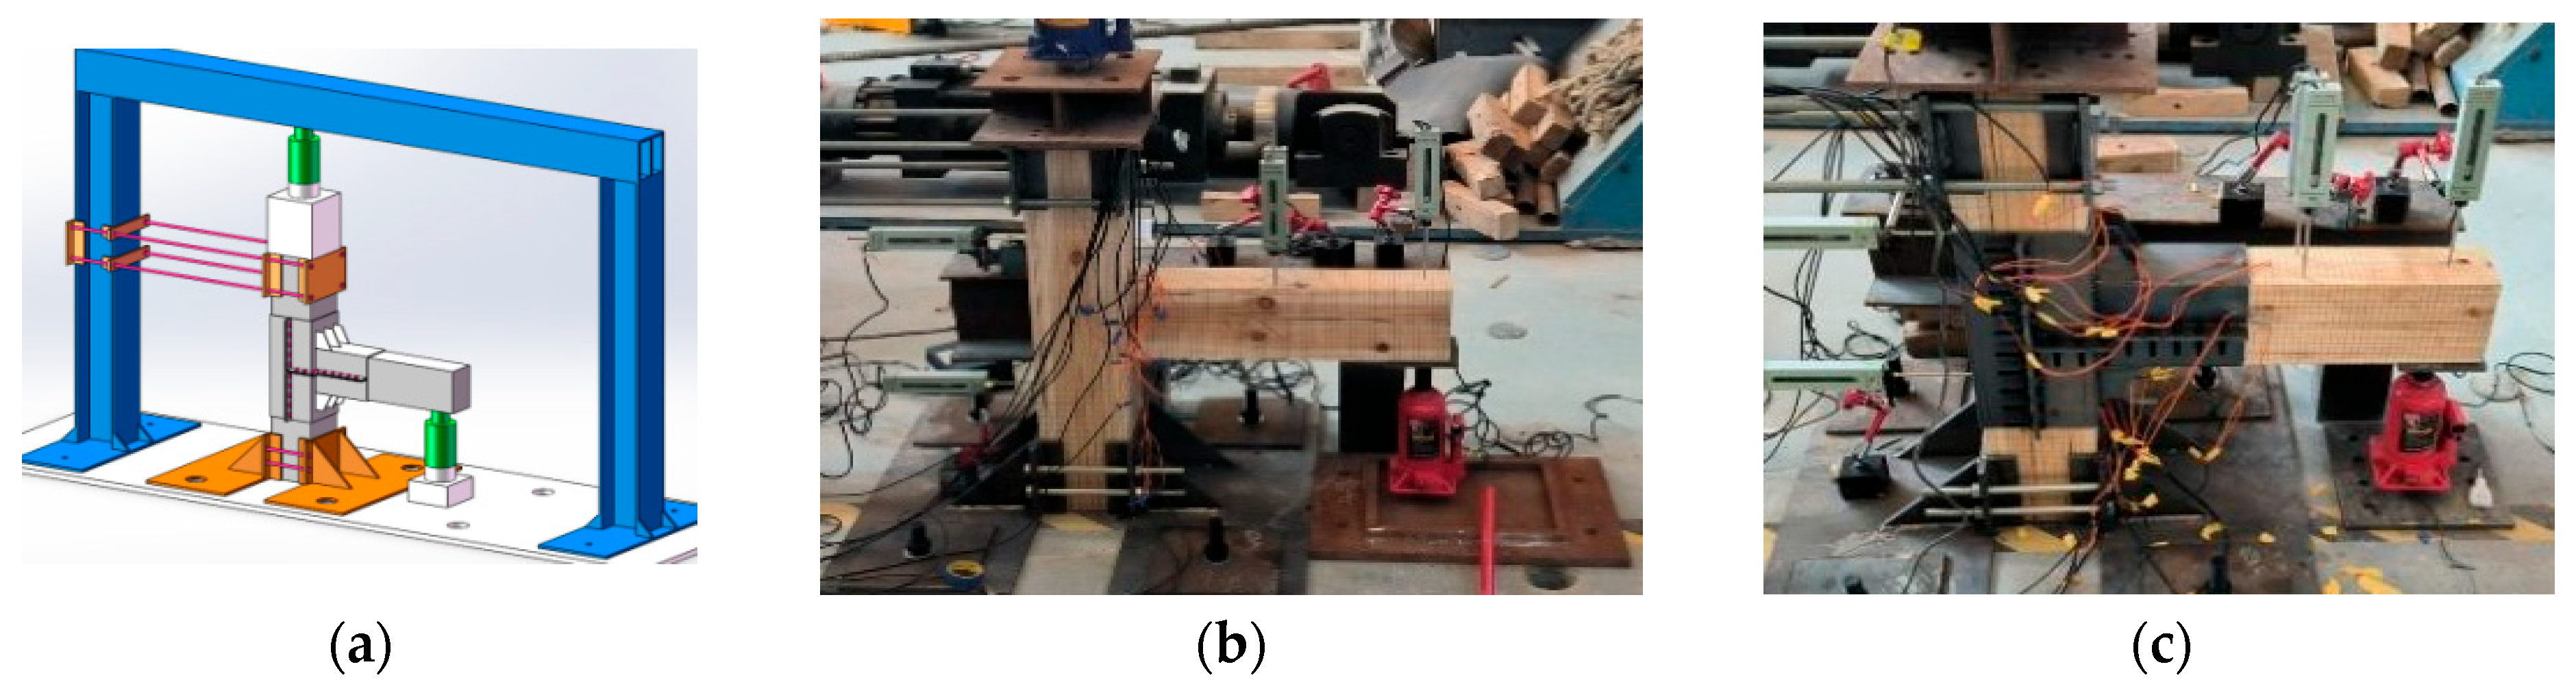
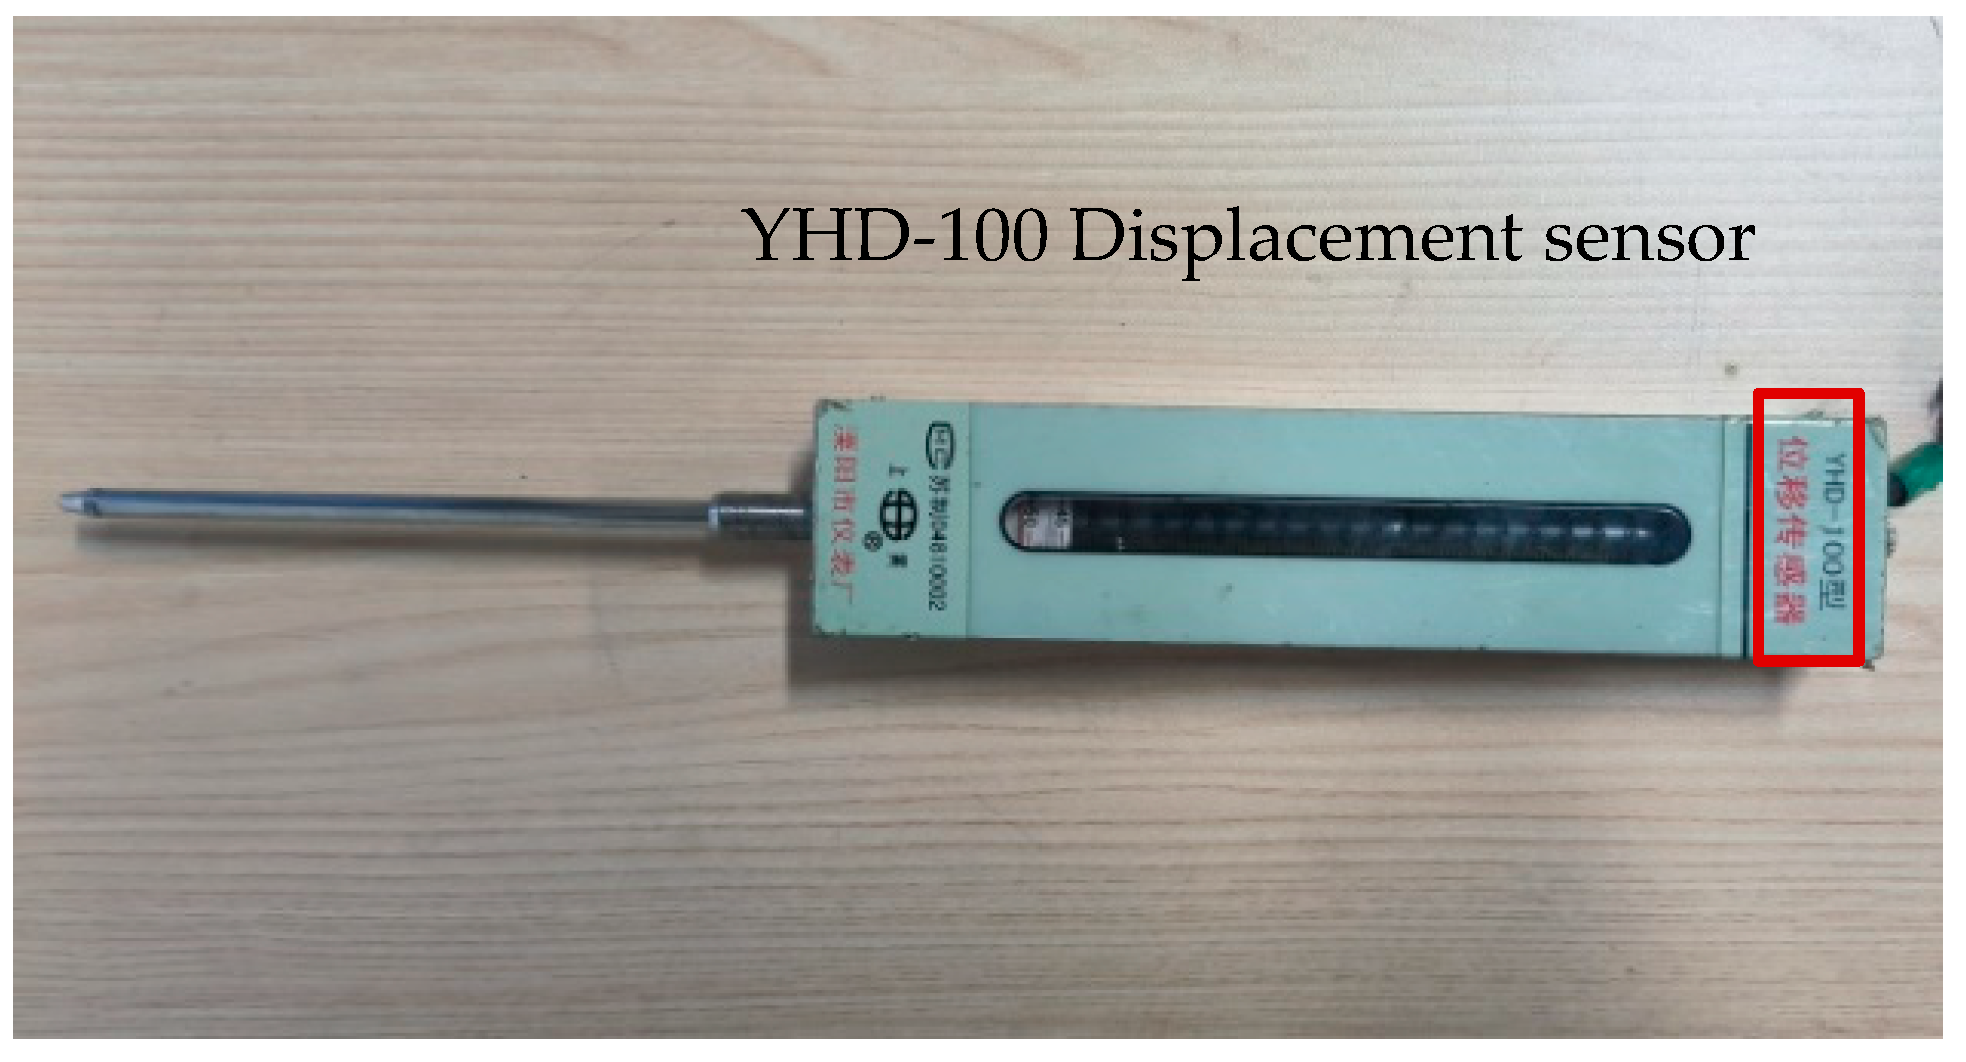
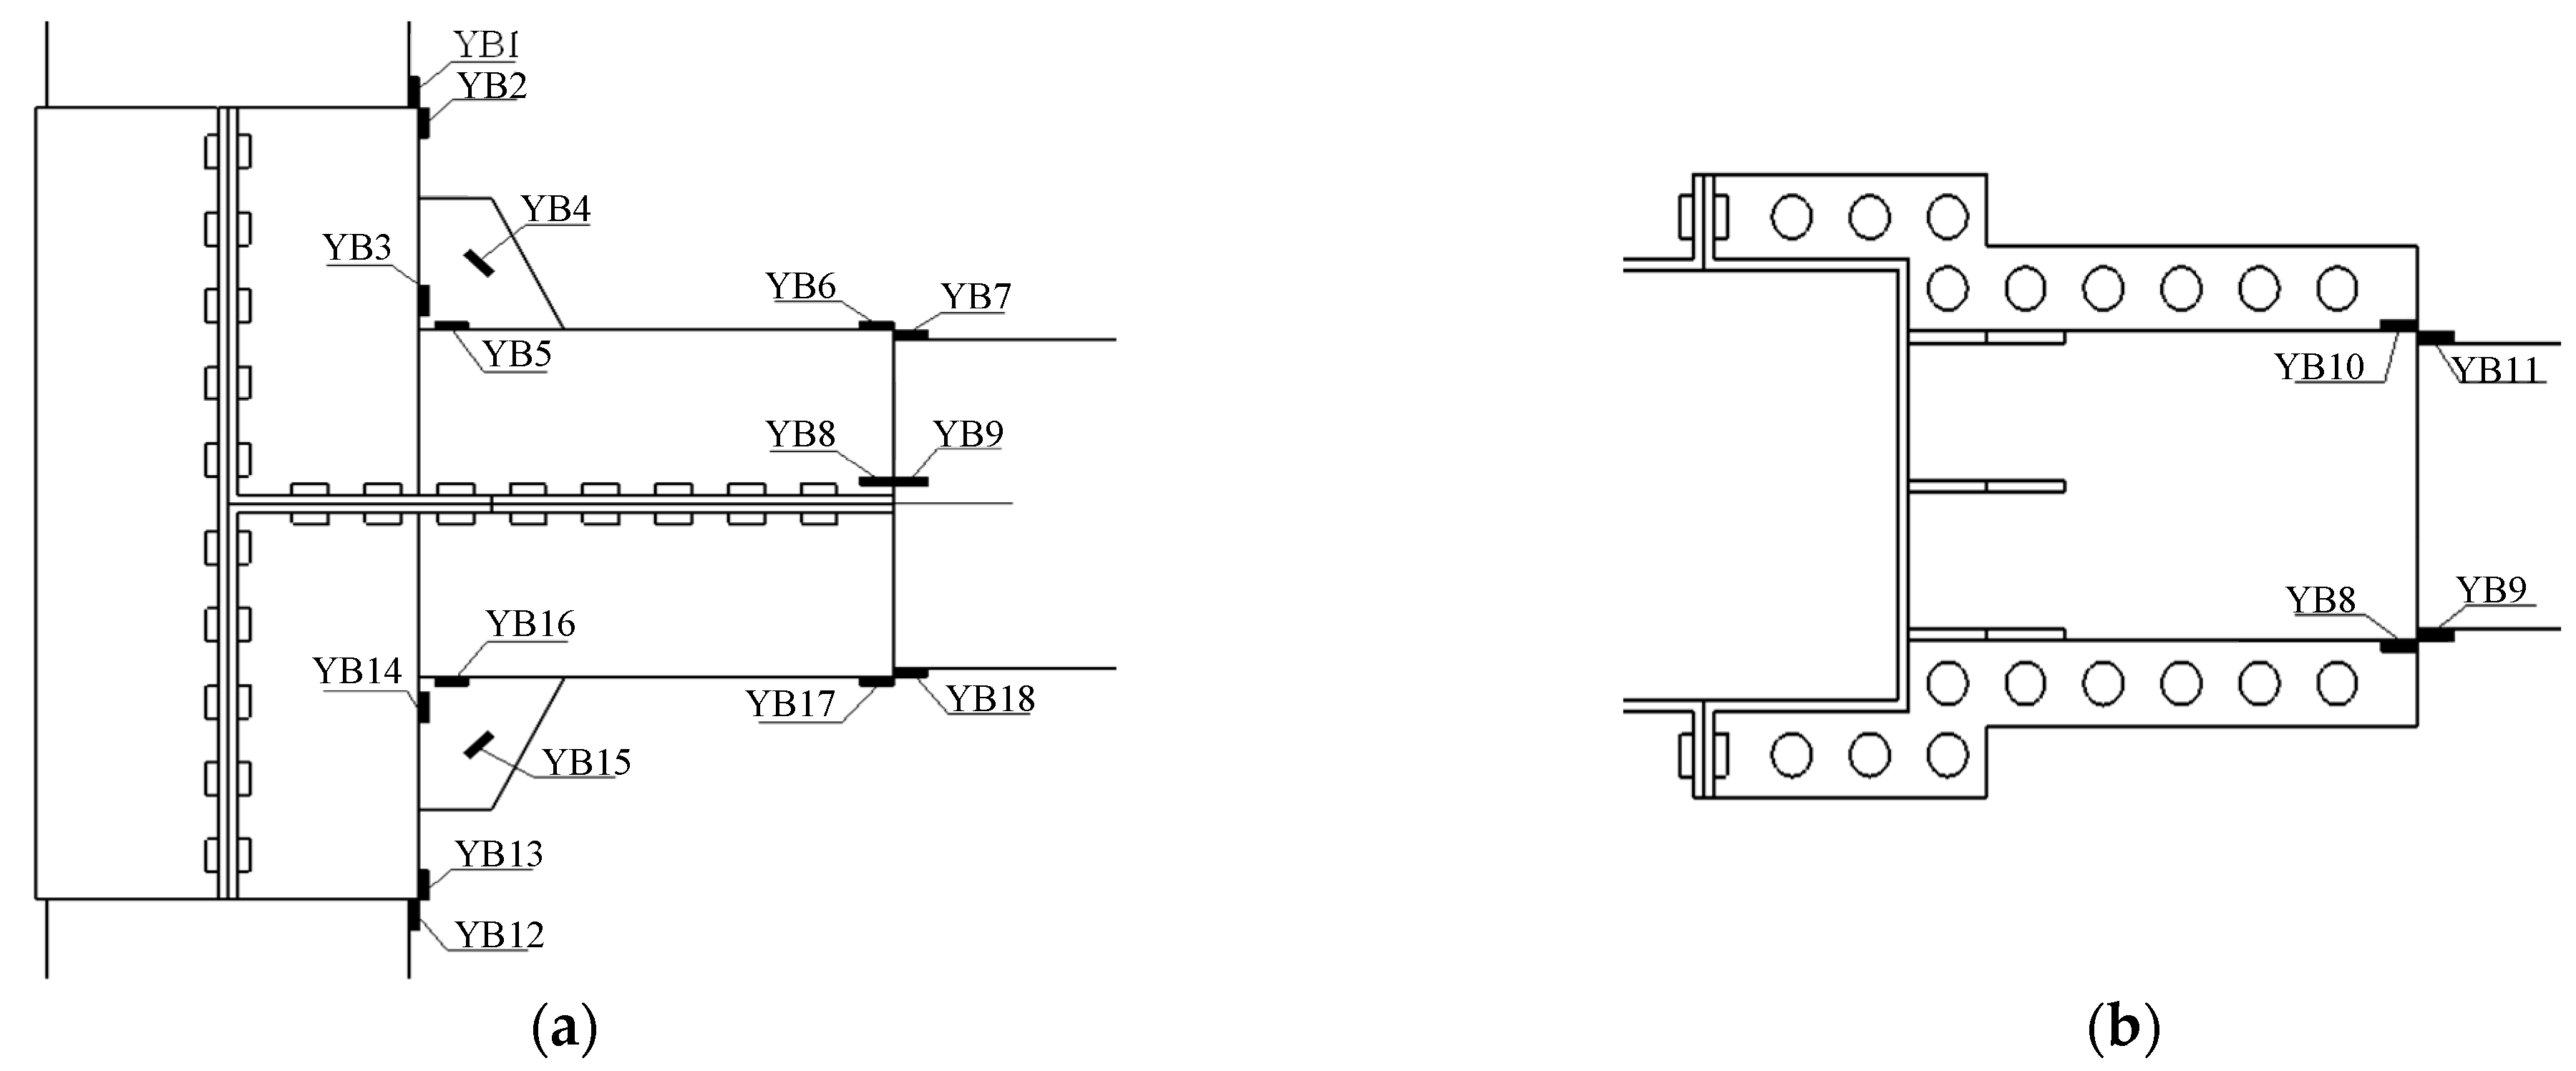
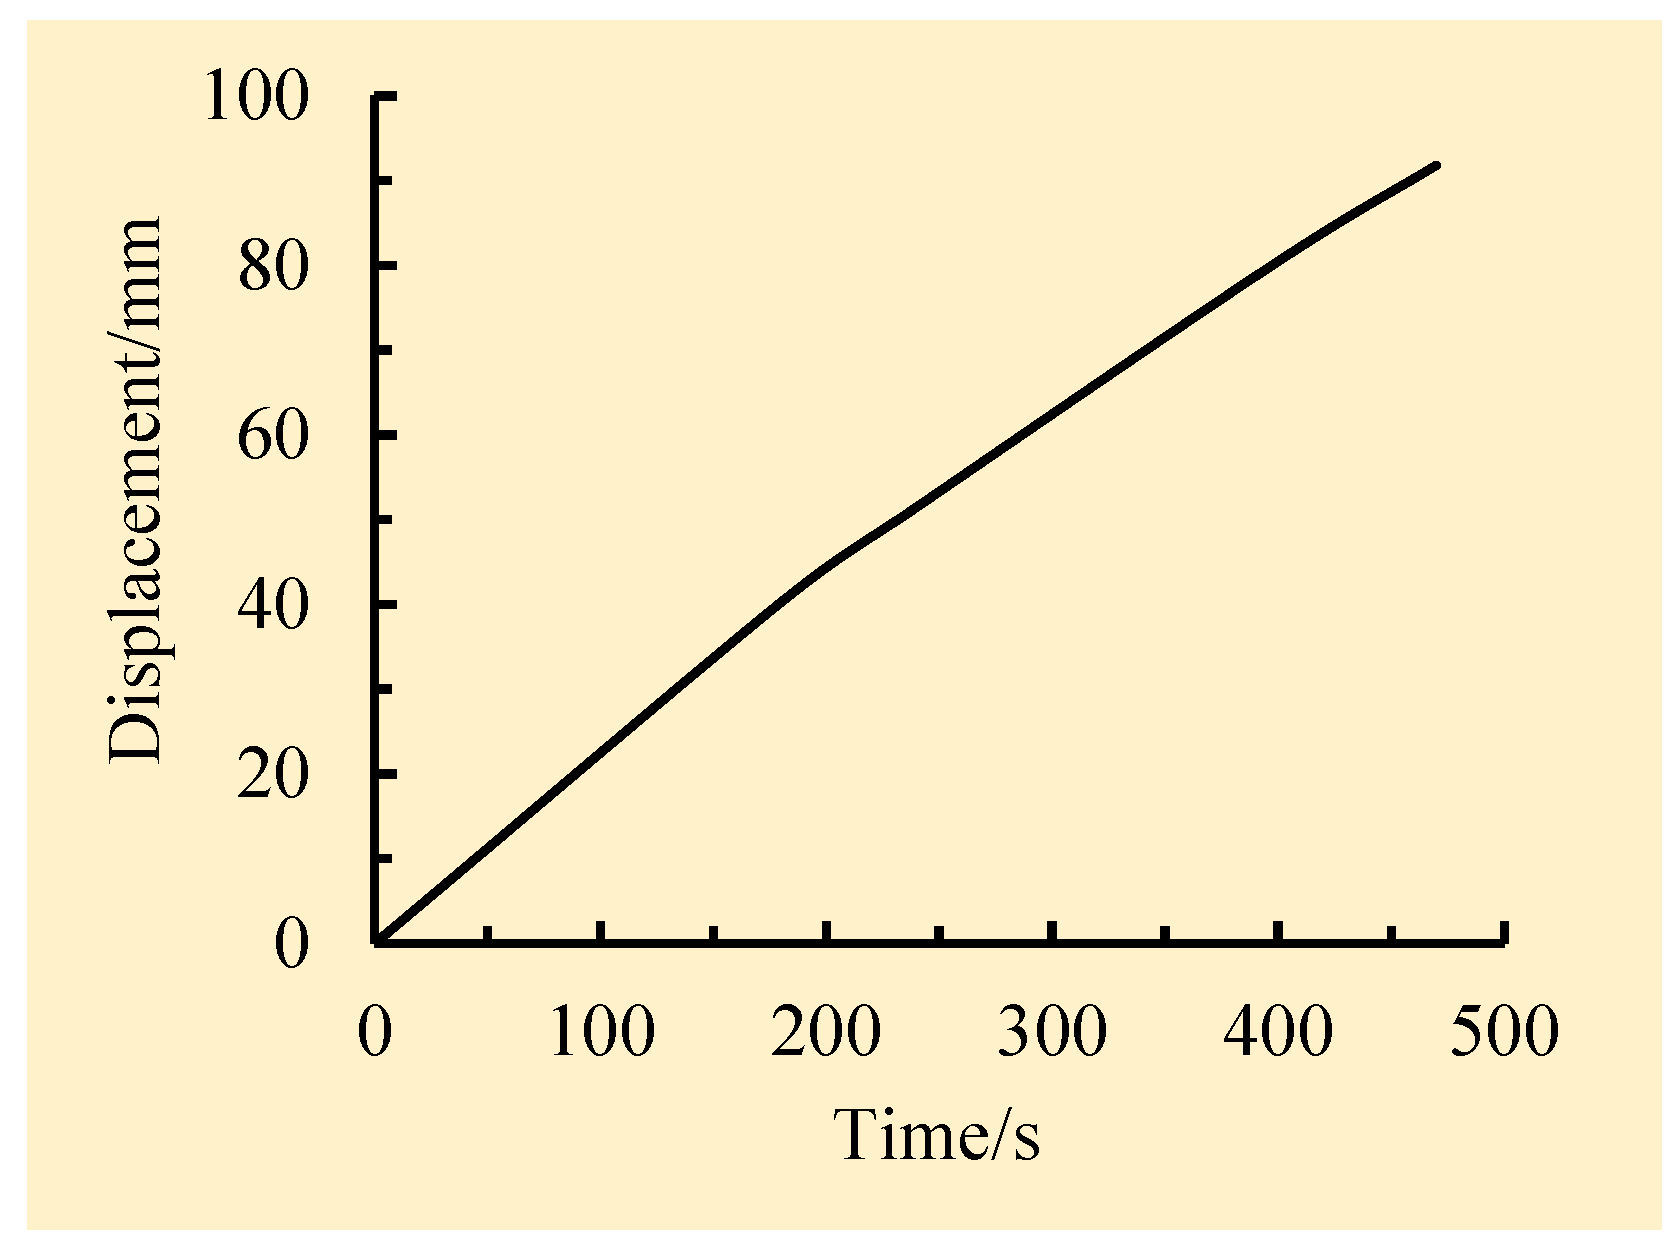
2.2. Loading Scheme and Data Collection

In order to conduct the monotonic bending test, the test device shown in Figure 4a was utilized. A constant vertical downward axial force was applied by a hydraulic jack to fix the wooden column, and the relevant values were measured using a pressure sensor. A concentrated load was applied upwards at the end of the beam using a displacement-controlled loading method during the test. The displacement amplitude at the first stage was set as 5 mm, with incremental increases of 5 mm at each subsequent stage, and was taken as the control displacement for the next stage. The test device used for upward loading at the beam end of the half-tenon wooden joint and the test diagrams of the two joints are shown in Figure 4. Strain gauges were appropriately arranged on the upper and lower surfaces of the wooden beam and the right-hand surface of the wooden column that was in contact with the steel sleeve. The strain values at each measurement point were measured using resistance strain gauges. The strain gauge data during the test were collected and analyzed using a GBD430 static strain tester (Dantu District Xincheng Shuxin Building Materials Business Department, Zhenjiang, China), as shown in Figure 5, and the displacement of the joint was measured using three displacement meters. The displacement meters employed were YHD-100-type displacement sensors (Dantu District Xincheng Shuxin Building Materials Business Department, Zhenjiang, China), as shown in Figure 6; two displacement gauges were symmetrically arranged with the center line of the beam as the symmetrical axis to detect whether the beam twists under monotonic static load. The third displacement gauge was used to measure the horizontal displacement at the column end. The strain values at each measuring point were precisely measured using resistance strain gauges, with the layout of the strain gauges shown in Figure 7. Monotonic loading was continued until the specimen failed. The displacement loading procedure is shown in Figure 8.

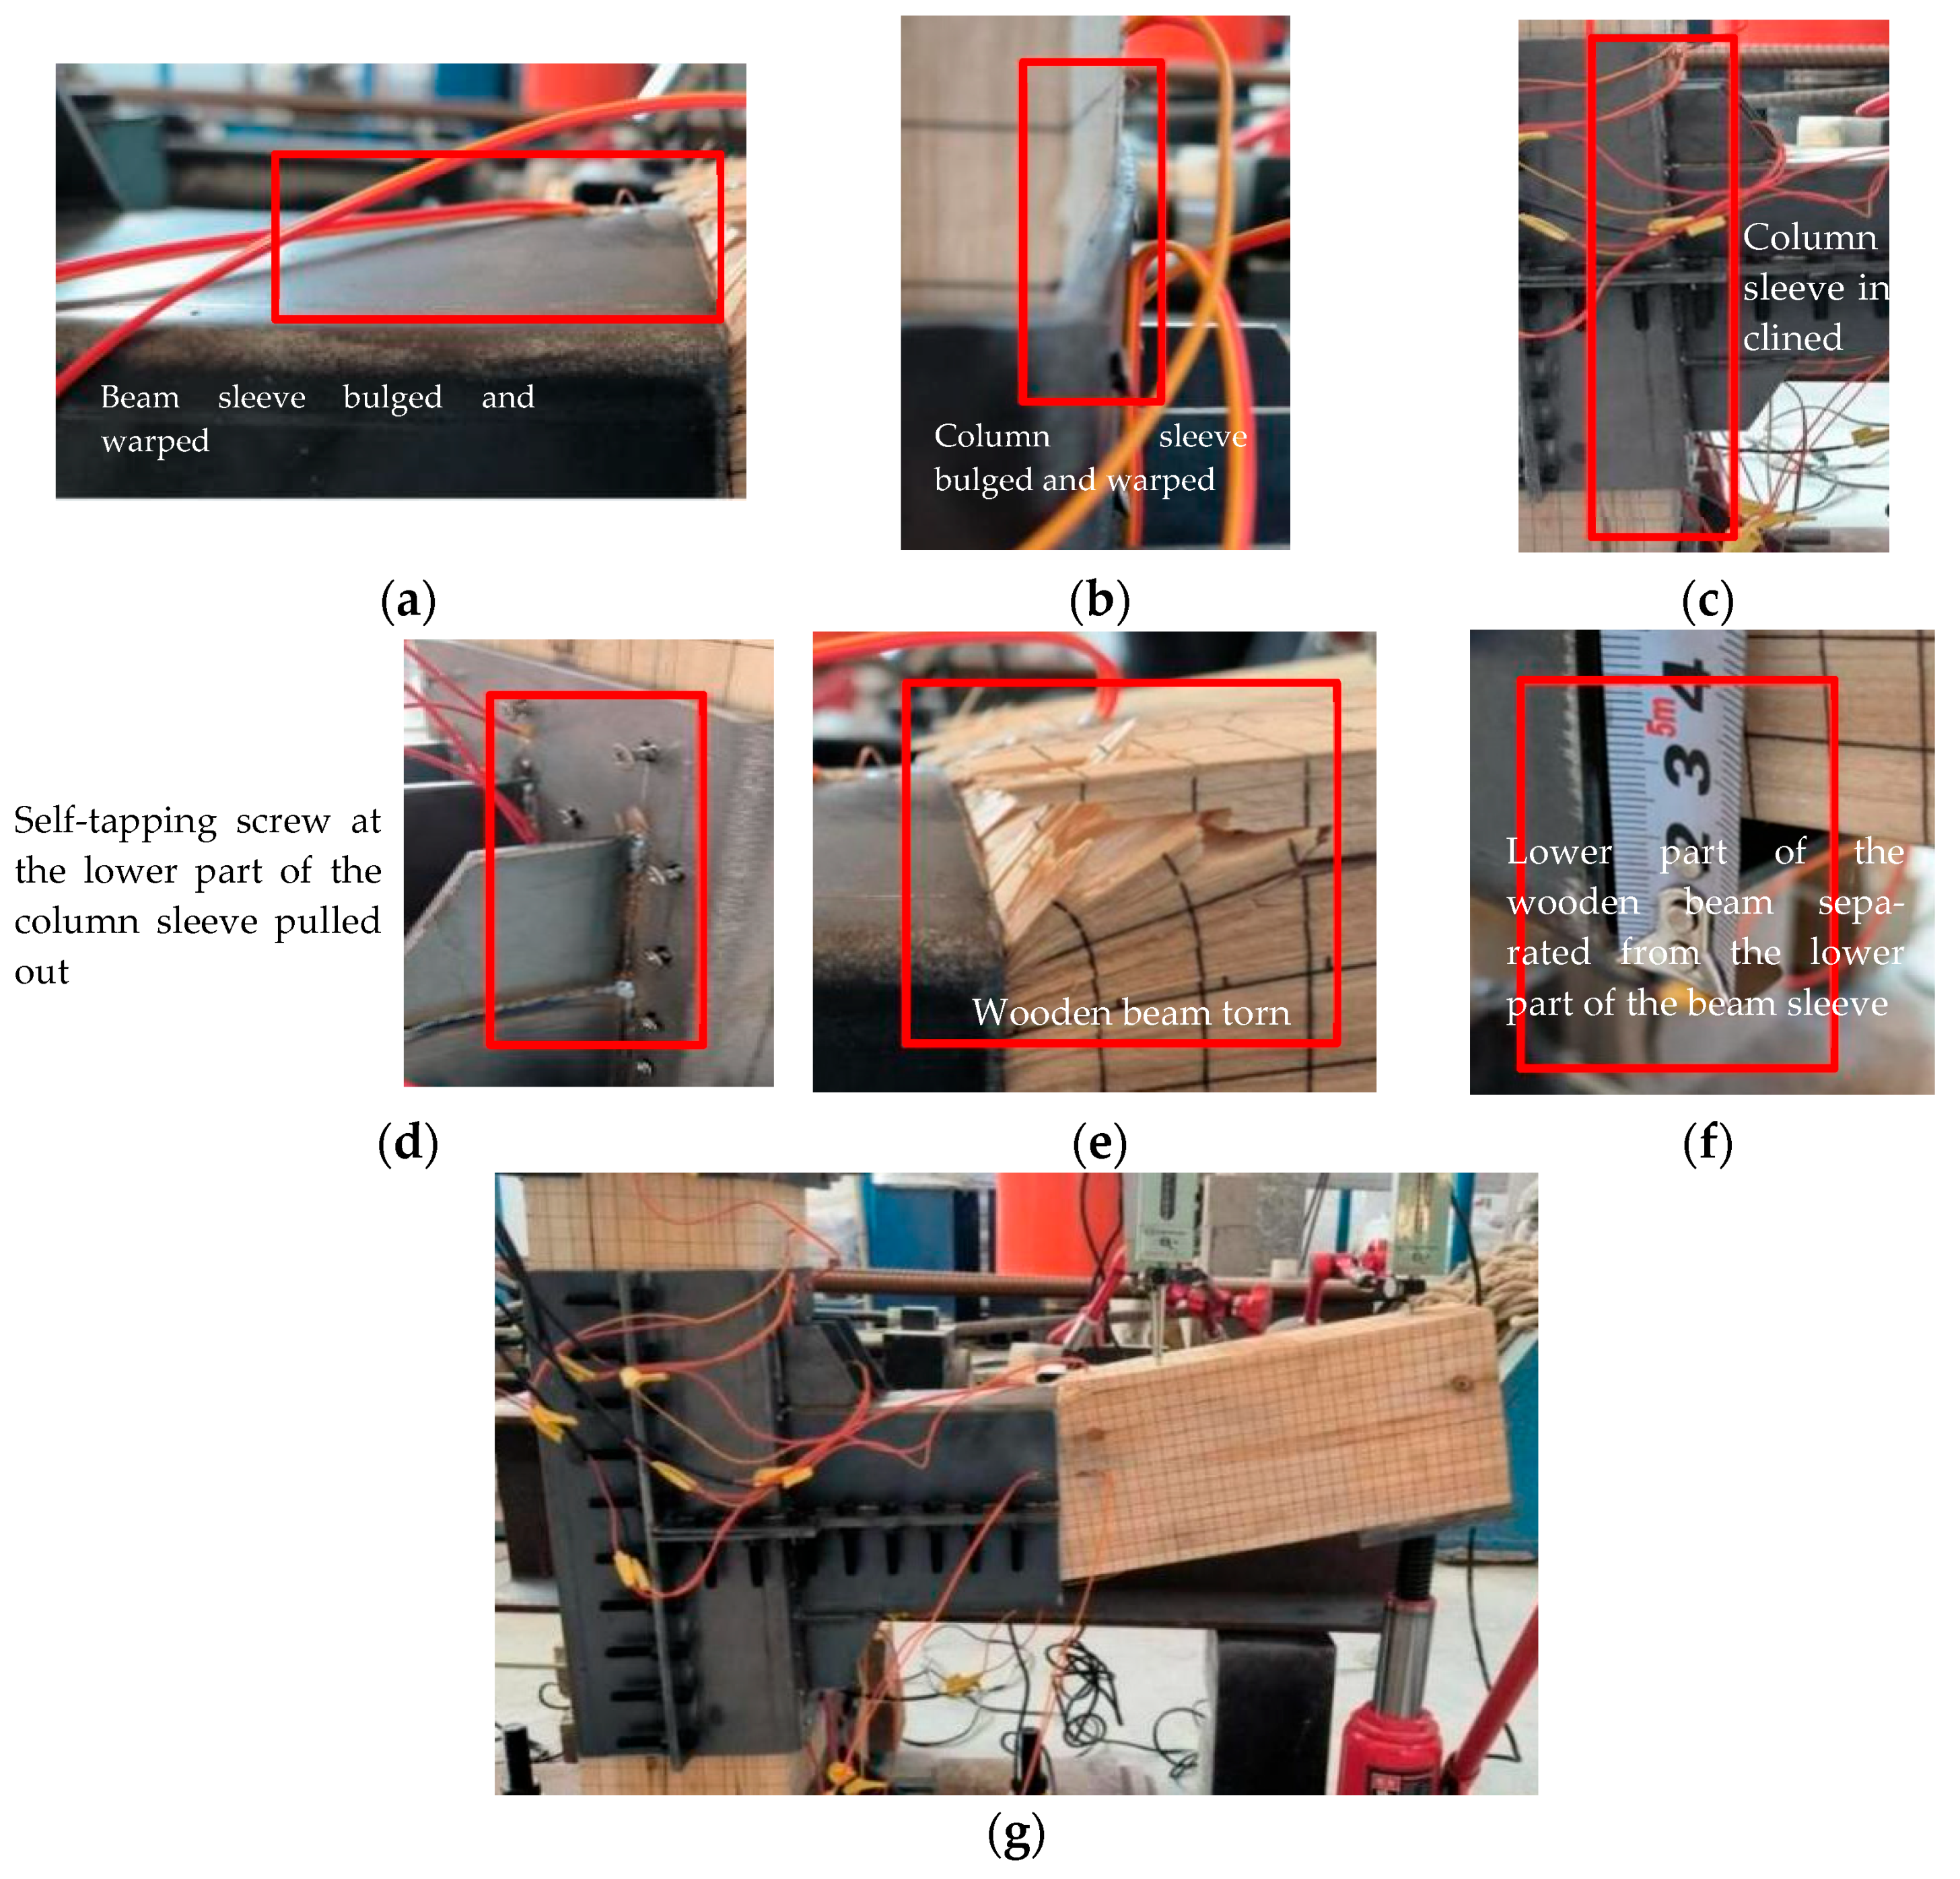
2.3. Test Process and Phenomena

(1)
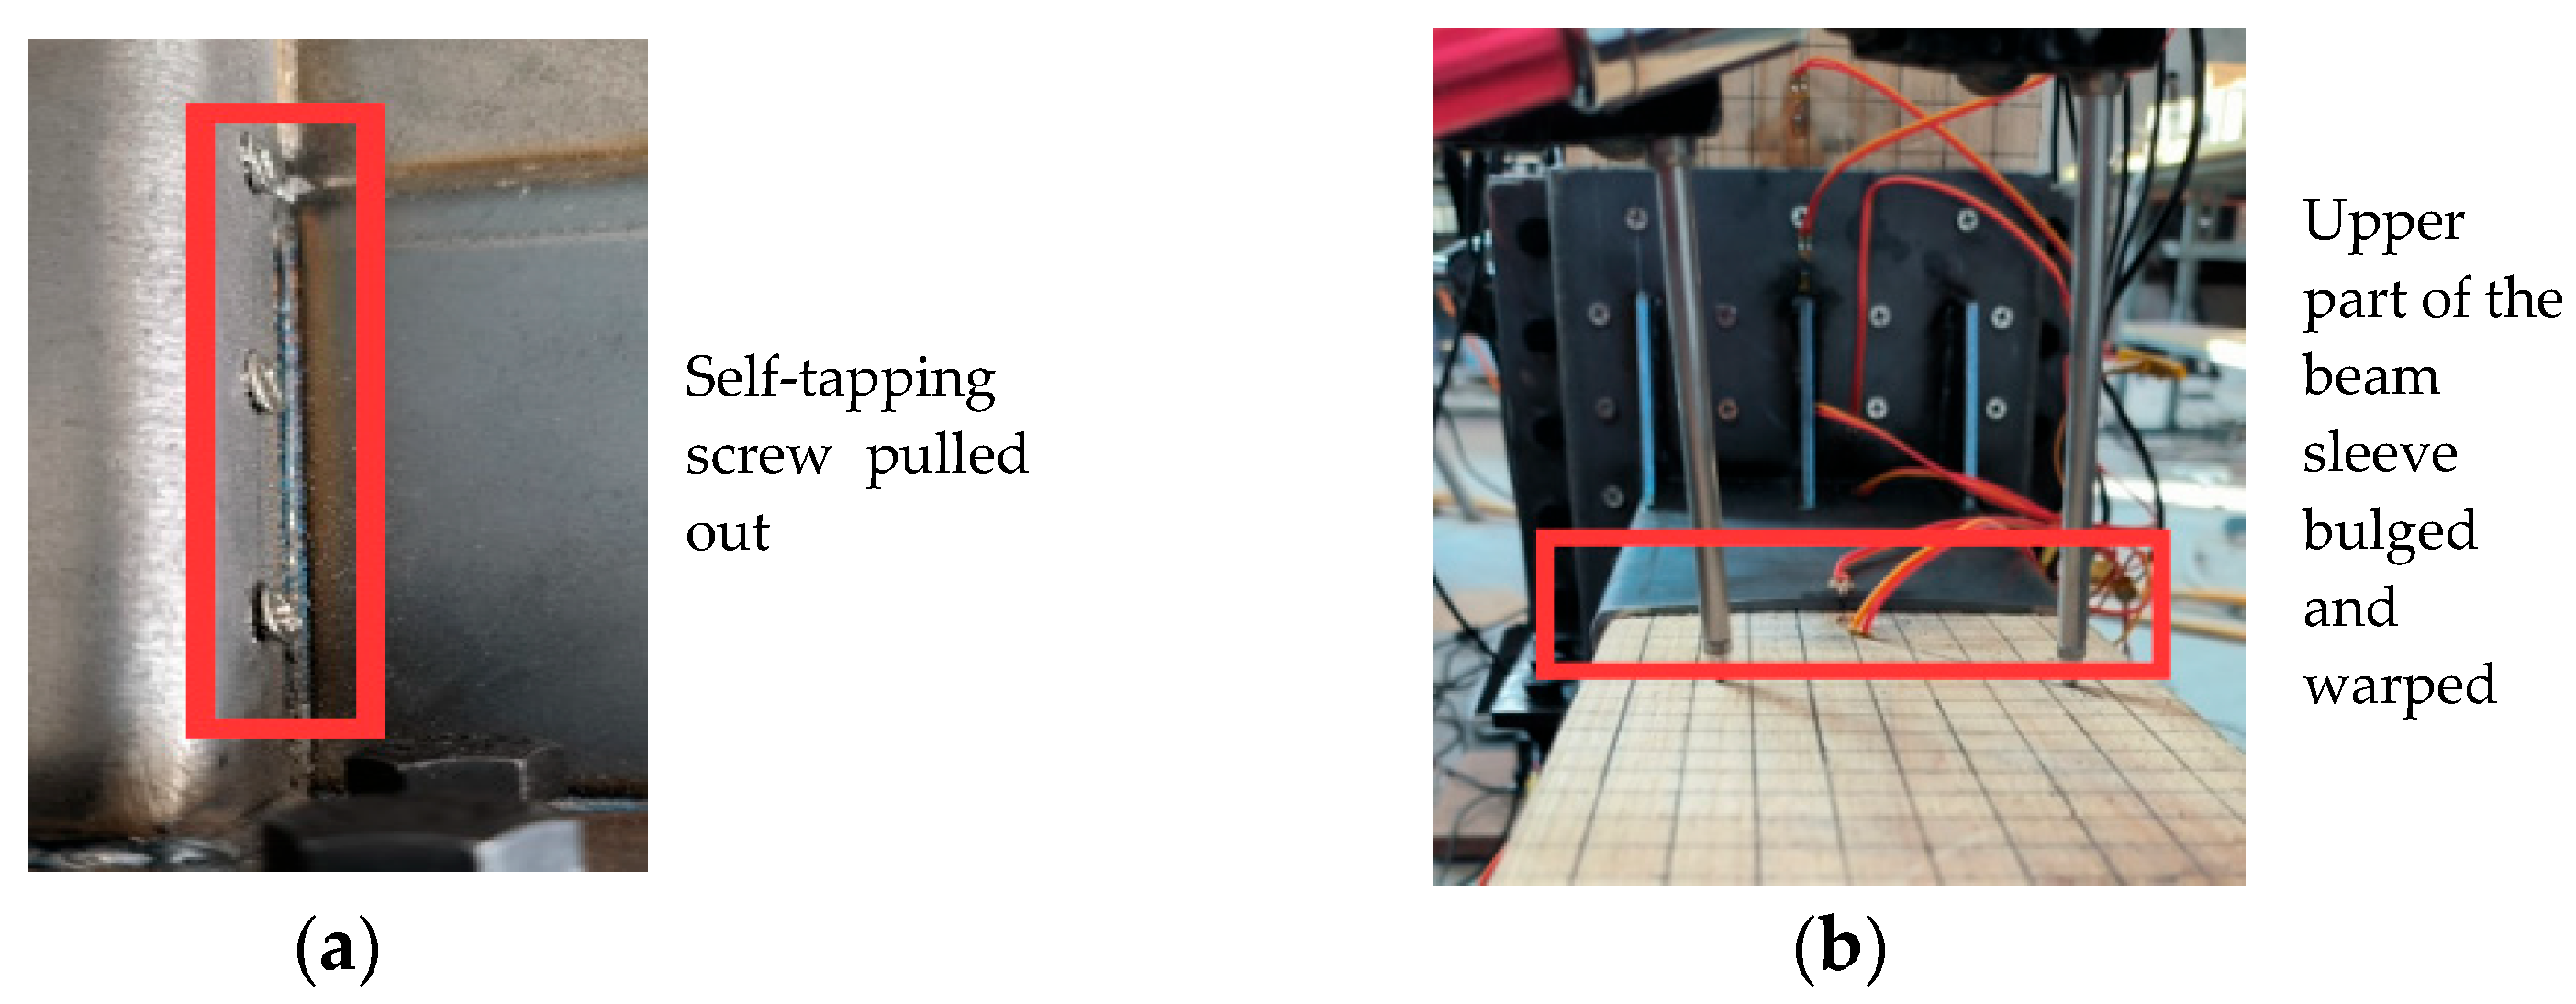
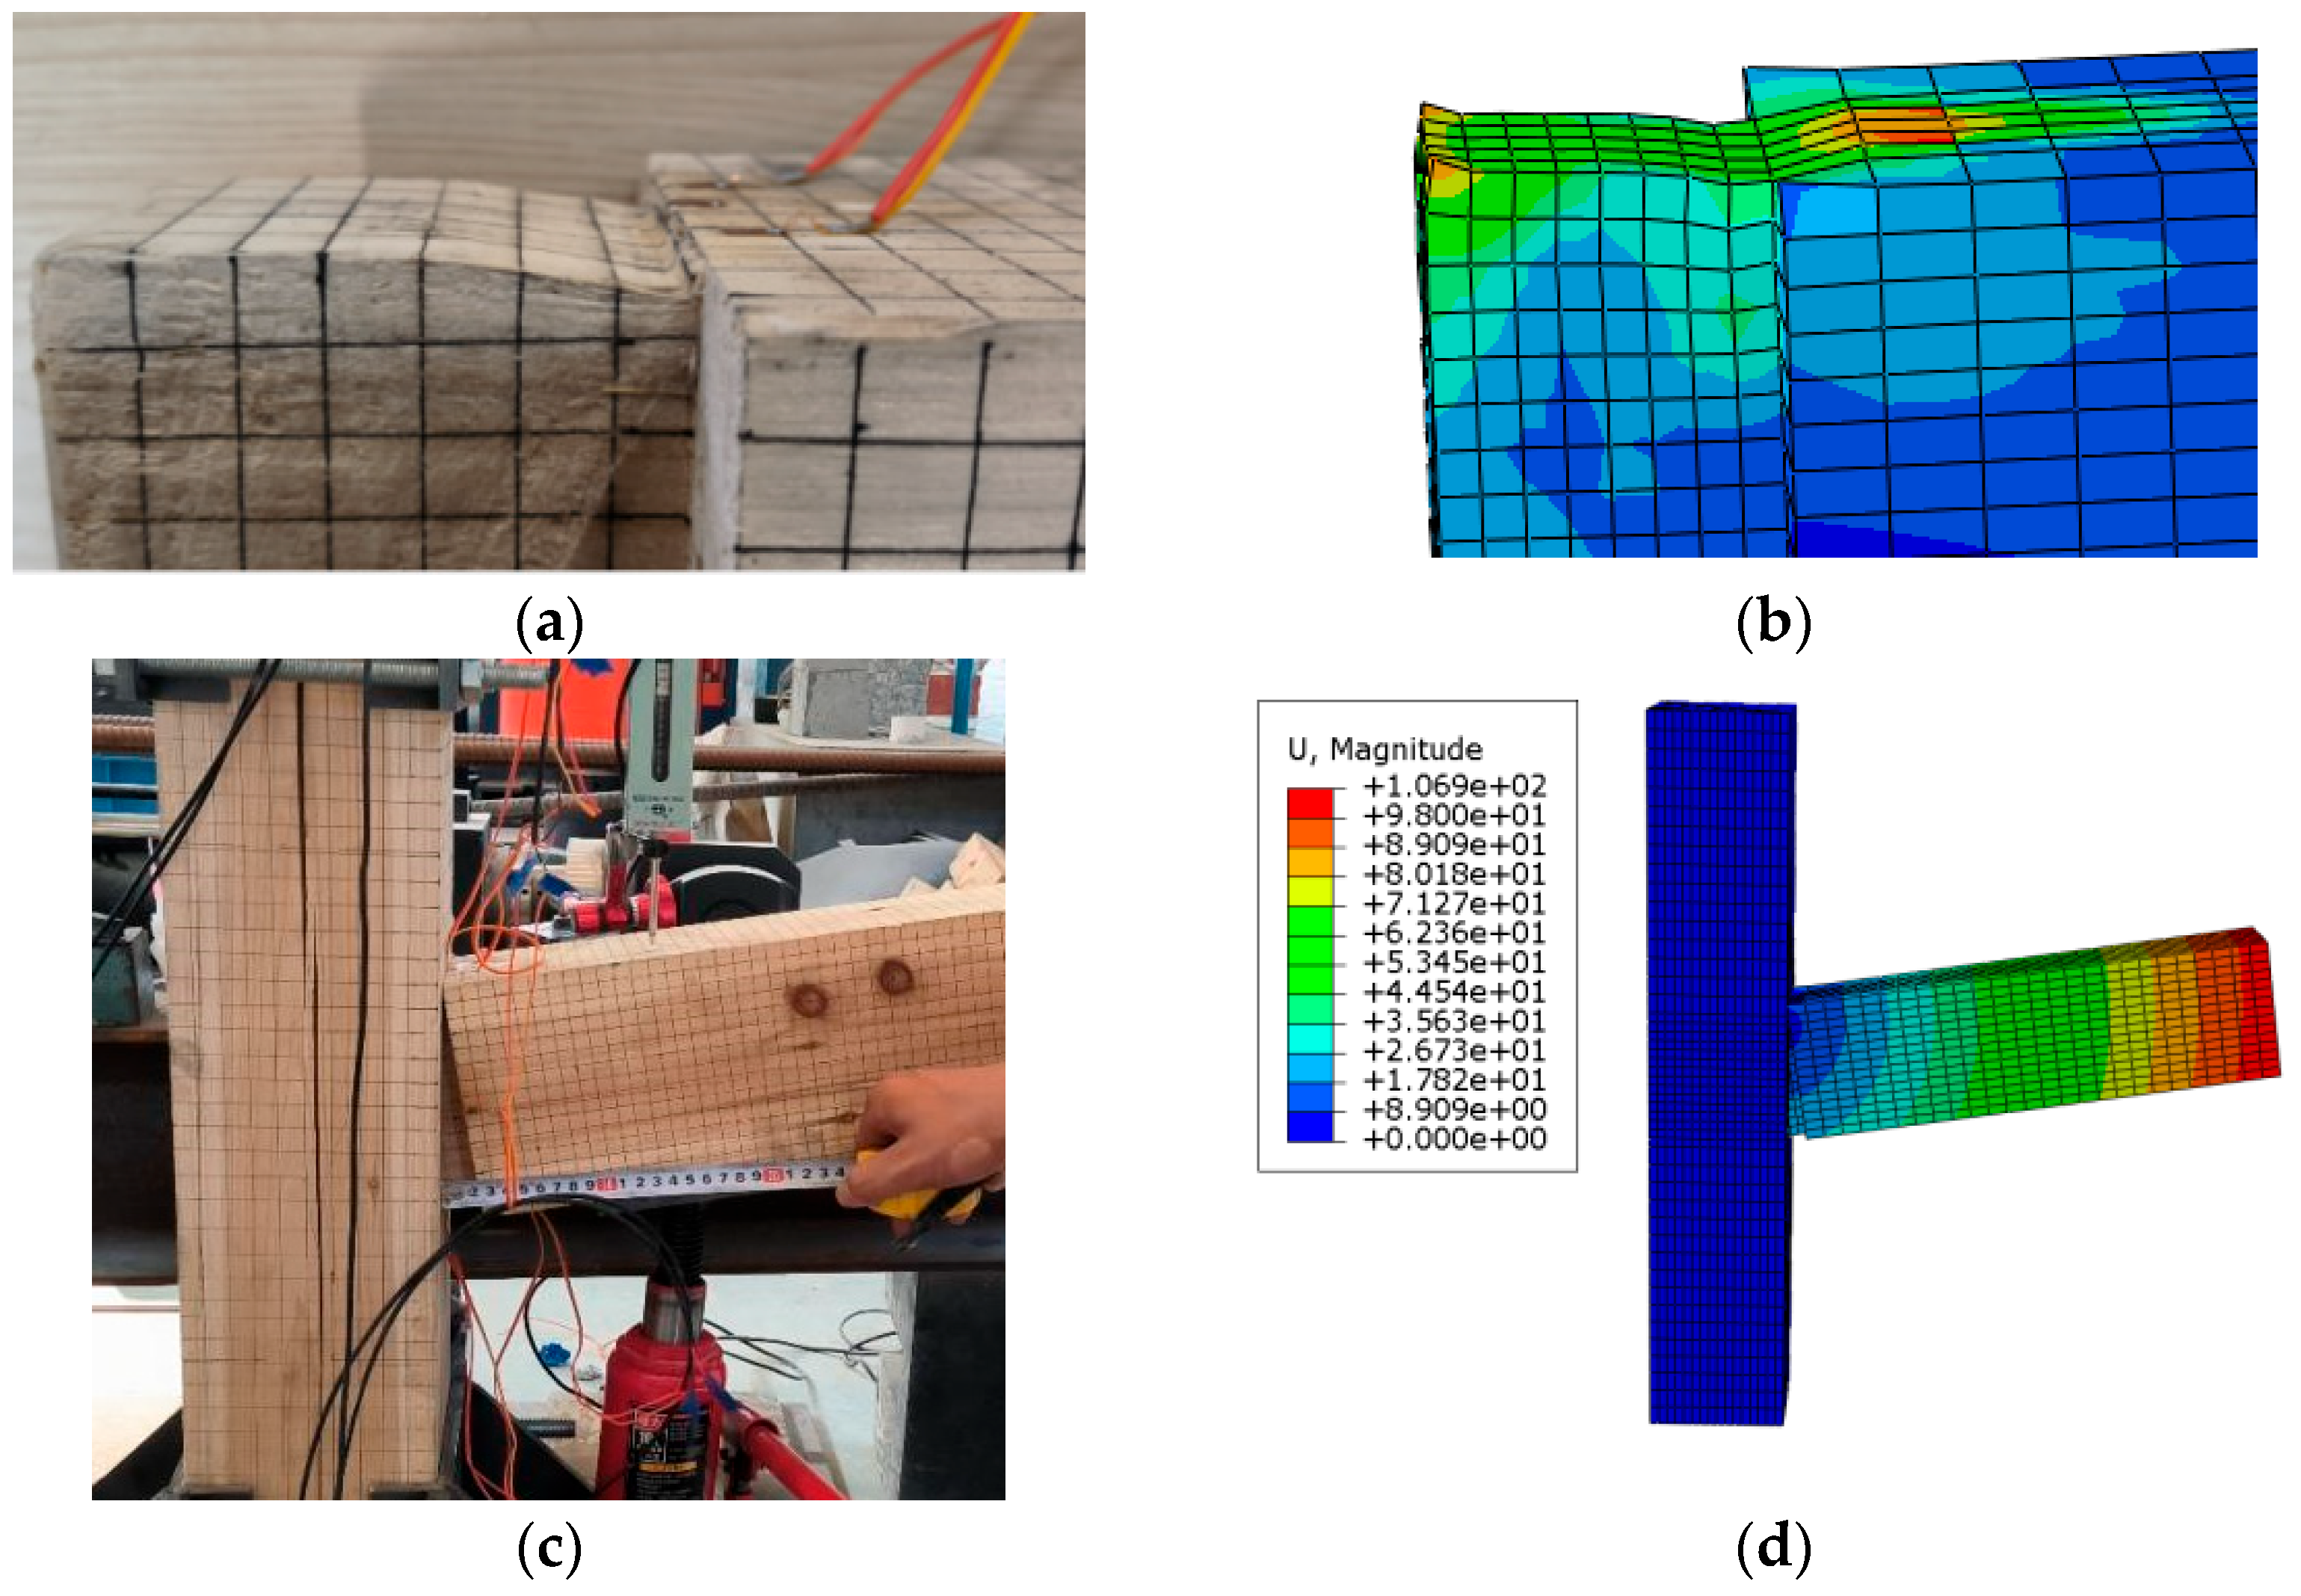
Failure phenomena of joint JG0
First, the wooden column was fixed by applying axial loads and using a hierarchical loading system and jack loading. Thereafter, beam end loading was carried out with the loading point being set on the central axis of the wooden beam 480 mm away from the column side. During the initial stage of beam end loading, the load rose quickly, and the sound of wood extrusion was clearly produced when the load was applied. The load was accompanied by the sound of the wood being squeezed simultaneously. The tenon at the lower edge of the beam end began to disengage from the wooden column when the load reached 0.4 kN, and the extraction amount of the tenon was 10 mm. After the load reached 0.8 kN, the joint entered the plastic yielding stage; in comparison, the bearing capacity remained practically the same and was stabilized at 0.8 kN. In addition, the displacement at the beam end was found to change significantly at this time. The test on joint JG0 was terminated when the displacement meter reached its maximum range and the tenon was evidently pulled out. The load at the beam end was measured as 0.8 kN, and the extraction amount of the tenon at the lower edge of the beam end was recorded as 22 mm at the end of the test. The tenon at the upper edge of the beam end underwent extrusion deformation with the mortise; in comparison, the lower tenon was found to ultimately disengage from the mortise. The column and the beam were kept intact, and the detailed diagram of the state after loading is presented in Figure 9.
A distinct “squeaking” sound was caused by the extrusion of the wood during each loading of joint JG0; no obvious damage could be found on either the wooden column or the wooden beam after the end of the test, however. The comparison of the overall component deformation of the specimen before and after the loading test is presented in Figure 10.
(2)
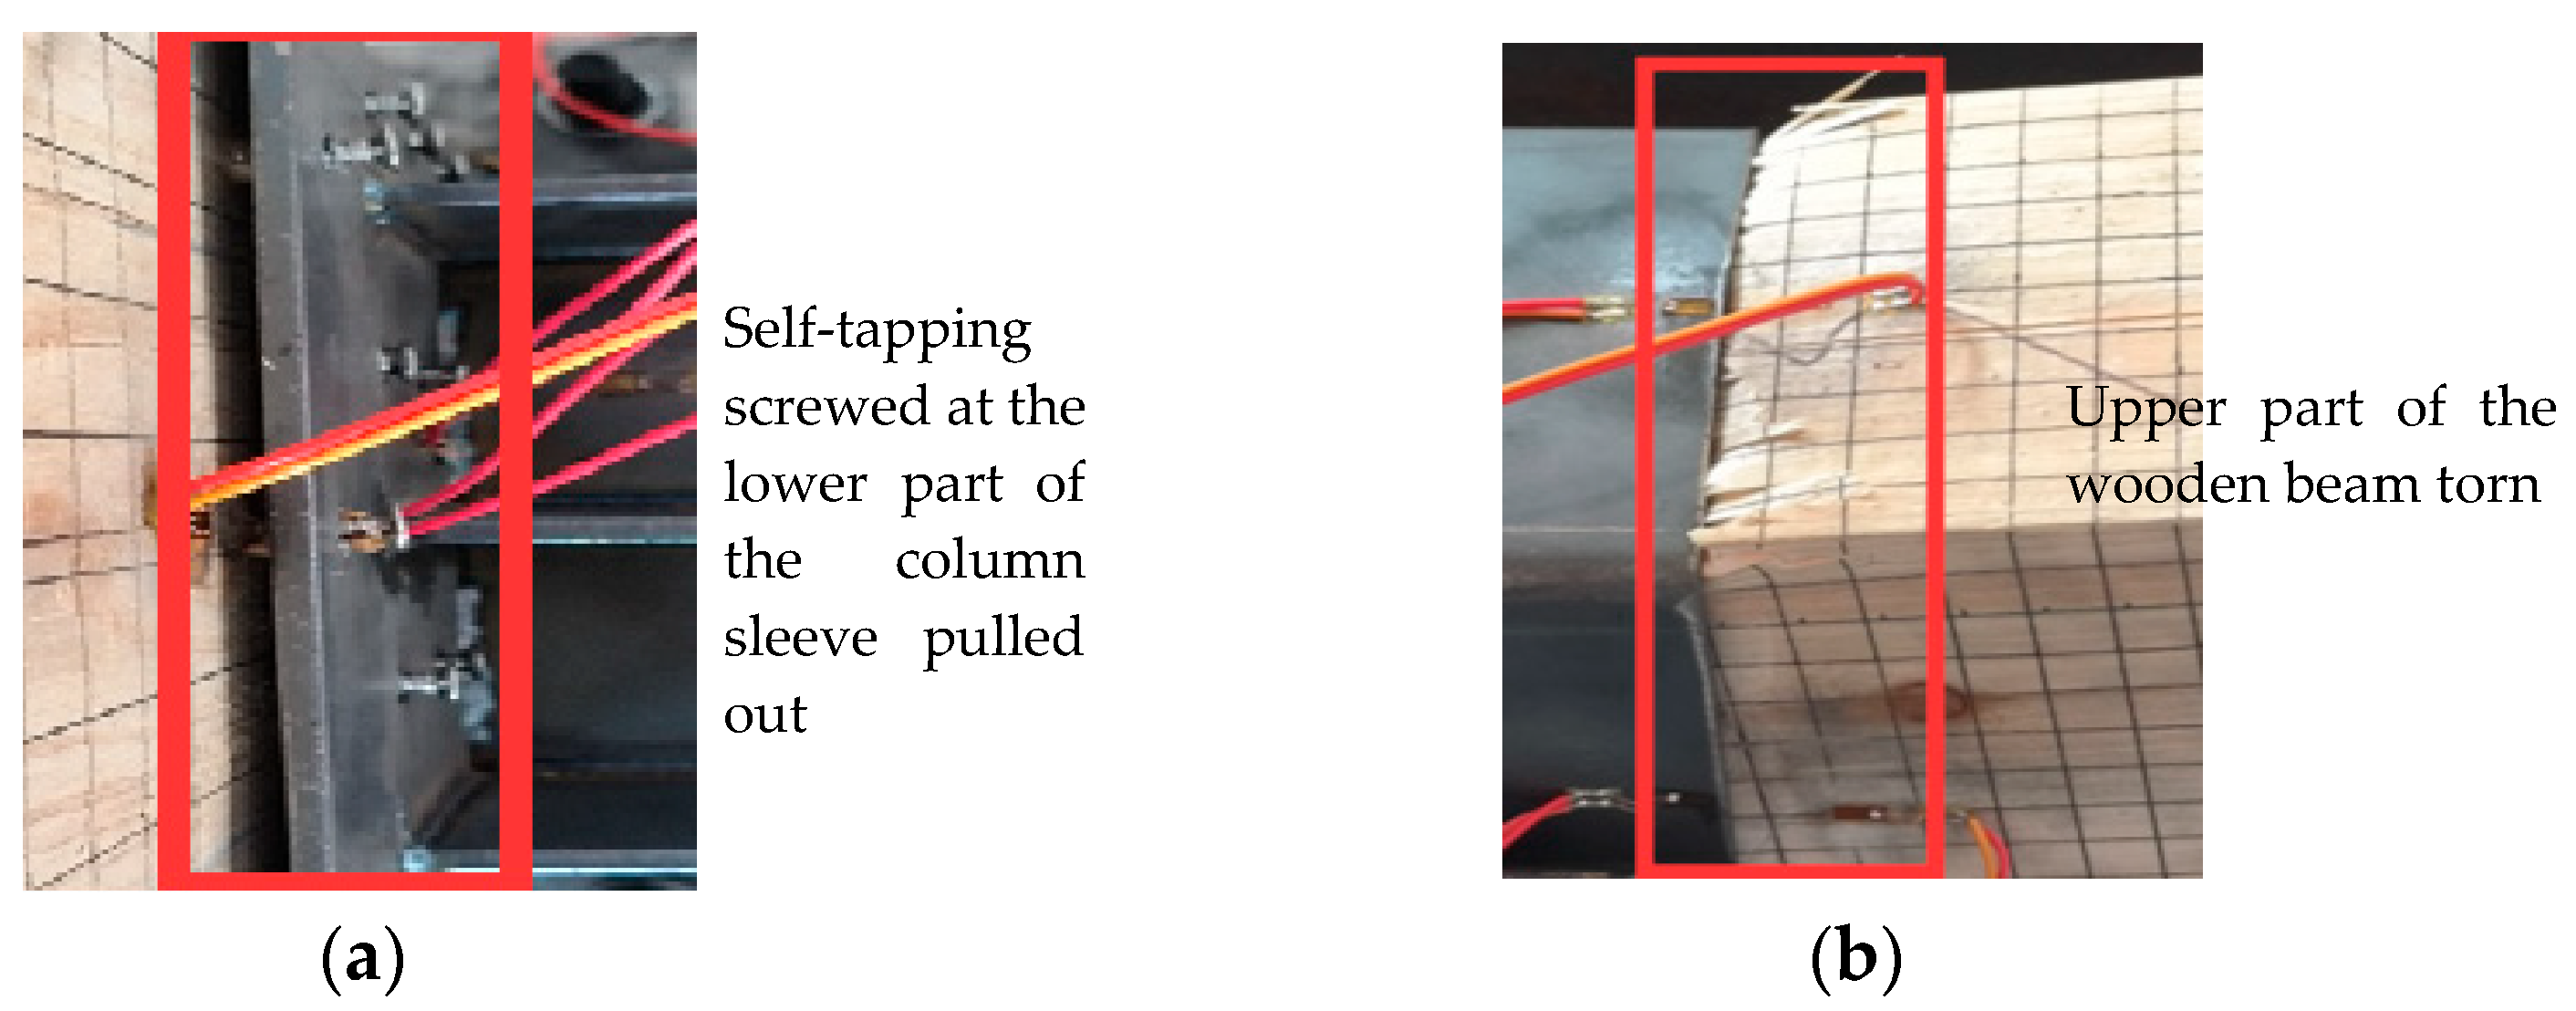
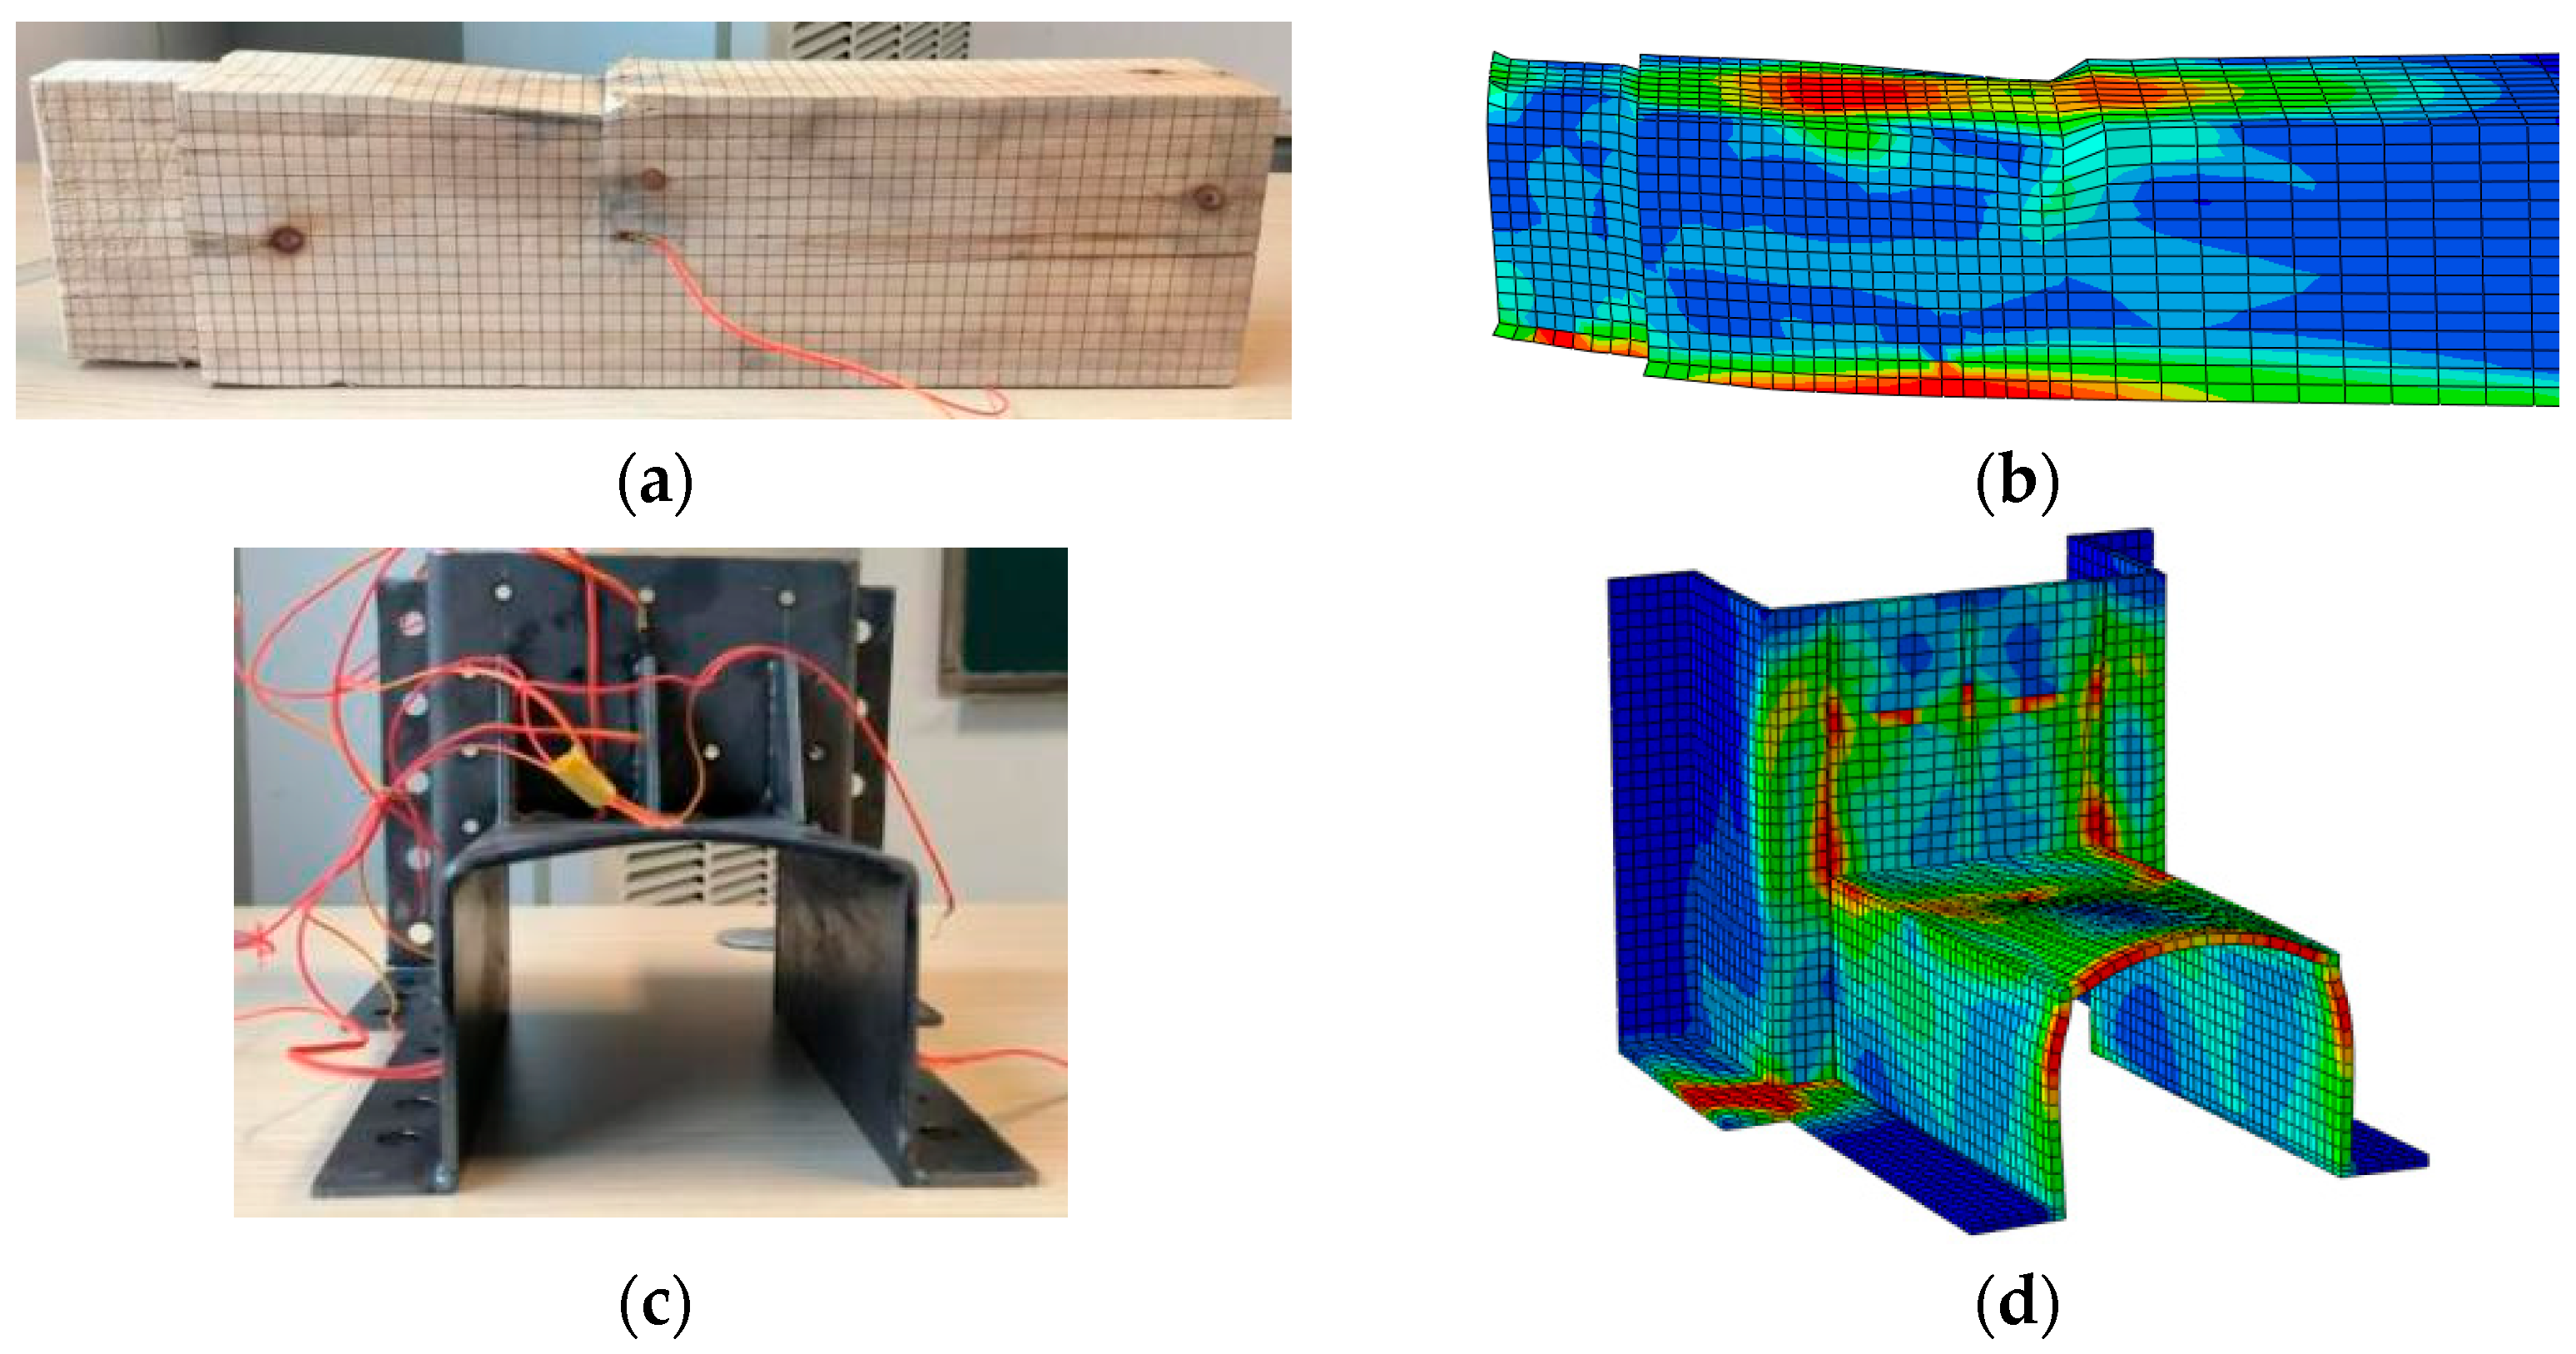
Failure phenomena of joint JG1
Joint JG1 was firmly reinforced with a detachable steel sleeve. When the displacement was positively loaded to 20 mm, a vertical load of 6.7 kN was recorded. The steel sleeve on the lower side of the wooden column was subjected to a tensile force, and this tensile force was efficiently transmitted to the wooden column by the self-tapping screws. The wood located in the area of the self-tapping screws was damaged because of the large tensile stress, causing the tensile self-tapping screws to be slightly pulled out. The sleeve at the upper end of the wooden beam was slightly tilted and bent, and the wood at the junction of the wooden beam and the steel sleeve was slightly extruded, as shown in Figure 11. When the displacement was loaded to 40 mm, a vertical compressive load of 12.7 kN was measured. The upper section of the beam sleeve suffered from large bulging and deformation, and the outermost row of self-tapping screws at the lower part of the column was evidently pulled out. The wood located around the outermost end of the steel sleeve on the upper side of the wooden beam was further crushed, and the steel sleeve was partly sunk into the wood, as shown in Figure 12.
When the displacement was loaded to 84 mm, the vertical load was already 19.2 kN. Both the upper part of the column sleeve and the beam sleeve experienced slightly bulging deformation; however, all of the self-tapping screws in the lower part of the column were evidently pulled out. Since the strength of the steel sleeve was higher than that of the wooden beam, the wood around the outermost end of the steel sleeve on the upper side of the wooden beam was further torn, and splitting occurred along the grain direction. The vertical load suddenly dropped to 16.4 kN at the time point when the wooden beam partially split. The axial force at the upper end of the wooden column was 26.9 kN at this time point, the distance between the lower part of the beam sleeve and the wooden beam was 28 mm, and the column sleeve showed obvious inclination. Given that the wooden beam had split and the load could evidently no longer be increased, it was determined that the specimen was damaged, and the test was terminated, as depicted in Figure 13. From the above results, it was concluded that the load-bearing capacity of the reinforced joint was 19.2 kN, and the tenon at the beam end had not been pulled out, with this value being significantly higher compared with the unreinforced joint, JG0.

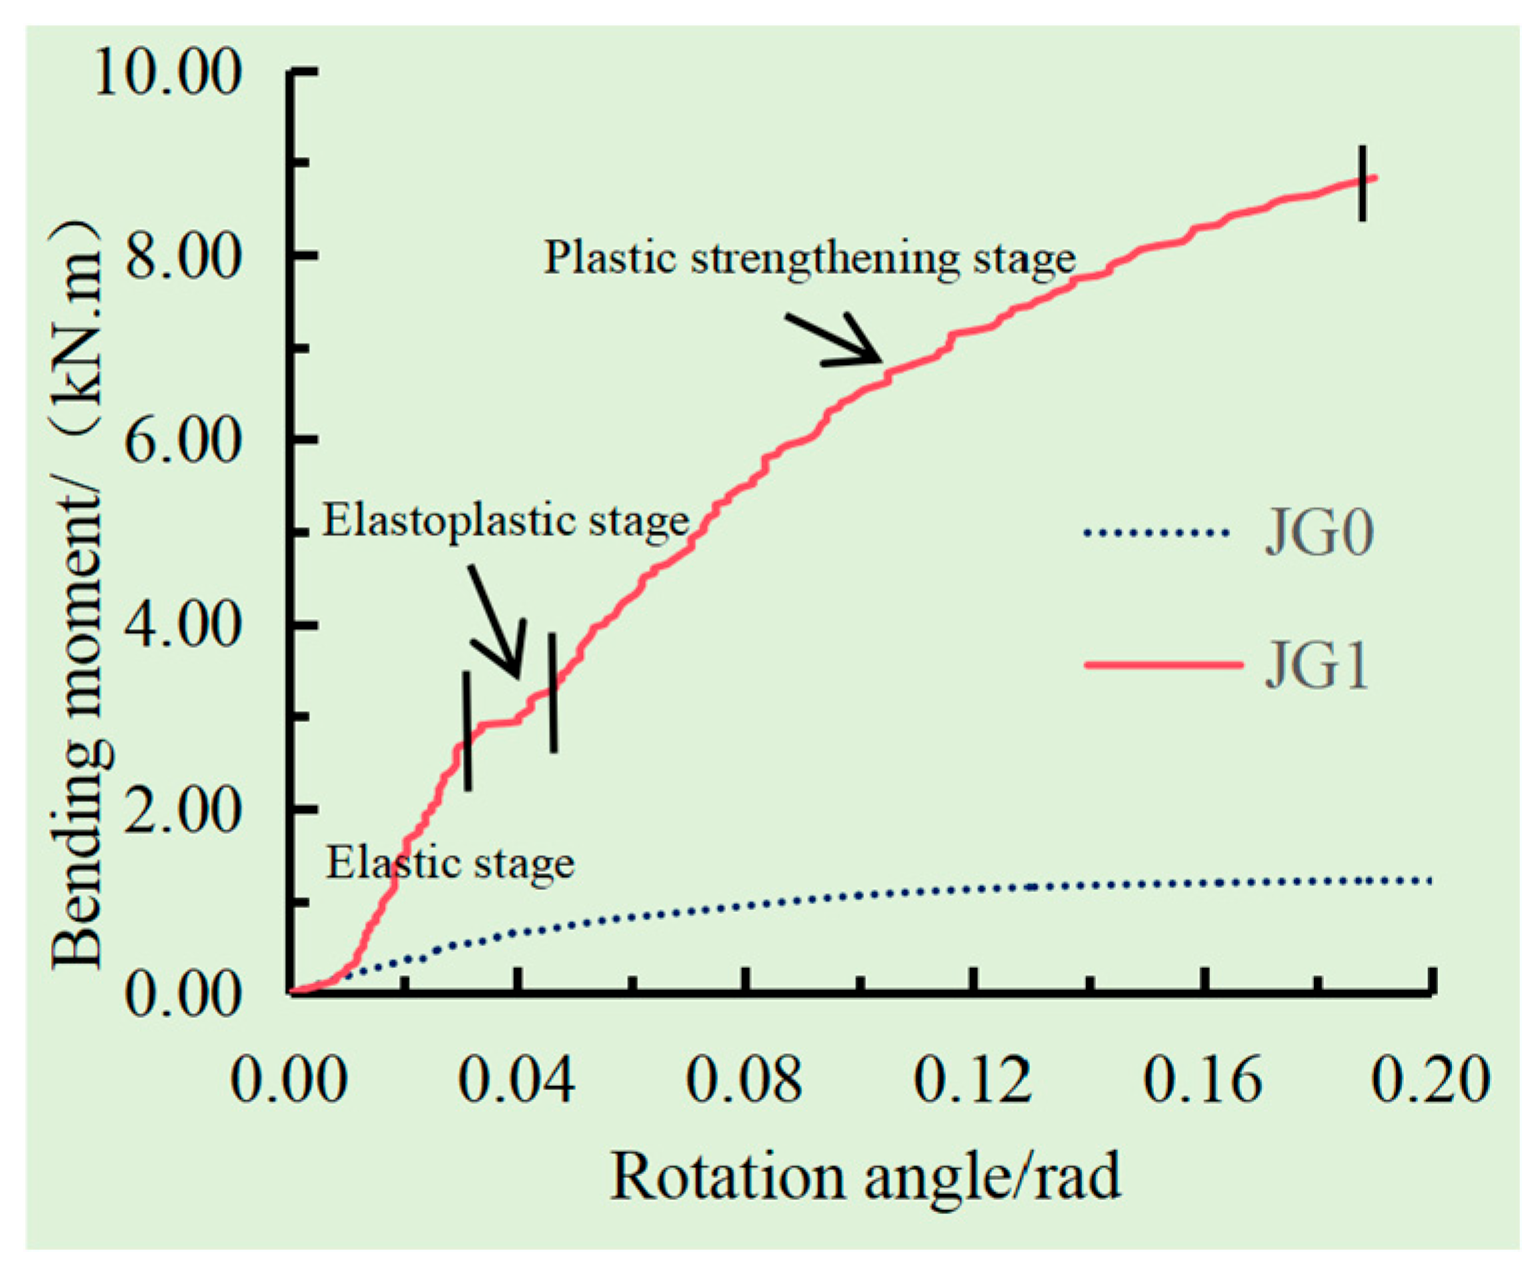
3. Test Results and Analysis

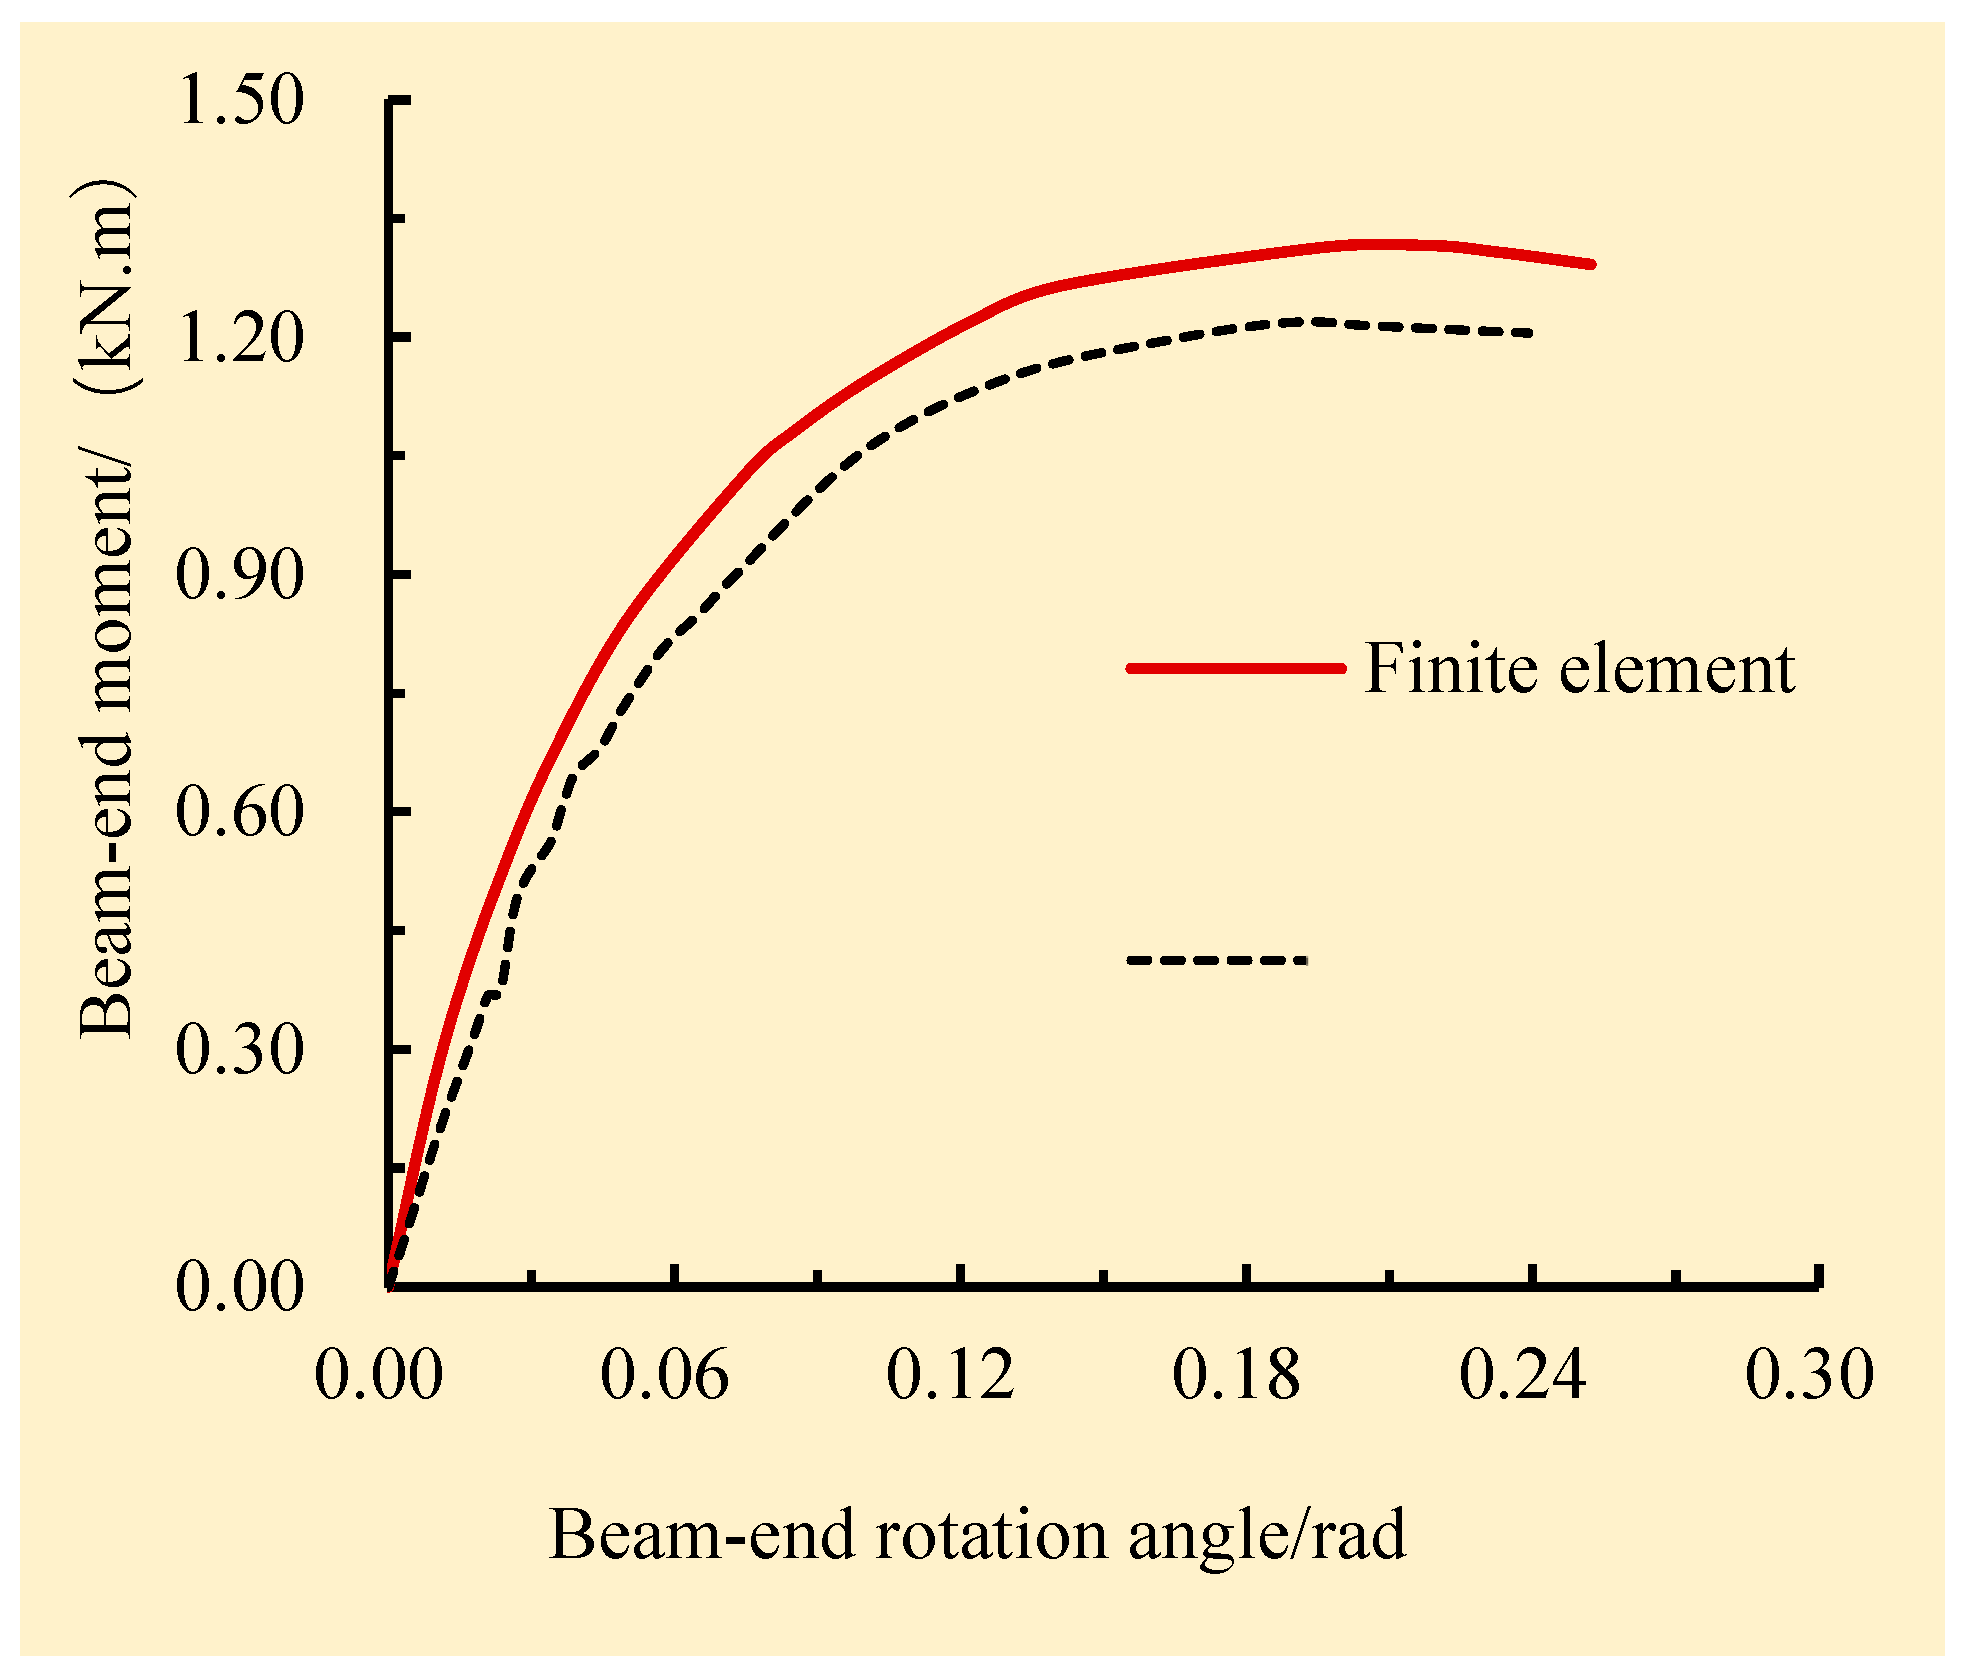
Moment–Rotation Curves of Joints

The test data of the pure wood joint, JG0, and the strengthened joint, JG1, were organized and analyzed to obtain the comparative curves of the moment–rotation relationship for these two joints, as shown in Figure 14. From the figure, it can be seen that the moment–rotation curves of specimens JG0 and JG1 firstly tended to be consistent at the initial loading stage, which was designated the sliding stage of the tenon and mortise connection due to a gap in the tenon during assembly. Thereafter, the curve of the pure wood joint rose slowly; in comparison, the load-bearing capacity of the strengthened joint exhibited a quickly rising trend at the elastic stage. When the rotation angle was 0.03 rad, the tenon at the lower edge of the beam end for the unstrengthened joint gradually separated from the mortise, and the bending moment at the beam end was 0.9 kN·m. In comparison, the upper end of the beam sleeve for the strengthened joint underwent slight bulging deformation, and the bending moment was 3.0 kN·m. After the joint reached the yield point, the rotation angle at the end of the beam reached 0.05 rad. The tenon at the beam end for the unstrengthened joint had ultimately separated from the mortise with the further increase in load; in comparison, the upper part of the beam sleeve for the strengthened joint exhibited a large bulging deformation and the steel sleeve sank into the wood when the moment–rotation curve entered a gentle platform section, and this stage was regarded as the elastoplastic stage. Lastly, both the upper part of the column sleeve and the beam sleeve for the strengthened joint underwent slight bulging deformation with the continuous increase in load, and the tenon at the beam end was not pulled out. The load-bearing capacity of the strengthened joint continued to increase, and the curve entered the plastic-strengthening stage. It can be clearly seen that the bending moment at the beam end for the unstrengthened joint was 1.2 kN·m; in comparison, this value increased significantly for the strengthened joint and reached 8.8 kN·m, which indicated that the beneficial effect of strengthening the joint with the detachable steel sleeve was outstanding.
The main mechanical index parameters of these two different joints were obtained using the geometric drawing method and the M-θ curve, as shown in Table 1. The initial rotational stiffness, yield bending moment, and ultimate bending moment increased by 495.4%, 425.9%, and 627.5%, respectively, compared with those of the unstrengthened joint, JG0. It is evident that strengthening the wooden joint with a detachable steel sleeve can significantly improve the load-bearing capacity and seismic performance of the wooden joint.

4. Finite Element Study

4.1. Constitutive of Material

The core concept of finite element analysis is to simplify complex engineering problems and discretize the solution region into a finite number of elements. An approximate solution for the entire solution region can ultimately be obtained by solving each element. Finite element analysis software, ABAQUS V6.11, was fully utilized to conduct numerical simulations on the unreinforced joint, JG0, and the reinforced joint, JG1, to determine the internal stress and deformation of the joints under load. The yield strength of the wood is taken as fc,l = 25 MPa in the finite element model, and the subscripts c and l represent compression and the grain direction of the wood, respectively. The potential function of the Hill yield criterion is shown in Formula (1):
f σ = F ( σ 22 σ 33 ) 2 + G ( σ 33 σ 11 ) 2 + H ( σ 11 σ 22 ) 2 + 2 L σ 23 2 + 2 M σ 31 2 + 2 N σ 12 2
The symbols F, G, H, L, M, and N are calculated according to the following formulas:
F = ( σ 0 ) 2 2 1 σ 22 2 + 1 σ 33 2 1 σ 22 2 = 1 2 ( 1 R 22 2 + 1 R 33 2 1 R 11 2 )
G = ( σ 0 ) 2 2 1 σ 33 2 + 1 σ 11 2 1 σ 22 2 = 1 2 ( 1 R 33 2 + 1 R 11 2 1 R 22 2 )
H = ( σ 0 ) 2 2 1 σ 11 2 + 1 σ 22 2 1 σ 33 2 = 1 2 ( 1 R 11 2 + 1 R 22 2 1 R 33 2 )
L = 3 2 τ 2 σ 23 2 = 3 2 R 23 2
M = 3 2 ( τ 2 σ 13 ) 2 = 3 2 R 13 2
N = 3 2 ( τ 2 σ 12 ) 2 = 3 2 R 12 2
The compressive strength of wood along grain fc,L was selected as the reference value, and τ 0 = σ 0 / 3 .
R11, R22, R33, R12, R13, and R23 represent the ratios of the yield strengths of the material in various directions, and the subscripts 1 to 3, respectively, represent the longitudinal grain, the radial transverse grain, and the tangential transverse grain of the wood. The calculation formulas are as follows.
R 11 = σ 11 σ 0 , R 22 = σ 22 σ 0 , R 33 = σ 33 σ 0 , R 12 = σ 12 σ 0 , R 13 = σ 13 σ 0 , R 23 = σ 23 σ 0 ,  
It can be seen from Formulas (2)–(7) that the constitutive equations of the plastic stage of wood can be represented by R11, R22, R33, R12, R13, and R23, and in ABAQUS finite element software, the potential function in the property definition module was used to define the six yield strength ratios of the wood, as shown in Table 2.

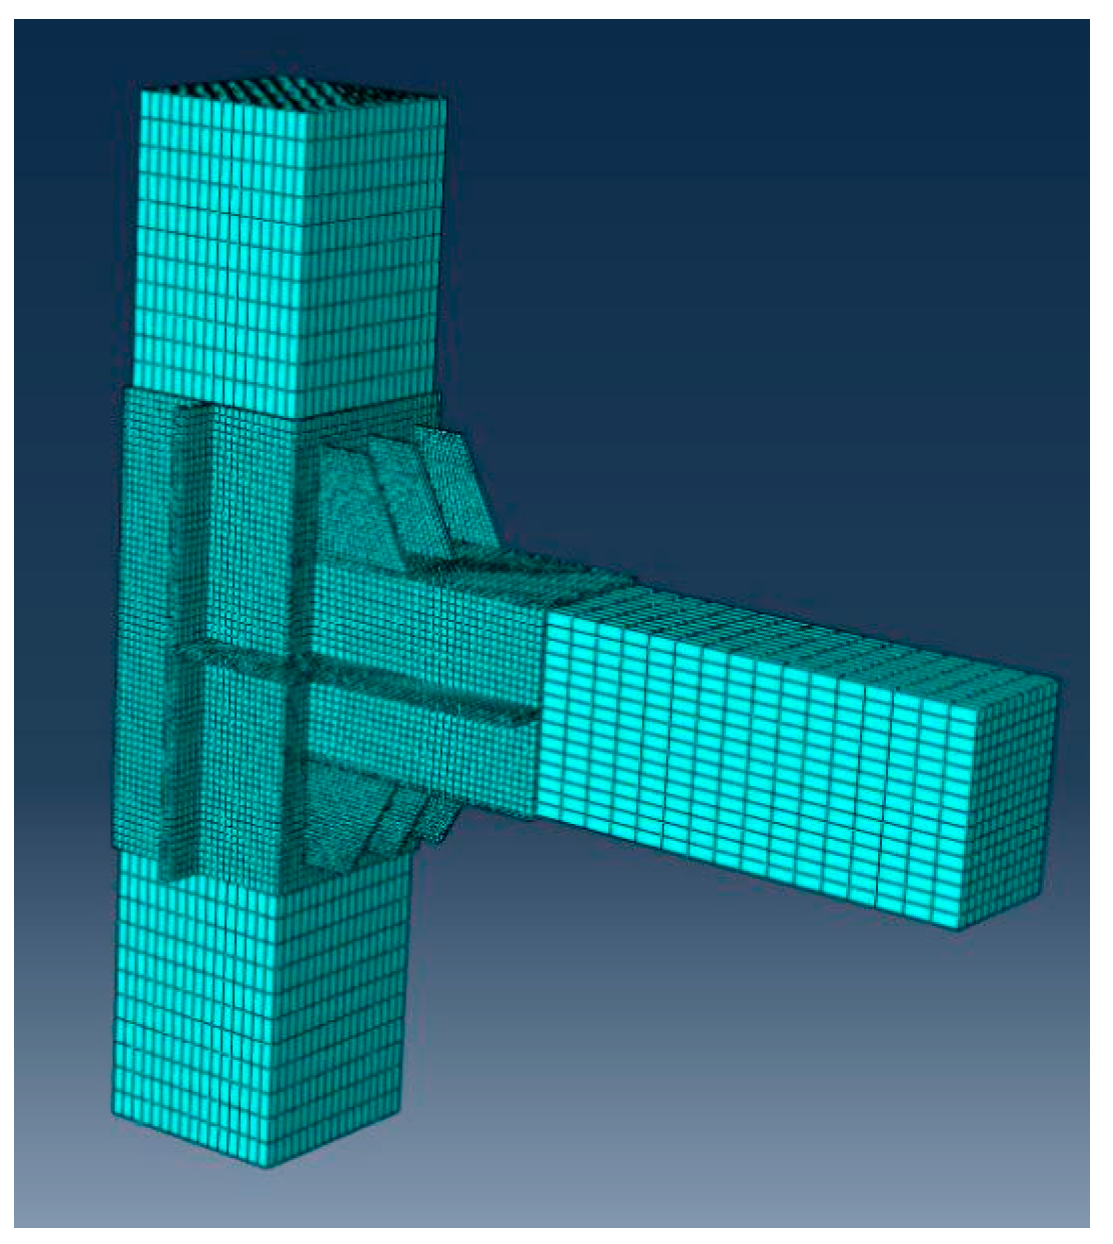
4.2. Element Type and Grid Division

Taking joint JG1 as an example, due to the anisotropic material characteristics of wood in this study, the eight-joint hexahedral linear reductive integral element was adopted to simulate wood components. In the process of grid division, structural optimization grid division technology was utilized. The grid size at the contact point between the wooden column and the beam was 10 mm, 6 mm at the detachable steel sleeve, and 20 mm at the section far from the contact surface between the wooden column and the beam. The specific division is illustrated in Figure 15.

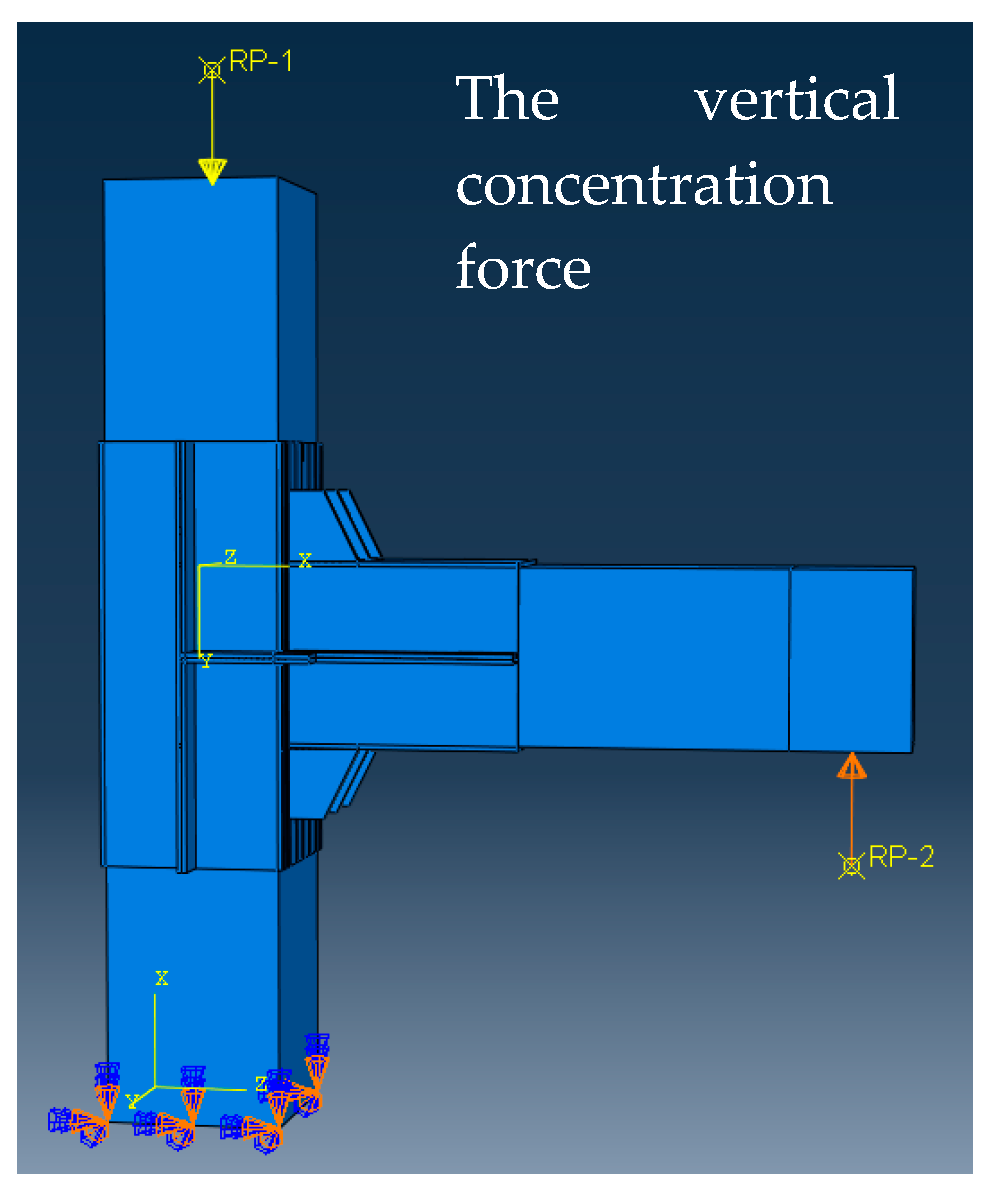
4.3. Analysis Step Setting

A total of three analysis steps, namely step-initial, step-1 and step-2, in the model were, respectively, simulated. The boundary conditions of the finite element model were set in the step-initial, the vertical concentration force of the reference point RP-1 on the top of the wooden column was applied in step-1, and the loading displacement on the reference point RP-2 with a maximum value of 100 mm was adopted in step-2. It was necessary to set the Nlgeom switch to “On” to take into account the geometric nonlinearity of the tenon wood joint and the detachable steel sleeve. The loading schematic diagram of the analysis model is shown in Figure 16.

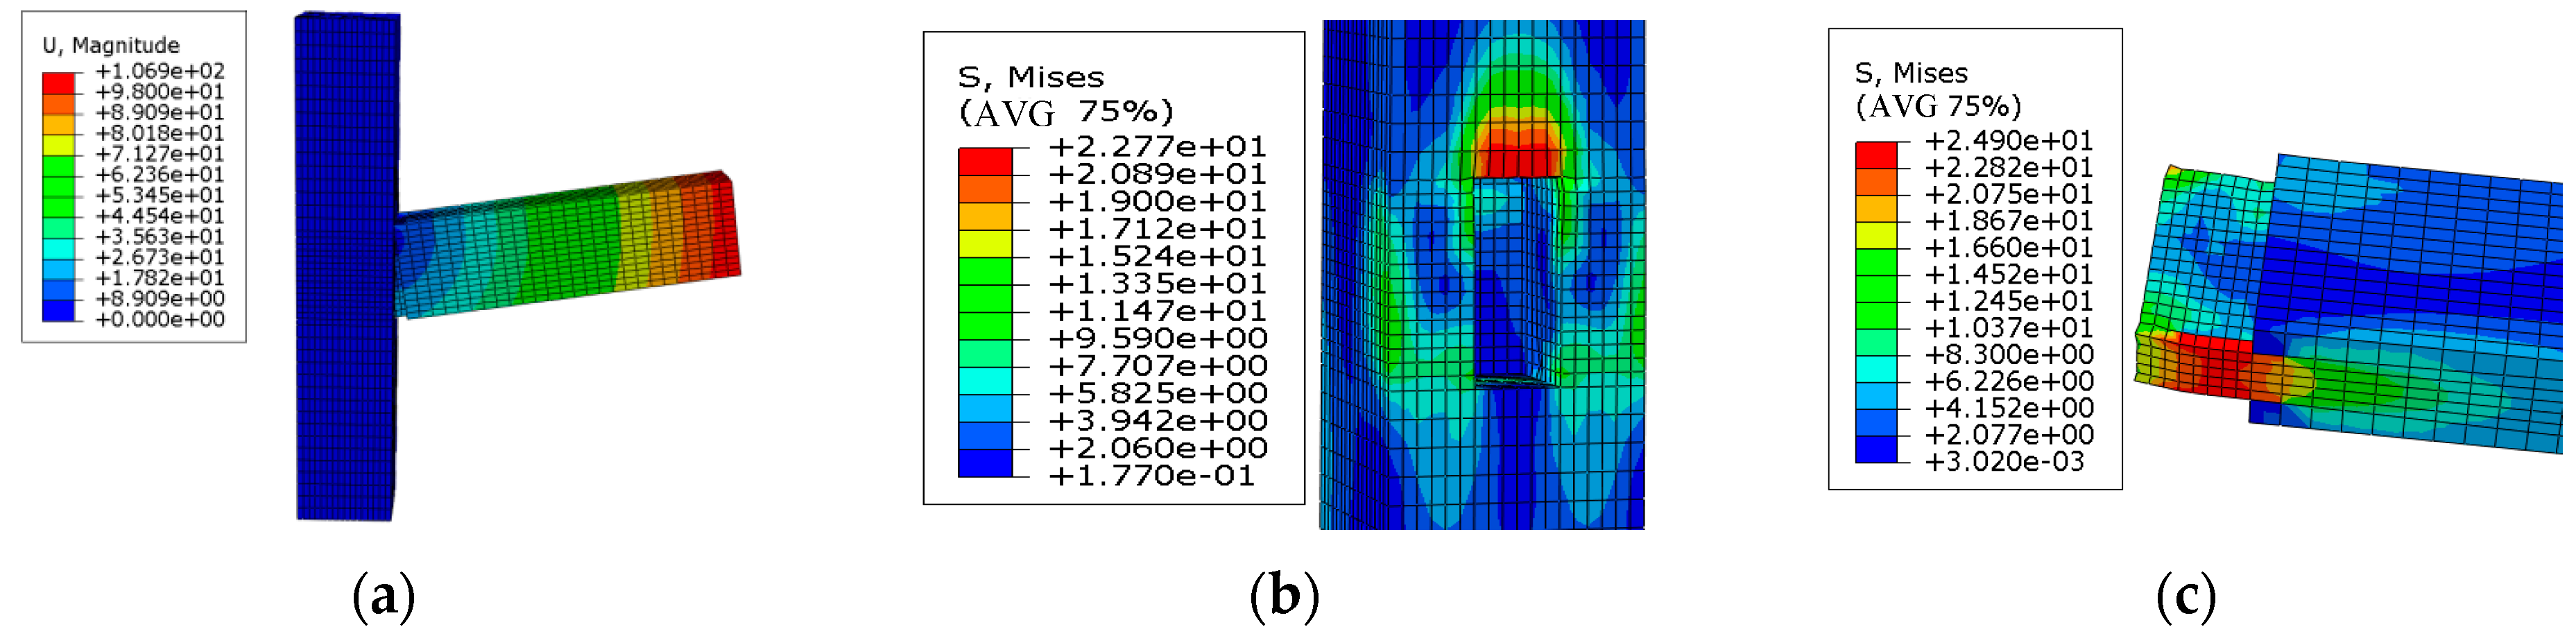
4.4. Unstrengthened Wooden Joint JG0

(1)
Stress state
The displacement results of the finite element numerical simulation for joint JG0 are shown in Figure 17a. At the end of the simulation, a relative rotation occurred between the wooden column and the wooden beam. The main deformations of joint JG0 included the extrusion deformation of the upper edge of the tenon, the tensile deformation of the lower edge, and the extrusion deformation of the upper and lower edges of the mortise. The failure mode of joint JG0 was determined to be tenon extraction failure. During the process of increasing the rotation angle, the deformation area of the tenon and the mortise for joint JG0 also visibly increased. The stress at the upper edge of the mortise was the greatest and reached 22.8 MPa, as shown in Figure 17b. The lower edge of the tenon entered the plastic yield stage, and the maximum stress reached 24.9 MPa, as shown in Figure 17c. Although the amount of tenon extraction continued to increase, the load-bearing capacity of the joint began to show an obvious downward trend in the later stage of loading. The phenomena in the finite element simulation were mostly consistent with those in the test process, and the data between them ultimately matched. The benefits of this finite element simulation method were thus accurately demonstrated.
(2)
Analysis of the moment–rotation curve
As evident in Figure 18, the variation trends of the moment–rotation curves between the numerical simulation and the test for joint JG0 were practically the same. The curve showed a rising trend in the initial stage of loading. As the load increased, the joint reached the yield point, and thereafter, the curve entered the plateau stage before entering the strengthening stage. However, the finite element simulation produced slightly larger values than the test value shown in Figure 18. This discrepancy was the result of initial defects, such as knots and dry-shrinkage cracks, in the wooden column and beam themselves. In addition, due to manufacturing errors, gaps were present in the tenon and mortise of the test piece. The ultimate bending moment of joint JG0 in the finite element simulation was precisely calculated as 1.3 kN·m, and the ultimate bending moment in the test was measured as 1.2 kN·m. A difference of 8% was found between the simulation and test results, which was reasonably in line with engineering accuracy requirements.
(3)
Analysis of deformation patterns
The comparison of the deformations between the finite element simulation and the test for joint JG0 is clearly illustrated in Figure 19. As can be seen from Figure 19a,b, both the simulation result and the test result of the tenon showed evidently consistent extrusion depressions at the extrusion section of the tenon’s upper edge in the mortise. From the overall failure diagrams of joint JG0, it can be seen that the pull-out amount of the wooden tenon at the lower edge of the beam end and the deformation simulated through finite element software were in close agreement with the test results presented in Figure 19c,d.

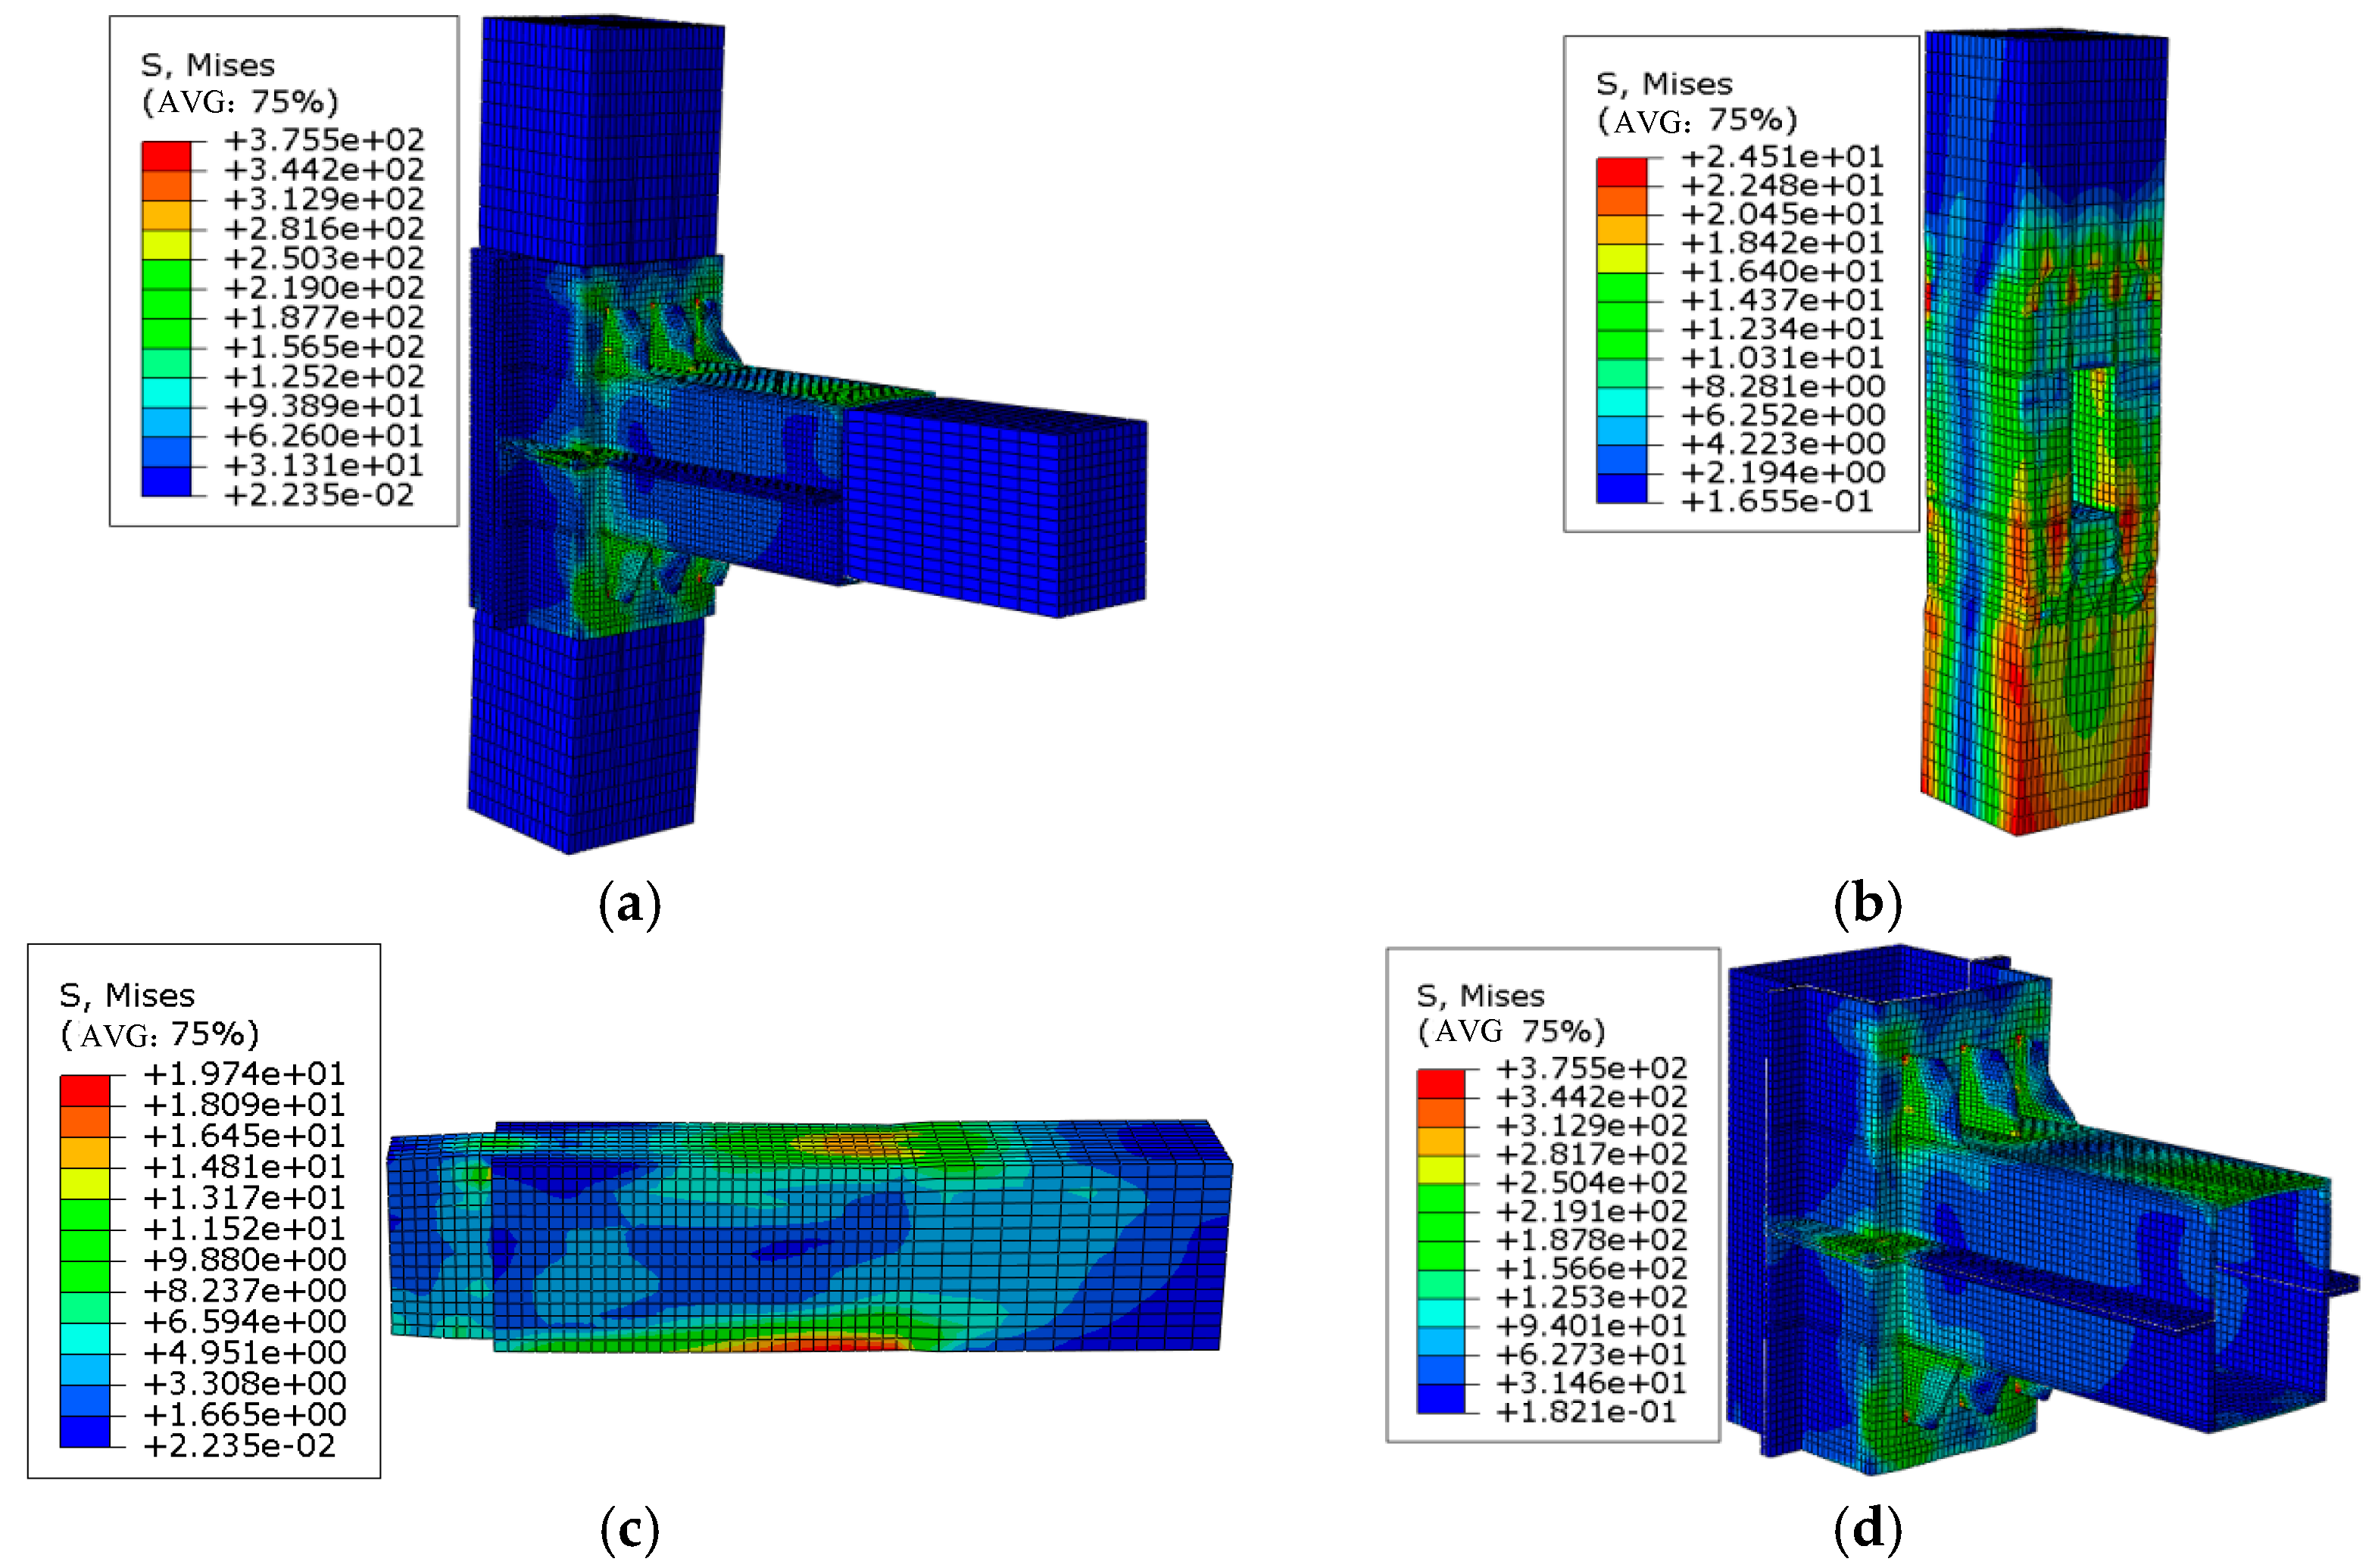
4.5. Joint JG1 Strengthened with a Steel Sleeve

(1)
Stress state
The displacement results of the finite element numerical simulation for joint JG1 are shown in Figure 20a. A relative rotation visibly occurred between the wooden column and the wooden beam at the end of the simulation. The main deformations of joint JG1 included the extrusion deformation at the lower edge of the tenon, the extrusion deformation at the upper and lower edges of the mortise, the upward convex deformation of the steel sleeve under pressure at the overlapping section between the upper edge of the wooden beam and the steel sleeve, the bending deformation of the stiffener due to the extrusion of the steel sleeve, the deformation of the wooden beam caused by the extrusion at the overlapping section between the upper edge of the beam end of the wooden beam and the steel sleeve, and the fracture of the wooden beam. The failure mode of the strengthened joint was presented as the wooden beam being fractured and its bearing capacity being lost. The maximum extrusion deformation of the mortise of joint JG1 differed from that of joint JG0, as shown in Figure 20b. The maximum stress at the lower edge of the mortise reached 24.9 MPa and the wood entered the plastic yield stage because a tensile stress was exerted on the wooden column by the self-tapping screws on the detachable steel sleeve. As shown in Figure 20c, the maximum deformation of the tenon occurred at the lower edge of the joint, and the section where the upper edge of the wooden beam was extruded by the sleeve also reached the cross-grain compressive yield strength of the wood. The steel sleeve reached the yield strength at the upper edge of the sleeve at the beam end and entered the plastic stage, as illustrated in Figure 20d. As presented in Figure 20e, the stiffener underwent visible deformation due to the extrusion of the wooden beam and the steel sleeve. Overall, our analysis results demonstrated that the mortise and tenon joint did not undergo severe stress changes or deformations throughout the loading process. The yield stress evidently appeared on the wooden beam and the wooden column. Thus, it can thus be concluded that the steel sleeve played a protective role in the important sections of the wood joint.
(2)
Analysis of the moment–rotation curve
As can be seen from Figure 21, the change trends of the moment–rotation curves between the numerical simulation and the test for joint JG1 were ultimately the same, and the values from the finite element simulation were slightly larger than those of the experiment. Owing to construction errors made during the manufacturing and installation process of joint JG1, gaps were present between the detachable steel sleeve and the wooden beams and columns. Concurrently, initial defects such as shrinkage cracks and knots were present in the wooden columns and beams themselves. In addition, some idealized simplifications were made to the constitutive relationship of the wood and the support constraints in the finite element simulation. The connection between the detachable steel sleeve and the wood was carefully simulated through surface-to-surface contact with a friction coefficient of 0.4, which may be found to be inconsistent with the actual situation, resulting in joint JG1 having a relatively large structural stiffness during the simulation because of the defects in the actual specimen. The ultimate moments of joint JG1 in the finite element simulation and the test were measured as 9.4 kN·m and 8.8 kN·m, respectively. A difference of 6.8% was found between the simulation and test results, meeting engineering accuracy requirements.
(3)
Analysis of deformation patterns
Two components with the most obvious deformation of joint JG1 were appropriately selected for comparison of deformation, including the wooden beam and the upper steel sleeve at the beam end, as shown in Figure 22. Obvious extrusion and indentation deformation were produced at the extrusion site between the steel sleeve at the beam end and the upper edge of the wooden beam, as seen from the test results presented in Figure 22a and the numerical simulation deformation results presented in Figure 22b. Because there were gaps inside the specimens during assembly, the edge of the tenon at the beam end in the test did not deform either. Apparent extrusion and protrusion deformation had been produced on the steel sleeve at the beam end, as presented in Figure 22c,d. The deformation results of the numerical simulation and the test at these two parts of joint JG1 were distinctly in appropriate agreement.

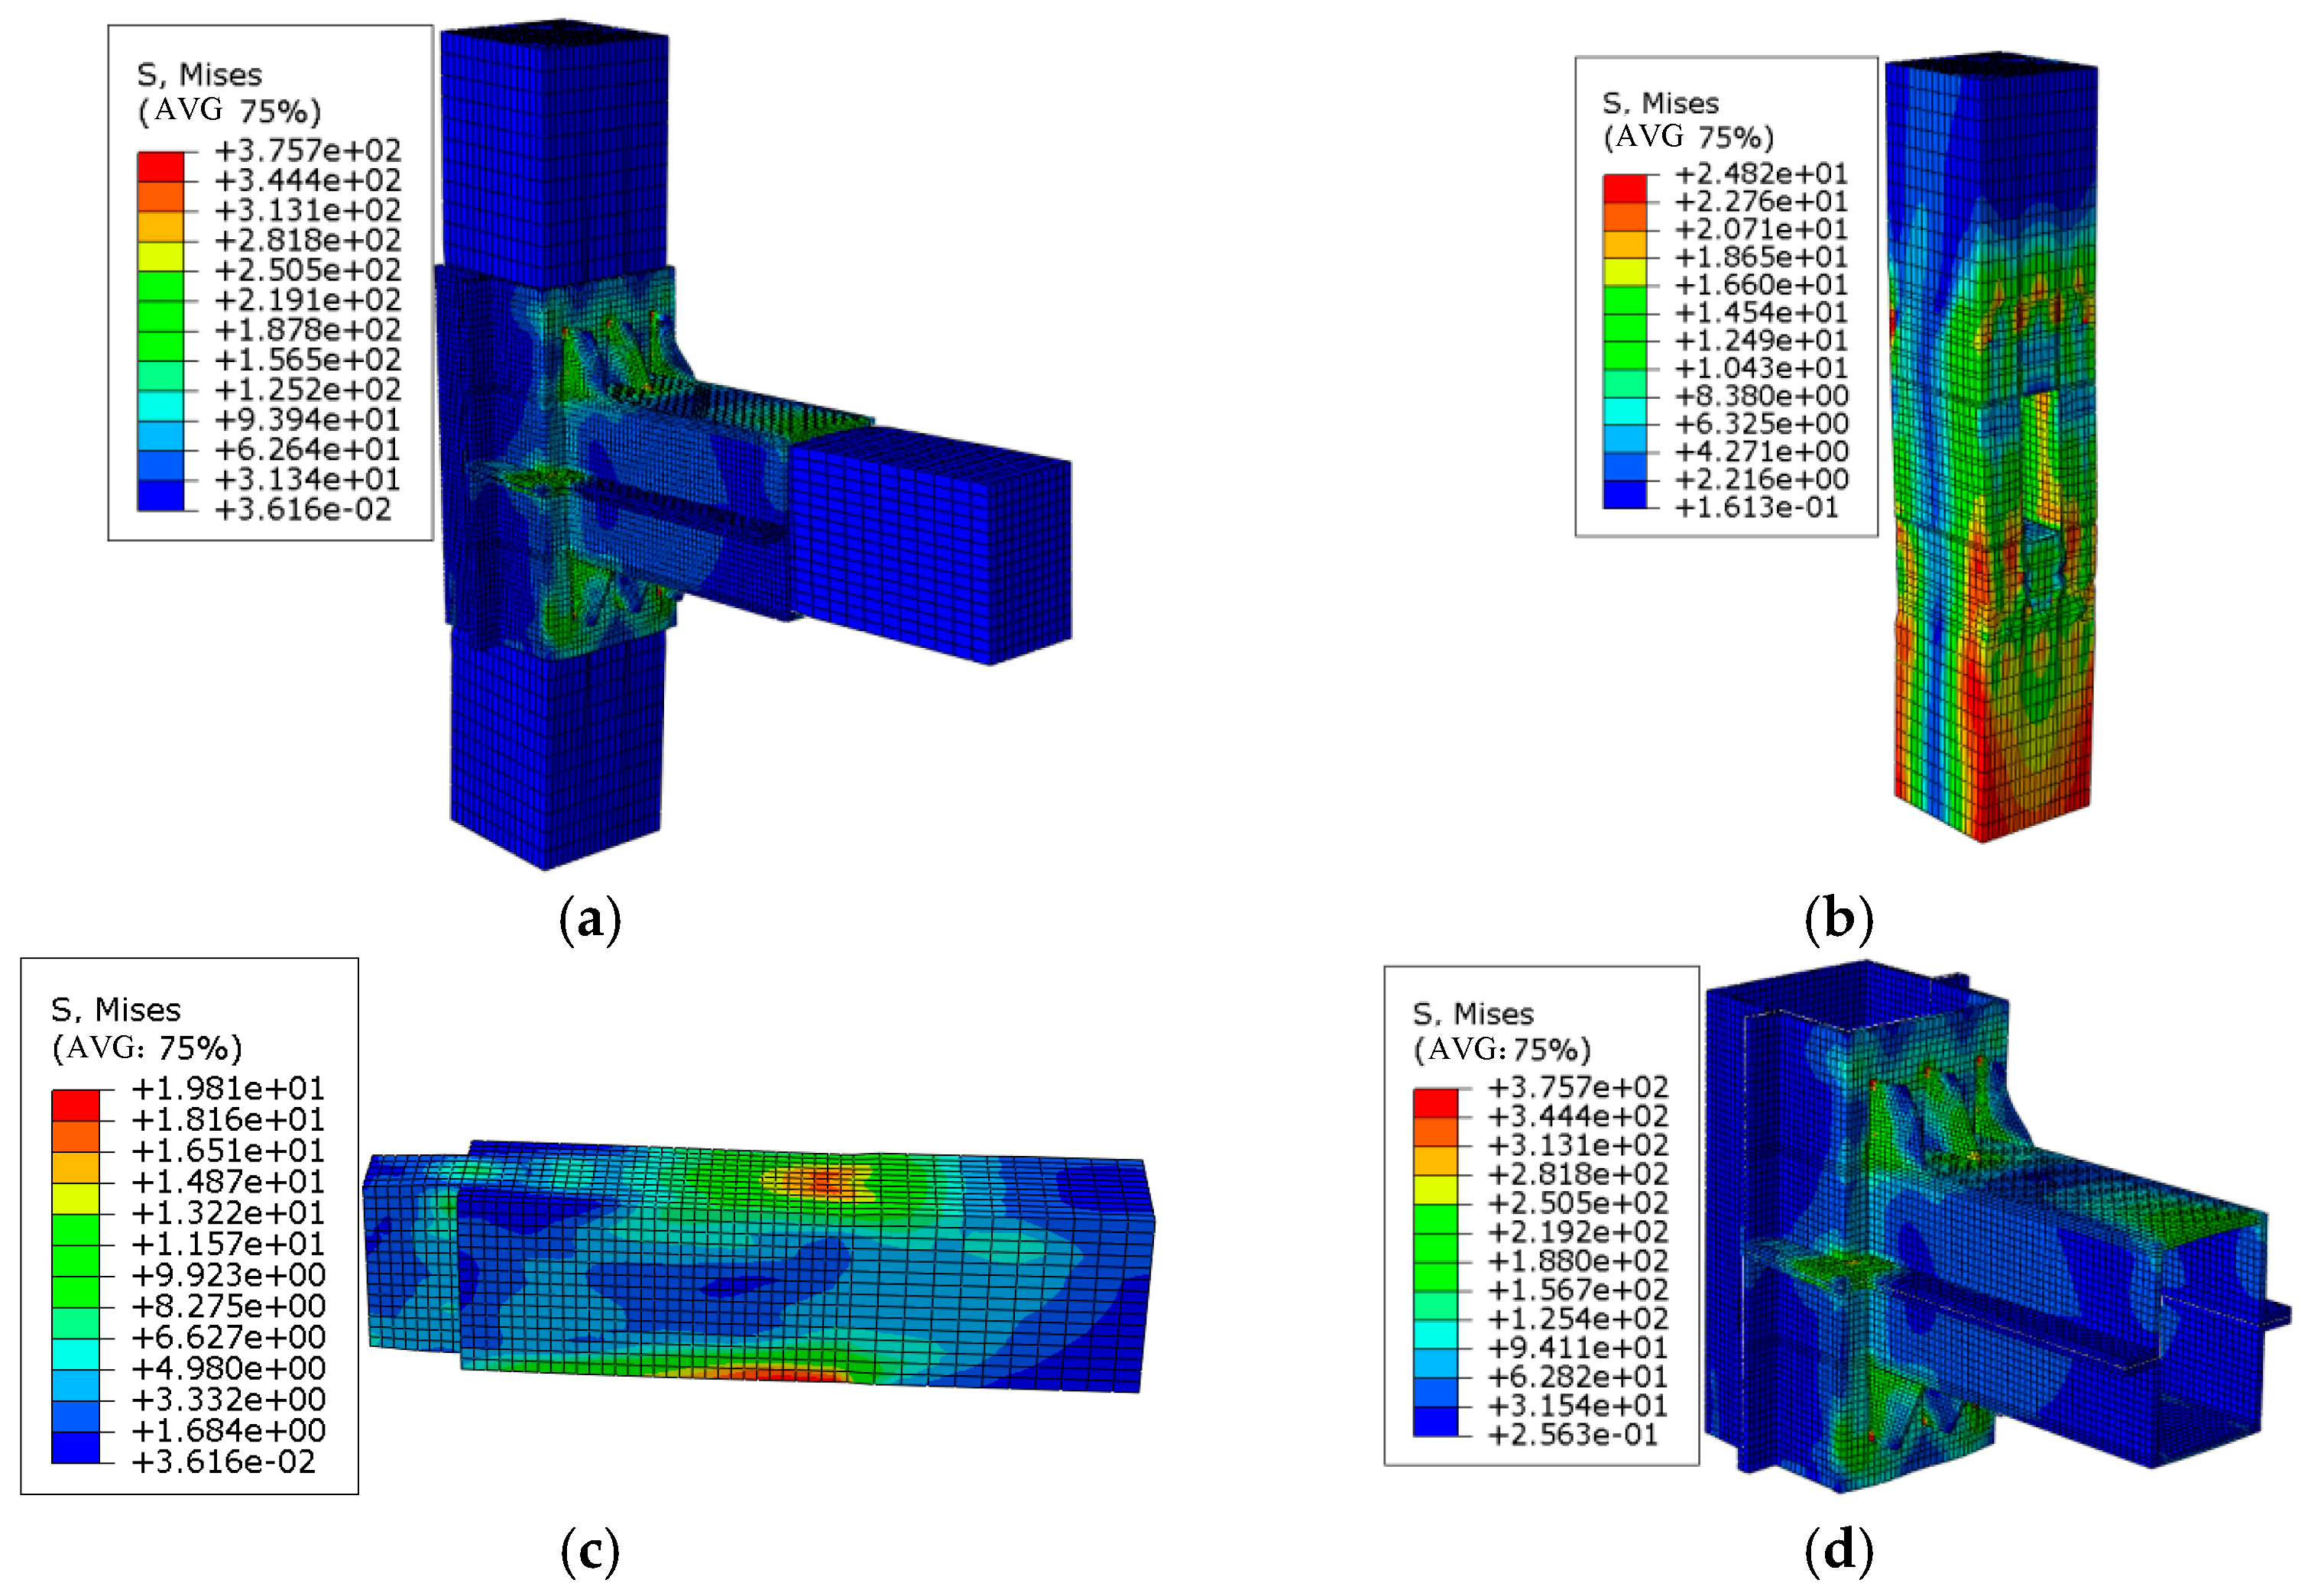
4.6. Finite Element Simulation of Joint JG1 with Different Steel Sleeve Thicknesses

Six different half-tenon wooden joints reinforced by steel sleeves with thicknesses of 1 mm, 2 mm, 3 mm, 4 mm, 5 mm, and 6 mm were, respectively, selected for finite element analysis using ABAQUS V6.11 software. The length of the steel sleeve at the beam end was 300 mm. The size of the stiffening rib, the dimensions of the wooden column and beam, mortise and tenon joints, and other factors were kept identical to the test components. Low-cycle reversed cyclic loading was employed for the simulation, as shown in Figure 23.

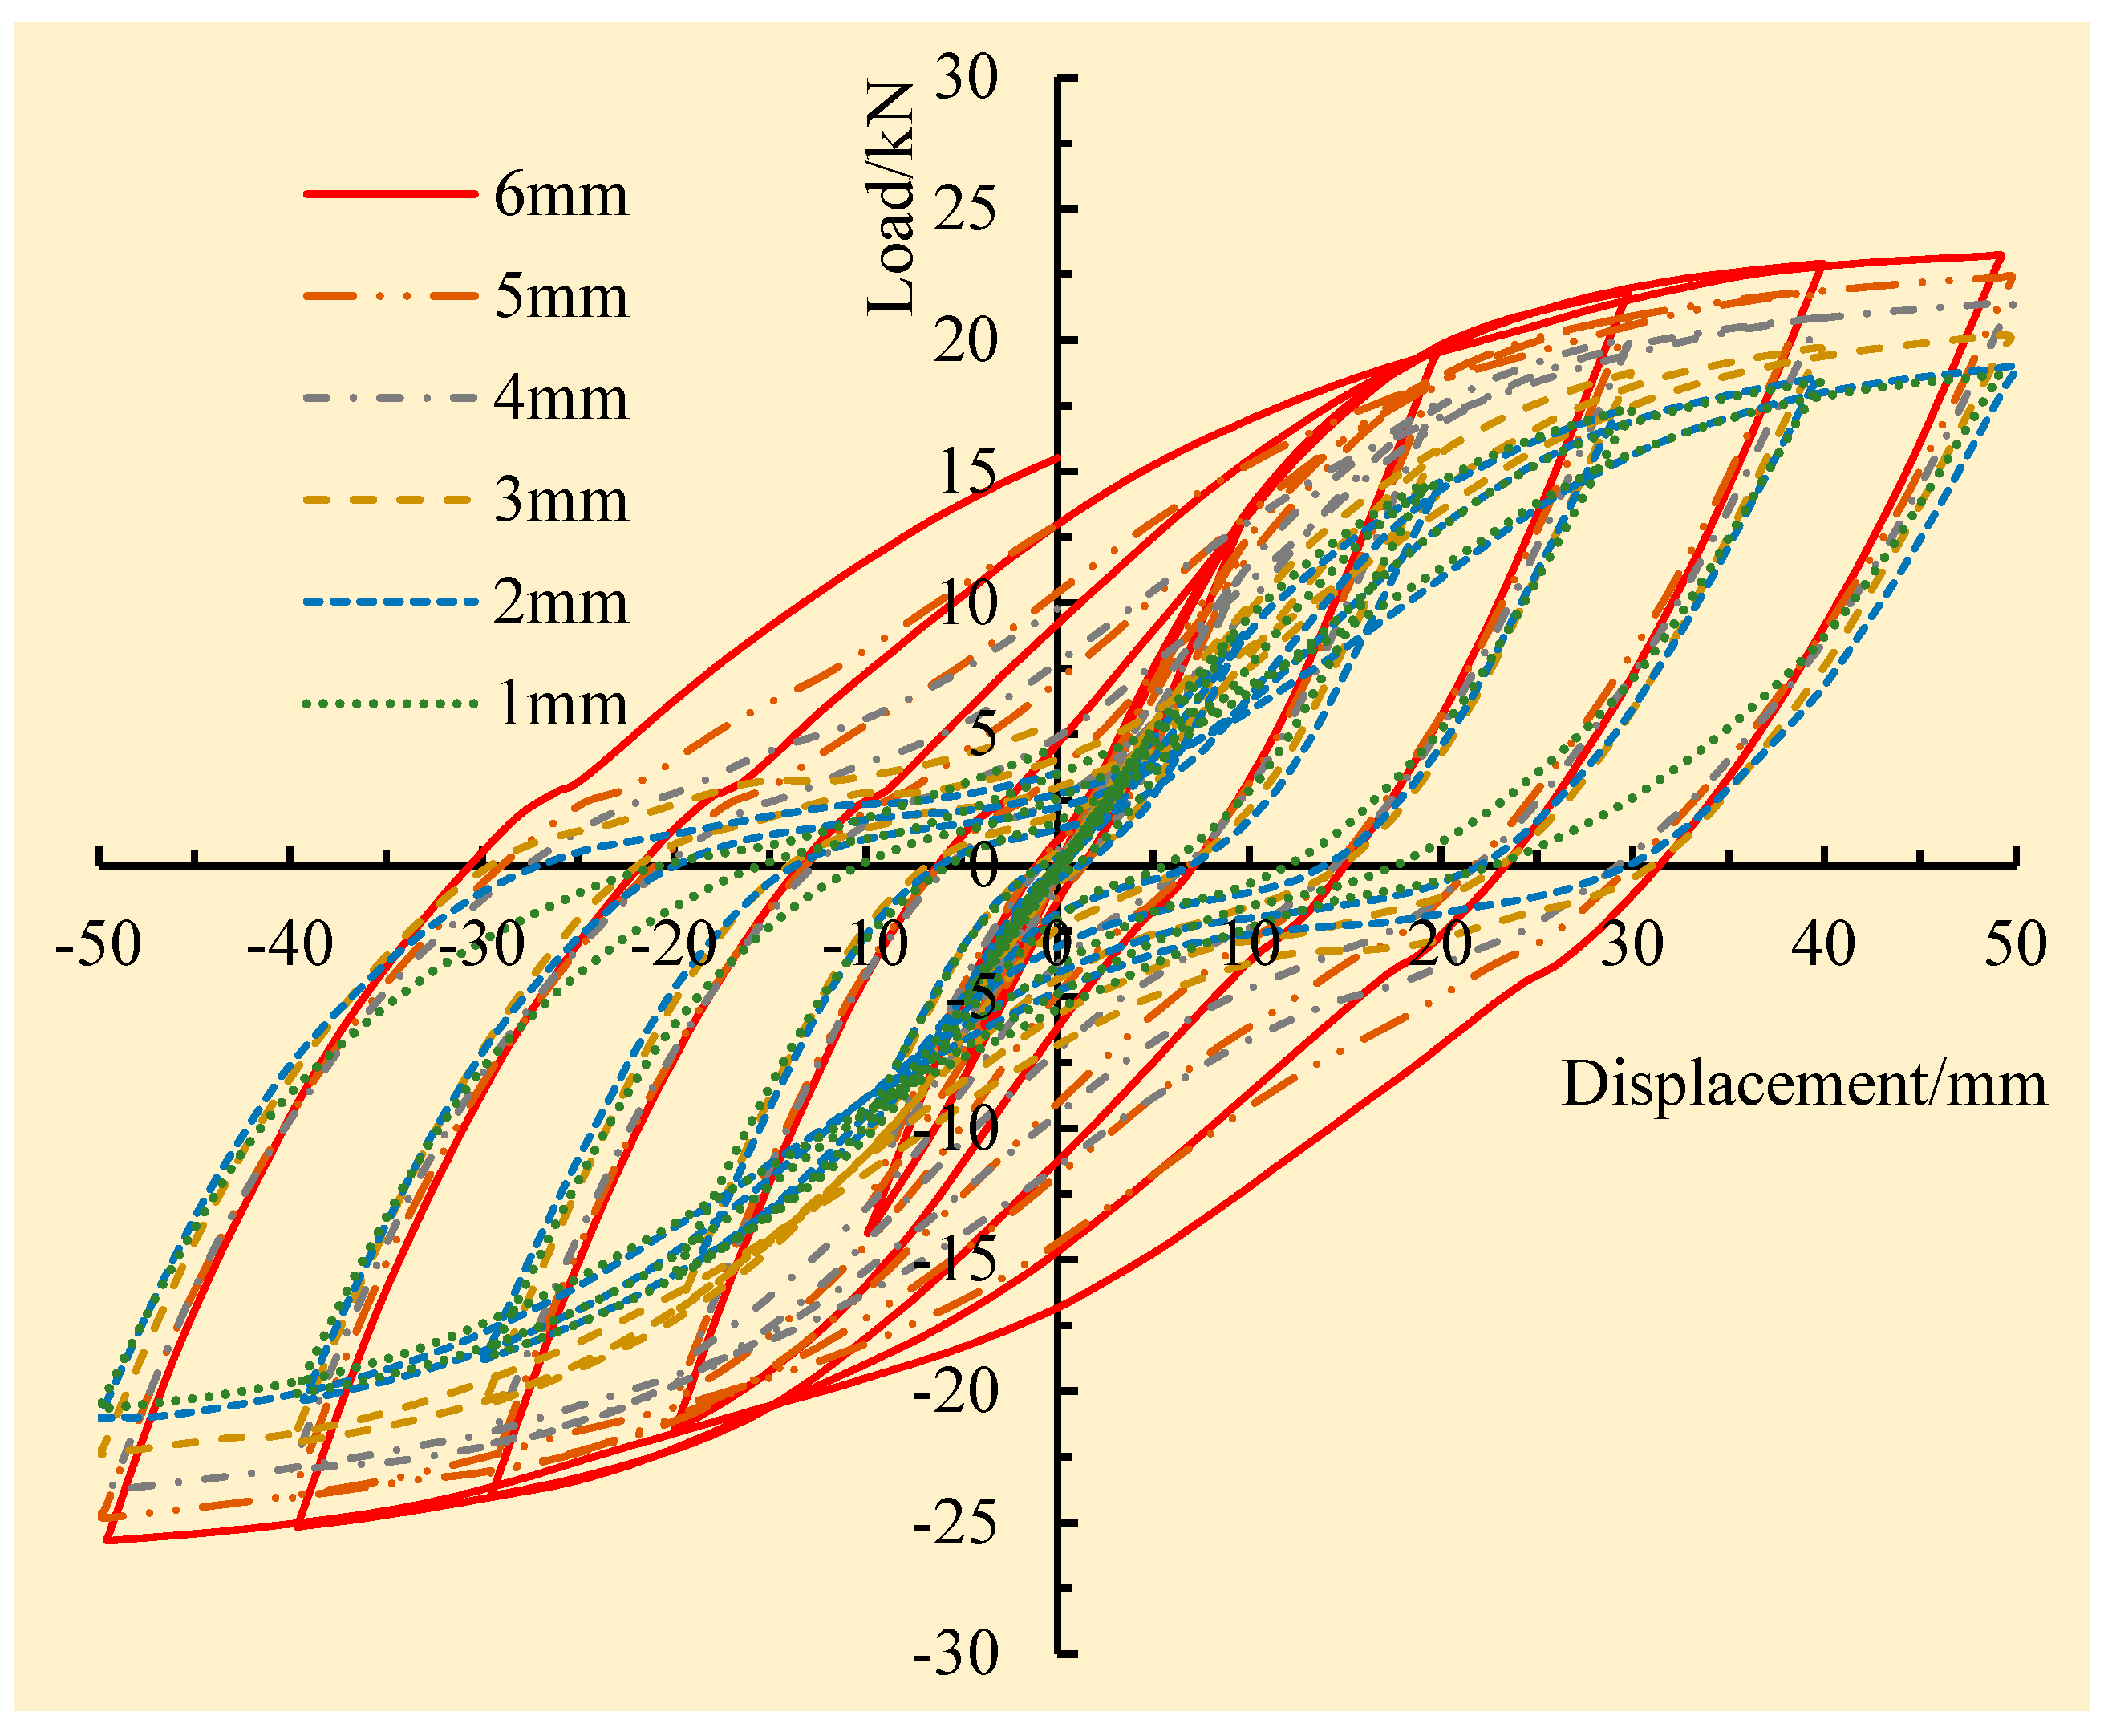
4.6.1. Analysis of Hysteresis Curves

The hysteresis curves of joints reinforced by steel sleeves with different thicknesses under low-cycle reciprocating loads are shown in Figure 24. It can be seen that when the thickness of the steel sleeve was less than or equal to 3 mm, the hysteresis curve of the reinforced joint was bow-shaped and characterized by a “pinch” effect. The hysteresis energy dissipation curve was affected by a certain degree of slip. This factor is related to the fact that the thinner the steel sleeve, the lower the overall stiffness of the reinforced joint. When the thicknesses of the steel sleeves were 1 mm and 2 mm, the hysteresis curves of these two reinforced joints had a relatively high degree of correlation, and the peak values of hysteresis loops were ultimately the same, with only a slight difference in the area of the hysteresis curves. When the thickness was greater than or equal to 4 mm, the hysteresis curve was characterized by a spindle shape, and the hysteresis loop was quite full, exhibiting excellent seismic performance and energy dissipation capacity.
By comparing the hysteresis curves of the six joints reinforced by steel sleeves with different thicknesses as a whole, it was found that as the thickness of the steel sleeve gradually increased, the shape of the hysteresis curve gradually tended to develop from bow to spindle, and the hysteresis curve became fuller and plumper. However, when the thickness of the steel sleeve increased from 4 mm to 6 mm, although the energy consumption of the hysteresis loop for the reinforced joints increased somewhat, the increase was not significant, which indicated that 4 mm was the optimal thickness for the steel sleeve from an economic perspective.

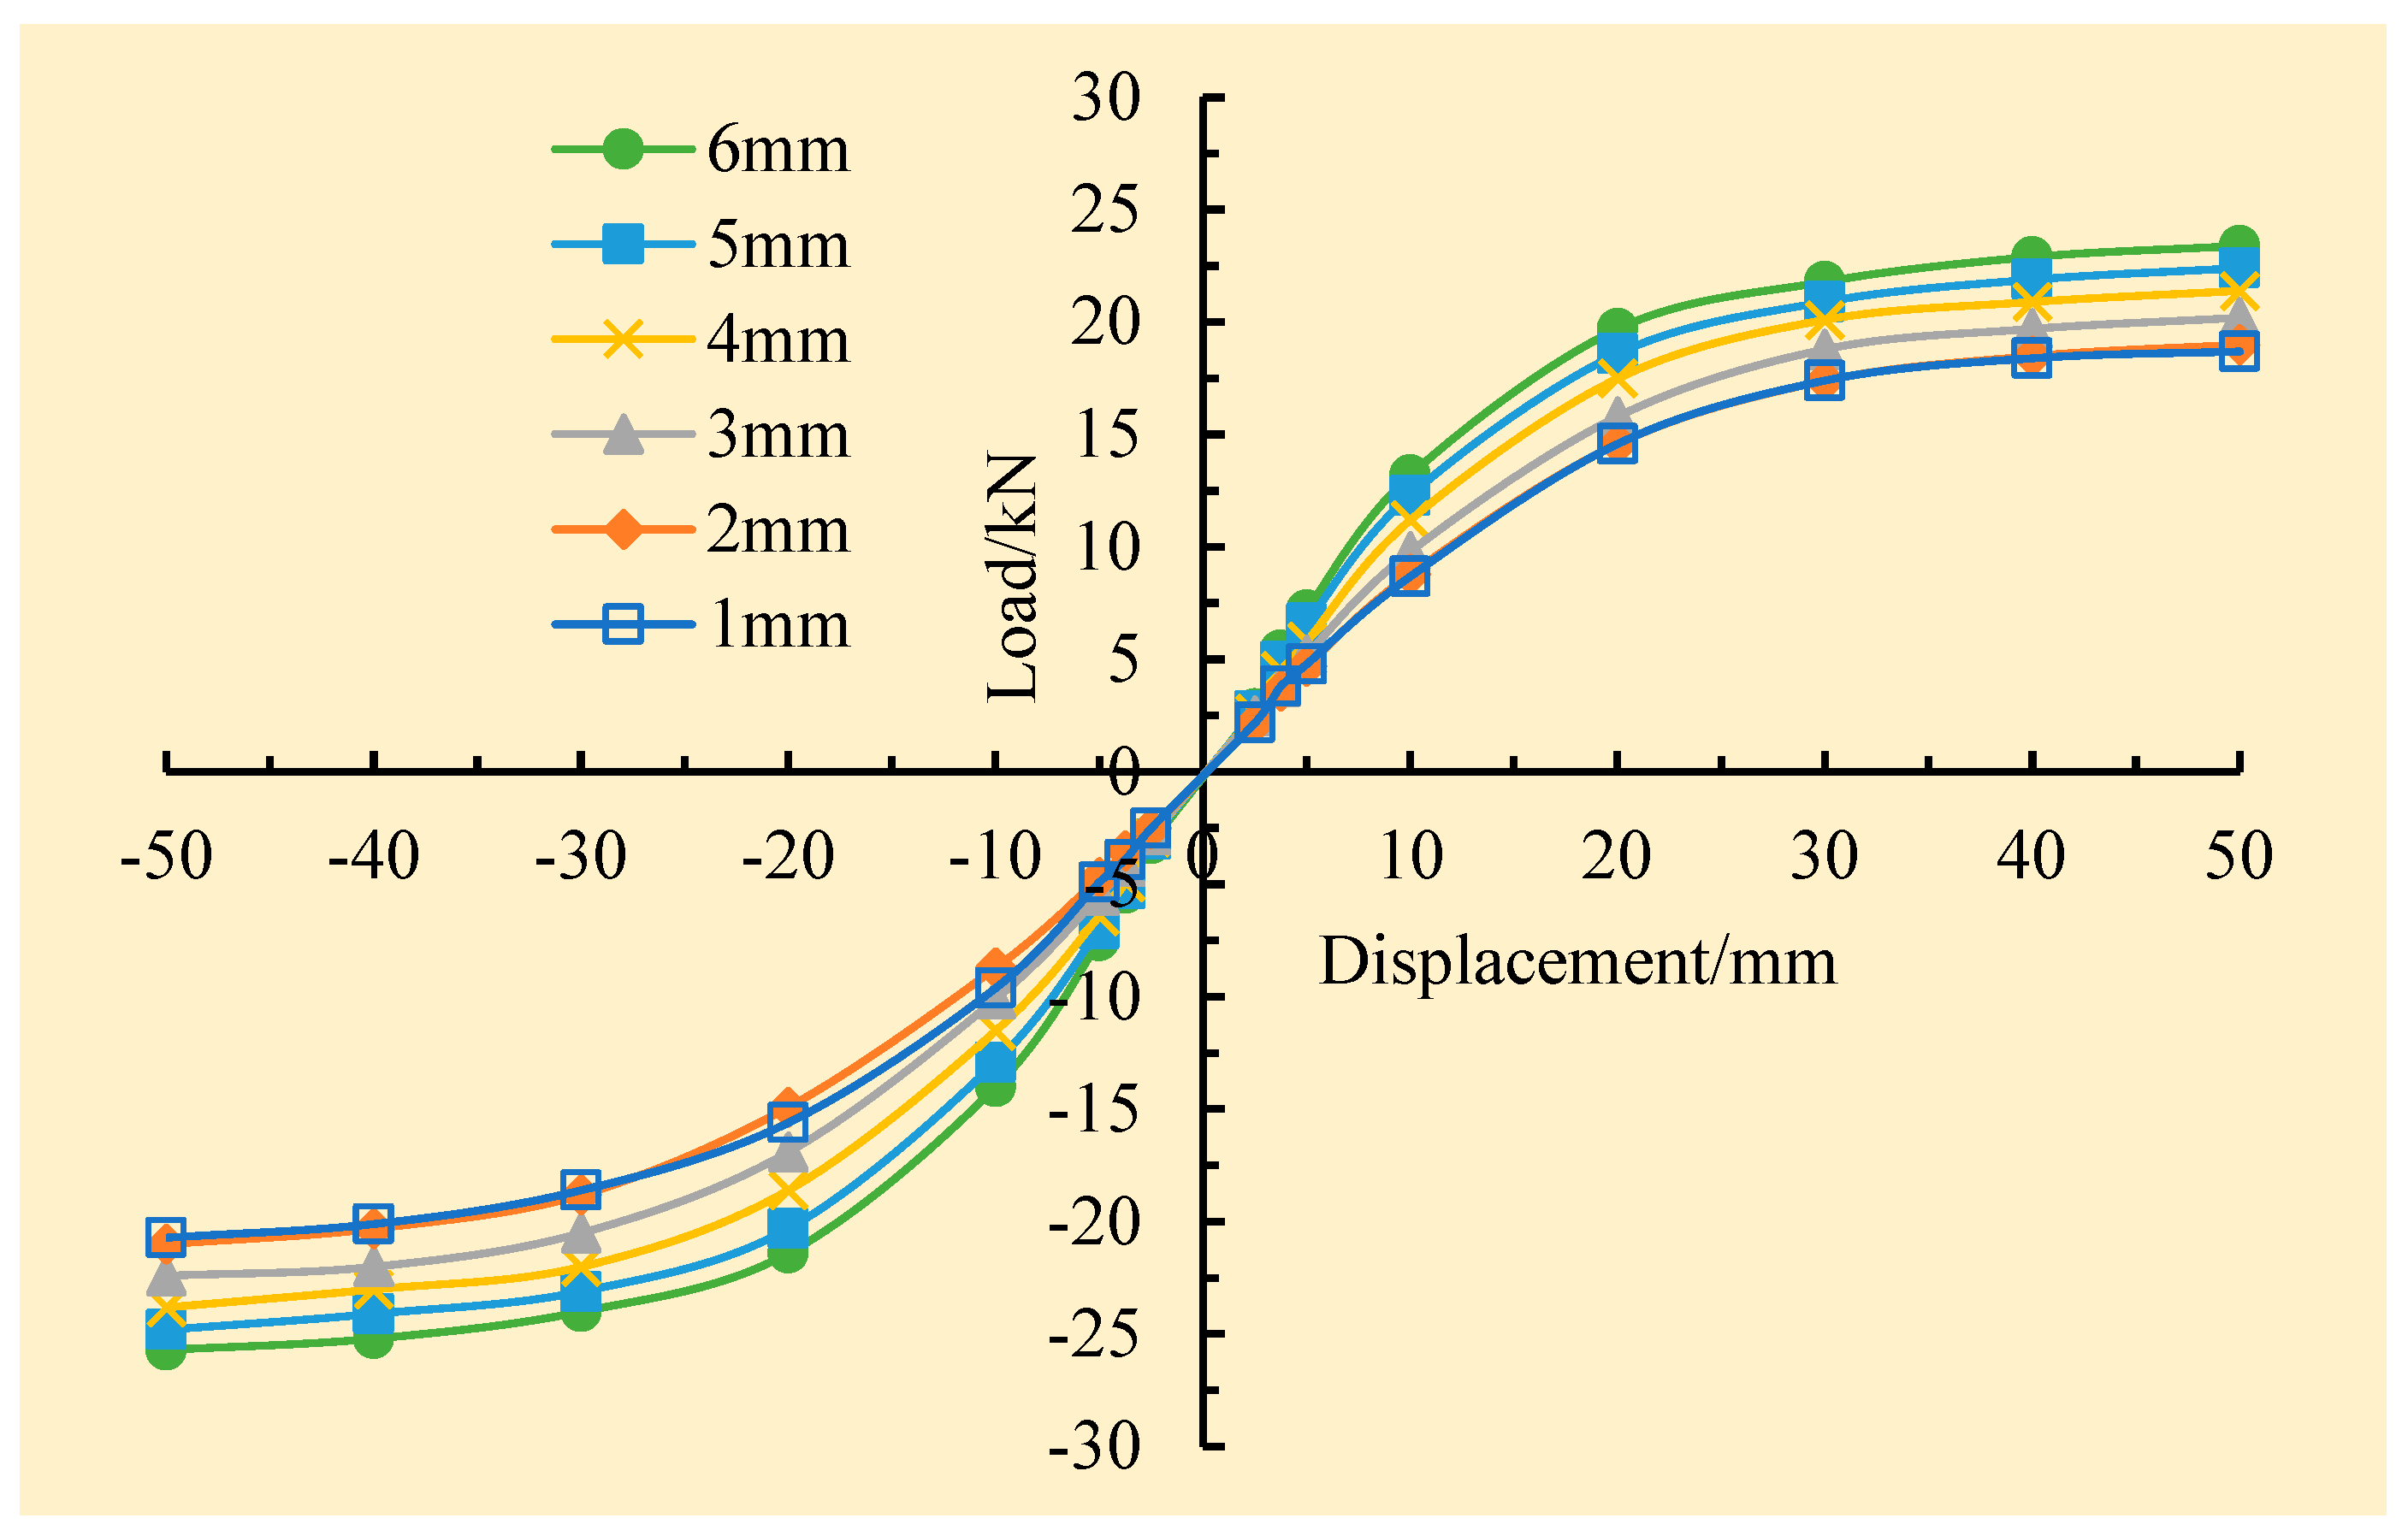
4.6.2. Analysis of Skeleton Curves

The skeleton curves of joints reinforced by steel sleeves with different thicknesses under low-cycle reciprocating loads are shown in Figure 25. It can be seen that when the thicknesses of the steel sleeves were 1 mm and 2 mm, the skeleton curves were ultimately consistent, and the difference was relatively small. Because the sleeve was too thin and had insufficient rigidity, this made it prone to premature yield. When the thickness of the steel sleeve was less than or equal to 2 mm, increasing the thickness of the steel sleeve had no effect on the load-bearing capacity of the wood joint. When the thickness of the steel sleeve was greater than or equal to 2 mm, it could be seen by comparing and analyzing the five skeleton curves that the load-bearing capacity of the joint was enhanced with the increase in sleeve thickness.
At the initial stage of loading, the six skeleton curves all showed a linear upward trend and practically remained the same, indicating that the initial stiffness of each joint was ultimately consistent. As the loading continued, each joint experienced the yield of the stiffening rib and extrusion deformation of the wooden beam and the steel sleeve at the beam end due to the increase in loading displacement. Moreover, as the stiffness of the reinforced joint decreased, this caused the upward trend of the curve to gradually flatten until it stopped rising and a flattening stage occurred. Moreover, the thickness of the steel sleeve became thicker, and the flattened point appeared later.

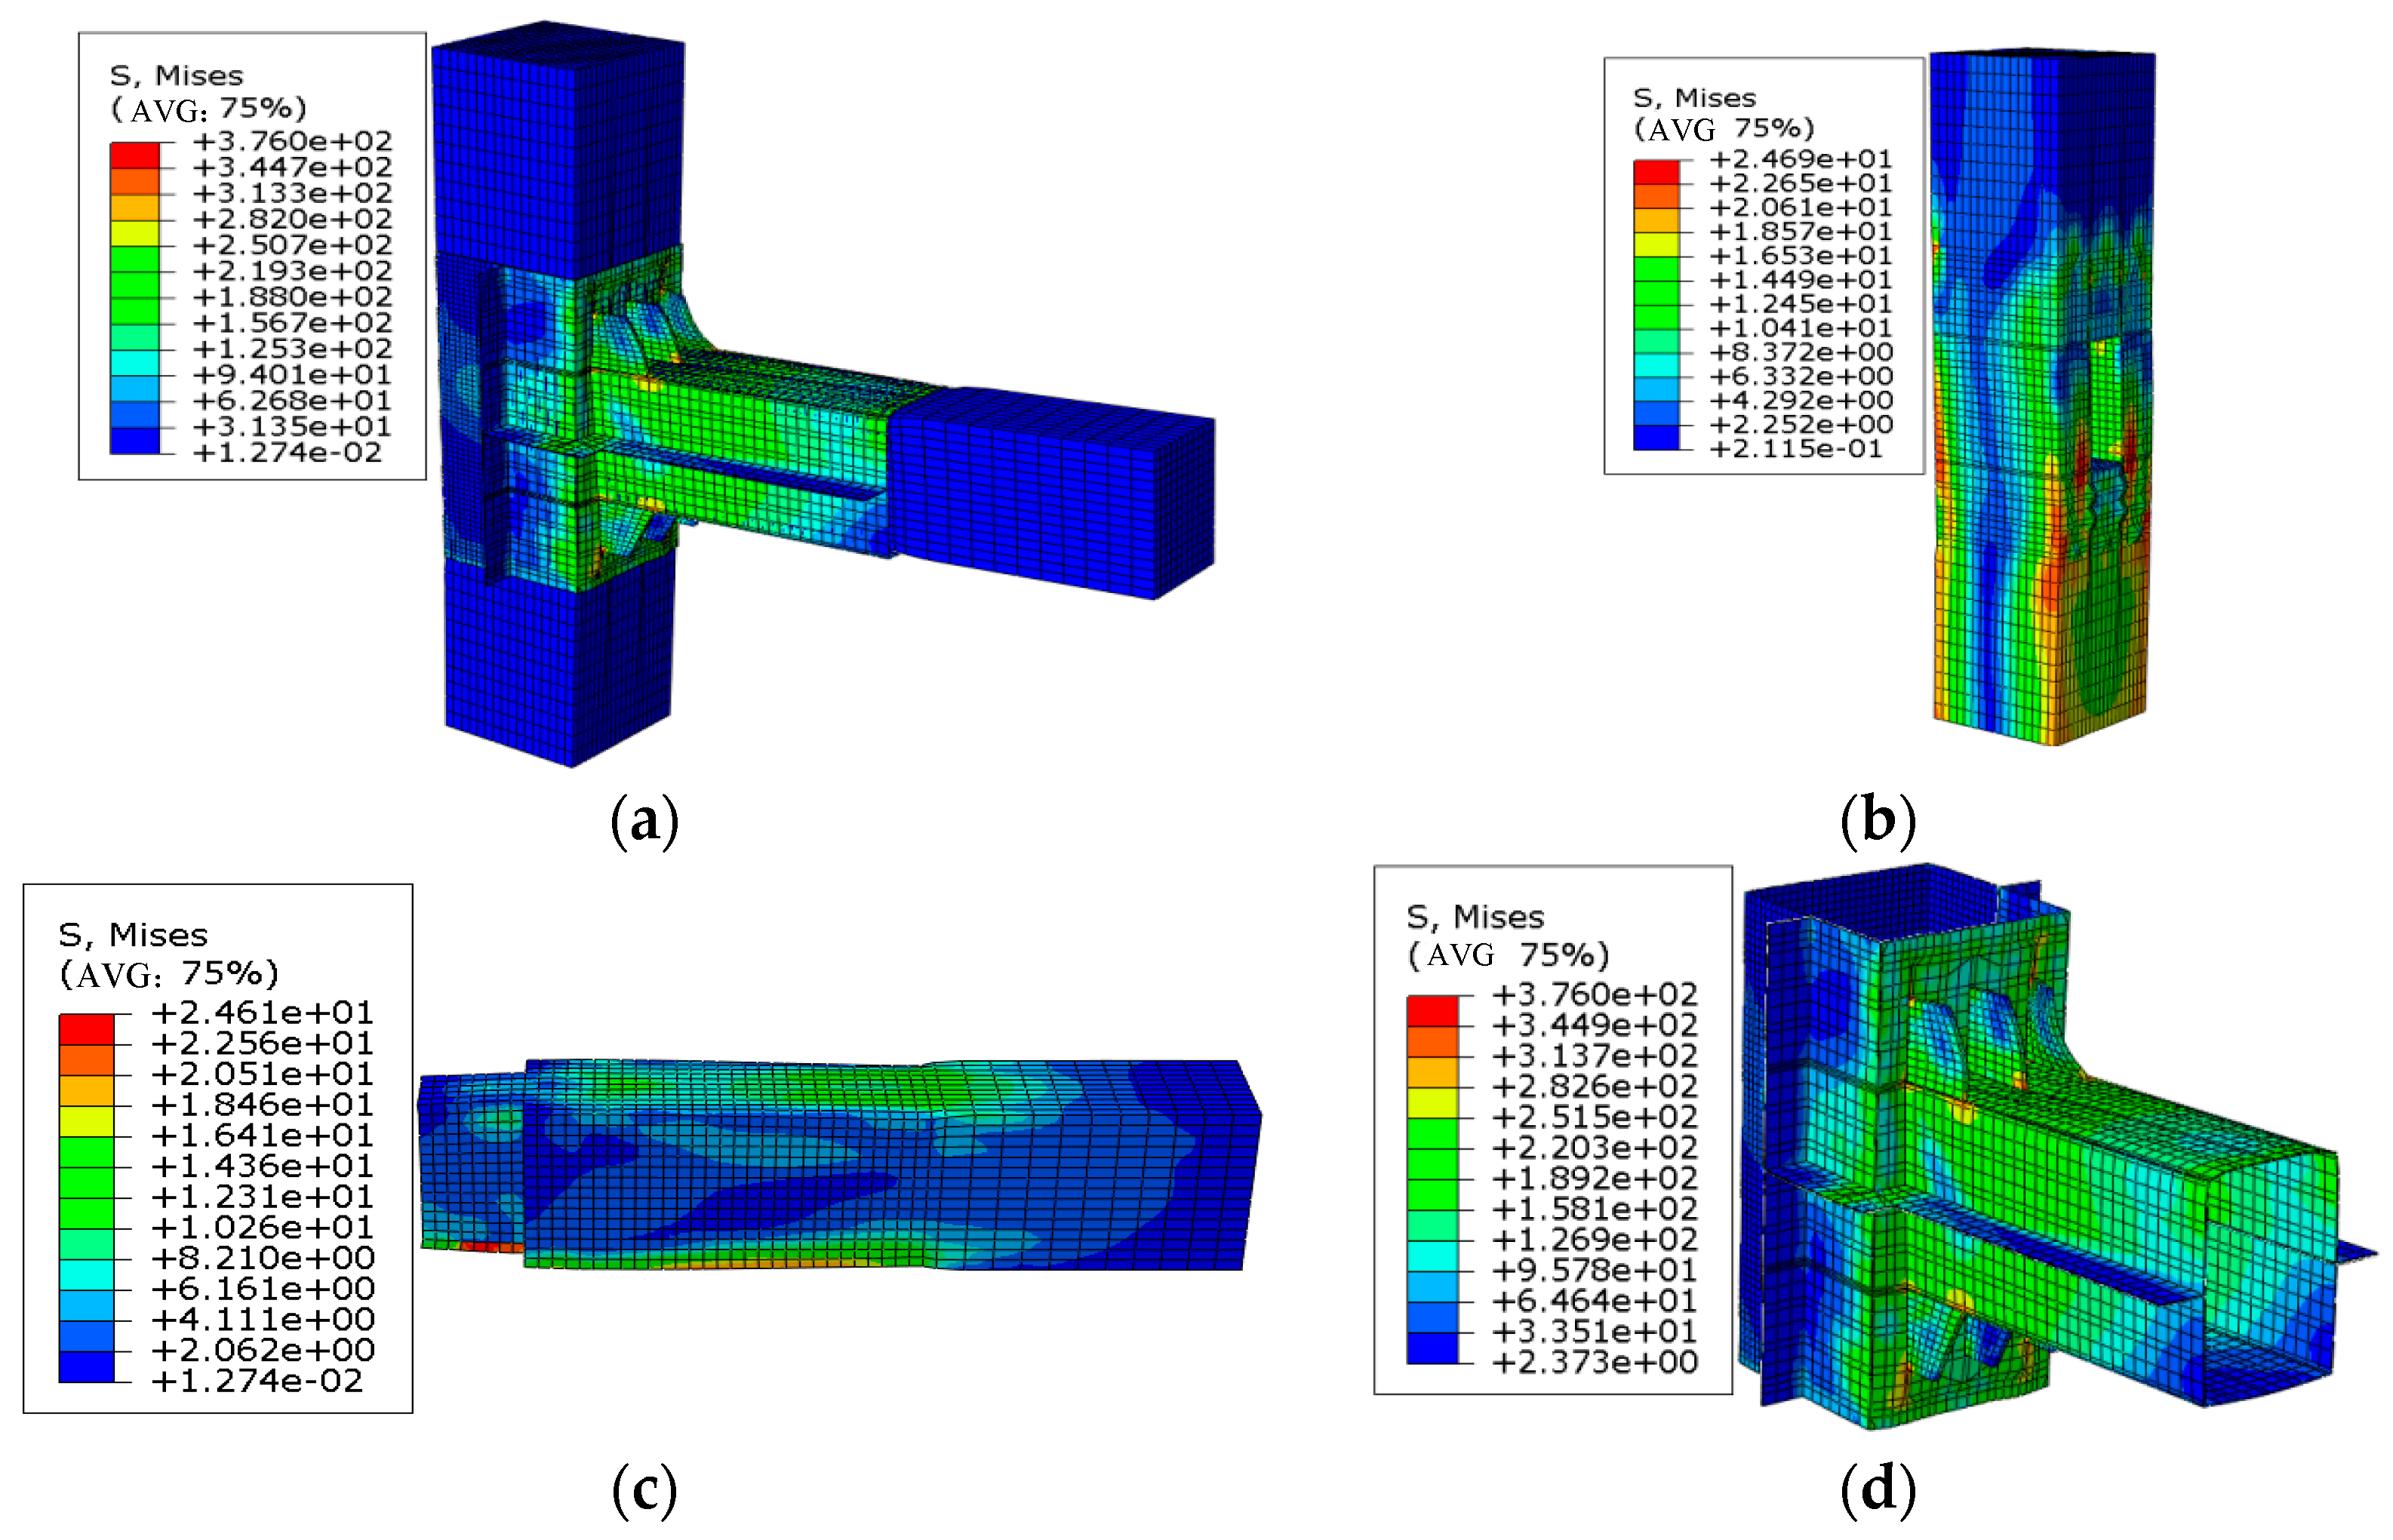
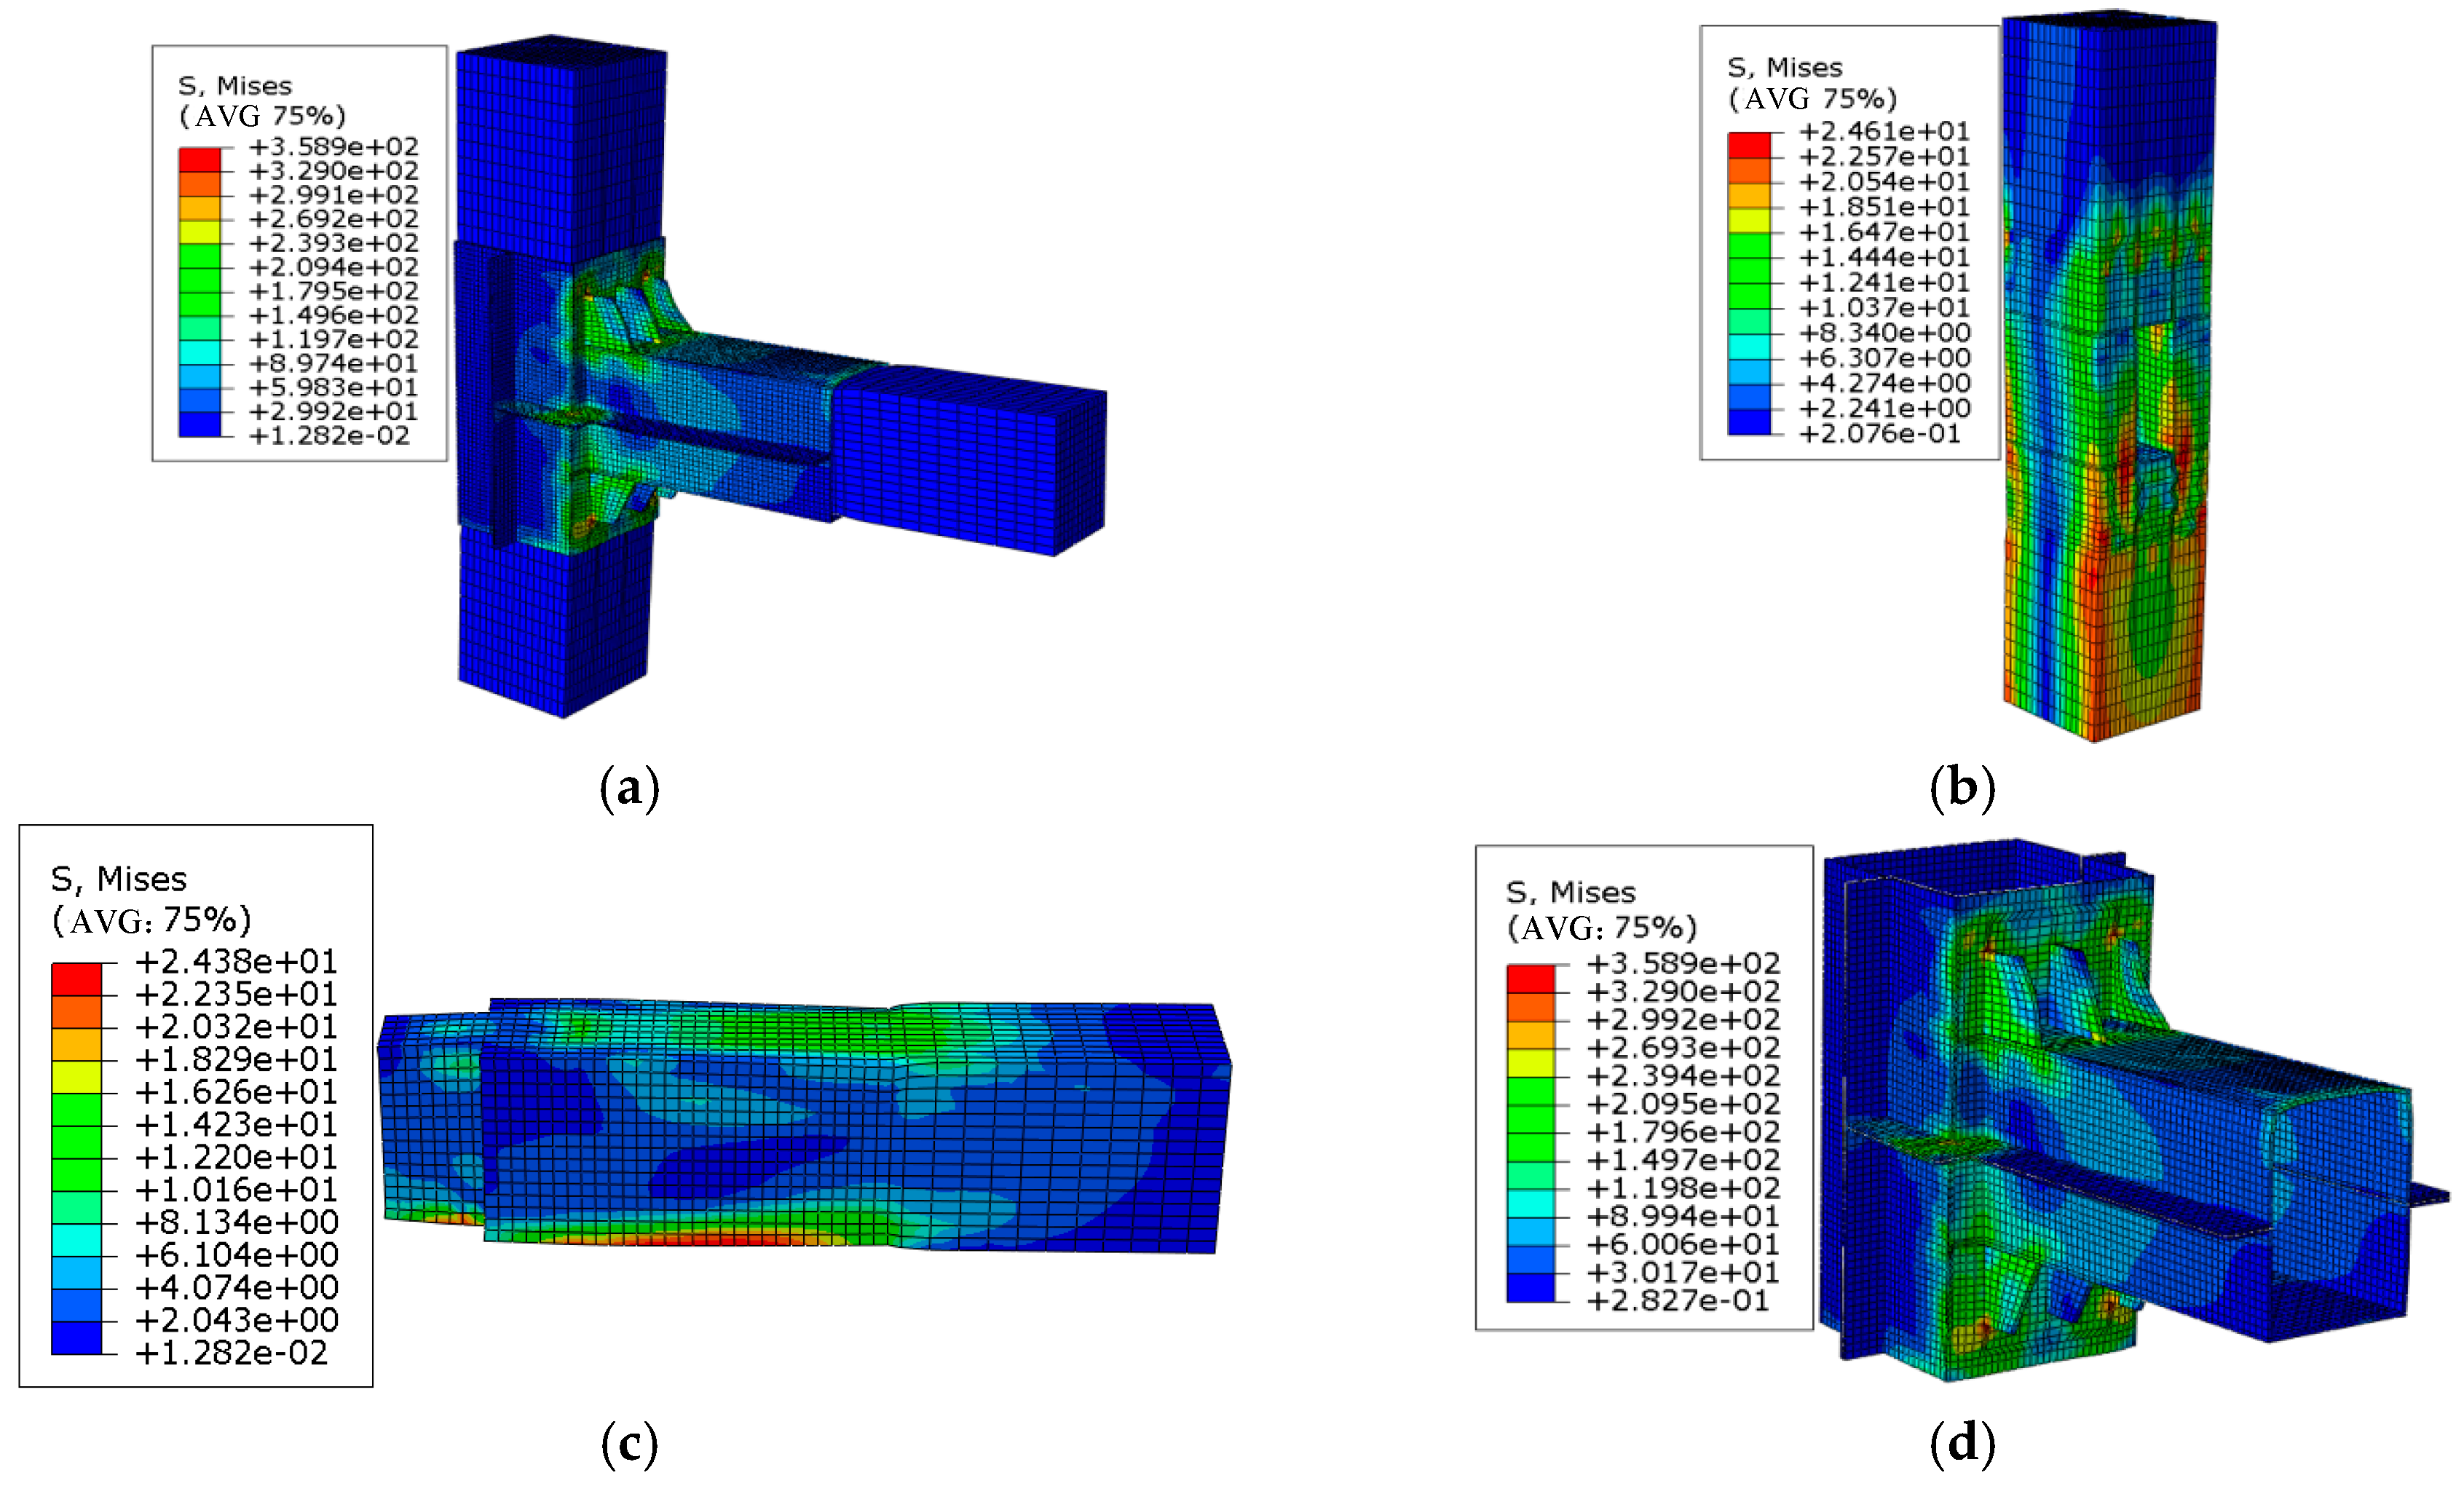
4.6.3. Analysis of Stress Nephograms

The stress nephograms of the entire structure and each component of the joints reinforced by steel sleeves with different thicknesses when the displacement reached 50 mm are shown in Figure 26, Figure 27, Figure 28, Figure 29, Figure 30 and Figure 31.
From the analysis of the above stress nephograms, it can be clearly seen that when the loading displacement reached 50 mm, as the thickness increased, the maximum stress of the beam gradually decreased; however, the maximum stress of the wooden column inversely increased, as a result of the increase in the thickness of the steel sleeve enhancing the rigidity of the joint, fully transmitting the force on the wooden beam to the wooden column.
The stiffening ribs on the compression side of these models all underwent plastic bending deformation. When the thickness of the steel sleeve was less than or equal to 3 mm, the bending deformation of the stiffening ribs increased as the thickness of the steel sleeve decreased. However, when the thickness reached 4 mm, the deformation of the stiffening ribs suddenly increased to a maximum of 11 mm and then began to decrease as the thickness of the steel sleeve increased. This finding was due to the fact that when the thickness of the steel sleeve was less than 3 mm, the overall rigidity of the detachable steel sleeve was relatively small. The steel sleeve at the beam end would undergo significant deformation under the compression of the wooden beam. The lower the thickness, the greater the deformation of the steel sleeve at the beam end. However, when the thickness of the steel sleeve reached 4 mm, the overall stiffness of the detachable steel sleeve was relatively large, and the deformation under the action of squeezing was relatively small; in addition, the deformation was mainly borne by the stiffening ribs. Due to the excessive overall stiffness of the detachable steel sleeve, the bending moment on the wooden beam was fully transferred to the wooden column.

4.7. Limitations

(1)
The difference in materials
The moisture content and texture differences of the wood were not fully considered in the present study; therefore, the applicability of the test has certain limitations.
(2)
Simplified model
Because of the time period in which the model was established, simplifying the material friction coefficient of the model may make it impossible to conduct detailed research under dynamic loads.
(3)
Loading conditions
Due to the limitations of the test site and equipment, the test cannot be performed under the condition of low-cycle reciprocating loads.
(4)
Research applicability
Due to the funding limitations of this project, the test materials and reinforcement methods lack variability; the results therefore cannot be generalized to all studies.

5. Conclusions

As part of this study on the key mechanical performance of steel–wood composite structures, we propose an effective, practical method for reinforcing wooden joints with detachable steel sleeves. The mechanical characteristics of a pure wooden joint without reinforcement were analyzed for comparison, and a monotonic loading test and finite element simulation study of the pure and reinforced joints were meticulously performed. The corresponding conclusions can be summarized and analyzed as follows:
(1) Through the monotonic loading test, it was evident that the unreinforced pure joint suffered from tenon extraction failure and possessed an extremely low load-bearing capacity of only 0.8 kN; in addition, the tenon separated from the column by 22 mm. However, the load-bearing capacity of the joint with the detachable steel sleeve effectively reached 19.2 kN, which indicates that the bearing capacity of the joint after reinforcement will be significantly improved through comparison with the pure joint. The reinforced joint experienced extrusion failure at the overlapping section between the upper edge of the wooden beam and the steel sleeve at the beam end, and the extrusion deformation between these components was obvious; however, the tenon at the beam end was not pulled out, which demonstrates that these failure characteristics will be beneficial for engineering designs compared with the pure wooden joint.
(2) By analyzing the essential mechanical parameters of these two joints, it was found that the initial rotational stiffness, yield moment, and ultimate moment of the reinforced joint with the steel sleeve were, respectively, increased by 495.4%, 425.9%, and 627.5%, compared to the unreinforced wooden joint, which clearly demonstrates that the mechanical performance will be significantly improved after reinforcement, enabling it to better resist the bending moment and delay the failure of the wooden joint.
(3) The failure states of tenons in the joint obtained from the experimental results and the finite element simulation were almost consistent; in comparison, a certain degree of deviation between the experimental and simulated values was found in the moment–rotation curves. For the unreinforced half-tenon joint and that reinforced with a detachable steel sleeve, the errors in their ultimate moments were 8% and 6.8%, respectively, which are reasonably in line with engineering accuracy requirements.
(4) The thickness of the steel sleeve has a significant influence on the hysteresis curve of the reinforced joint. As the thickness of the steel sleeve gradually increased, the shape of the hysteresis curve gradually tended to develop from bow- to spindle-shaped, and the hysteresis loop became fuller and more substantial. When the thickness of the steel sleeve was less than 2 mm, the thickness of the steel sleeve had a relatively small influence on the mechanical properties of the joint. However, when the thickness of the steel sleeve increased from 4 mm to 6 mm, although the energy consumption of the hysteresis loop for the reinforced joints increased somewhat, the increase was not significant, which indicated that 4 mm was the optimal thickness for the steel sleeve from an economic perspective.

Author Contributions

Conceptualization, J.S.; methodology, Z.W. and H.X.; software, Y.Z. and B.M.; validation, Y.Z. and B.M.; investigation, J.G.; resources, A.F.; data curation, Y.W.; writing—original draft preparation, J.G.; writing—review and editing, J.S.; supervision, Y.W.; project administration, Z.W.; funding acquisition, A.F. All authors have read and agreed to the published version of the manuscript.

Funding

National Natural Science Foundation of China (12462010), Qiandongnan Science and Technology Plan Project (Qiandongnan Science and Technology Cooperation Support (2024) No. 0019), Qiandongnan Science and Technology Plan Project (Qiandongnan Science and Technology Foundation (2023) No. 03), the “14th Five-Year Plan” Discipline Professional Platform Team Integration Construction Project of Kaili College (YTH-PT202403).

Data Availability Statement

The data presented in this study are available on request from the corresponding author. The data are not publicly available due to the test data involves personal privacy and is not convenient to provide.

Conflicts of Interest

Authors Anxiang Feng and Hongxuan Xu were employed by the company Guizhou Zhongjian Weiye Construction (Group) Co., Ltd. The remaining authors declare that the research was conducted in the absence of any commercial or financial relationships that could be construed as a potential conflict of interest.

References

  1. Rafal, K. FRP Strengthening of Timber Structures under the Elevated Temperature. IOP Conf. Ser. Mater. Sci. Eng. 2019, 471, 052049. [Google Scholar]
  2. Hua, Y.; Chun, Q.; Mi, Z.; Wu, Y. Experimental research on progressive collapse behavior of Chinese ancient timber buildings with different joint strengthening methods. J. Build. Eng. 2023, 68, 106215. [Google Scholar] [CrossRef]
  3. Dar, M.A.; Subramanian, M.; Anbarasu, H.C.; Dar, A.R. Effective Strengthening of Timber Beams: Experimental lnvestigation. Pract. Period. Struct. Des. Constr. 2021, 26, 0402. [Google Scholar] [CrossRef]
  4. Shao, J.; Wang, K.; Kaewunruen, S.; Cai, W.; Wang, Z. Experimental investigations into earthquake resistance of steel frame retrofitted by low-yield-point steel energy absorbers. Appl. Sci. 2019, 9, 3299. [Google Scholar] [CrossRef]
  5. Liu, Q.; Shao, J.; Tang, B.; Wang, Z. Experimental investigation into failure modes of low-yield-point steel plate shear walls. Appl. Sci. 2022, 12, 5632. [Google Scholar] [CrossRef]
  6. Hota, G.; Sonti, S.S.; Superfesky, M.C. Static response of wood crossties reinforced with composite fabrics. Int. Soc. Adv. Mater. Process Eng. Symp. Exhib. 1996, 41, 1291–1303. [Google Scholar]
  7. Plevris, N.; Triantafillou, T. FRP-reinforced wood as structural material. J. Mater. Civ. Eng. 1992, 3, 300–317. [Google Scholar] [CrossRef]
  8. Johns, K.C.; Lacroix, S. Composite reinforcement of timber in bending. Can. J. Civ. Eng. 2000, 27, 899–906. [Google Scholar] [CrossRef]
  9. Liu, K.; Shao, J.; Tang, B.; Wu, Q.; Wang, Z. Seismic performance of low-yield-point steel plate shear walls under horizontal cyclic load. Iran. J. Sci. Technol. Trans. Civ. Eng. 2022, 46, 3739–3752. [Google Scholar] [CrossRef]
  10. Wang, Z.; Shao, J. Study on quasi-static axial compression performance and energy absorption of aluminum foam-filled steel tubes. Materials 2023, 16, 4485. [Google Scholar] [CrossRef] [PubMed]
  11. Wang, T.; Shao, J.; Zhao, C.; Liu, W.; Wang, Z. Shaking table test for evaluating the seismic performance of steel frame retrofitted by buckling-restrained braces. Shock Vib. 2021, 1, 1–17. [Google Scholar] [CrossRef]
  12. José, R.; Guaita Fernández, M.V.; Arriaga Martitegui, F.V. Analysis of the Stress State at the Cogging Joint in Timber Structures. Biosyst. Eng. 2007, 96, 79–90. [Google Scholar]
  13. Kłosowski, P.; Pestka, A.; Krajewski, M.; Lubowiecka, I. Experimental and computational study on mechanical behaviour of carpentry corner log joints. Eng. Struct. 2020, 213, 110515. [Google Scholar] [CrossRef]
  14. Khelifa, M.; Auchet, S.; Méausoone, P.-J.; Celzard, A. Finite element analysis of flexural strengthening of timber beams with Carbon Fibre-Reinforced Polymers. Eng. Struct. 2015, 101, 364–375. [Google Scholar] [CrossRef]
  15. Nakagawa, T.; Ohta, M. Collapsing process simulations of timber structures under dynamic loading I: Simulations of two-story frame models. J. Wood Sci. 2003, 49, 392–397. [Google Scholar] [CrossRef]
  16. Li, H.; Qiu, H.; Lu, Y. An analytical model for the loading capacity of splice-retrofitted slender timber columns. Eng. Struct. 2020, 225, 111274. [Google Scholar] [CrossRef]
  17. Micelli, F.; Scialpi, V.; La Tegola, A. Flexural Reinforcement of Glulam Timber Beams and Joints with Carbon Fiber-Reinforced Polymer Rods. J. Compos. Constr. 2005, 9, 337–347. [Google Scholar] [CrossRef]
  18. Wang, Z.; Yang, W.; Gao, Z.; Shao, J.; Li, D. Experimental and Numerical Simulation Study on the Mechanical Properties of Integrated Sleeve Mortise and Tenon Steel-Wood Composite Joints. Buildings 2025, 15, 137. [Google Scholar] [CrossRef]
  19. Wang, T.; Shao, J.; Xu, T.; Wang, Z. Wang Study on axial compression properties of aluminum foam-filled steel tube members after high temperature. Iran. J. Sci. Technol. Trans. Civ. Eng. 2022, 46, 883–900. [Google Scholar] [CrossRef]
  20. Xu, T.; Shao, J.; Zhang, J.; Kaewunruen, S. Experimental performance evaluation of multi-storey steel plate shear walls designed by different methods. Int. J. Civ. Eng. 2019, 17, 1145–1154. [Google Scholar] [CrossRef]
Figure 1. Dimension diagram of the wooden beam and wooden column (unit: mm): (a) three-dimensional view of the wooden beam, (b) front view of the wooden beam, (c) right-side view of the wooden beam, (d) top view of the wooden beam, (e) top view of the wooden column, (f) three-dimensional view of the wooden column, (g) front view of the wooden column, and (h) right-side view of the wooden column.
Buildings 15 02139 g001
Figure 2. Dimension diagram of the steel sleeve at the beam end and column end (unit: mm): (a) three-dimensional view of the sleeve at the beam end, (b) front view of the sleeve at the beam end, (c) right-side view of the sleeve at the beam end, (d) top view of the sleeve at the beam end, (e) three-dimensional view of the sleeve at the column end, (f) front view of the sleeve at the column end, (g) right-side view of the sleeve at the column end, and (h) top view of the sleeve at the column end.
Buildings 15 02139 g002
Figure 3. Processing, installation, and finished product diagrams of the components: (a) wooden beam, (b) wooden column, (c) steel sleeve, (d) installation process, and (e) finished product.
Buildings 15 02139 g003
Figure 4. Loading device and test diagram: (a) three-dimensional diagram of the test device, (b) test diagram of the pure wooden joint, and (c) test diagram of the joint reinforced by the steel sleeve.
Buildings 15 02139 g004
Figure 5. GBD430 static strain instrument.
Buildings 15 02139 g005
Figure 6. YHD-100 displacement sensor.
Buildings 15 02139 g006
Figure 7. Layout diagram of strain gauges at different measuring points: (a) front view and (b) top view.
Buildings 15 02139 g007
Figure 8. Diagram of the displacement loading procedure.
Buildings 15 02139 g008
Figure 9. Schematic diagram of the failure of JG0: (a) extrusion between the tenon and the mortise and (b) tenon at the beam end pulled out.
Buildings 15 02139 g009
Figure 10. Overall diagram of joint JG0: (a) specimen before the test begins and (b) failure after the test ends.
Buildings 15 02139 g010
Figure 11. Phenomena of joint JG1 at the loading displacement of 20 mm: (a) self-tapping screw pulled out and (b) upper part of the beam sleeve bulged and warped.
Buildings 15 02139 g011
Figure 12. Phenomena of joint JG1 at the loading displacement of 40 mm: (a) self-tapping screwed at the lower part of the column sleeve pulled out and (b) upper part of the wooden beam torn.
Buildings 15 02139 g012
Figure 13. Schematic diagram of the failure of joint JG1: (a) beam sleeve bulged and warped, (b) column sleeve bulged and warped, (c) column sleeve inclined, (d) self-tapping screw at the lower part of the column sleeve pulled out, (e) wooden beam torn, (f) lower part of the wooden beam separated from the lower part of the beam sleeve, and (g) overall failure diagram.
Buildings 15 02139 g013
Figure 14. Comparison of the moment–rotation curves for JG0 and JG1.
Buildings 15 02139 g014
Figure 15. Schematic diagram of the mesh division.
Buildings 15 02139 g015
Figure 16. Loading schematic of the analysis model.
Buildings 15 02139 g016
Figure 17. Finite element simulation nephogram of joint JG0 (unit: MPa): (a) diagram of joint displacement (unit: mm), (b) extrusion stress diagram of the mortise, and (c) extrusion stress diagram of the tenon.
Buildings 15 02139 g017
Figure 18. Comparison between the numerical simulation and test results of joint JG0.
Buildings 15 02139 g018
Figure 19. Comparison of deformation of the tenon of joint JG0: (a) extrusion deformation of the upper edge of the tenon in the test, (b) simulated extrusion deformation of the upper edge of the tenon, (c) test diagram of the tenon being pulled out, and (d) simulation of the tenon being pulled out.
Buildings 15 02139 g019
Figure 20. Finite element simulation nephogram of joint JG1 (unit: MPa): (a) joint displacement (unit: mm), (b) stress distribution of the mortise, (c) extrusion stress distribution of the tenon, (d) deformation and stress distribution of the steel sleeve, and (e) deformation and stress distribution of the stiffener.
Buildings 15 02139 g020
Figure 21. Comparison between the numerical simulation and experimental results of joint JG1.
Buildings 15 02139 g021
Figure 22. Comparison of extrusion deformations of joint JG1: (a) extrusion deformation of the wooden beam in the test, (b) simulated extrusion deformation of the wooden beam, (c) extrusion deformation of the upper sleeve at the beam end in the test, and (d) simulated extrusion deformation of the upper sleeve at the beam end.
Buildings 15 02139 g022
Figure 23. Displacement loading procedure.
Buildings 15 02139 g023
Figure 24. Comparison of hysteresis curves for joints reinforced by steel sleeves with different thicknesses.
Buildings 15 02139 g024
Figure 25. Comparison of skeleton curves for joints reinforced by steel sleeves with different thicknesses.
Buildings 15 02139 g025
Figure 26. Stress nephogram of a joint at a thickness of 1 mm (unit: MPa): (a) overall stress nephogram, (b) stress nephogram of the wooden column, (c) stress nephogram of the wooden beam, and (d) stress nephogram of the steel sleeve.
Buildings 15 02139 g026
Figure 27. Stress nephogram of a joint at a thickness of 2 mm (unit: MPa): (a) overall stress nephogram, (b) stress nephogram of the wooden column, (c) stress nephogram of the wooden beam, and (d) stress nephogram of the steel sleeve.
Buildings 15 02139 g027
Figure 28. Stress nephogram of a joint at a thickness of 3 mm (unit: MPa): (a) overall stress nephogram, (b) stress nephogram of the wooden column, (c) stress nephogram of the wooden beam, and (d) stress nephogram of the steel sleeve.
Buildings 15 02139 g028
Figure 29. Stress nephogram of a joint at a thickness of 4 mm (unit: MPa): (a) overall stress nephogram, (b) stress nephogram of the wooden column, (c) stress nephogram of the wooden beam, and (d) stress nephogram of the steel sleeve.
Buildings 15 02139 g029
Figure 30. Stress nephogram of a joint at a thickness of 5 mm (unit: MPa): (a) overall stress nephogram, (b) stress nephogram of the wooden column, (c) stress nephogram of the wooden beam, and (d) stress nephogram of the steel sleeve.
Buildings 15 02139 g030
Figure 31. Stress nephogram of a joint at a thickness of 6 mm (unit: MPa): (a) overall stress nephogram, (b) stress nephogram of the wooden column, (c) stress nephogram of the wooden beam, and (d) stress nephogram of the steel sleeve.
Buildings 15 02139 g031
Table 1. Comparison of the main mechanical properties of the joints.
Specimen NumberInitial Rotational Stiffness/(kN·m/rad)Yield Bending Moment/(kN·m)Ultimate Bending Moment/(kN·m)Increase Ratio of Initial Rotational Stiffness After ReinforcementIncrease Ratio of Yield Bending Moment After ReinforcementIncrease Ratio of Ultimate Bending Moment After Reinforcement
JG025.00.91.2---
JG1124.04.78.8495.4%425.9%627.5%
Table 2. Yield point and yield coefficient in the simulation.
Yield Strength/MPaσ11σ22σ33σ12σ13σ23σ0
251.51.55.25.25.225
Yield Strength CoefficientR11R22R33R12R13R23
10.060.060.120.120.12
Disclaimer/Publisher’s Note: The statements, opinions and data contained in all publications are solely those of the individual author(s) and contributor(s) and not of MDPI and/or the editor(s). MDPI and/or the editor(s) disclaim responsibility for any injury to people or property resulting from any ideas, methods, instructions or products referred to in the content.

