1. Introduction
Pavement thickness is one of the most critical parameters in road construction and maintenance, directly influencing the structural integrity, durability, and long-term performance of pavement systems [
1,
2]. In newly constructed roads, ensuring uniform thickness is essential to meet design specifications, distribute traffic loads effectively, and prevent premature failures such as cracking, rutting, and moisture damage [
3,
4]. Deviations in thickness can lead to localized stress concentrations, accelerating pavement deterioration and increasing maintenance costs [
5].
For asphalt pavements, especially those on steel bridge decks, maintaining proper thickness is even more crucial due to the dynamic loading conditions and the need for a robust bond between the pavement and the underlying steel structure [
6]. Traditional quality control methods rely on coring or manual measurements, which are destructive, time-consuming, and only provide discrete data points [
7,
8]. Consequently, there is a pressing need for non-destructive testing (NDT) techniques that can rapidly and accurately assess pavement thickness across large areas, ensuring compliance with engineering standards [
9].
Steel bridge decks are widely used in long-span bridges due to their high strength-to-weight ratio and structural efficiency [
10]. However, the direct application of conventional asphalt mixtures on steel decks is prone to distresses such as fatigue cracking, delamination, and poor adhesion under heavy traffic and environmental fluctuations [
11]. To address these issues, epoxy asphalt (EA) pavements have been increasingly adopted due to their superior mechanical properties, including high strength, flexibility, and resistance to deformation.
Despite these advantages, constructing epoxy asphalt pavements on steel bridge decks presents unique challenges in assessing and controlling the uniformity of the full cross-sectional thickness, due to the surface irregularity of the steel deck and the limitations of traditional inspection methods [
12,
13]. Core sampling involves point-by-point detection, which may not provide a representative assessment of the entire pavement layer. This method is also time-consuming and labor-intensive, leading to disruptions in traffic and increased costs associated with repair and restoration after sampling [
7]. The paving process must account for the steel deck’s flexibility, thermal expansion, and the need for a precise bond between layers [
14]. Variations in thickness can lead to uneven stress distribution, compromising the pavement’s performance and the bridge’s overall safety [
15]. Moreover, traditional thickness measurement methods are impractical for steel bridge decks, as they may damage the waterproofing layer or weaken the steel structure.
Given these constraints, there is a critical need for advanced NDT methods that can evaluate pavement thickness efficiently and non-invasively [
16,
17]. Such techniques would enhance construction quality control, reduce inspection time, and improve the long-term performance of steel bridge deck pavements.
Ground-penetrating radar (GPR) has emerged as a powerful NDT tool for pavement thickness assessment due to its ability to rapidly scan large areas with high resolution [
18]. Unlike traditional methods, GPR uses electromagnetic waves to detect layer interfaces based on dielectric property contrasts, providing continuous thickness profiles without damaging the pavement structure [
19]. Recent advancements in GPR technology, particularly three-dimensional (3D) GPR systems [
20], have significantly improved the accuracy and reliability of thickness measurements [
21]. Unlike 2D-GPR, which provides single-line profiles, 3D-GPR captures volumetric data, enabling a comprehensive evaluation of pavement thickness distribution [
22]. By employing high-frequency antennas and advanced signal processing algorithms, 3D-GPR can detect subtle variations in layer thickness, even in complex multi-layered systems such as epoxy asphalt pavements on steel bridge decks. While GPR is a valuable tool for analyzing pavement layers, it has several limitations when compared to the more commonly adopted coring method. Most notably, GPR is an expensive technology, not widely accessible to all research institutions. It also requires precise calibration and frequent maintenance, and can involve long hours of data post-processing [
20].
However, applying 3D-GPR to steel bridge decks introduces additional complexities [
23]. The presence of steel reinforcement and electromagnetic interference from the deck structure can affect wave propagation, requiring specialized data processing techniques to extract accurate thickness information [
24,
25]. Furthermore, the dielectric properties of epoxy asphalt differ from those of conventional asphalt, necessitating calibration and validation to ensure measurement precision [
26,
27].
Ensuring thickness uniformity is a key factor in pavement quality control, as localized deviations can lead to premature failures and increased lifecycle costs [
28]. Traditional uniformity assessments rely on statistical analysis of discrete core samples, which may not capture critical variations across the pavement surface [
29]. With the advent of high-resolution 3D-GPR, it is now possible to evaluate thickness uniformity at a much finer scale [
30]. By analyzing spatial distribution maps generated from GPR data, engineers can identify areas with insufficient or excessive thickness, allowing for timely corrective measures during construction [
31]. Statistical metrics such as mean thickness, standard deviation, and coefficient of variation can be used to quantify uniformity, providing objective criteria for quality acceptance [
32]. For epoxy asphalt pavements on steel bridge decks, uniformity assessment is particularly important due to the material’s sensitivity to application conditions [
33]. Variations in thickness can affect the curing process, leading to inconsistent mechanical properties [
34]. Therefore, integrating 3D-GPR-based uniformity evaluation into construction quality control can enhance the performance and longevity of these specialized pavements.
The necessity of this research arises from the need to develop and validate effective methods for detecting and evaluating the thickness uniformity of epoxy asphalt pavements on steel bridge decks. Given the unique challenges and significance of these pavements, there is a critical need for advanced non-destructive testing technologies that can provide accurate and reliable thickness measurements. This research aims to address the limitations of traditional thickness detection methods by leveraging the capabilities of 3D-GPR. By reconfiguring the antenna array spacing and employing the common midpoint (CMP) method, this study seeks to enhance the accuracy and resolution of thickness measurements, providing valuable data for quality control and construction optimization, as shown in
Figure 1.
2. Epoxy Asphalt Pavement Materials Used in Pavement
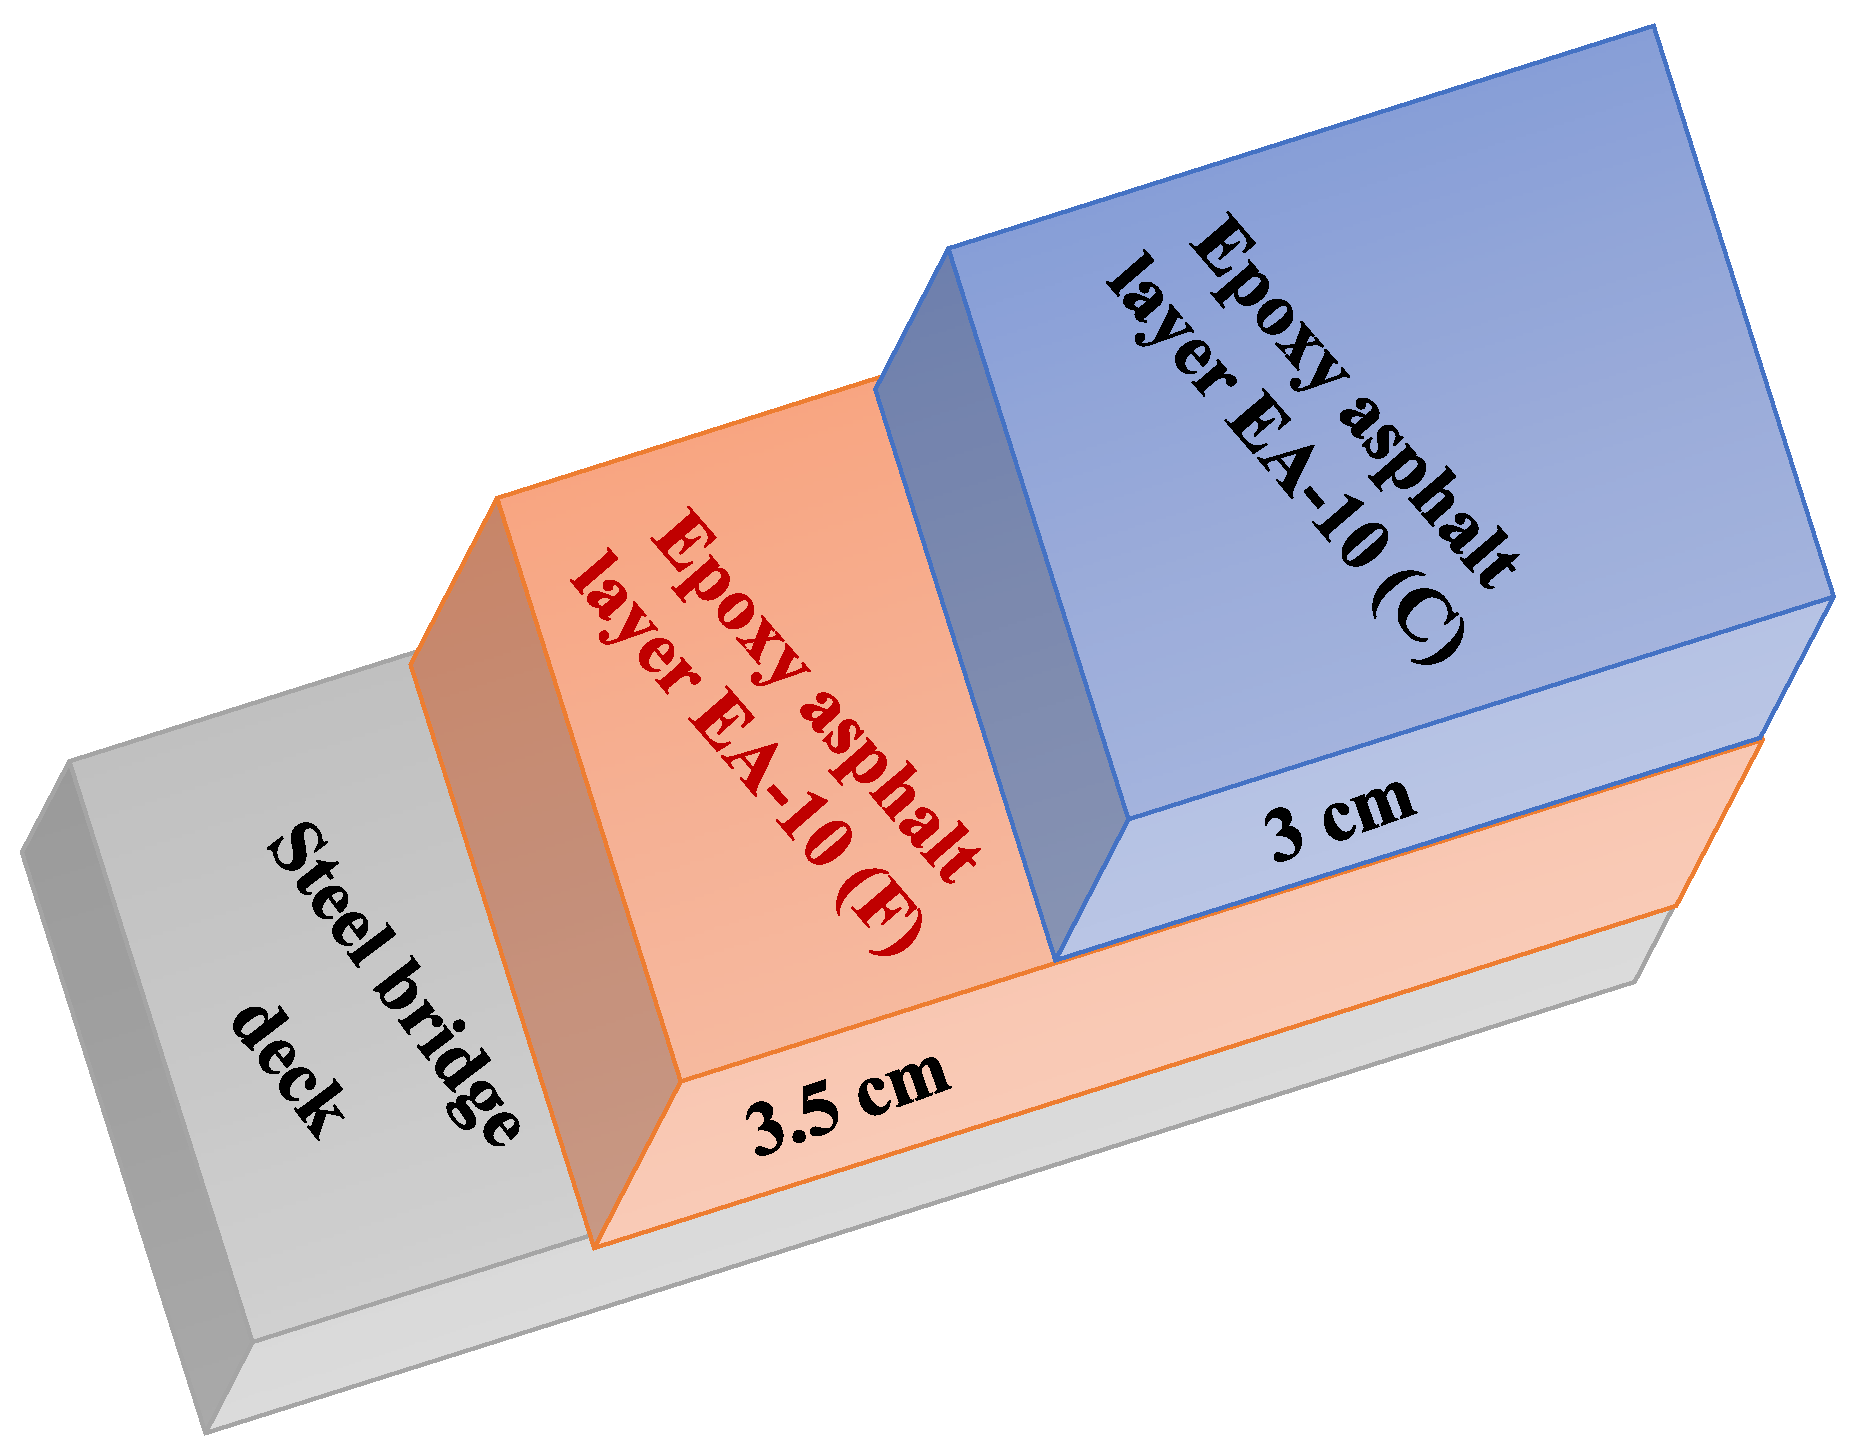
The steel bridge deck pavement is divided into two structural layers: the upper and lower layers, as shown in
Figure 2. The mixture type for the lower pavement structure is epoxy asphalt mixture EA-10 (F), with a designed thickness of 3.5 cm, while the upper layer uses epoxy asphalt mixture EA-10 (C), with a designed thickness of 3 cm. This study primarily focuses on the analysis of the uniformity of the full cross-section thickness construction quality of the lower pavement layer.
The epoxy resin used is KD-BEP, produced by the Modernization Chemical Company, which includes the base resin and hardener. The technical specifications of the KD-BEP epoxy resin after curing and hardening are shown in
Table 1. The weight ratio of base resin to hardener is 56/44. The tensile strength is 4.81 MPa and the elongation at break is 106%. All the testing indicators meet the required standards.
The asphalt used is A-70# base asphalt, provided by Guangzhou Xinyue Asphalt Co., Ltd., Zhenjiang, China. The technical properties of A-70# base asphalt are presented in
Table 2. The penetration value is 65 cm, the softening point is 49.2 °C, and the ductility is greater than 100 cm. Other test indicators also comply with the specified requirements.
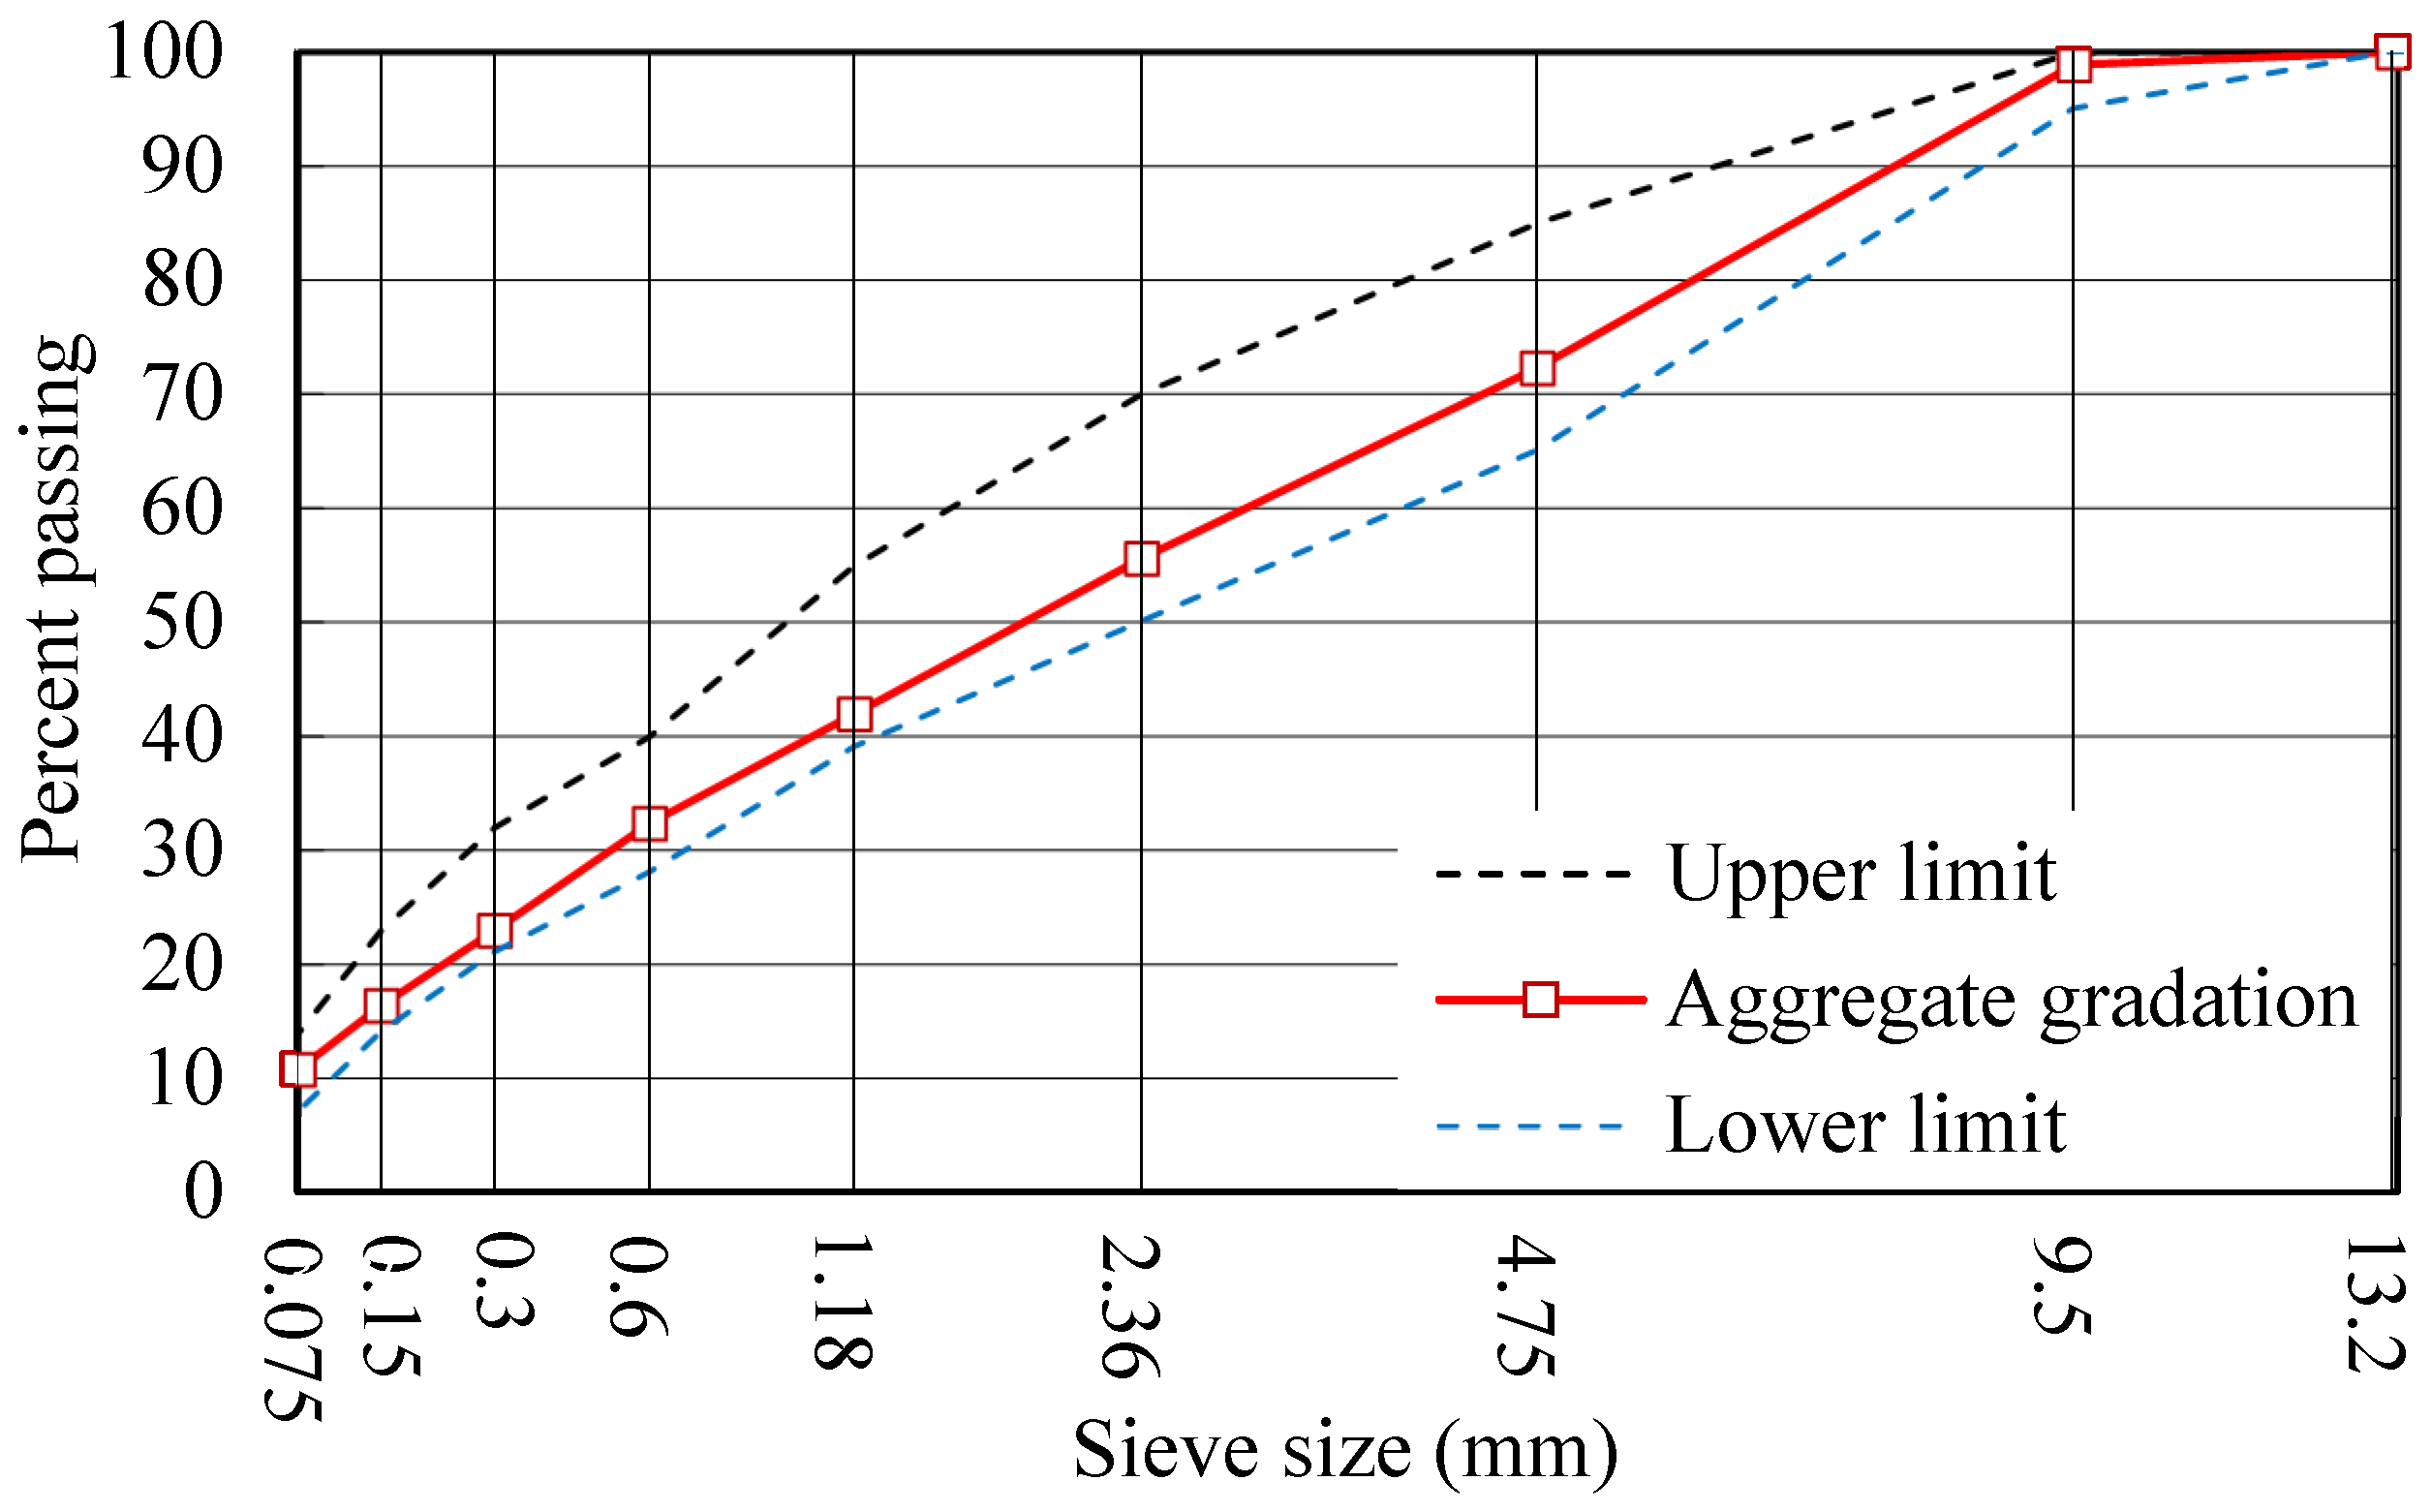
The aggregates used in the mixture are basalt aggregates, with particle sizes of 5–10 mm, 3–5 mm, and 0–3 mm, supplied by Zhongshan Aggregate Processing Plant. The mineral powder is sourced from the LuoDing Jinji Town. The particle size distribution (
Figure 3) reveals that 55.6% by mass of the aggregate passes through the 2.36 mm standard sieve. The sieve pass rates for all sizes fall within the required upper and lower limits, and the gradation meets construction specifications.
The mix ratio for the lower pavement layer EA-10 (F) is as follows: 5–10 mm: 3–5 mm: 0–3 mm: mineral powder = 28:13:51:8, with an oil–stone ratio of 6.3%. Marshall specimens of the epoxy asphalt mixture prepared according to this mix ratio were tested, with the results presented in
Table 3. The bulk specific gravity and theoretical maximum specific gravity of the specimens are 2.597 and 2.631, respectively, and the air void is 1.3%, meeting the requirement of no more than 3%. The stability and flow values of the Marshall specimens, both before and after curing, meet the requirements. Other performance indicators, such as dynamic stability, freeze–thaw splitting strength ratio, flexural ultimate strain, and impact toughness, all show excellent performance.
These results indicate that the mix ratio of EA-10 (F) components is reasonable and the mixture can be applied to the steel bridge deck epoxy asphalt pavement layer. The components of the mixture play critical roles in achieving the desired performance characteristics. The epoxy resin provides excellent adhesion and resistance to wear, while the asphalt binder ensures proper cohesion and durability. The aggregates contribute to the overall strength and stability of the pavement, with the mineral powder improving the mixture’s density and enhancing the binder’s workability. The selected mix ratio ensures a well-balanced pavement material with optimal mechanical properties for the demanding conditions of steel bridge decks.
3. Detection Principle of 3D-GPR
3.1. 3D-GPR Equipment
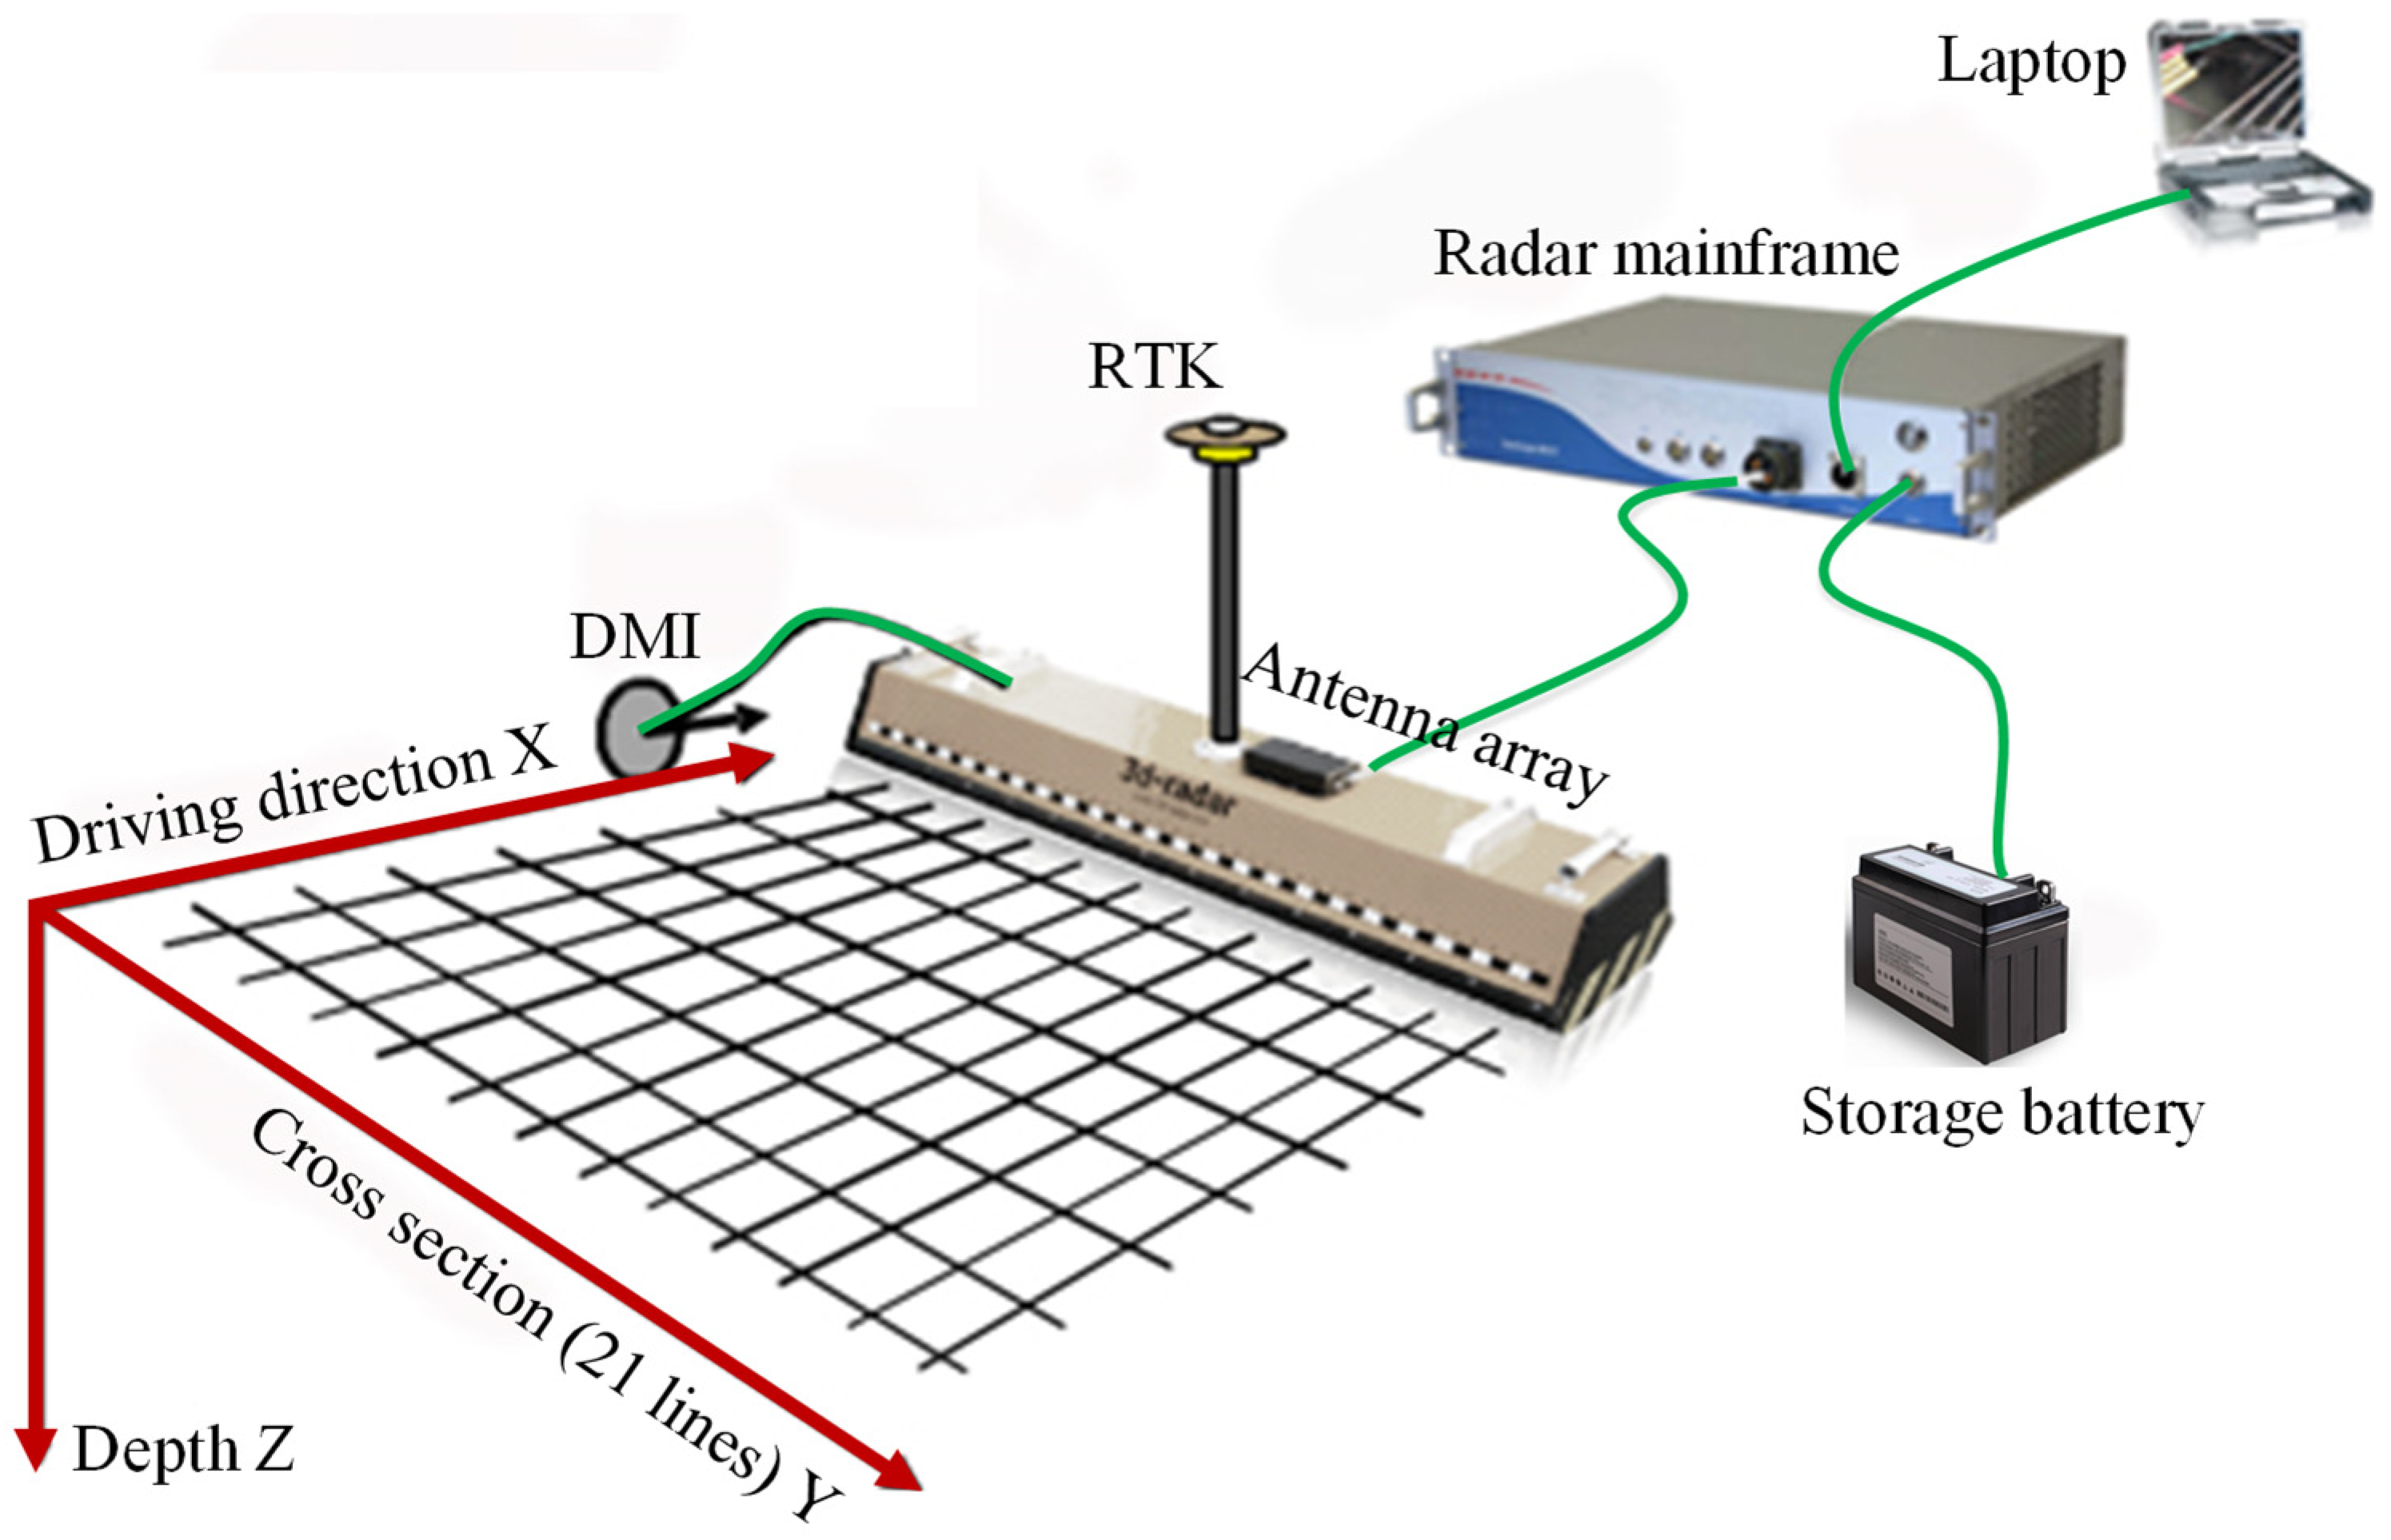
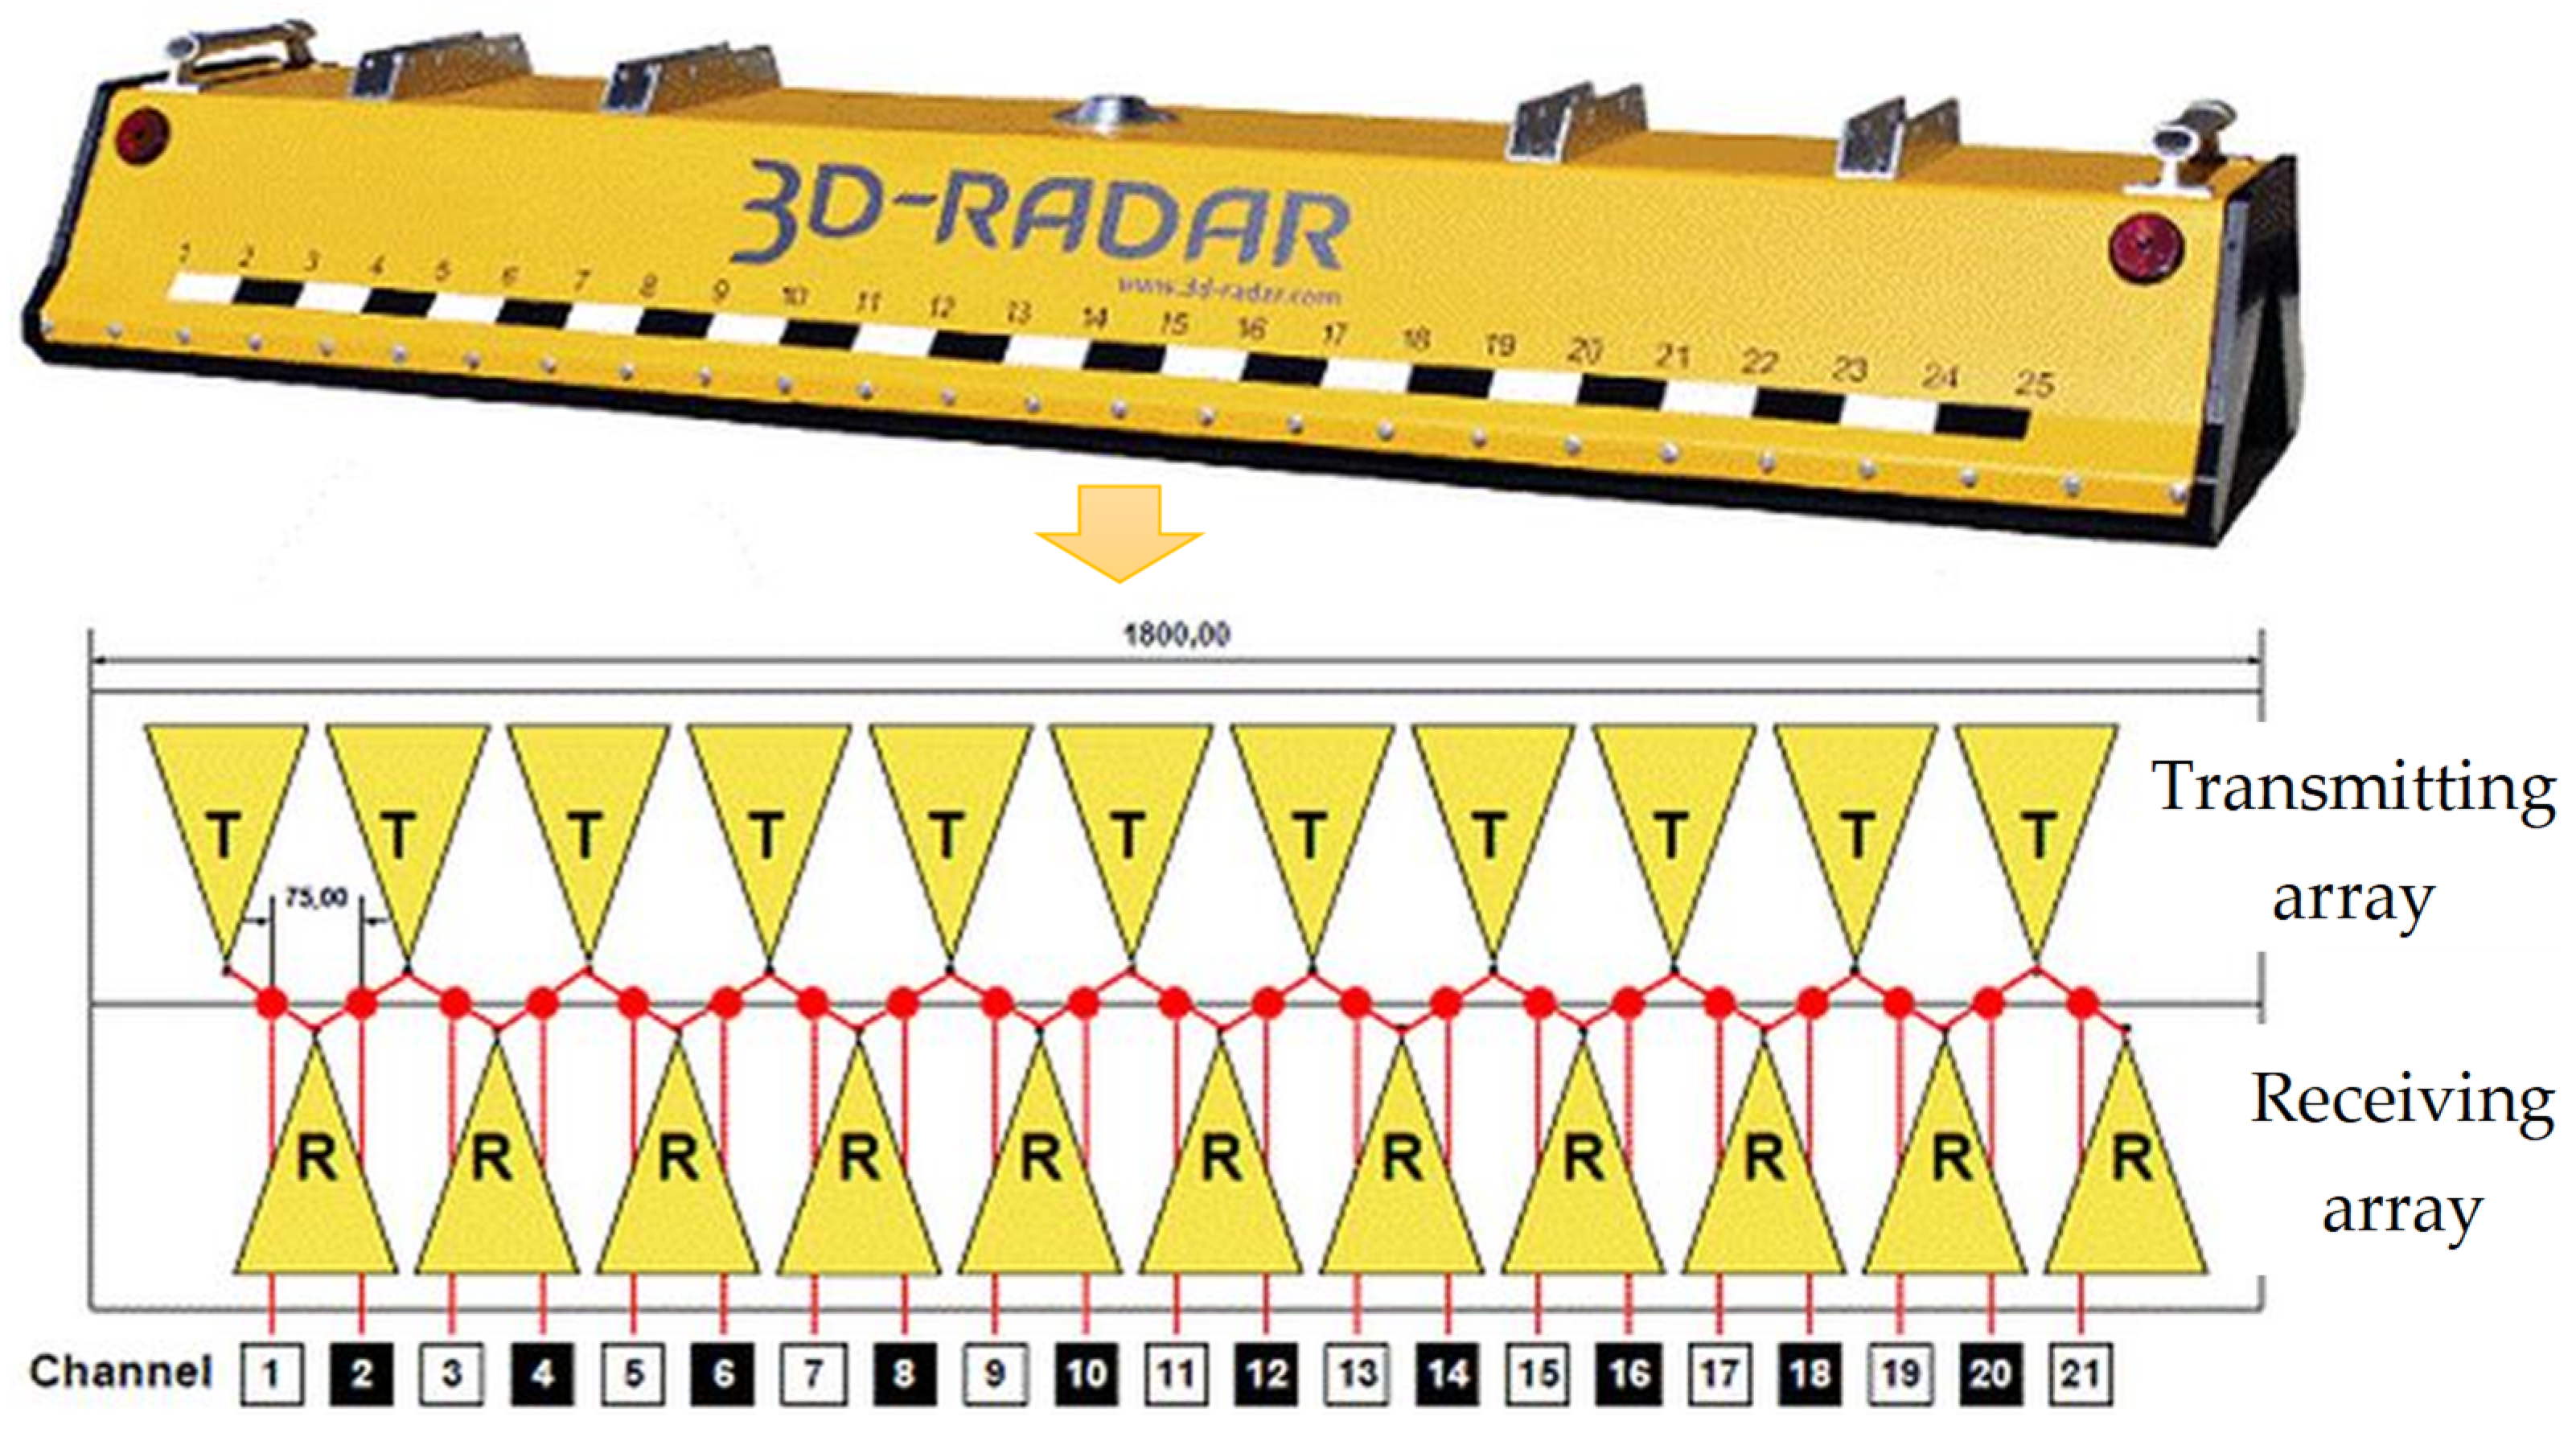
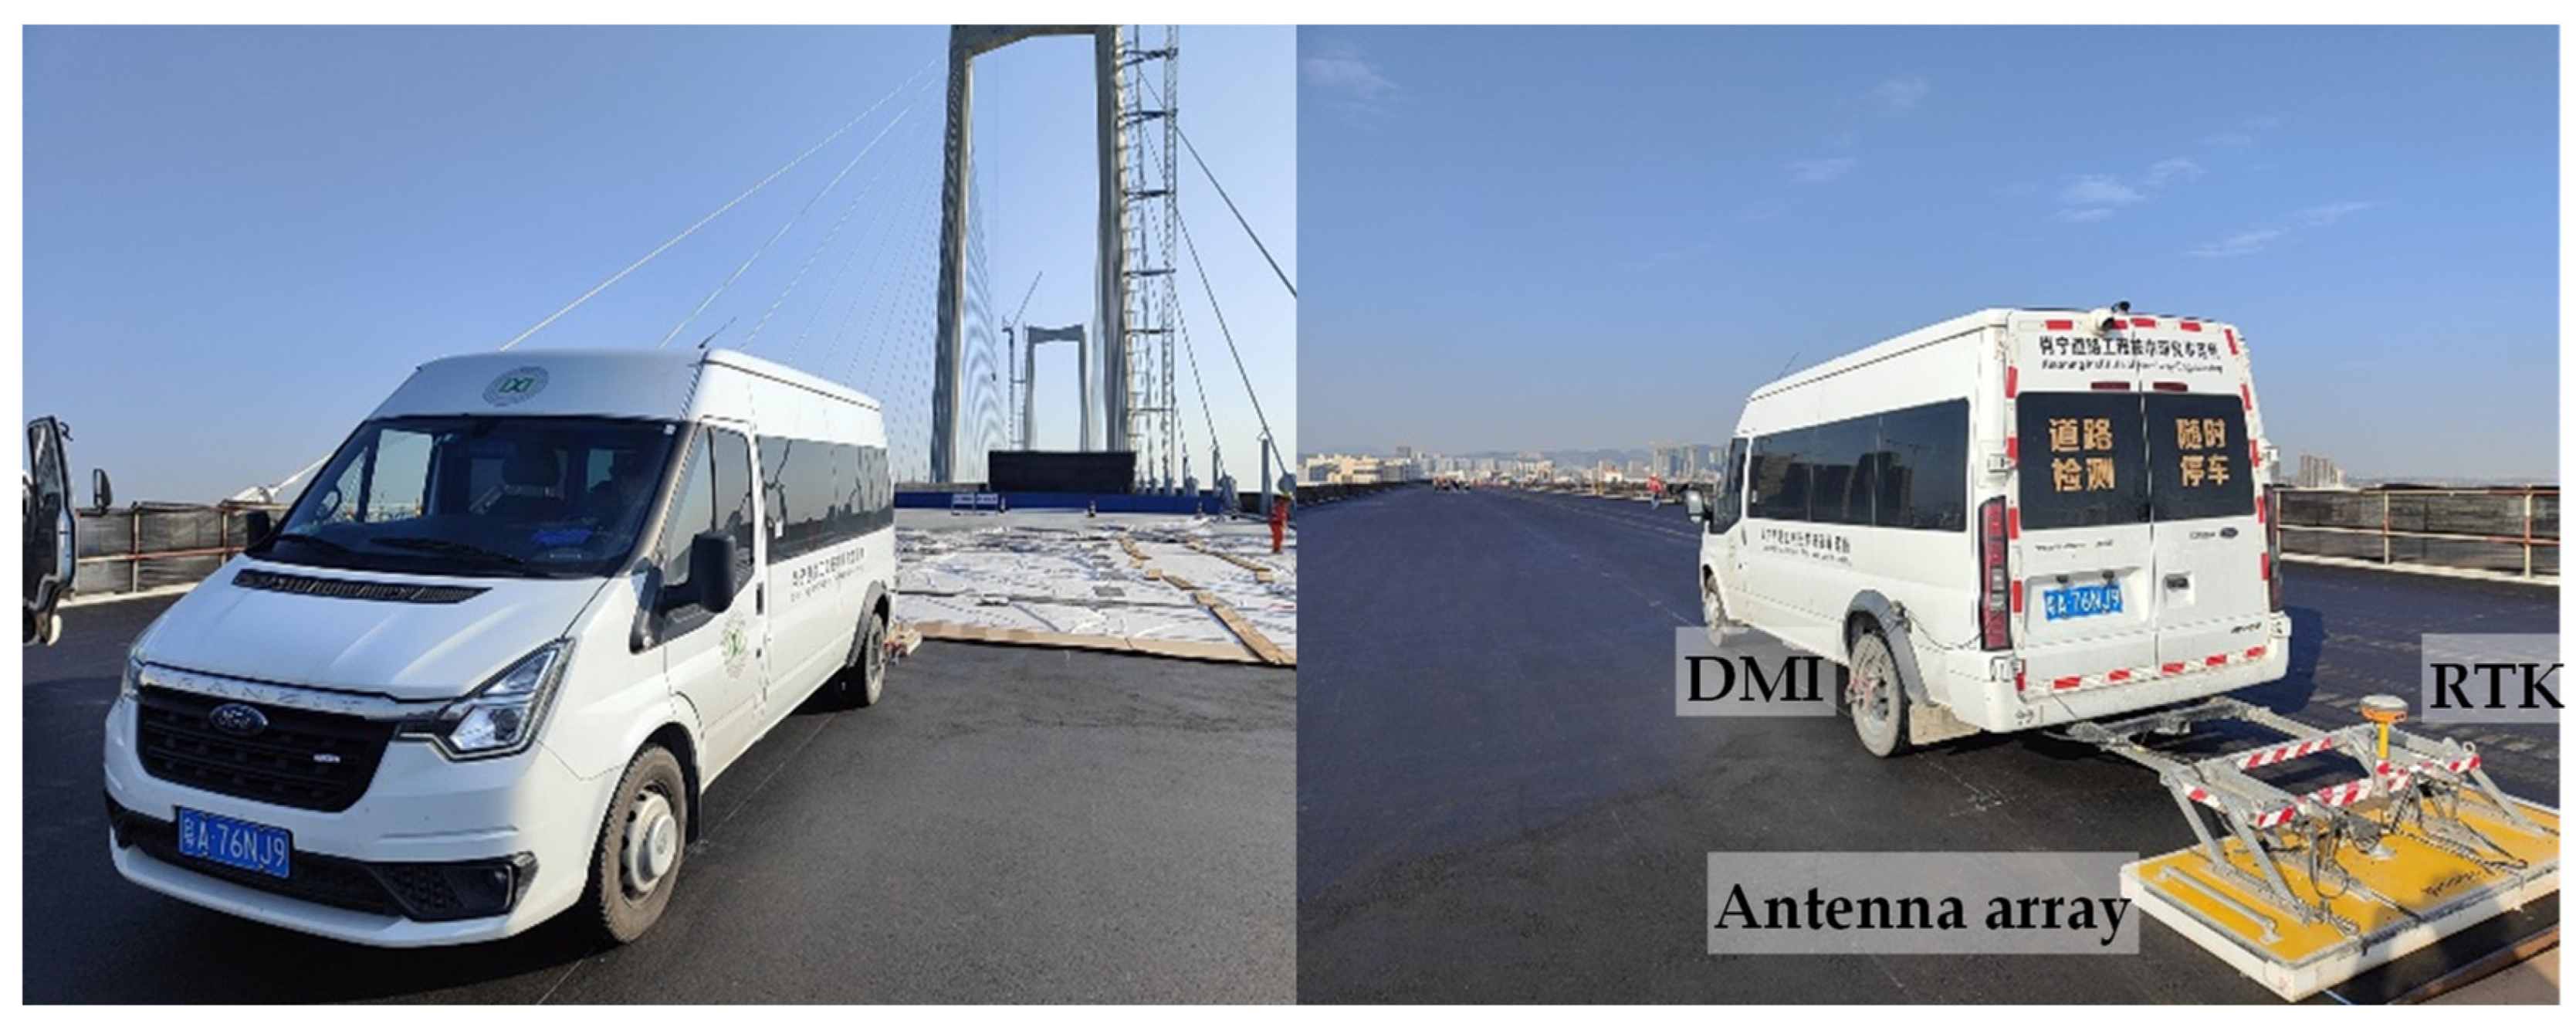
The 3D-GPR system consists of several key components, each playing a crucial role in data acquisition and analysis. The primary equipment includes the Geoscope™ MKIV Radar Main Unit, the DXG Series Multi-Channel Ground Coupled Antenna Array, the Real-Time Kinematic (RTK) Positioning System, the Distance Measurement Instrument (DMI) device, and the associated Data Acquisition and Post-Processing Software suite (version 2.92), as shown in
Figure 4.
The Geoscope™ MKIV Radar Main Unit is the core of the system, responsible for transmitting and receiving high-frequency electromagnetic signals. The Geoscope™ MKIV offers advanced signal processing capabilities, which enhance the detection of subsurface features with high resolution. Its compact and robust design ensures reliable performance in a variety of field conditions. The DXG Series Multi-Channel Ground Coupled Antenna Array is an essential part of the 3D-GPR system, designed to emit electromagnetic waves into the pavement and record the signals reflected from subsurface structures. The multi-channel configuration allows for simultaneous data collection from multiple points, significantly increasing the system’s efficiency and the resolution of the data. This antenna array ensures optimal coupling with the ground, enabling detailed imaging of different subsurface layers.
The RTK system provides high-accuracy positioning data, critical for georeferencing the collected GPR data. By integrating the positioning information with the GPR readings, it ensures precise mapping of subsurface structures in relation to surface features. This real-time positioning is vital for large-scale surveys and ensures high accuracy in location-based evaluations. The DMI device is designed to provide precise distance measurements during GPR surveys. It triggers data acquisition based on a predefined distance, ensuring that the system captures data at specific intervals along the survey path. This feature is particularly useful for systematic data collection in large-scale surveys, improving the accuracy of spatial positioning and enhancing data consistency across the entire inspection area.
The Data Acquisition and Post-Processing Software suite (version 2.92) that accompanies the GPR system is responsible for managing data collection, processing, and visualization. The acquisition software facilitates the seamless recording of radar data, while the post-processing software enables the detailed analysis of pavement subsurface features. Through advanced filtering, time-depth conversion, and visualization techniques, the software helps in interpreting the GPR data, providing clear insights into the structure and condition of the pavement layers being studied.
Together, these components form a powerful tool for pavement subsurface inspection, offering precise, real-time imaging and analysis capabilities. This system is particularly useful in applications such as evaluating the uniformity and quality of construction layers, detecting anomalies, and mapping subsurface structures in a wide range of fields, including civil engineering, environmental studies, and infrastructure monitoring. It is applicable to asphalt pavement, concrete pavement, and epoxy asphalt pavement. However, materials such as steel fibers or geogrid may influence GPR detection, causing unclear interfaces in the subsurface layers.
3.2. Pavement Layer Thickness Prediction
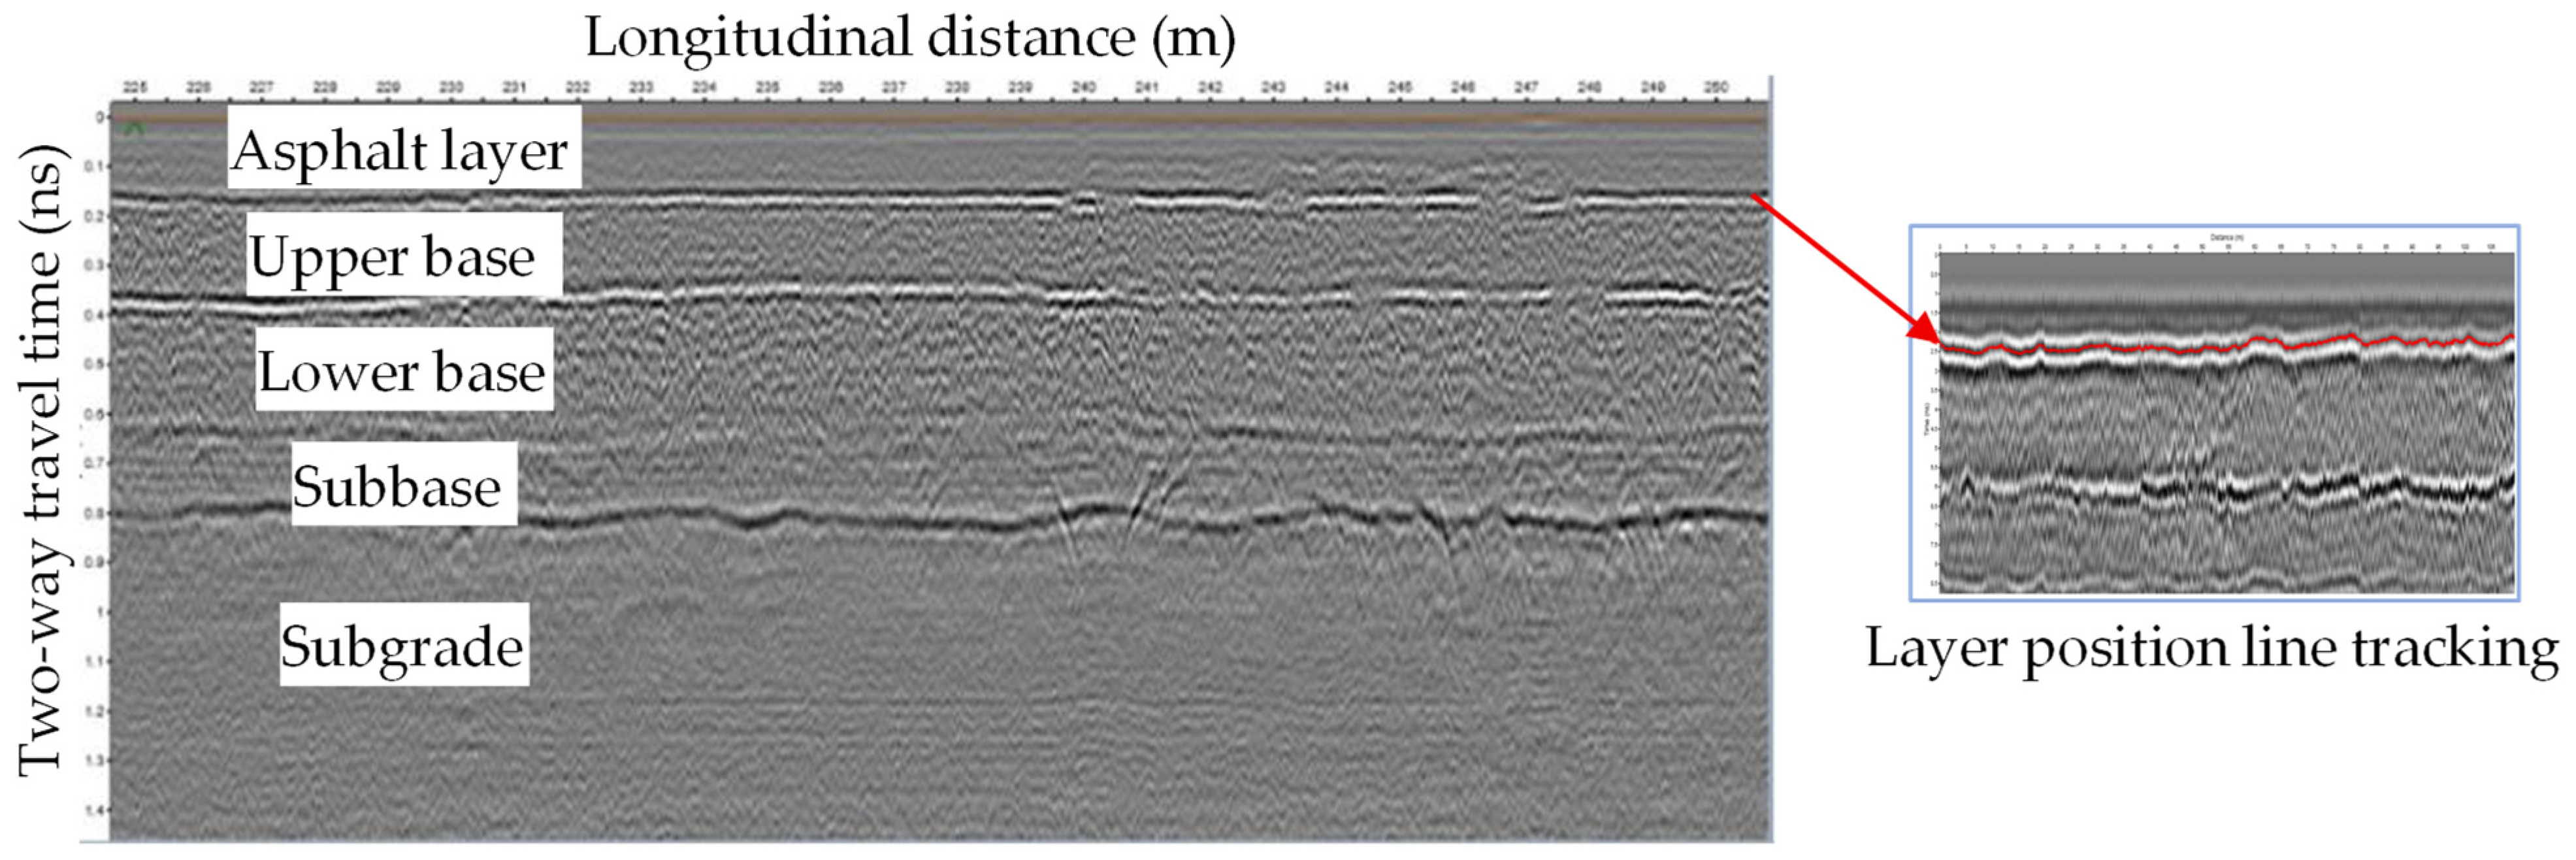
The fundamental principle of employing 3D-GPR for pavement layer detection involves transmitting high-frequency electromagnetic waves into the subsurface medium and analyzing the reflected signals to characterize the spatial distribution of stratified structures [
36,
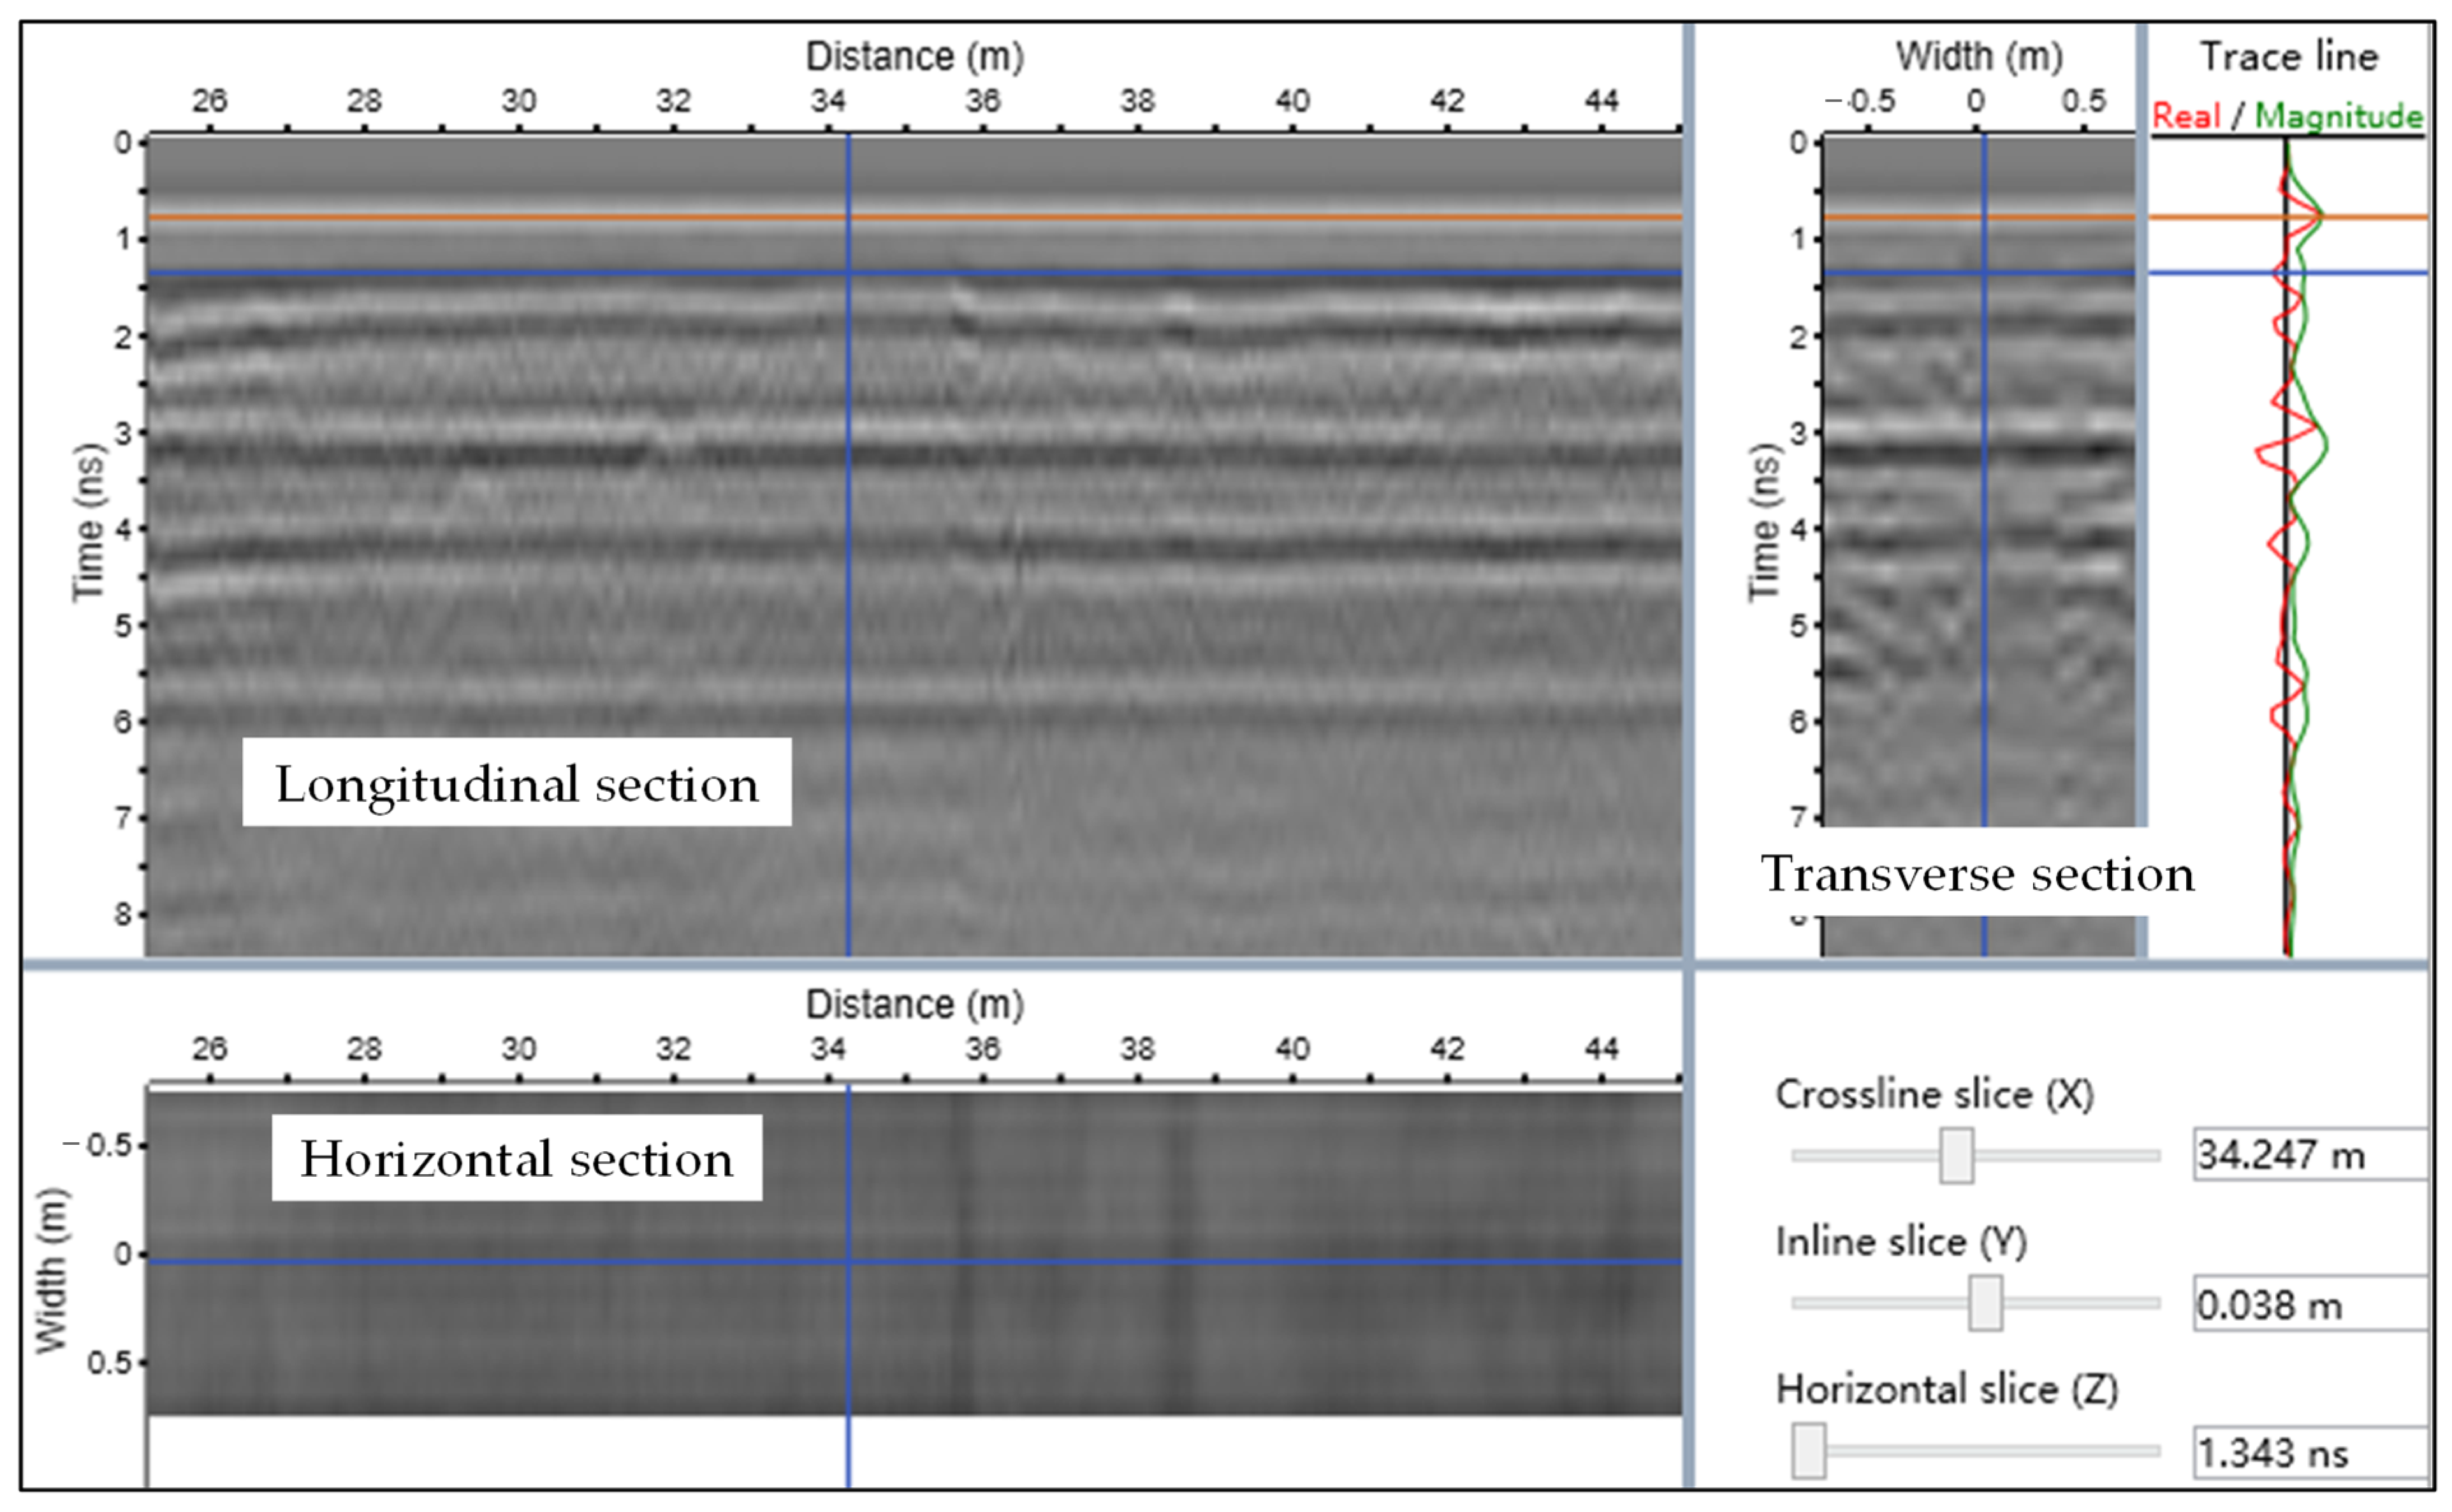
37]. These pulses, emitted by the radar system, propagate through the pavement layers and are reflected back when they encounter interfaces between different structural layers. The reflected waves create continuous, coherent amplitude waveforms, which form a clear, strong-phase axis in the collected data. This process results in a longitudinal distance vs. two-way travel time amplitude grayscale image, as depicted in
Figure 5.
The 3D-GPR system collects extensive subsurface data, generating a high-resolution image of the pavement’s internal structure. The reflected electromagnetic waves provide information on the location and characteristics of the interfaces between various pavement layers, such as the surface layer, binder courses, and the base layers beneath the pavement. By analyzing the amplitude and travel time of the reflected waves, it is possible to create a detailed, continuous profile of the pavement structure.
Subsequently, based on the relationship defined by Equations (1) and (2), the thickness of the pavement layers, particularly the surface layer, can be accurately calculated. This calculation relies on the known velocity of the electromagnetic waves in the pavement material, allowing for precise measurement of the layer thickness. The integration of 3D GPR data offers a comprehensive view of the subsurface conditions, facilitating accurate assessments of pavement quality and uniformity for maintenance and engineering purposes.
where
v and
c denote the propagation velocities of electromagnetic waves in the pavement structural layer material and in vacuum, respectively.
denotes the relative permittivity of the pavement structural layer material,
h represents the thickness of the pavement structural layer, and
refers to the propagation time of the electromagnetic wave in the structural layer material, which is the two-way travel time.
3.3. Algorithm of the Common Midpoint Method
From the GPR images of the pavement structural layers, the two-way travel time of the electromagnetic waves can be determined. However, without knowing the dielectric constant of the structural layer material—essentially, the propagation speed of the electromagnetic waves in the material—it is impossible to directly calculate the thickness of the structural layer. Therefore, it becomes necessary to apply the midpoint method, discussed in this section, to determine the dielectric properties of the pavement structural layer materials. This method allows for the estimation of the dielectric constant, which is crucial for accurately calculating the thickness of the layers based on the two-way travel time data.
The dielectric constant, also known as the relative permittivity, reflects the polarization characteristics of a medium in response to an applied electric field. It is a key property of materials that determines how they interact with electromagnetic waves. For pavement materials, the dielectric constant serves as an indicator of the material’s compactness and porosity. Specifically, a higher dielectric constant of the pavement surface layer material indicates a lower porosity, implying a denser structure. Conversely, materials with lower dielectric constants tend to have higher porosities. The dielectric constant is a fundamental factor in determining the speed at which electromagnetic waves propagate through a material. As the dielectric constant increases, the propagation speed of electromagnetic waves decreases, since the material becomes more effective at slowing down the waves.
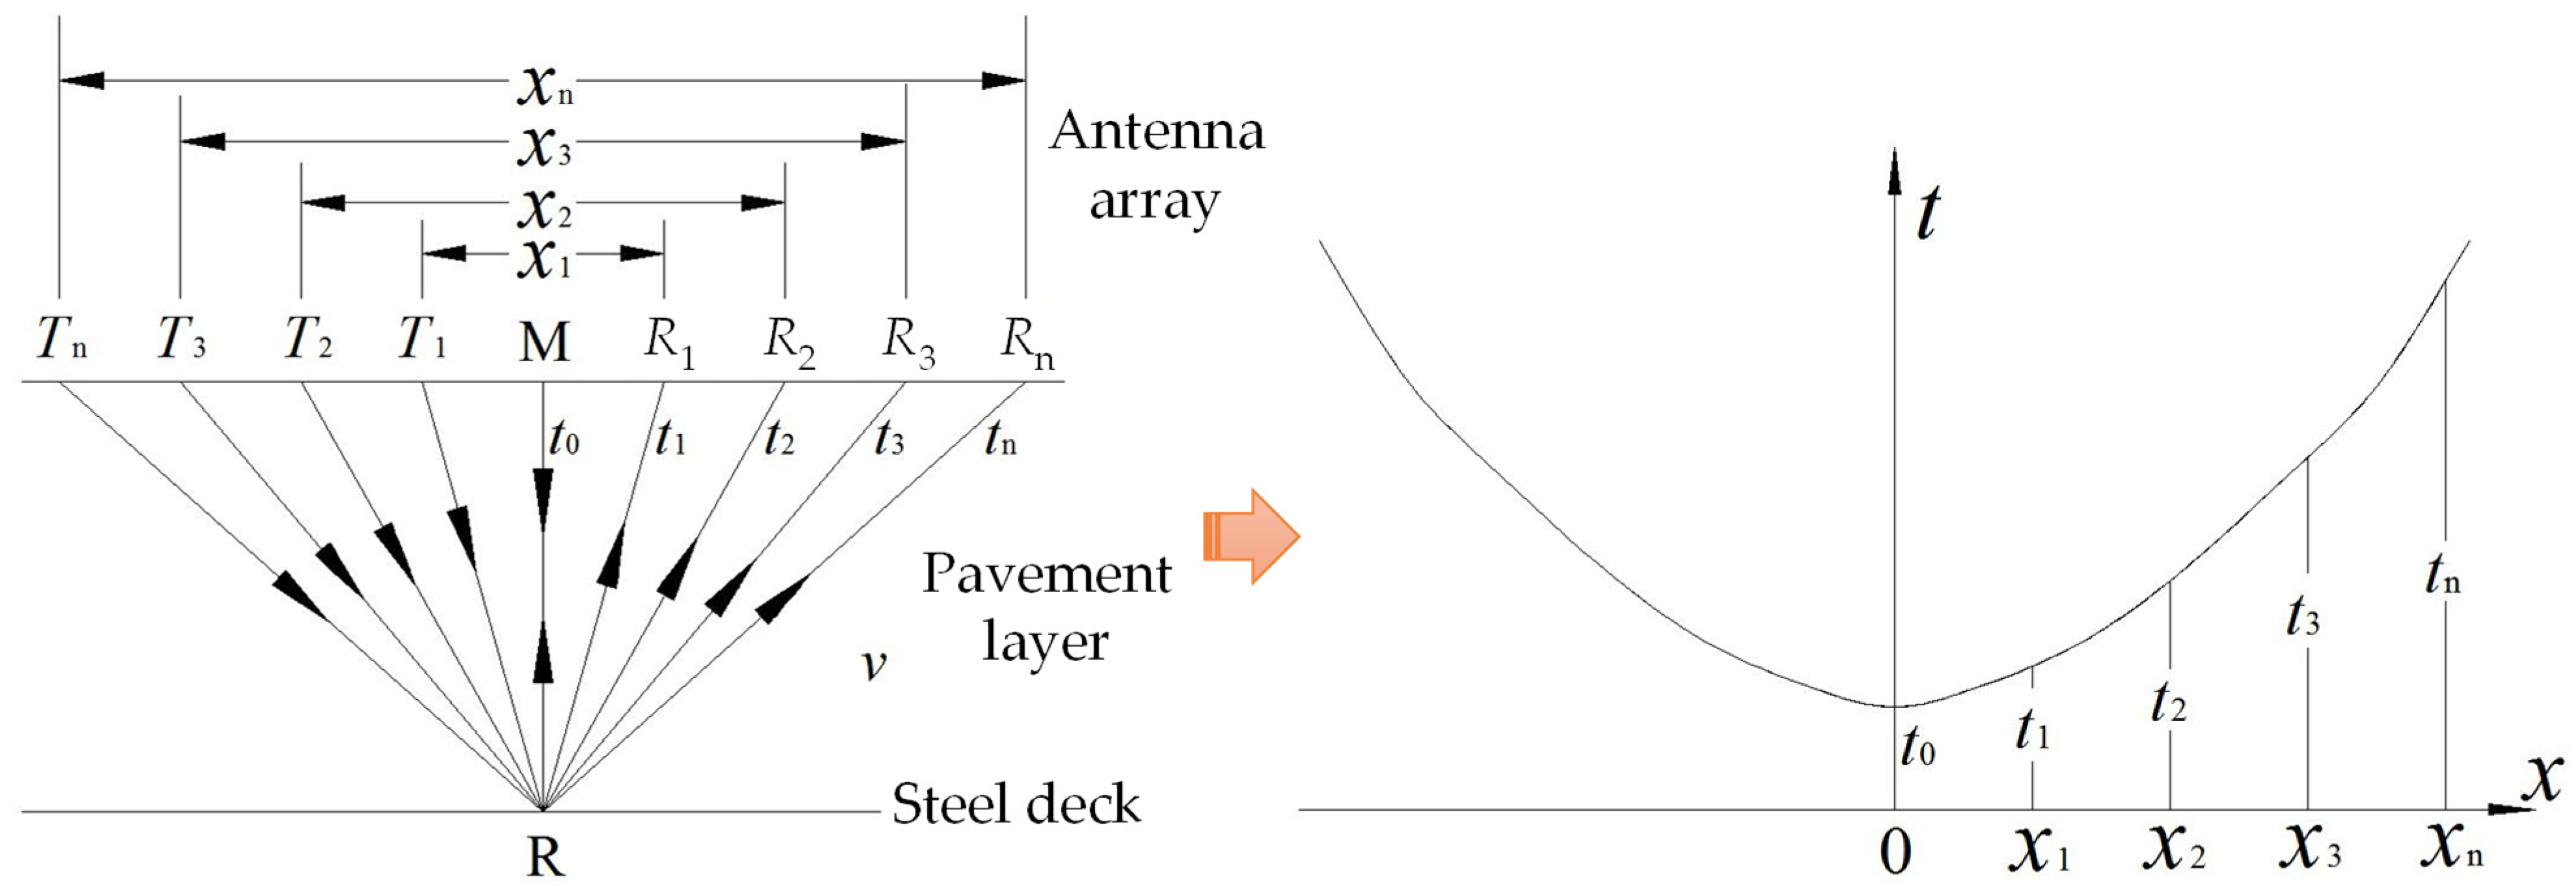
The CMP method is a widely used technique for determining the dielectric constant of pavement structural layer materials. This method involves adjusting the horizontal distance between the transmitting and receiving antennas, denoted as xi, and comparing the total propagation time ti of the reflected wave from the bottom of the pavement structural layer at various antenna spacings. By analyzing the variations in the total travel time with respect to the antenna distance, the dielectric constant of the structural layer material can be calculated.
The principle of the common midpoint method is based on the relationship between the antenna separation and the time it takes for the electromagnetic waves to travel through the pavement material. As the antenna distance changes, the time it takes for the reflected waves to return from the base of the pavement layer also changes. This time difference is influenced by the dielectric properties of the material and electromagnetic wave propagation path. This method allows for the back-calculation of the relative permittivity values of the epoxy asphalt pavement layer without the need for core sampling, thus preventing damage to the pavement and enabling rapid, non-destructive assessment of steel bridge deck epoxy asphalt layers.
Figure 6 and
Figure 7 demonstrate the standard common midpoint method procedure, which determines the pavement material’s dielectric constant by analyzing travel time variations of electromagnetic waves and utilizing the established relationship between dielectric properties and wave propagation velocity. The mathematical relationship governing this process is represented in Equation (3). This method is crucial for obtaining accurate dielectric properties of the pavement structural layers, which in turn enable precise calculations of layer thickness and material characteristics for further analysis.
where
xi denotes the horizontal offset between the
i-th transmitter–receiver antenna pair and
ti represents the two-way electromagnetic wave propagation time through the pavement layer for the corresponding antenna pair.
5. Uniformity Evaluation of Epoxy Asphalt Pavement Layer
5.1. Dielectric Property of Epoxy Asphalt Pavement Layer
Based on the kilometer post (
x) of the measurement points on the epoxy asphalt pavement, the distance (
y) from the central median, and the relative permittivity (
), a data matrix (
x,
y,
) was constructed to record the position and relative permittivity of the measurement points. The grid size of the data matrix was 7.5 × 6.83 cm. The mapping relationship between the relative permittivity values of the epoxy asphalt pavement and the image gray values was established, as shown in
Table 5.
Since the permittivity of the epoxy asphalt mixture generally ranged between 3 and 7, a linear interpolation of gray values was used for relative permittivity values within this range. Specifically, as the permittivity increases, the corresponding gray value decreases. This relationship allows for the precise representation of permittivity variations in the pavement material through differences in image gray values.
In this context, the relative permittivity range of 3 to 7 is critical for interpreting the material characteristics, with higher permittivity values corresponding to lower gray values in the images. This method of linear interpolation provides a clear and quantifiable means of visualizing the distribution of permittivity across the epoxy asphalt pavement, facilitating more accurate assessments and analyses in pavement material studies.
The epoxy asphalt mixture can be broadly divided into four components based on its composition: binder (asphalt and epoxy resin), aggregate, and air, with these components mixed in specific proportions. The relative permittivity of the epoxy asphalt mixture typically ranges between 3 and 7, while the relative permittivity of air is 1. In contrast, the relative permittivity of other components is significantly higher than that of air. Consequently, as the void ratio of the epoxy asphalt mixture increases, its relative permittivity decreases. The void ratio and the relative permittivity of the epoxy asphalt mixture exhibit a strong exponential relationship, with a correlation coefficient reaching 0.915. By analyzing the relative permittivity of the epoxy asphalt mixture, it is possible to identify regions at risk of segregation. Specifically, areas where the relative permittivity is less than 4 indicate a higher proportion of air and a greater void ratio, suggesting a risk of coarse segregation and an increased likelihood of water damage in those regions.
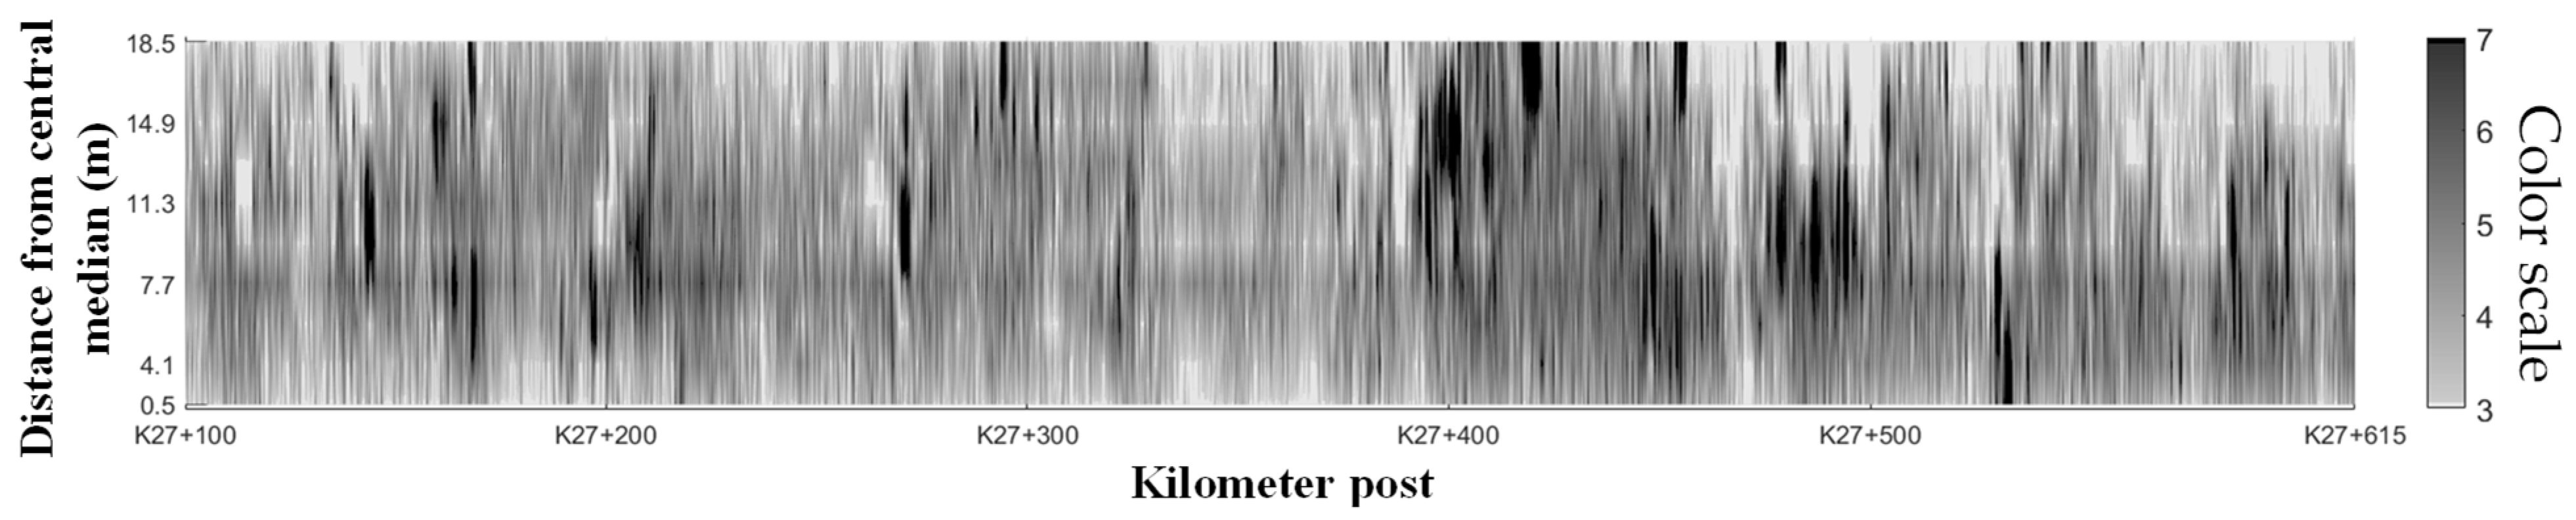
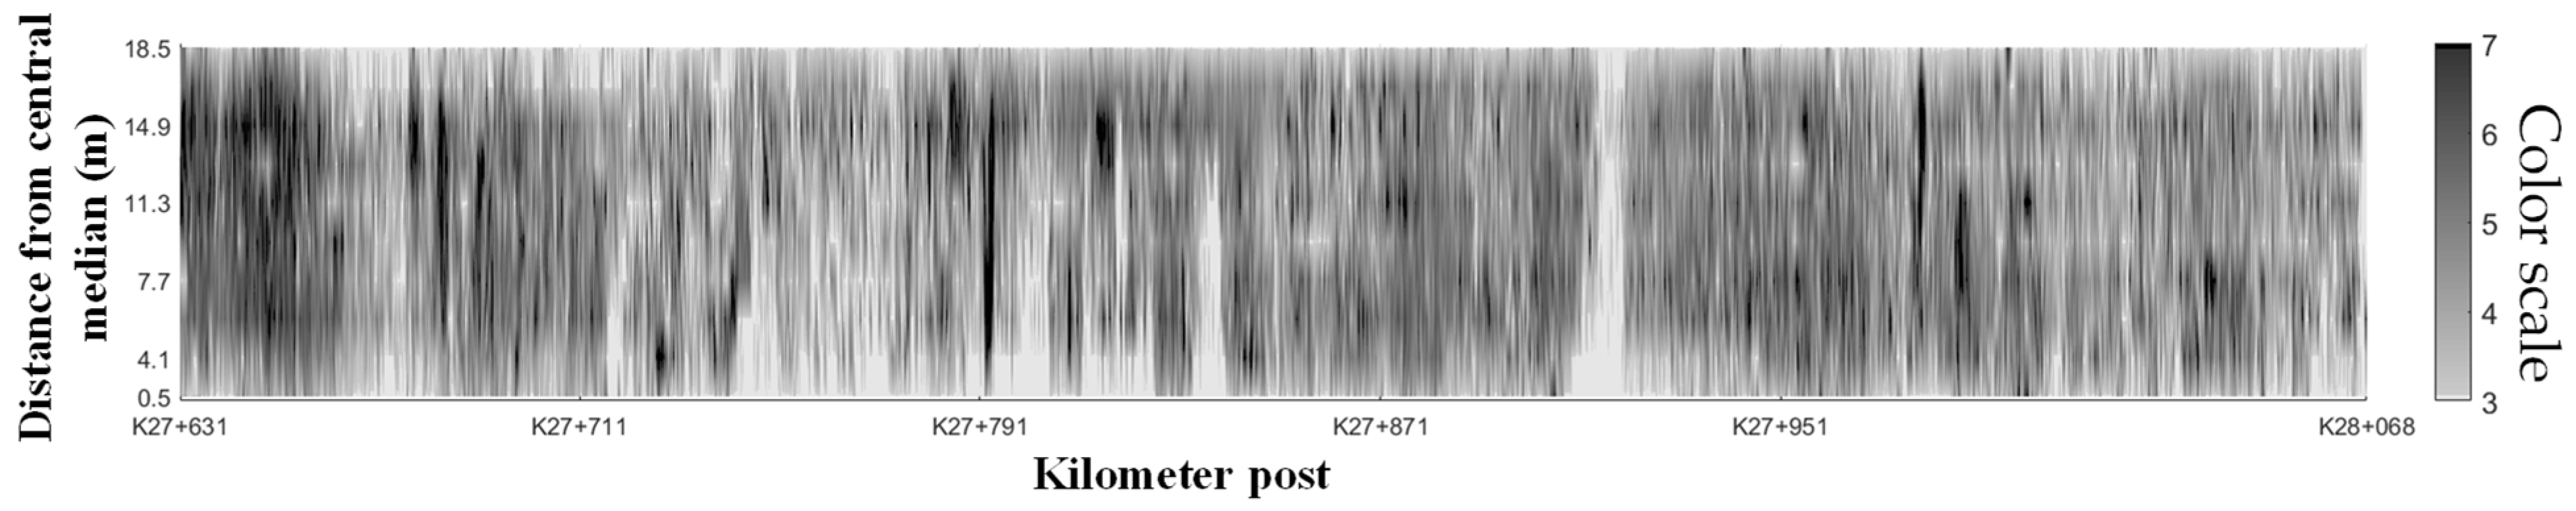
The study areas were selected based on the availability of two adjacent segments of the epoxy asphalt pavement layer on the same steel bridge deck, specifically from K27 + 100 to K27 + 615 and from K27 + 631 to K28 + 068. The main criterion for selecting these areas was to compare the thickness uniformity of two segments that were constructed at different times, allowing for an analysis of how time differences in construction might influence pavement thickness uniformity.
Figure 11 and
Figure 12 illustrate the distributions of the relative permittivity of the epoxy asphalt pavement layer on a steel bridge deck for the segments from K27 + 100 to K27 + 615 and from K27 + 631 to K28 + 068, respectively. These figures provide a clear visual representation of the relative permittivity at various points across the entire cross-section of the epoxy asphalt pavement. Generally, the relative permittivity of the epoxy asphalt pavement falls within the range of 5 to 7, which is considered reasonable. However, both figures reveal localized areas where the relative permittivity of the epoxy asphalt mixture is notably lower, indicating regions with higher void ratios that are prone to early-stage water damage. Among these, the segment from K27 + 631 to K28 + 068 shows a significantly higher number of regions with coarse segregation.
This analysis underscores the importance of monitoring the relative permittivity of epoxy asphalt mixtures to identify potential problem areas and mitigate risks associated with pavement deterioration and water damage.
5.2. Thickness Uniformity of Epoxy Asphalt Pavement Layer
Based on
Figure 11 and
Figure 12, which depict the distribution of the relative permittivity of the epoxy asphalt pavement, and utilizing Equation (2), the full cross-sectional thickness of the newly constructed lower layer of epoxy asphalt pavement on the steel bridge deck was calculated for the sections from K27 + 100 to K27 + 615 (
Section 1) and from K27 + 631 to K28 + 068 (
Section 2). The results are illustrated in
Figure 13 and
Figure 14. The thickness distribution maps for the sections K27 + 100 to K27 + 615 and K27 + 631 to K28 + 068 cover areas measuring 515 m × 18.75 m and 437 m × 18.75 m, respectively, with corresponding measurement points numbering 7540 × 250 and 6398 × 250.
In the grayscale thickness maps (
Figure 13 and
Figure 14), green (ranging from light green to dark green) represents the acceptable thickness range (3.3 to 3.7 cm), red indicates areas where the thickness is below the acceptable range (<3.3 cm), and yellow signifies areas where the thickness exceeds the acceptable range (>3.7 cm). A visual comparison of the thickness distribution maps reveals that
Section 1 (K27 + 100 to K27 + 615) has a larger area of acceptable thickness and fewer areas of insufficient thickness compared to
Section 2 (K27 + 631 to K28 + 068). The grayscale maps also enable the rapid identification of areas with unacceptable thickness, providing crucial data for guiding the thickness specifications of the subsequent pavement layer.
The statistical results for the thickness measurements at each designated point in both sections are comprehensively summarized in
Table 6. For
Section 1, spanning from K27 + 100 to K27 + 615, the analysis reveals that the proportions of acceptable thickness, thin areas, and thick areas are 26.52%, 3.89%, and 69.59%, respectively. This section exhibits an average thickness of 3.91 cm, accompanied by a standard deviation of 0.396 cm, resulting in a coefficient of variation of 10.13%, indicating a relatively low degree of variability in thickness.
In contrast, for
Section 2, which extends from K27 + 631 to K28 + 068, the proportions shift slightly, with acceptable thickness at 19.97%, thin areas at 15.08%, and thick areas at 64.95%. The average thickness in this section is slightly higher at 3.97 cm, with a greater standard deviation of 0.646 cm, leading to a coefficient of variation of 16.26%. This higher coefficient suggests a greater variability in thickness compared to
Section 1.
Compared to
Section 2,
Section 1 exhibits a higher rate of acceptable thickness and significantly fewer thin areas. Insufficient thickness can severely compromise the structural performance of the entire pavement, necessitating close monitoring of these areas. Additionally, the smaller standard deviation and coefficient of variation (less than 12%) in
Section 1 indicate better uniformity in the thickness of the epoxy asphalt pavement, suggesting superior construction techniques in terms of spreading and compaction. In contrast, the construction methods used in
Section 2 require improvement to achieve similar quality.
Overall, these findings highlight the differences in thickness characteristics between the two sections, emphasizing the need for targeted assessments and potential interventions based on the observed variations. This detailed analysis highlights the importance of precise thickness control and uniformity in epoxy asphalt pavement construction, which are critical for ensuring the durability and performance of the pavement on steel bridge decks.
6. Conclusions
The study utilized three-dimensional ground-penetrating radar to conduct a full cross-sectional detection of the epoxy asphalt layer thickness on a steel bridge deck and evaluate the uniformity of the pavement construction thickness. The main conclusions are as follows:
(1) The epoxy asphalt layer–steel bridge deck interface is characterized by a strong-amplitude, nearly horizontal, continuous-phase axis, and the presence of significant multiple reflections in the 3D-GPR images. This phenomenon occurs due to the thin thickness of the epoxy asphalt layer and the substantial dielectric property differences between the epoxy asphalt layer and the steel bridge deck, resulting in complete electromagnetic wave reflection by the steel bridge deck.
(2) By applying the CMP method, the antenna array spacing of the 3D-GPR was reconfigured to enable the non-destructive and effective measurement of the relative permittivity of the epoxy asphalt layer material. There is a strong positive correlation between the relative permittivity of the epoxy asphalt layer material and its void ratio. Regions with a lower relative permittivity (<5) exhibit higher void ratios, indicating coarse segregation, which is closely associated with early-stage water damage. These areas require special attention. To prevent further damage, it is recommended to focus on improving the mixture composition and quality control during asphalt layer production. Additionally, regular monitoring of these regions should be performed to detect early signs of water infiltration and mitigate potential damage through surface sealing or drainage improvements.
(3) Utilizing grayscale maps of the thickness distribution of the epoxy asphalt layer on the steel bridge deck, the actual thickness values were compared with the design thickness values to precisely identify regions of acceptable thickness, under-thickness, and over-thickness. Standard deviations and coefficients of variation of the pavement layer thickness were calculated for each construction section to evaluate the uniformity of construction thickness. A larger standard deviation and coefficient of variation indicate poorer uniformity in the thickness of the epoxy asphalt pavement layer. When the coefficient of variation of the measured thickness values exceeds 12%, improvements in paving or compaction processes are necessary. In such cases, a re-evaluation of the compaction equipment or methods should be considered, and adjustments made to ensure more uniform application of the pavement layer. Implementing better quality control measures during construction, such as frequent thickness checks and adjustments to the mix design and the design thickness of surface course, will help enhance the uniformity and durability of the pavement layer.
7. Limitations and Future Work
Future research should focus on further refining 3D-GPR techniques to enhance resolution and accuracy in thickness measurement. Additionally, studies could explore the development of real-time monitoring systems for pavement construction, integrating advanced data analytics and machine learning algorithms to predict and prevent potential issues related to thickness uniformity and material segregation. Investigating the long-term performance of epoxy asphalt pavements under varying environmental conditions and traffic loads will also provide valuable insights for optimizing construction practices and material formulations.
Future research will focus on expanding the validation of the 3D-GPR method by comparing it with additional conventional and advanced techniques, such as ultrasonic testing and laser profiling. These comparisons will provide a more comprehensive evaluation of the method’s accuracy in assessing the uniformity of pavement thickness across different materials and construction types. We plan to expand the study to consider all the layers and elements that contribute to the mechanical strength of the epoxy asphalt pavement structure. This will allow for a more comprehensive understanding of the overall pavement performance and enhance the applicability of the 3D-GPR method in a wider range of pavement evaluation scenarios.
More specific statistical parameters, such as the analysis of anomalous values, homogeneity of results, and statistically significant variations, will be incorporated to further refine the evaluation of the thickness distribution uniformity. These additional indicators will also be compared to improve the overall accuracy and reliability of the assessment.
However, a detailed cost comparison with traditional methods was not included, and future work will address this by evaluating the economic viability and potential adoption of 3D-GPR in construction contracts. Additionally, the impact of environmental factors such as temperature and humidity on GPR performance has not been examined. Future research will explore these influences to optimize the accuracy and reliability of GPR measurements under varying field conditions.


 and
and 


