
Research on the Factors Influencing Broken-Bridge Aluminum Exterior Windows with the Goal of Thermal Performance Improvement

 ,
, 
Abstract
1. Introduction
2. Methodology
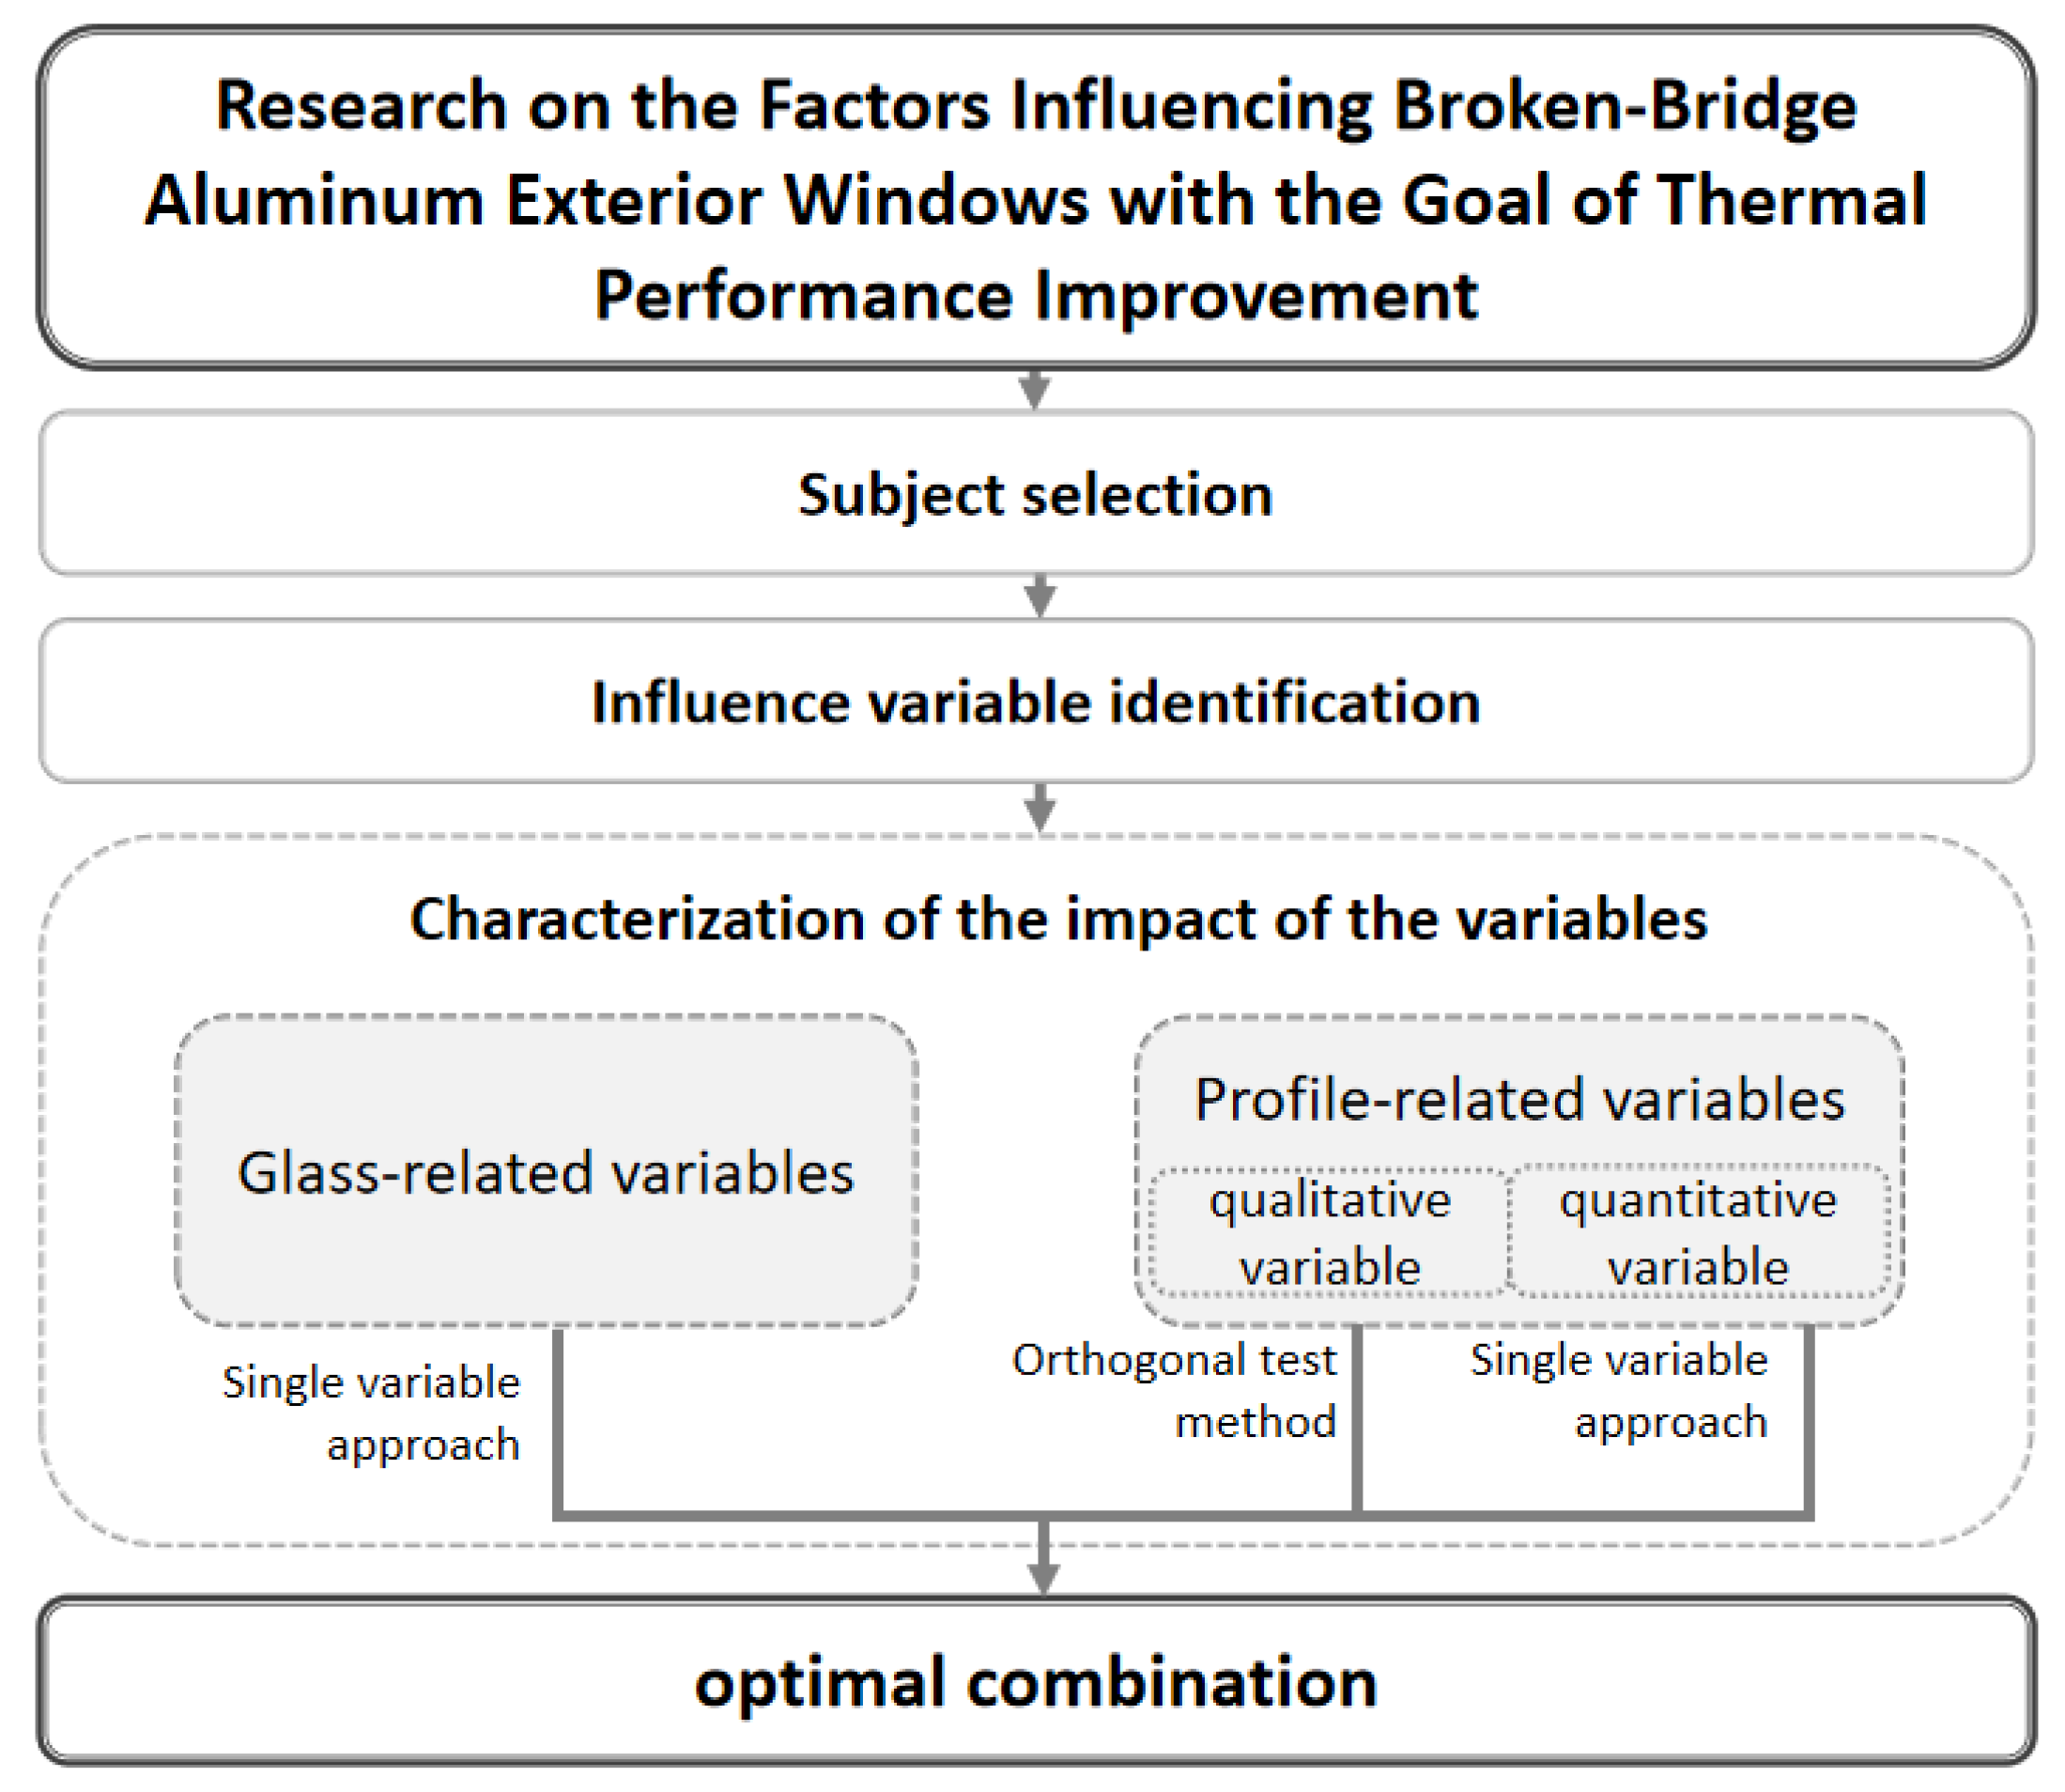
2.1. Research Design
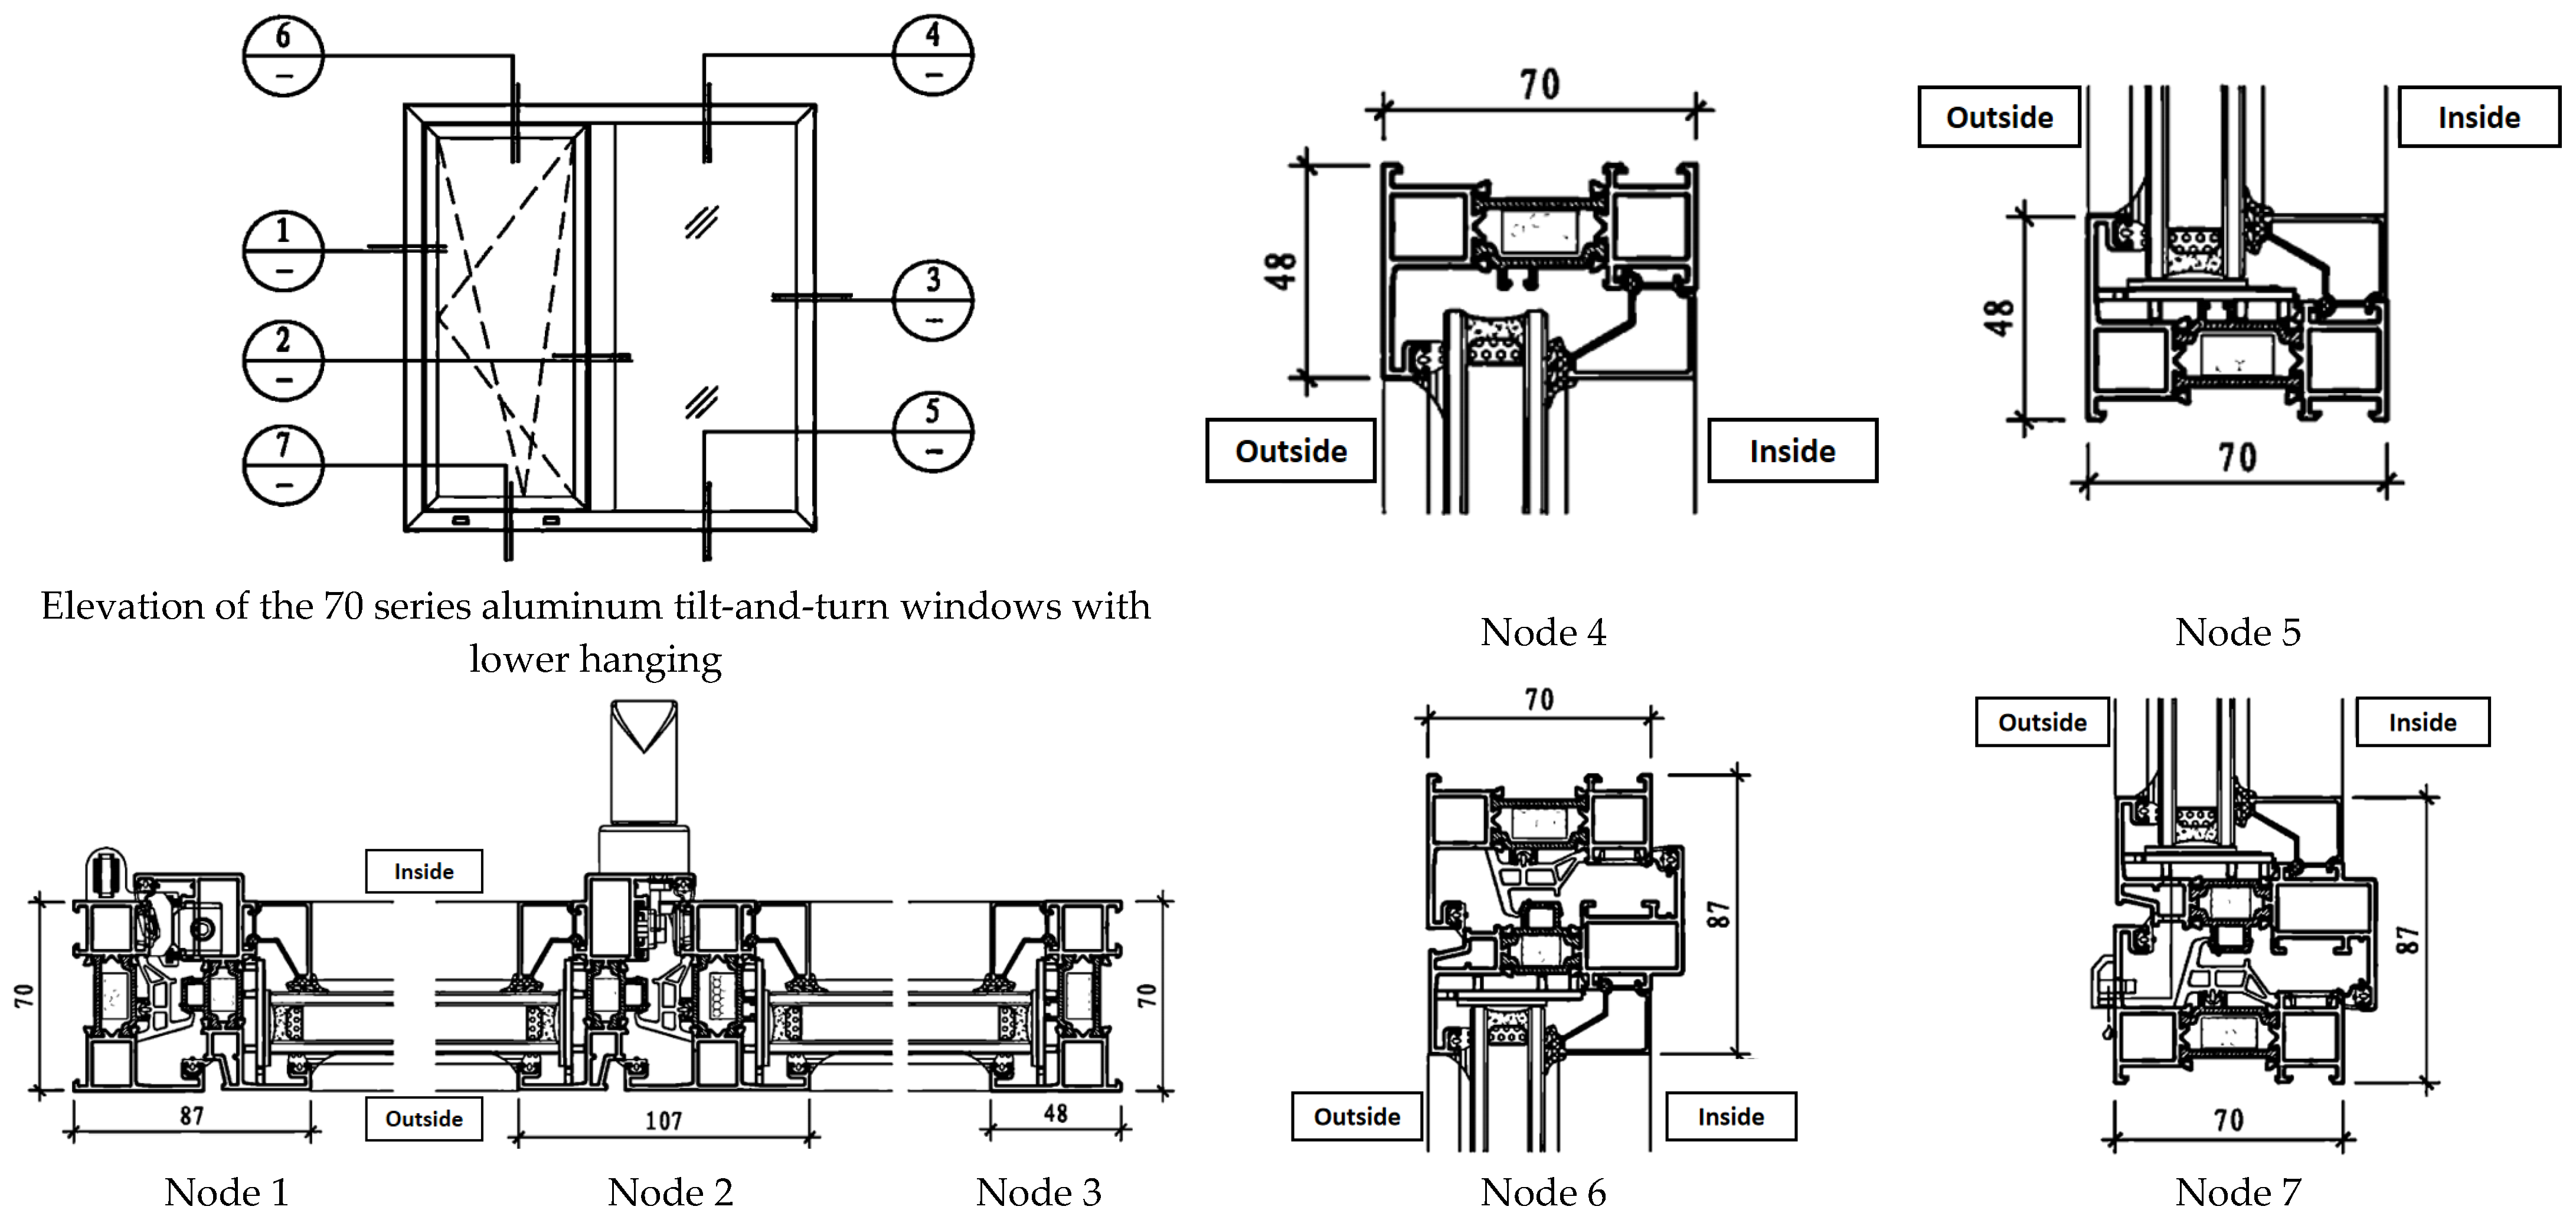
2.2. Subject Selection
2.3. Variable Identification
2.4. Methods of Analysis
2.4.1. Numerical Simulation
- (1)
- Simulation Software Selection
- (2)
- Calculation of environmental boundary conditions
- (3)
- Analog Material Selection
- (4)
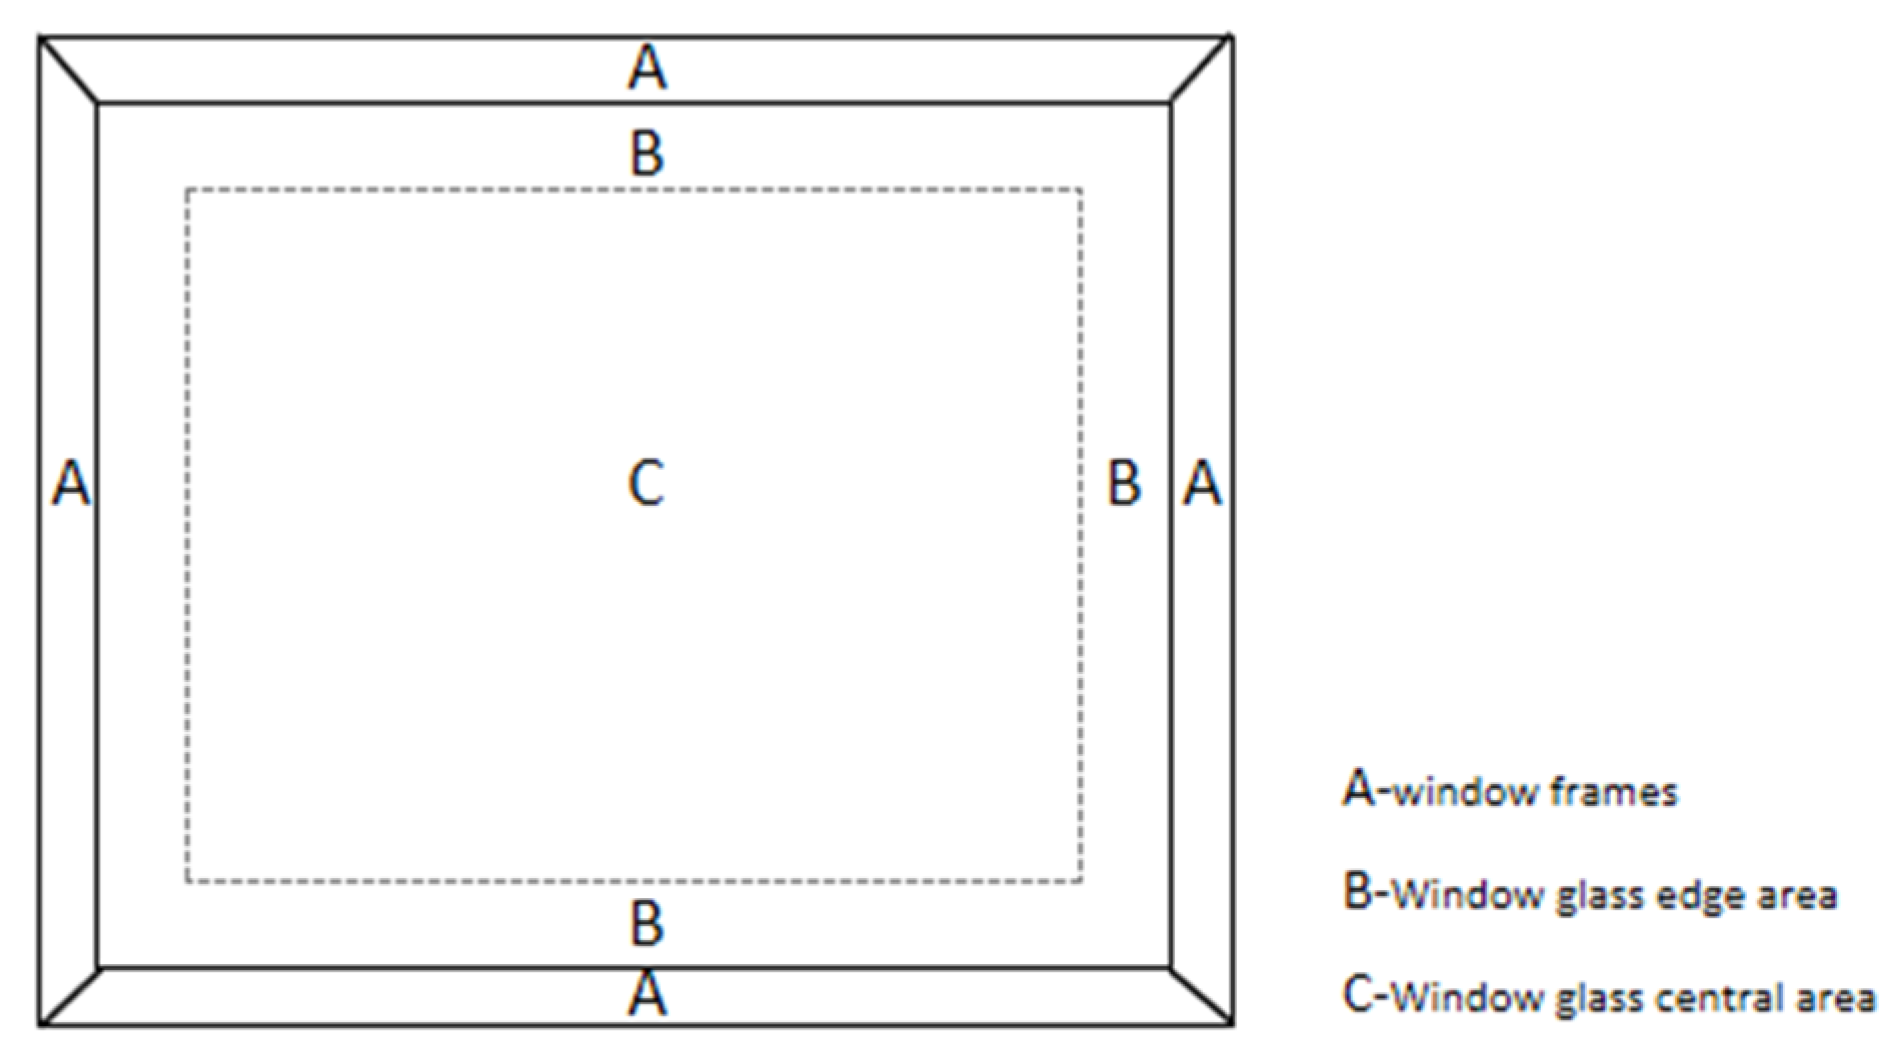
- Calculation of thermal performance of the whole window
- (5)
- Validation of numerical simulation methods
2.4.2. Statistical Analysis
- (1)
- Single-variable approach
- (2)
- Orthogonal test method
3. Results and Analysis
3.1. Characterization of the Impact of Each Variable
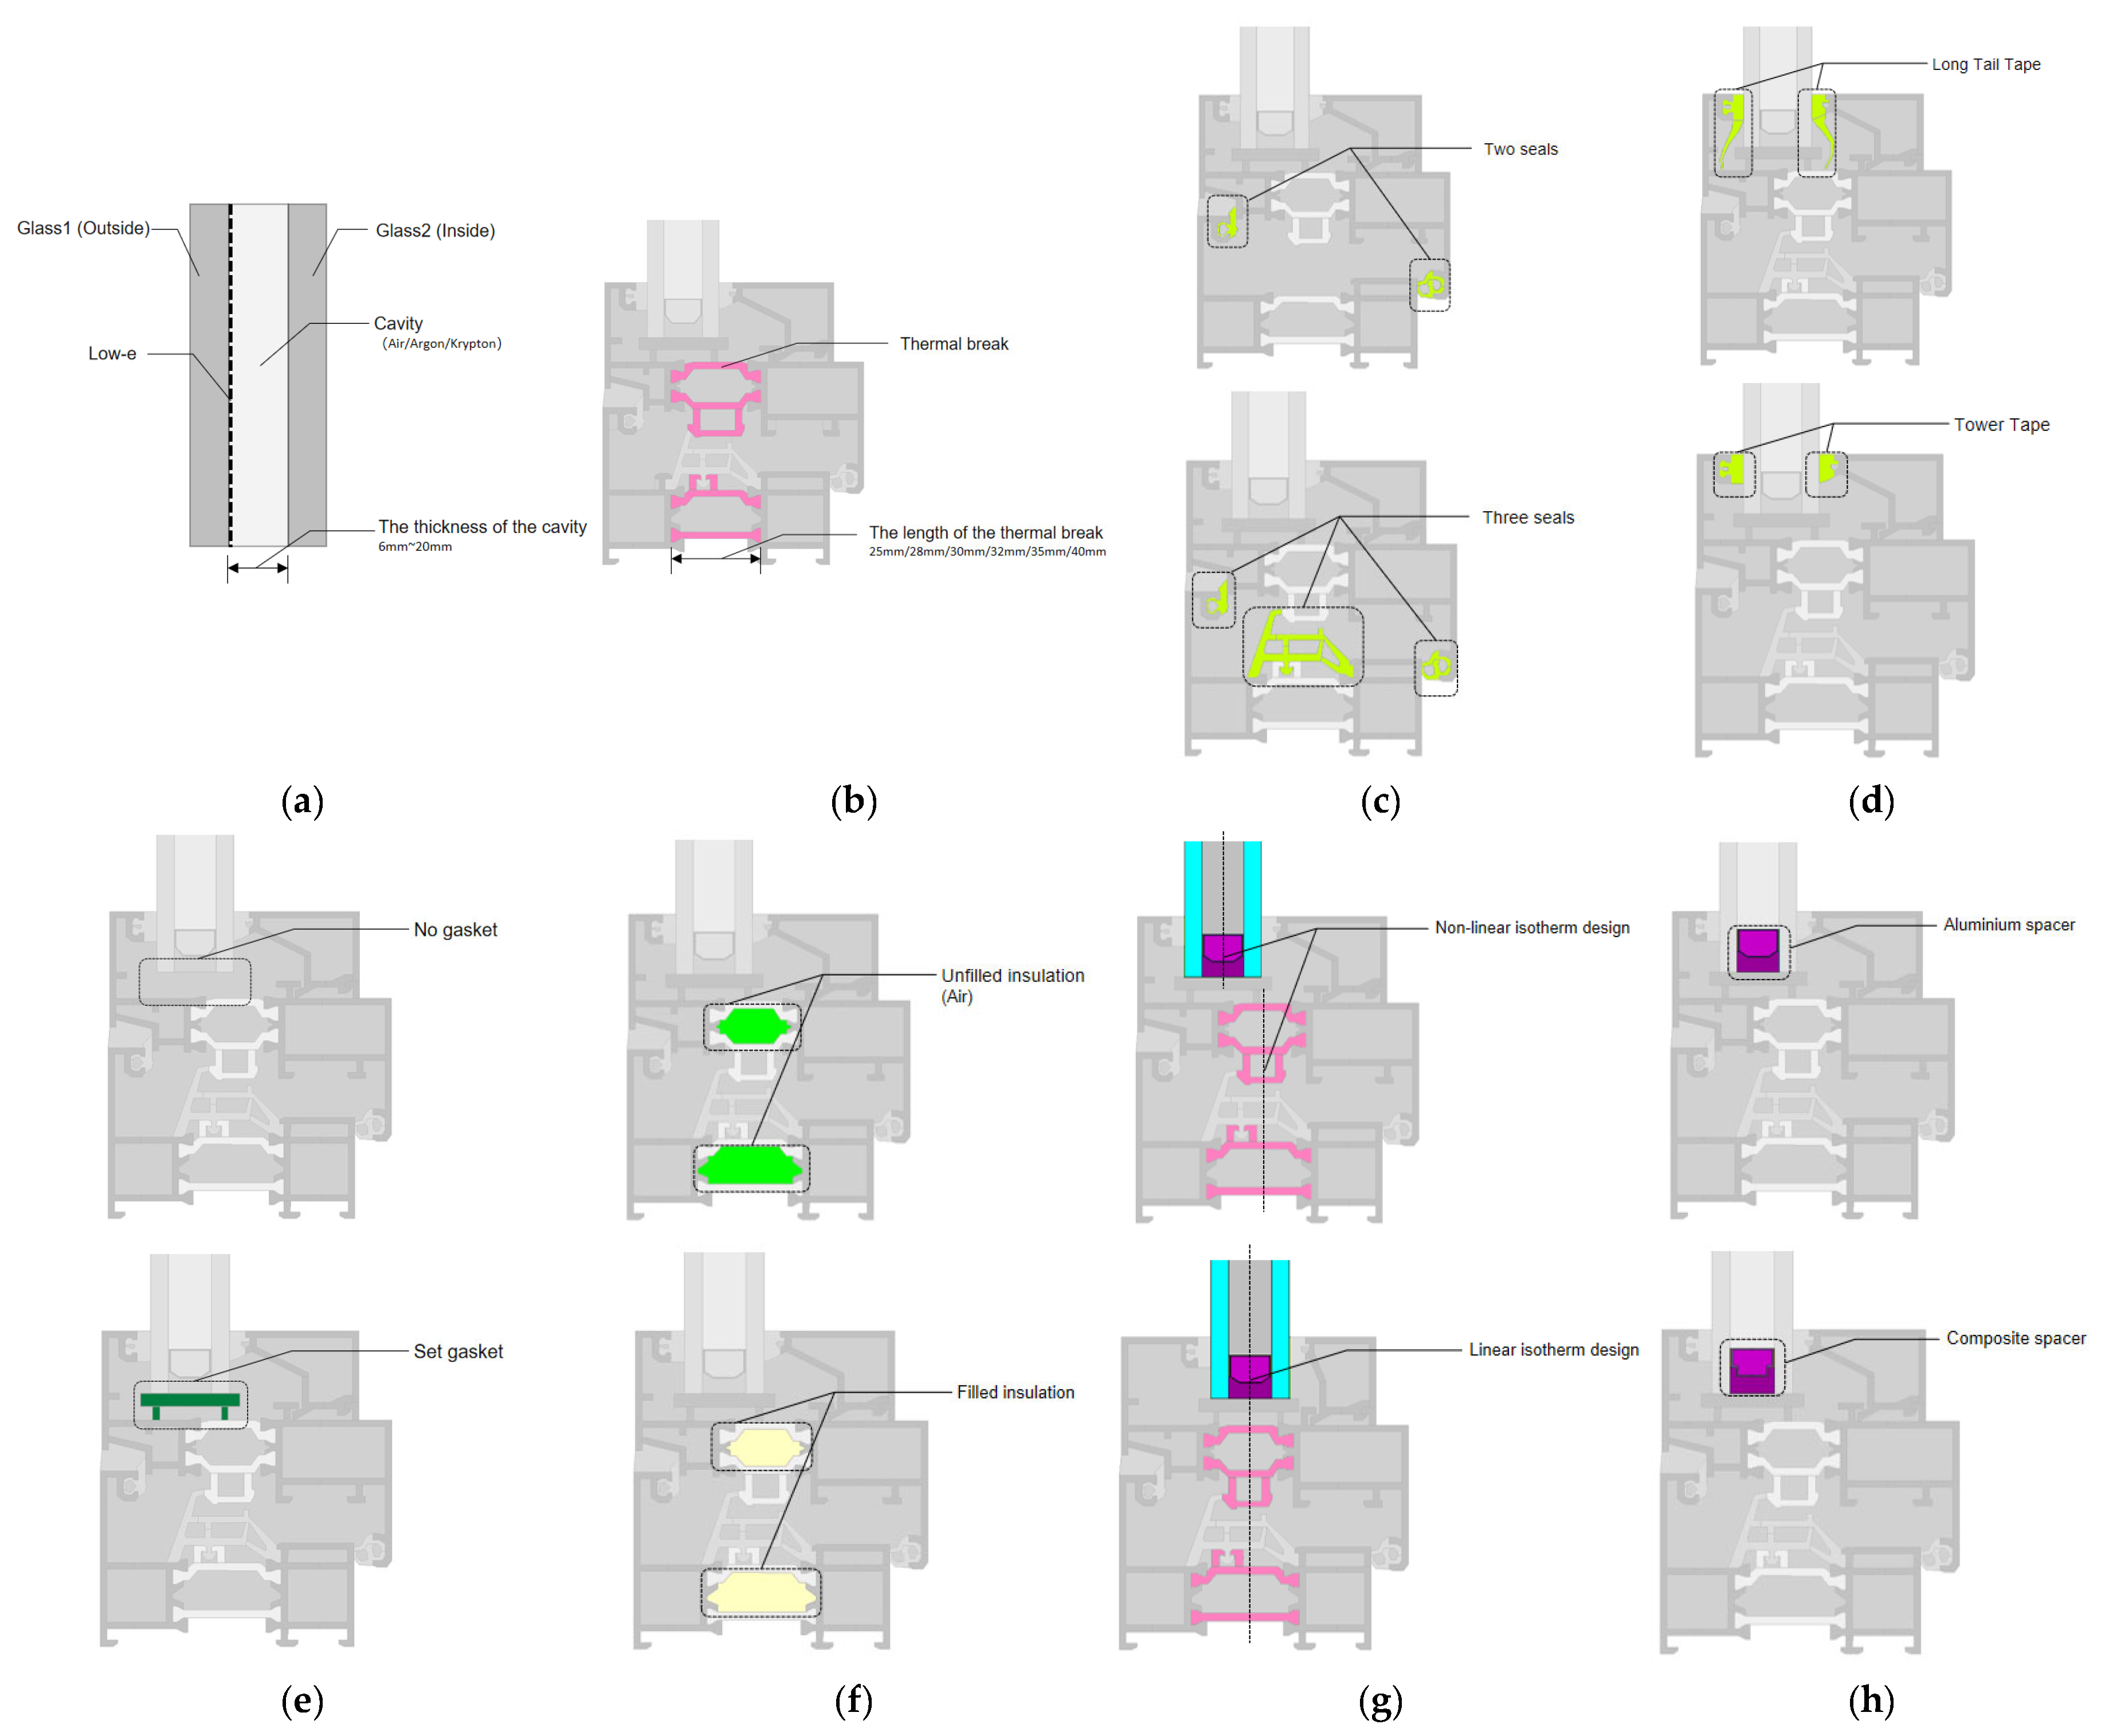
3.1.1. Characterization of the Impact of the Glass-Related Variables
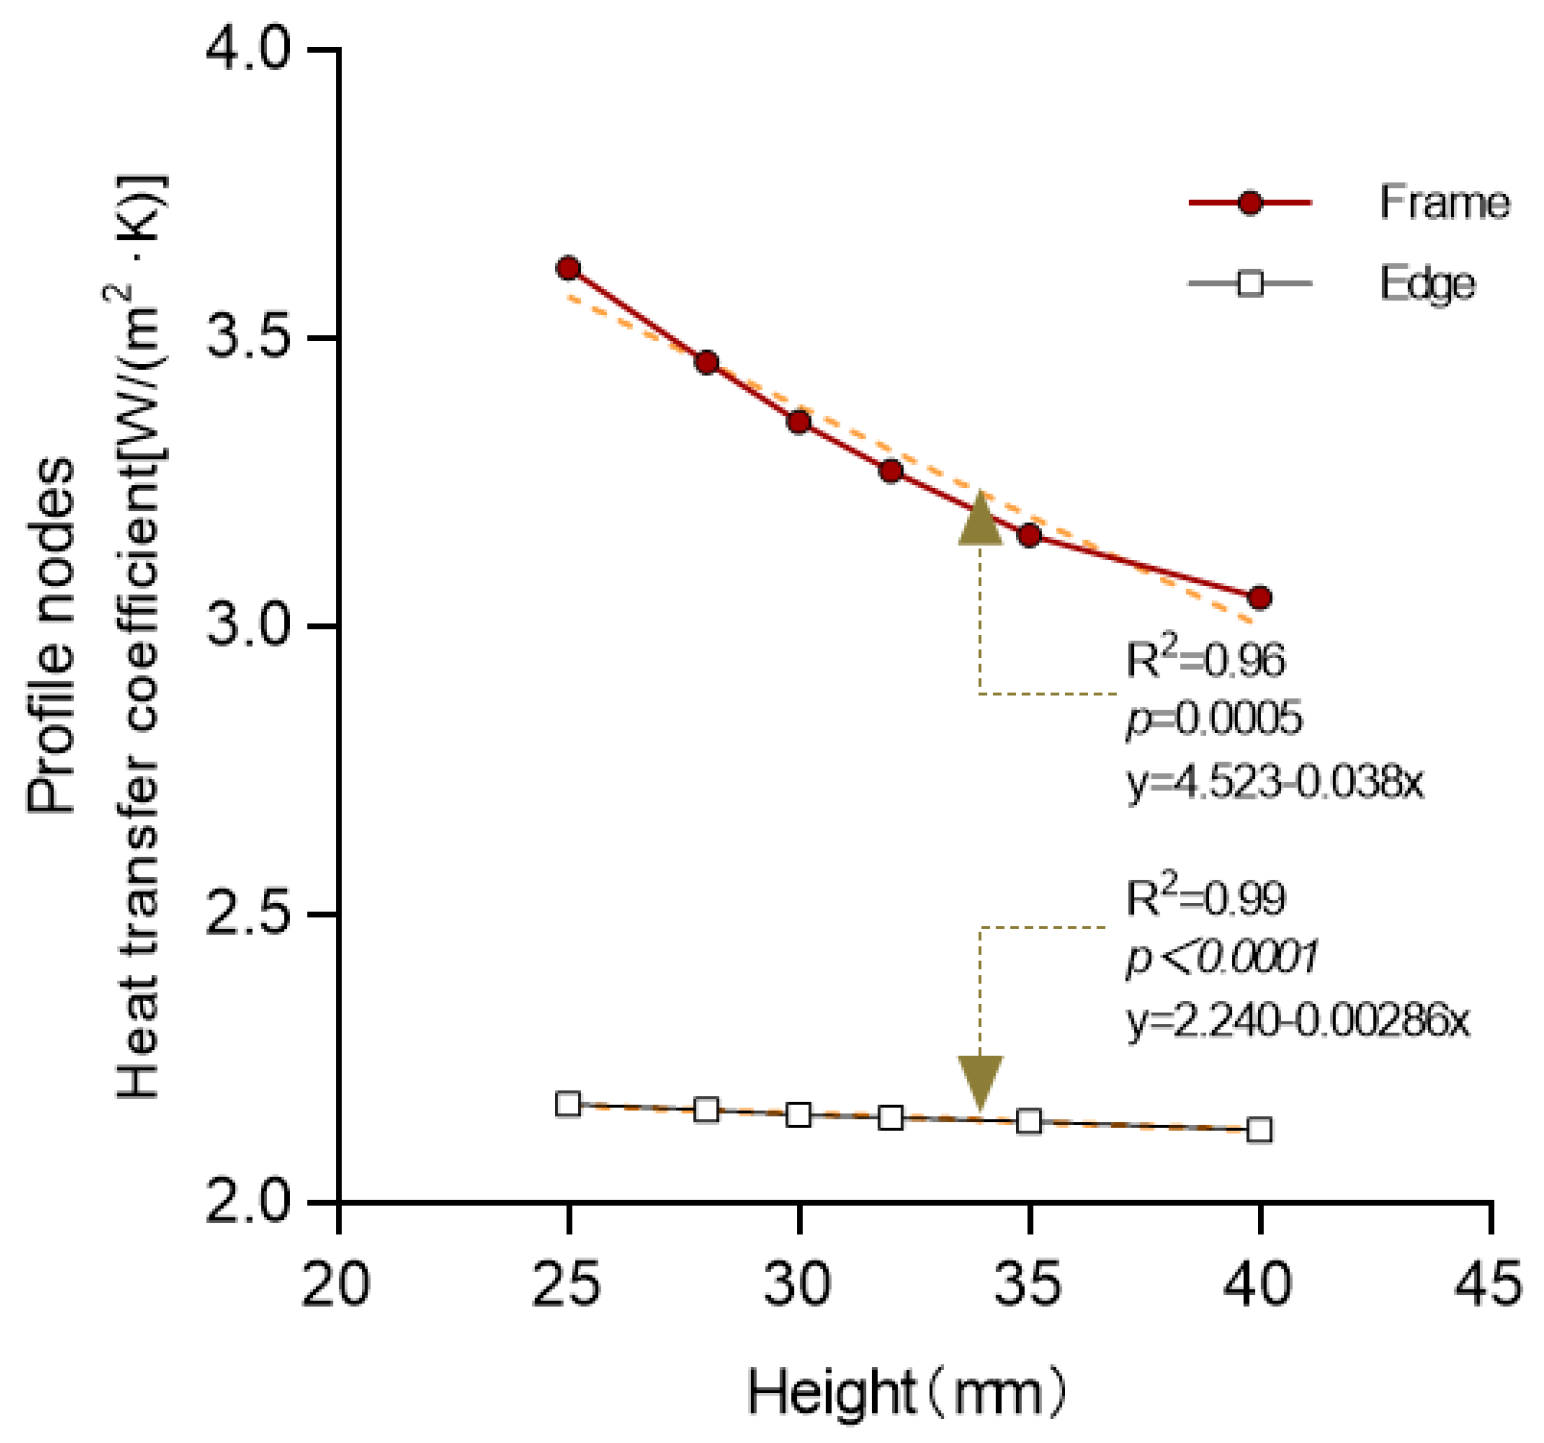
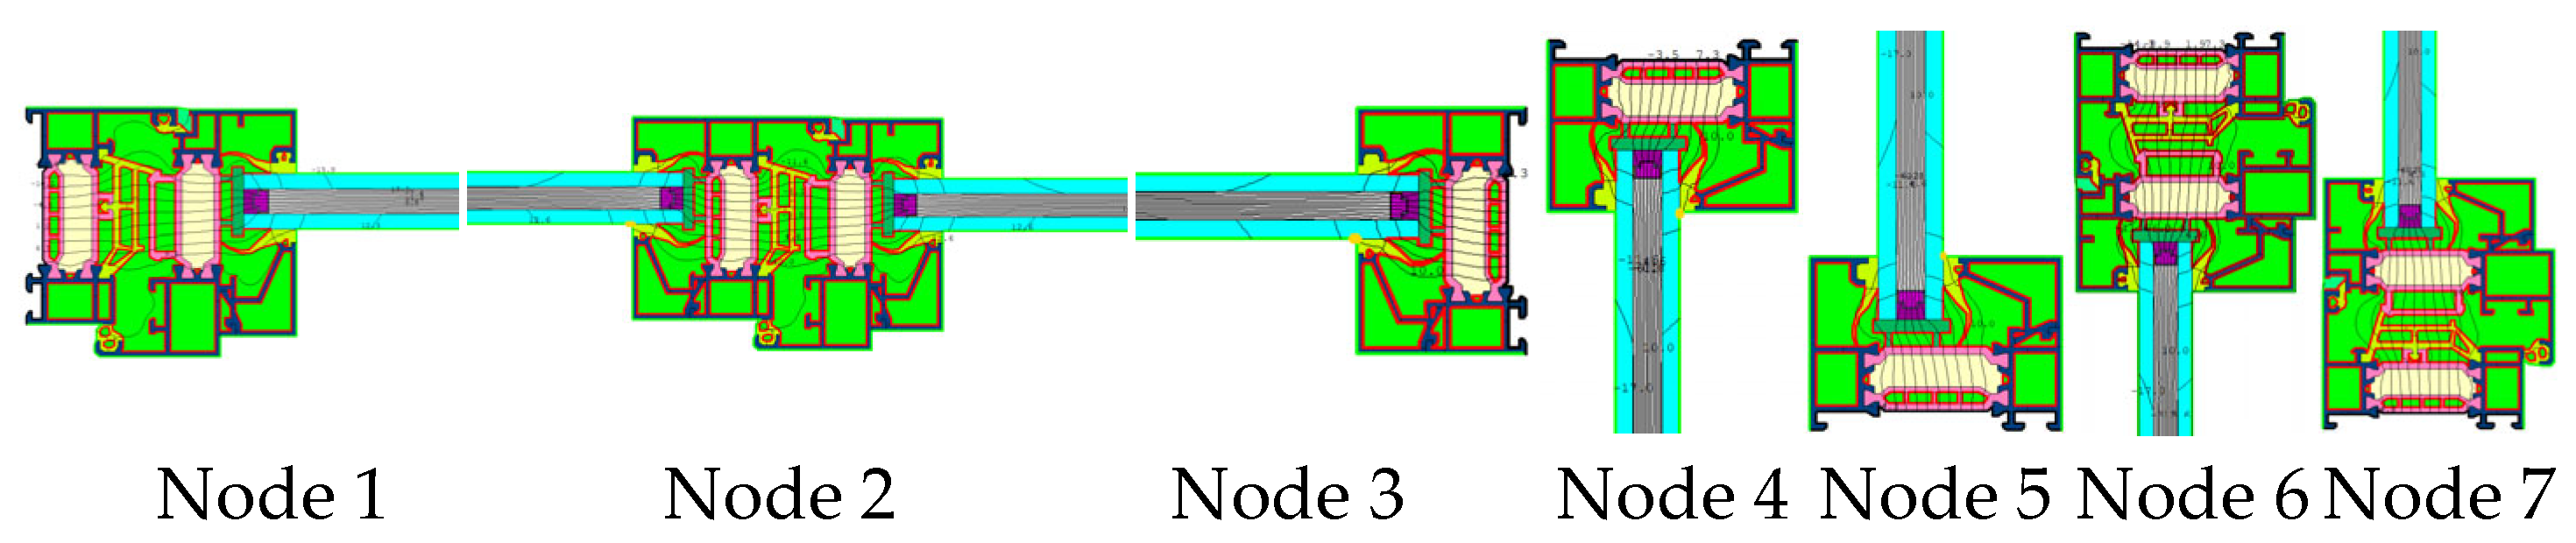
3.1.2. Characterization of the Impact of the Profile-Related Variables
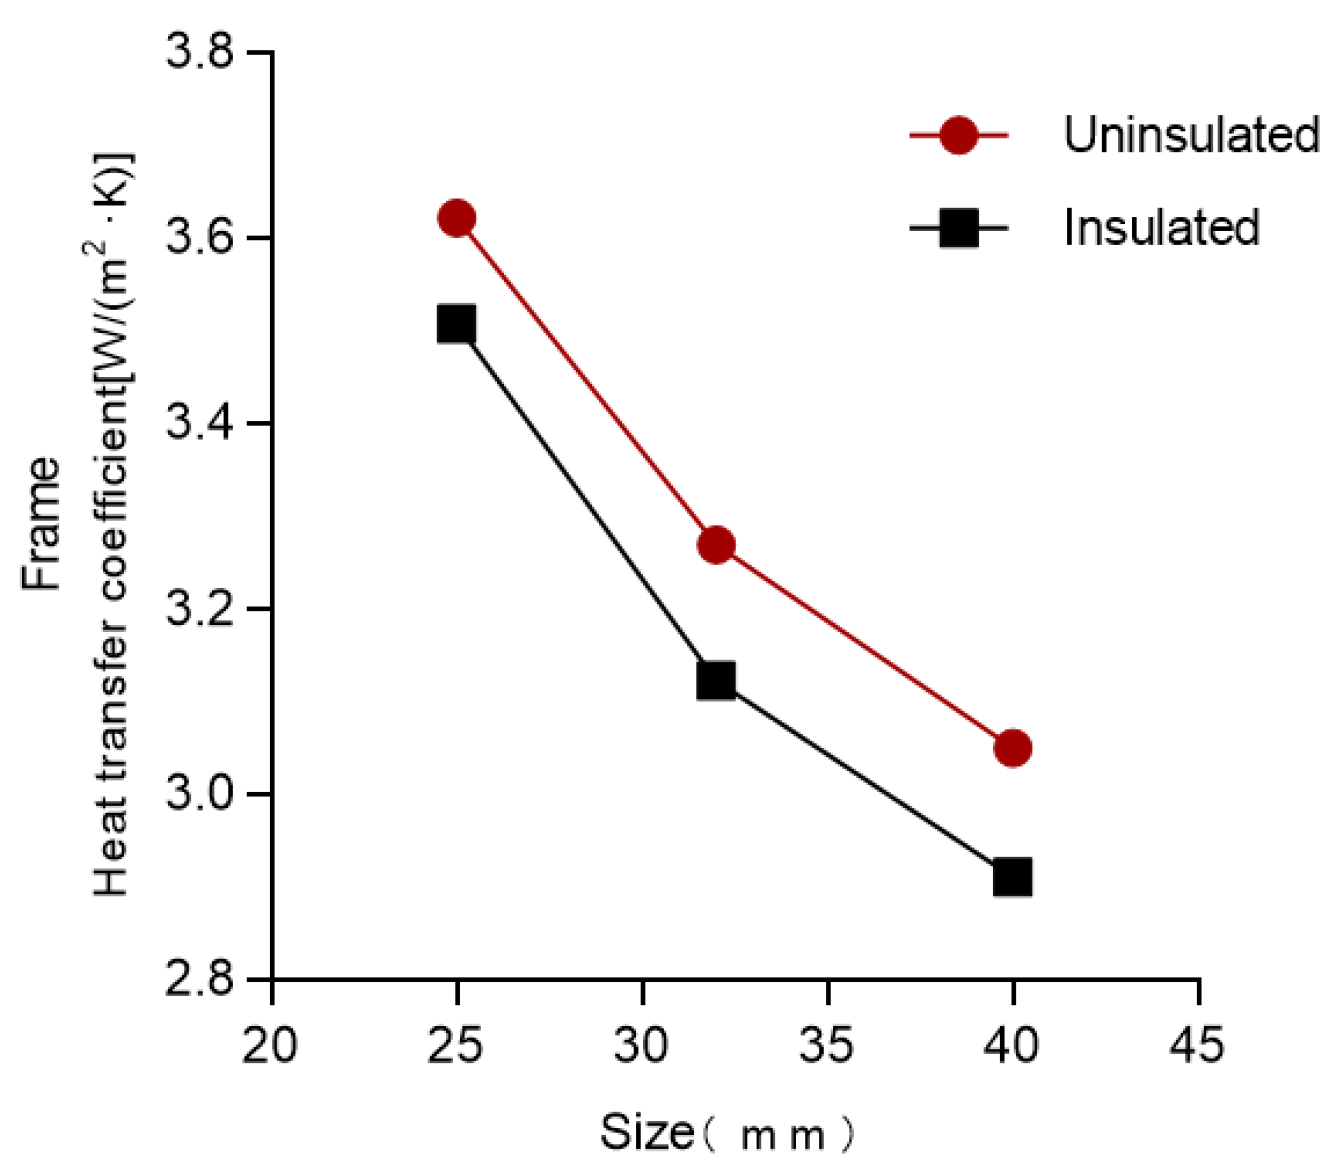
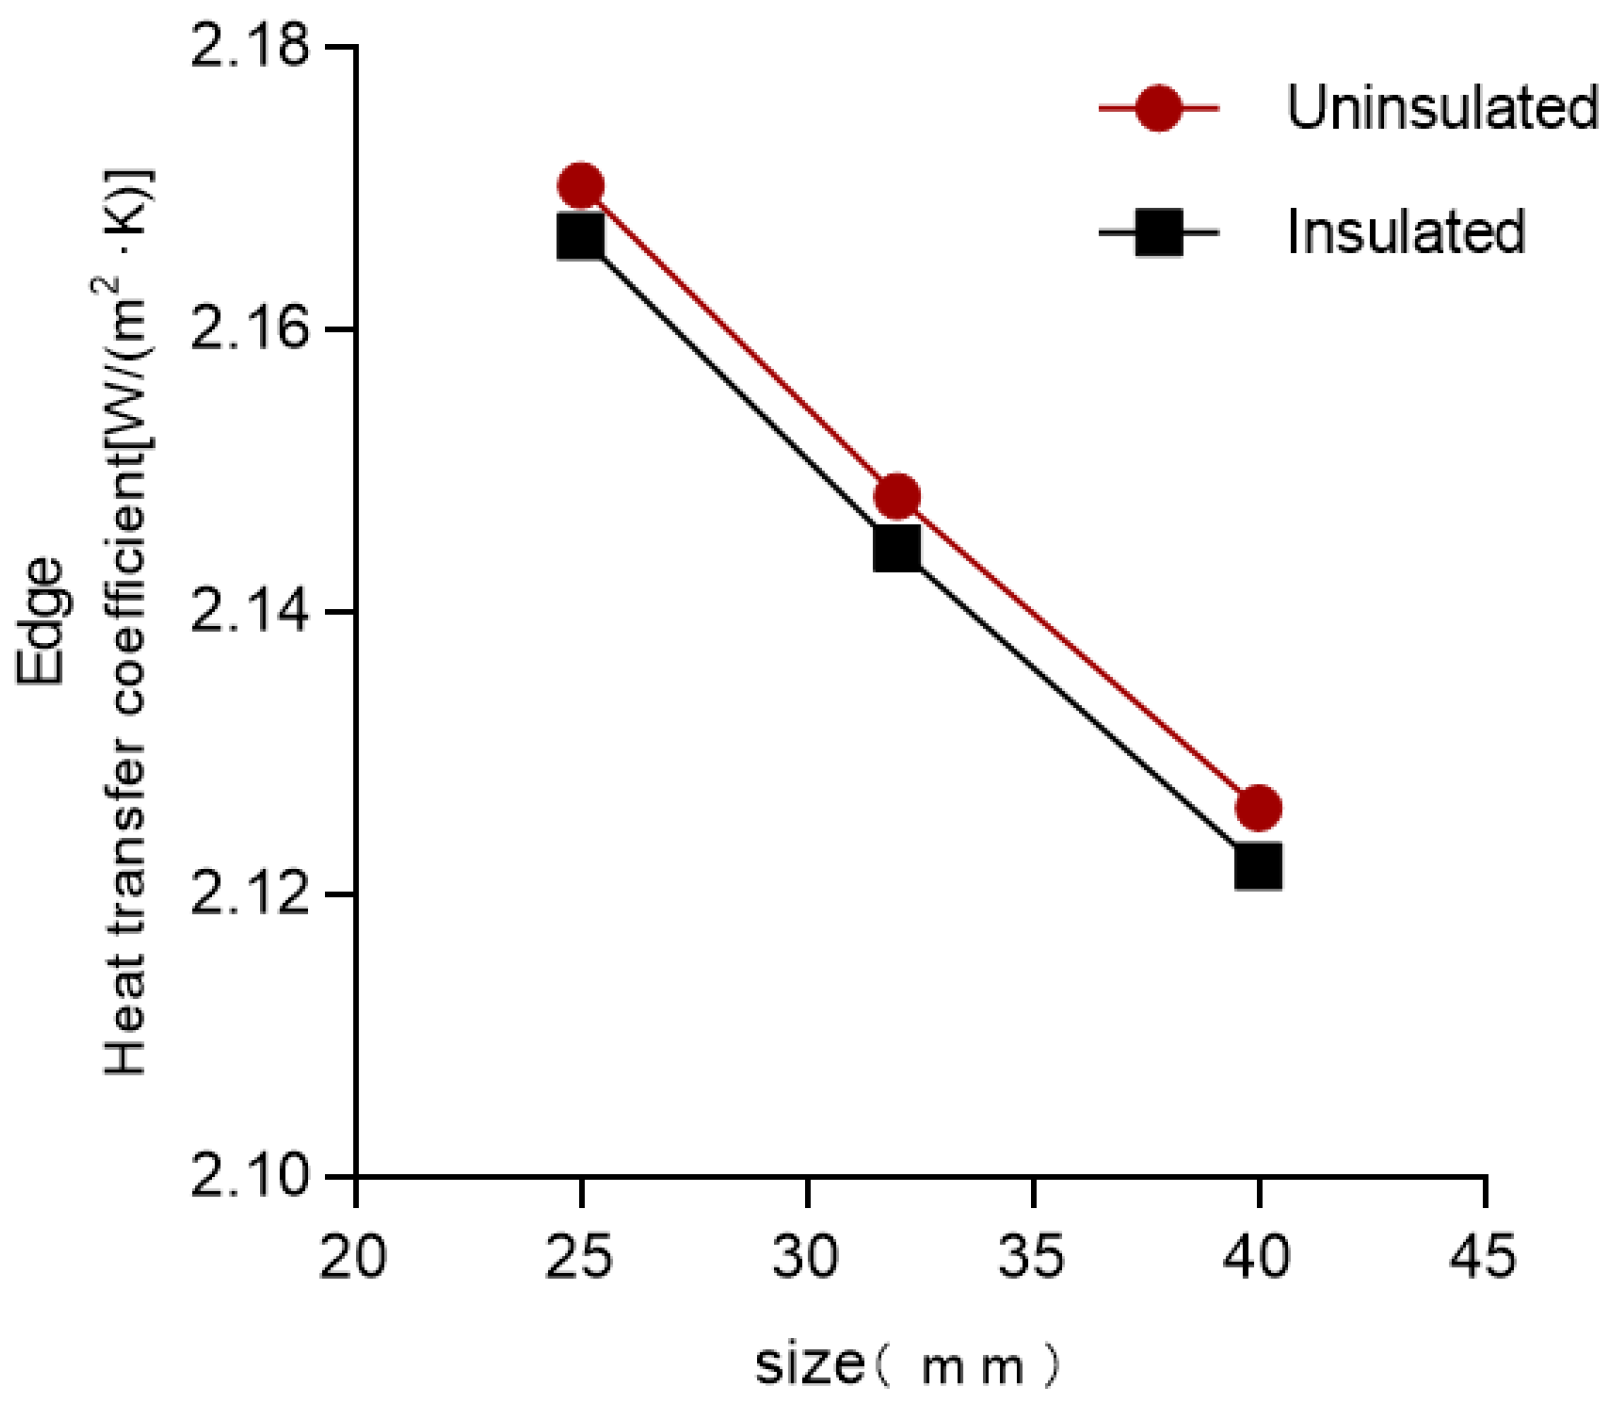
- (1)
- Influence of the length of the thermal break on the characteristics
- (2)
- Characterization of the impact of the other variables
3.2. Combination of Variables with the Goal of Thermal Performance Improvement
3.2.1. Optimal Combination Based on Mathematical Analysis
3.2.2. Performance Simulation of the Optimal Combination of Whole Windows
3.2.3. Cost-Effectiveness of the Optimal Combination of Whole Windows
- -
- The glass selection was adjusted from 5 mm (low-e) + 12 A + 5 mm to 5 mm (low-e) + 8 Kr + 5.
- -
- The length of the thermal break was adjusted from 25 mm to 40 mm.
- -
- The spacer tape between the glass was adjusted from an aluminum spacer to an composite spacer.
- -
- The broken-bridge cavity was filled with insulation material.
- -
- The shape of the sealing tape between the glass and the profile was adjusted from tower-shaped tape to a long-tailed tape shape.
4. Summary and Discussion
Author Contributions
Funding
Data Availability Statement
Conflicts of Interest
References
- U.S. Energy Information Admnistration. Internaltional Energy Outlook 2019; U.S. Energy Information Admnistration: Washington, DC, USA, 2019; pp. 25–150. [Google Scholar]
- IEA. Roadmap for Energy-Efficient Buildings and Construction in ASEAN; IEA: Paris, France, 2022; Available online: https://www.iea.org/reports/roadmap-for-energy-efficient-buildings-and-construction-in-the-association-of-southeast-asian-nations (accessed on 15 May 2025).
- International Energy Agency. Net Zero by 2050: A Roadmap for the Global Energy Sector; International Energy Agency: Paris, France, 2021; p. 224. Available online: https://www.iea.org/reports/net-zero-by-2050 (accessed on 15 May 2025).
- Qiu, C.; Yang, H.; Zhang, W. Investigation on the energy performance of a novel semi-transparent BIPV system integrated with vacuum glazing. Build. Simul. 2019, 12, 29–39. [Google Scholar] [CrossRef]
- Chel, A.; Kaushik, G. Renewable energy technologies for sustainable development of energy efficient building. Alex. Eng. J. 2018, 57, 655–669. [Google Scholar] [CrossRef]
- Kim, H.; Yeo, M. Thermal Bridge Modeling and a Dynamic Analysis Method Using the Analogy of a Steady-State Thermal Bridge Analysis and System Identification Process for Building Energy Simulation: Methodology and Validation. Energies 2020, 13, 4422. [Google Scholar] [CrossRef]
- Grynning, S.; Gustavsen, A.; Time, B.; Jelle, B.P. Windows in the buildings of tomorrow: Energy losers or energy gainers? Energy Build. 2013, 61, 185–192. [Google Scholar] [CrossRef]
- Cuce, E.; Cuce, P.M. Vacuum glazing for highly insulating windows: Recent developments and future prospects. Renew. Sustain. Energy Rev. 2016, 54, 1345–1357. [Google Scholar] [CrossRef]
- Uddin, M.M.; Jie, J.; Wang, C.; Zhang, C.; Ke, W. A review on photovoltaic combined vacuum glazing: Recent advancement and prospects. Energy Build. 2023, 286, 112939. [Google Scholar] [CrossRef]
- Huang, J.; Chen, X.; Peng, J.; Yang, H. Modelling analyses of the thermal property and heat transfer performance of a novel compositive PV vacuum glazing. Renew. Energy 2021, 163, 1238–1252. [Google Scholar] [CrossRef]
- Pont, U.; Wölzl, M.; Schober, P.; Khosravi, S.N.; Schuss, M.; Mahdavi, A. Recent progress in the development of windows with vacuum glass. MATEC Web Conf. 2019, 282, 02020. [Google Scholar] [CrossRef]
- Lyu, Y.; Zheng, S.; Zhuo, K.; Su, H.; Li, J.; Liu, C. Experimental and numerical performance investigation of a water-flow window with vacuum-glazing insulation. Sol. Energy 2022, 233, 259–270. [Google Scholar] [CrossRef]
- Li, D.; Zhang, C.; Li, Q.; Liu, C.; Arıcı, M.; Wu, Y. Thermal performance evaluation of glass window combining silica aerogels and phase change materials for cold climate of China. Appl. Therm. Eng. 2020, 165, 114547. [Google Scholar] [CrossRef]
- Schultz, J.M.; Jensen, K.I.; Kristiansen, F.H. Super insulating aerogel glazing. Sol. Energy Mater. Sol. Cells 2005, 89, 275–285. [Google Scholar] [CrossRef]
- Wu, S.; Sun, H.; Duan, M.; Mao, H.; Wu, Y.; Zhao, H.; Lin, B. Applications of thermochromic and electrochromic smart windows: Materials to buildings. Cell Rep. Phys. Sci. 2023, 4, 101370. [Google Scholar] [CrossRef]
- Liang, R.; Sun, Y.; Aburas, M.; Wilson, R.; Wu, Y. Evaluation of the thermal and optical performance of thermochromic windows for office buildings in China. Energy Build. 2018, 176, 216–231. [Google Scholar] [CrossRef]
- Piccolo, A. Thermal performance of an electrochromic smart window tested in an environmental test cell. Energy Build. 2010, 42, 1409–1417. [Google Scholar] [CrossRef]
- Bai, T.; Li, W.; Fu, G.; Zhang, Q.; Zhou, K.; Wang, H. Dual-band electrochromic smart windows towards building energy conservation. Sol. Energy Mater. Sol. Cells 2023, 256, 112320. [Google Scholar] [CrossRef]
- Gustavsen, A.; Grynning, S.; Arasteh, D.; Jelle, B.P.; Goudey, H. Key elements of and material performance targets for highly insulating window frames. Energy Build. 2011, 43, 2583–2594. [Google Scholar] [CrossRef]
- Van Den Bergh, S.; Hart, R.; Jelle, B.P.; Gustavsen, A. Window spacers and edge seals in insulating glass units: A state-of-the-art review and future perspectives. Energy Build. 2013, 58, 263–280. [Google Scholar] [CrossRef]
- Paulos, J.; Berardi, U. Optimizing the thermal performance of window frames through aerogel-enhancements. Appl. Energy 2020, 266, 114776. [Google Scholar] [CrossRef]
- Xiaoyan, Y. Analysis of the influence of building exterior window profiles on heat transfer coefficient. Green Build. 2022, 14, 72–76. [Google Scholar]
- Appelfeld, D.; Hansen, C.S.; Svendsen, S. Development of a slim window frame made of glass fibre reinforced polyester. Energy Build. 2010, 42, 1918–1925. [Google Scholar] [CrossRef]
- Pittie, T.; Ahmad, S.; Singh, H.; Rashid, M.M.; Adhikari, S.; Shetty, S.; Krishnan, N.M.A. A combined experimental and numerical analysis framework for the design of aluminum windows. J. Build. Eng. 2024, 82, 108259. [Google Scholar] [CrossRef]
- Simko, T.; Moore, T. Optimal window designs for Australian houses. Energy Build. 2021, 250, 111300. [Google Scholar] [CrossRef]
- Van Den Bossche, N.; Buffel, L.; Janssens, A. Thermal Optimization of Window Frames. Energy Procedia 2015, 78, 2500–2505. [Google Scholar] [CrossRef]
- Chen, H.; Liu, Y.; Zhang, L.; Li, W.; Li, C.; Huang, L.; Jiang, S.; Luo, T. Research on new heat-insulating aluminum alloy profiles for building exterior windows. Build. Sci. 2021, 37, 170–174+210. [Google Scholar] [CrossRef]
- Wan, C.; Wang, H.; Sun, S.; Wang, L. Simulation study on factors affecting thermal performance of aluminum alloy windows. Constr. Sci. Technol. 2014, 1, 62–65. [Google Scholar] [CrossRef]
- Jin, J.; Yu, H. Analysis of key technology of thermal performance of heat-insulating aluminum alloy profiles. Sichuan Build. Sci. Res. 2017, 43, 132–135. [Google Scholar]
- Xi, Y.; Liu, W. Research on heat transfer coefficient of building exterior windows based on different measures. New Build. Mater. 2020, 47, 20–24+34. [Google Scholar]
- Chen, J.; Shen, R. Research on isothermal distribution and heat transfer coefficient of thermal insulation profiles. Doors Windows 2011, 5, 46–51. [Google Scholar]
- 22J603-1; Aluminum Alloy Windows and Doors. China Institute of Building Standard Design & Research: Beijing, China, 2022.
- GB55015-2021; General Specification for Building Energy Efficiency and Renewable Energy Utilization. International Energy Agency: Paris, France, 2021.
- Amaral, A.R.; Rodrigues, E.; Gaspar, A.R.; Gomes, Á. A thermal performance parametric study of window type, orientation, size and shadowing effect. Sustain. Cities Soc. 2016, 26, 456–465. [Google Scholar] [CrossRef]
- Troup, L.; Phillips, R.; Eckelman, M.J.; Fannon, D. Effect of window-to-wall ratio on measured energy consumption in US office buildings. Energy Build. 2019, 203, 109434. [Google Scholar] [CrossRef]
- Marino, C.; Nucara, A.; Pietrafesa, M. Does window-to-wall ratio have a significant effect on the energy consumption of buildings? a parametric analysis in Italian climate conditions. J. Build. Eng. 2017, 13, 169–183. [Google Scholar] [CrossRef]
- Teich, M.; Scherer, C.; Schuster, M.; Brandenstein, M.; Elstner, M. Reuse and remanufacturing of insulated glass units. Glass Struct. Eng. 2024, 9, 339–356. [Google Scholar] [CrossRef]
- Mert Cüce, A.P.; Cüce, E.; Şen, H. Numerical analysis of thermal insulation performance of double glazing products using air, argon and krypton. In Proceedings of the II-International Conference on Global Practice of Multidisciplinary Scientific Studies, Batumi, Georgia, 26–28 July 2022; pp. 1480–1486. [Google Scholar]
- Mo, Y.; Wang, C.; Kassem, M.A.; Wang, D.; Chen, Z. Optimizing Window Configurations for Energy-Efficient Buildings with Aluminum Alloy Frames and Helium-Filled Insulating Glazing. Sustainability 2024, 16, 6522. [Google Scholar] [CrossRef]
- Chen, Z.; Li, Q.; Zhang, L.; Meng, Q. Thermal properties of Aluminum & PVC co-extrusion sliding window. In Proceedings of the 2011 International Conference on Multimedia Technology, Hangzhou, China, 26–28 July 2011; pp. 5660–5663. [Google Scholar] [CrossRef]
- 2006BAJ02B06; Research on Thermal Calculation Standard System of Chinese and Foreign Building Doors, Windows and Curtain Walls: One of the Special Research Contents of National Eleventh Five-Year Plan “Research and Development of Typical Building Window Systems for Regional Use”. China Building Metal Structure: Beijing, China, 2011; Volume 2, pp. 33–38.
- Curcija, D.C.; Hart, R.G. Modeling Thermal Performance of VIG: WINDOW and THERM Software Tools; Proc. Presented at the 1st China (Qingdao) International Glass & Equipment Technology Seminar; Lawrence Berkeley National Laboratory: Alameda County, CA, USA, 2018. [Google Scholar]
- Mitchell, R.; Kohler, C.; Curcija, D.; Zhu, L.; Vidanovic, S.; Czarnecki, S.; Arasteh, D.; Carmody, J.; Huizenga, C. THERM 7/WINDOW 7 NFRC Simulation Manual; Lawrence Berkeley National Lab. (LBNL): Berkeley, CA, USA, 2017. [Google Scholar]
- JGJ/T151-2008; Thermal Calculation Regulations for Building Doors, Windows and Glass Curtain Walls. China Construction Industry Press: Beijing, China, 2009.
- NFRC 100:2004; Procedure for Determining Fenestration Product U-Factors. NFRC: Greenbelt, MD, USA, 2004.
- RISN-TG013-2012; Guidelines for Labeling Energy-Saving Performance of Building Windows and Doors. NFRC: Greenbelt, MD, USA, 2012.
- Mead, R. The Design of Experiments; Wikimedia: San Francisco, CA, USA, 1990. [Google Scholar]
- Zhu, J.; Chew, D.A.S.; Lv, S.; Wu, W. Optimization method for building envelope design to minimize carbon emissions of building operational energy consumption using orthogonal experimental design (OED). Habitat Int. 2013, 37, 148–154. [Google Scholar] [CrossRef]
- Li, Q.; Hu, H.; Ma, L.; Wang, Z.; Arıcı, M.; Li, D.; Luo, D.; Jia, J.; Jiang, W.; Qi, H. Evaluation of energy-saving retrofits for sunspace of rural residential buildings based on orthogonal experiment and entropy weight method. Energy Sustain. Dev. 2022, 70, 569–580. [Google Scholar] [CrossRef]
- Omle, I.; Kovács, E.; Bolló, B. Applying recent efficient numerical methods for long-term simulations of heat transfer in walls to optimize thermal insulation. Results Eng. 2023, 20, 101476. [Google Scholar] [CrossRef]
- Marwan, M.; Jamal, J.; Hamid, A.; Nasir, N.; La Nafie, N.A.; Gunawan, A.; Syamsuddin, S.; Razak, B.A.; Musaruddin, M. Optimize electrical energy cost of air conditioning considering to different wall characteristics. Results Eng. 2023, 17, 100990. [Google Scholar] [CrossRef]
- Jelle, B.P.; Hynd, A.; Gustavsen, A.; Arasteh, D.; Goudey, H.; Hart, R. Fenestration of today and tomorrow: A state-of-the-art review and future research opportunities. Sol. Energy Mater. Sol. Cells 2012, 96, 1–28. [Google Scholar] [CrossRef]
- Wakili, K.G.; Raedle, W.; Krammer, A.; Uehlinger, A.; Schüler, A.; Stöckli, T. Ug-value and edge heat loss of triple glazed insulating glass units: A comparison between measured and declared values. J. Build. Eng. 2021, 44, 103031. [Google Scholar] [CrossRef]
- Wolf, A.T. Studies into the life-expectancy of insulating glass units. Build. Environ. 1992, 27, 305–319. [Google Scholar] [CrossRef]
- Altun, A.F. Determination of Optimum Building Envelope Parameters of a Room concerning Window-to-Wall Ratio, Orientation, Insulation Thickness. Buildings 2022, 12, 383. [Google Scholar] [CrossRef]
- Alghoul, S.K.; Rijabo, H.G.; Mashena, M.E. Energy consumption in buildings: A correlation for the influence of window to wall ratio and window orientation in Tripoli, Libya. J. Build. Eng. 2017, 11, 82–86. [Google Scholar] [CrossRef]

| Model Number | Extruded Profile | Glass Configuration | Glass U-Value | Whole Window Heat Transfer Coefficient U-Value | ||
|---|---|---|---|---|---|---|
| Ratio of Area of Window Frames and Openings | ||||||
| 15% | 20% | 30% | ||||
| 70 series aluminum tilt-and-turn windows | Heat-insulating aluminum alloy profiles | 5mm(low-E) + 12 A + 5 mm | 1.75 | 1.88 | 1.96 | 2.14 |
| Typology | Potential Factor | Variable Classification | Specific Measures | Whether to Study |
|---|---|---|---|---|
| Fiberglass (Figure 3a) | Configuration of the glass itself | Fixed variable | China South Glass 5 mm (low-e) + 5 mm insulating glass | No |
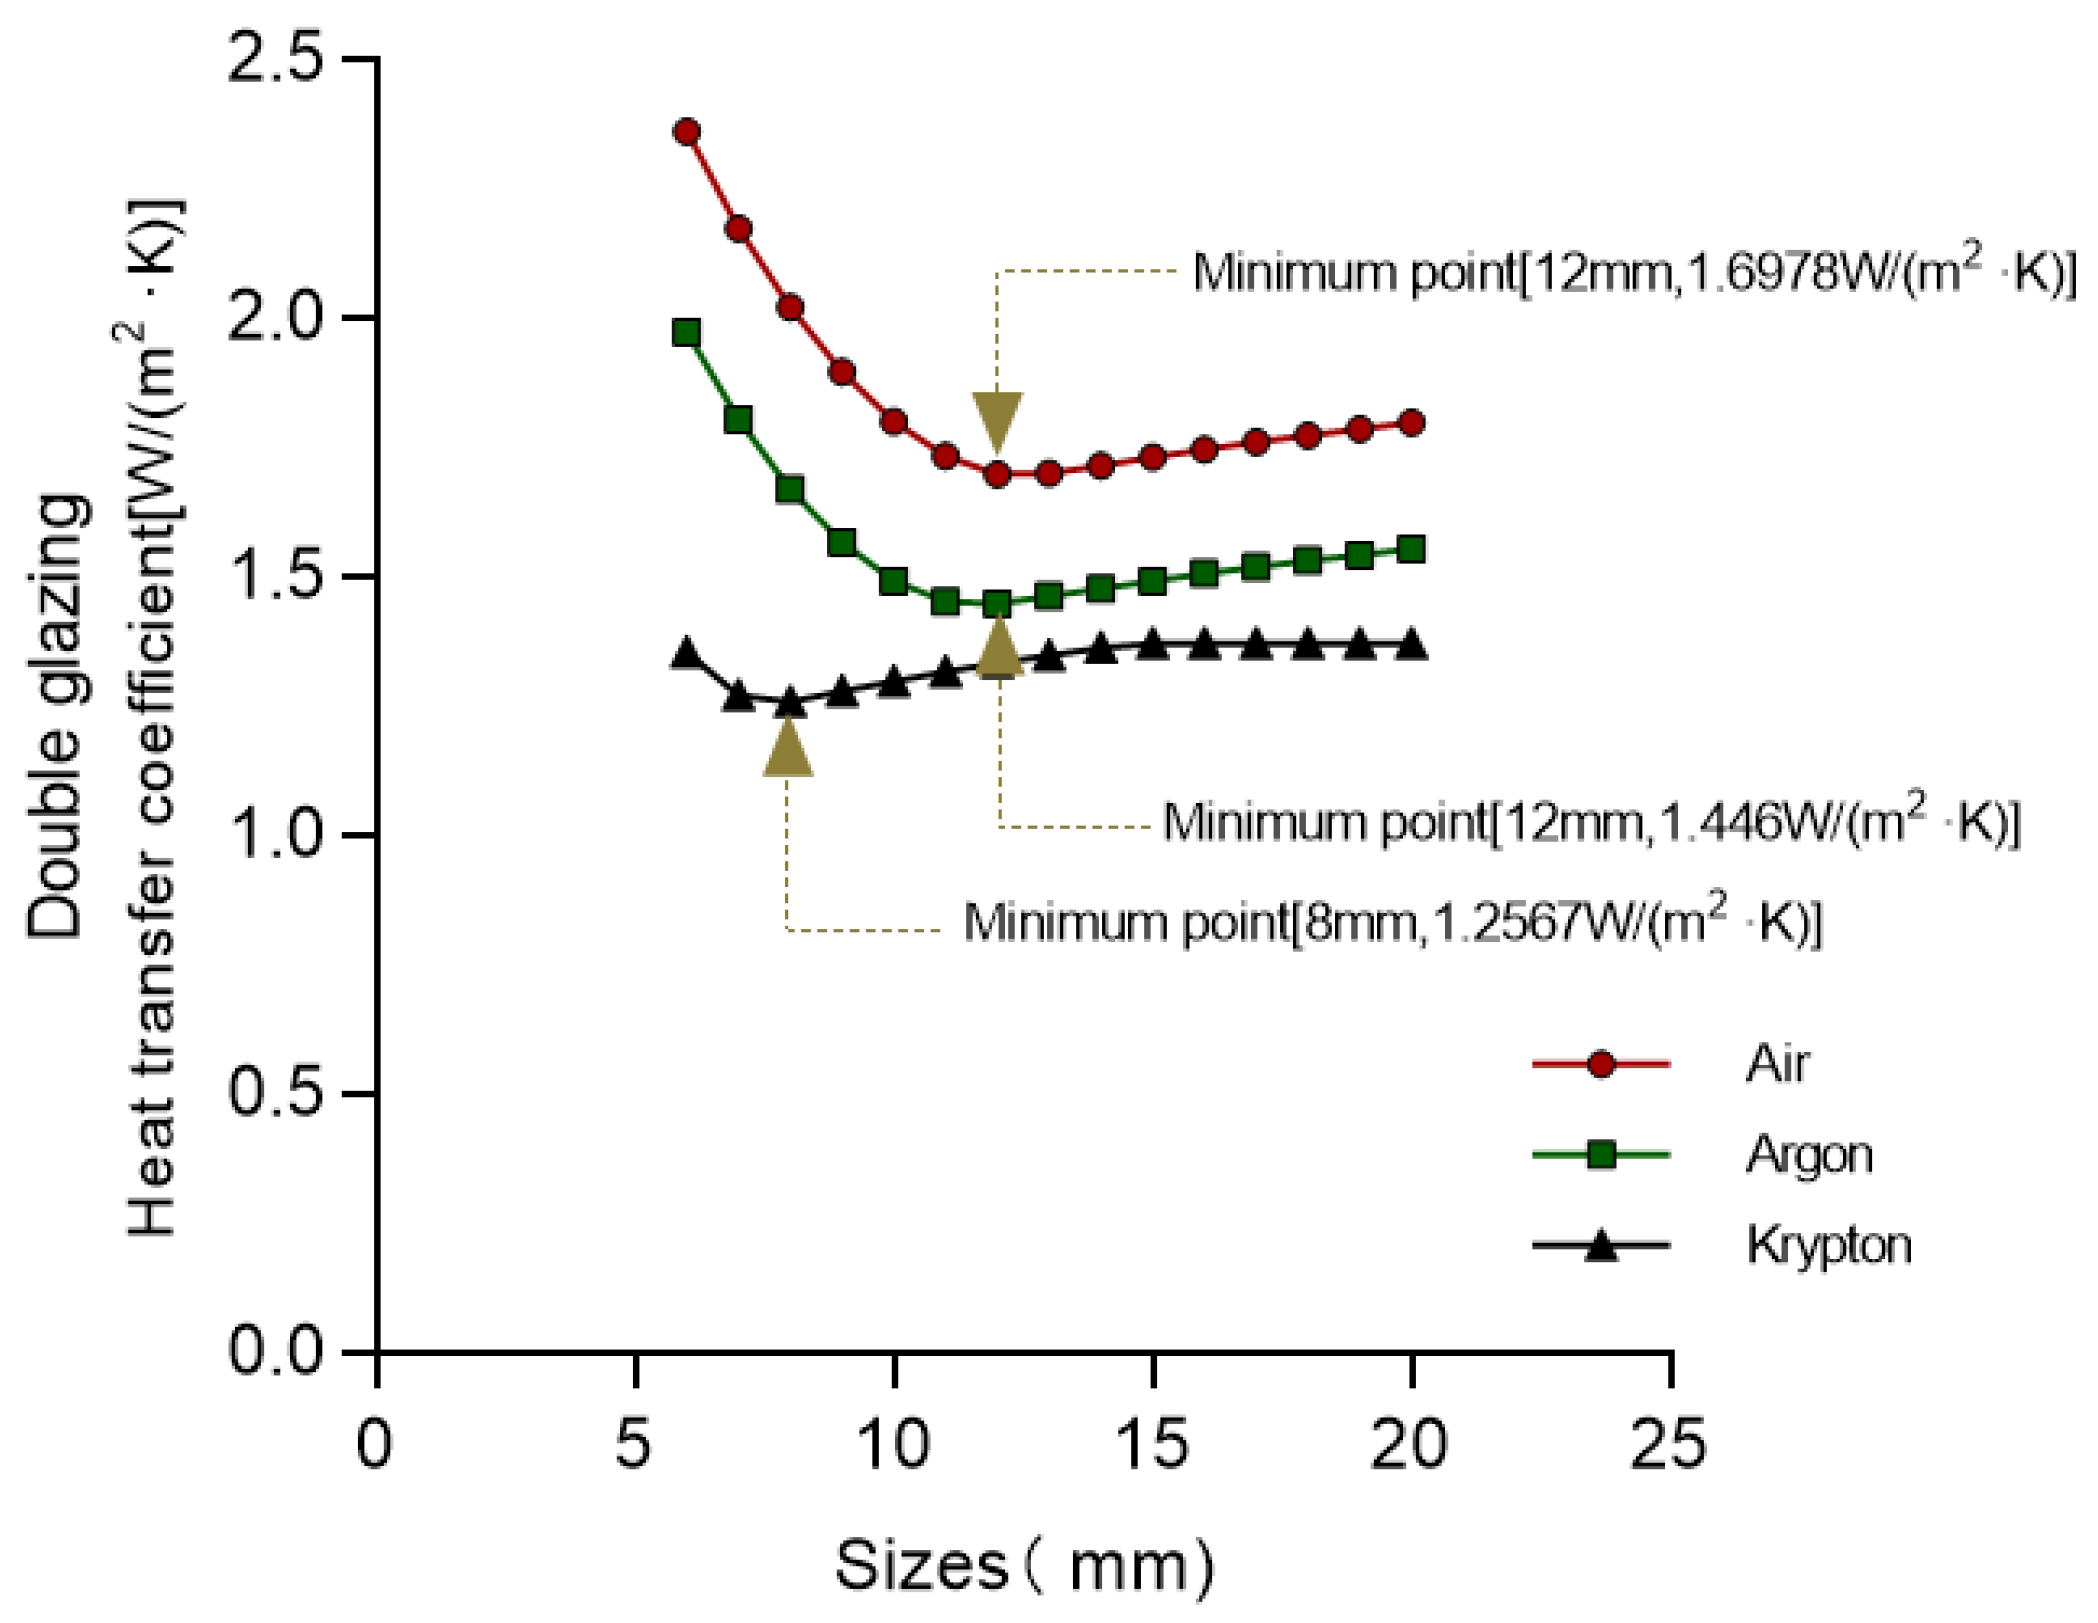
| Cavity gas types | Qualitative variable | Air/argon/krypton | Yes | |
| Cavity thickness | Quantitative variable | 6~20 mm one-by-one simulation | Yes | |
| Extruded profile | Number of profile cavities | Fixed variable | 70 Series 3-Cavity | No |
| Length of the thermal break (Figure 3b) | Quantitative variable | 25 mm, 28 mm, 30 mm, 32 mm, 35 mm, 40 mm | Yes | |
| Number of sealing channels between window frame and window sash (Figure 3c) | Qualitative variable | Two seals/three seals | Yes | |
| Shape of sealing tape (Figure 3d) | Qualitative variable | Tower tape/Long-tail tape | Yes | |
| Whether or not to set the gasket under the glass (Figure 3e) | Qualitative variable | Set shim/no shim | Yes | |
| Whether the cavity is filled with insulation material (Figure 3f) | Qualitative variable | Filled insulation/unfilled insulation | Yes | |
| Isothermal design (Figure 3g) | Qualitative variable | Linear isotherm design/non-linear isotherm design | Yes | |
| Spacer types (Figure 3h) | Qualitative variable | Aluminum spacer/composite spacer | Yes |
| Typology | Material Selection | Parameters | ||
|---|---|---|---|---|
| Glass | Outer piece of glass (Glass1): CEV11-55T_5.CSG | Conductivity | Emissivity1 | Emissivity2 |
| 1.00 W/m·K | 0.84 | 0.05 | ||
| Inner piece of glass (Glass2): Clear_5.CSG | Conductivity | Emissivity1 | Emissivity2 | |
| 1.00 W/m·K | 0.84 | 0.84 | ||
| Gas | Air: 100% air | Conductivity | ||
| 0.024069 W/m·K | ||||
| Argon: 85% Ar mixed with 15% air | Conductivity | |||
| 0.017425 W/m·K | ||||
| Kryptonite: 95% krypton mixed with 5% air | Conductivity | |||
| 0.009237 W/m·K | ||||
| Profile | Aluminum Aluminum alloys (anodized) | Conductivity | Emissivity | |
| 160.00 W/m·K | 0.8 | |||
| Sealing strip: Ethylene propylene diene monomer (EPDM) | Conductivity | Emissivity | ||
| 0.25 W/m·K | 0.9 | |||
| Under-glass gasket: Polyvinylchloride (PVC) flexible, with 40% softer | Conductivity | Emissivity | ||
| 0.14 W/m·K | 0.9 | |||
| Thermal break: Polyamide 6.6 with 25% glass fiber | Conductivity | Emissivity | ||
| 0.30 W/m·K | 0.9 | |||
| Insulation in broken-bridge cavity: Polyurethane foam | Conductivity | Emissivity | ||
| 0.05 W/m·K | 0.9 | |||
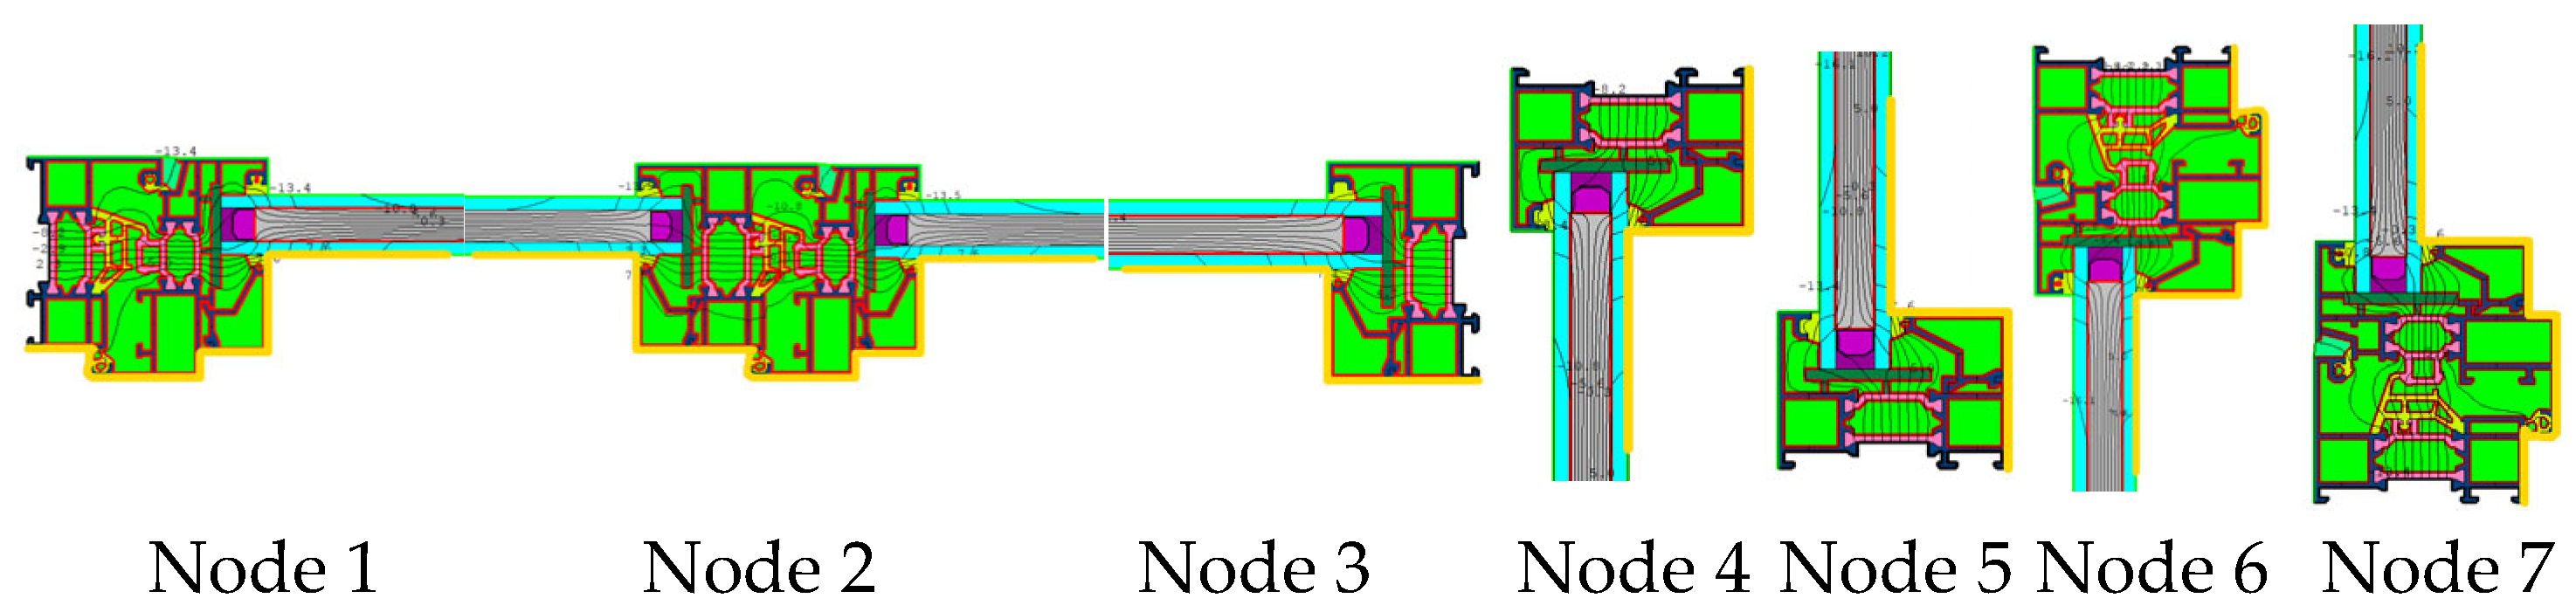
| Region | Heat Transfer Coefficient of the Frame Uf | Heat Transfer Coefficient at the Edges Ueg | SHGC |
|---|---|---|---|
| Node 1 | 3.5050 | 2.1522 | 3.4916 |
| Node 2 | 3.9583 | 2.1669 | 3.9967 |
| Node 3 | 3.7038 | 2.1610 | 3.7907 |
| Node 4 | 3.6671 | 2.1583 | 3.7519 |
| Node 5 | 3.6664 | 2.1583 | 3.7511 |
| Node 6 | 3.4722 | 2.1503 | 3.4553 |
| Node 7 | 3.4739 | 2.1497 | 3.4560 |
| Serial Number | Considerations | Heat Transfer Coefficient of the Frame | Edge Heat Transfer Coefficient | Combined Heat Transfer Coefficient of Profiles | |||||
|---|---|---|---|---|---|---|---|---|---|
| Spacer Type | Whether the Bridge is Filled with Insulation Material or Not | Number of Sealing Channels | Under-Glass Gasket | Adhesive Strip Shape | Isothermal Design | ||||
| 1 | Aluminum spacer | Insulated | 2 channels | Gasketless | Tower shaped | Straight isotherm | 4.087 | 2.1324 | 3.2623 |
| 2 | Aluminum spacer | Insulated | 3 channels | Gasketed | Tower shaped | Non-linear isotherm | 3.3476 | 2.1488 | 2.8418 |
| 3 | Aluminum spacer | Insulated | 3 channels | Gasketed | Long tail | Non-linear isotherm | 3.3535 | 2.149 | 2.8453 |
| 4 | Aluminum spacer | Uninsulated | 2 channels | Gasketed | Long tail | Straight isotherm | 4.0234 | 2.1453 | 3.231 |
| 5 | Aluminum spacer | Uninsulated | 2 channels | Gasketless | Long tail | Non-linear isotherm | 4.0199 | 2.1673 | 3.2382 |
| 6 | Aluminum spacer | Uninsulated | 3 channels | Gasketless | Tower shaped | Straight isotherm | 3.739 | 2.1108 | 3.052 |
| 7 | Composite spacer | Insulated | 2 channels | Gasketed | Long tail | Straight isotherm | 3.6025 | 1.8995 | 2.884 |
| 8 | Composite spacer | Insulated | 2 channels | Gasketless | Tower shaped | Non-linear isotherm | 3.7036 | 1.9515 | 2.9643 |
| 9 | Composite spacer | Insulated | 3 channels | Gasketless | Long tail | Straight isotherm | 2.9984 | 1.8667 | 2.5209 |
| 10 | Composite spacer | Uninsulated | 2 channels | Gasketed | Tower shaped | Non-linear isotherm | 3.7066 | 1.949 | 2.965 |
| 11 | Composite spacer | Uninsulated | 3 channels | Gasketed | Tower shaped | Straight isotherm | 3.1158 | 1.8707 | 2.5905 |
| 12 | Composite spacer | Uninsulated | 3 channels | Gasketless | Long tail | Non-linear isotherm | 3.1704 | 1.9119 | 2.6394 |
| Level | Spacer Type | Whether or Not There Is Insulation in the Broken-Bridge Cavity | Number of Sealing Channels | Under-Glass Gasket | Shape of Sealing Tape | Isothermal Design |
|---|---|---|---|---|---|---|
| 1 | Aluminum spacer | Insulated | 2 channels | Gasketed | Tower shaped | Straight isotherm |
| 2 | Composite spacer | Uninsulated | 3 channels | Gasketless | Long tail | Non-linear isotherms |
| Term (in a Mathematical Formula) | Square Sum | Degrees of Freedom | Mean Square | F | p | R2 | Adjustment of R2 |
|---|---|---|---|---|---|---|---|
| Intercept | 102.286 | 1 | 102.286 | 46,013.532 | 0.000 *** | 0.984 | 0.965 |
| Spacer type | 0.303 | 1 | 0.303 | 136.258 | 0.000 *** | ||
| Whether or not there is insulation in the broken-bridge cavity | 0.013 | 1 | 0.013 | 5.923 | 0.059 * | ||
| Number of sealing channels | 0.352 | 1 | 0.352 | 158.296 | 0.000 *** | ||
| Under-glass gasket | 0.009 | 1 | 0.009 | 3.827 | 0.108 | ||
| Shape of sealing tape | 0.008 | 1 | 0.008 | 3.769 | 0.11 | ||
| Isothermal design | 0 | 1 | 0 | 0.082 | 0.786 |
| Category | Spacer Type | Whether or Not There Is Insulation in the Broken-Bridge Cavity | Number of Sealing Channels | Under-Glass Gasket | Adhesive Strip Shape | Isothermal Design |
|---|---|---|---|---|---|---|
| K1 | 18.471 | 17.319 | 18.545 | 17.358 | 17.676 | 17.541 |
| K2 | 16.564 | 17.716 | 16.49 | 17.677 | 17.359 | 17.494 |
| K1 avg | 3.078 | 2.886 | 3.091 | 2.893 | 2.946 | 2.923 |
| K2 avg | 2.761 | 2.953 | 2.748 | 2.946 | 2.893 | 2.916 |
| R | 0.318 | 0.066 | 0.342 | 0.053 | 0.053 | 0.008 |
| Optimal level of factors | Composite spacer | Insulated | 3 seals | Gasketed | Long-tail tape | Non-linear isotherms |
| Order of priority of factors | Number of sealing channels > spacer types > whether or not the broken-bridge cavity is filled with insulation > under-glass gasket > shape of sealing tape > isothermal design | |||||
| Heat Transfer Coefficient of Glass (5 mm (low-e) + 12 A + 5 mm) | Glass Selection (5 mm (low-e) + 8 Kr + 5 mm) Heat Transfer Coefficient | Reduction Rate |
|---|---|---|
| 1.6978 | 1.2567 | 25.98% |
| Node | Heat Transfer Coefficients at Each Node of a Typical Object | Heat Transfer Coefficients at Each Node for the Optimal Combination of Whole Window Performance | Peak Reduction Rate (Frame/Edge) | ||
|---|---|---|---|---|---|
| Heat Transfer Coefficient of the Frame, Uf | Heat Transfer Coefficient at the Edge, Ueg | Heat Transfer Coefficient of the Frame, Uf | Heat Transfer Coefficient at the Edge, Ueg | ||
| Node 1 | 3.5050 | 2.1522 | 2.4175 | 1.4992 | 31.03%/30.34% |
| Node 2 | 3.9583 | 2.1669 | 2.6076 | 1.5089 | 34.12%/30.37% |
| Node 3 | 3.7038 | 2.1610 | 2.5283 | 1.5123 | 31.74%/30.02% |
| Node 4 | 3.6671 | 2.1583 | 2.5217 | 1.5141 | 31.23%/29.85% |
| Node 5 | 3.6664 | 2.1583 | 2.5218 | 1.5141 | 31.22%/29.85% |
| Node 6 | 3.4722 | 2.1503 | 2.4240 | 1.4951 | 30.19%/30.47% |
| Node 7 | 3.4739 | 2.1497 | 2.4225 | 1.4945 | 30.27%/30.48% |
| Serial Number | Type of Factor | Specific Factors | Costs (Manufacturing, Production, etc.) |
|---|---|---|---|
| 1 | Spacer type | Aluminum spacer | About 1.5 RMB/m |
| Composite spacer | About 8.5 RMB/m | ||
| 2 | Whether or not there is insulation in the broken-bridge cavity | / | / |
| Polyurethane foam | About 1.0 RMB/meter | ||
| 3 | Gas type | Atmosphere | / |
| Krypton | About 450 RMB/m3 | ||
| 4 | Length of the thermal break | 25 mm | About 2.5 RMB/m |
| 40 mm | About 7.0 RMB/m | ||
| 5 | Shape of the sealing tape | Tower-shaped tape | About 1.0 RMB/m |
| Long-tailed tape | About 1.5 RMB/m |
Disclaimer/Publisher’s Note: The statements, opinions and data contained in all publications are solely those of the individual author(s) and contributor(s) and not of MDPI and/or the editor(s). MDPI and/or the editor(s) disclaim responsibility for any injury to people or property resulting from any ideas, methods, instructions or products referred to in the content. |
© 2025 by the authors. Licensee MDPI, Basel, Switzerland. This article is an open access article distributed under the terms and conditions of the Creative Commons Attribution (CC BY) license (https://creativecommons.org/licenses/by/4.0/).
Share and Cite
Yang, F.; Sun, Y.; Li, L.; Zhang, Y.; Sun, L.; Wang, D.; Sun, F.; Liu, L. Research on the Factors Influencing Broken-Bridge Aluminum Exterior Windows with the Goal of Thermal Performance Improvement. Buildings 2025, 15, 2101. https://doi.org/10.3390/buildings15122101
Yang F, Sun Y, Li L, Zhang Y, Sun L, Wang D, Sun F, Liu L. Research on the Factors Influencing Broken-Bridge Aluminum Exterior Windows with the Goal of Thermal Performance Improvement. Buildings. 2025; 15(12):2101. https://doi.org/10.3390/buildings15122101
Chicago/Turabian StyleYang, Feining, Yu Sun, Lei Li, Yu Zhang, Lingyun Sun, Dong Wang, Fengjun Sun, and Lin Liu. 2025. "Research on the Factors Influencing Broken-Bridge Aluminum Exterior Windows with the Goal of Thermal Performance Improvement" Buildings 15, no. 12: 2101. https://doi.org/10.3390/buildings15122101
APA StyleYang, F., Sun, Y., Li, L., Zhang, Y., Sun, L., Wang, D., Sun, F., & Liu, L. (2025). Research on the Factors Influencing Broken-Bridge Aluminum Exterior Windows with the Goal of Thermal Performance Improvement. Buildings, 15(12), 2101. https://doi.org/10.3390/buildings15122101