1. Introduction
A specific feature of reinforced concrete structural elements is that, during operation, cracks appear in them. Crack initiation in reinforced concrete members may be caused by various factors, such as concrete shrinkage, external loads, pressure from corrosion products, or high temperatures resulting from fire or technological processes at production facilities. Depending on the combination of forces and environmental factors, different types of cracks can be distinguished. Various criteria are used in engineering practice to evaluate these cracks. Generally, concrete’s tensile strength in the direction of the main tensile stresses, ultimate tensile strains, or fracture energy can be used as criteria for crack appearance. For reinforced concrete members, crack opening is correlated with bonding between the reinforcement and concrete.
Steel reinforcing bars in concrete are protected from corrosion by a passive oxide film that forms on their surface due to the concrete’s natural alkaline environment. However, factors such as concrete carbonization or chloride action can destroy this protective layer. Andrade et al. [
1] considered the influence of the ratio of corrosion damage depth to reinforcing bar radius on crack mouth opening displacement (CMOD). They derived an analytical relationship based on the generalization of experimental datasets. The formation of corrosion products significantly decreases the adhesion of the bars to the concrete, making reinforced concrete structures more vulnerable to impact. Turan et al. [
2] investigated the relationship between the loss of cross-sectional area of reinforcing bars due to corrosion and the width of corrosion cracks on the surface of members. This enabled them to estimate the actual load-bearing capacity of corrosion-damaged members using features available for visual inspection and measurement. The authors also studied how loss of cross-sectional area affects members’ ability to absorb impact energy, which is important in seismic design.
The presence of cracks and the parameters of the stress–strain state in the region adjacent to the crack affect the deformations and the redistribution of forces in the structural component. Therefore, this phenomenon should be taken into account when evaluating the serviceability limit state, as well as the parameters of the ultimate limit states, including those resulting from accidental actions. A number of studies discuss the physical and design models of deformation in the tensile zone of reinforced concrete structures after the formation of cracks, the phenomenon of concrete deformation at the faces of cracks of various types, etc. Rasmussen [
3] points out the need for an advanced study of the resistance of reinforced concrete structures to cracking, as well as the importance of a more comprehensive reflection of the real physical phenomena in the design models for serviceability and ultimate limit states.
Based on the analysis of a large amount of experimental data, the following factors influencing the crack opening width in reinforced concrete members were identified in [
4,
5]: concrete strength, stresses in the reinforcing bars, bar diameter, reinforcement ratio, and concrete cover thickness.
Existing models often use conservative assumptions that result in a lack of physical transparency [
6,
7]. Despite the nonlinear change of the crack profile in reinforced concrete structures under various stress states that has been established experimentally [
8,
9,
10] and substantiated theoretically [
8,
11], a number of standards and codes [
12,
13,
14,
15,
16] still continue to use semi-empirical design relationships that employ the model of linear change of the crack profile to calculate the crack opening width. In [
17], Dey et al. focused on the evaluation of the bond between the reinforcement and the concrete in the areas between cracks. In contrast, recent studies [
8,
9,
10] using more advanced tools to determine crack opening show that the crack opening width is defined not only by the bond parameters in the area between cracks, but also by the distribution of strains in concrete and reinforcement near the crack faces, by the crack profile, by the shear along the crack face, by the strength of concrete, and other factors. Therefore, it is important to have a more universal model that describes the deformation of reinforcement and concrete in the vicinity of crack faces and is suitable for different types of stress states of reinforced concrete structures. The research in this direction should create a stronger link between the serviceable and ultimate limit states of a structure and lead to a more efficient application of both concrete and reinforcement.
A similar opinion about the necessity of improvement of physical and computational models was stated in [
8,
18]. The authors proposed one of the block models perfect for calculating the width of normal crack opening in reinforced concrete beams. This model accounts for two types of cracks: primary and secondary cracks. Primary cracks are flexural cracks that intersect most of the tensile zone and almost reach the neutral axis. Secondary cracks occur in deep beams. They are always smaller than primary cracks and are located near the tensile reinforcement. The same idea to divide beams into deep and normal ones is proposed in [
3]. The peculiarity of the considered model is that it considers the stage of stabilized cracking. The strains of the bending element are estimated by averaging the strains of a reinforced concrete block with the length of the average crack spacing. The profile of primary cracks in deep beams has a bilinear shape. Despite the detailed consideration of a number of physical laws of deformation and cracking in bending beam structures, the considered model remains within the framework of the Bernoulli hypothesis and the hypothesis of averaging of reinforcement strains in the tensile zone. Therefore, this model describes the crack opening in a bending element strictly enough when a network of only regular cracks perpendicular to the longitudinal axis of the structure appears.
In [
19], the shear in an inclined crack of a reinforced concrete structure was considered. It is shown that there are seven elementary effects on the shear behavior of a reinforced concrete element in an inclined crack. The shear crack propagation theory (SCPT) formulated there allows the analysis of the process of shear loading, including crack propagation, up to the exhaustion of the shear bearing capacity. In contrast to a number of well-known shear strength models, e.g., [
20,
21], where the depth of the compression zone is determined by the Bernoulli–Navier hypothesis, neglecting the tensile strength of the concrete, the present model takes into account the change of the depth of the compression zone as a function of the magnitude of the applied bending moment and by considering the tensile strength of the concrete in bending. Classen [
19] applied an approach in which the distance between primary cracks is assumed to be 0.7 of the structure’s depth, unlike other models for determining the distance between primary cracks in beam structures under the action of moment and shear force [
20,
22,
23]. The crack is represented here as two inclined crack branches with angles β1, β2, and a horizontal section of the bond failure crack along the reinforcement. The kinematic model of a shear crack with two branches in the tensile and compression zones takes into account crack opening (mode I) and shear crack slip (mode II), as well as the dowel effect in the tensile reinforcement and the strains in the uncracked concrete of the tensile and compression zones. An iterative procedure is proposed to determine the kinematic behavior of each point along the crack, such as the crack opening and crack slip, as well as the distance between the crack tip and the center of rotation. As a result, the above algorithm rigorously models the process of inclined crack opening in the zone of combined action of moment and shear force in beam structures. The results of calculations using this model, as shown in [
19,
24], satisfactorily capture the test data for beam structures.
The overwhelming number of studies in this area, for example [
6,
7,
10,
25,
26,
27,
28], are devoted to solving the traditional tasks of reinforced concrete theory; i.e., estimation of the mean distance between irregular cracks, investigation of the mechanism of opening of such cracks in tension, tension with bending, study of the bonding at the reinforcement–concrete interface [
17], and other similar problems. All these models are usually related to beam structures, with uniaxial or biaxial stress states. Usually, the appearance and opening of a network of regular or irregular cracks in the tensile zones is studied, with subsequent estimation of the average distances between the cracks. At the same time, the physical aspect of these models remains within the framework of the traditional views of reinforced concrete theory. These models do not take into account all the types of cracks found. They do not reflect the physical peculiarities and effects for reinforced concrete structures made of new types of concrete and fiber-reinforced concrete, the formation of unit cracks under complex stress states [
29,
30,
31], and the consideration of the real properties of these materials. Traditional models based on averaging of reinforcement strains between cracks in tensile zones of structures do not work and provide a very rough approximation when such cracks are formed [
32]. There are no proposals for models of cracking in reinforced concrete structures under a static–dynamic loading regime. These models are strongly required when checking the robustness of operated reinforced concrete structures under accidental actions [
33,
34,
35,
36].
The analysis of the standards of a number of countries [
12,
13,
14,
15,
16], which are used in the practice of design of reinforced concrete structures, shows that the determination of the parameters of the crack opening width is still based on the simplest models developed for beam structures made of concrete of relatively low strength. They do not take into account a number of newly established important parameters for the assessment of serviceability limit states or take them into account by semi-empirical relations. Thus, when designing high-strength concrete (HSC) structures, SP 311.1325800 [
13] recommends using the models of SP 63.13330 [
12], developed for the design of reinforced concrete structures made of ordinary reinforced concrete, to estimate the parameters of serviceability limit states. At the same time, tests of HSC structures [
29,
30,
31,
37] have shown that their structural behavior is quantitatively and qualitatively different from the behavior of structures made of normal strength concrete. For example, it was found [
29,
30] that the relative range of HSC structure performance in the serviceability limit state conditions is more than two times less that for structures made of ordinary strength concrete.
The aim of this study was to develop an analytical model for calculating the crack opening width in reinforced concrete structures, based on the analysis of experimentally established new physical phenomena of the behavior of reinforced concrete structures under different types of stress states. The development of the analytical model included the following stages: (1) formulation of initial principles and hypotheses for the development of a model of crack opening in reinforced concrete structures; (2) construction of a model for opening of irregular and unit cracks using a double-cantilever element (DCE), which takes into account the deformation effect in the concrete at the crack faces and the bonding of the reinforcement with the concrete in the zone of crack faces; (3) experimental verification of the reliability of the proposed semi-analytical model and development of the algorithm for its implementation.
2. Model for Opening of Irregular and Unit Cracks
The crack-opening model presented in this study is based on the Thomas–Kolchunov hypothesis, which is confirmed by the results of experimental investigations [
5,
38,
39,
40,
41,
42]. It takes into account all stages of the component’s performance [
5,
38,
39,
40,
41,
42]. The essence of the hypothesis is as follows. Crack initiation in a reinforced concrete member is considered as an accumulation of relatively conventional concentrated mutual displacements (slip) of reinforcement and concrete in the areas located on both sides of the crack. This takes into account the deplanation (violation of Bernoulli’s hypothesis) of concrete in the section with the crack. The hypothesis related to [
5,
39,
40,
43,
44,
45,
46] revealed the effects of the stress–strain state arising in reinforced concrete member as a result of violation of concrete continuity.
Thus, the analytical model of crack opening is based on the following principles.
Appearance of a crack of any type results in a deformation effect in a reinforced concrete member. This effect means that the crack surfaces are restrained by the reaction of a reinforcing bar at the brittle fracture of a tensile concrete matrix. Thus, the surfaces do not satisfy the Bernoulli hypothesis and the crack profile becomes nonlinear.
The crack opening process in a reinforced concrete member can be modeled by a double-cantilever element (DCE) and is based on an energy principle that combines the deformation parameters of traditional reinforced concrete theory and the parameters of fracture mechanics.
Crack opening in a reinforced concrete element in bending is defined as the value of relative mutual displacements (slip) of concrete and reinforcement through the anchorage zone, which is determined from the equilibrium of the block located between the section with a crack and the section where these displacements are equal to zero. It also takes into account the dowel effect in the reinforcement and the shear along the crack.
The development of a DCE is based on the analysis of the physical processes during deformation of reinforced concrete structures under different stress conditions. The process of crack formation and crack opening in experiments uses more advanced tools such as digital cameras with a recording frequency of 600 and more frames per second. Non-destructive inspection and monitoring techniques such as digital image correlation (DIC) [
47,
48] or machine vision techniques [
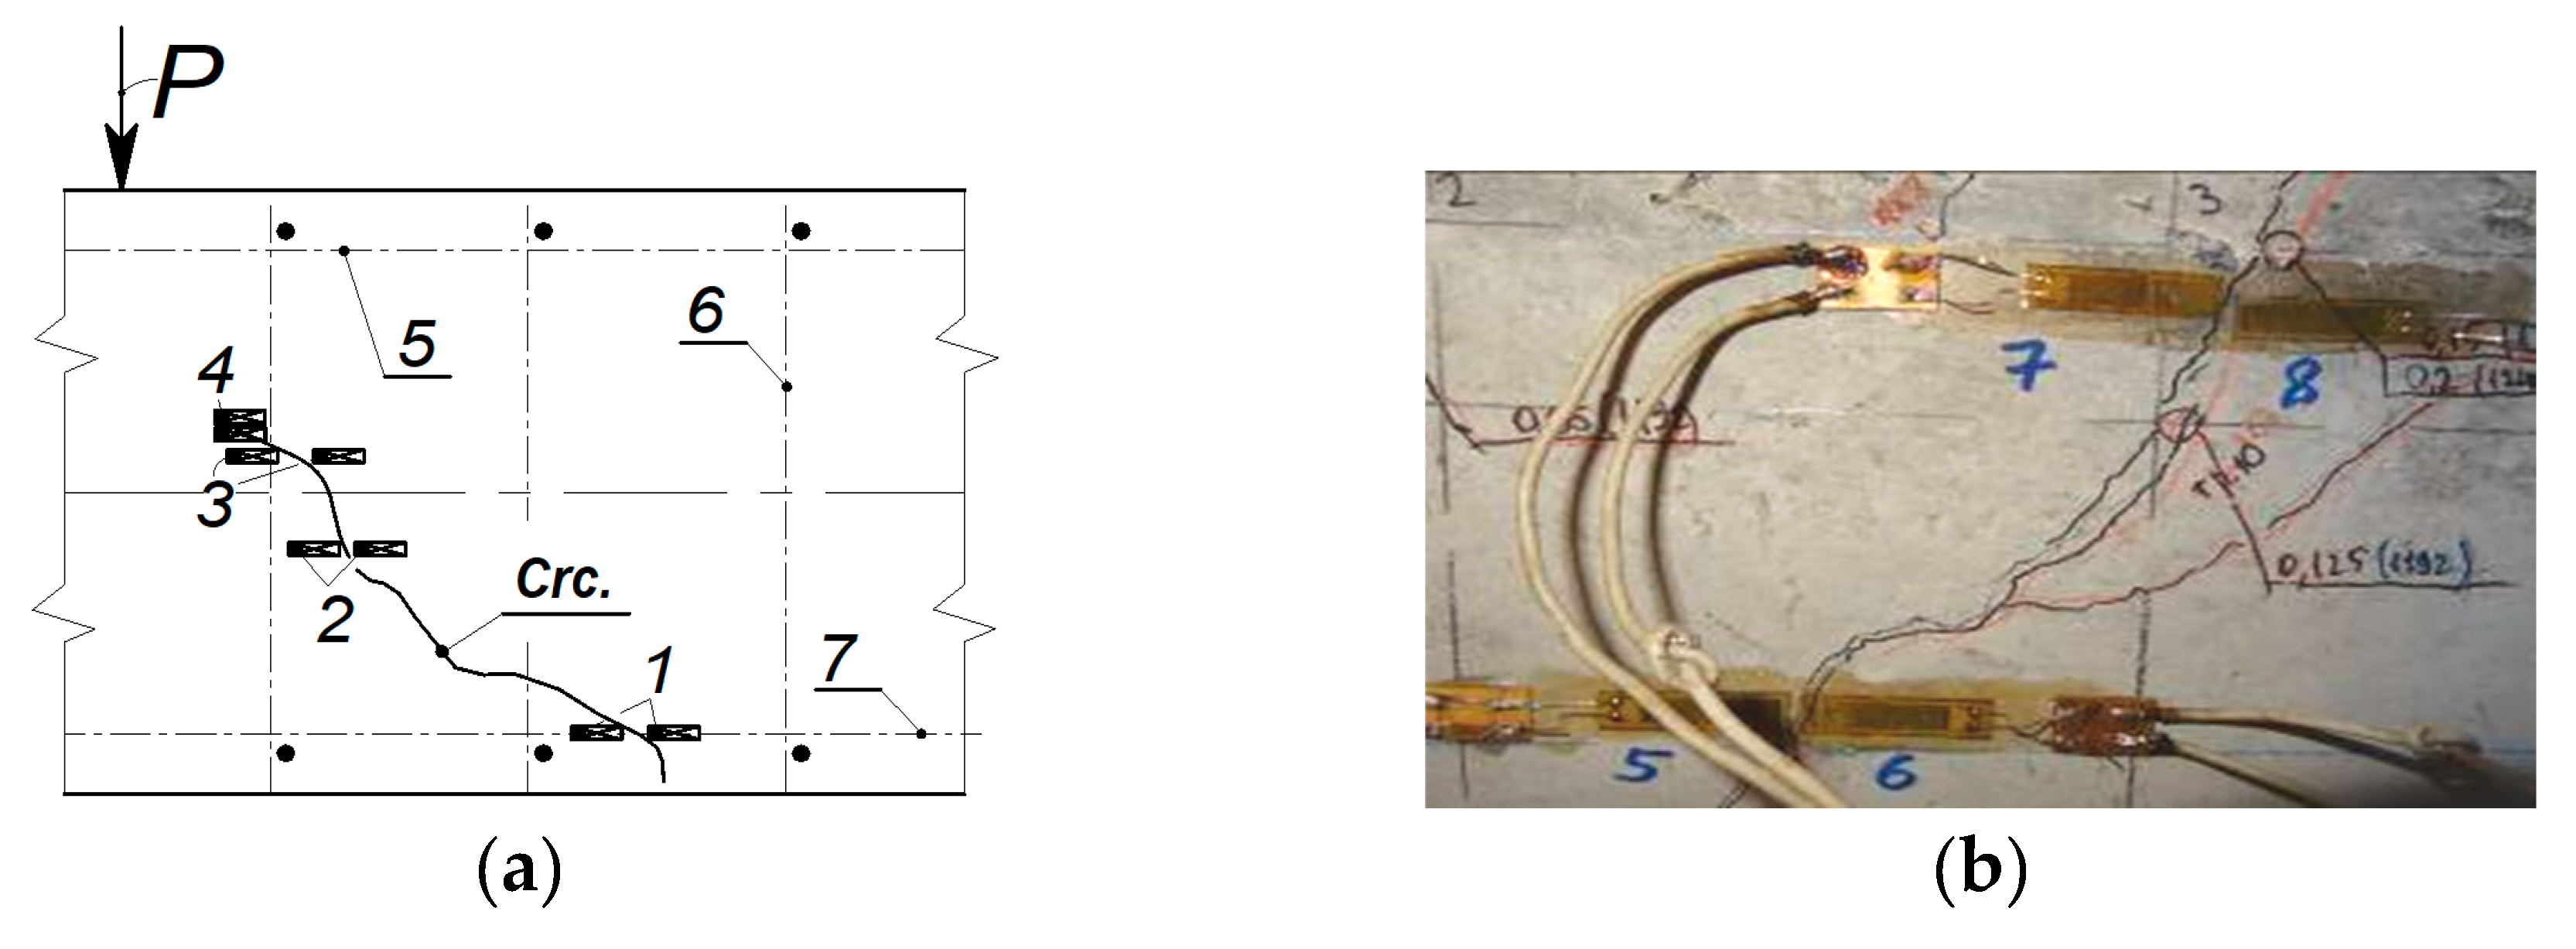
49] can also be used to determine the stress–strain state parameters of the concrete in the region adjacent to the crack. Crack opening usually begins in the most stressed tensile zone of the structure at the level of the axis of the reinforcing bar or at some distance from this axis. The crack propagates in the direction of the compression zone, as shown in
Figure 1a.
The reinforcing bar is the tie that prevents the crack opening and its development. On the other hand, the crack development in the direction of the compressed zone is blocked by the tensile resistance of the concrete matrix. This tie affects the concrete strains in the vicinity of the crack faces and causes nonlinear changes in the profile of the crack opening. Therefore, the concrete exhibits the so-called deformation effect. The crack profile curves and acquires a form close to the shape of an ellipse, as shown in
Figure 1b. Concrete strains in the near-reinforcement zone change from tension to compression, as presented in
Figure 1c. The qualitative pattern of this effect was confirmed by the photoelasticity method the study [
50].
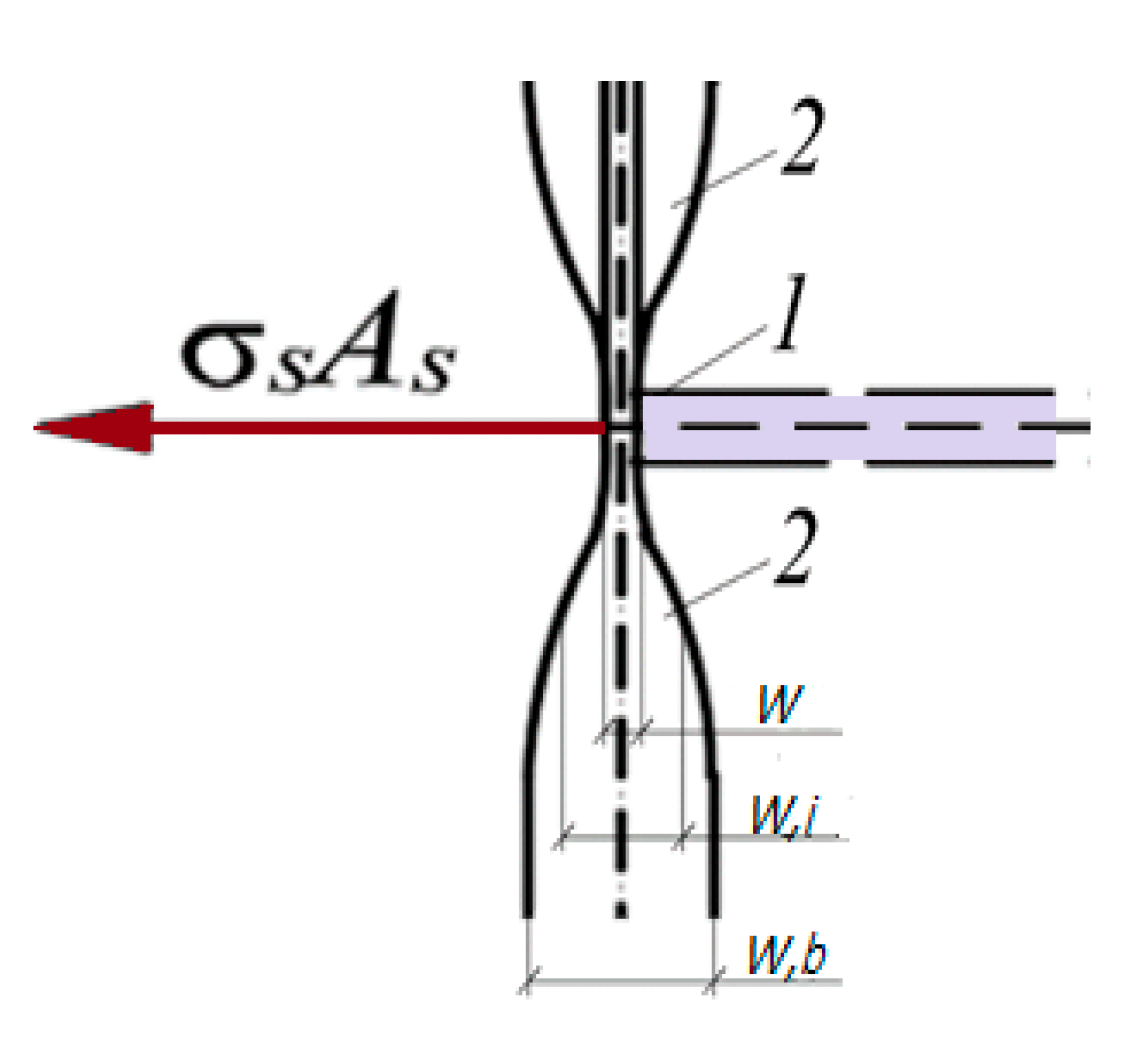
According to the described physical process, the crack opening, i.e., the increase of its surface during the fracture of the concrete matrix, can be modeled by fracture mechanics parameters. The strain of the rebar and the concrete near the crack surfaces can be defined by the strain in the crack. The double-cantilever element (DCE) model was adopted to describe the above. For the tensile reinforced concrete element under the action of force Ns, the design scheme of the DCE is as shown in
Figure 2a. The DCE considers a nonlinear crack profile that has a minimum opening at the level of the tensile reinforcement axis and an increase in the opening as it moves away from the reinforcement bar. In the vicinity of the reinforcement, the stress state in the concrete changes due to the deformation effect. For the bent reinforced concrete element shown in
Figure 2b, the distance between the crack faces is also minimal in the near-reinforcement zone. Then, as the distance from the rebar increases up to two or three rebar diameters, the crack width has a maximum opening and gradually decreases as it approaches the compression zone.
The crack profile, and therefore the DCE design scheme, is slightly different and close to triangular for the variant of a compressed element with multi-row reinforcement, as shown in
Figure 2c.
The crack opening surface is determined from the following energy balance relations:
The crack length
hcrc must satisfy the following condition:
where ζ
cu is the specific surface of a crack; δ
V is the reduction of the potential energy of the member during crack propagation by a small value of surface δ
A; δ
W is the additional work performed on the member at crack propagation by the small value of surface δ
A;
∂C and
∂P are the increment in pliability and load in the double-cantilever element;
is the function, which depends on the relation ε
i–σ
i of strain and stress intensity for concrete;
is the elastic–plastic function of the load.
In Expression (1), a transformation of the fracture mechanics functional is performed to remove the static indeterminacy of the DCE separated from the member. This functional relates the desired crack formation surface (ζ
cu) to the potential energy increment ∂
V and the additional work during crack development ∂
W, which are expressed through the pliability function. For a reinforced concrete member, this relationship in terms of crack spacing can be rewritten as follows:
where η is the coefficient accounting for the reduction of the spacing between adjacent cracks. This coefficient is defined as the ratio of the stress in the tensile reinforcement in the spatial cross section to the stress at which the crack appears.
The crack spacing scrc,i is the most important parameter needed to determine the crack opening width in reinforced concrete structures. The crack length, hr, is determined from the following fracture mechanics relation (2).
The described cracking process in the structure requires a modification of the traditionally used model using the mean strains of reinforcement and concrete, which is used to estimate the strains of concrete and reinforcement in the tensile zone of the reinforced concrete element in the areas between irregular and single cracks [
29,
30]. For different types of irregular and single cracks, the crack opening process can be described more strictly by a model in which the strains in concrete and reinforcement are determined for a block between cracks when a network of irregular cracks occurs, as shown in
Figure 3a, or by a model for a block in the zone of a single crack when only a single crack occurs in the structure, as shown in
Figure 3b.
According to this model, the concrete tensile strains ε
ct(
x) are determined from the equilibrium of the block located between the section with a crack and the section passing at a distance
t*+
x from the crack, as can be seen in
Figure 3:
where
t* is the distance along beam axis from the crack face to the point at which the tangential stresses in concrete take zero values, as shown in
Figure 2.
The relative mutual displacements (slip) of reinforcement and concrete are determined by the formula:
where ε
s(
x) is the strains of reinforcement; ε
ct(
x) is the strains of concrete in the section with coordinate
x.
On the other hand, the relative mutual displacements of reinforcement and concrete are expressed in the differential equation:
The solution of the differential Equation (6) is as follows:
The integration constant
C in (7) is determined from the boundary condition by the formula:
In Formula (8), the parameters that take into account the boundary tensile strains of concrete, the effect of violation of concrete continuity, the geometric characteristics of the cross section, as well as the bonding of reinforcement and concrete are determined as follows:
where
G =
G(λ) is the secant modulus of bond–slip between rebars and concrete;
Q is the shear force acting in the section;
Ss is the perimeter of one longitudinal reinforcement bar; the coefficient δ takes into account the depth of the beam cross section and the depth of the compressed zone;
K is the parameter that takes into account the effect of concrete continuity violation in the case of crack formation;
D1j is the function which depends on the forces acting in the design section as well as properties of concrete and steel rebars, bond–slip between reinforcement bars and concrete.
In Formula (11), ε
s = [σ
s/(ν
s·
Es)] is the strain of tensile reinforcement in the crack. Δ
T = 2·π·
r·
ts·σ
ct,c is the equivalent tangent force between reinforcing bars and concrete adjacent to the crack faces, where
ts is the distance from the axis of the tensile reinforcement to the point at which the tangential stresses take zero values, as shown in
Figure 2b.
The compressive stress in the concrete near the reinforcement adjacent to the crack σct,c should meet the conditions σct,c ≤ fc and σct,c ≤ (2·π·r/b)·0.5·fc.
In the beams experiencing bending with torsion, the value of Q is assumed to be equal to the generalized support reaction Q = Rsup.
The coefficient δ is calculated by the formula:
where ξ = (
xk/
h0) is the relative depth of compressed concrete in the cross section; γ = (
h/
h0) is the ratio of the total cross-section depth to effective one.
By performing the mathematical transformations, the formula is obtained for determining the tensile concrete strains in the cross section passing at a distance
x +
t* from the crack:
In Expression (14), f* is the function that depends on the completeness factor ωct(x) of the strain diagram and the plasticity factor νct(x) of the tensile concrete in section x at the area between the cracks, respectively. In practice, the product of these coefficients can be taken as follows: ωct(x)·νct(x) ≈ 0.5.·Act(x) is the area of concrete in tension at the portion x.
Using Condition (4) and Formula (10), the following relation is obtained:
where ν
c is the factor of plasticity of compressive concrete, which takes the value ν
c = 0.45 for the serviceability limit state; ε
ct,u is the ultimate tensile strain of concrete that is taken equal to ε
ct,u = 2·
fct·
k*/
Ec, where
k* = 1.8.
By solving Equation (15) in terms of crack spacing
scr at the considered stress level of the structure, we obtained:
where parameter
B4 is defined as follows:
Analysis of the parameters in Formula (16) shows that the increase of strain in the reinforcement with increasing load on the structure causes a decrease in the distance between the cracks. This fully reflects the physical meaning of the considered phenomenon established by tests of beam structures.
Cracking in the structure continues until the stabilization of the crack spacing at a certain load level. For low-strength concrete, cracking continues until the structure fails. In this case, in accordance with the considered design model, not one but several cracking levels are distinguished:
By comparing the current scr and level scr,i crack spacing values, one can define the possibility of subsequent levels of crack formation.
If we know the cracking levels along the longitudinal and transverse reinforcement, we can theoretically draw a complete pattern of different types of cracks in a reinforced concrete structure.
The appearance of a new cracking level corresponds to the load level at which the following inequality is fulfilled:
where
scr,i is the spacing between adjacent cracks at
ith cracking level as shown in
Figure 2b;
scr,i-1 is the same at (
i − 1)th cracking level;
scr,i,rig,
scr,i,lef are the spacing between crack appearing at (
i − 1)th cracking level and a new crack appearing at
ith cracking level on the right and left sides respectively.
When a structure transfers to the next level of cracking, it is necessary to take into account the coefficient of reduction of the spacing between adjacent cracks η
crc, which is determined as follows:
where ε
s is the tensile strain in reinforcement in the design section; ε
s,cr is the strain in tensile reinforcement in the design section at the moment when a crack appears.
The crack opening width at the level of the longitudinal reinforcement bar or transverse reinforcement bar is defined as follows:
The model considers the formation of multiple cracks in ordinary heavy concrete. In this case, the spacing between cracks at different cracking levels must be determined. This takes into account the effect of decreasing crack spacing as the load increases. In some cases, this may lead to stabilization or a reduction in the width of cracks formed at previous levels due to the redistribution of forces and deformations when new cracks appear. Substituting expressions for all parameters in Formula (22) and integrating it produces an analytical relation for an irregular crack opening width in ordinary concrete.
For high-strength concrete, where a single crack can lead to failure, the opening width of a single crack must be calculated. In this case, the calculation is based on the length of the reinforcing bar pulled out rather than the spacing between cracks:
where
f** is the function which accounts for violation Bernoulli’s hypothesis in the section with a crack, as shown in
Figure 4, and depends on the diameter of the longitudinal reinforcement ds and the radius r of the boundary layer, which is accepted as the radius of the protective layer; φ
1 is the coefficient that accounts for duration of the load action and equals to 1.0 for short-term loading and 1.4 for long-term loading; φ
2 is the coefficient that accounts for the profile of the reinforcement bars, which equals 0.5 for ribbed rebars and 0.8 for plane rebars; φ
3 is the coefficient that accounts for the stress state of the structure and equals 1.0 for flexure and eccentrical compression, 1.1 for combined action of bending moment and torque;
scrc,ult is the limit crack opening width according to standards [
12,
13,
14,
15,
16].
If only a single crack appears in the structure, as can be seen in
Figure 3b, the integration of the expressions for relative mutual displacements in Formula (24) is performed for two sections located on either side of the crack at a length of 0.5·
scrc, equal to the length of the anchorage zone presented in
Figure 1a.
The analysis of Formula (24) obtained in the present study shows that the proposed relationship for determining the crack opening width is a modification of the hypothesis of Thomas [
44], which is still widely used in scientific research [
51,
52].
The main advantage of the double-cantilever element model is that it considers the physical nature of opening cracks of different types. This allows it to be used to calculate the width of cracks and the stiffness of structures under different types of loading, including the combined action of bending moments, shear forces, and torques, based on a unified methodological approach.
The parameters of the double-cantilever element model presented in this study were calibrated for single quasi-static loading conditions. In order to use this model for cyclic or dynamic loading, or to account for high-temperature effects, it is necessary to calibrate the parameters to take into account the peculiarities of the deformation of the reinforcing bars, the concrete, and their bonding under these conditions.
The model can be applied to ultra-high-strength concrete, fiber concrete, lightweight concrete, and self-compacting concrete, and concrete based on recycled aggregates. In these cases, it will be necessary to calibrate the model parameters to account for the peculiarities of the bond–slip interaction between the reinforcing bars and the concrete, as well as the fracture energy per unit area of crack propagation. For concretes with dispersed reinforcement, such as fiber concretes, there is a bridge effect consisting of the partial transfer of forces through fibers embedded at the crack edges. Thus, the stress–strain diagram (or diagram for conditional crack opening width) for fiber concrete will have an expanded part after tensile strength is reached.
3. Experimental Verification of Semi-Analytical Model of Crack Opening in Reinforced Concrete Structures
3.1. Design of Specimens and Test Method
For experimental verification of the semi-analytical model of crack opening in reinforced concrete structures presented in this paper, a methodology of experimental investigations of reinforced concrete members under different stress states was developed. The following types of specimens were considered:
- -
Beams with a rectangular cross section made of ordinary heavy concrete;
- -
Beams with a square or box cross section made of high-strength concrete;
- -
Beams with a layered cross section.
The beams were designed according to the requirements of SP 63.13330.2018 [
12] for combinations of dead, long-term, and short-term loads. Specific design requirements for seismic loads and accidental actions were not considered. Future research will discuss the validation of the model for members in compression, such as columns, and planar members, such as slabs.
To investigate the cracking in the plane-stressed zones of beams in inclined sections under the combined action of bending moment and shear force, 10 reinforced concrete beams made of heavy ordinary concrete were tested at four-point bending. The basic parameters of the specimens are shown in
Table 1 and
Figure 5.
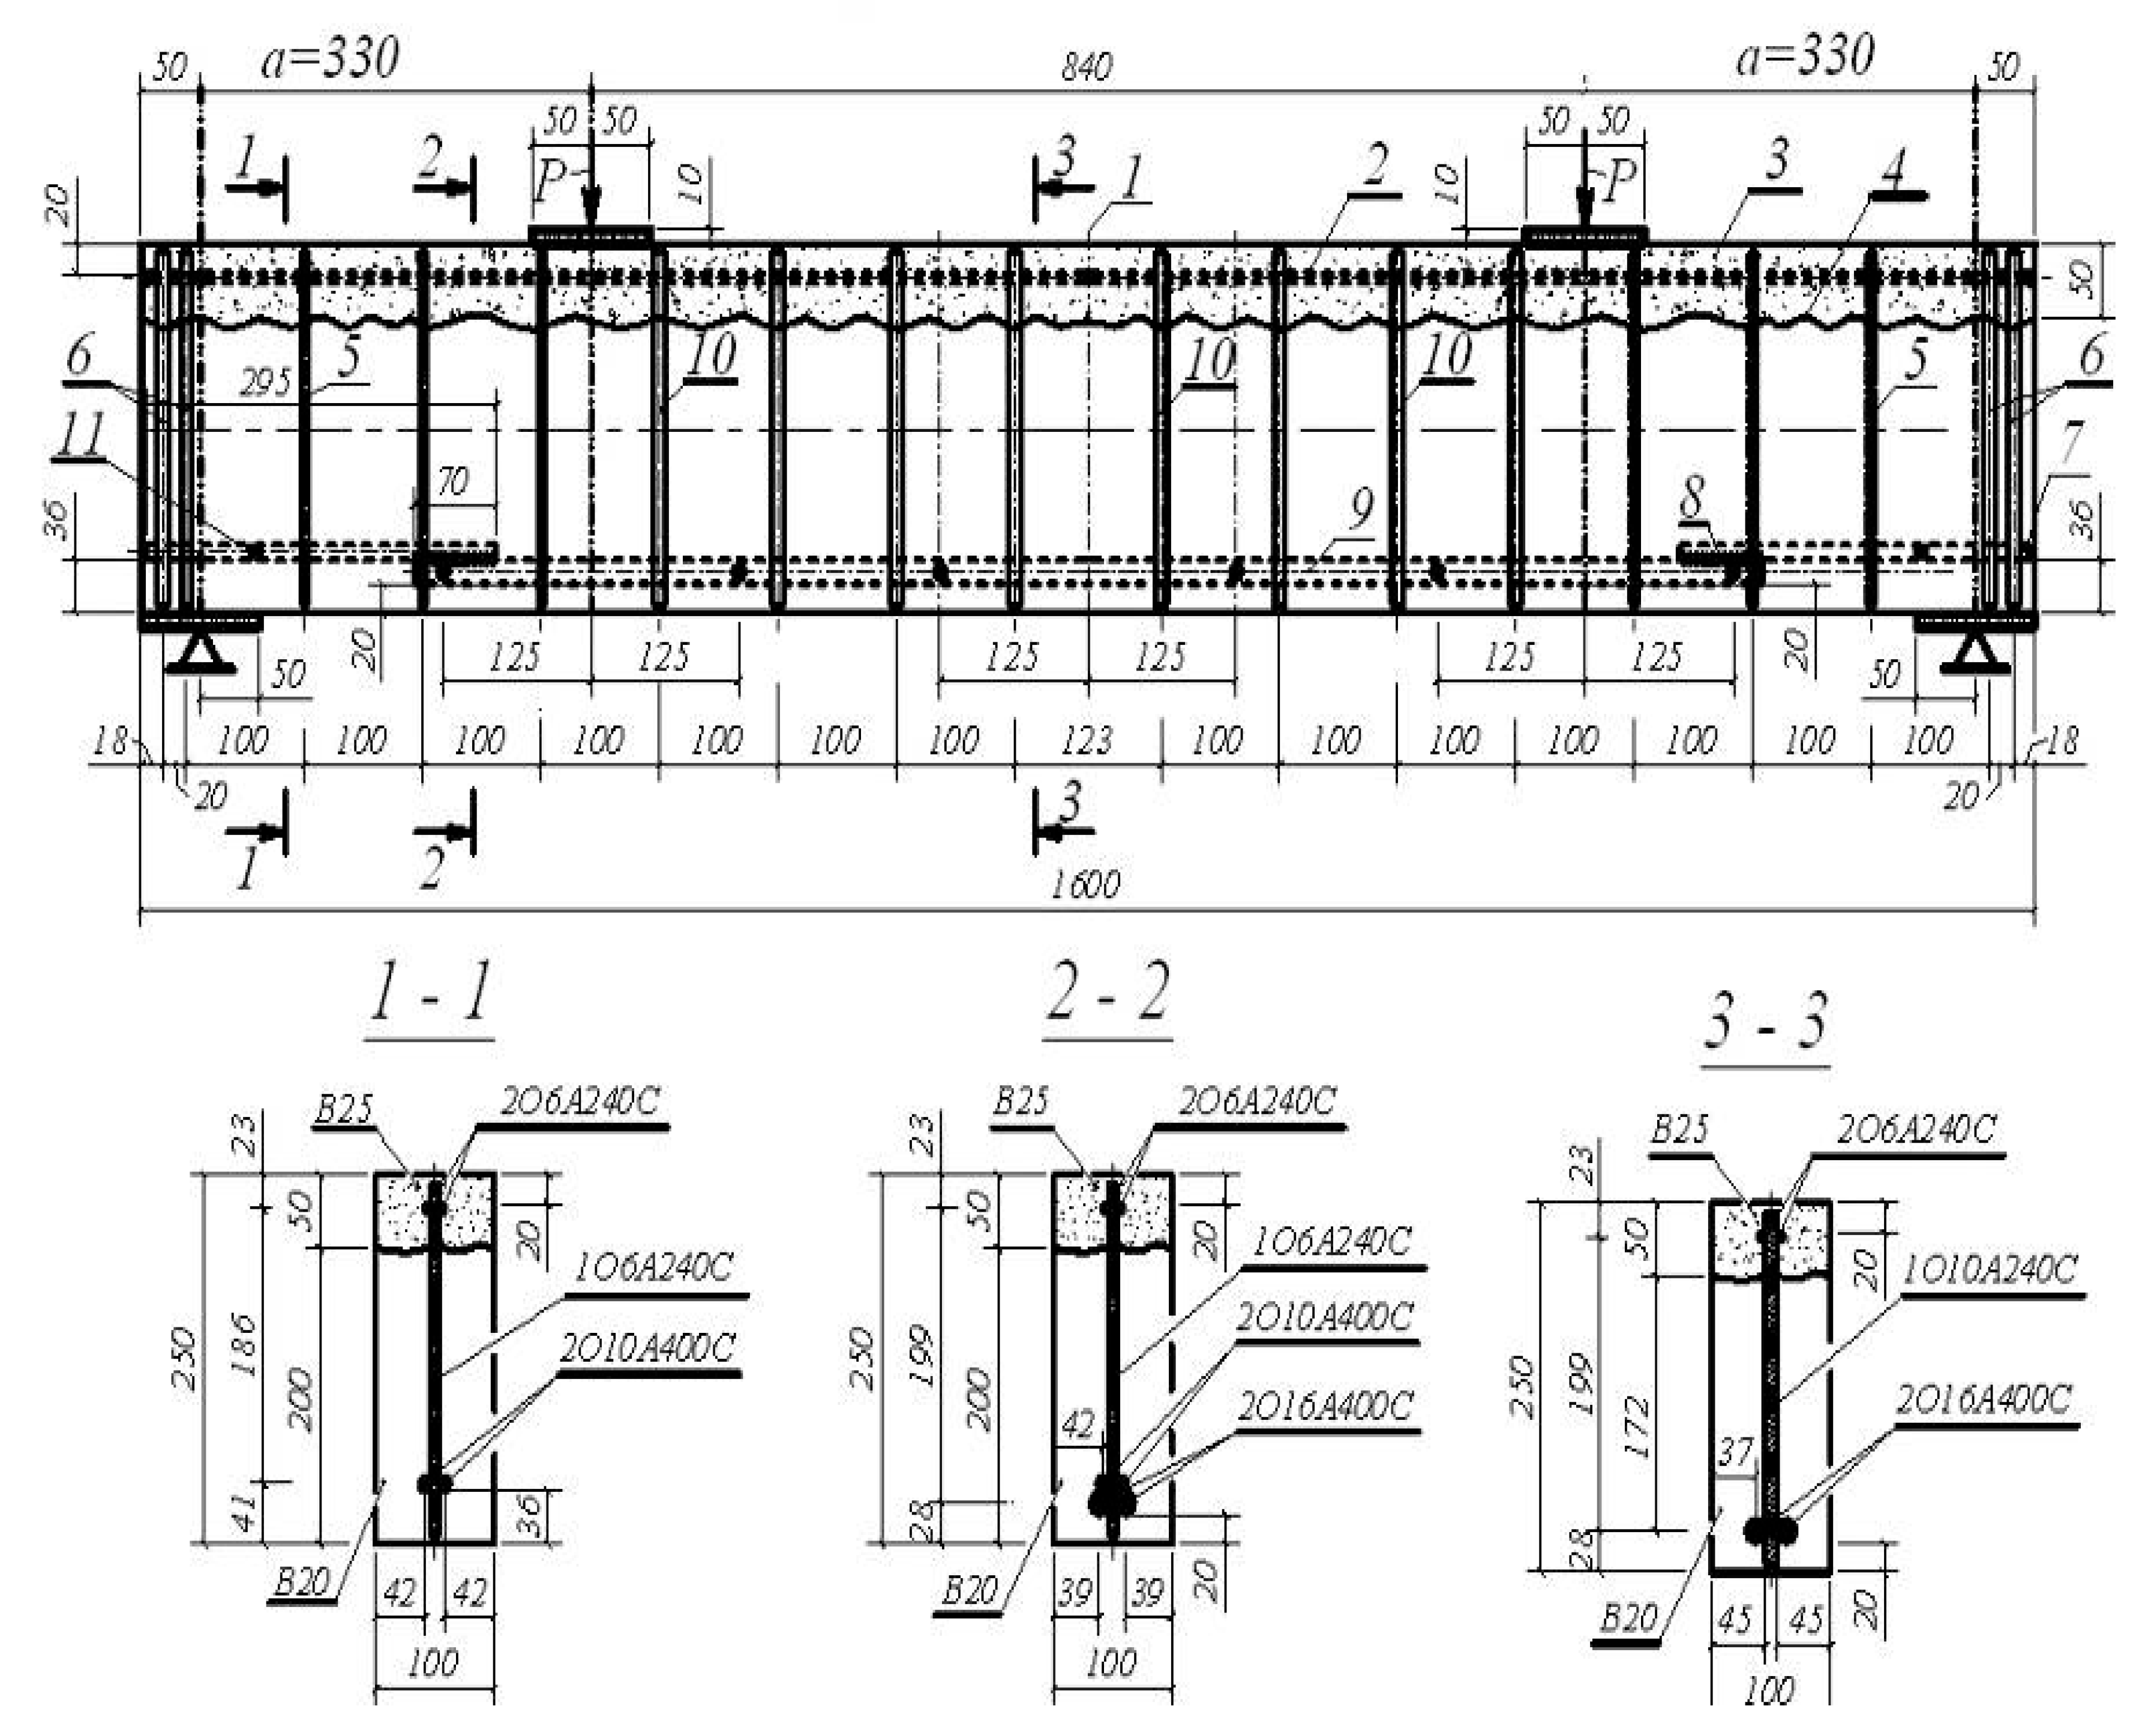
The reinforcement ratio and the shear spans (a/h) were varied. Three series of reinforced concrete beams, each consisting of two beams, were taken as tested heavy concrete structures. All beams had the same dimensions: length l = 1200 mm, width b = 100 mm, and depth h = 200 mm. Plain steel reinforcement of A240 grade according to GOST 34028-2016, with diameters of 6, 8, 10, and 12 mm, was used in the manufacture of the cages. All beams had the same transverse reinforcement with 6 mm diameter bars with a spacing between the stirrups of 80 mm.
The beams B2-1-2, B2-2-2, B4-1-2a, and B4-2-2a were reinforced in the area of pure bending with steel bars of 10 mm diameter and 750 mm length, consisting of 2 upper and 2 lower bars. The reinforcement ratio was μ = 1.57%. In the shear span zone, the beams were reinforced with 8 mm diameter rebars of 310 mm length, including 2 upper and 2 lower bars on each side. The reinforcement ratio in the shear span was μ = 1.005%, as shown in
Figure 5a. In the beams of the fifth series, the pure bending zone was reinforced with steel rebars with diameters of 10… 12 mm, and lengths of 750 mm. The reinforcement ratio in the pure bending zone was μ = 1.57% + 3.83% = 5.4%, which included 2 upper and 2 lower Ø10 rebars and 2 upper and 2 lower Ø12 rebars. In the shear zone, 2 upper and 2 lower rebars with a diameter of 8 mm and a length of 310 mm were used. Thus, the reinforcement ratio in the shear span was μ = 1.005%.
In order to check the mechanical properties and stress–strain diagram parameters of the steel reinforcement, three 400 mm long bars of each diameter, Ø6A240, Ø8A240, and Ø10A240, were tested. During the tests, the following steel properties were determined: yield strength σsn, MPa for steel with a pronounced yield point, tensile strength σsu, MPa. After the test, the modulus of elasticity Es was calculated.
The determination of physical and mechanical properties of concrete was carried out on the concrete specimens of the same composition as the beam structures. The specimens included 12 concrete prisms with dimensions of 100 × 100 × 400 mm and 12 cubes of 100 × 100 × 100 mm. Concrete strength grades were established in accordance with the methodology of GOST 18105 [
53]. The mean compressive strength of all series of concrete cubes was 28.5 MPa. For prisms, the actual compressive strength of concrete was 23 MPa.
The tensile strength of the concrete was determined by performing a bending test according to GOST 18105 [
53]. The mean tensile strength was 2.15 MPa. The mean value of the initial modulus of elasticity of concrete obtained in tests of standard prisms was 25,330 MPa.
The program of experimental studies of high-strength reinforced concrete beams included laboratory tests of four series of reinforced concrete structures, a general view of which is presented in
Figure 6. The main parameters of these structures are summarized in
Table 2. The main difference in the testing methodology of these beams was that they were loaded through a special traverse that allowed the application of bending and torque moments to the structures. As a result, a three-dimensional stress state appeared in the cross sections of the structures.
As part of the research on crack resistance of reinforced concrete structures, experimental investigations of precast monolithic beams of solid and layered sections under the combined action of bending moment and shear forces were carried out. The opening of inclined cracks at the level of the axis of longitudinal and transverse tensile reinforcement and along the crack profile was studied. The program of these studies included laboratory tests of five series of reinforced concrete beams consisting of 20 beams in total. The design of these beams was similar to the design of the precast-monolithic beam BS-I-1.5-150 of the first series presented in
Figure 7. The number of tested structures was accepted taking into account the variation of diameter and spacing of stirrups, longitudinal reinforcement, the grade of precast and monolithic concrete, and shear span.
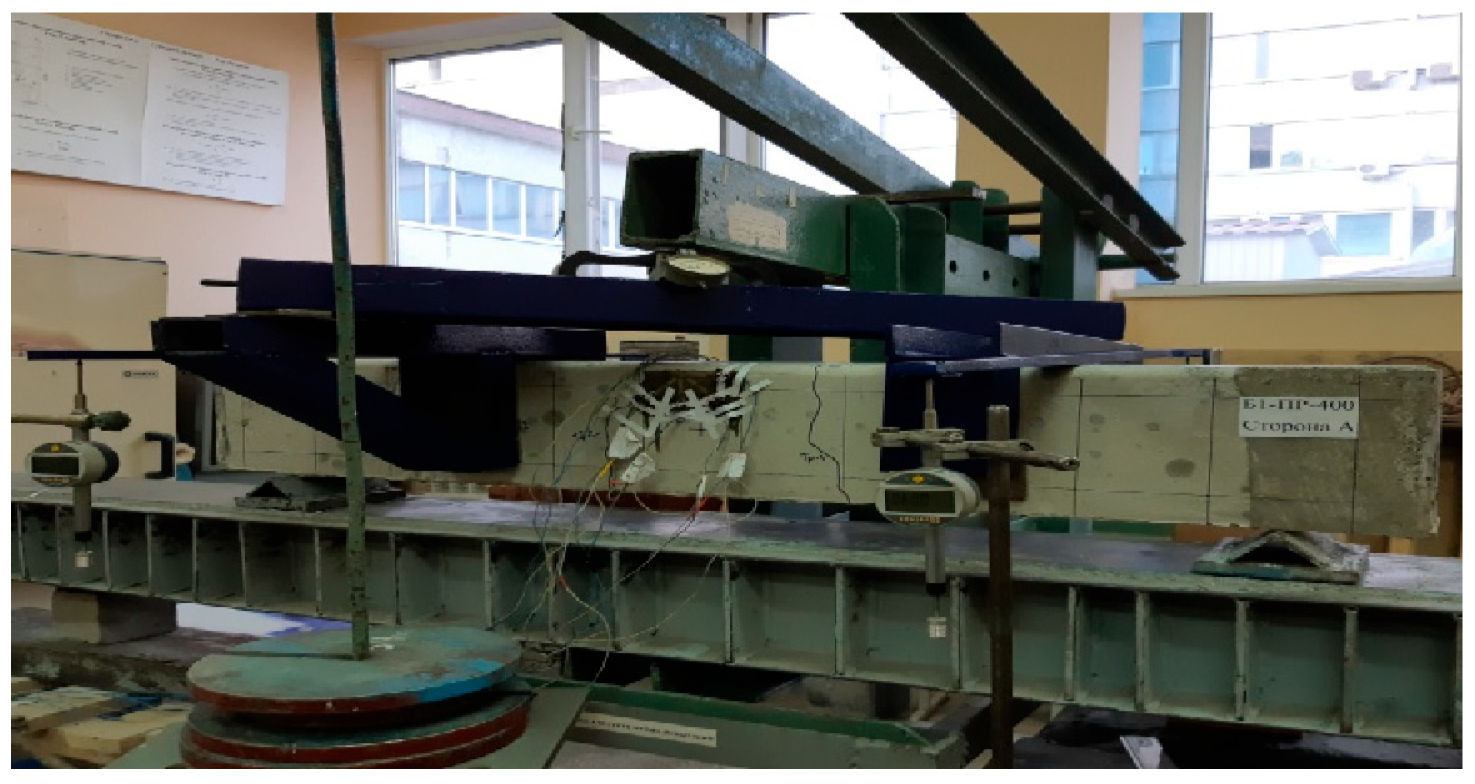
Beams of the all types were subjected to four-point bending tests. The loading was applied in steps of 0.1 of the expected failure loads. After two steps, the step size was reduced to 0.05 of the expected failure loads. This allowed visual detection of cracks on the concrete surface, determination of the moment of crack initiation to obtain sufficiently accurate results for inclined crack propagation, and gauge readings. Gauge readings were taken at each step immediately after the load was applied and at the end of the hold time. This made it possible to determine the time of crack initiation, strains, and deflections prior to reaching maximum load, and to reliably identify possible nonlinearities just prior to cracking and at the transition through maximum load. As a result, a greater number of points were obtained on the stress–strain diagrams of the sections. During the test, the width of normal cracks, inclined cracks, and shear displacements were measured using a P54 digital electronic micrometer with a graduation of 0.001 mm installed in the tensile zone of the beam. In order to keep the experimental data clean and to compare the shear in the inclined crack, the indicators were also installed on the opposite side of the beam in a mirrored position. The crack opening was also recorded with a digital video camera at a rate of 200 frames per second. The strains of the compressive and tensile zones of the concrete, as well as the strains of the zone of combined action of shear force and bending moment, were measured by the indicators of a digital electronic micrometer P54 with a graduation value of 0.001 mm. Strain gauges with a 50 mm measuring base were also used to check the readings of mechanical devices.
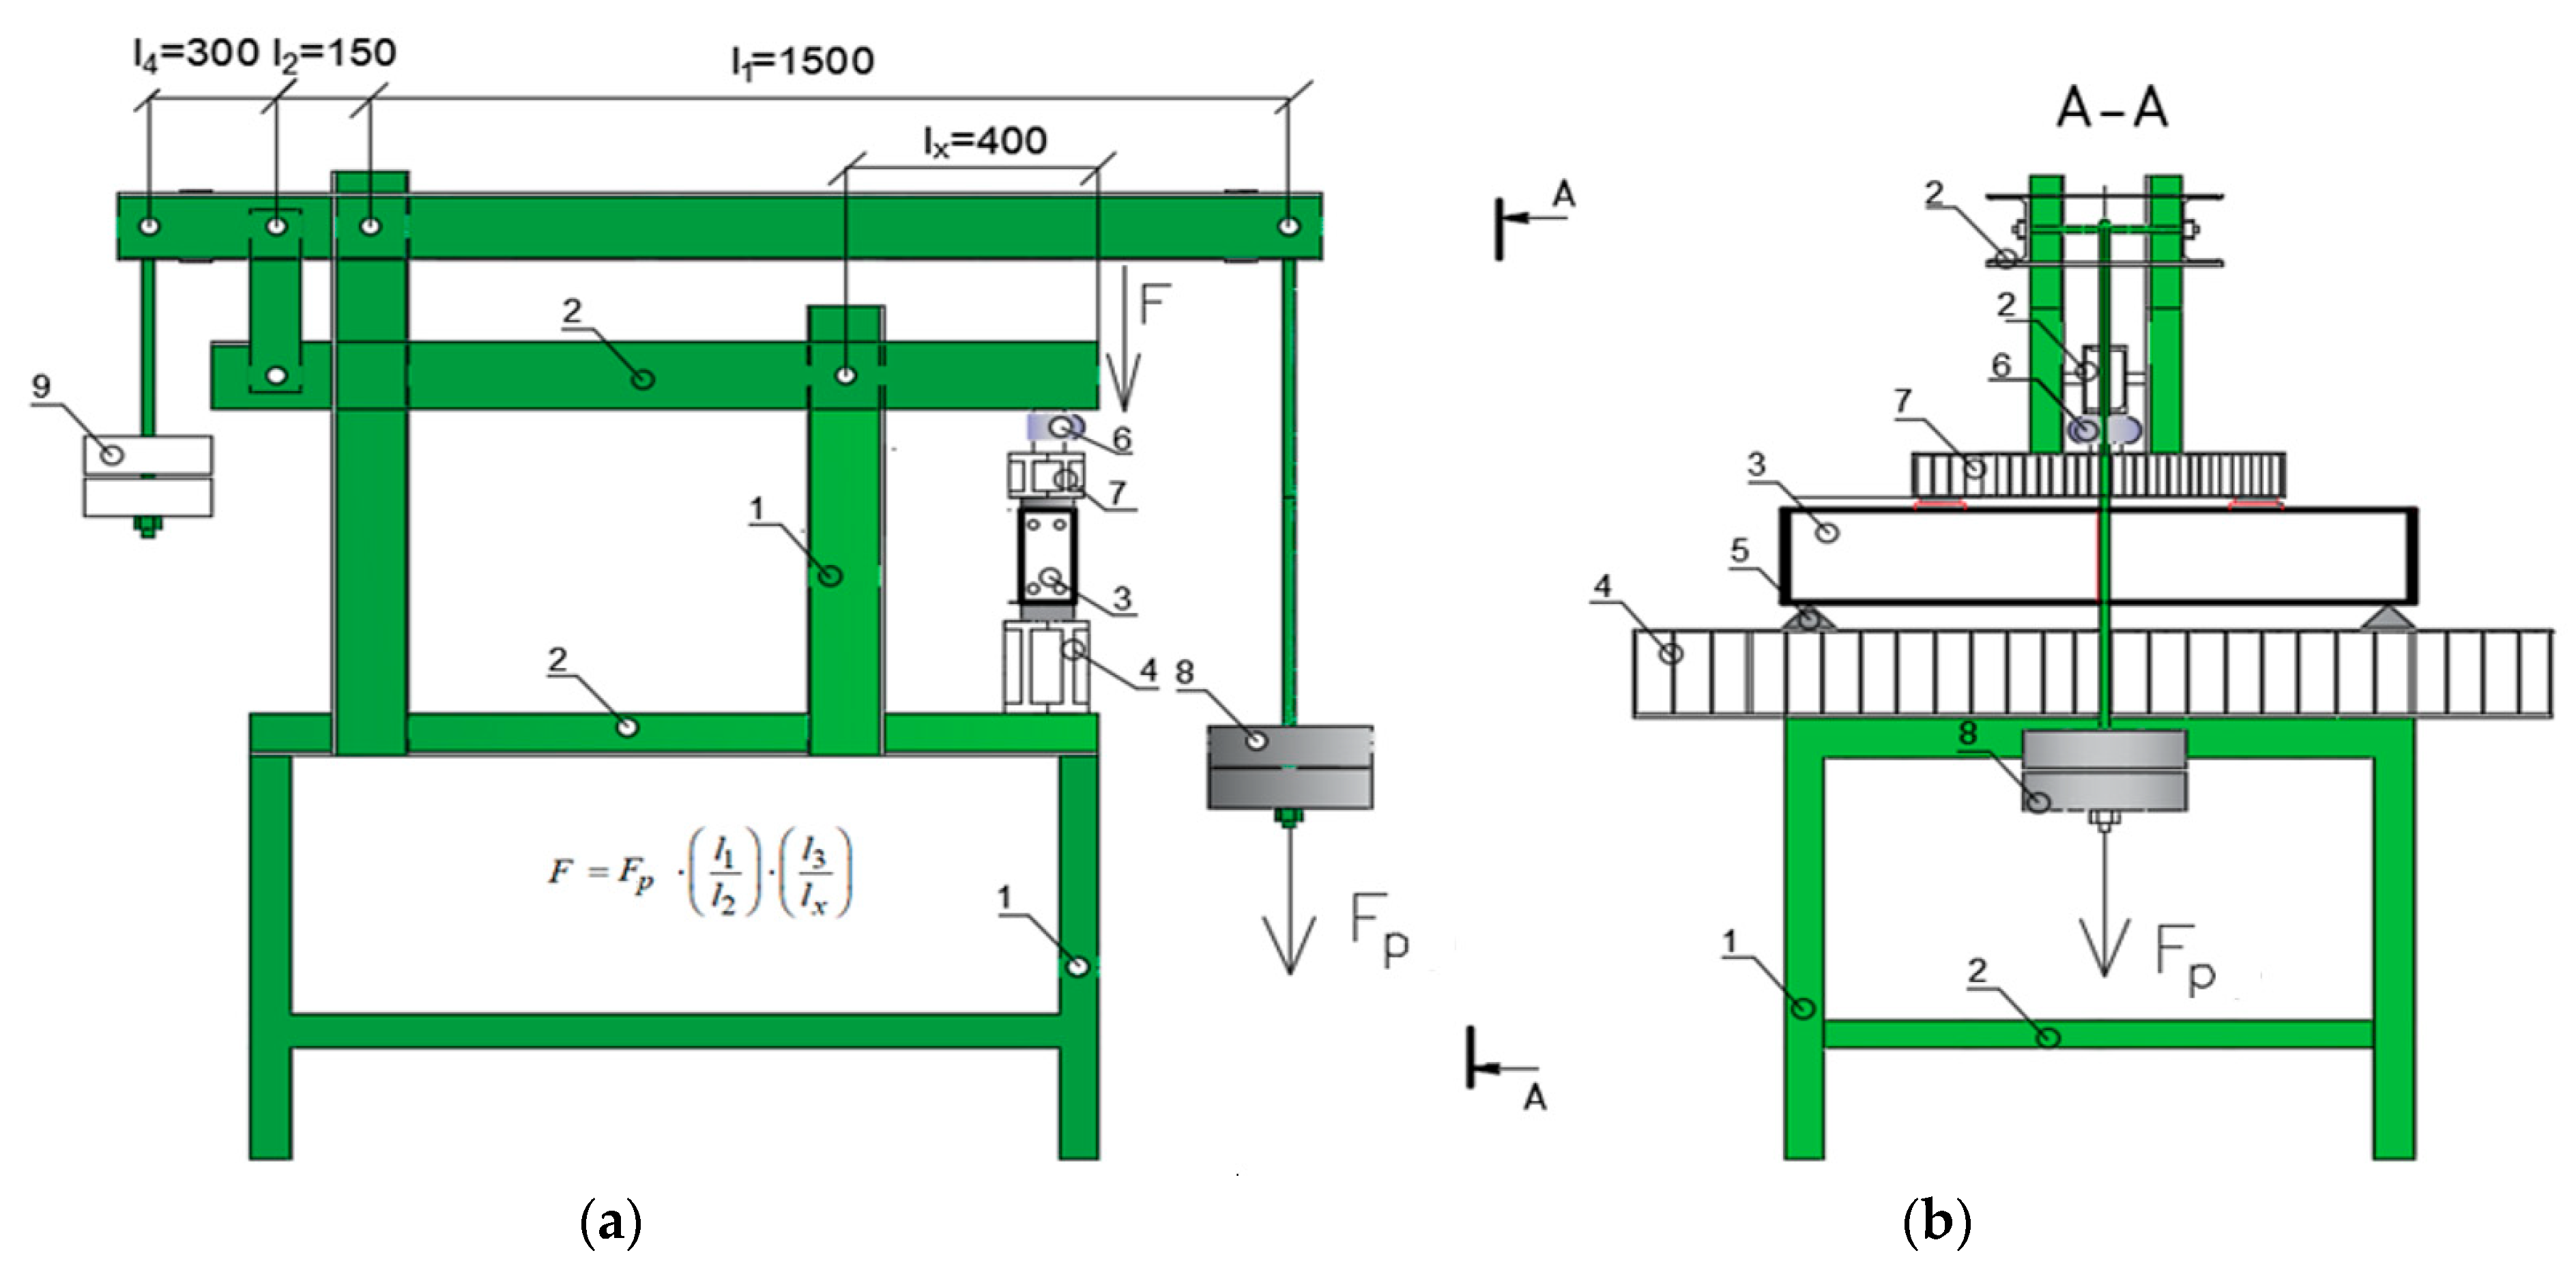
The static tests were performed using the mechanical equipment presented in
Figure 8.
Initially, strain gauges were installed in the support zones to control the directions of the principal stresses in the plane stress state of the members, as well as in the three-dimensional stress–strain state that occurs during combined torsion and bending. Once the first cracks appeared, additional strain gauges were placed along the crack faces to record changes in the stress–strain state in the area adjacent to the crack.
Two variants of boundary conditions were implemented during the tests: a cantilever beam and a simply supported beam.
In the first scheme, the testing equipment allowed the implementation of the planned loading scheme with a given length and varying leverage of the load application. The reinforced concrete specimens were tested in a horizontal position with free access to the tensile zone. This made it possible to study in detail the formation, development, and opening of cracks.
In the second scheme, the equipment allowed uniform loading of both cross sections of the beams located in the thirds of the span. The experimental beams were loaded by two concentrated forces applied symmetrically near the center of the beam span.
3.2. Experimental Investigation of Crack Opening in Beams of Heavy Concrete
As a result of processing the measured values, the crack opening widths, the change of their profile during opening, as well as the experimental parameters of the tested structures related to the cracking process, were determined. These parameters included the depth of compressed concrete above the inclined crack xb, the distribution of strains in the plane stressed zone of the combined action of shear force and bending moment, and the crack spacings scr at all loading levels of the structure.
In ordinary concrete beam structures, the primary cracks appeared at an angle to the cross-sectional plane of the specimens. As the load increased, the subsequent propagation of these cracks was observed. The angle of inclination of these cracks also increased. In all sections of the beam, the formation of new cracks between the previously existing cracks was observed as the load increased. Thus, the crack spacing
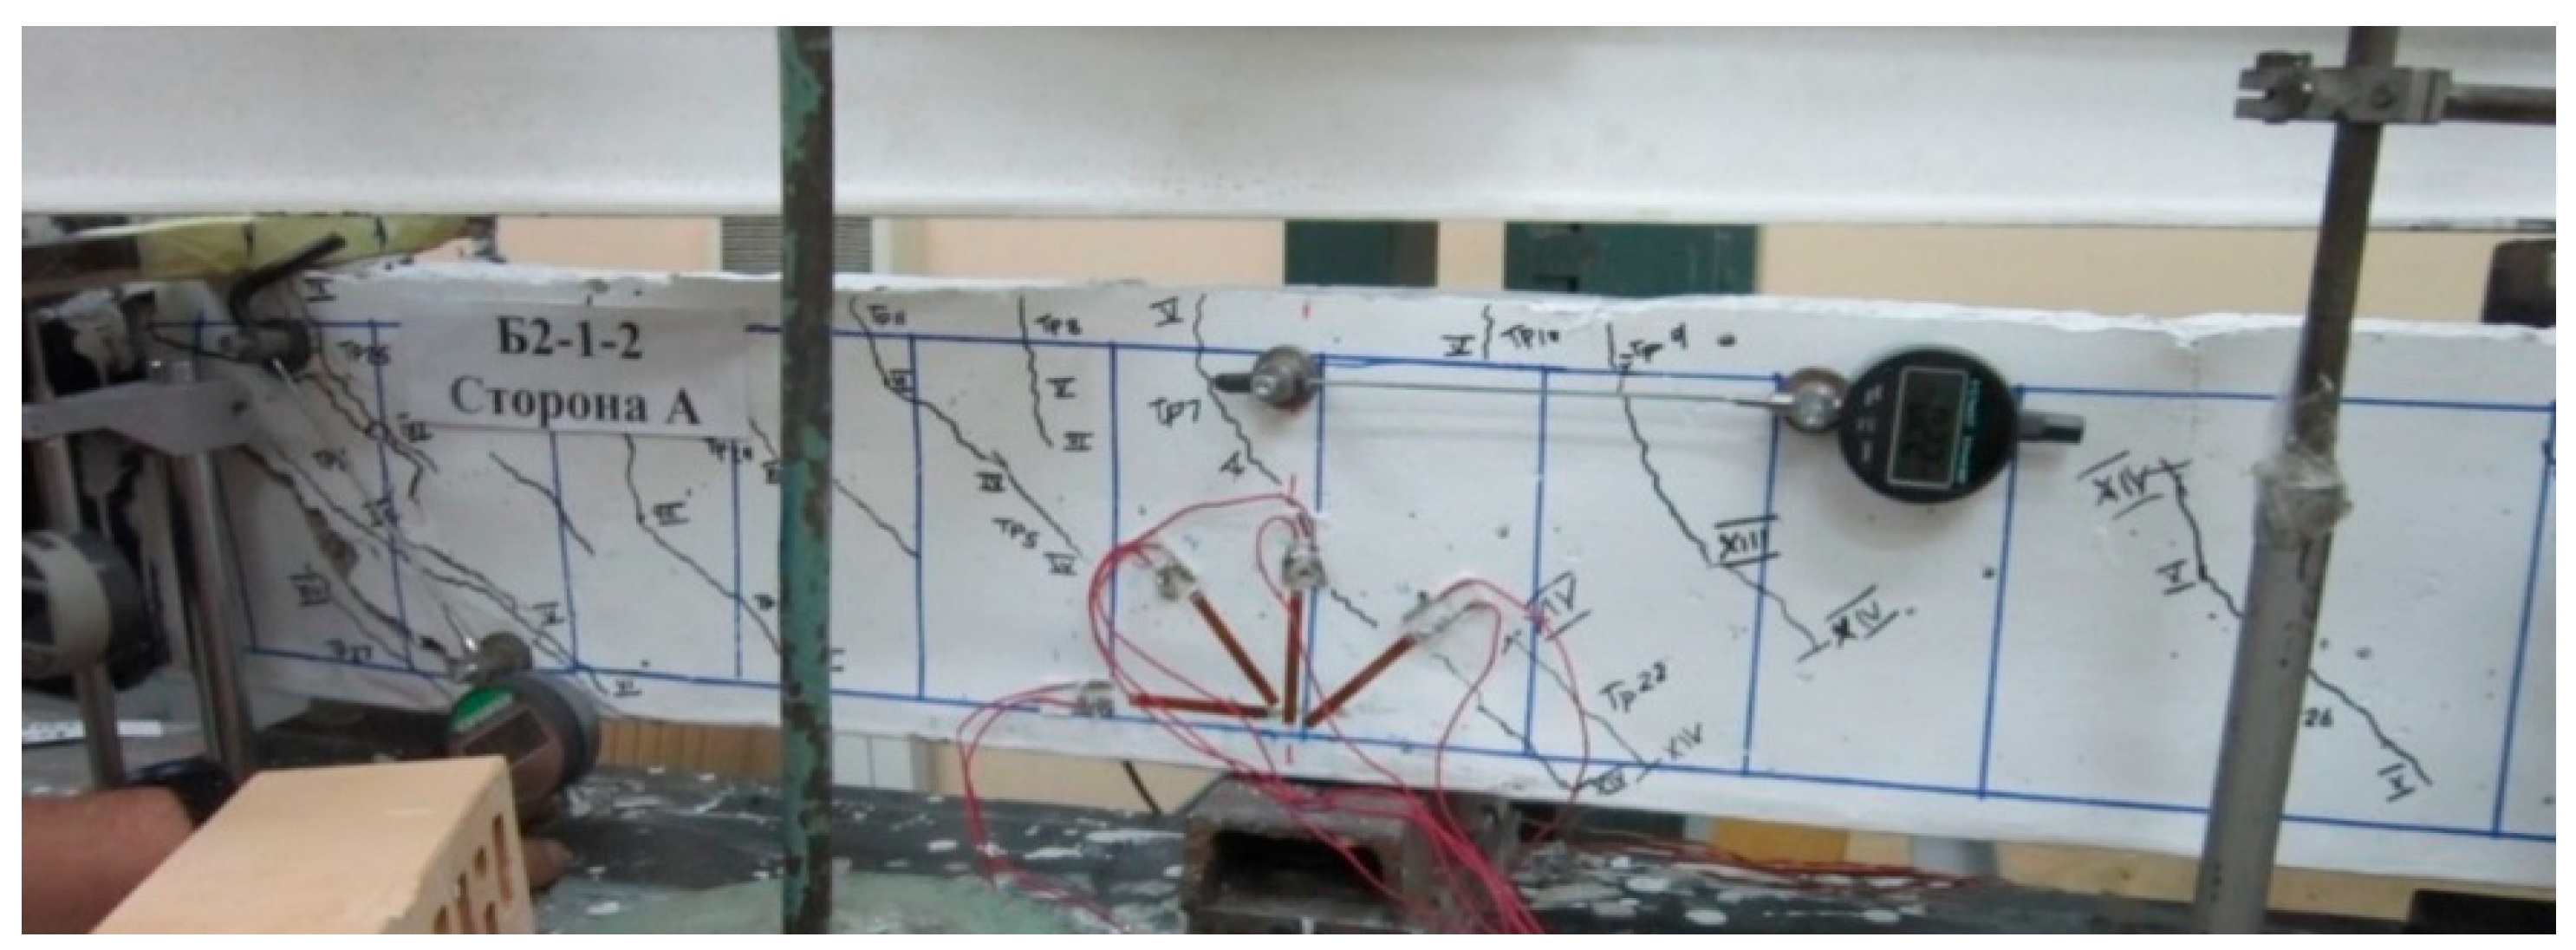
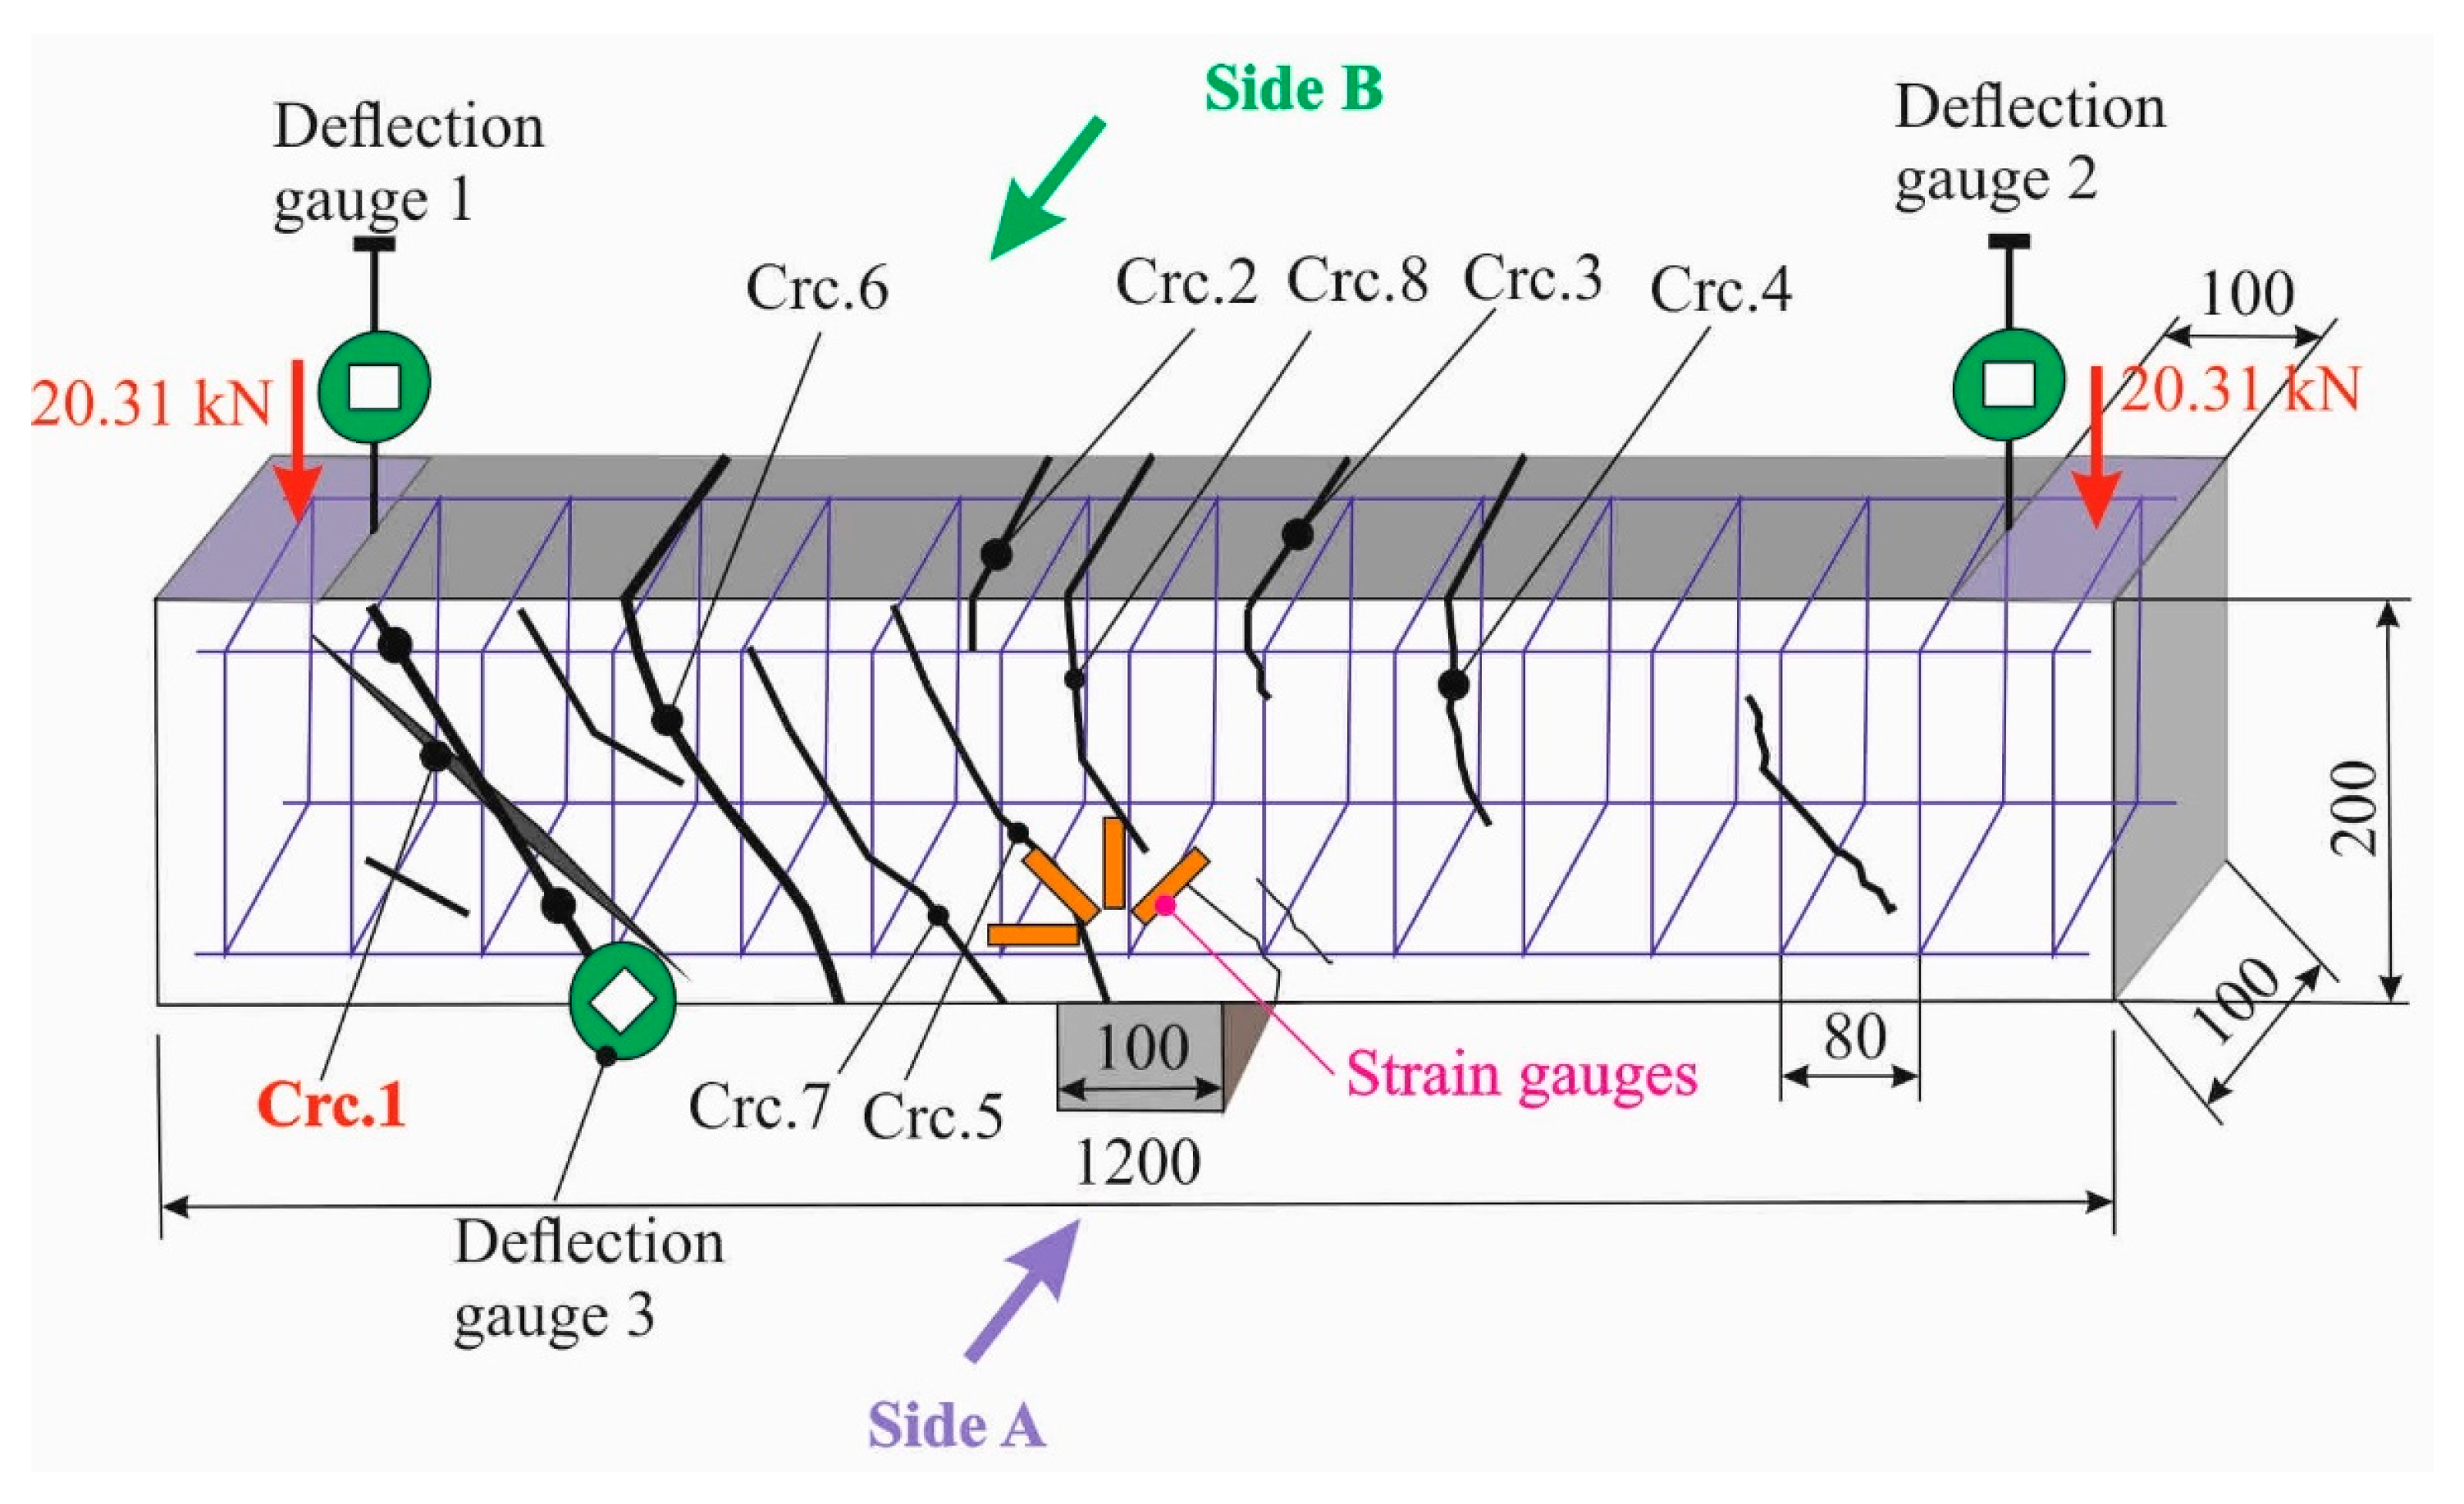
scr decreased. The angle of inclination of the secondary cracks usually did not coincide with the angle of inclination of the formed primary cracks. This was due to the change in the value and direction of the principal strains, as evidenced by the changes in the measured strains in the tensile zone of the structures after the formation of primary cracks. The cracks developed smoothly with a uniform increase in the width of their opening from 0.02–0.05 mm to 1–2 mm at the moment of fracture. The typical experimental pattern of crack formation and crack opening is shown in
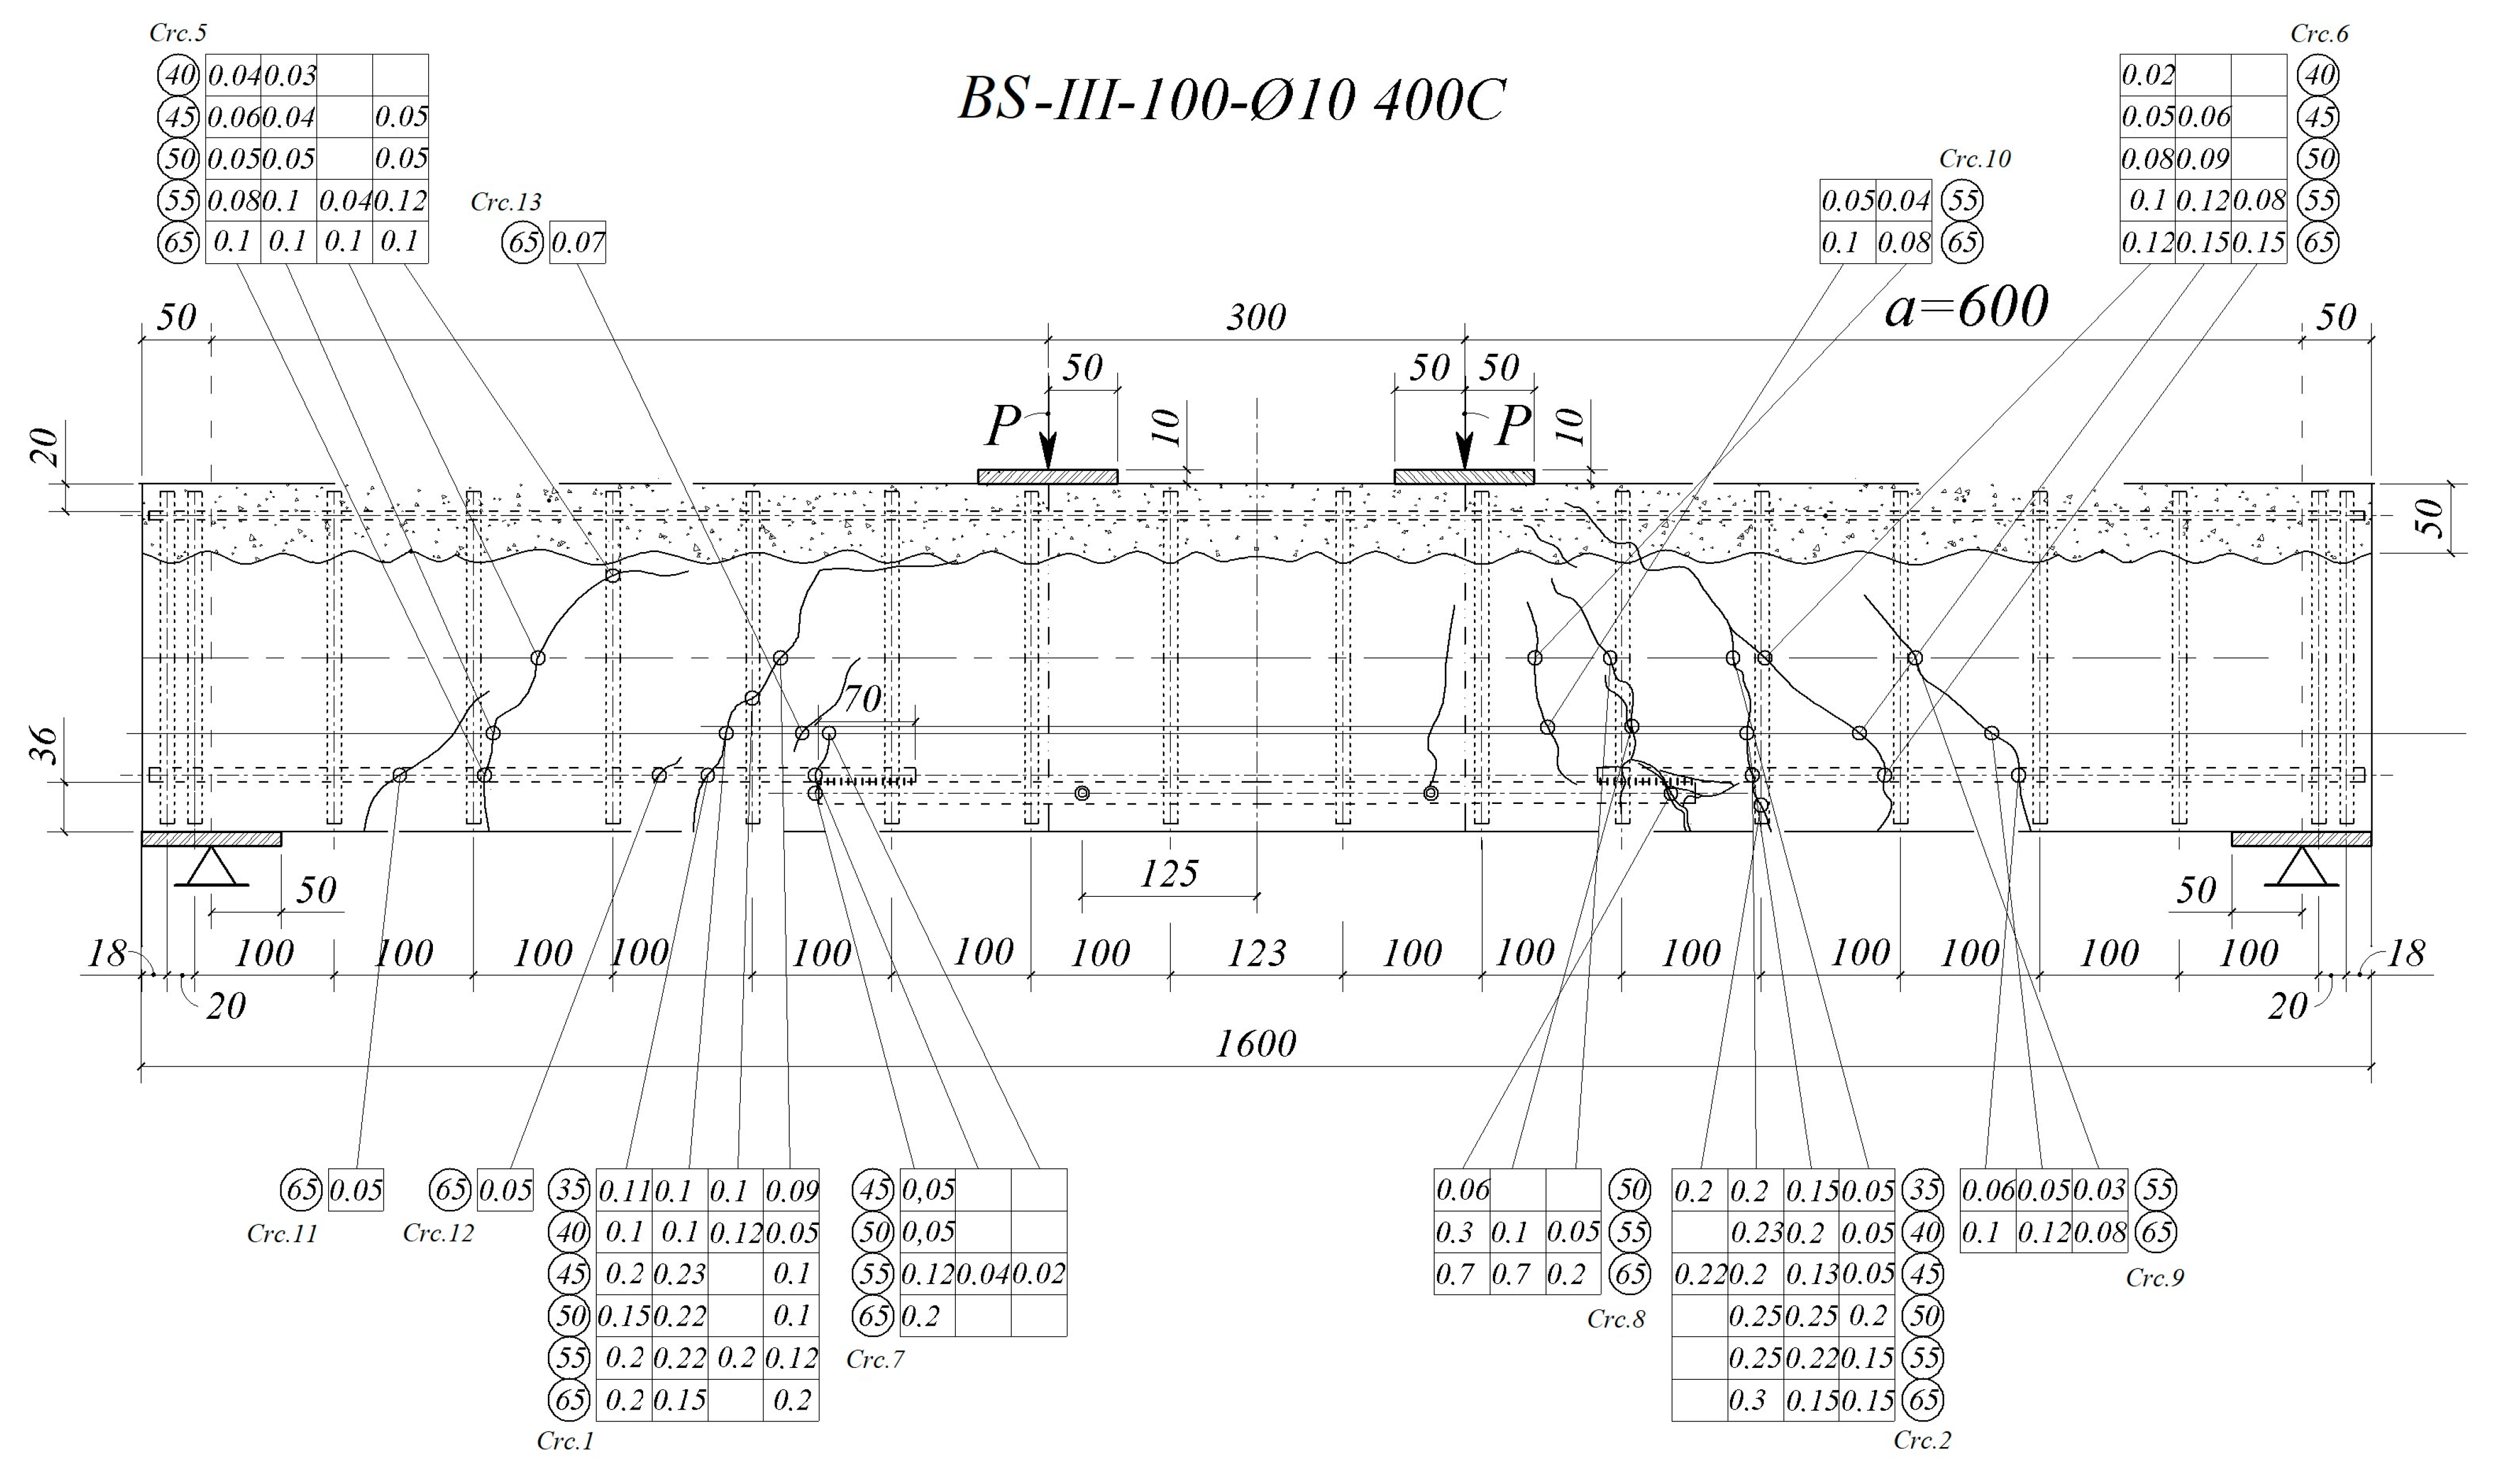
Figure 9 and
Figure 10 using the example of beam B2-1-2 tested according to the two-cantilever scheme.
Figure 10 shows the inclined cracks Crc.1 with the largest opening width. During the tests, they were considered progressive and the experimental beams fractured across them.
Table 3 shows the relationships between load and shear deformations.
From the analysis of the crack opening width along the crack profile shown in
Figure 10 and
Table 3, it can be concluded that the maximum crack opening occurred at a distance of two or three diameters from the axis of the longitudinal reinforcing bars. The same crack profile pattern was observed in tests of beams of other series, in particular in tests of the single-span beam B5-2-2 shown in
Figure 11. These results confirm the hypothesis about the deformation effect during crack opening in the tensile zones of the structures.
The measured shear deformations along the crack profile allowed us to quantify the dowel effect in the reinforcing bar and also to confirm the results of recently published experimental and theoretical studies [
19,
24].
3.3. Experimental Investigation of High-Strength Reinforced Concrete Beams
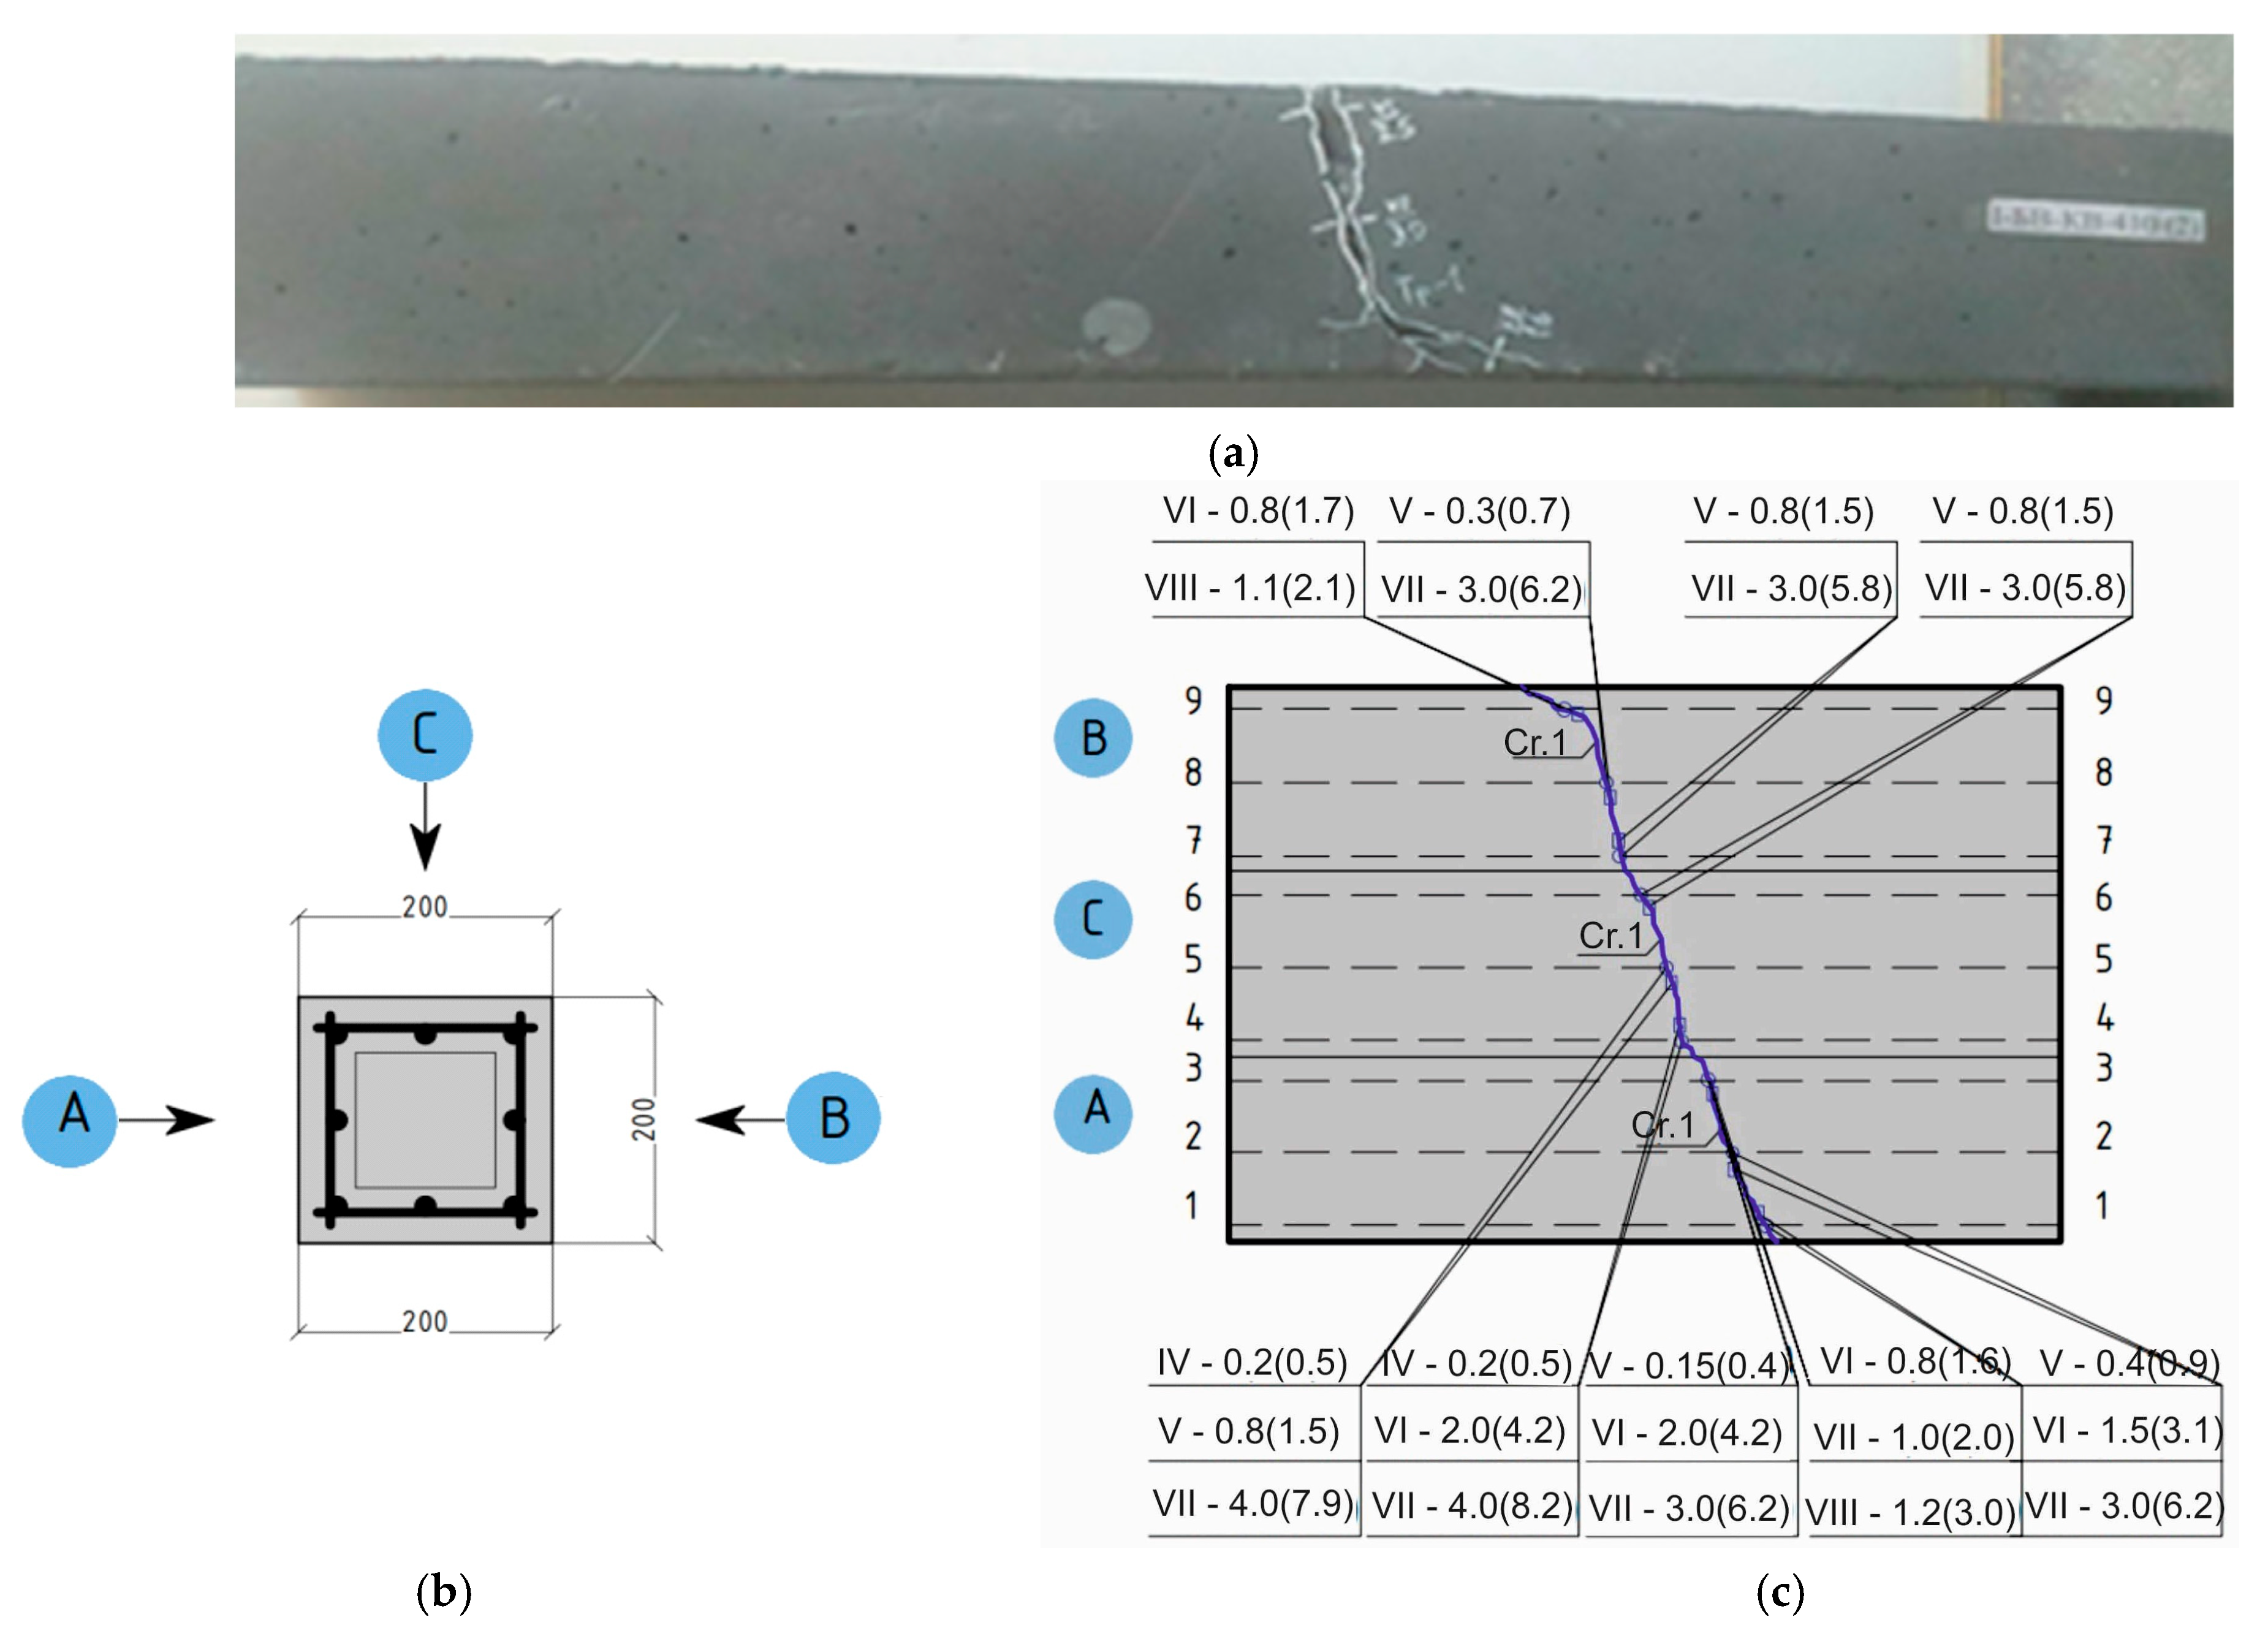
Tests of high-strength concrete and high-strength fiber concrete beams subjected to bending with torsion revealed regularities of reinforcement and concrete deformation patterns in tensile zones similar to those in structures made of ordinary concrete. Tests showed that only a single spatial crack appeared in such structures. The analysis of the crack opening on the beam faces showed that the width of its opening at the level of the axis of the reinforcing bars was one-and-a-half to two times smaller than at a distance of two or three diameters of the reinforcing bars, as can be seen in
Figure 12.
As for ordinary concrete beams, there was a qualitative change in the concrete strains at the crack faces where the crack crossed the longitudinal or transverse reinforcement at the moment of crack appearance. Therefore, it can be concluded that the violation of concrete continuity at the moment of crack appearance caused a deformation effect in 3D-stressed high-strength reinforced concrete and high-strength fiber-reinforced concrete beams. It had a significant influence on the crack opening width at the level of the longitudinal reinforcement axis. This effect changed the strain distribution in concrete and reinforcement in the anchorage zone at the crack boundary, as shown in
Figure 1b.
3.4. Experimental Investigation of Precast-Monolithic Reinforced Concrete Beams
The peculiarity of these tests was that the test procedure included the additional installation of strain gauges at the crack boundaries, as shown in
Figure 13, in order to study the deformed state of the concrete at the crack faces in more detail and to determine the deformation effect. The beam structures were tested in a horizontal position, which allowed the crack opening pattern to be studied in detail. As a result of testing these series of structures, it was found that reinforcement restrained the crack opening by counteracting the opening of its faces, as shown in
Figure 14.
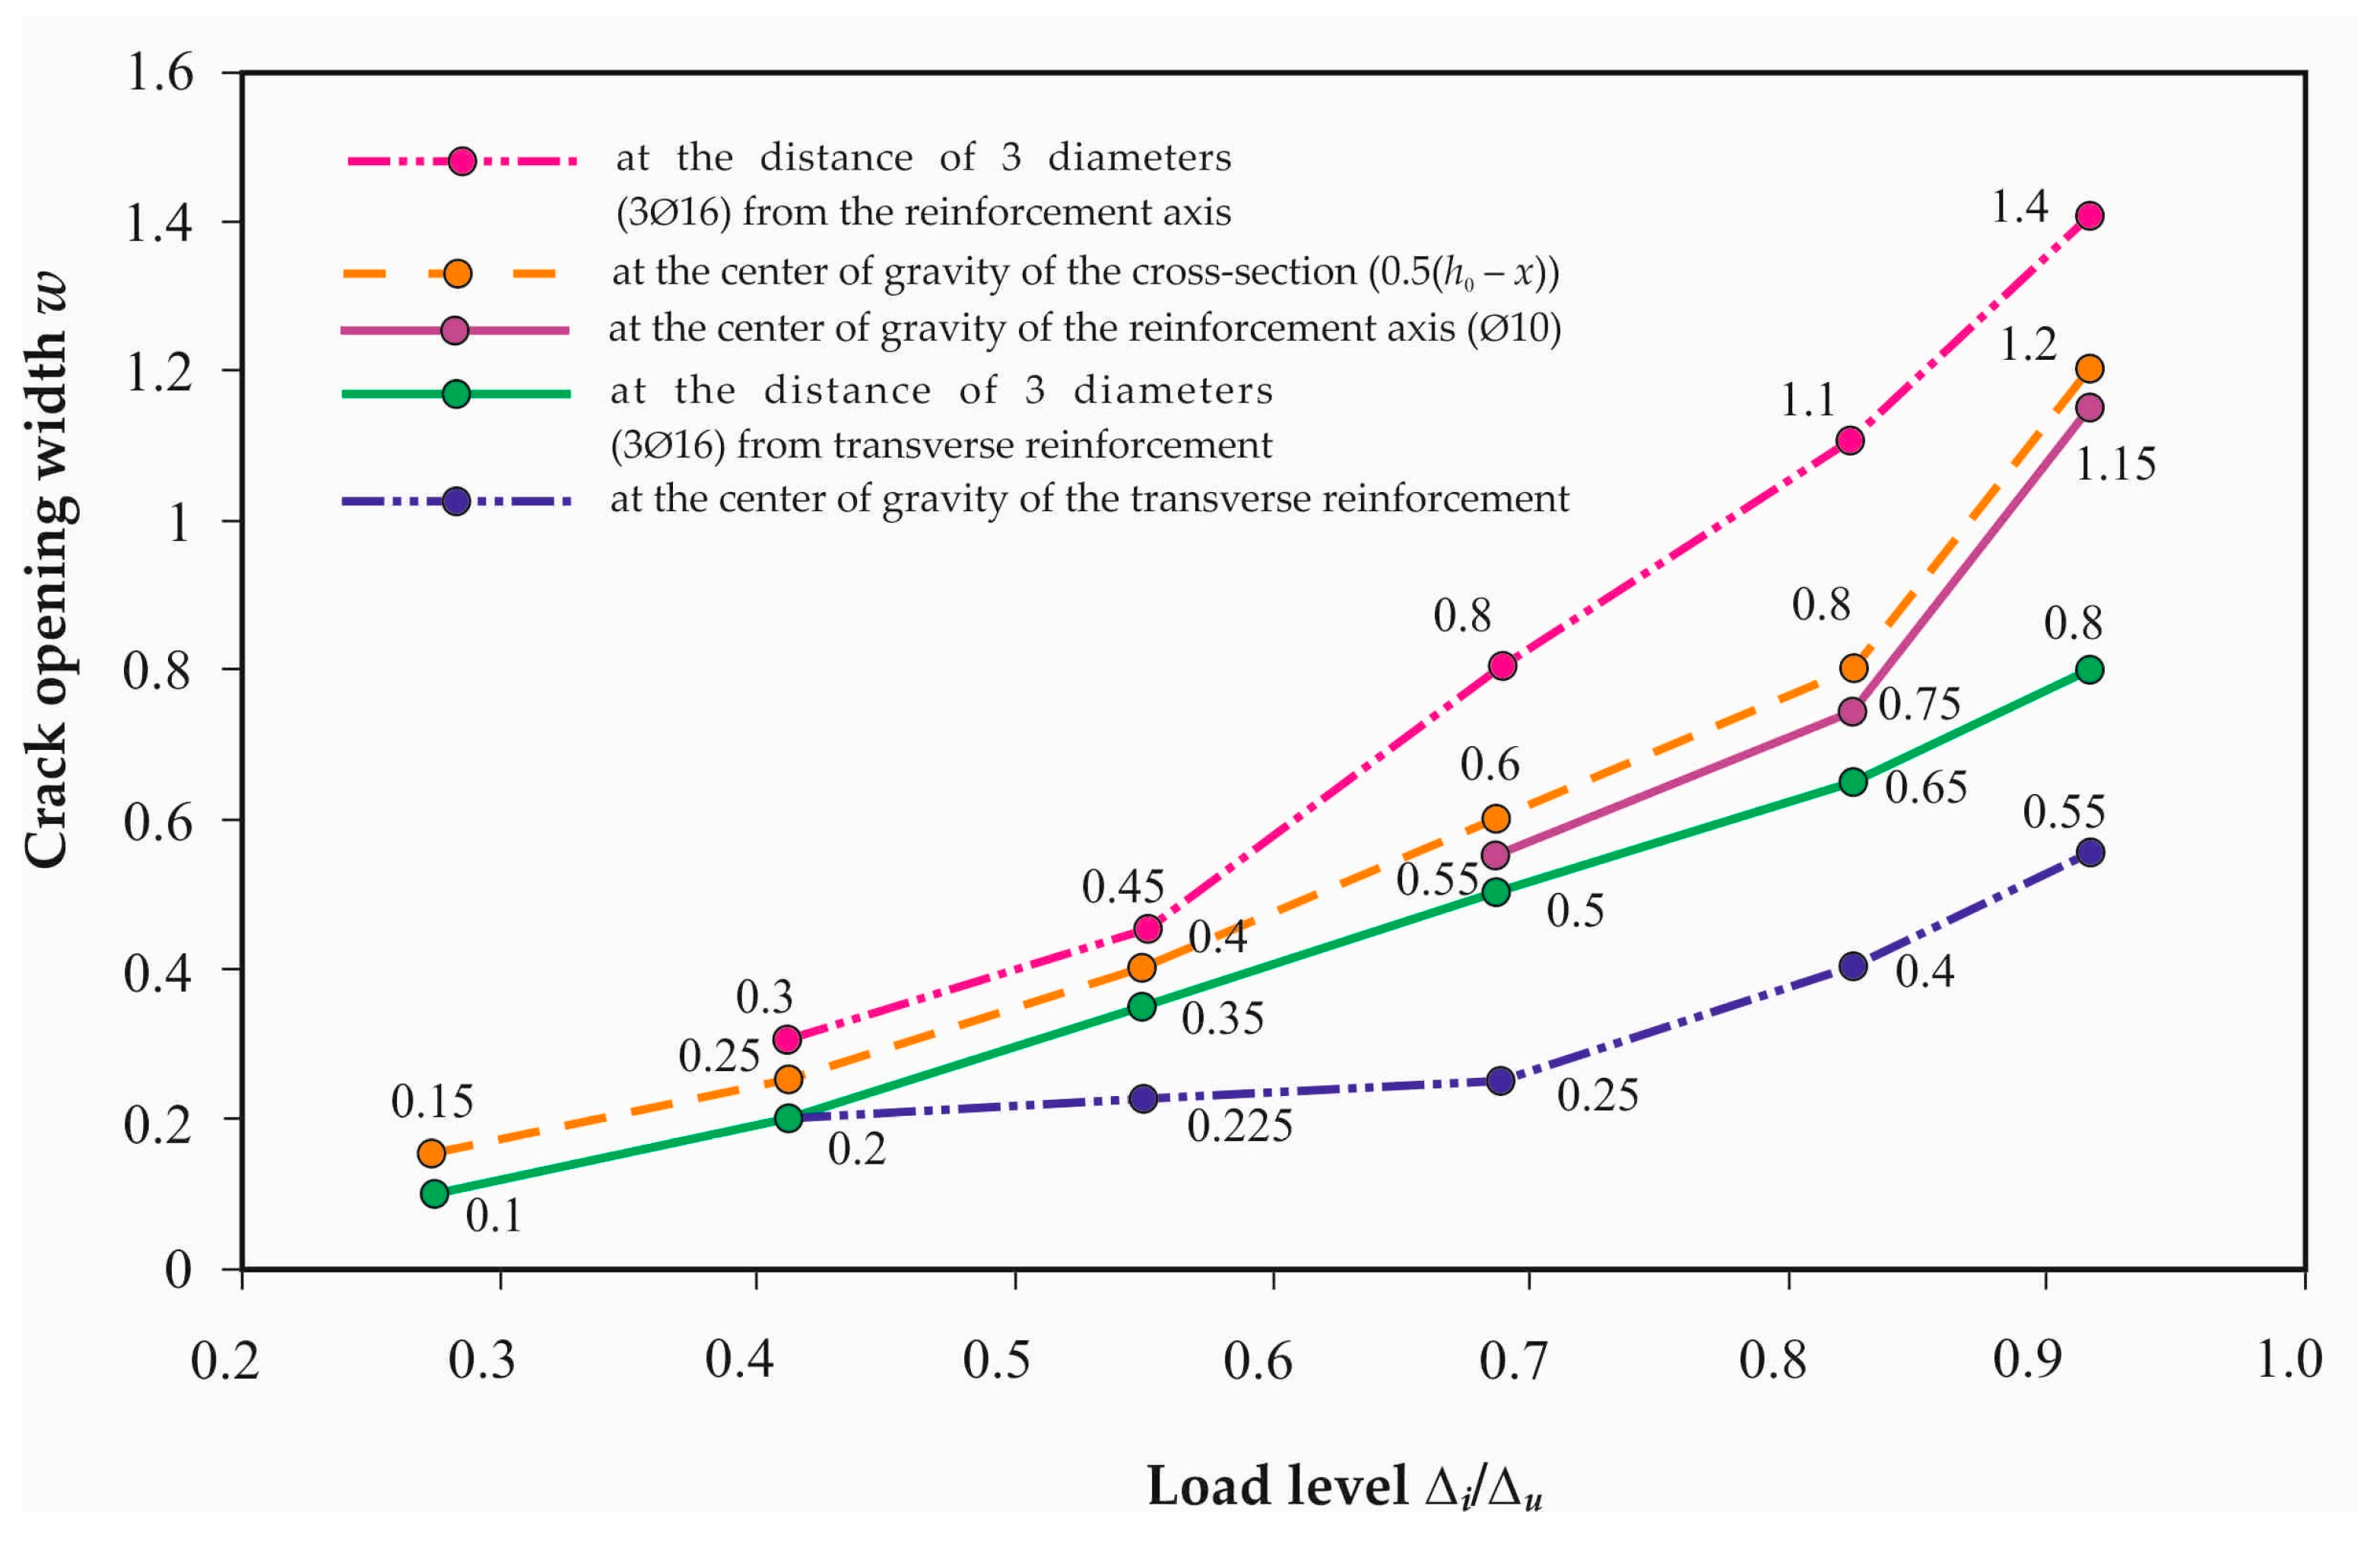
The resulting reactions caused local compression in the concrete of the crack faces in the vicinity of the reinforcement zone, as indicated by the concrete strains. The simultaneous action of moment and transverse force (M, Q) and the presence of strong tensile reinforcement caused the cracks to have a maximum opening not at the level of the reinforcement axis, but at a distance equal to 2–3 rebar diameters from the reinforcement axis. The crack propagation followed two directions: towards the compressive surface of the concrete and towards the longitudinal tensile reinforcement. At the intersection with the transverse bars, the crack opening width was smaller than at the distance of two diameters from them.
Figure 15 shows that the crack opening width
w increased with increasing loading level Δ
i/Δ
u despite the fact that the crack spacing decreased simultaneously with increasing stresses in the reinforcement. Taking into account the multilevel cracking process, one should have expected a decrease in the crack opening width because of a decrease in the distance between the cracks that occurred despite the increase in the loading level and stress growth in the reinforcement. The change in the distance between the cracks was discrete and inversely proportional to the change in bending moments that should have had the opposite effect on the crack opening width. However, this did not occur, which is fully reflected in the analytical relationship (24). The experimental results obtained from the proposed design model create the following specific requirement: the calculation should qualitatively confirm this regularity observed in the experiments.
The new test data presented for reinforced concrete structures tested under different types of loading and made of concrete of different strengths, including prefabricated monolithic structures, significantly expand the existing experimental material. In particular, it is found that the reinforcement restrains the crack opening and counteracts the expansion of its faces. The resulting reactions cause local compression of the concrete in the vicinity of the reinforcement. Therefore, the continuity violation leads to a change of the crack profile from triangular to curvilinear. The analysis performed on the experimental crack patterns revealed several levels of crack appearance. Moreover, the cracks of each subsequent level appeared, as a rule, in the middle of the distance between the cracks of the previous level. In total, two or three levels of cracking were observed in the experiments.
4. Comparison of Theoretical and Experimental Results and Discussion
This section discusses the experimental results for crack opening width, and the profile of normal and inclined cracks considered in
Section 3 of the paper.
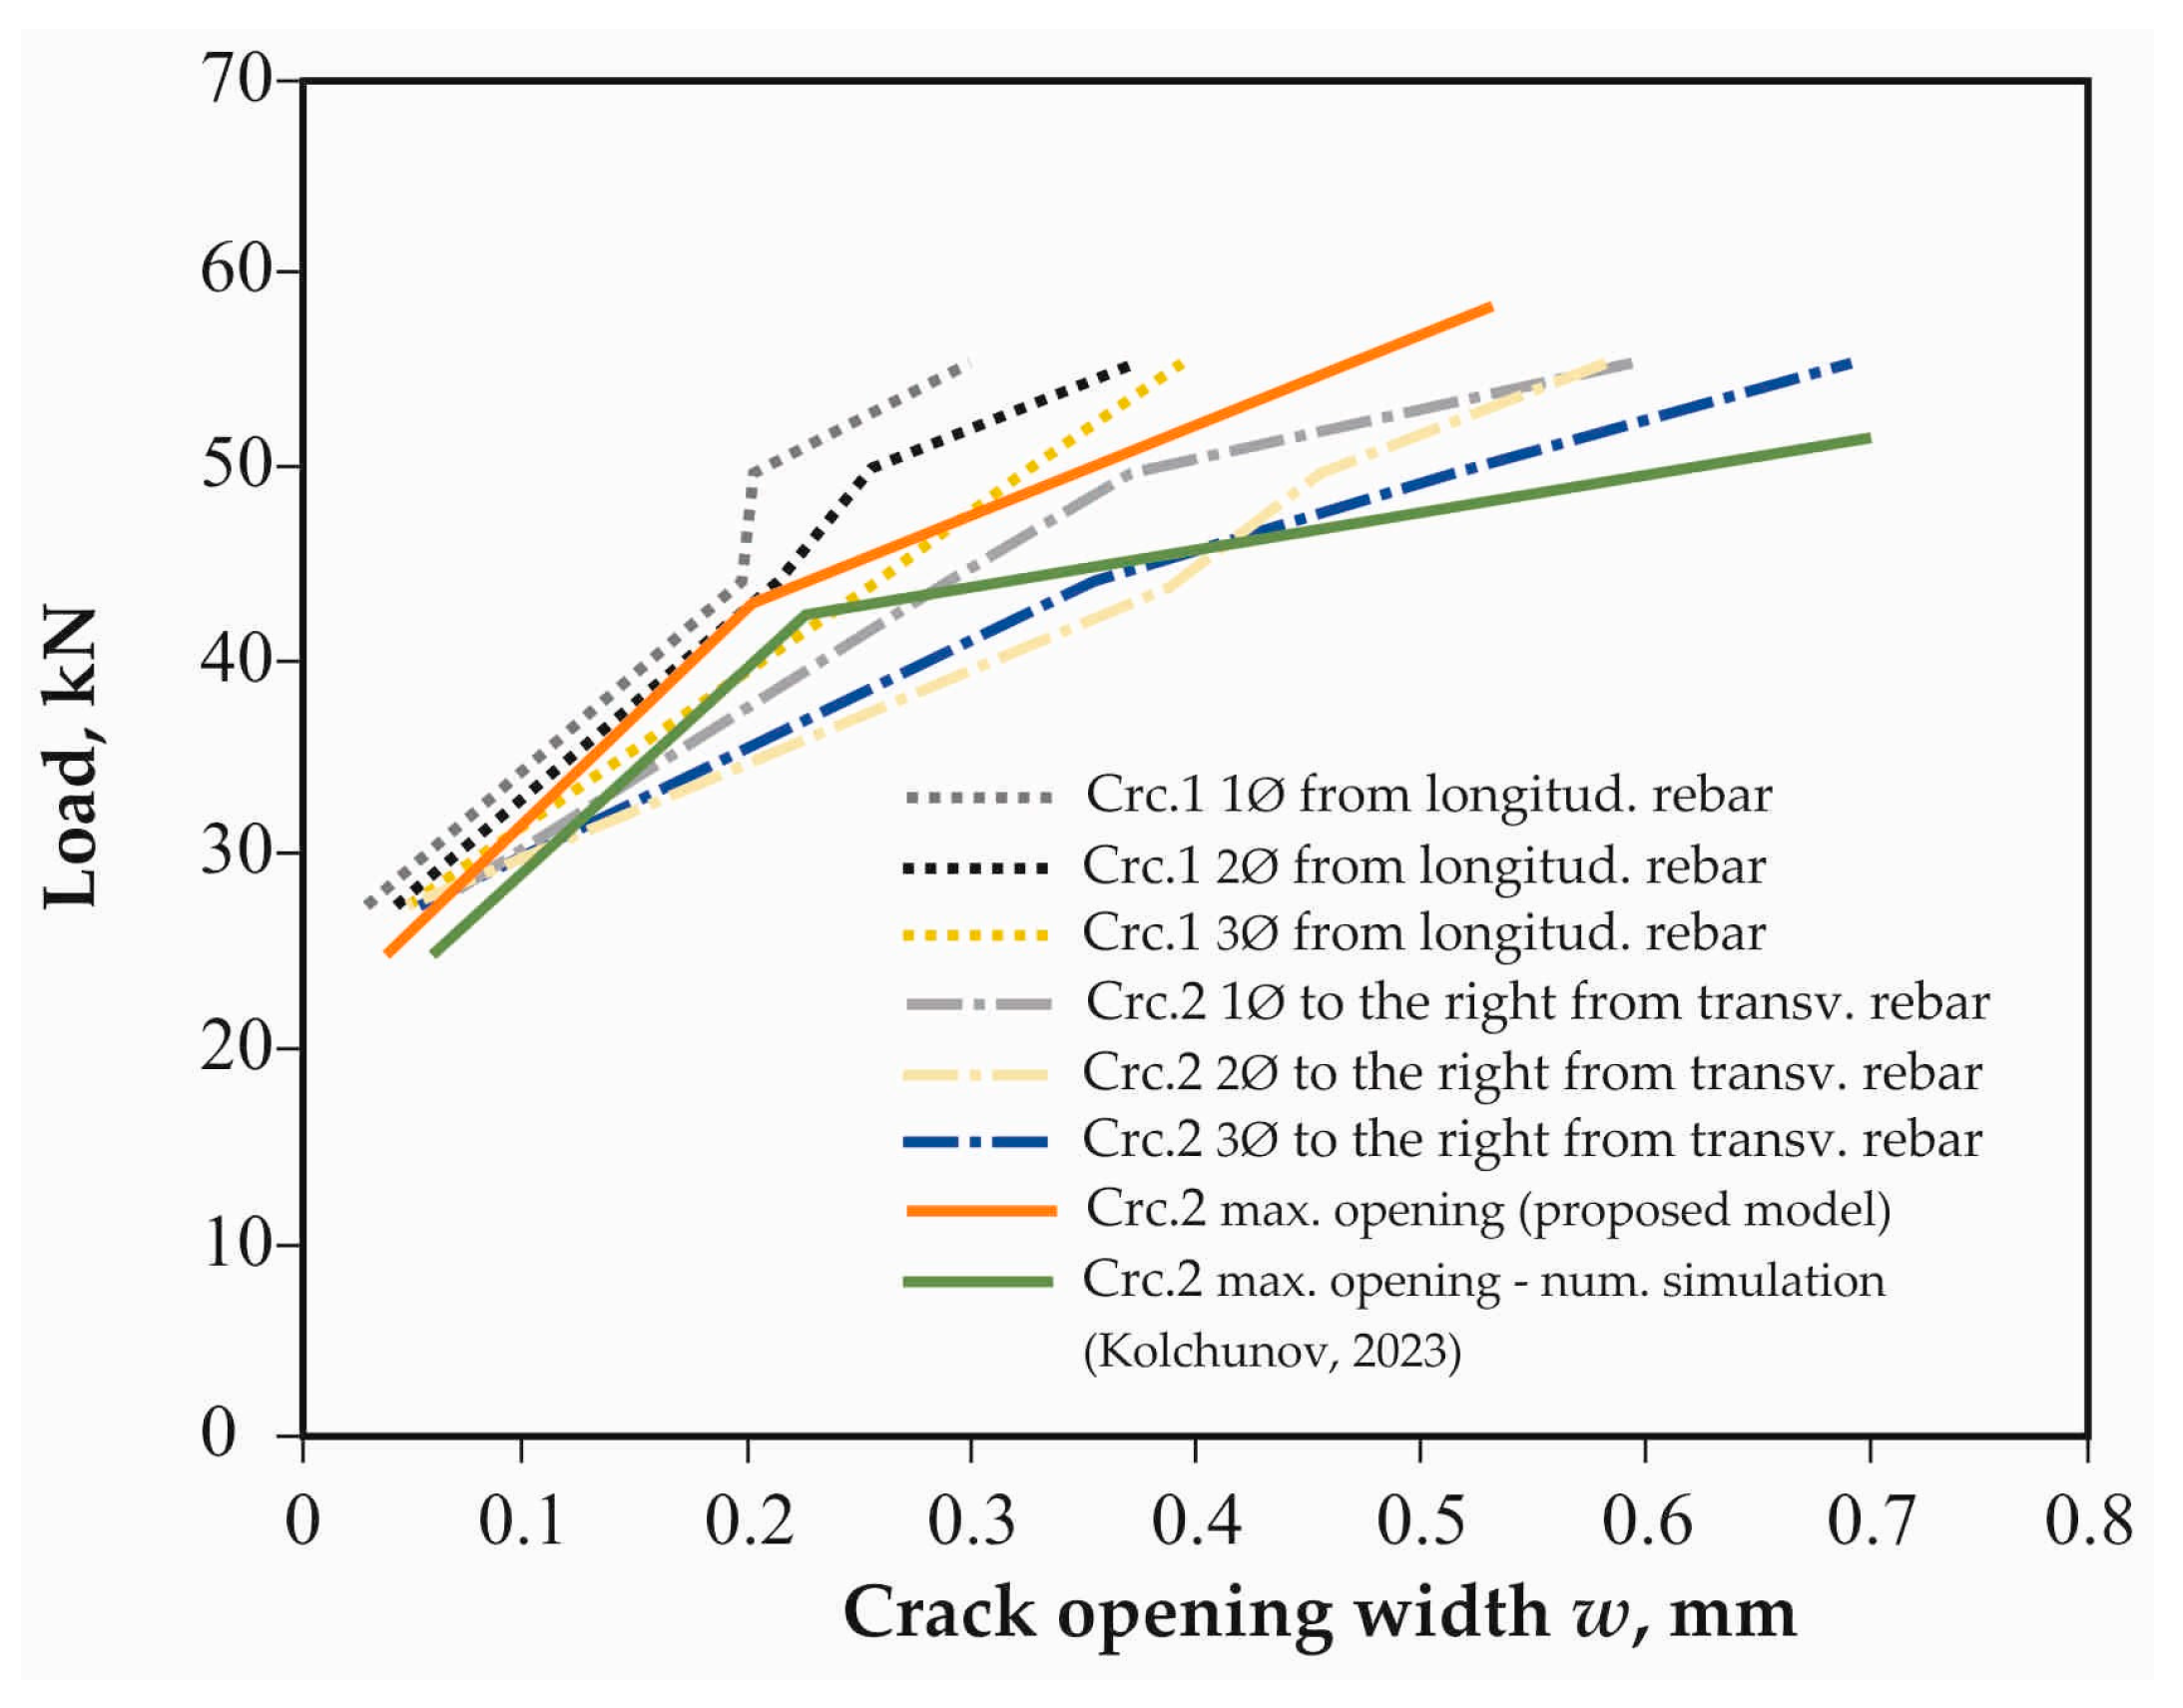
Figure 16,
Figure 17 and
Figure 18 show plots of crack opening widths calculated using the proposed model and the experimental values as a function of load in the experimental reinforced concrete structures B2-1-2 (
Figure 16), B4-2-2a (
Figure 17), and B5-1-2 (
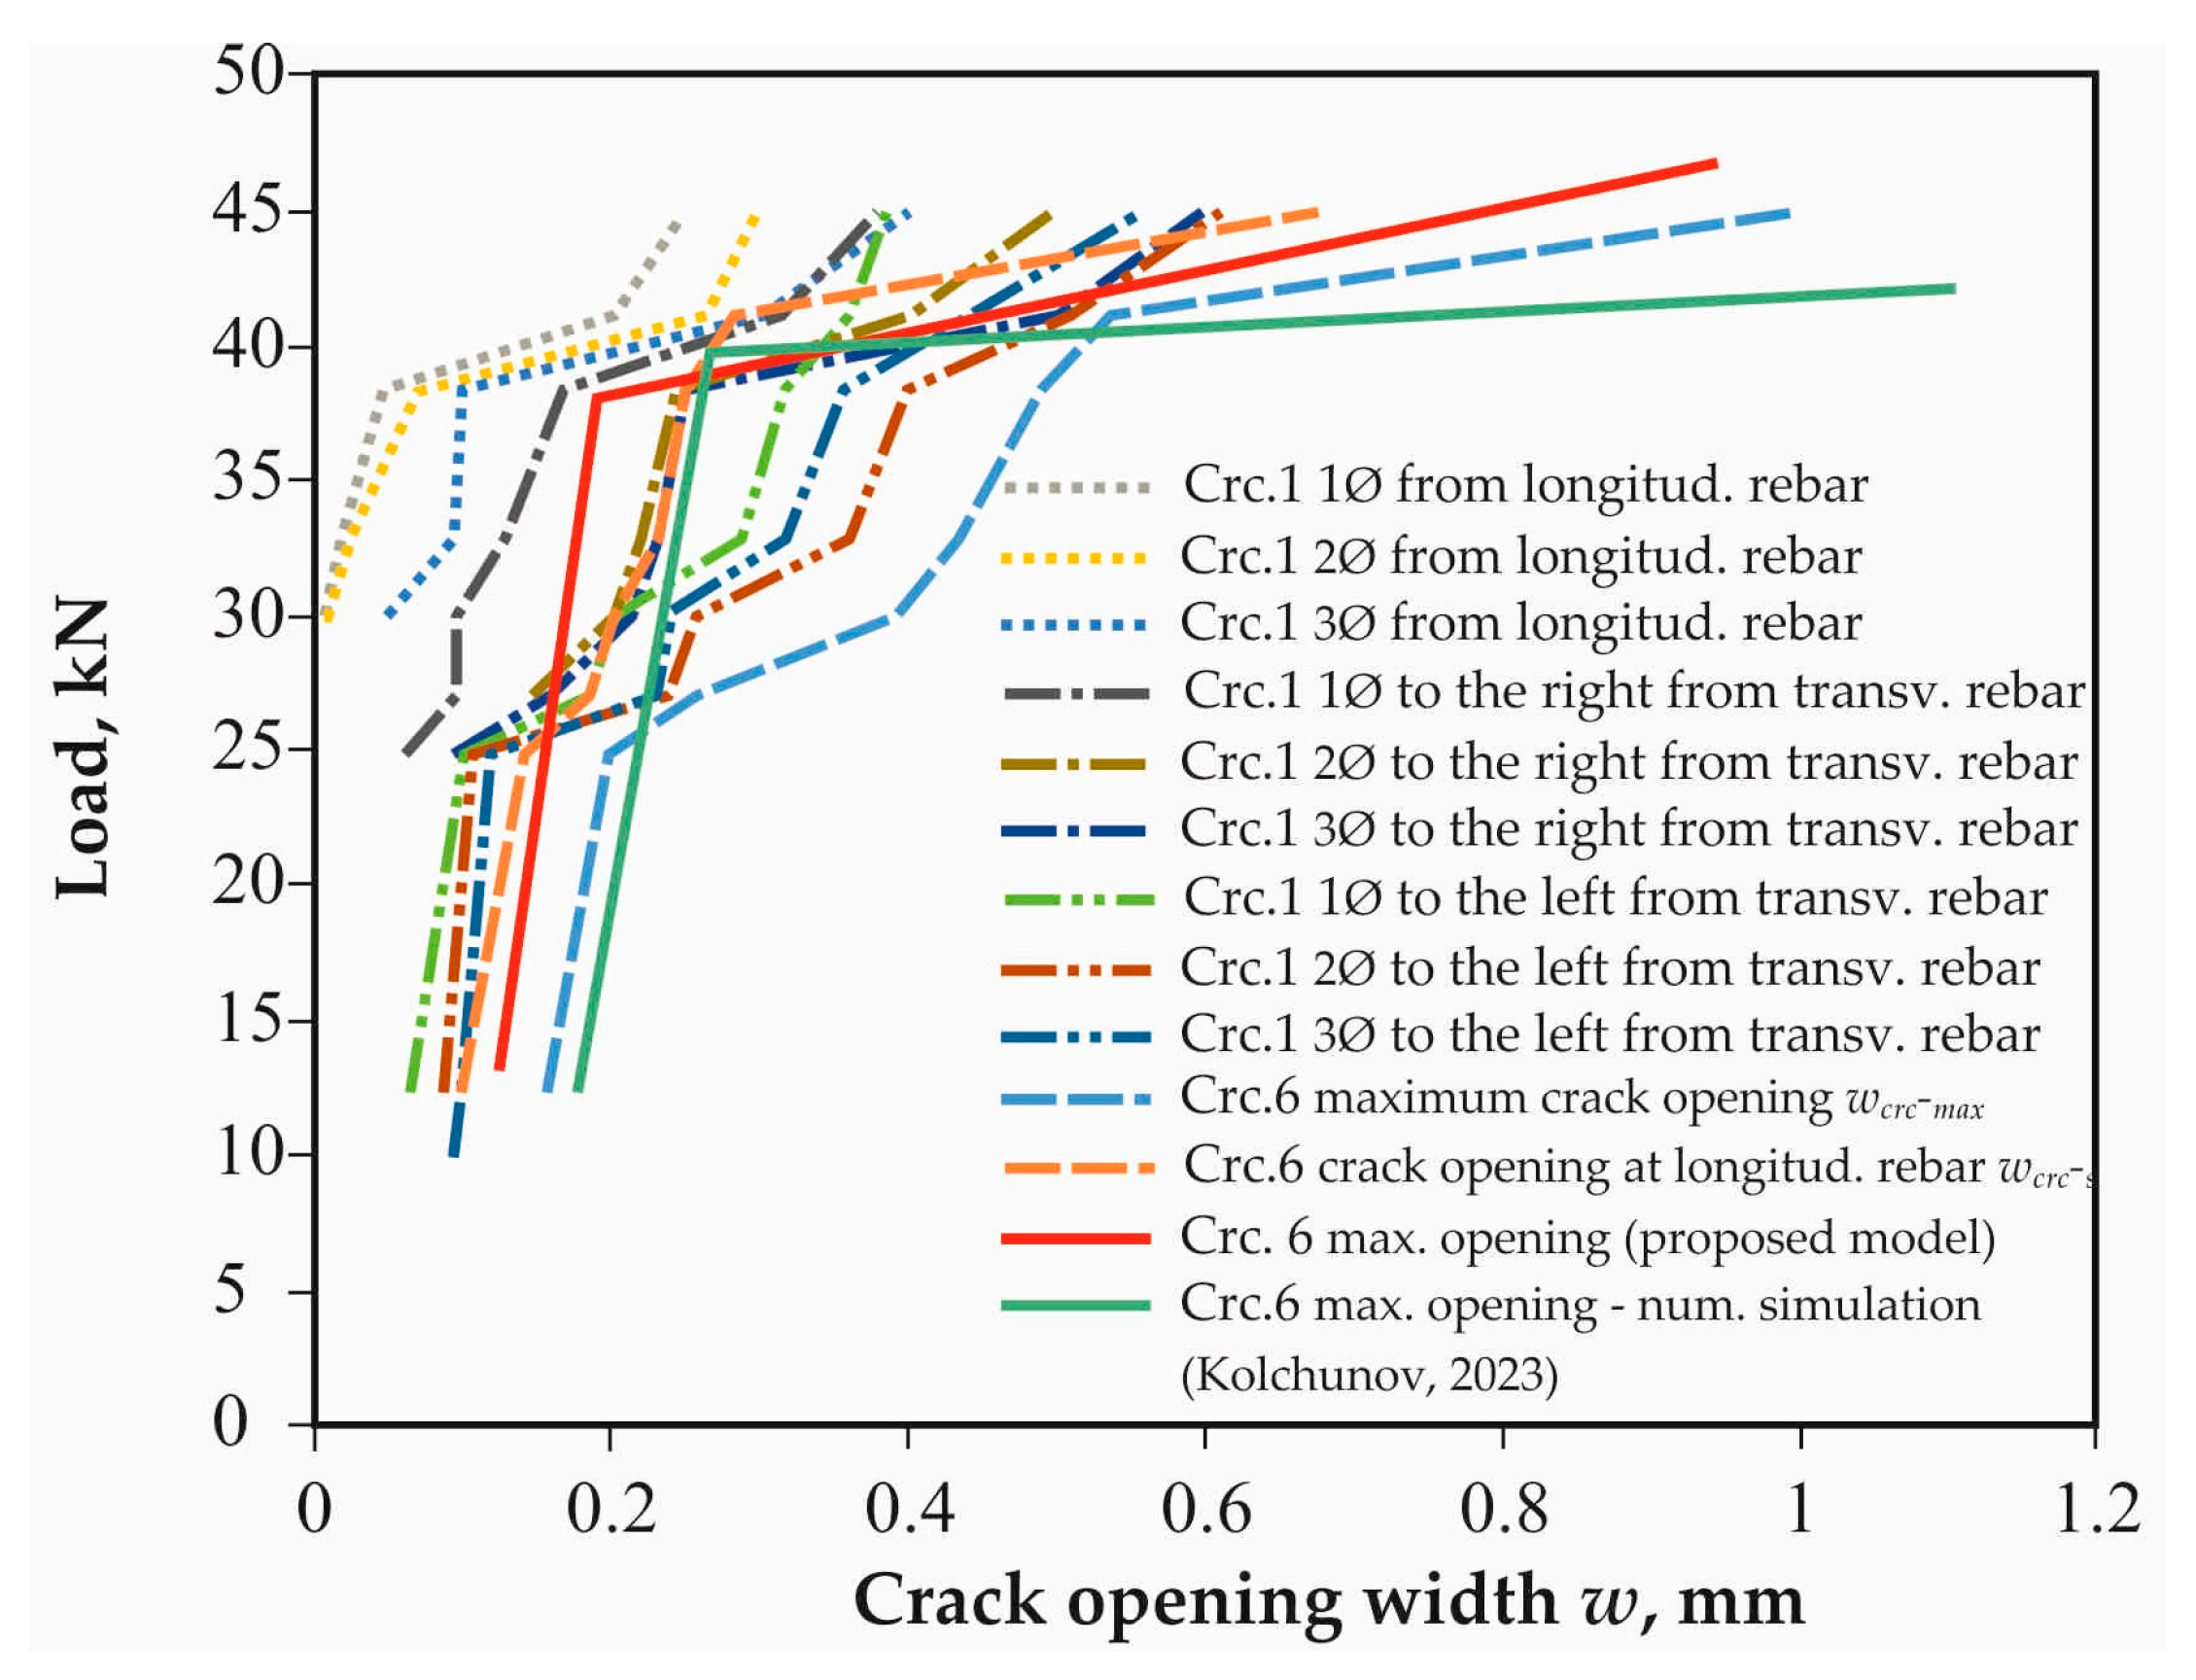
Figure 18). These figures contain data on the opening of irregular inclined cracks at different distances from the transverse and longitudinal reinforcement of the beams. Thus, for the cantilever and single-span beams shown in
Table 2, it is found that the opening width of the experimental propagating inclined crack crossing the stirrup at a distance of one to two diameters from the axis of the reinforcement was twice as large as at the level of the axis of the reinforcement. In particular, the opening of this crack at a distance of one diameter from the transverse rebar for B2-1-2 (
Figure 16) was
wcr = 0.066…0.384 mm, while at a distance of two diameters it was
wcr = 0.1…0.5 mm, and at a distance of three diameters it was
wcr = 0.096…0.6 mm, respectively.
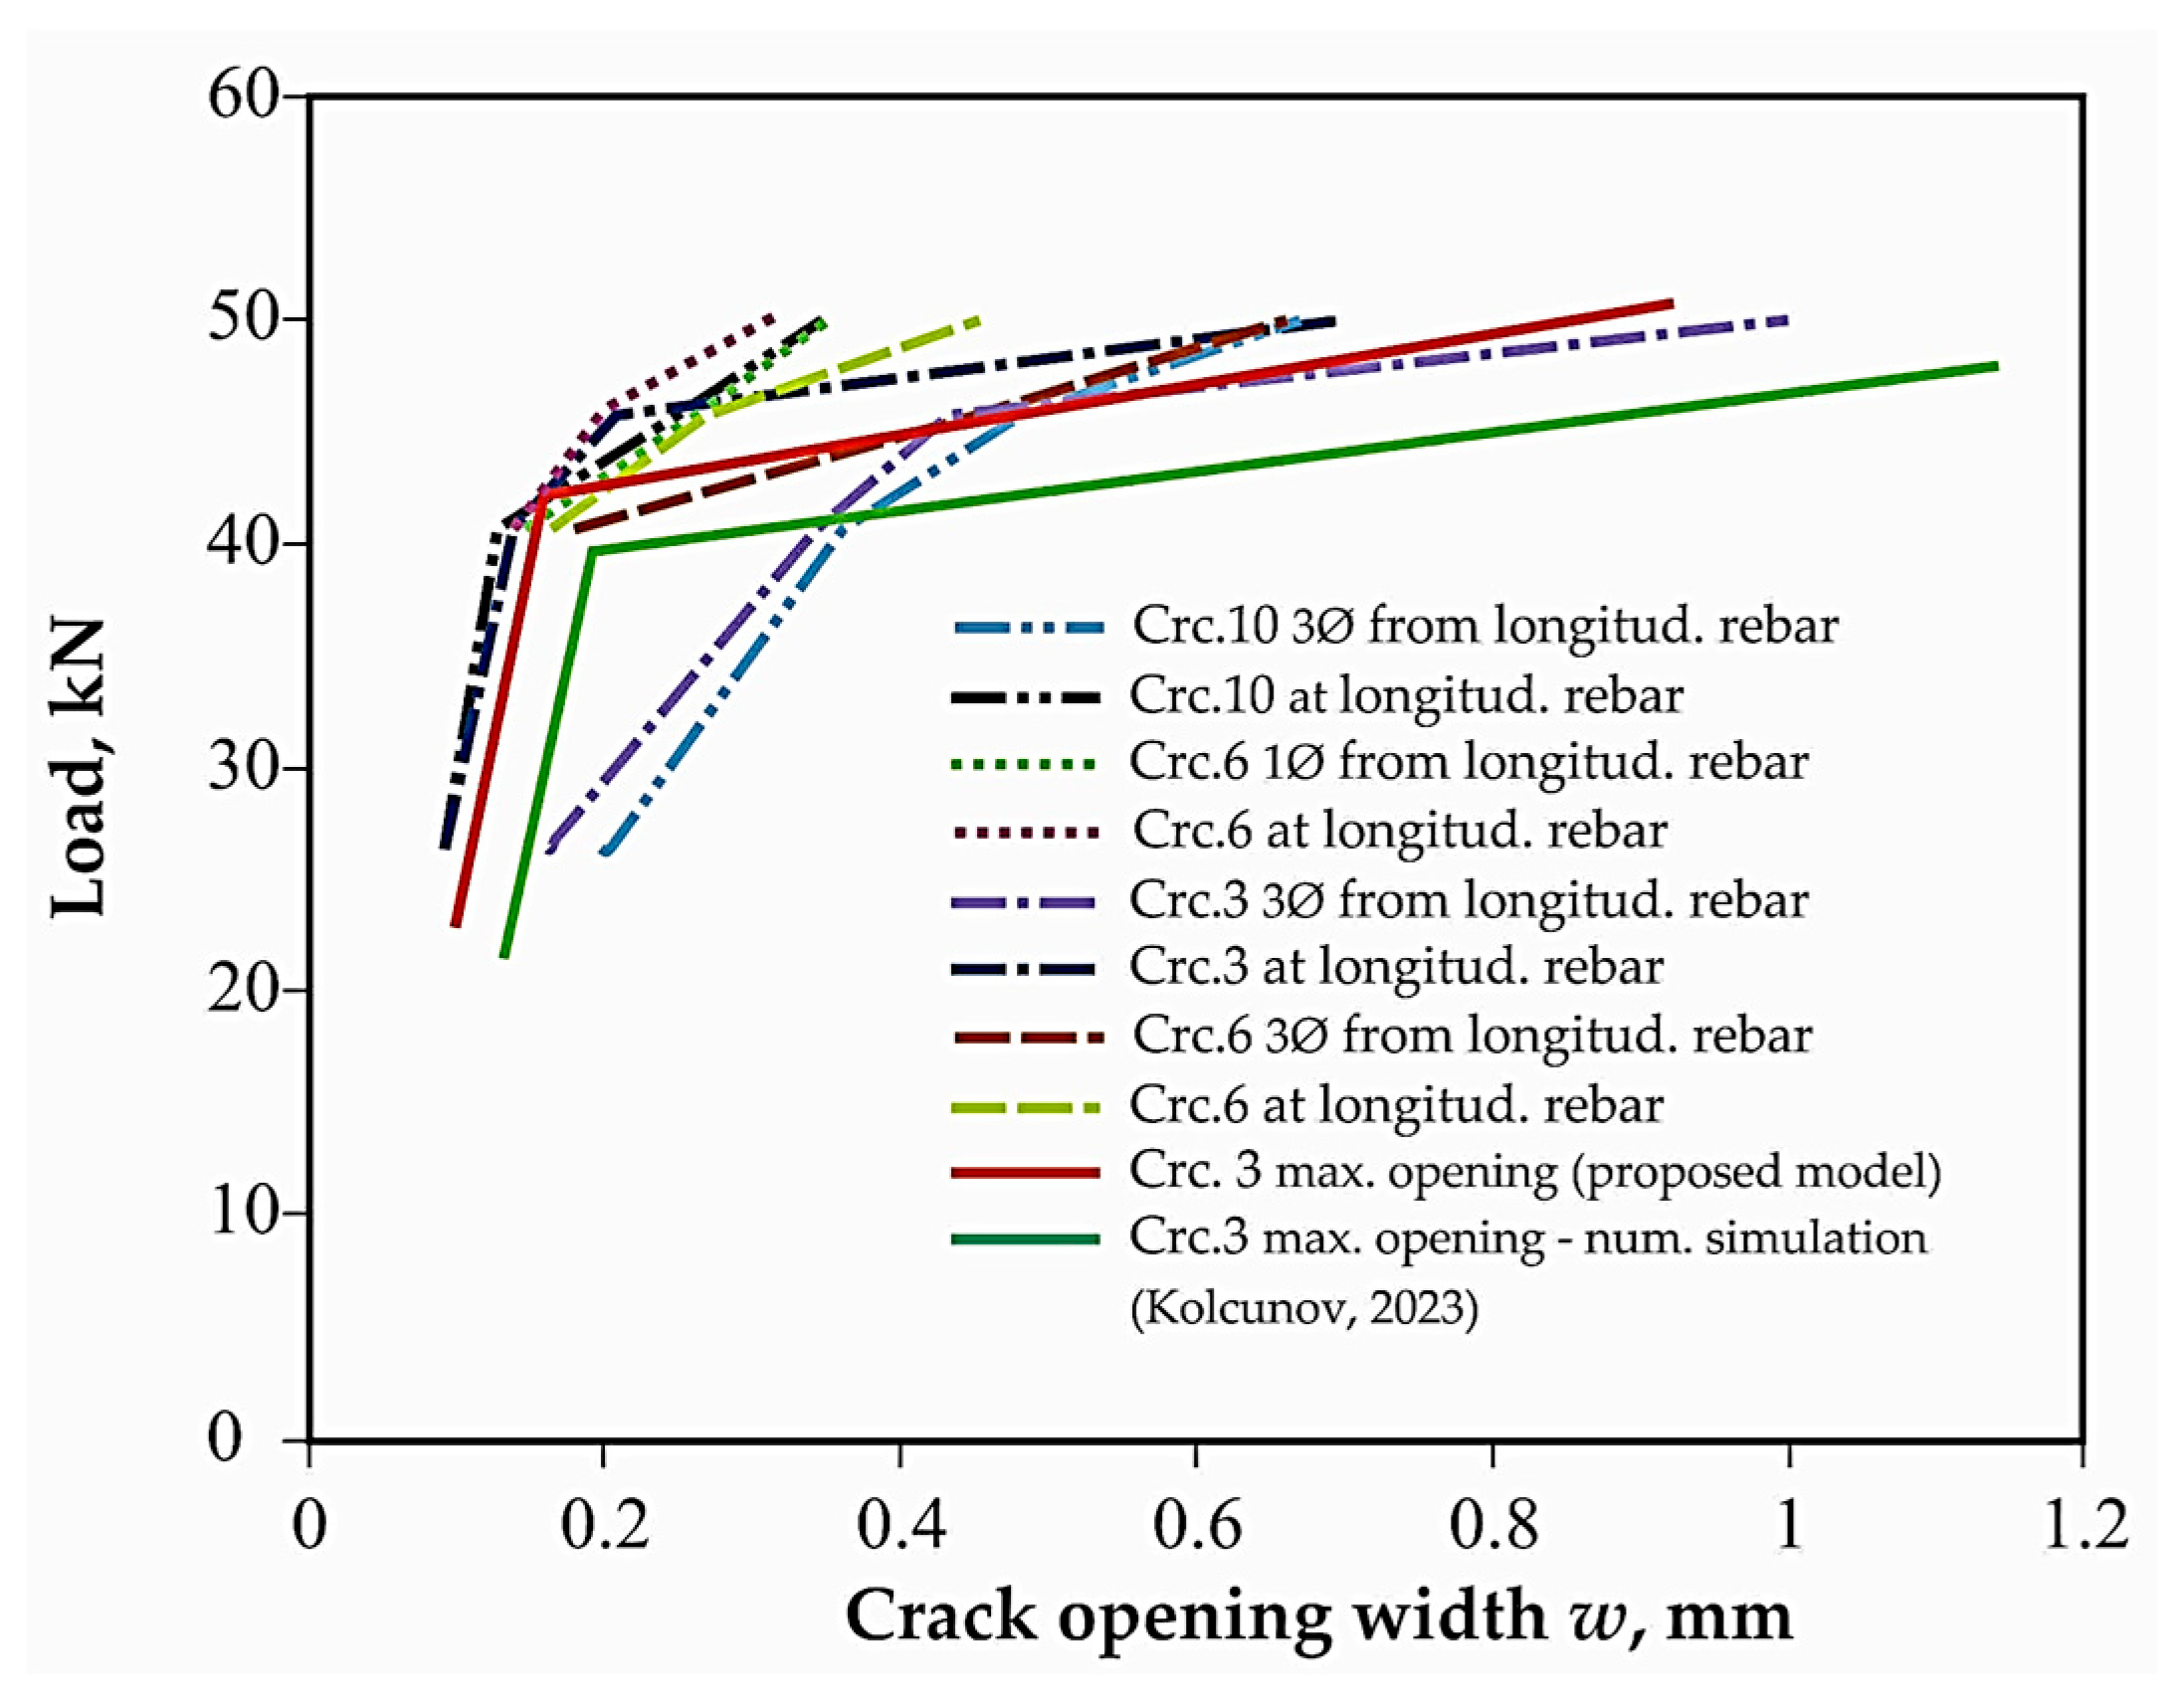
The similar pattern of change of crack opening width along its length in relation to the distance from transverse and longitudinal reinforcement was observed for beam structures of all tested series (
Figure 17 and
Figure 18).
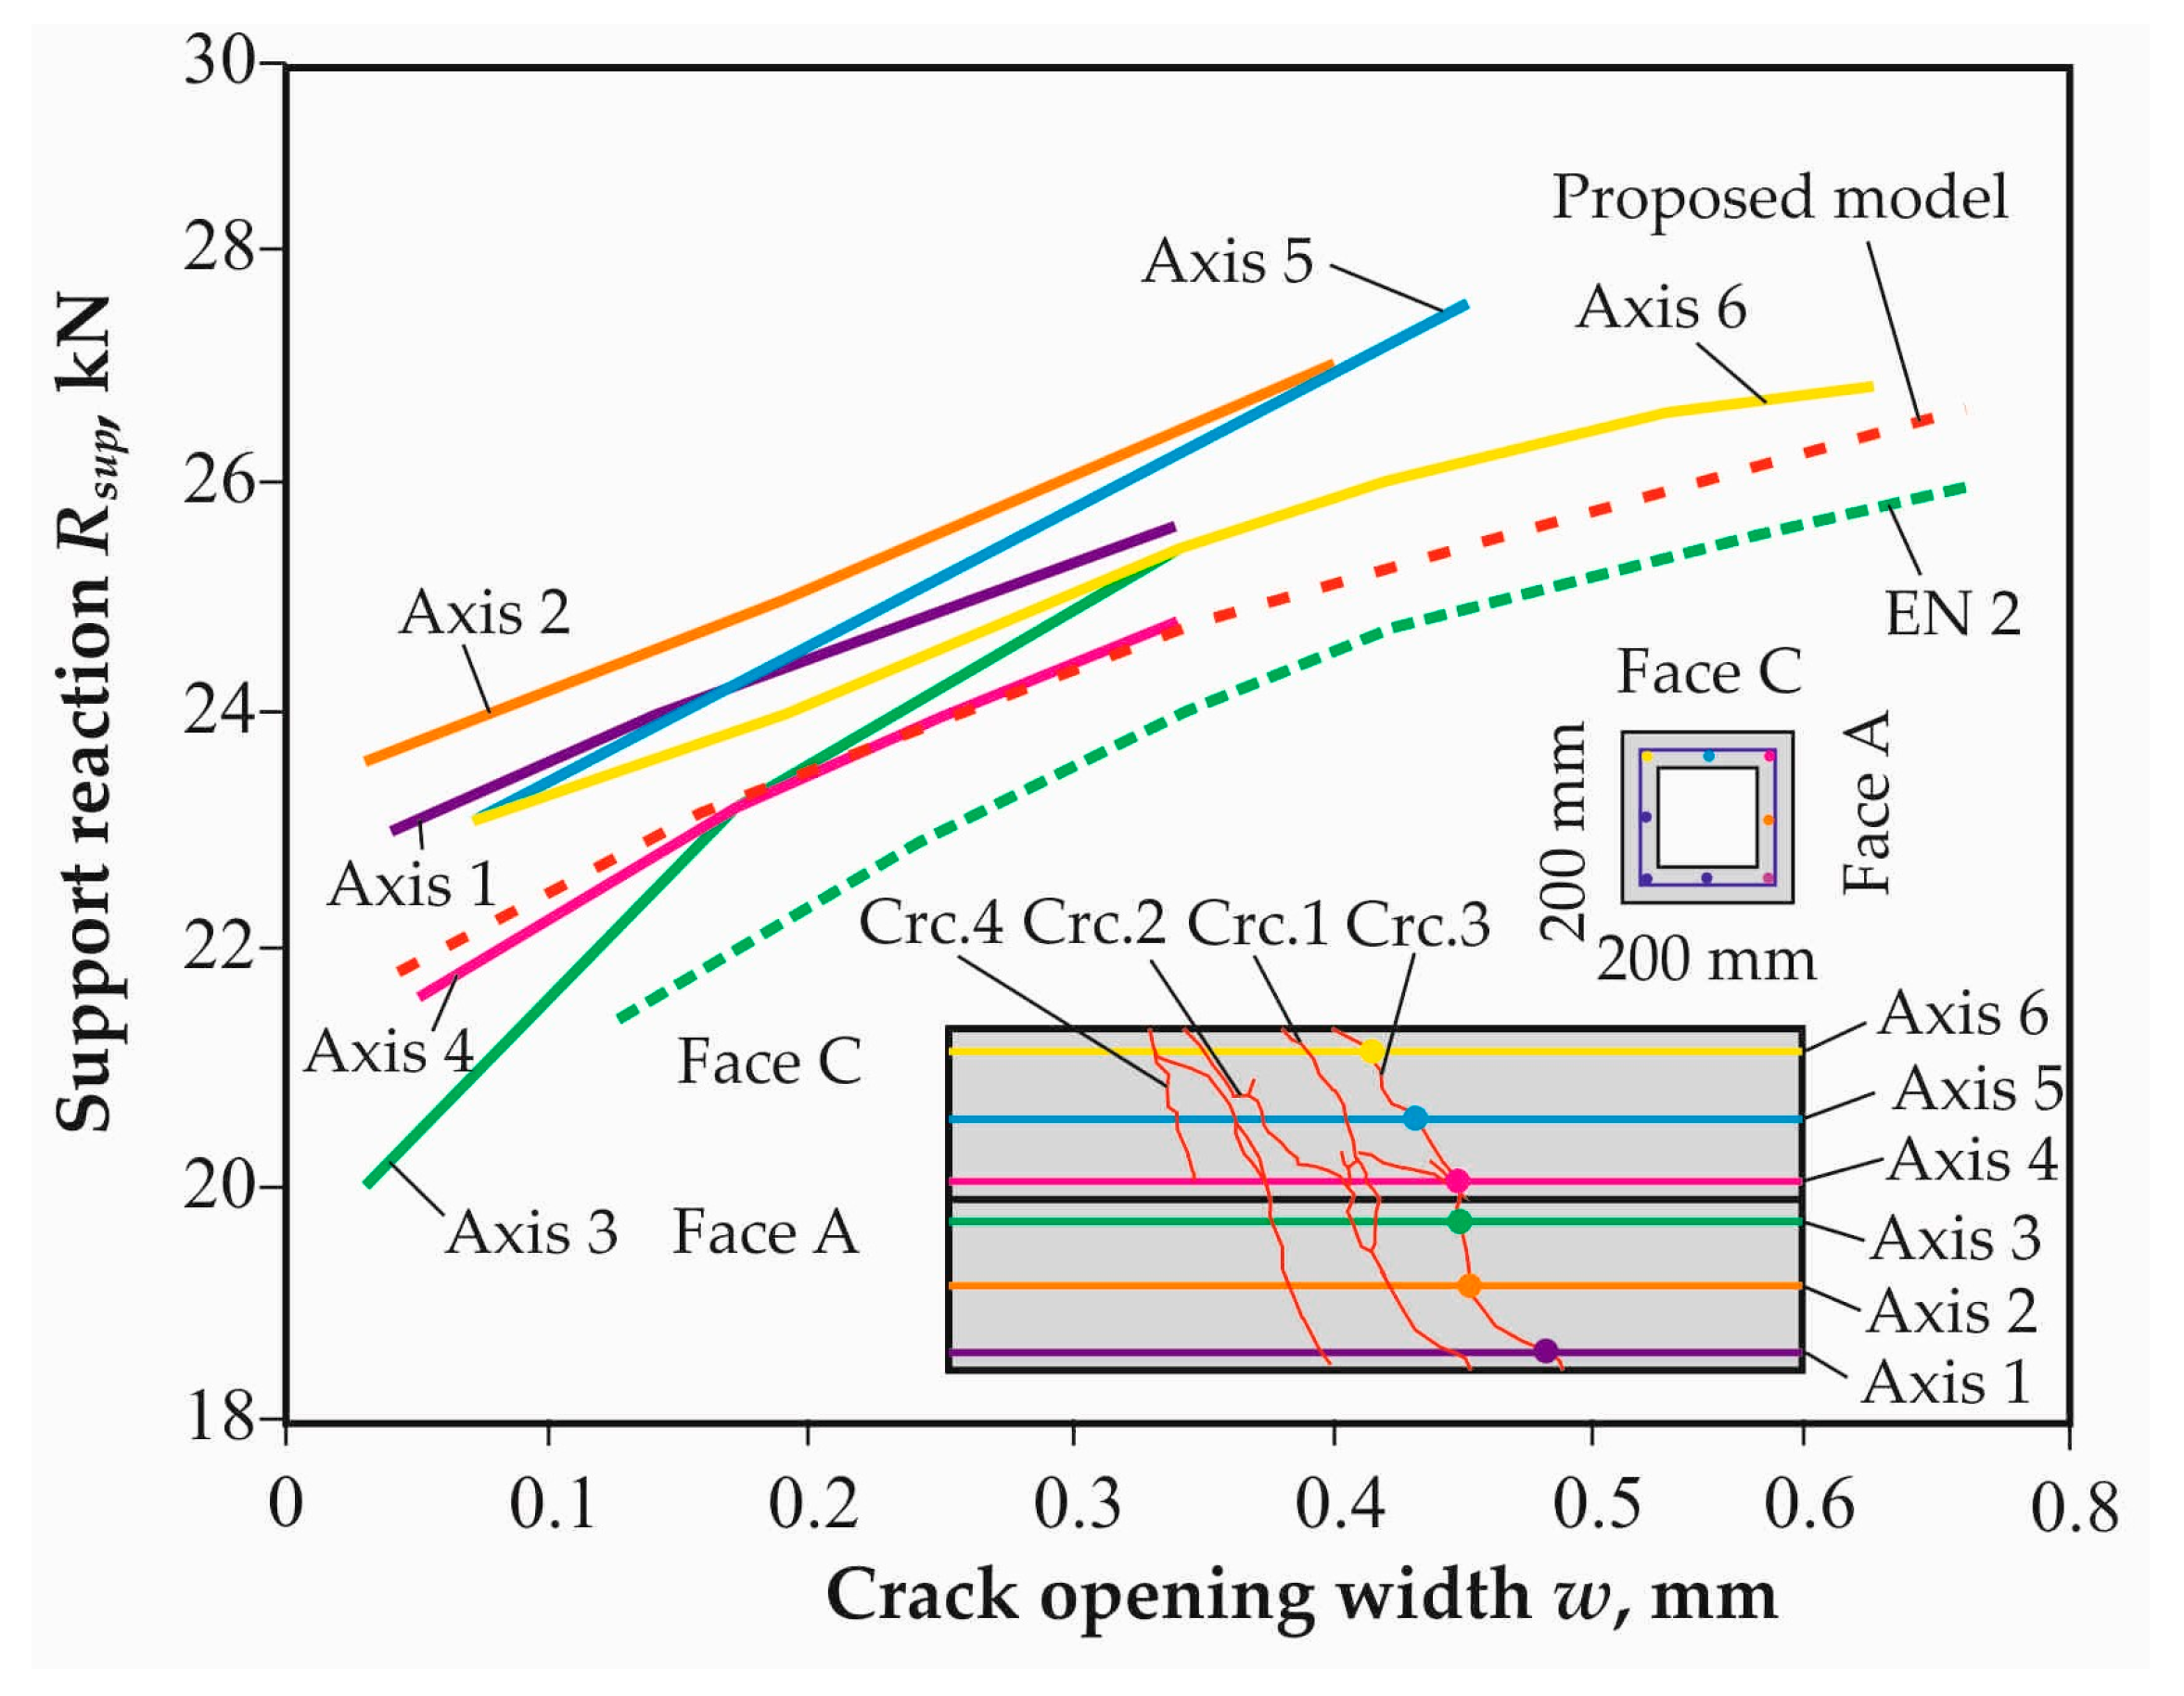
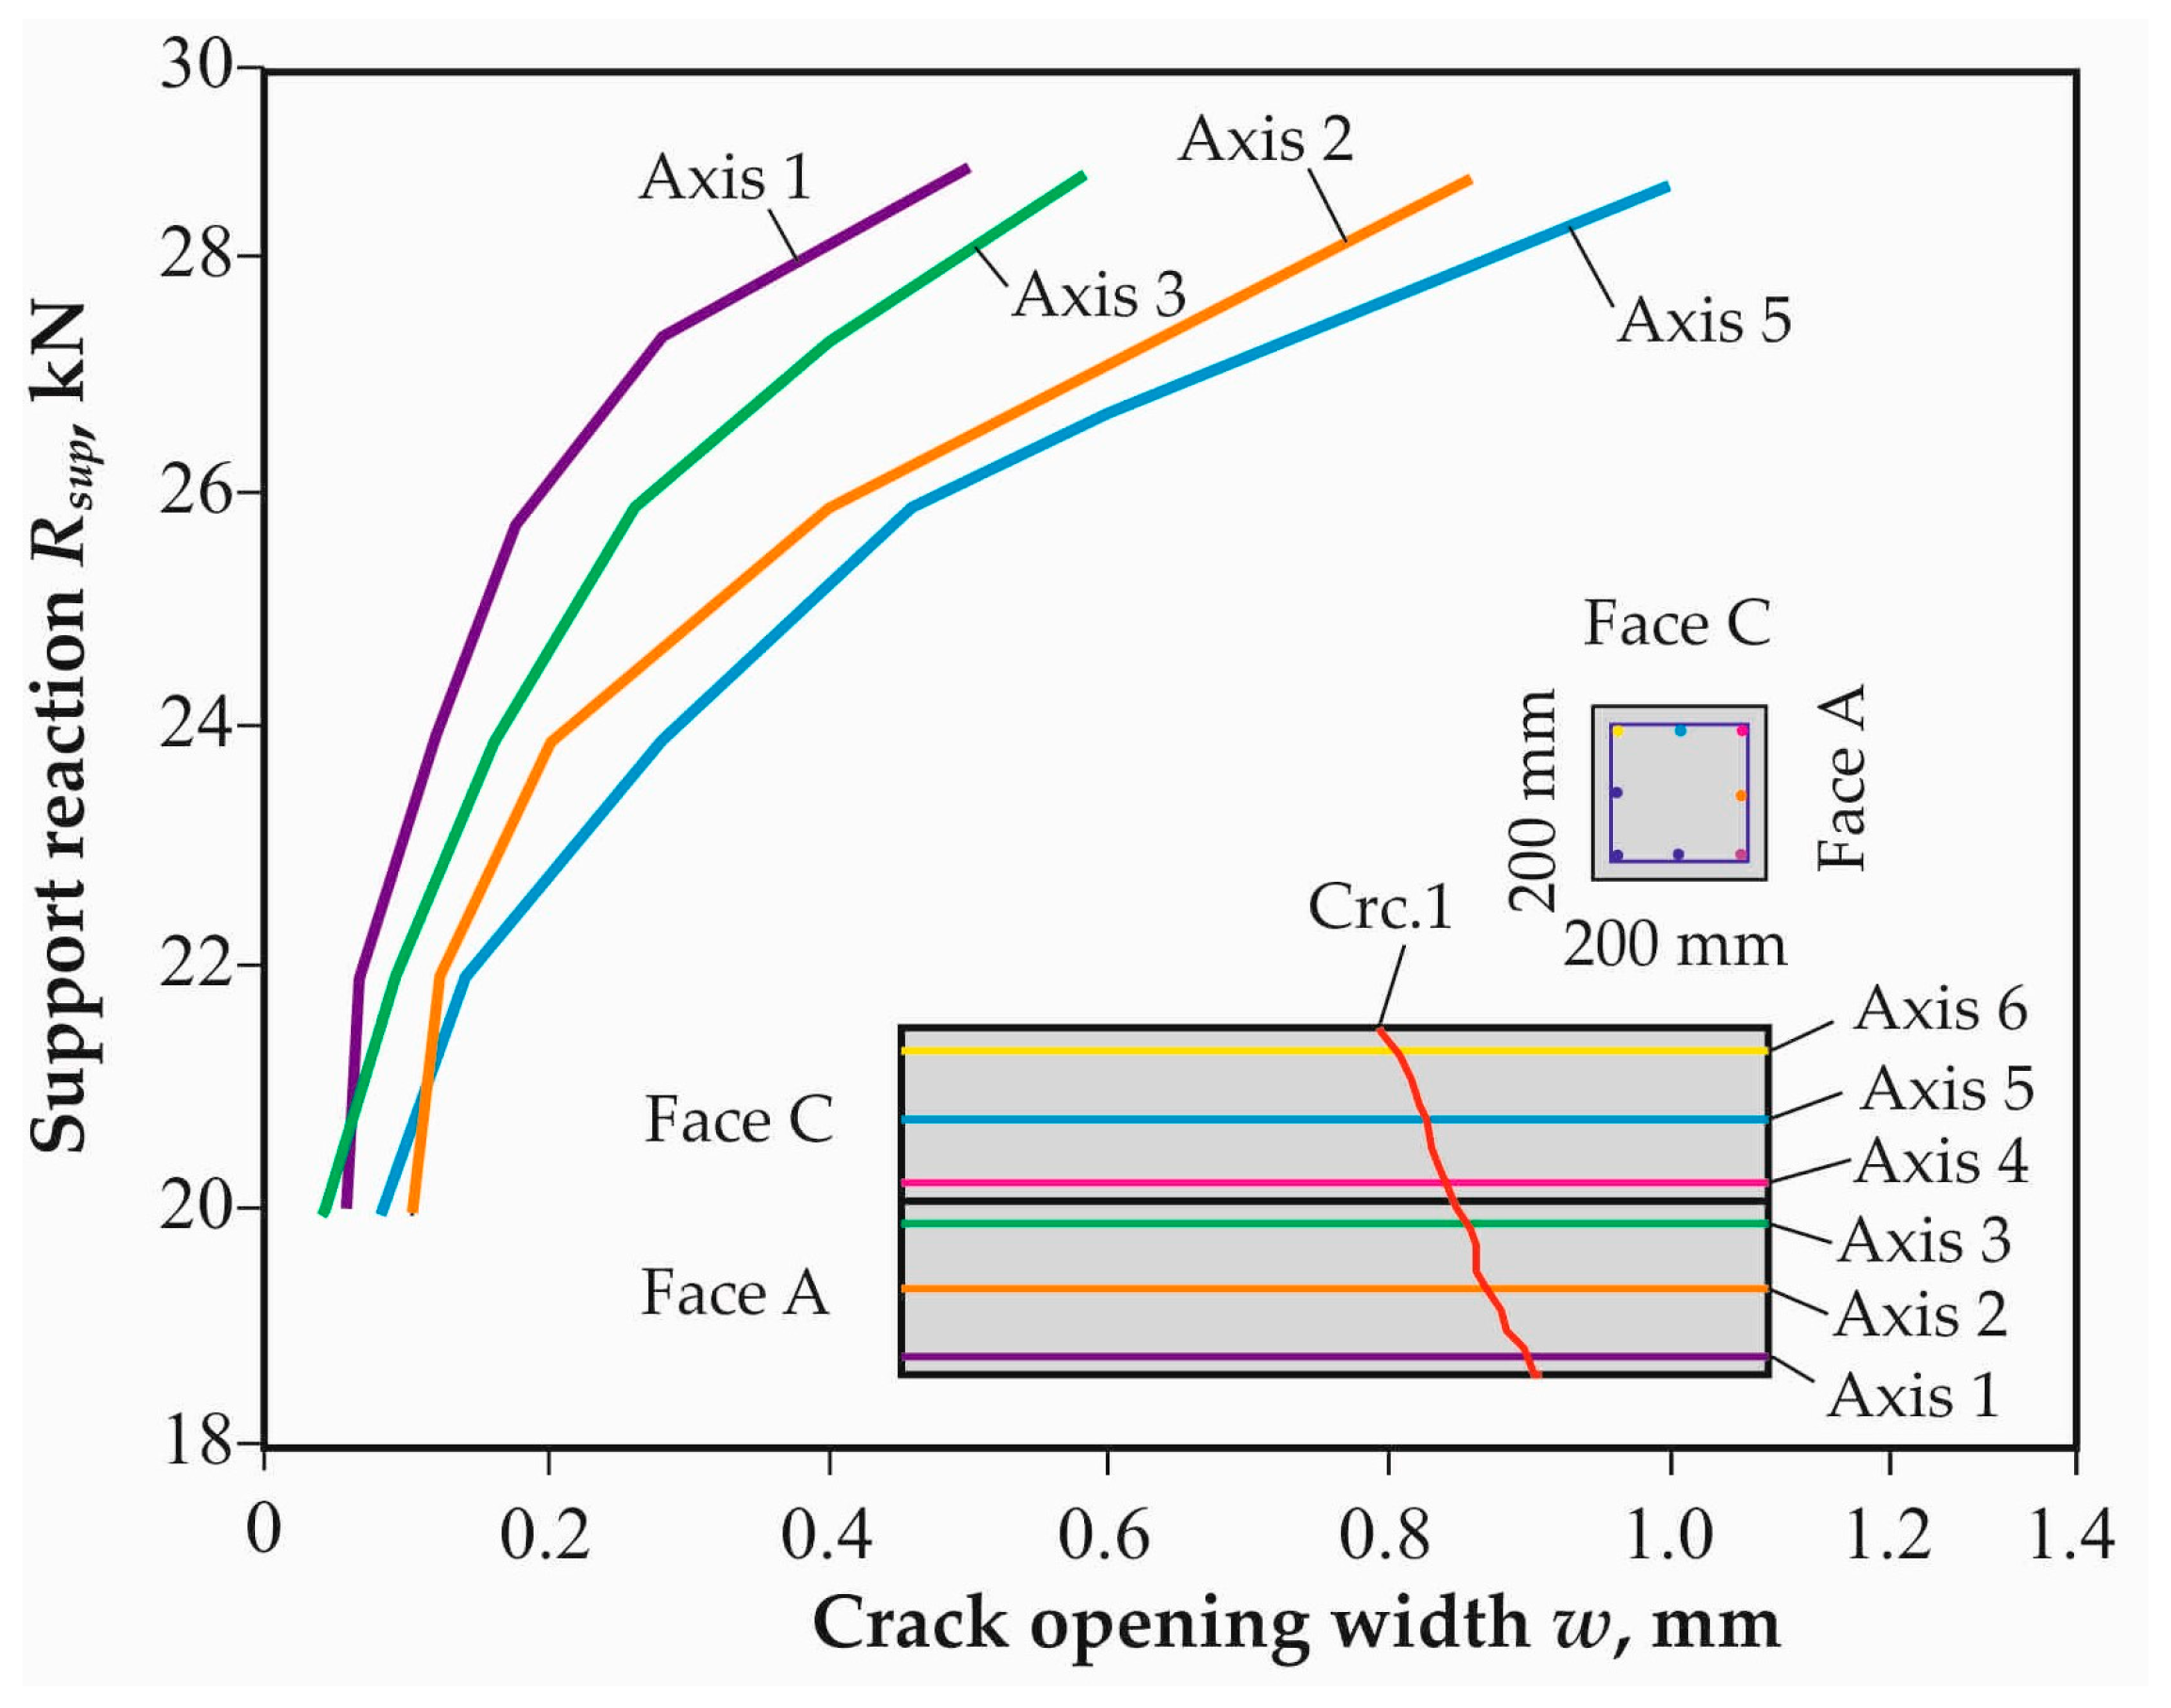
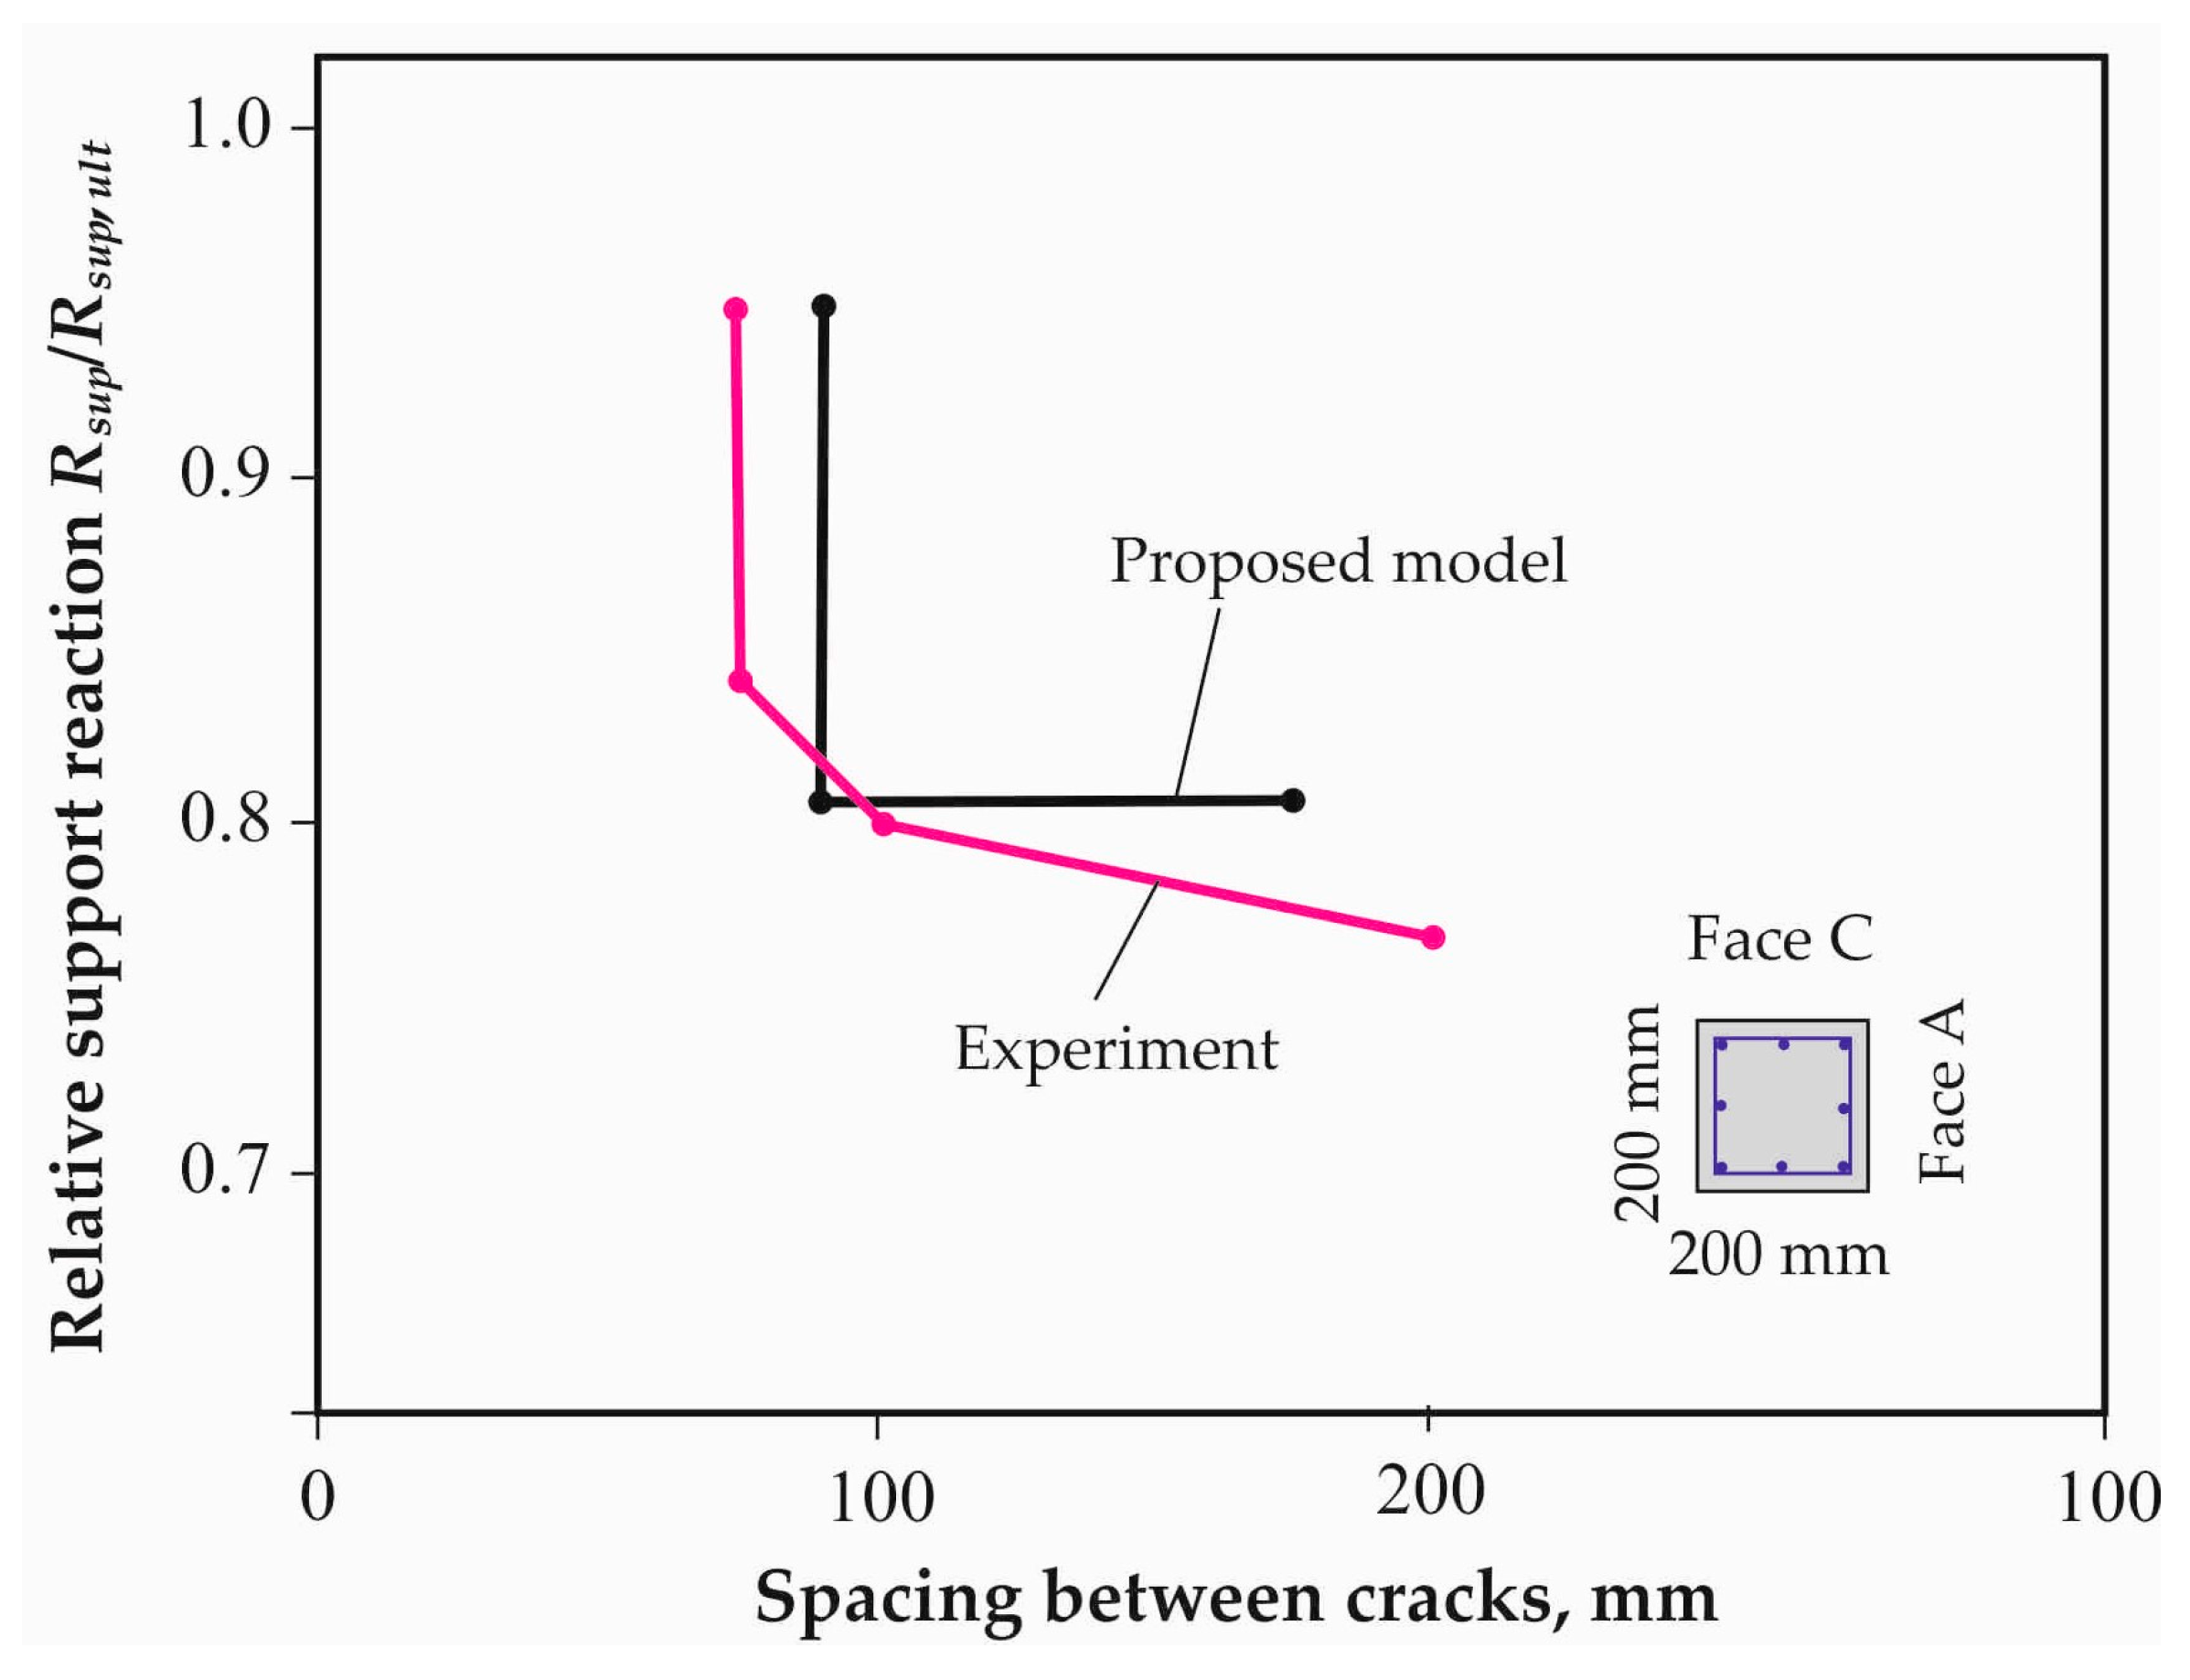
The comparison of calculated and experimental diagrams of relative crack opening width w vs. support reaction
Rsup for high-strength reinforced concrete beams BH-S-410 of solid section and beams BH-B-410 of box section, shown in
Figure 19 and
Figure 20, made it possible to establish the following.
In continuous section beams, a single spatial crack (Crc.1) appeared at the top tensile face C. This crack propagated to the lateral faces of the structure toward the compression zone. The maximum width of this crack opening was at a distance of two to three diameters from the axis of the longitudinal reinforcement located at the top edge of the beam (curve 2). The crack opening at the intersection with the longitudinal reinforcing bar level was less than twice as wide. This difference increased as the load increased.
All known design models and current standards include such design parameters as mean or base crack spacing [
10,
11,
12,
13,
14,
15,
16,
19,
24,
25,
54]. However, in a number of experimental studies, such as the recent experiment conducted by Chiu et al. [
10] for high-strength reinforced concrete beams, it was found that with increasing load, the bending crack opening width becomes proportional to the stresses in the tensile reinforcement after the mean crack spacing stabilizes. Using the proposed model and the level value of crack spacing, it was found that for high-strength reinforced concrete beams (BH-B-410) under a three-dimensional state, the design value of this parameter is more conservative than its experimental value. The ratio of experimental and calculated crack spacing is shown in
Figure 21. It can be seen that for high-strength concrete structures, stabilization of this parameter occurs relatively quickly even in the case of multiple crack formation instead of a single crack. The load range for this process was relatively short in our experiments, in contrast to structures made of ordinary and light concrete. This largely determines the calculated value of the crack opening width in high-strength reinforced concrete structures.
Similar results for the change in the primary crack profile have been observed in the testing of deep beams [
8,
29]. Comparisons of the theoretical relative values of the crack opening width in the high-strength concrete beam showed that the calculated values under the assumption of a linear crack profile according to the Eurocode [
15] (curve 3) significantly overestimated the value of this parameter. The relative values of the crack opening width calculated with the proposed model (curve 4) were more consistent with the experimental results for high-strength reinforced concrete structures, in which a single crack appears under the considered stress state.
It is also appropriate to note that the model of regular cracks for modeling the considered type of single cracks did not reflect the physical essence of cracking obtained in the experiments.
In the beam BH-B-410 of box cross section, the first spatial cracks also appeared at the upper most tensile face C under a similar stress state to that shown in
Figure 19. However, due to the pliability of the cross-sectional contour of this structure, several cracks marked 2, 3, 4 sequentially appeared at the first stages after the crack initiation. Then, as the load increased, the progressive opening of only one of these cracks (Crc.3) occurred and the structure collapsed. Comparison of the experimental relative values of the crack opening width for this crack with the calculated values according to Eurocode 2 and according to the proposed model also showed that the proposed model was closer to the experimental data due to the deformation effect.
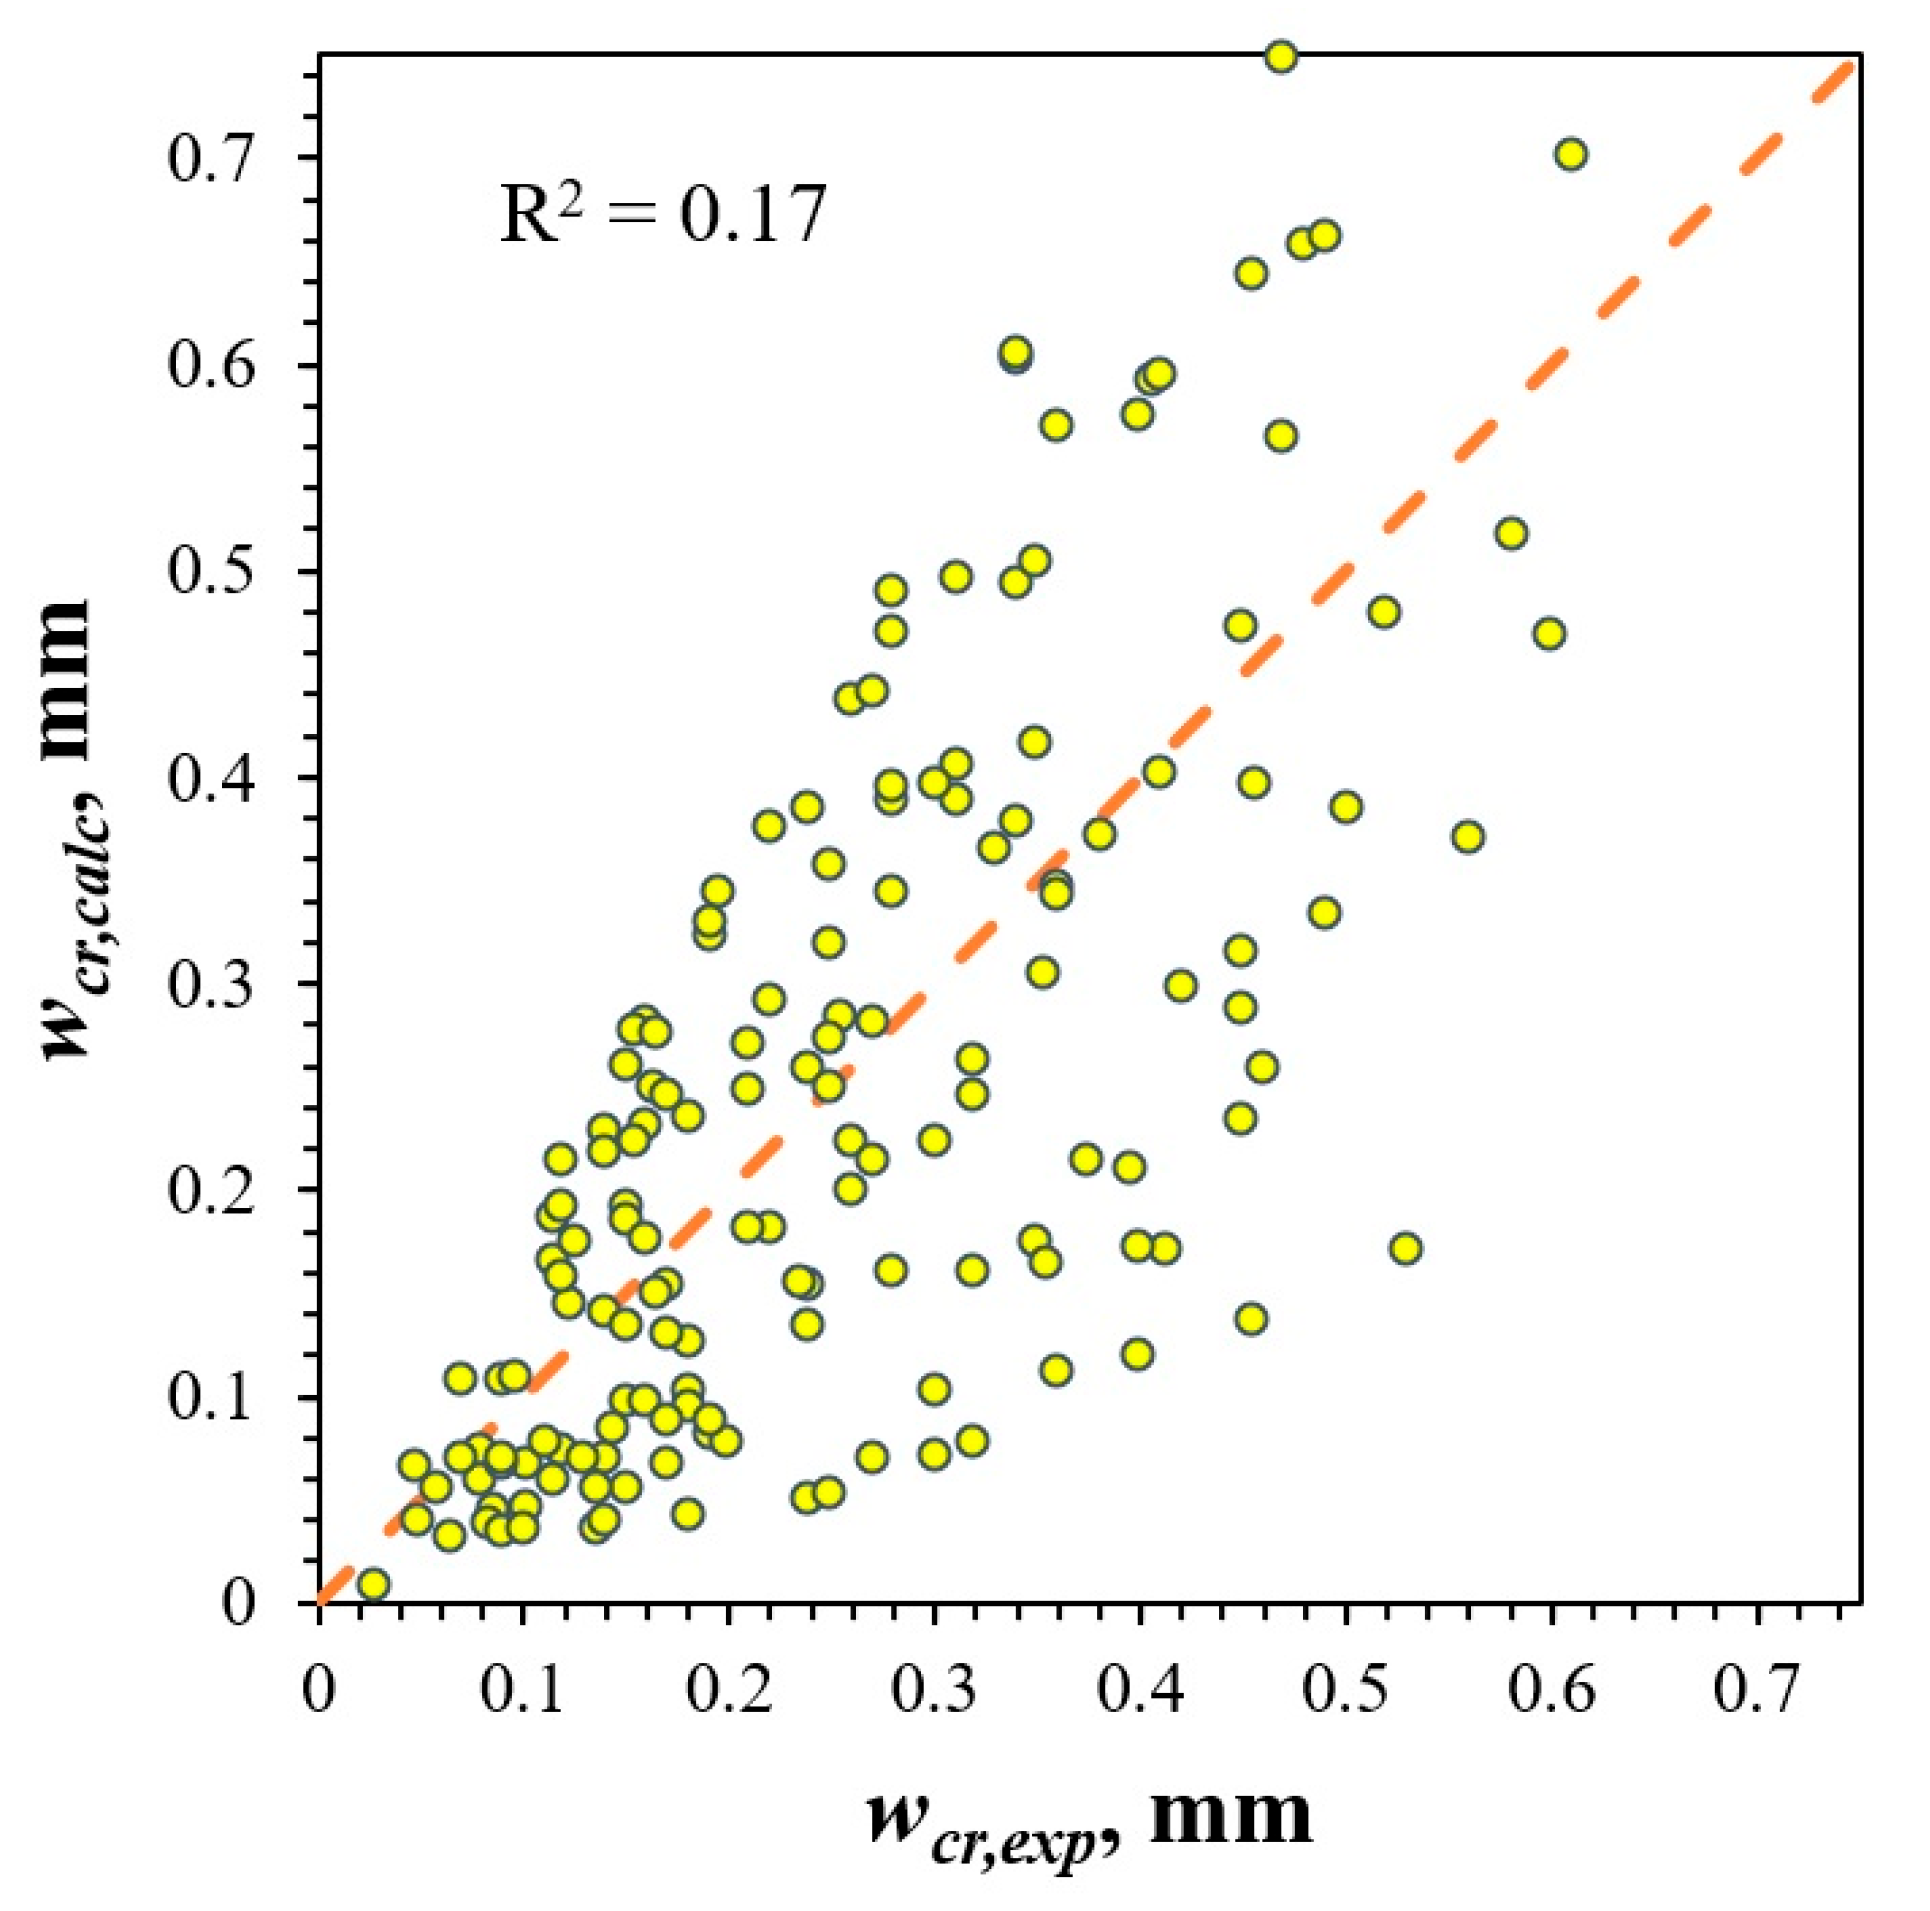
The validity of the proposed model was assessed by comparing it with experimental datasets, which included 162 maximum crack opening width values presented in this study and in the scientific literature [
55,
56].
Figure 22 shows the maximum crack opening width according to the proposed model vs. the experimental data presented in this study and in [
55,
56]. The coefficient of determination was R
2 = 0.17. Study [
4] provides a comparison of crack opening width prediction results obtained using various artificial intelligence tools and codes of practice, as well as 675 results from experimental studies of reinforced concrete beams with different designs. The authors note that the coefficient of determination was R
2 = 0.121 for the model code, R
2 = 0.12 for Eurocode 2, and R
2 = 0.13 for the ACI code.


 and
and 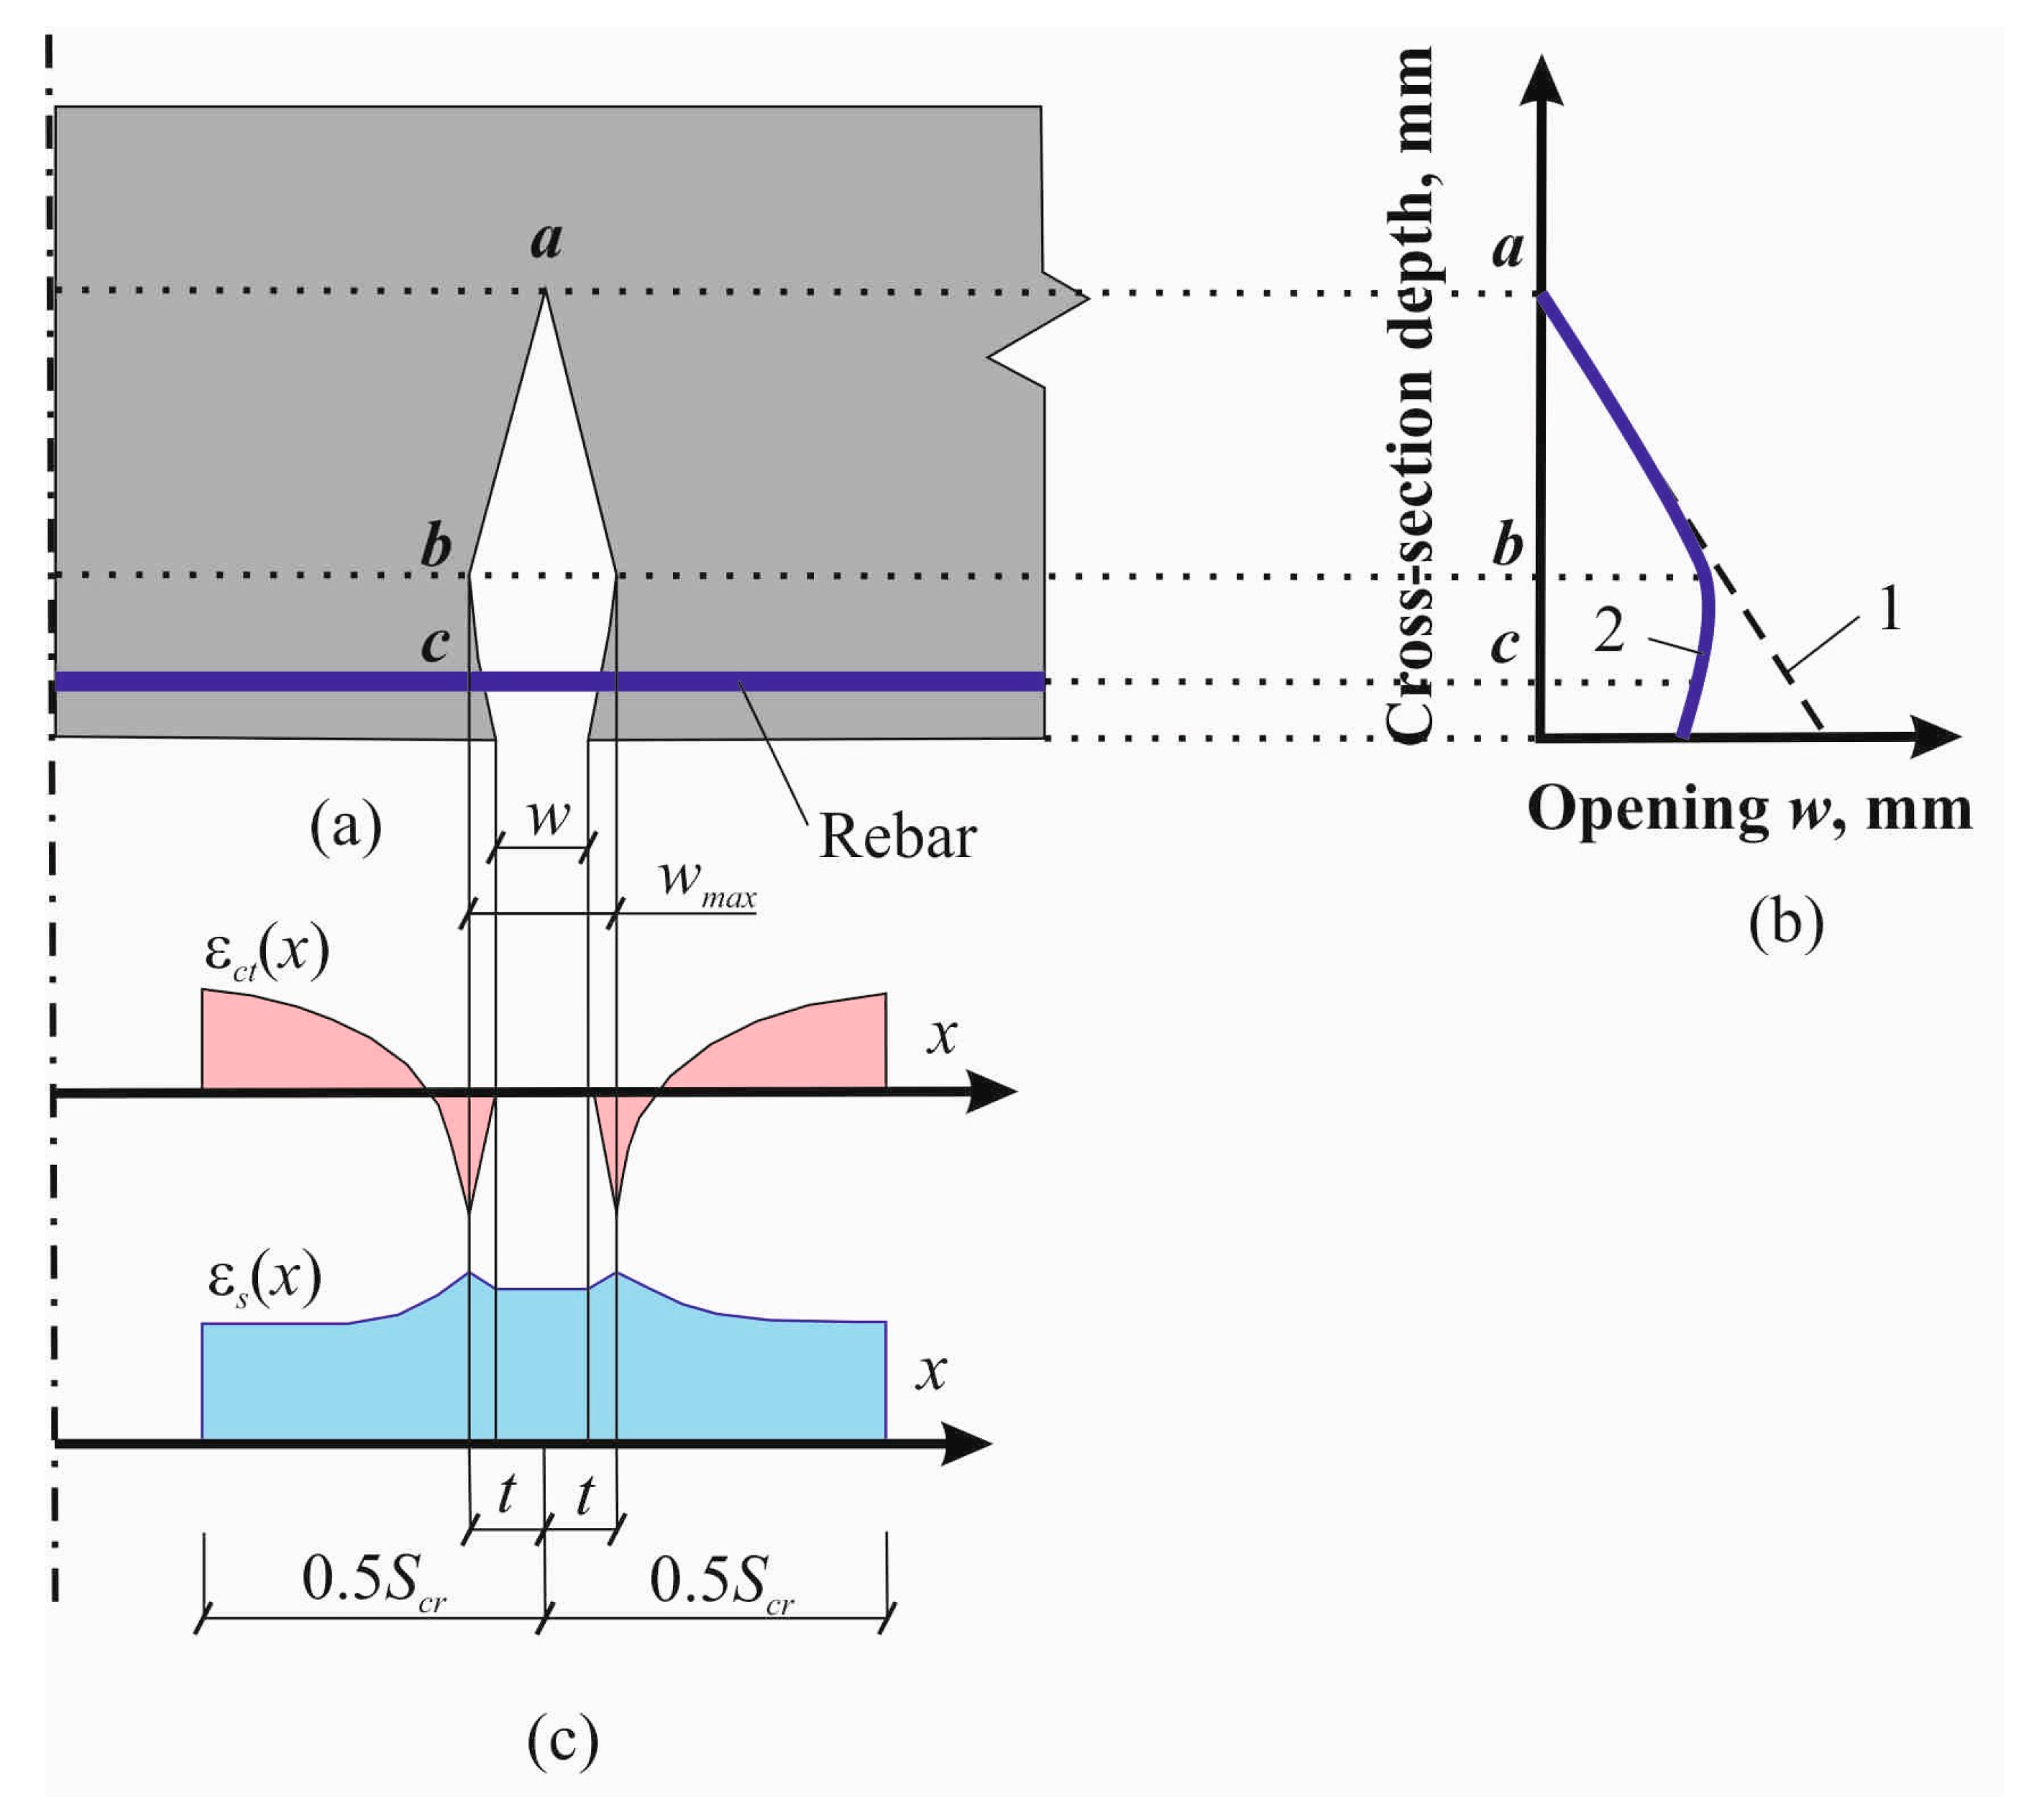


