
Reconciling Urban Density with Daylight Equity in Sloped Cities: A Case for Adaptive Setbacks in Amman, Jordan


Abstract
1. Introduction
2. Literature Review
2.1. Importance of Daylight in Urban Environments
2.1.1. Health and Psychological Benefits
2.1.2. Energy Efficiency
2.1.3. Social Equity
2.2. Urban Regulations and Daylight Access
2.2.1. Global Perspectives
2.2.2. Middle Eastern Context
2.2.3. Amman’s Regulatory Framework
2.3. Critique of Building Code No. 67, 1979
2.4. Shadow Analysis and Simulation Tools
2.4.1. Shadow Dynamics
2.4.2. Simulation Tools
2.4.3. Topographical Considerations
2.5. Challenges in Sloped Urban Areas
2.5.1. Topographical Constraints
2.5.2. Basement Usage
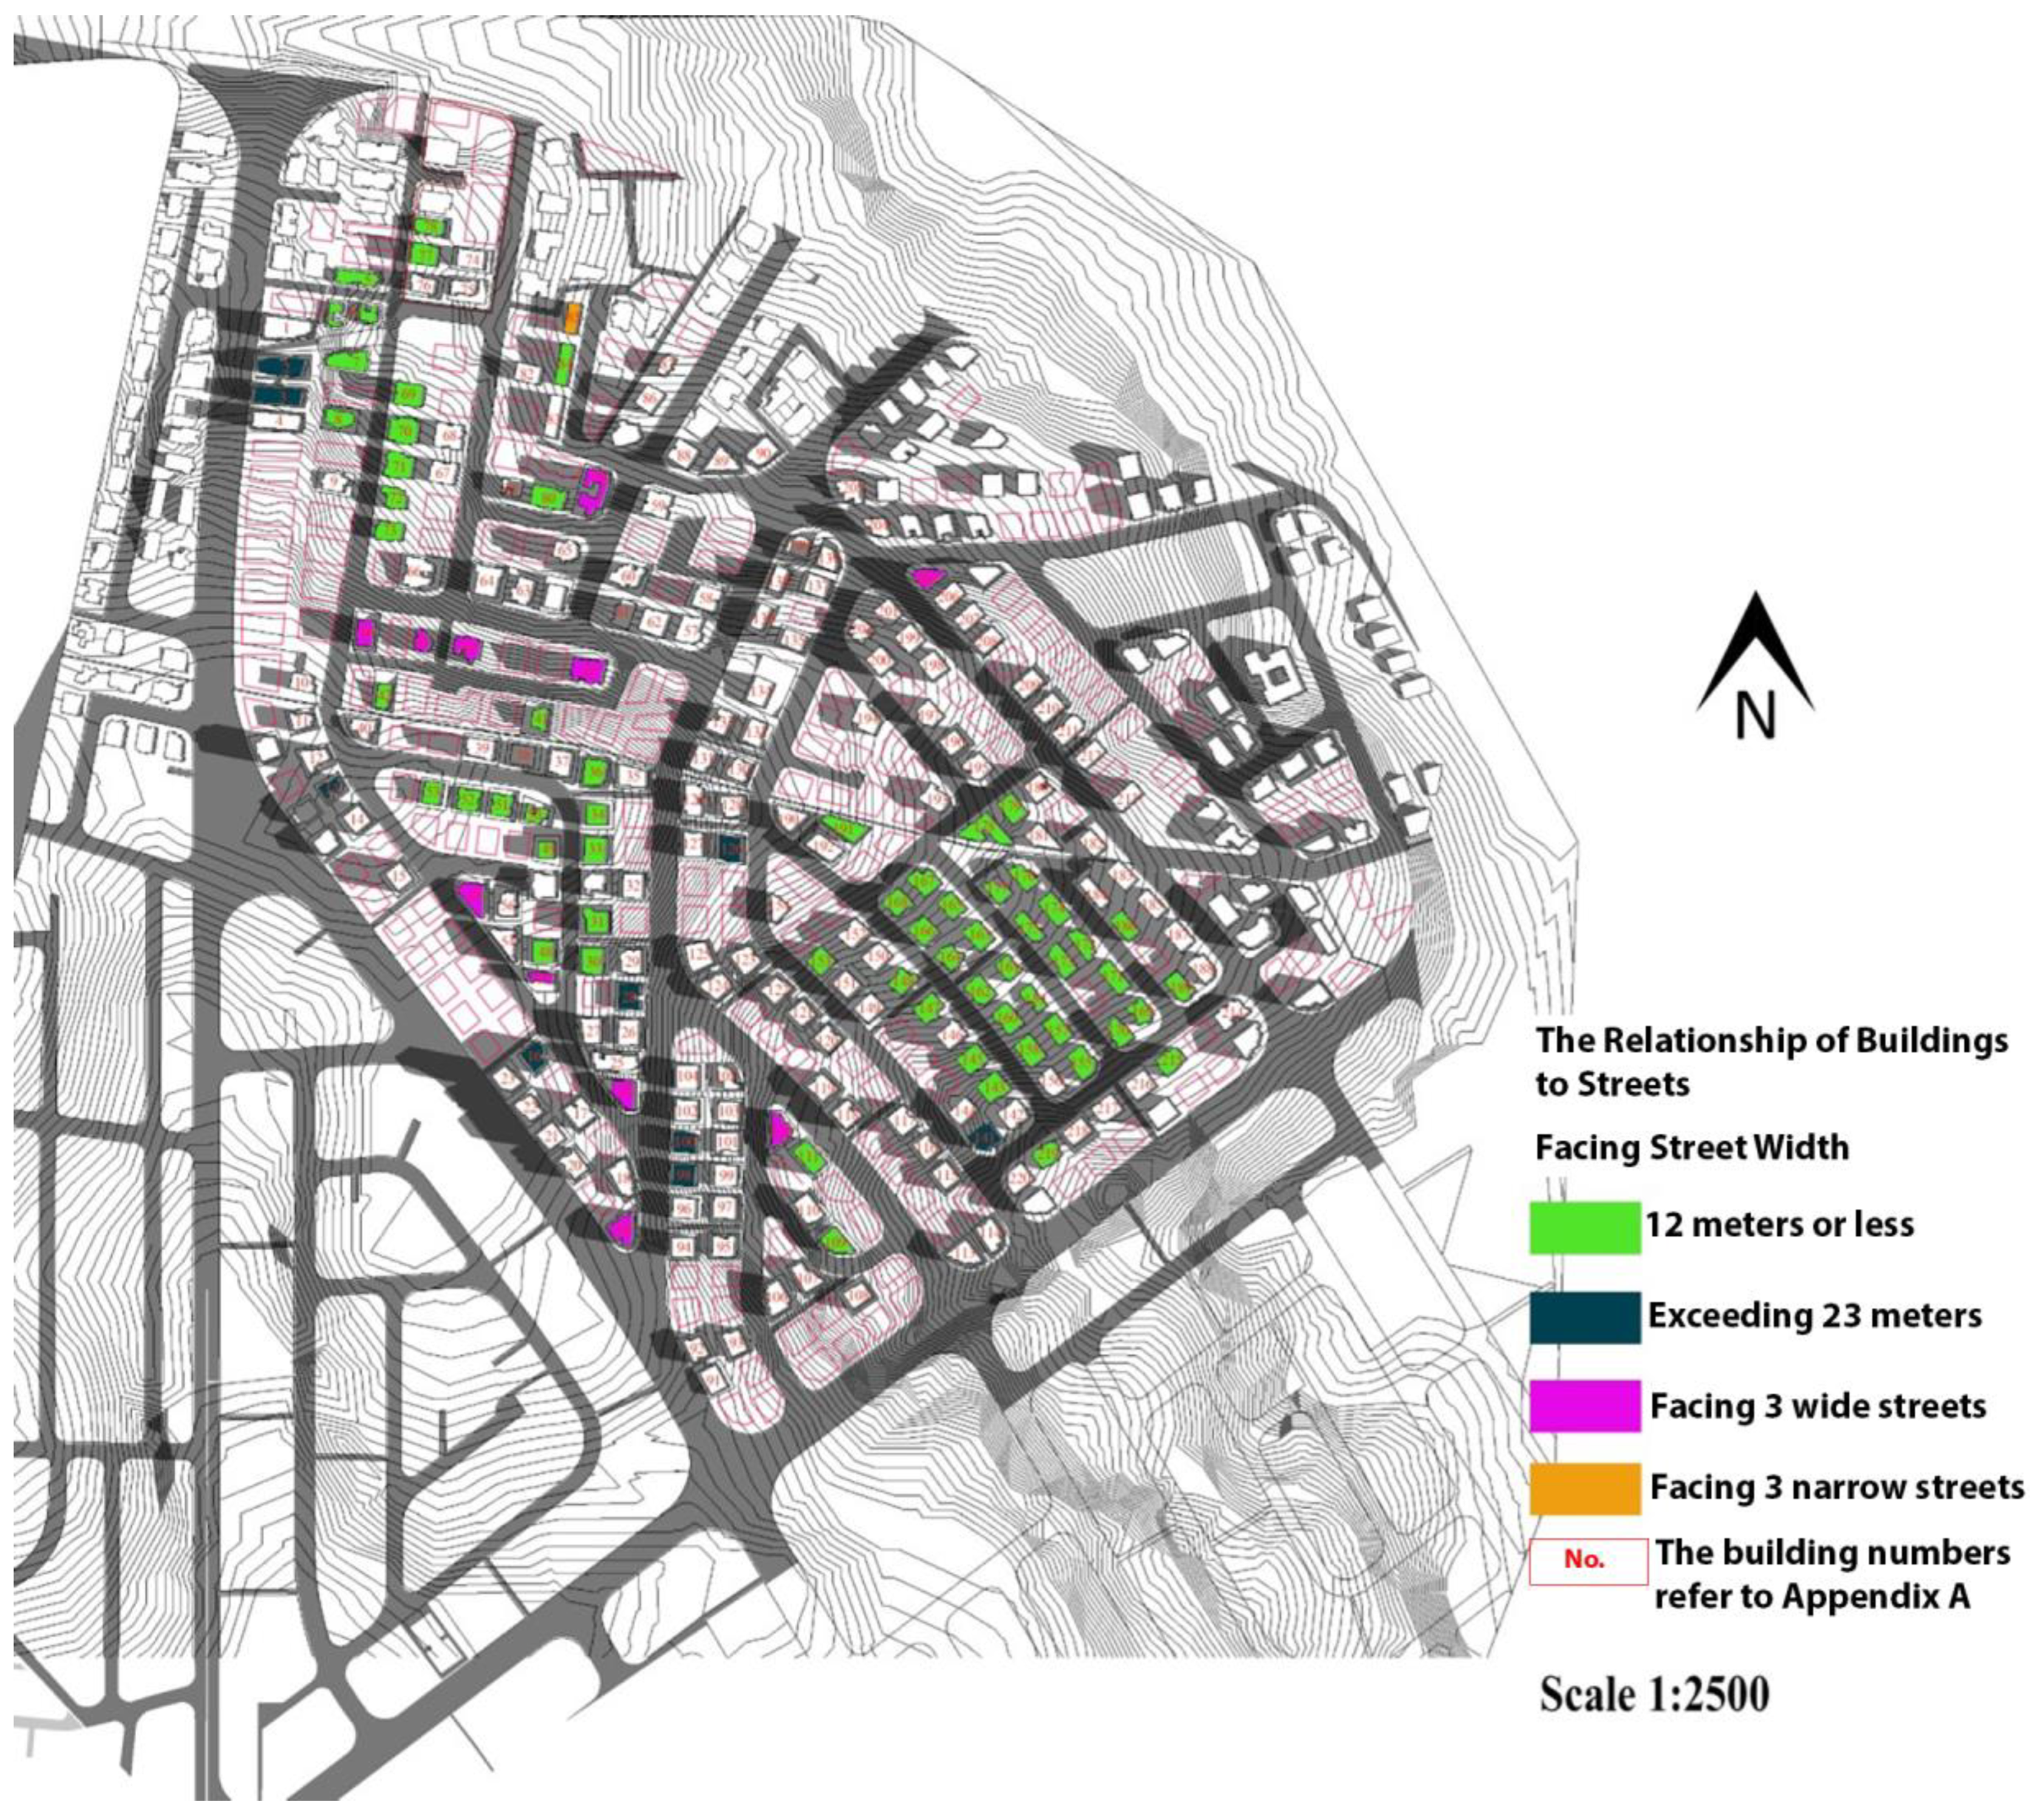
2.5.3. Street Orientation and Width
2.6. Gaps in Existing Research
2.6.1. Lack of Slope-Sensitive Studies
2.6.2. Policy-Relevant Research
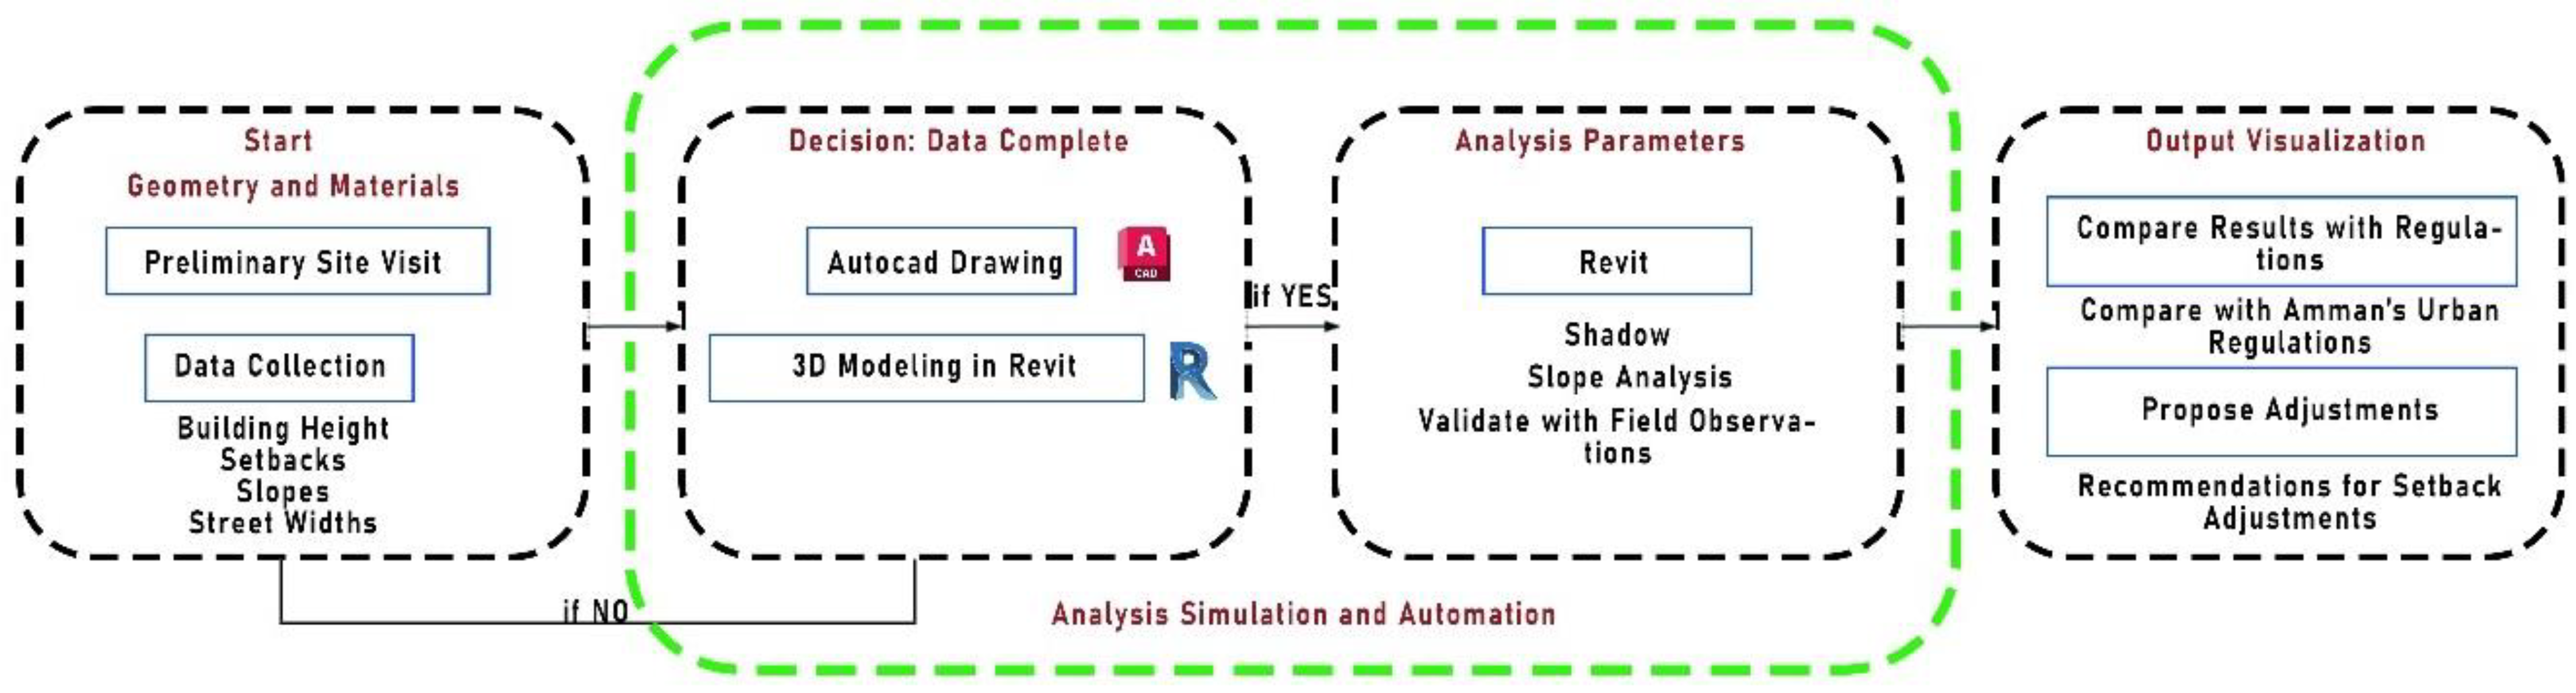
3. Methodology
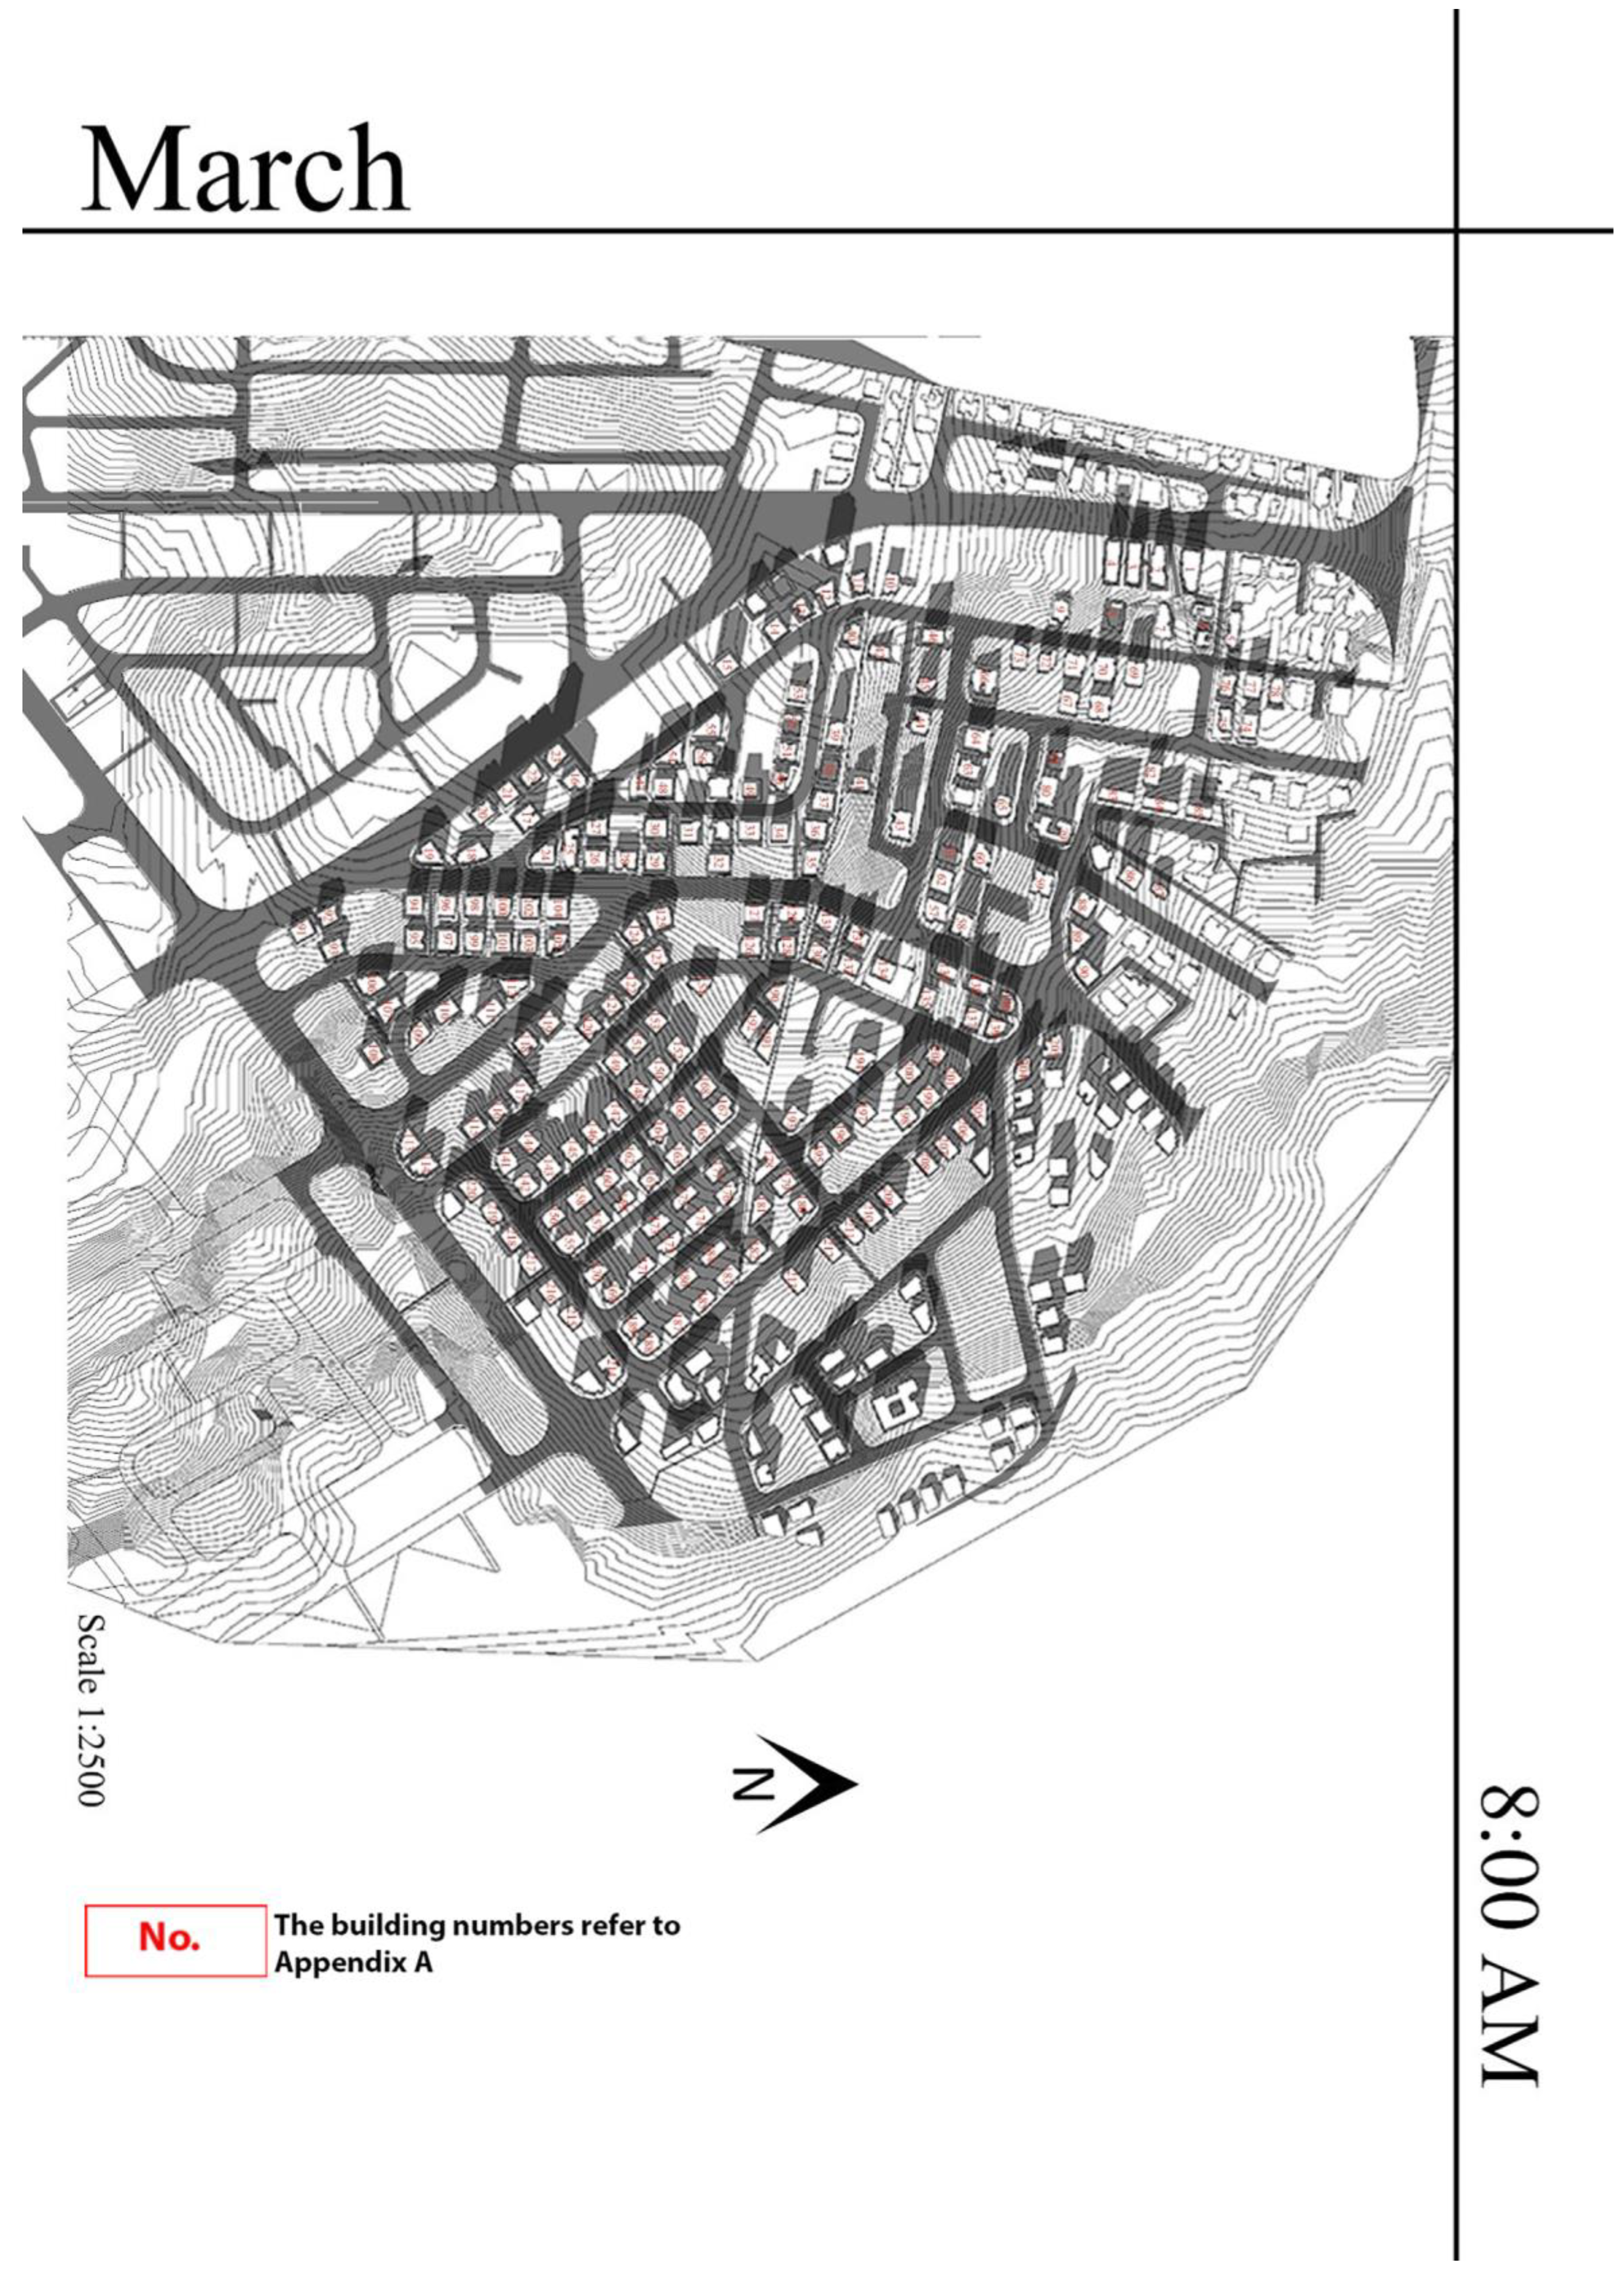
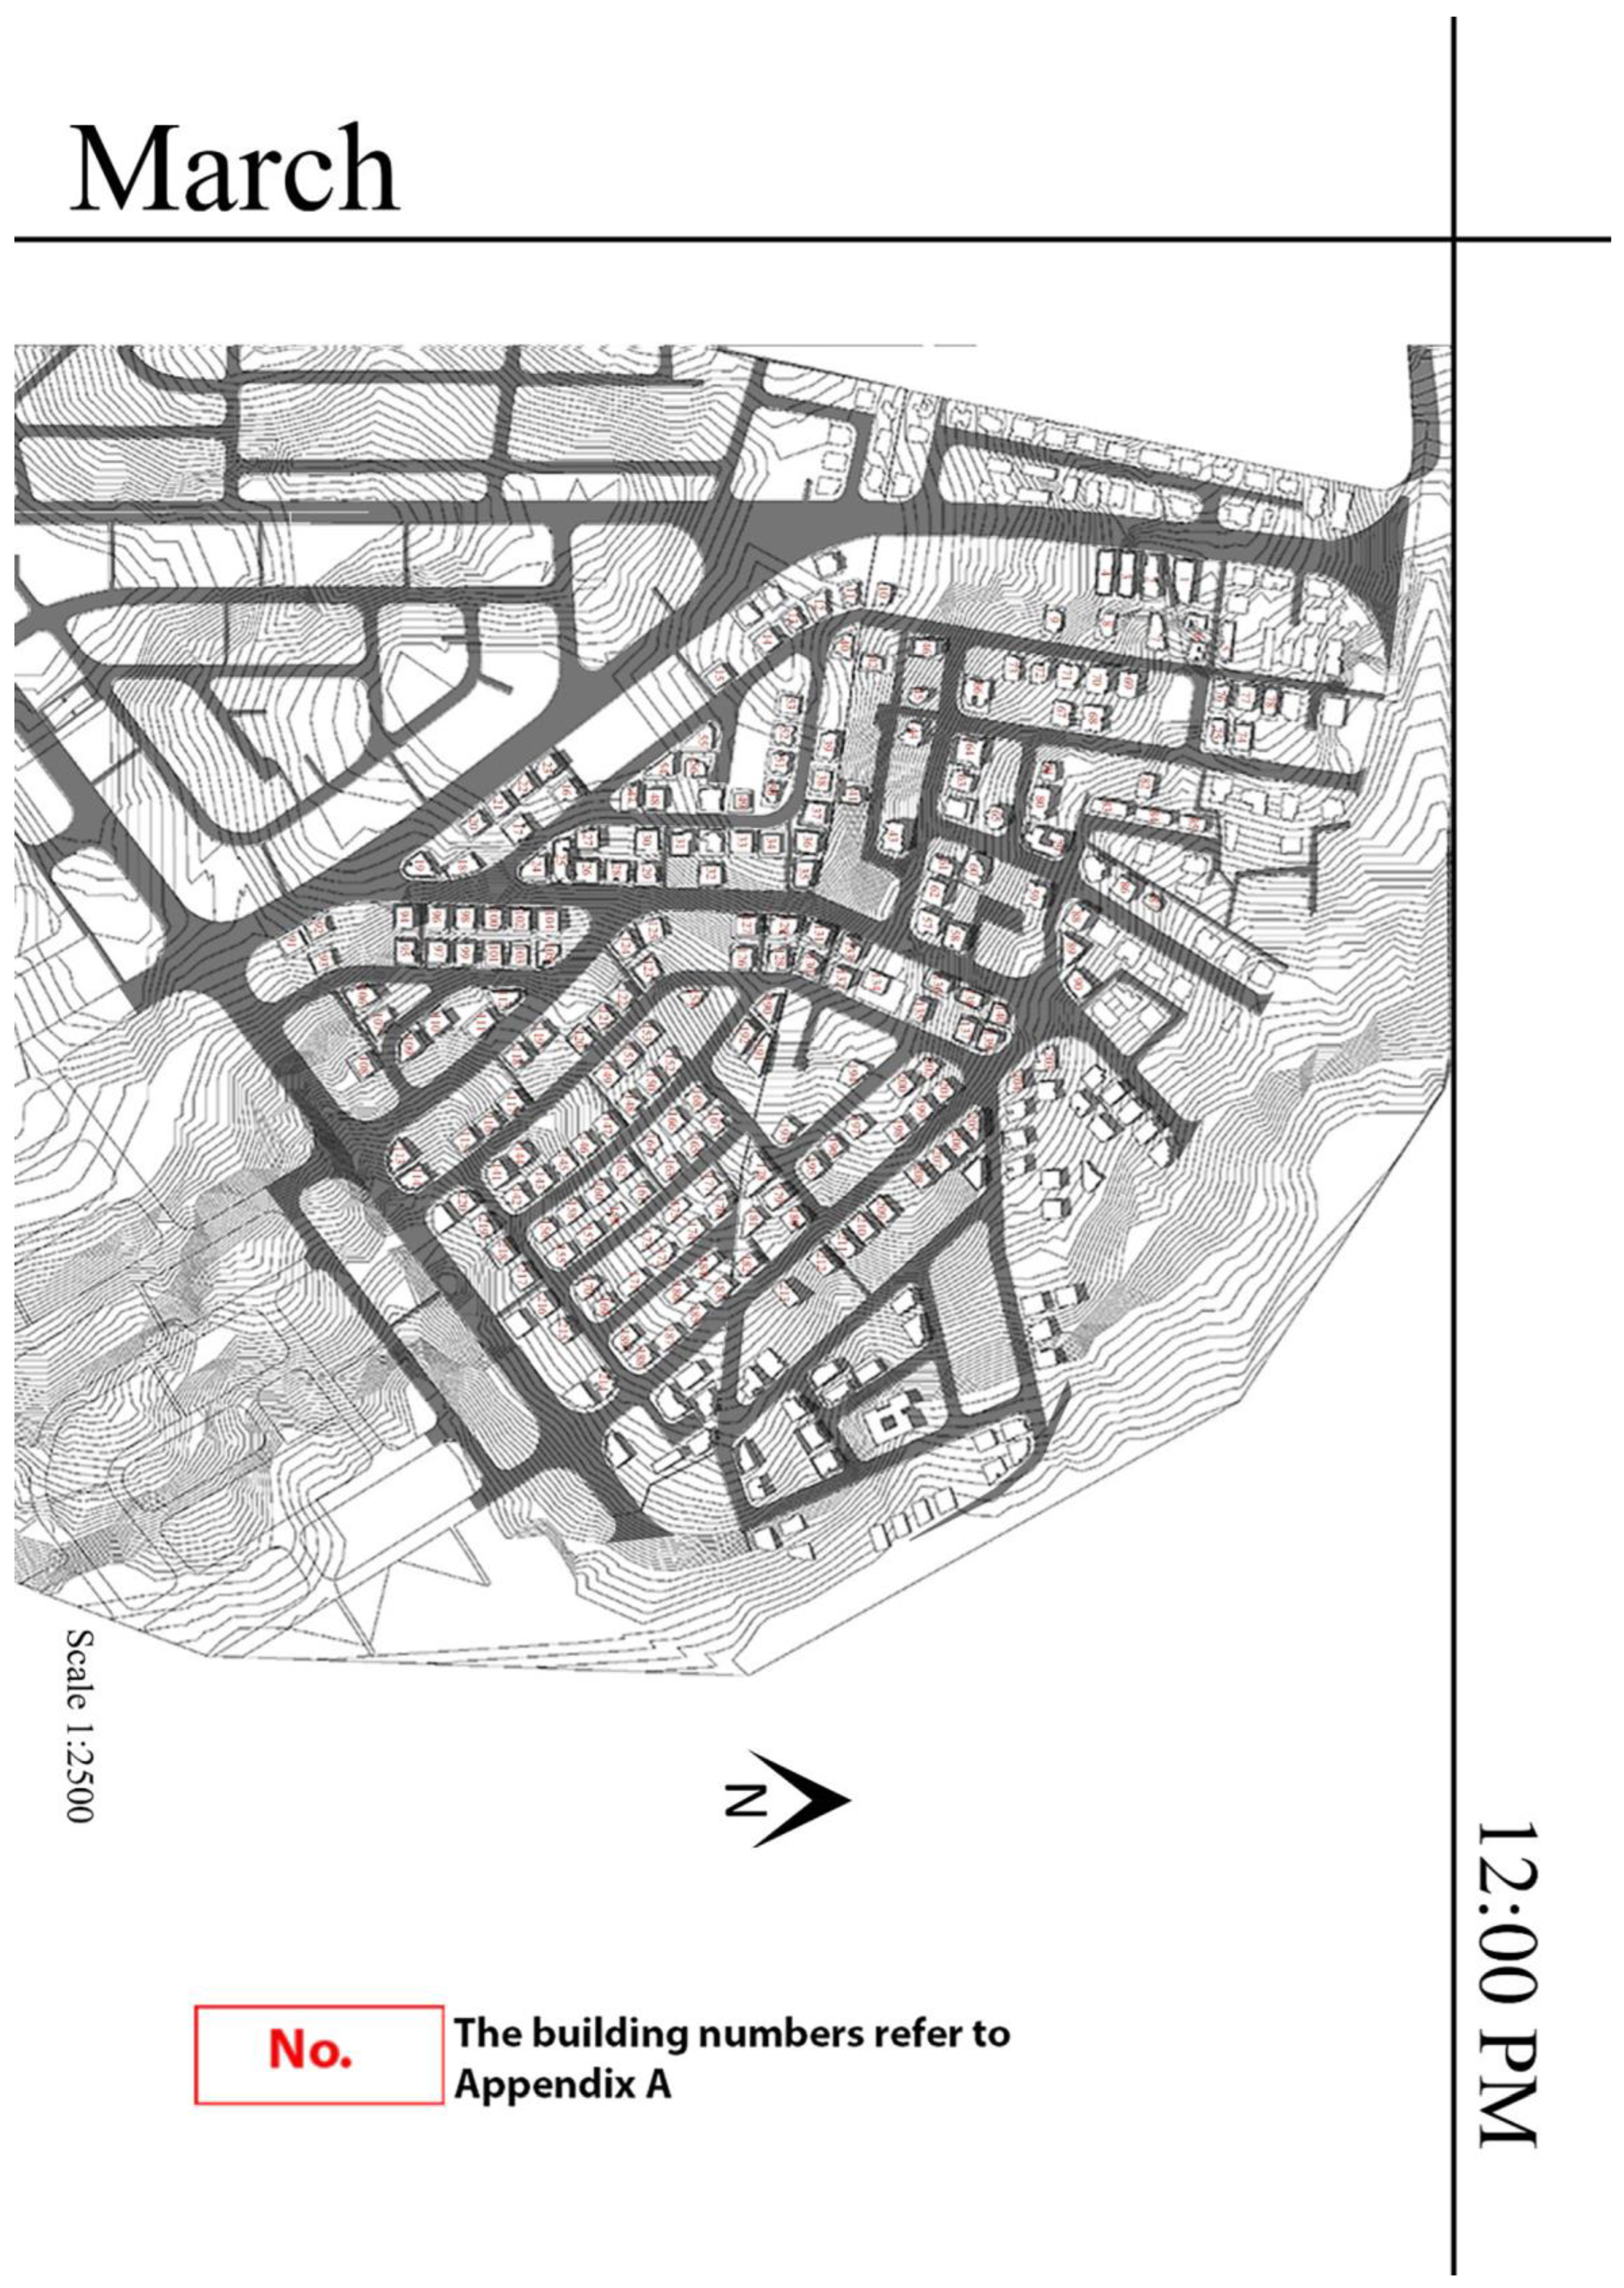
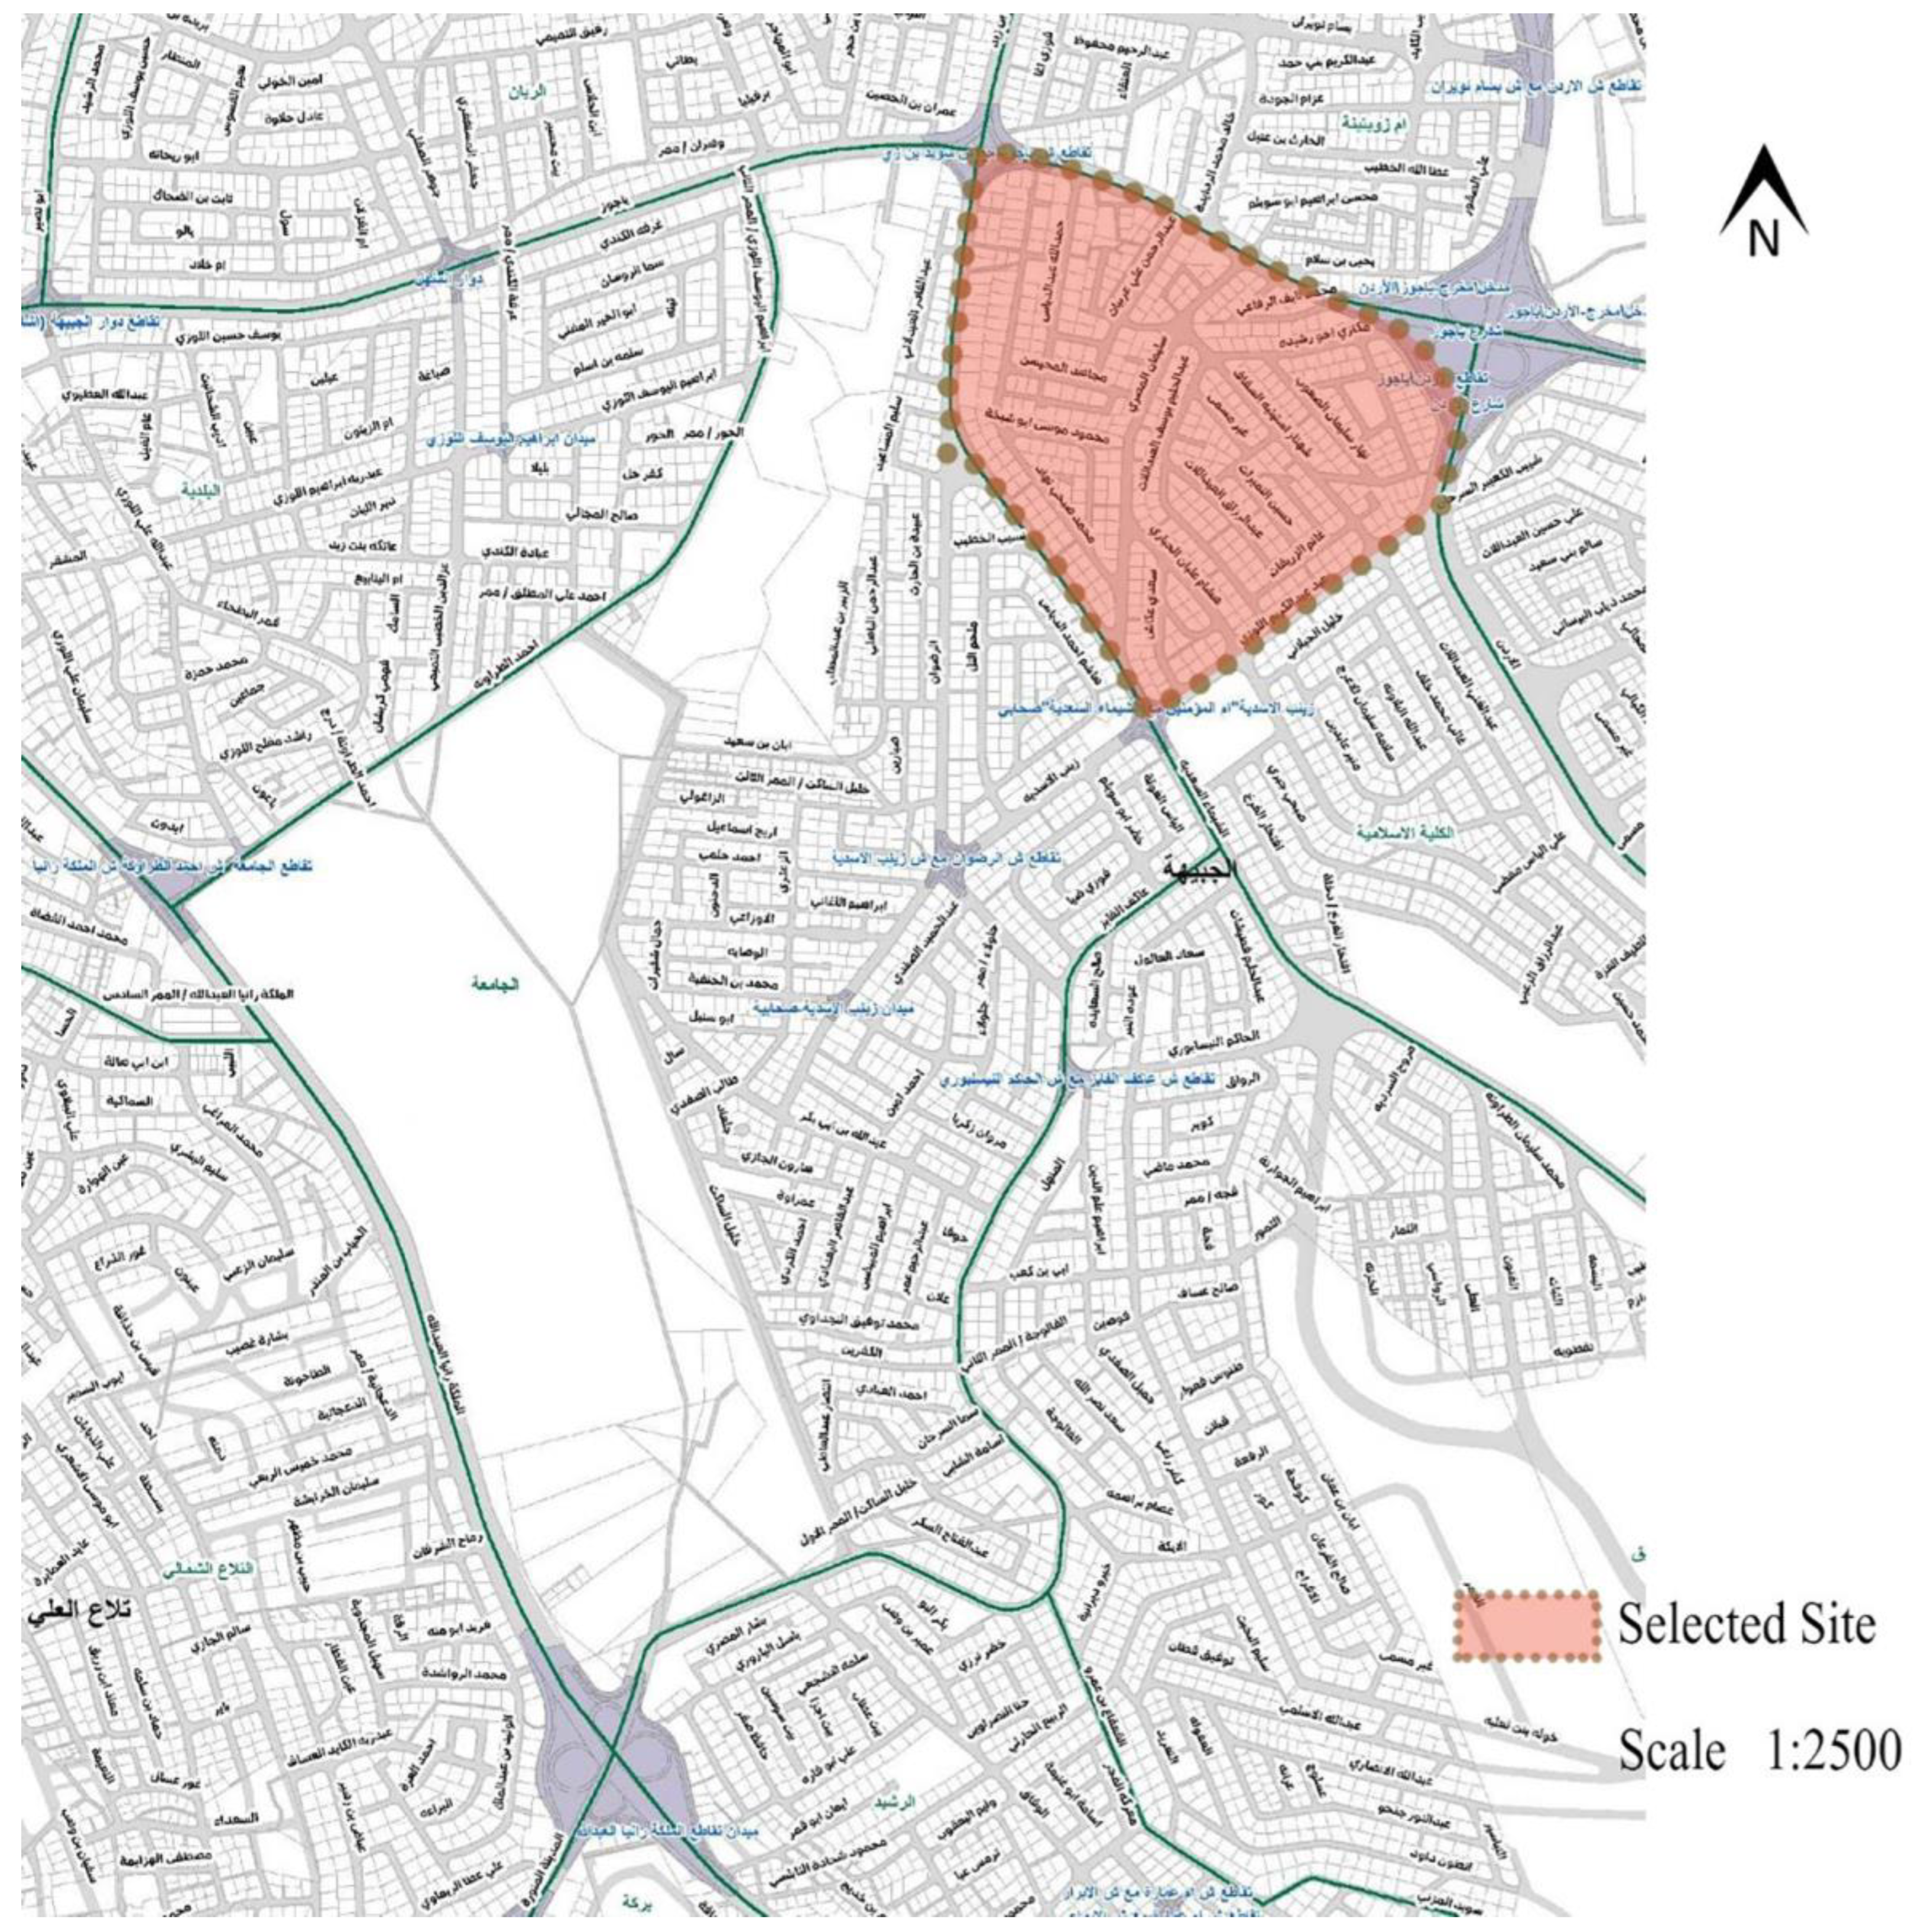
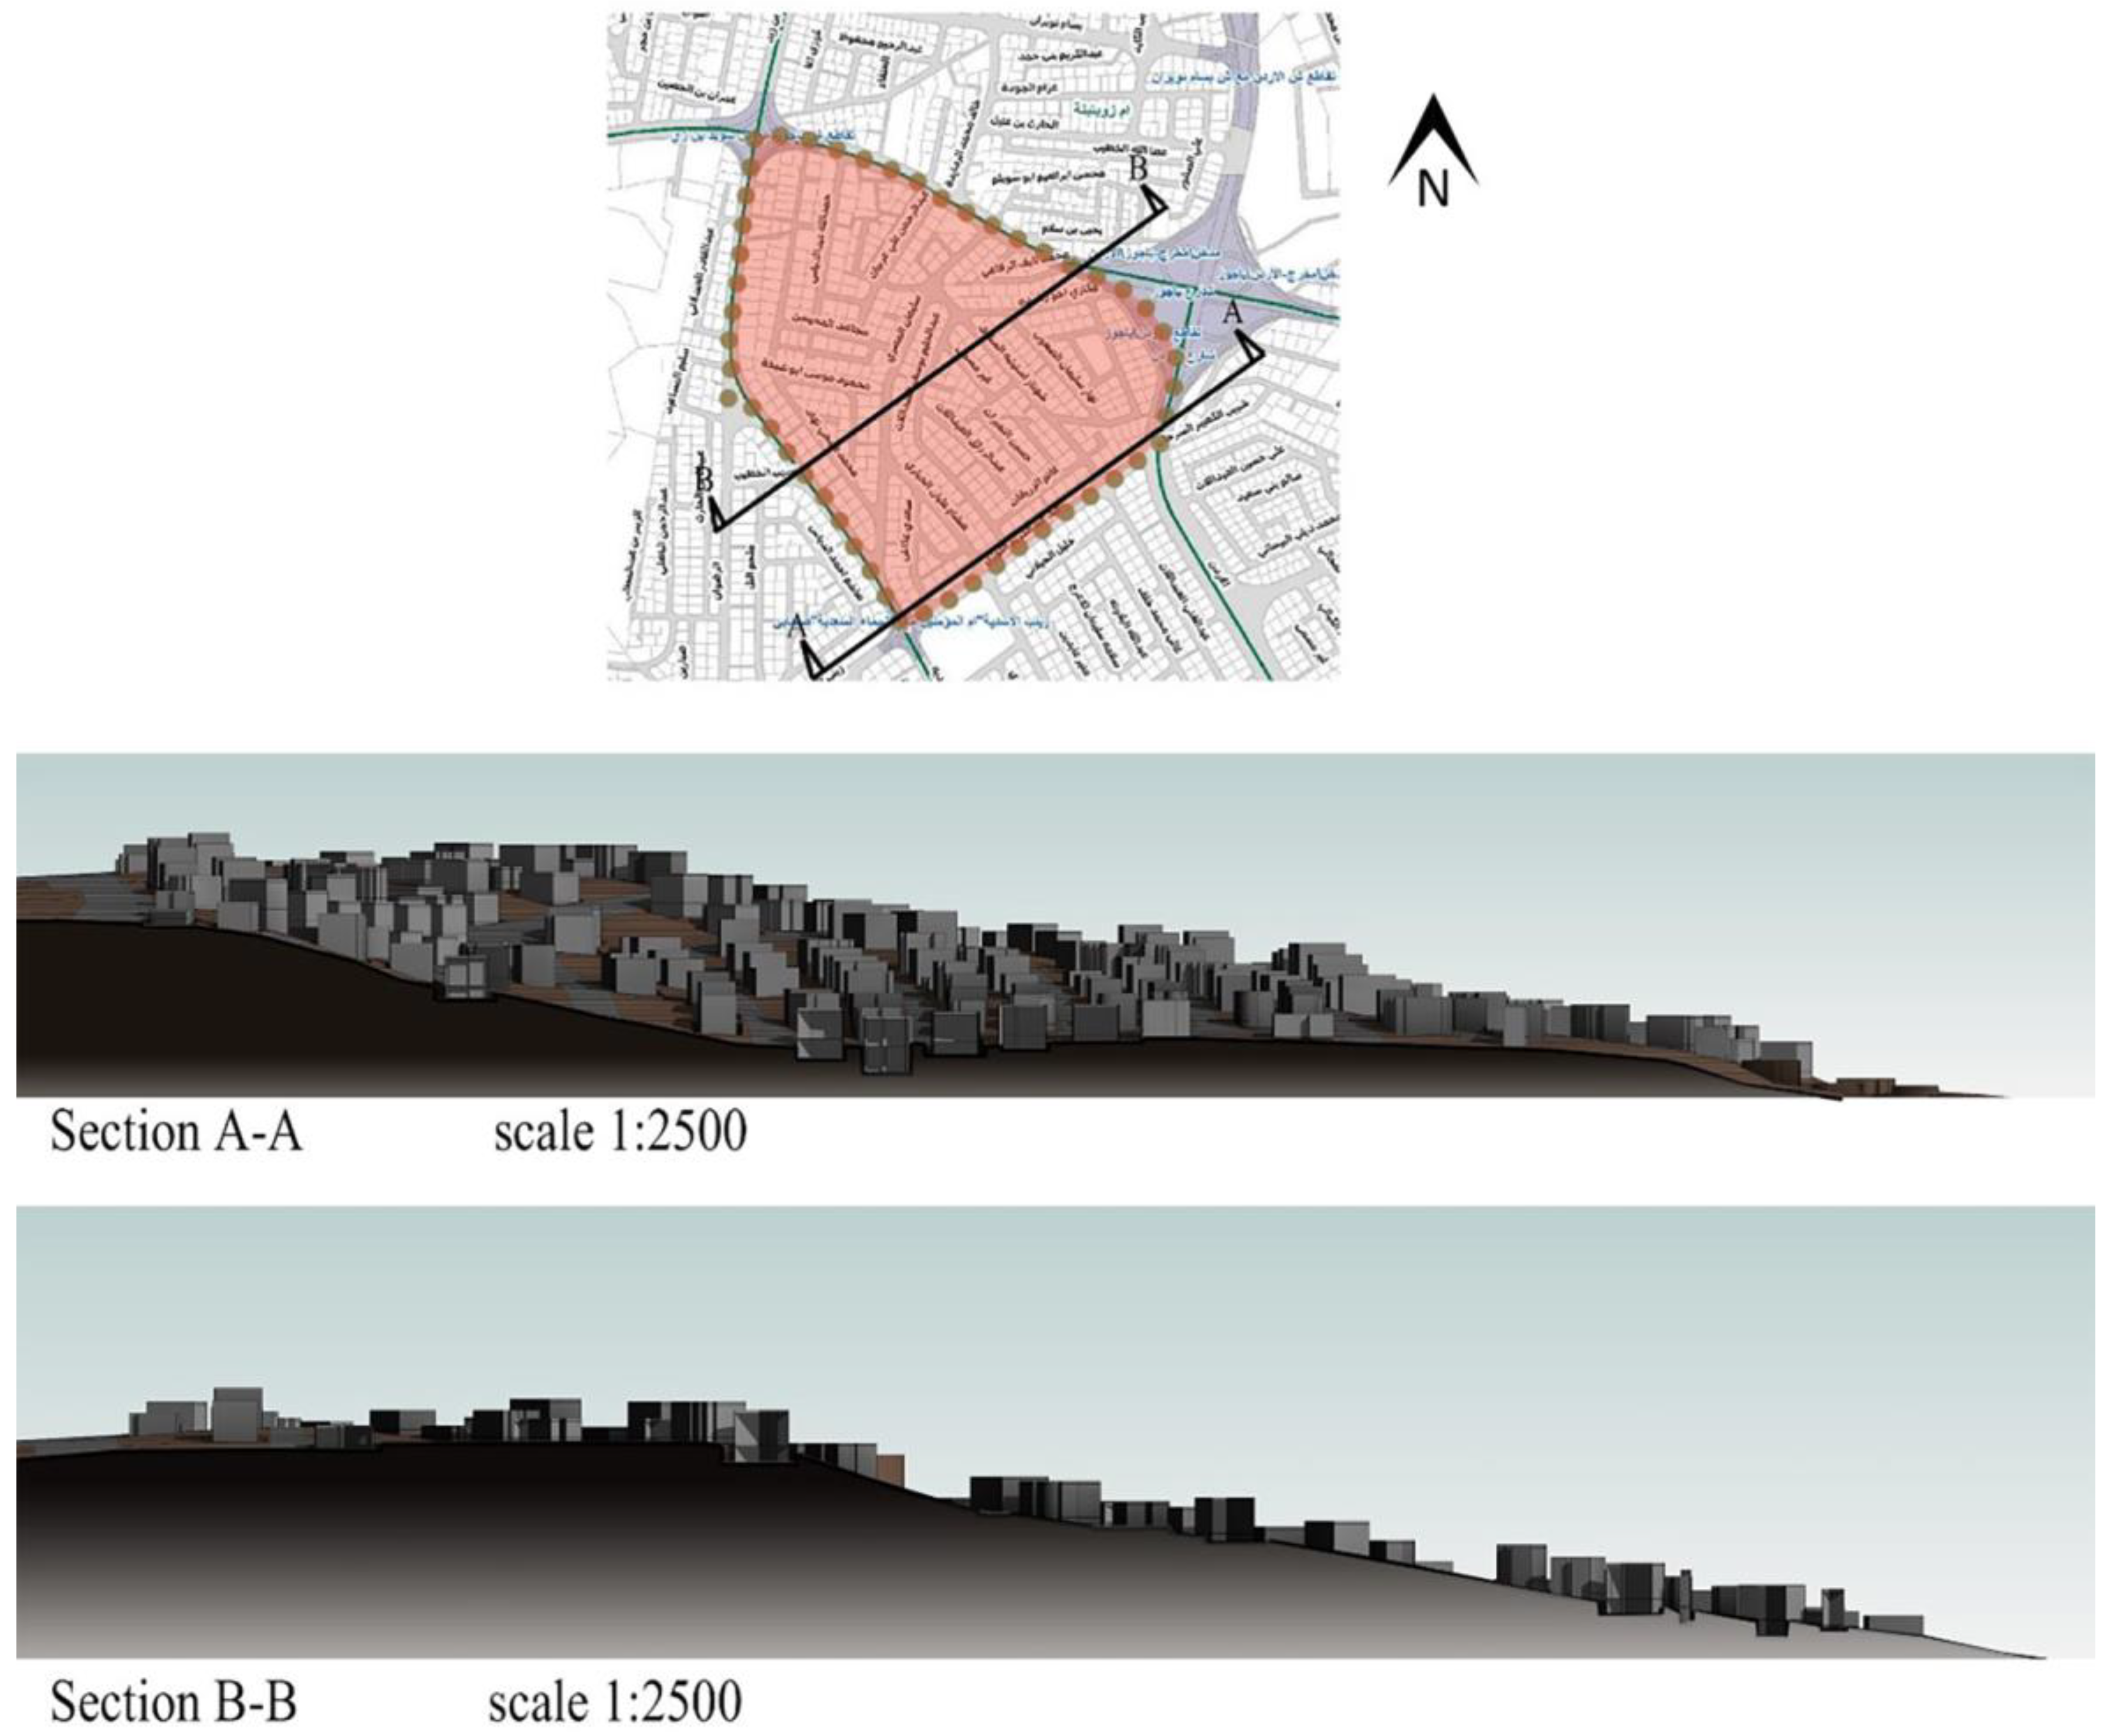
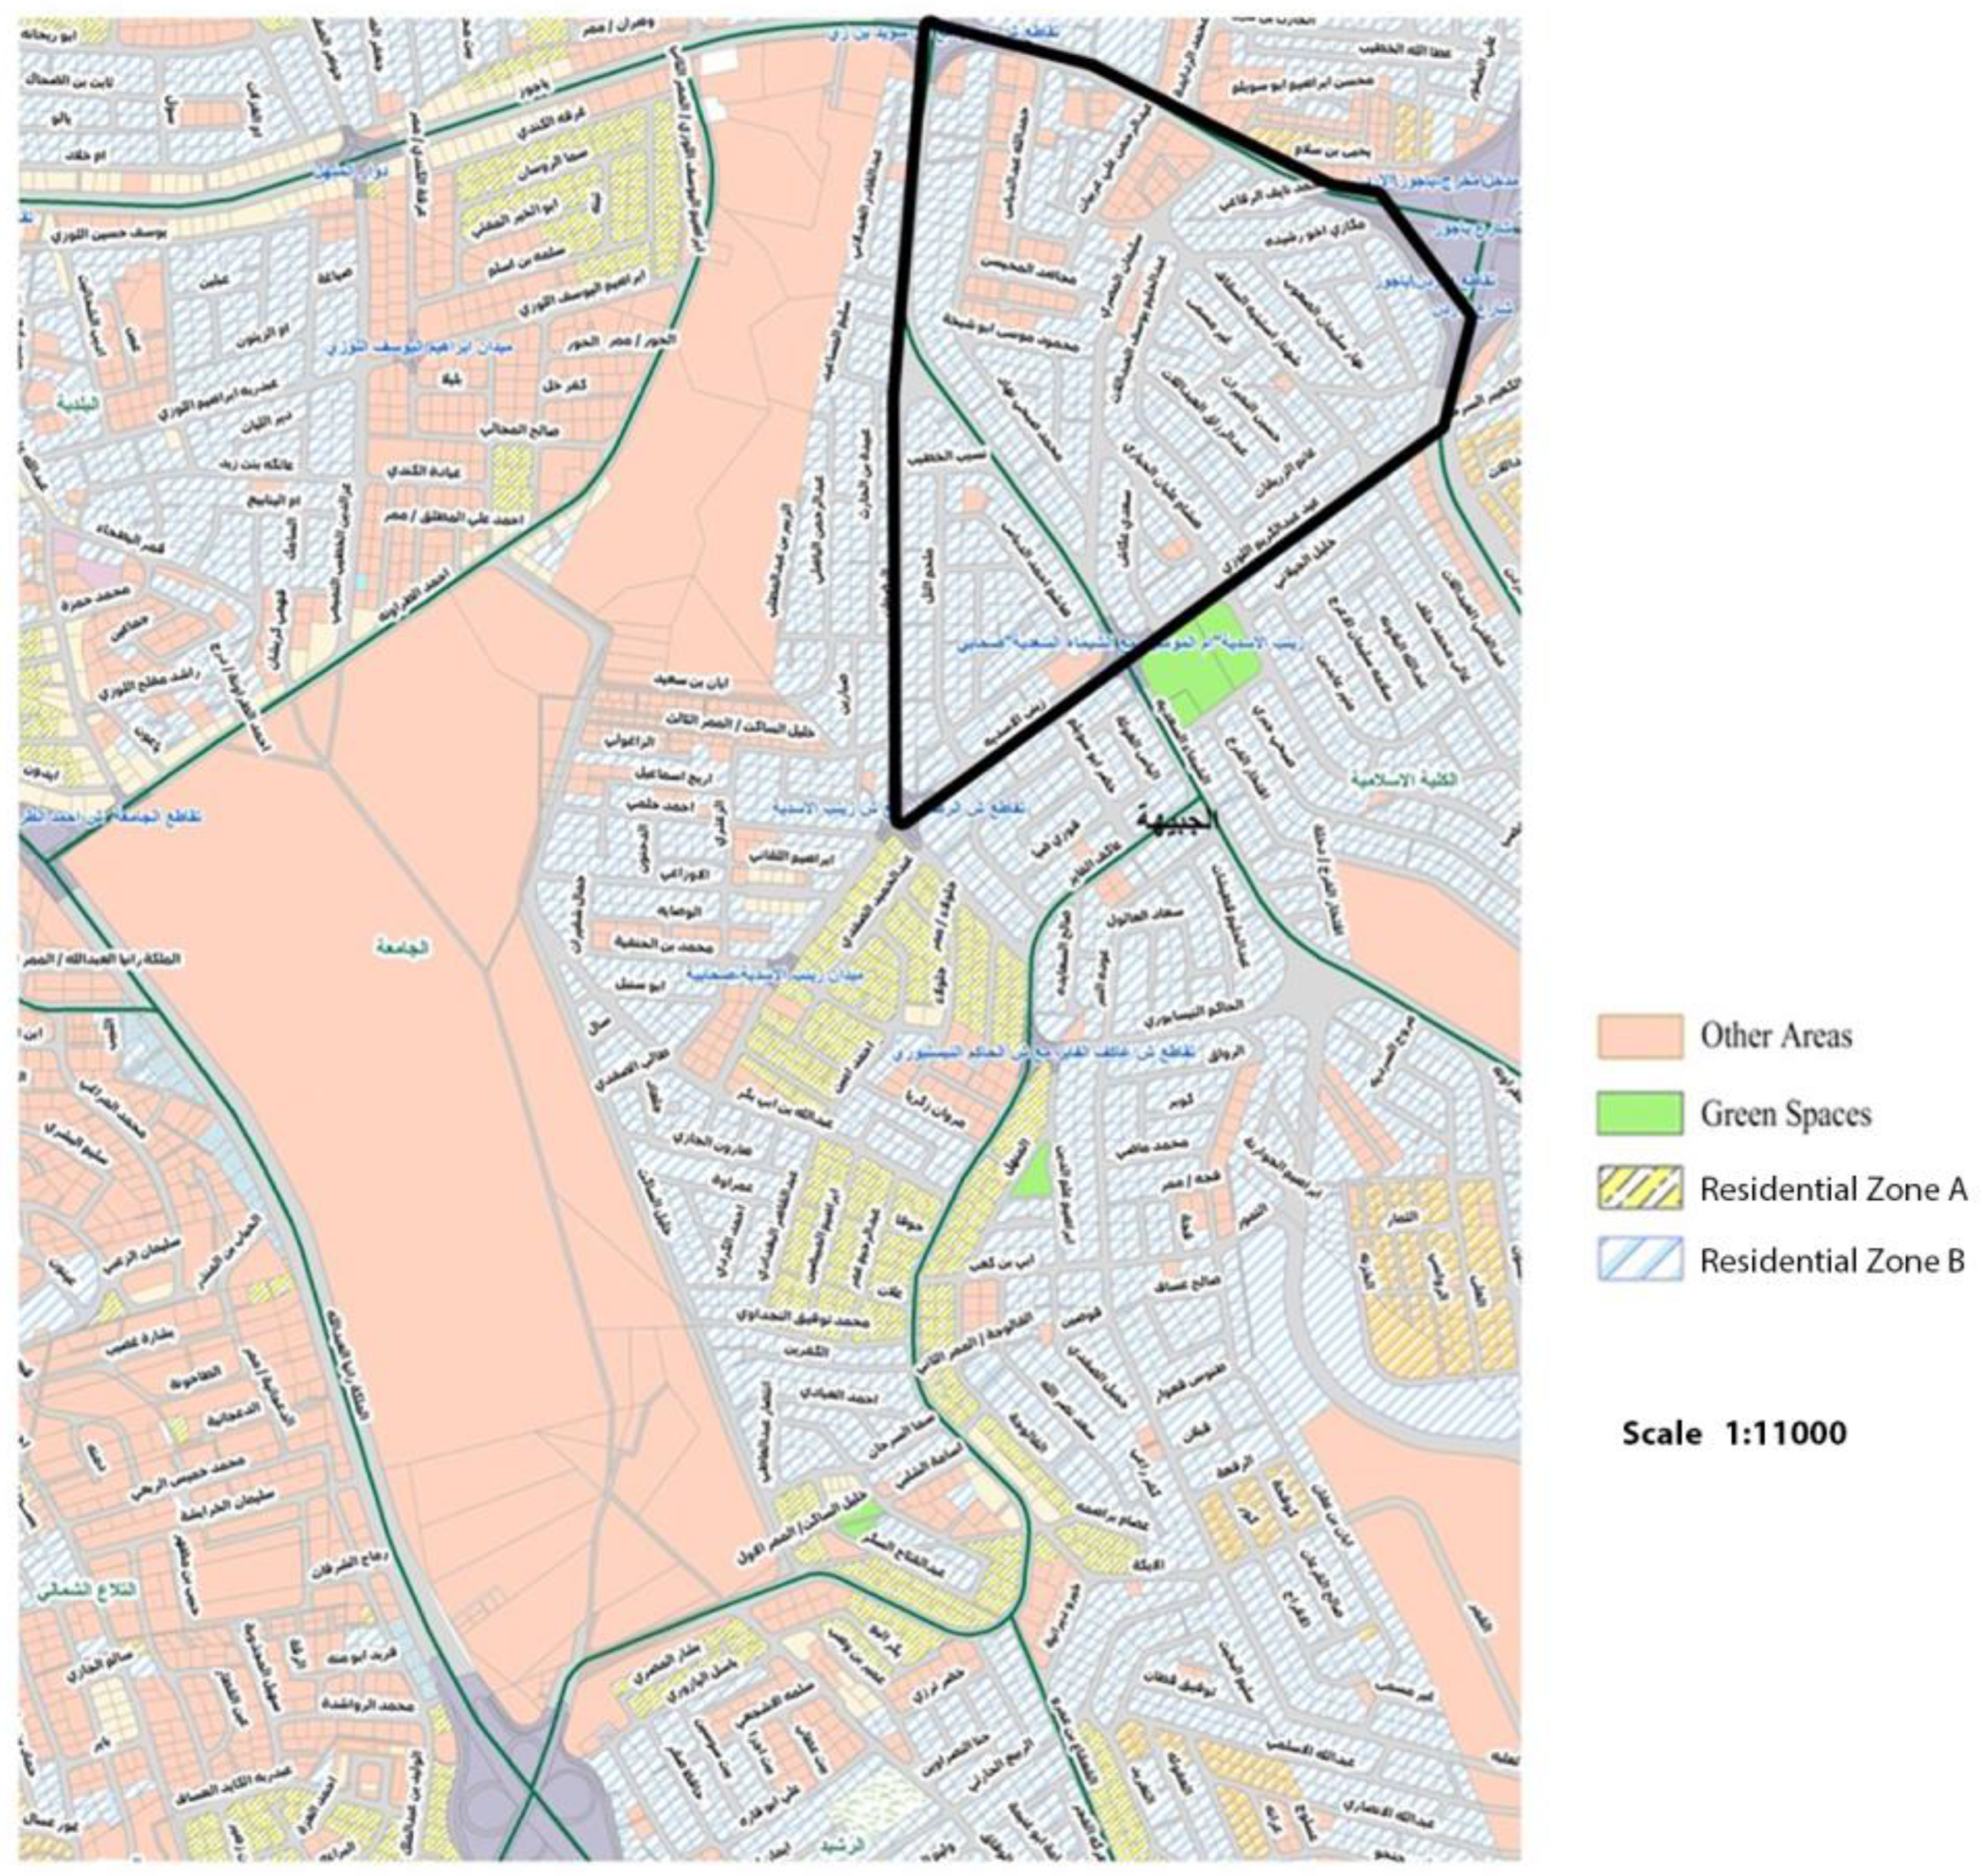
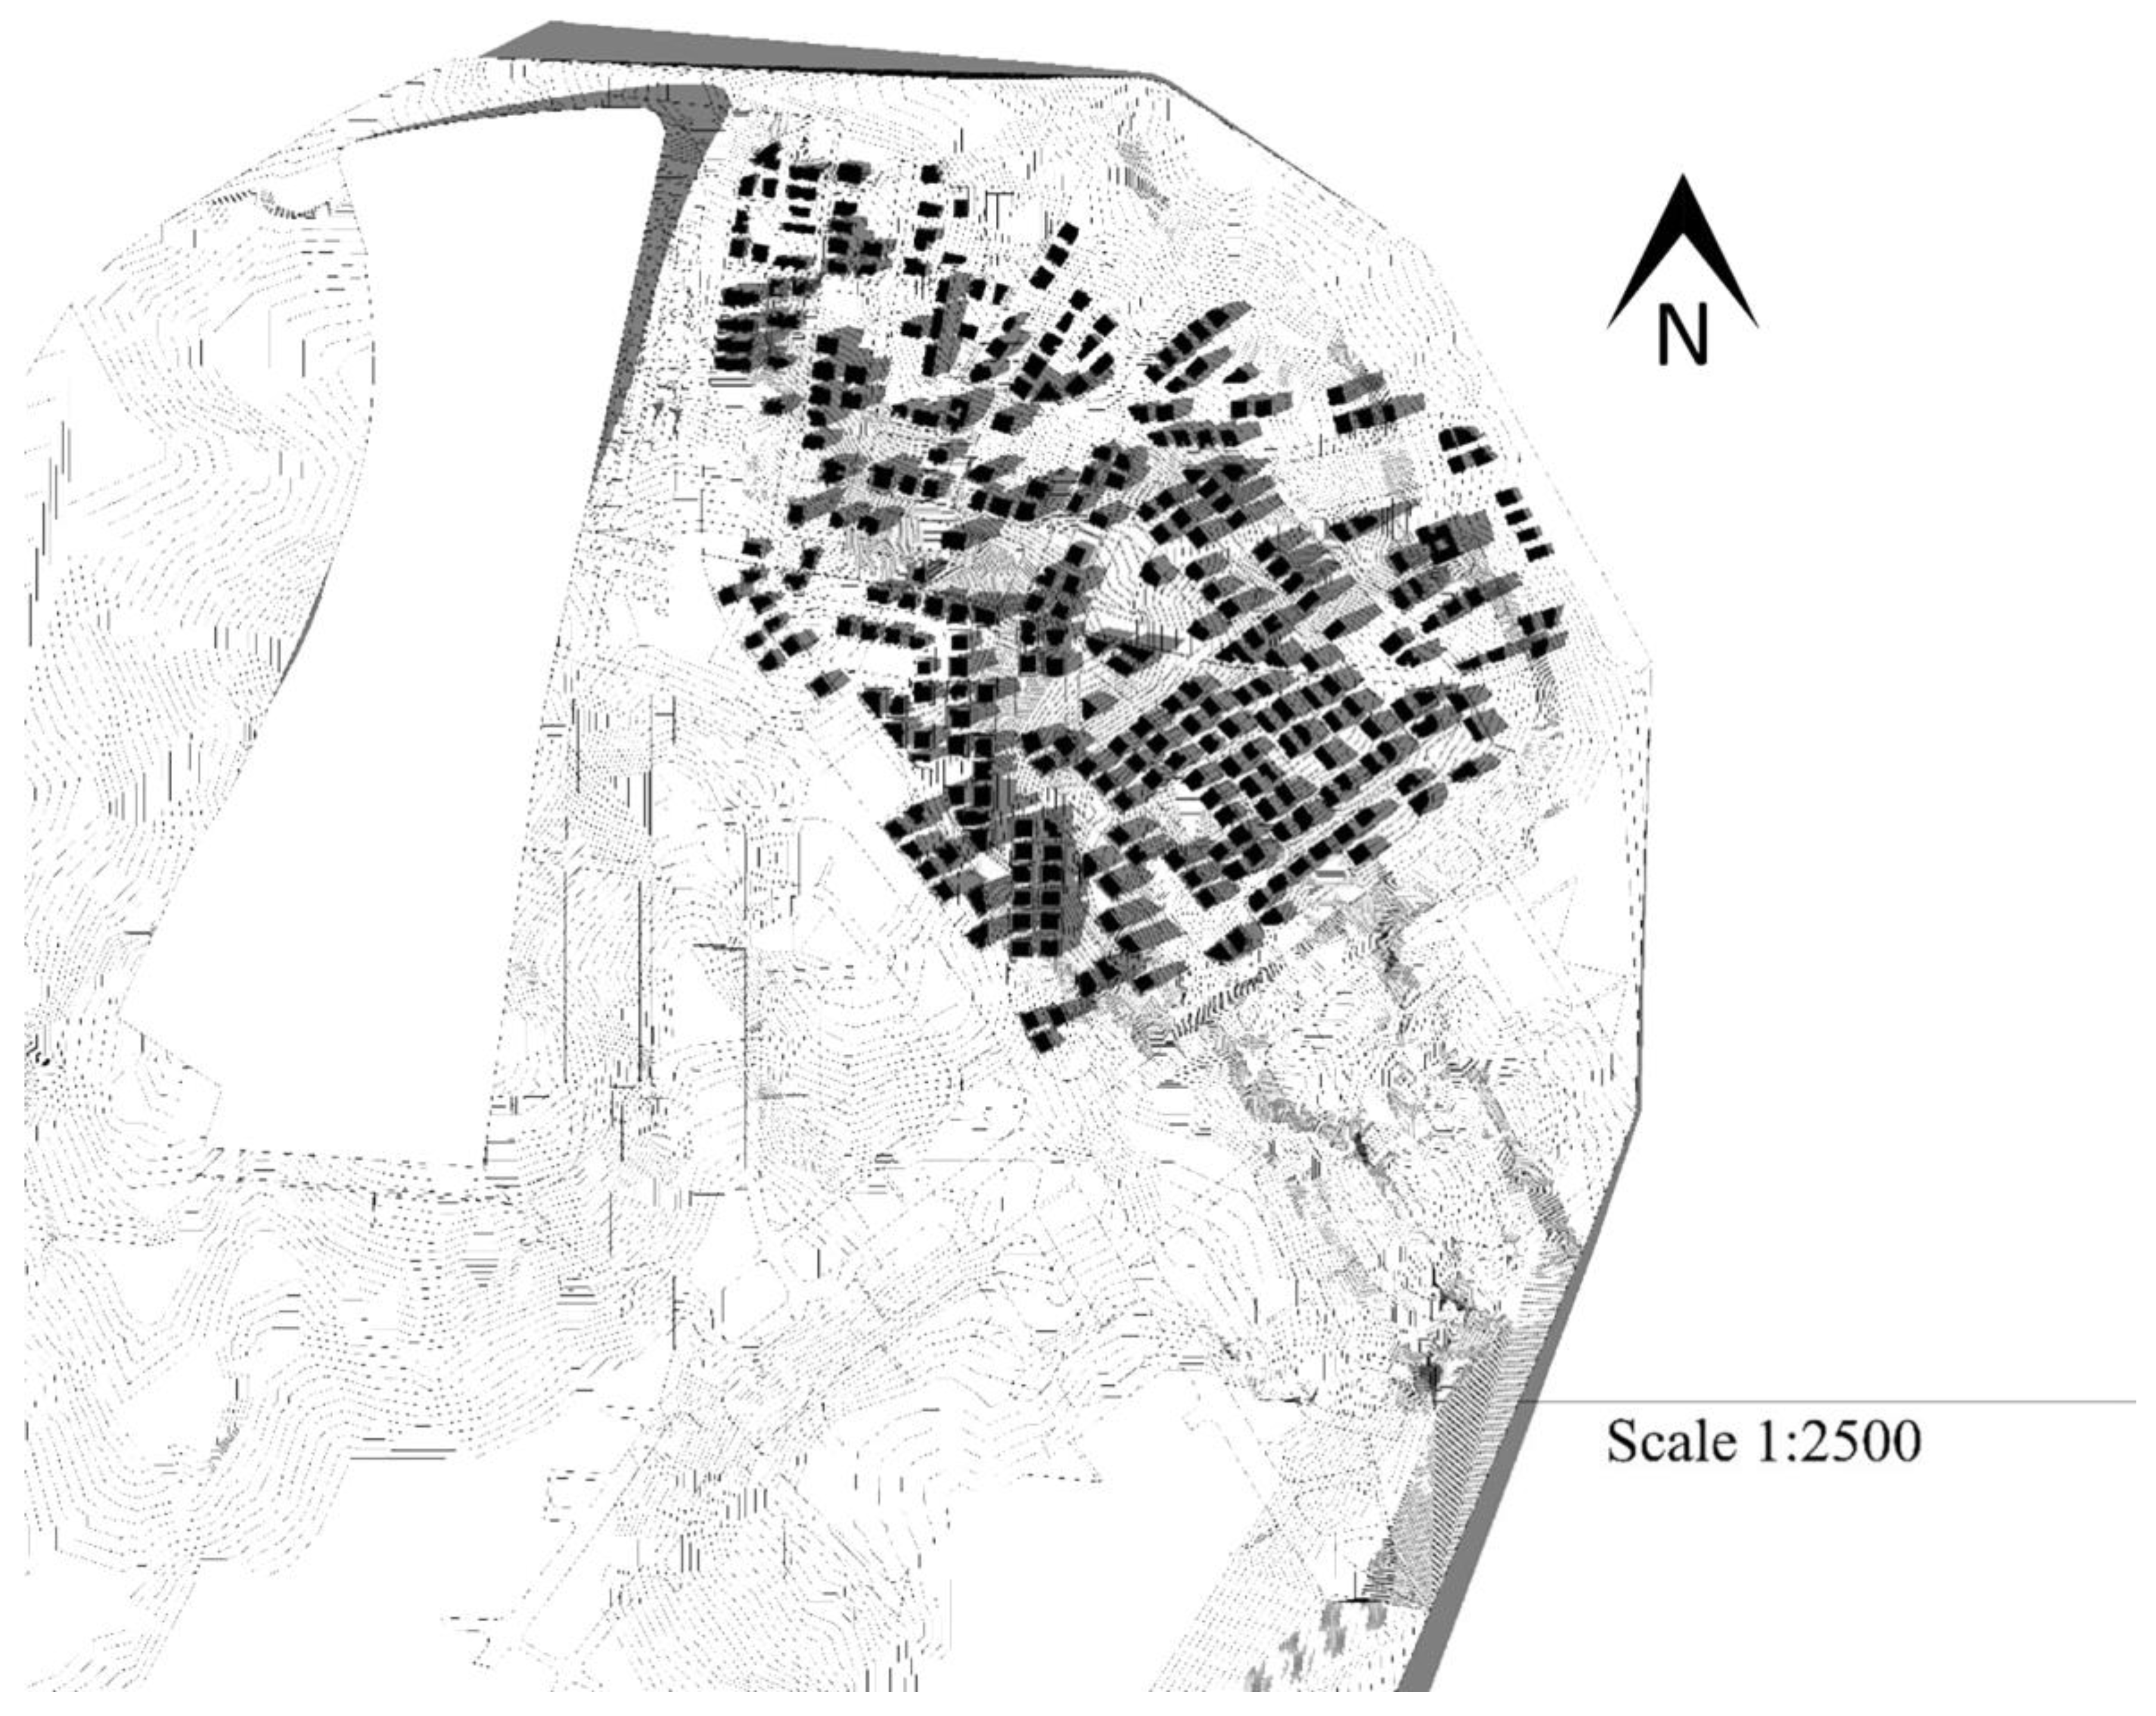
3.1. Study Area
3.2. Data Collection
3.3. Simulation Tools and Parameters
3.3.1. Slope Calculation
3.3.2. Daylight Factor (DF)
3.3.3. Spatial Daylight Autonomy (sDA)
3.4. Analysis Techniques
Validation and Limitations
4. Decision
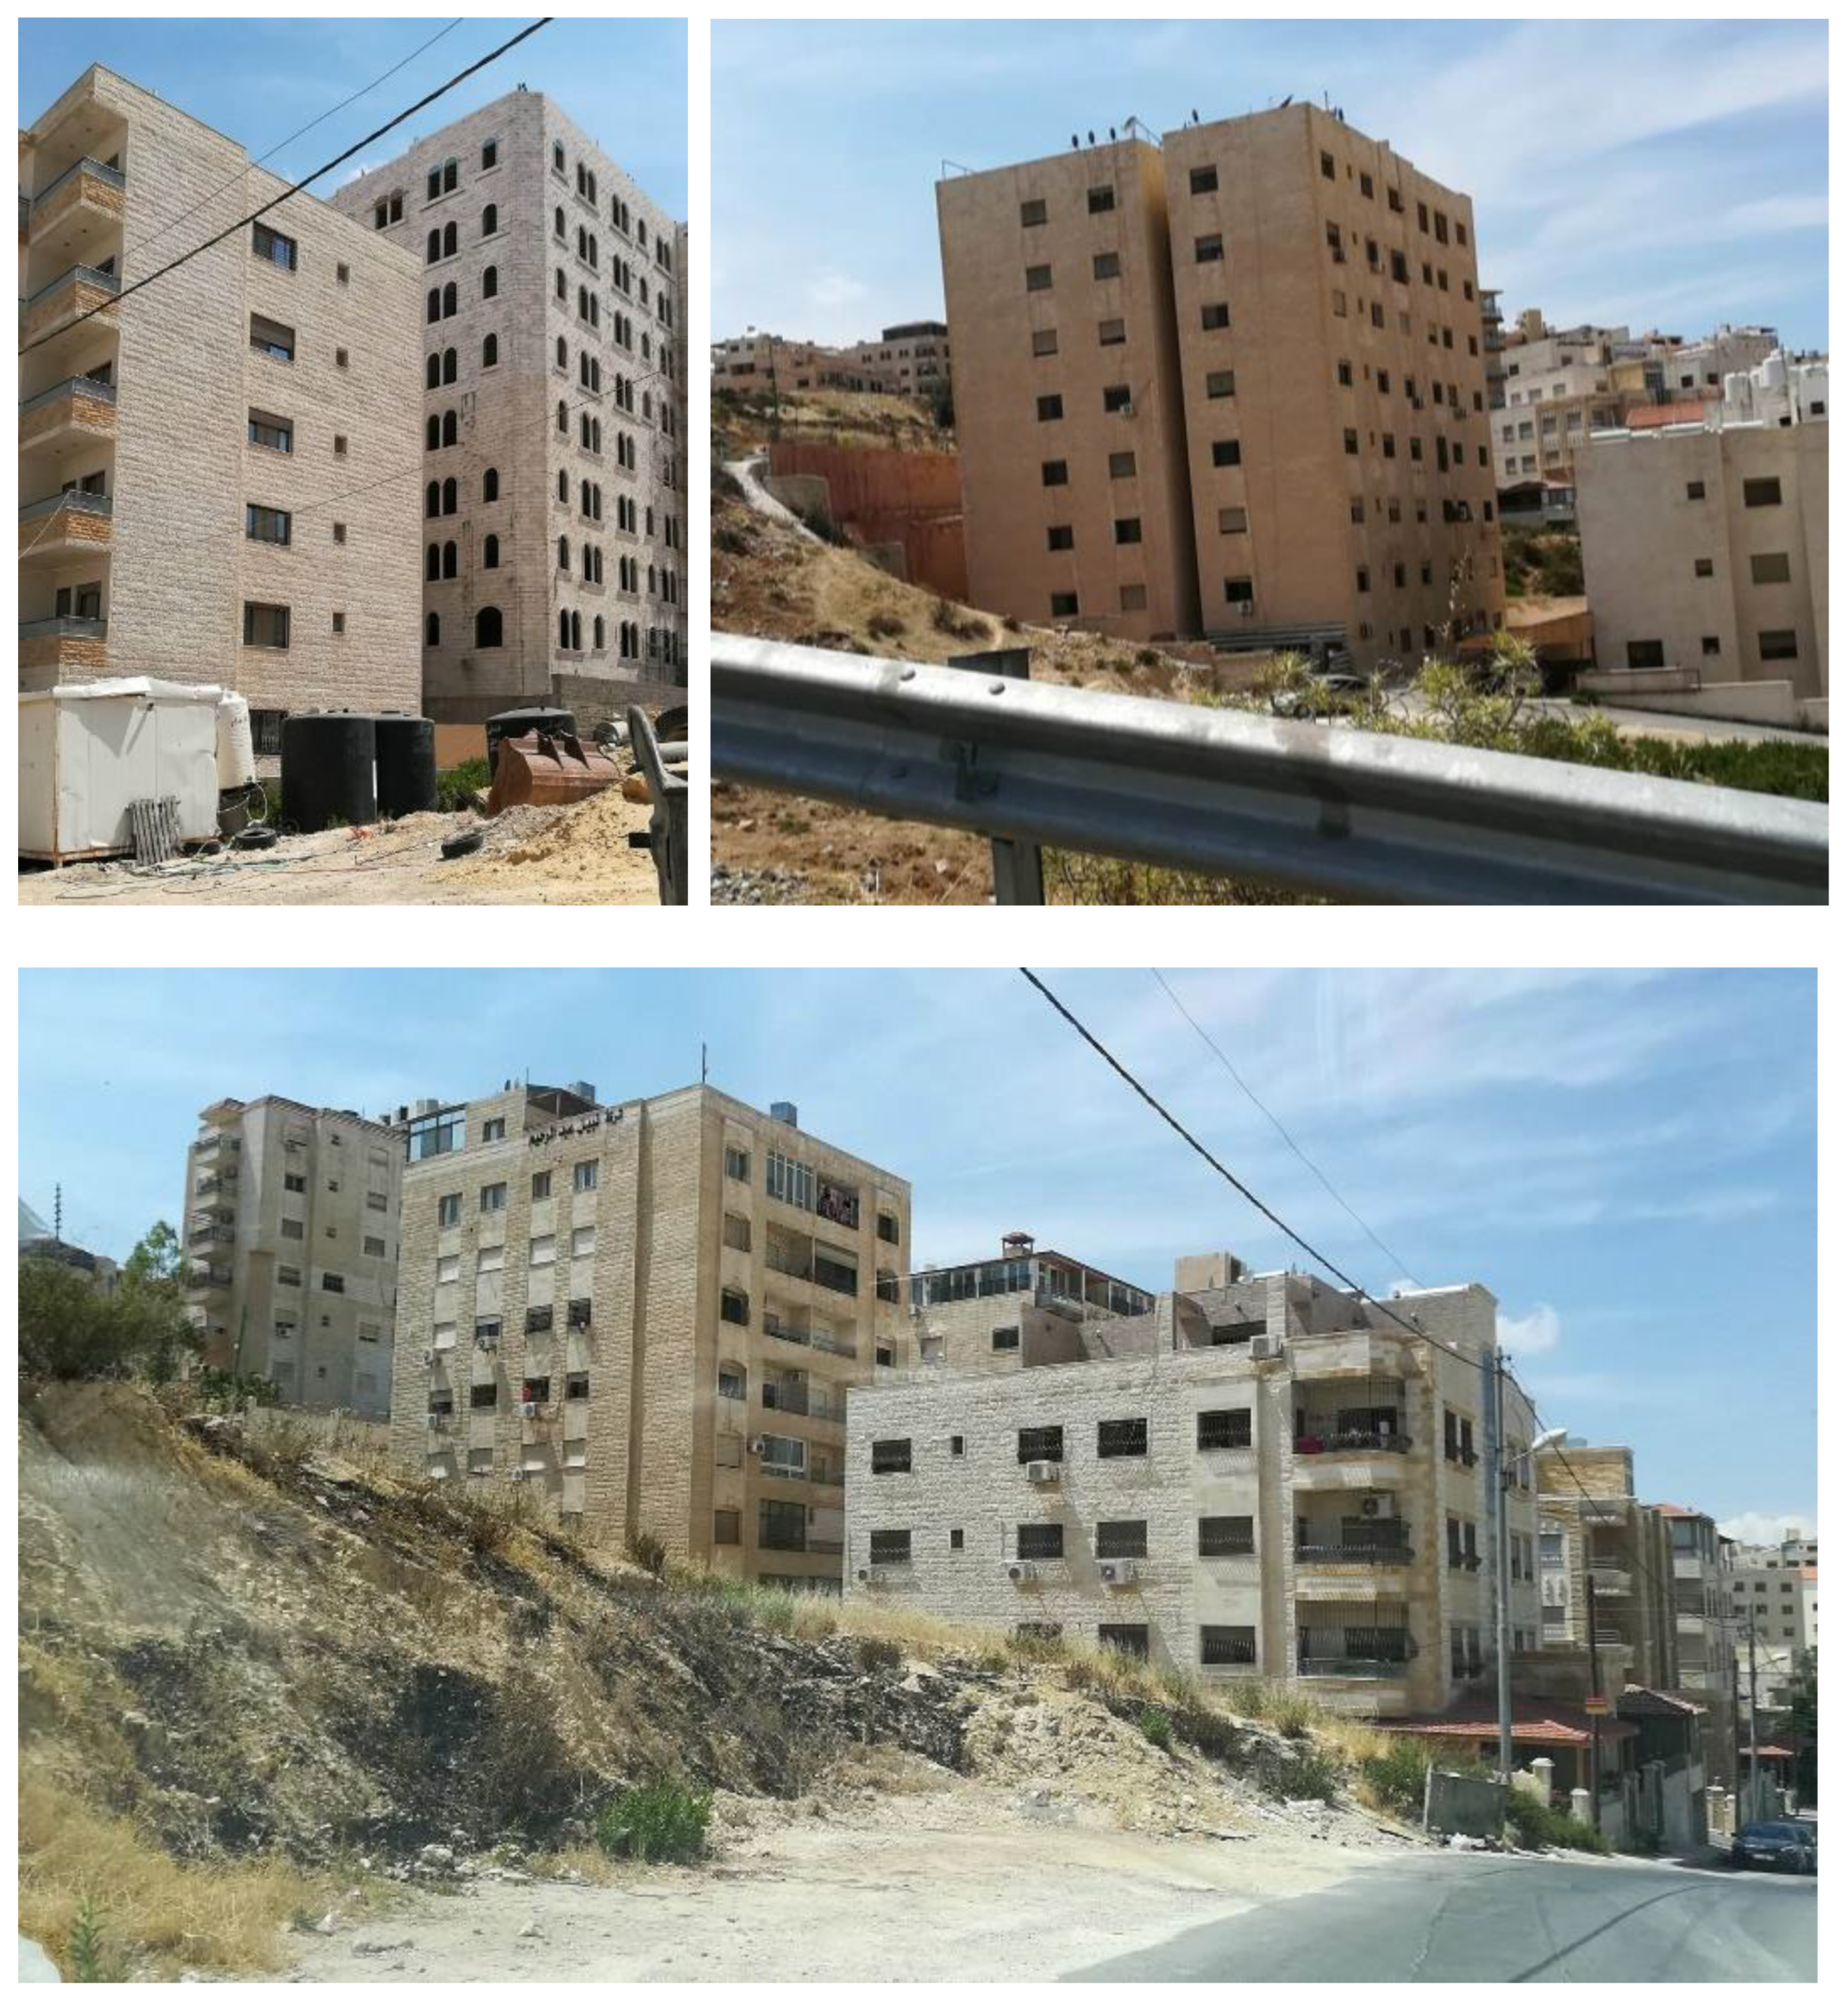
4.1. Preliminary Site Visit
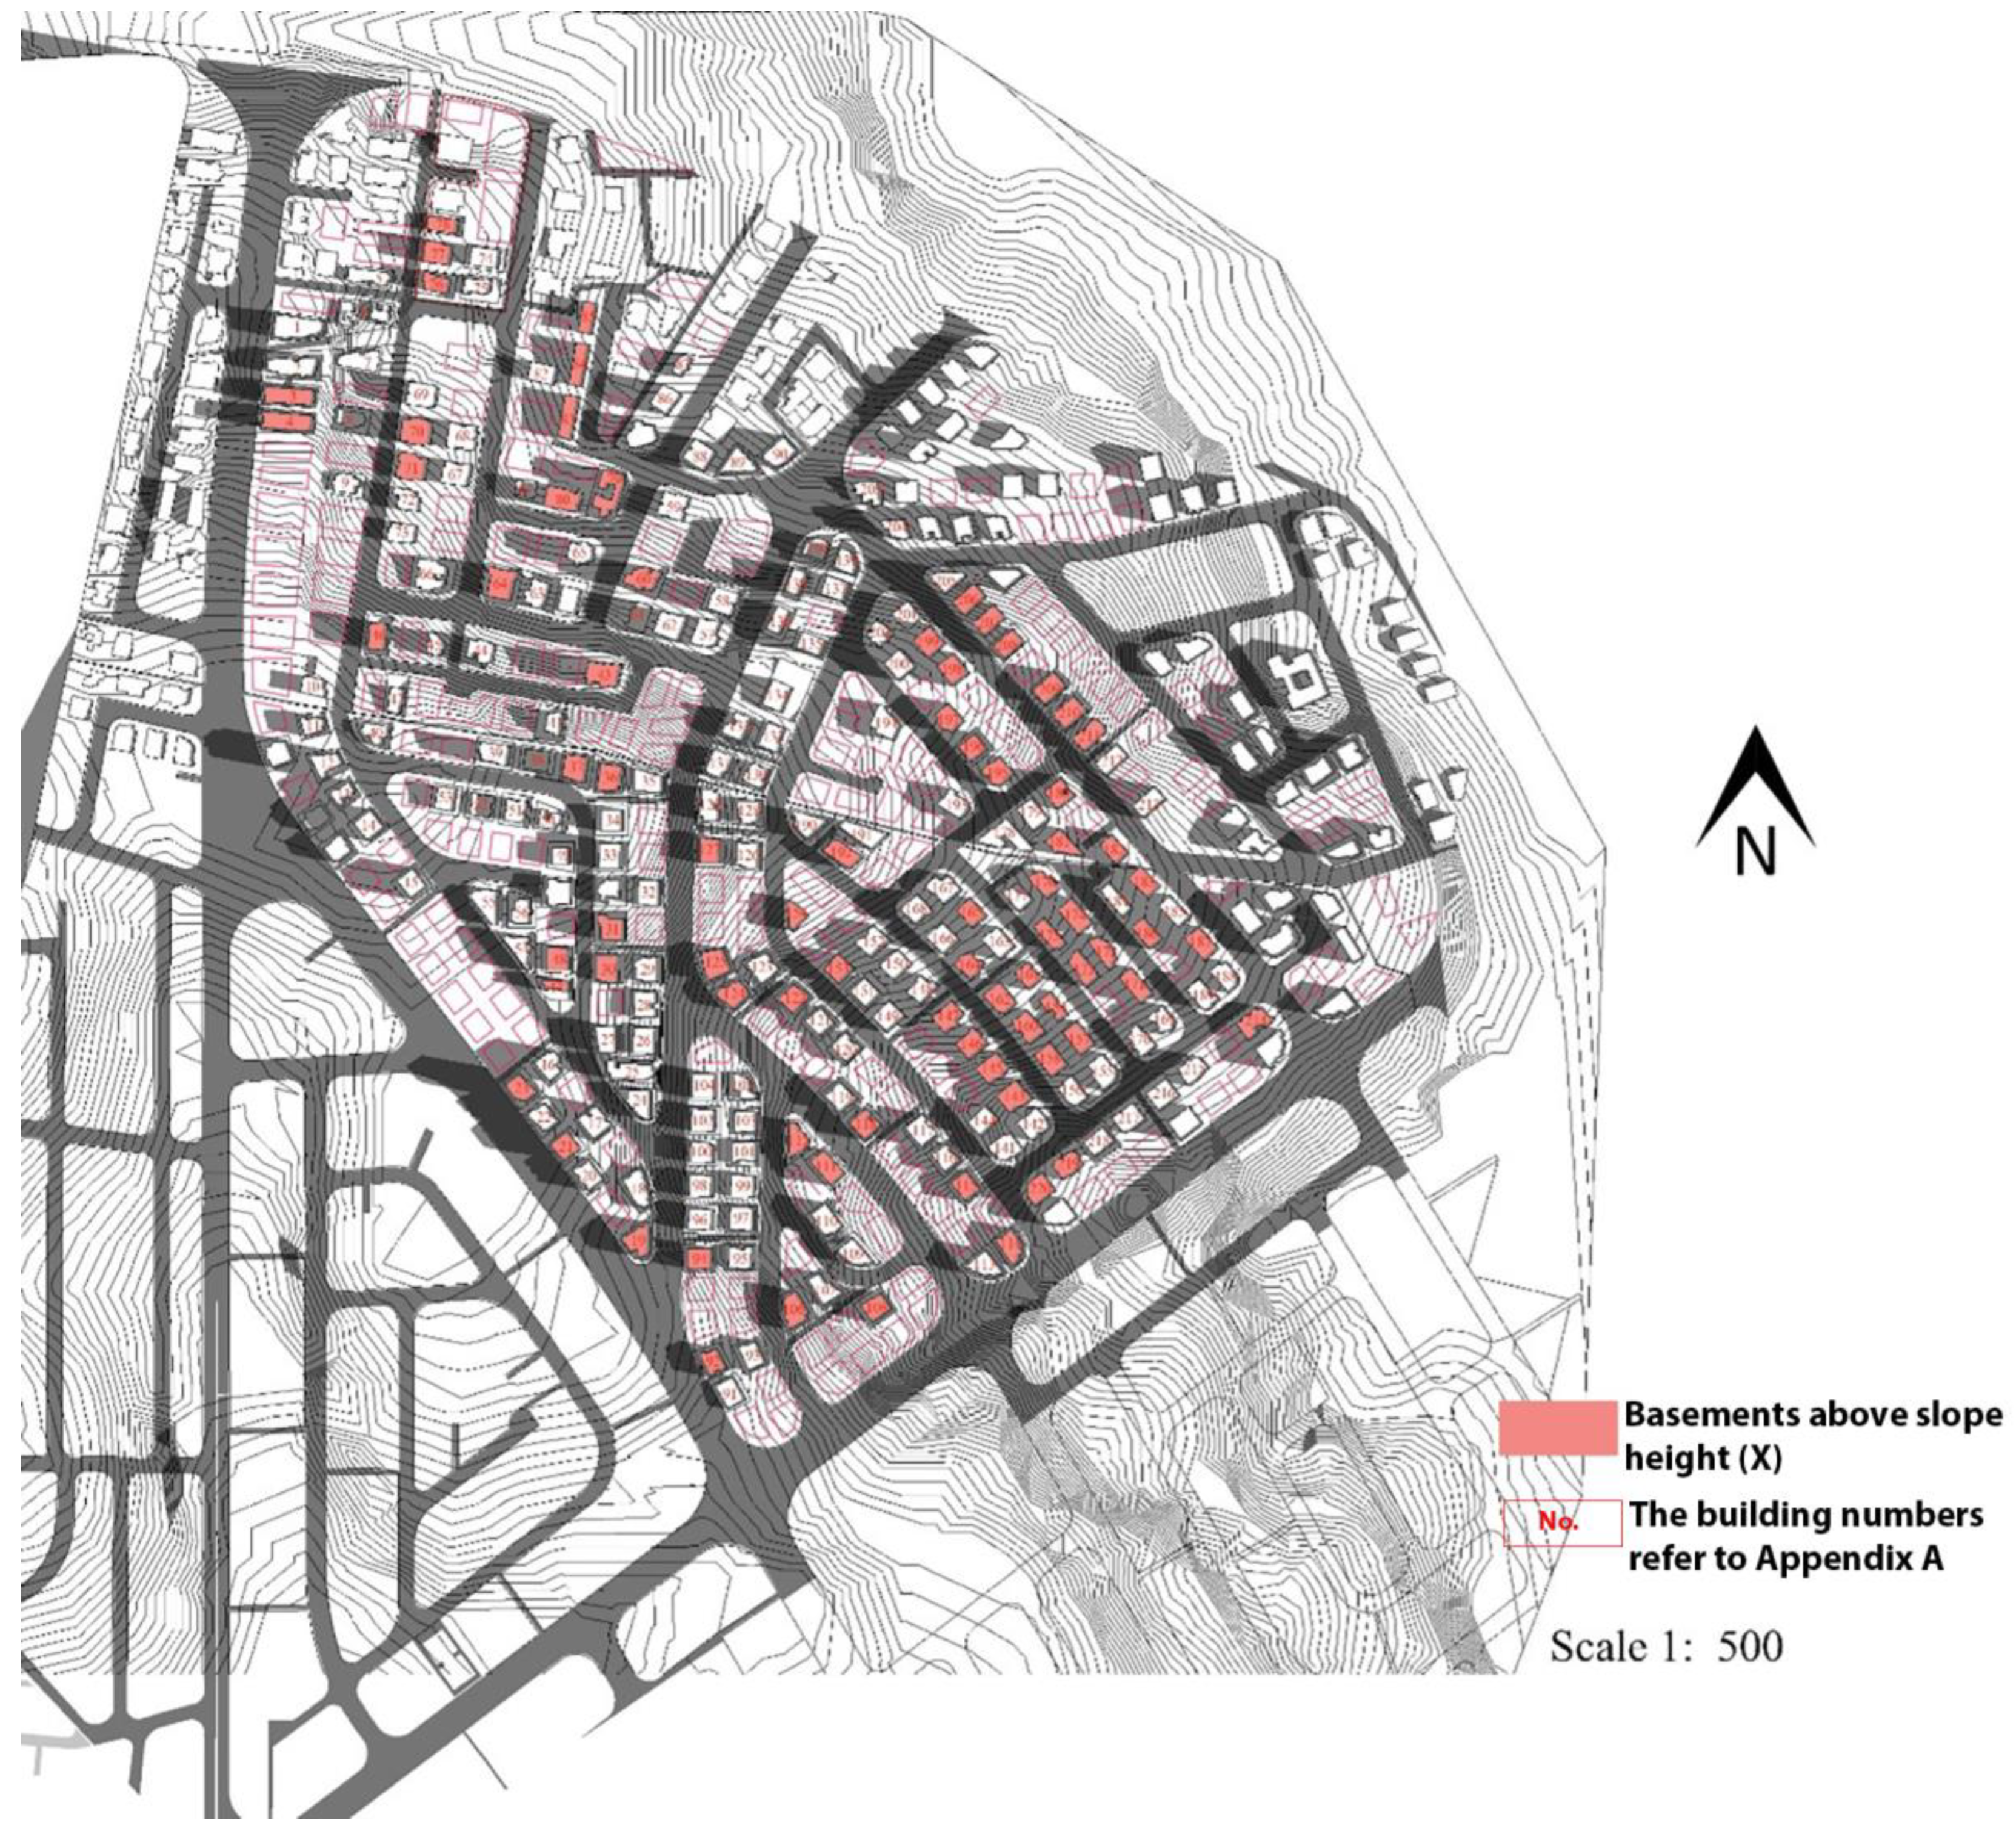
4.2. Basement Assessment
4.3. Street Width Measurement
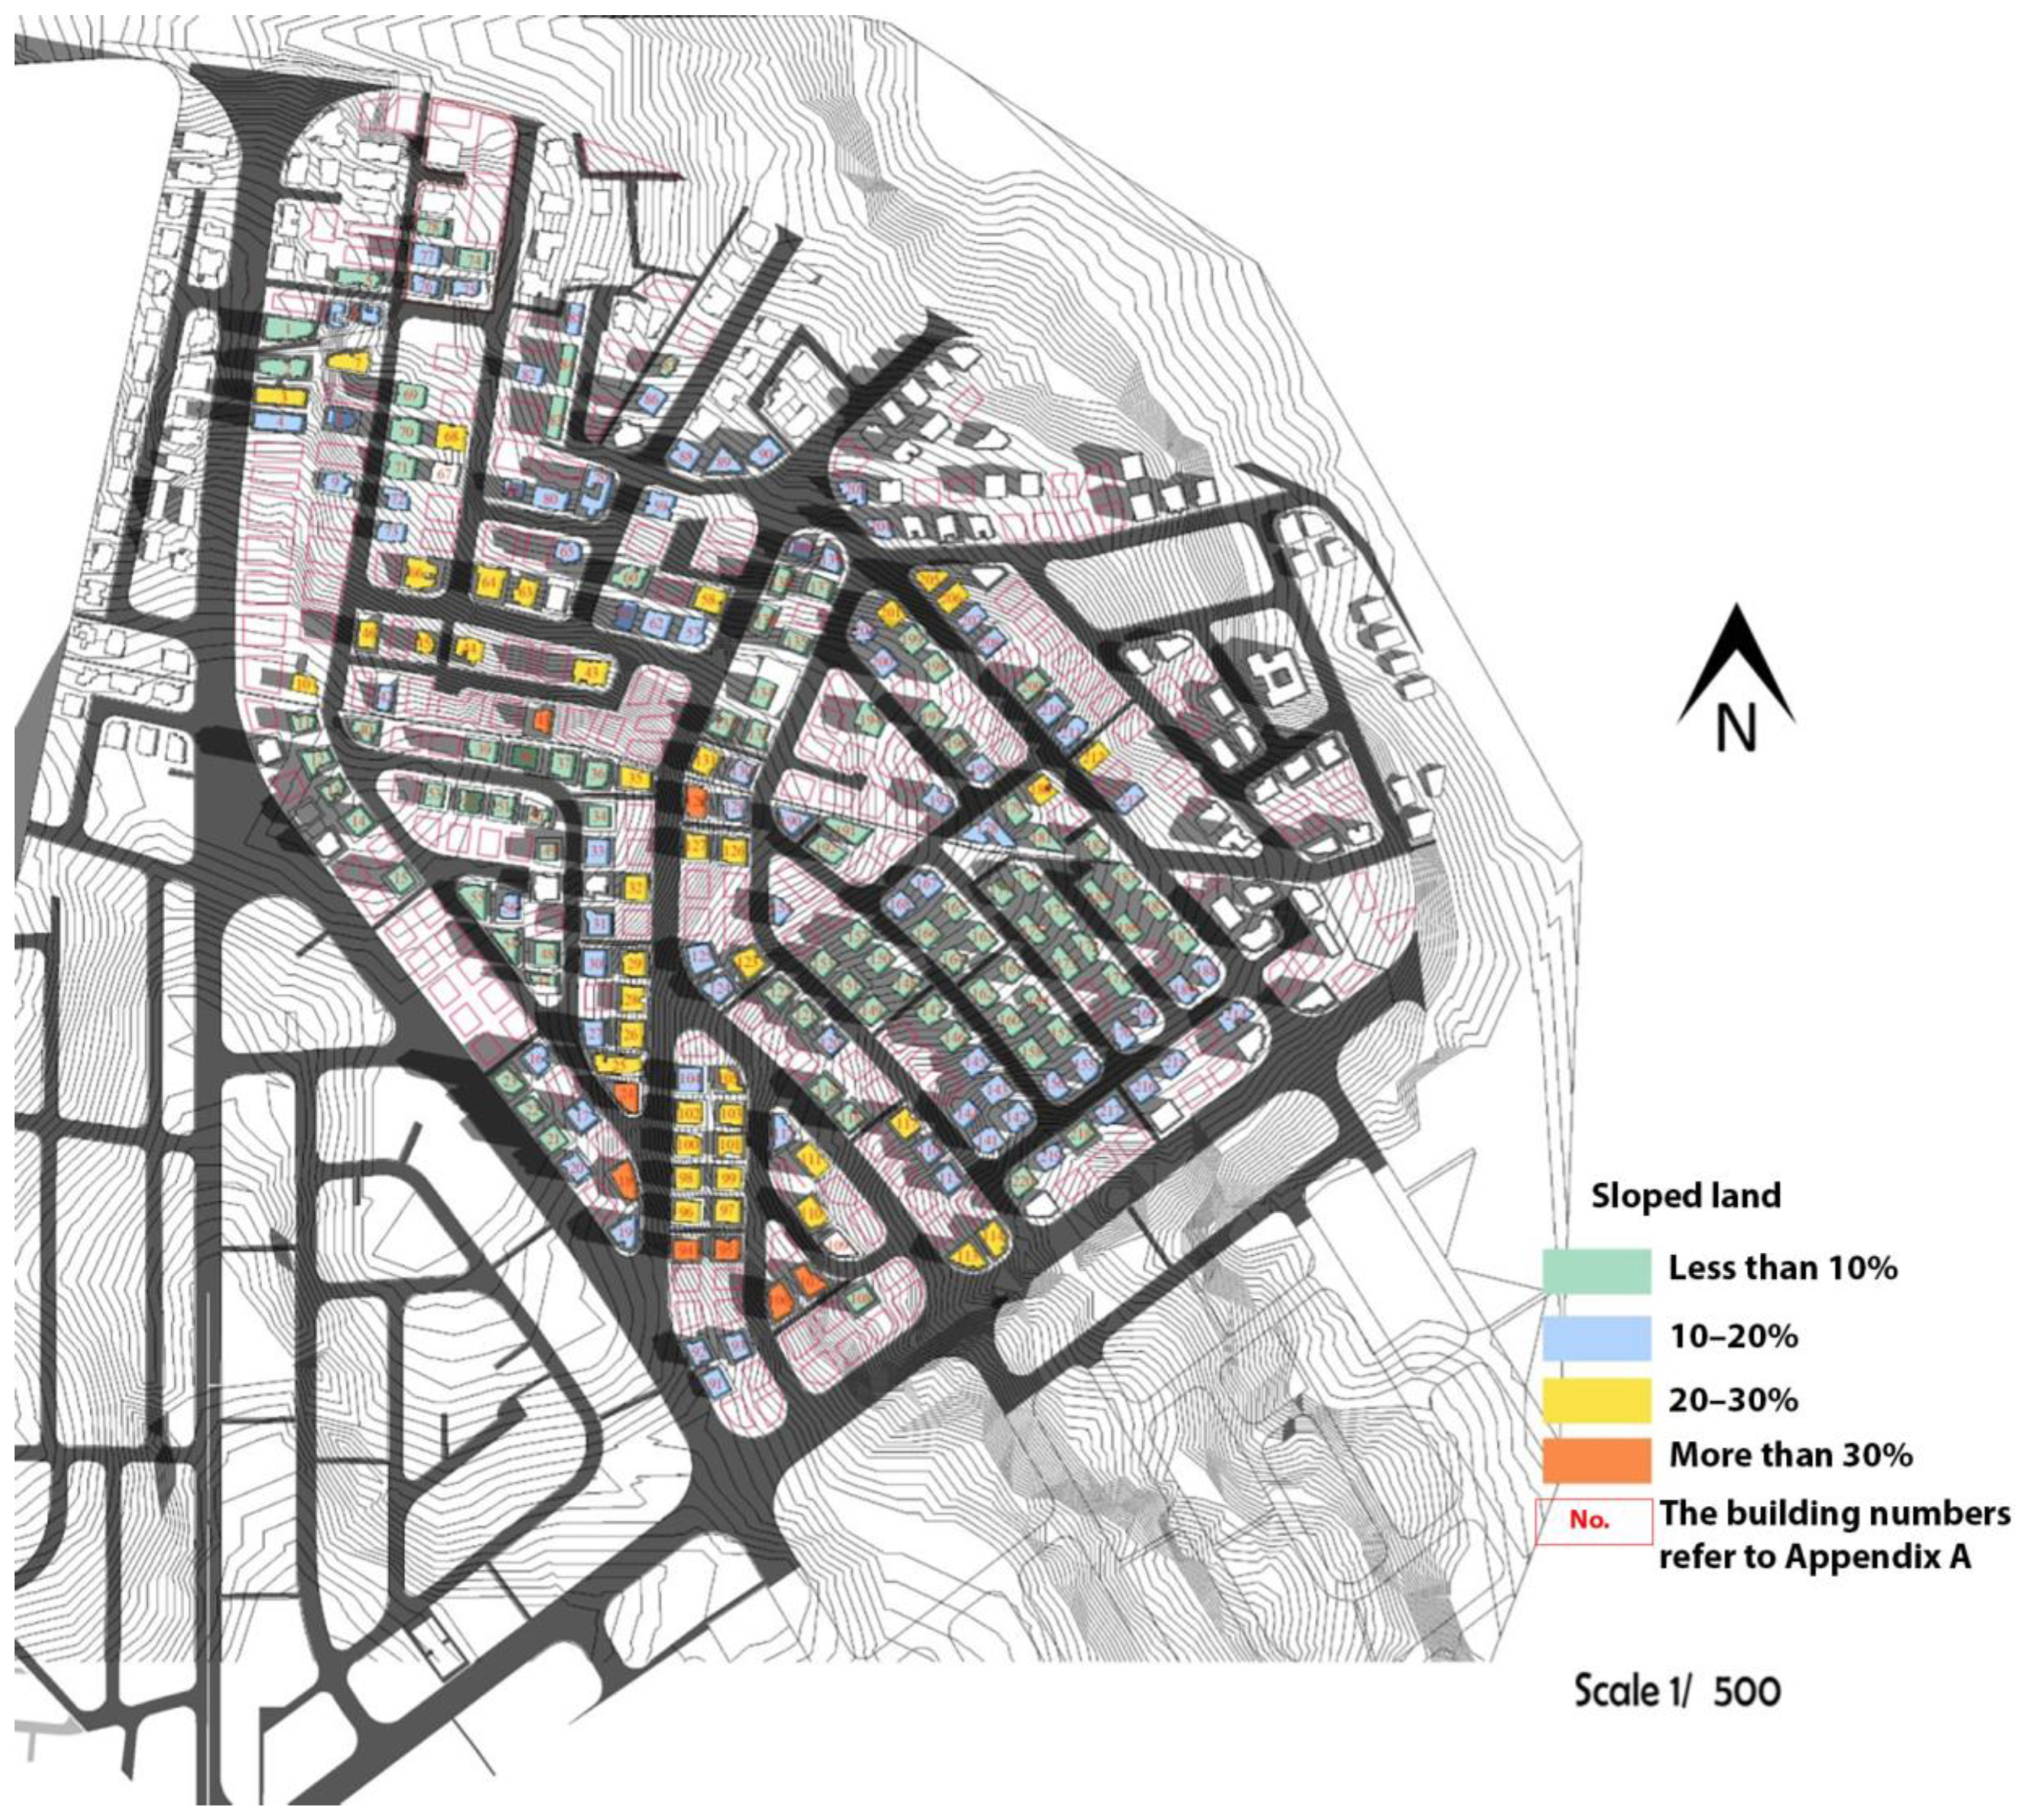
4.4. Topography and Slope Calculation
- Flat terrain (0%);
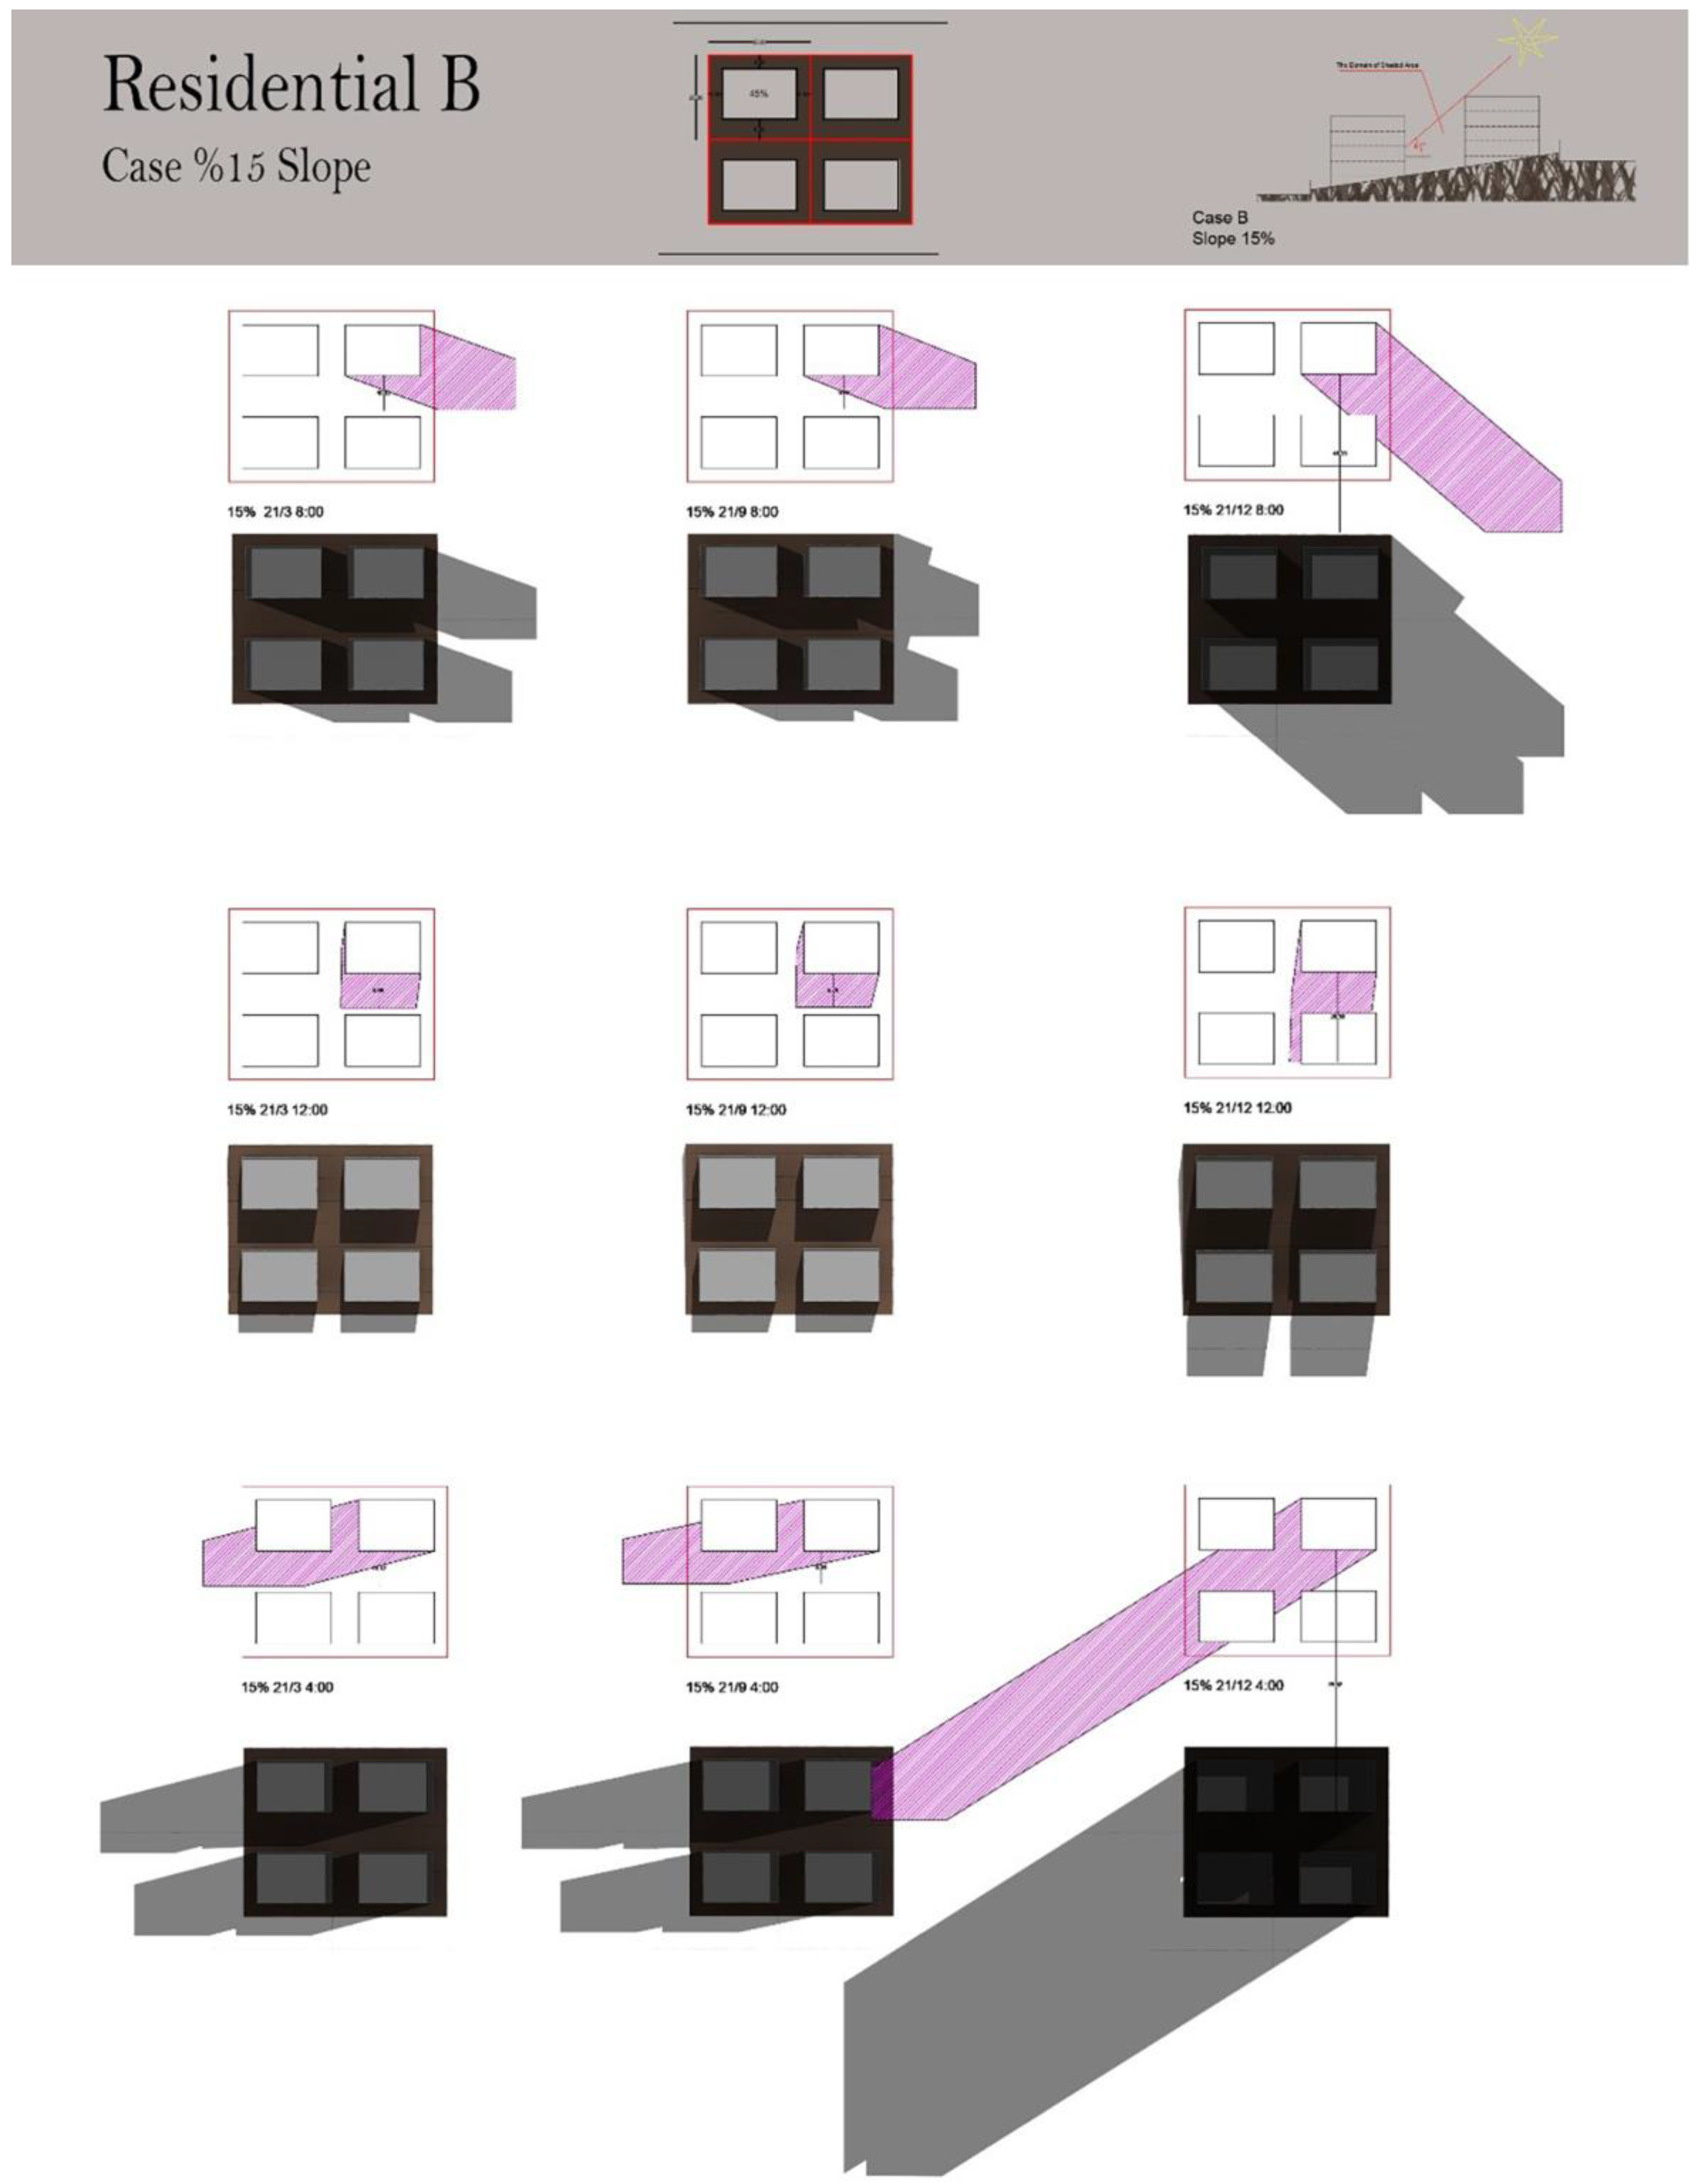
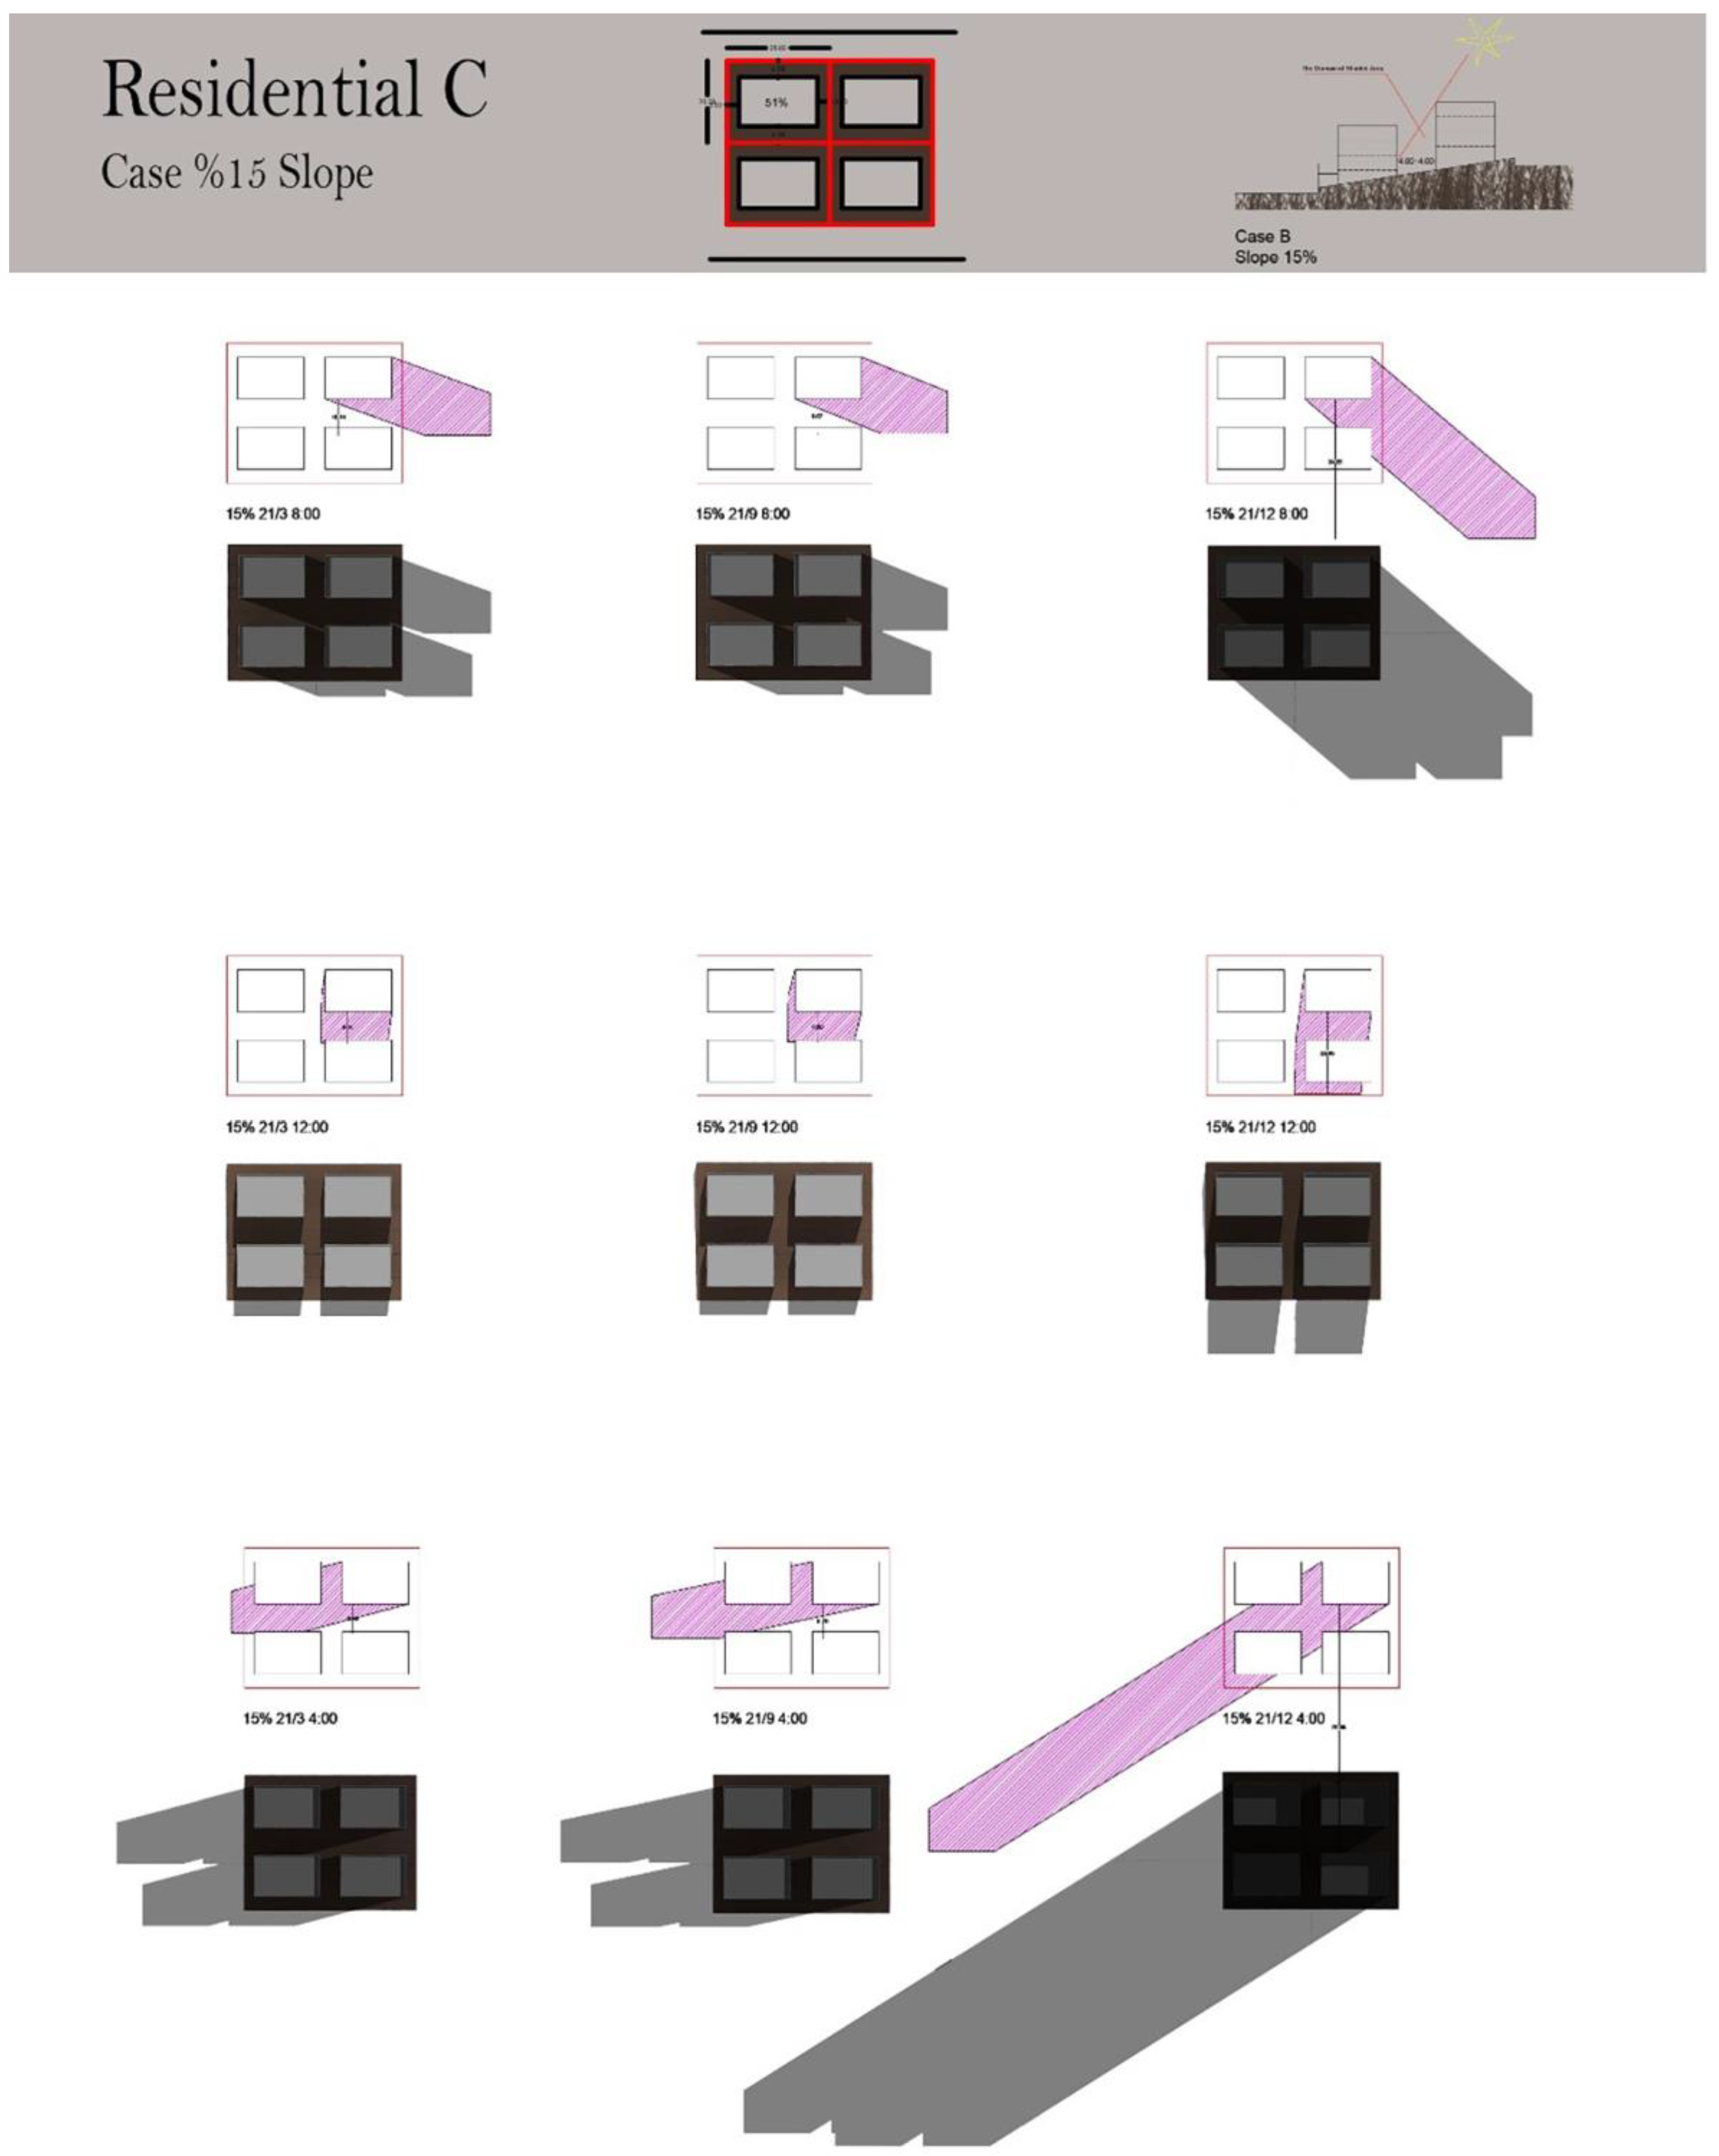
- Moderate slope (15%);
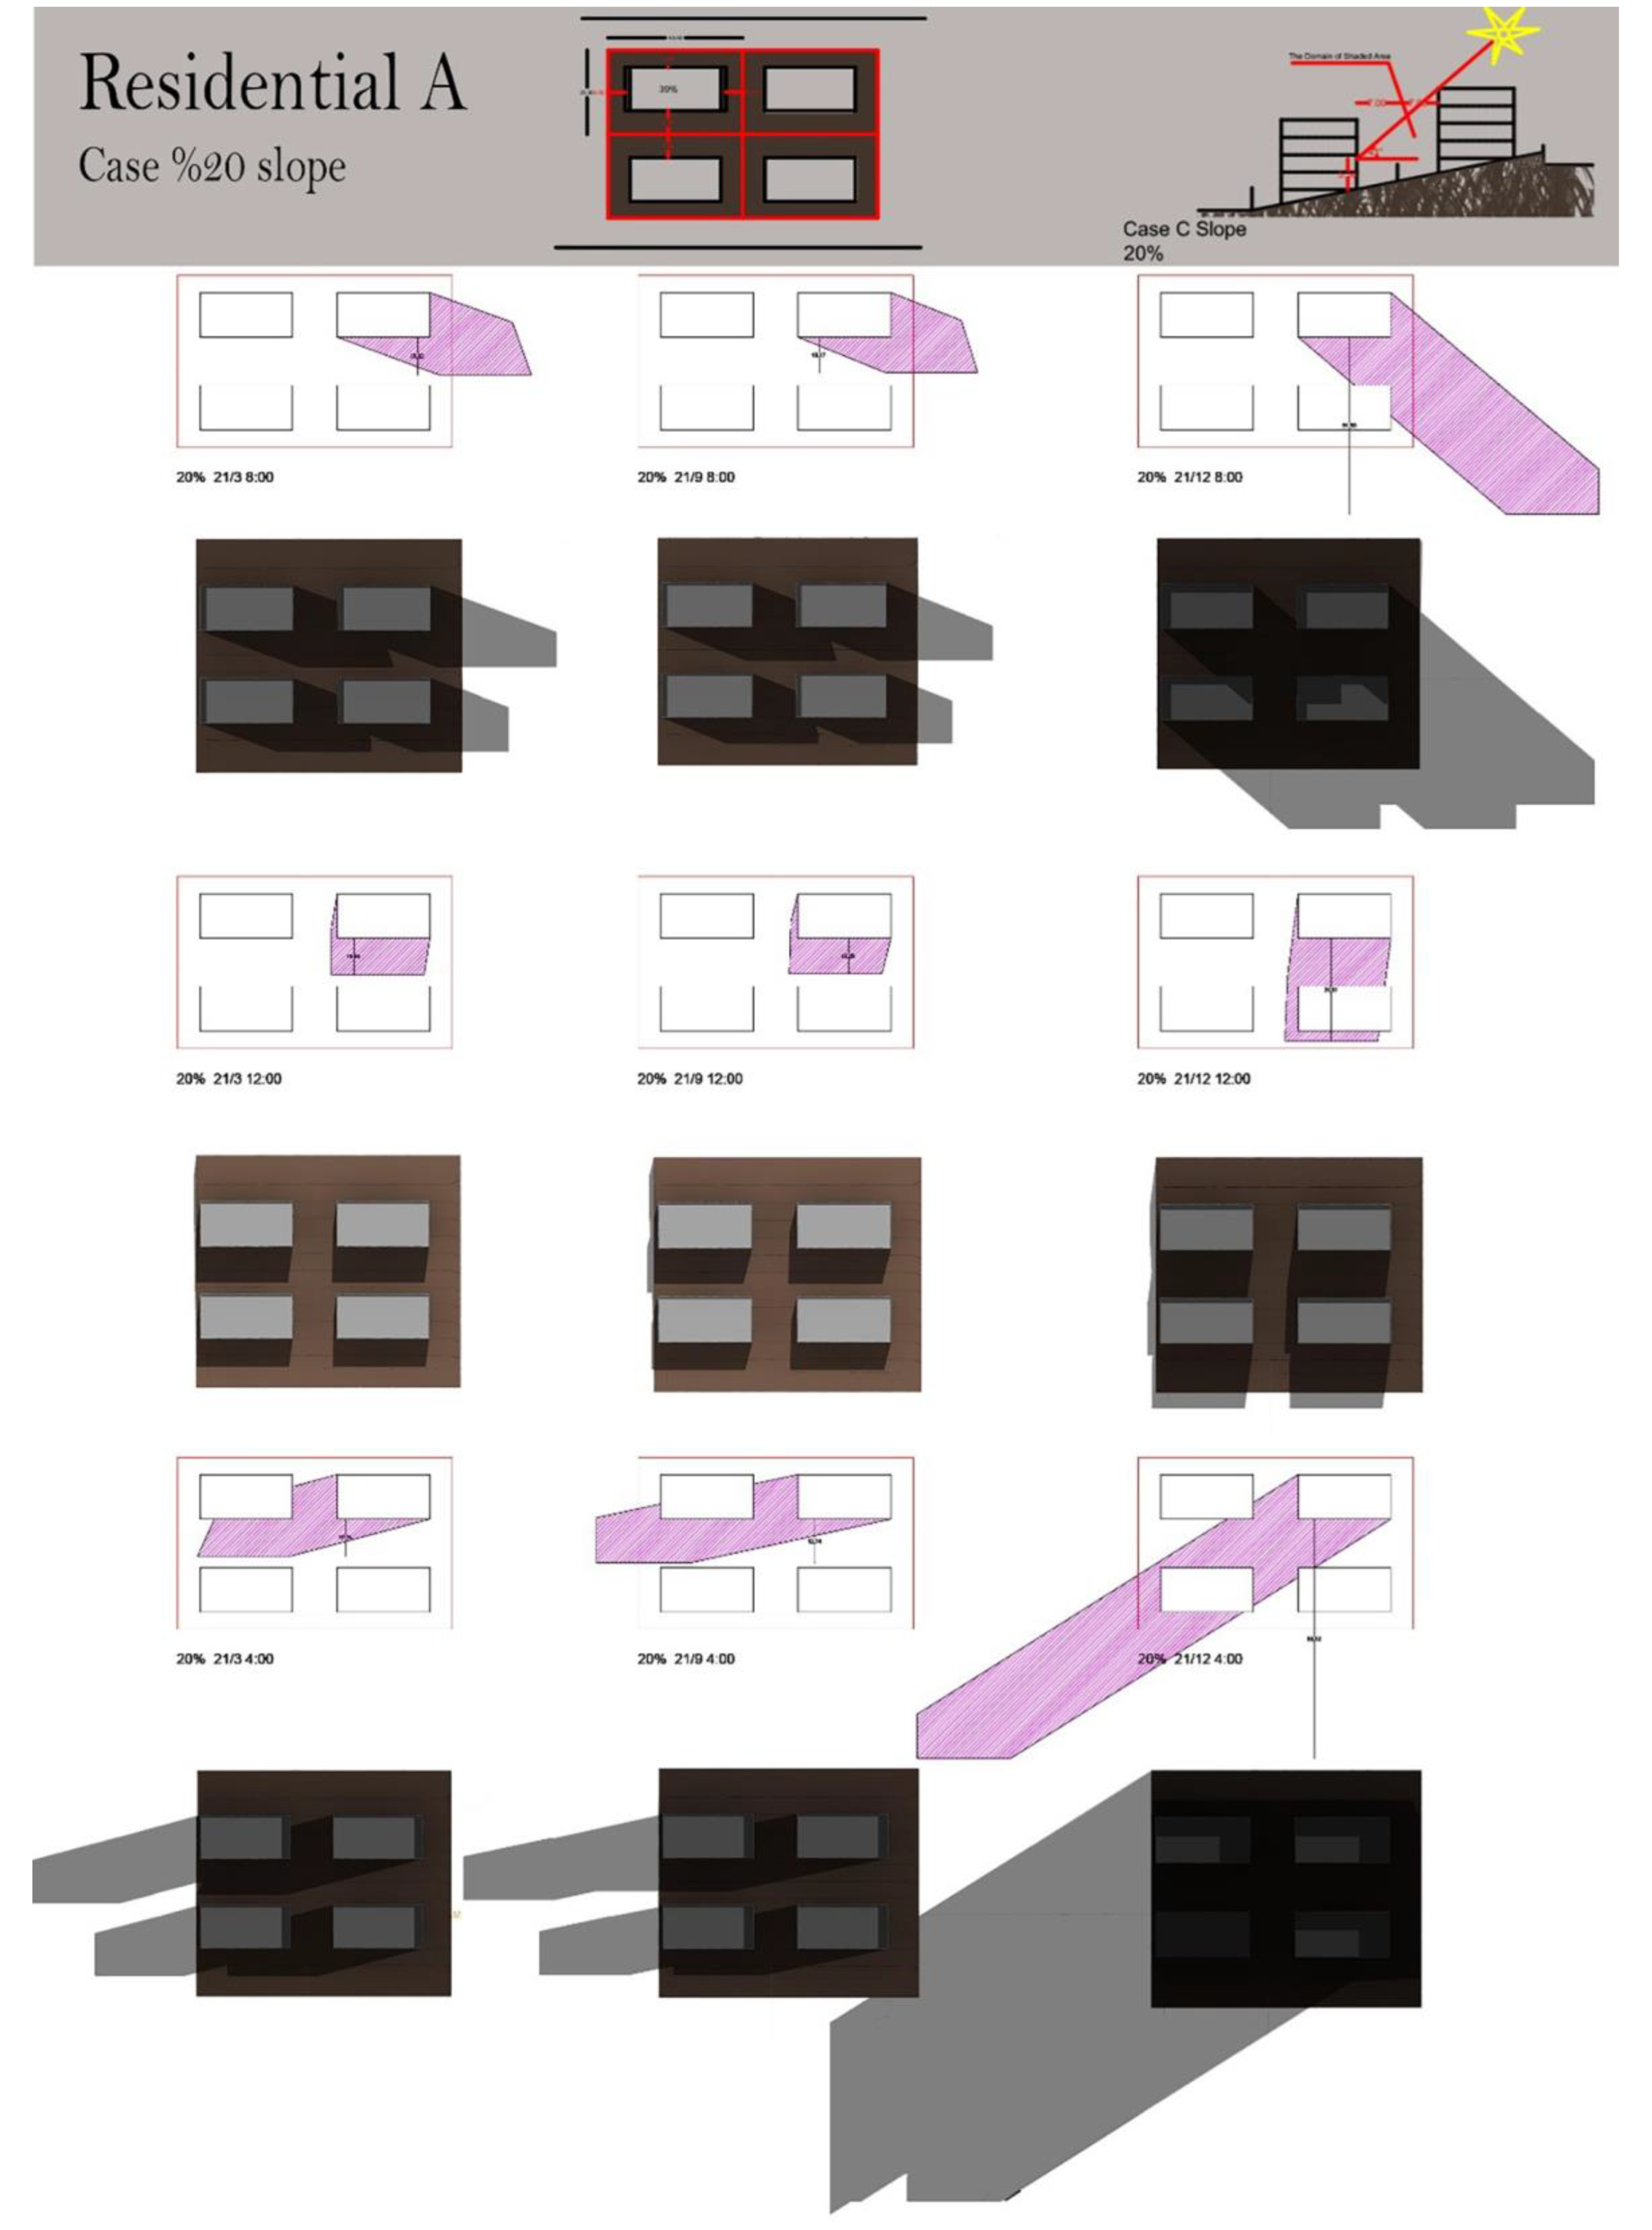
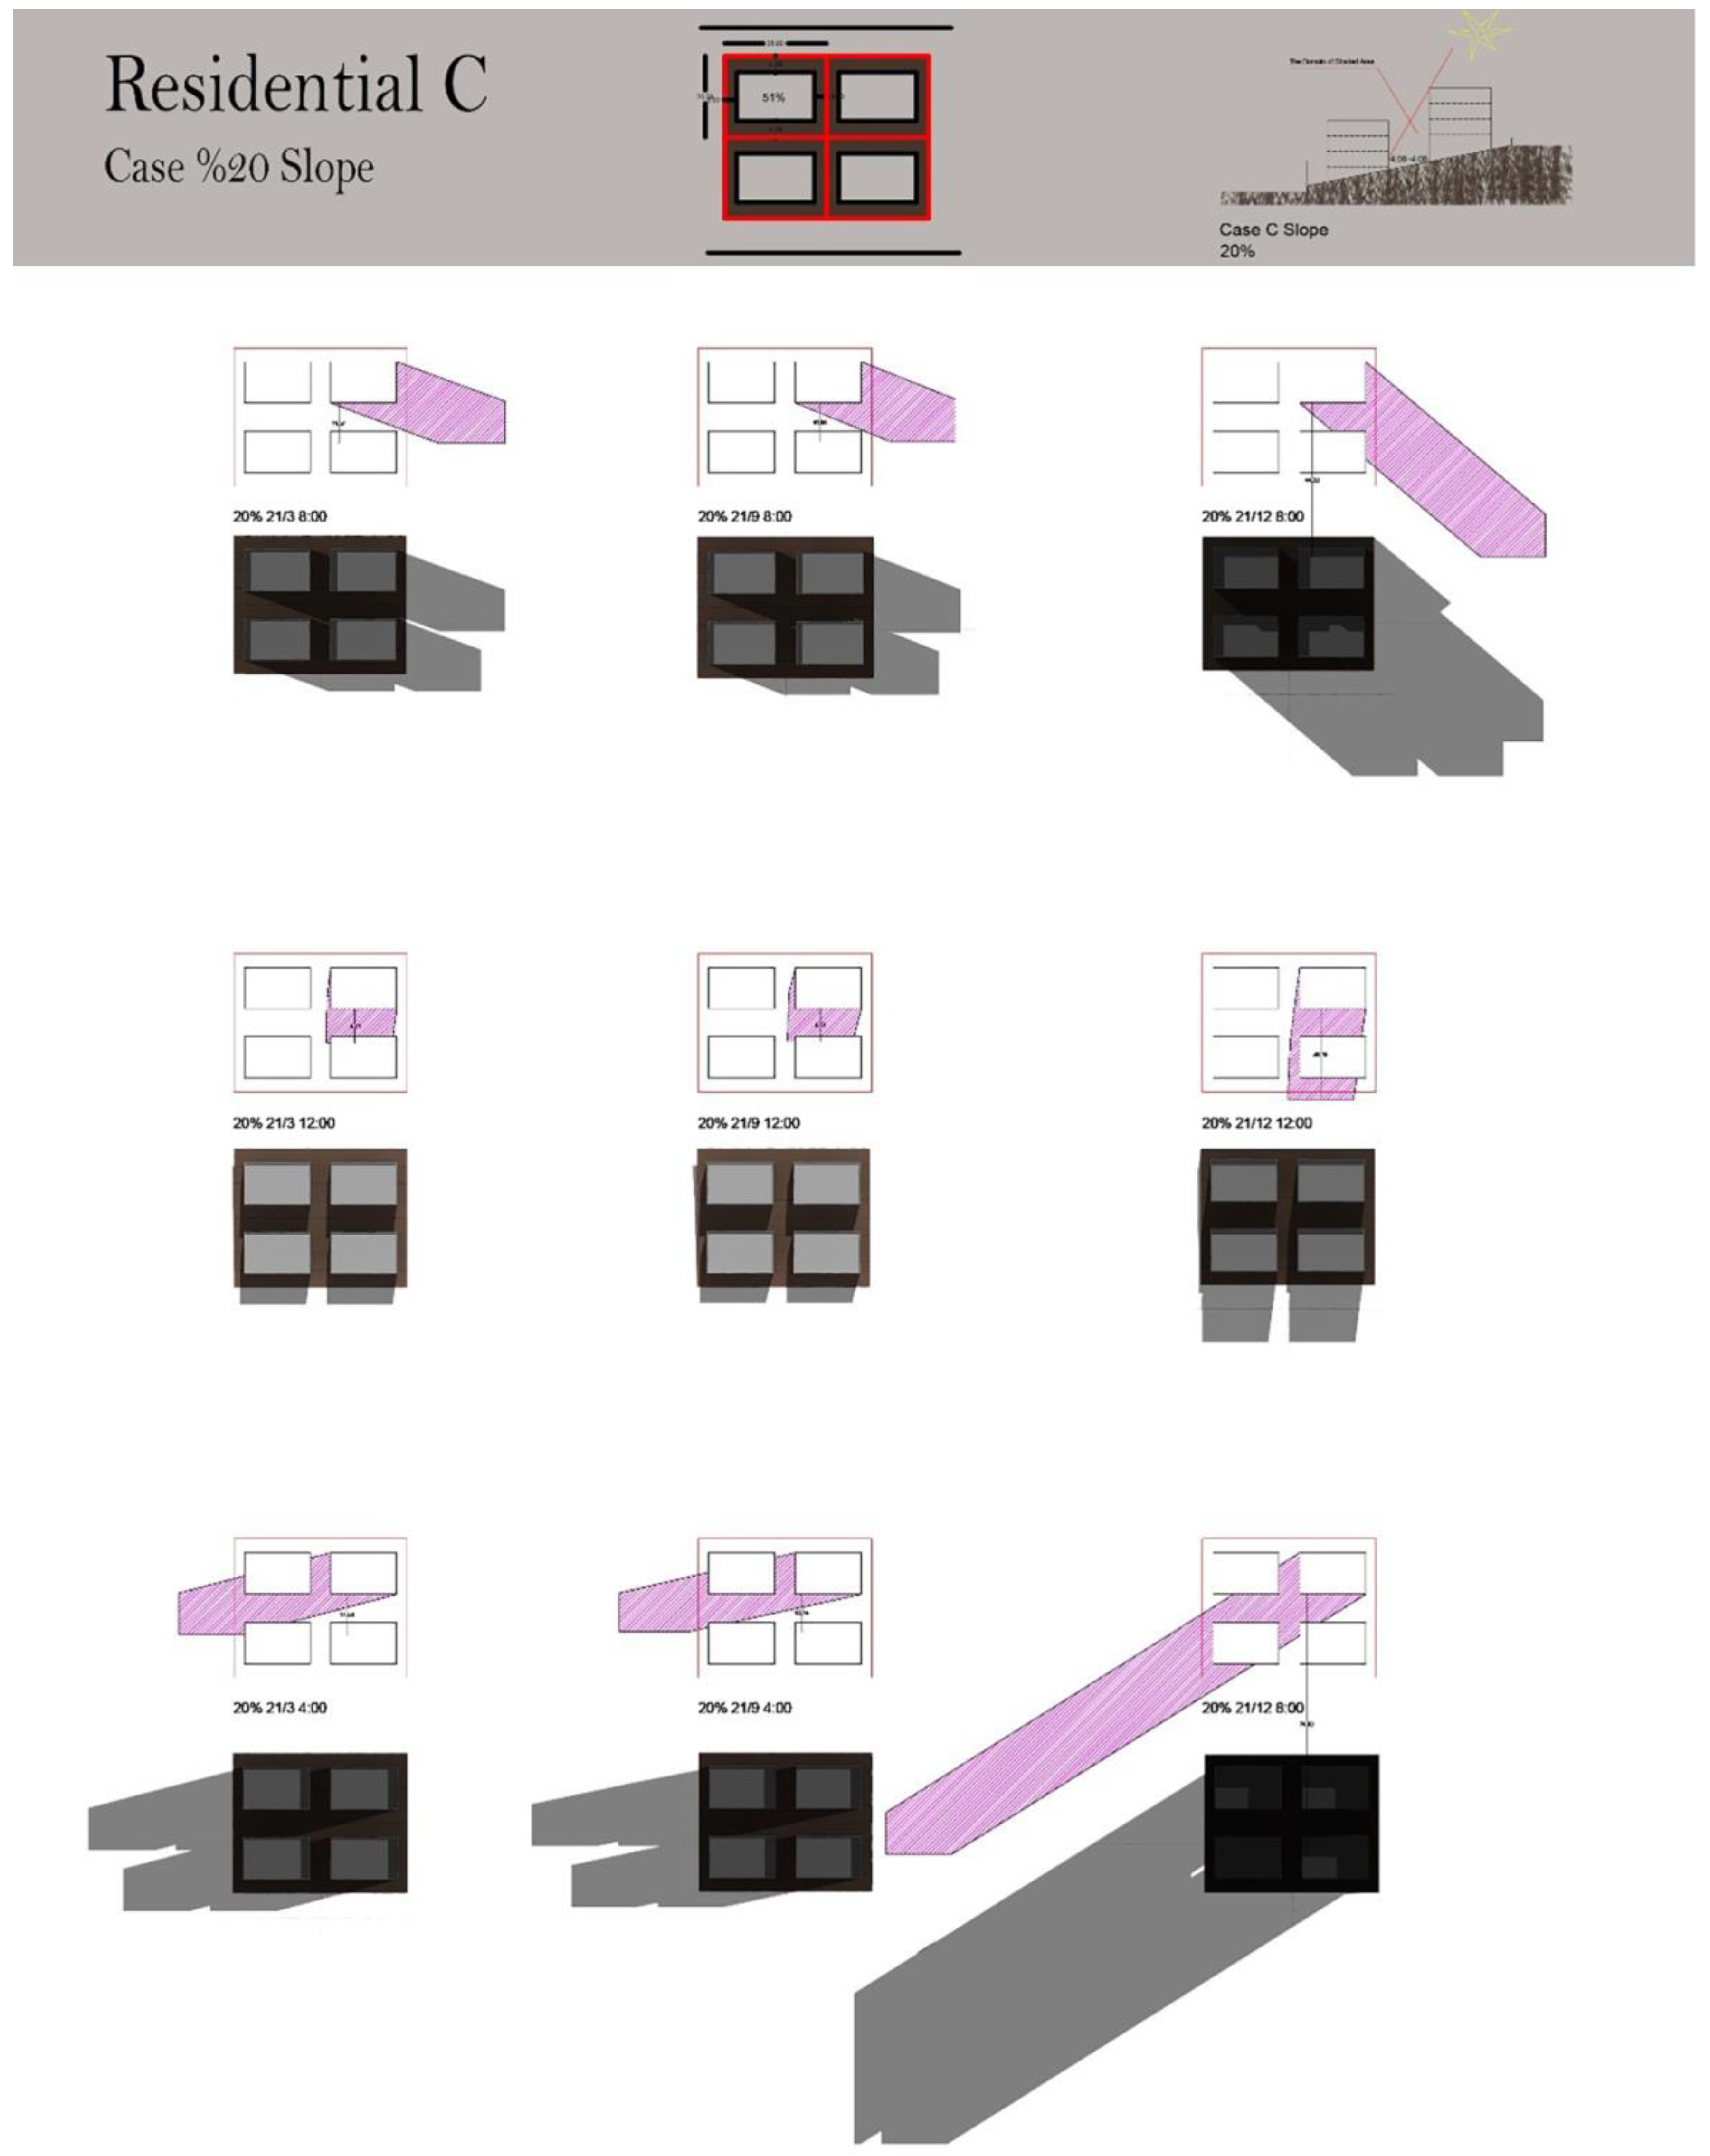
- Steep slope (20%);
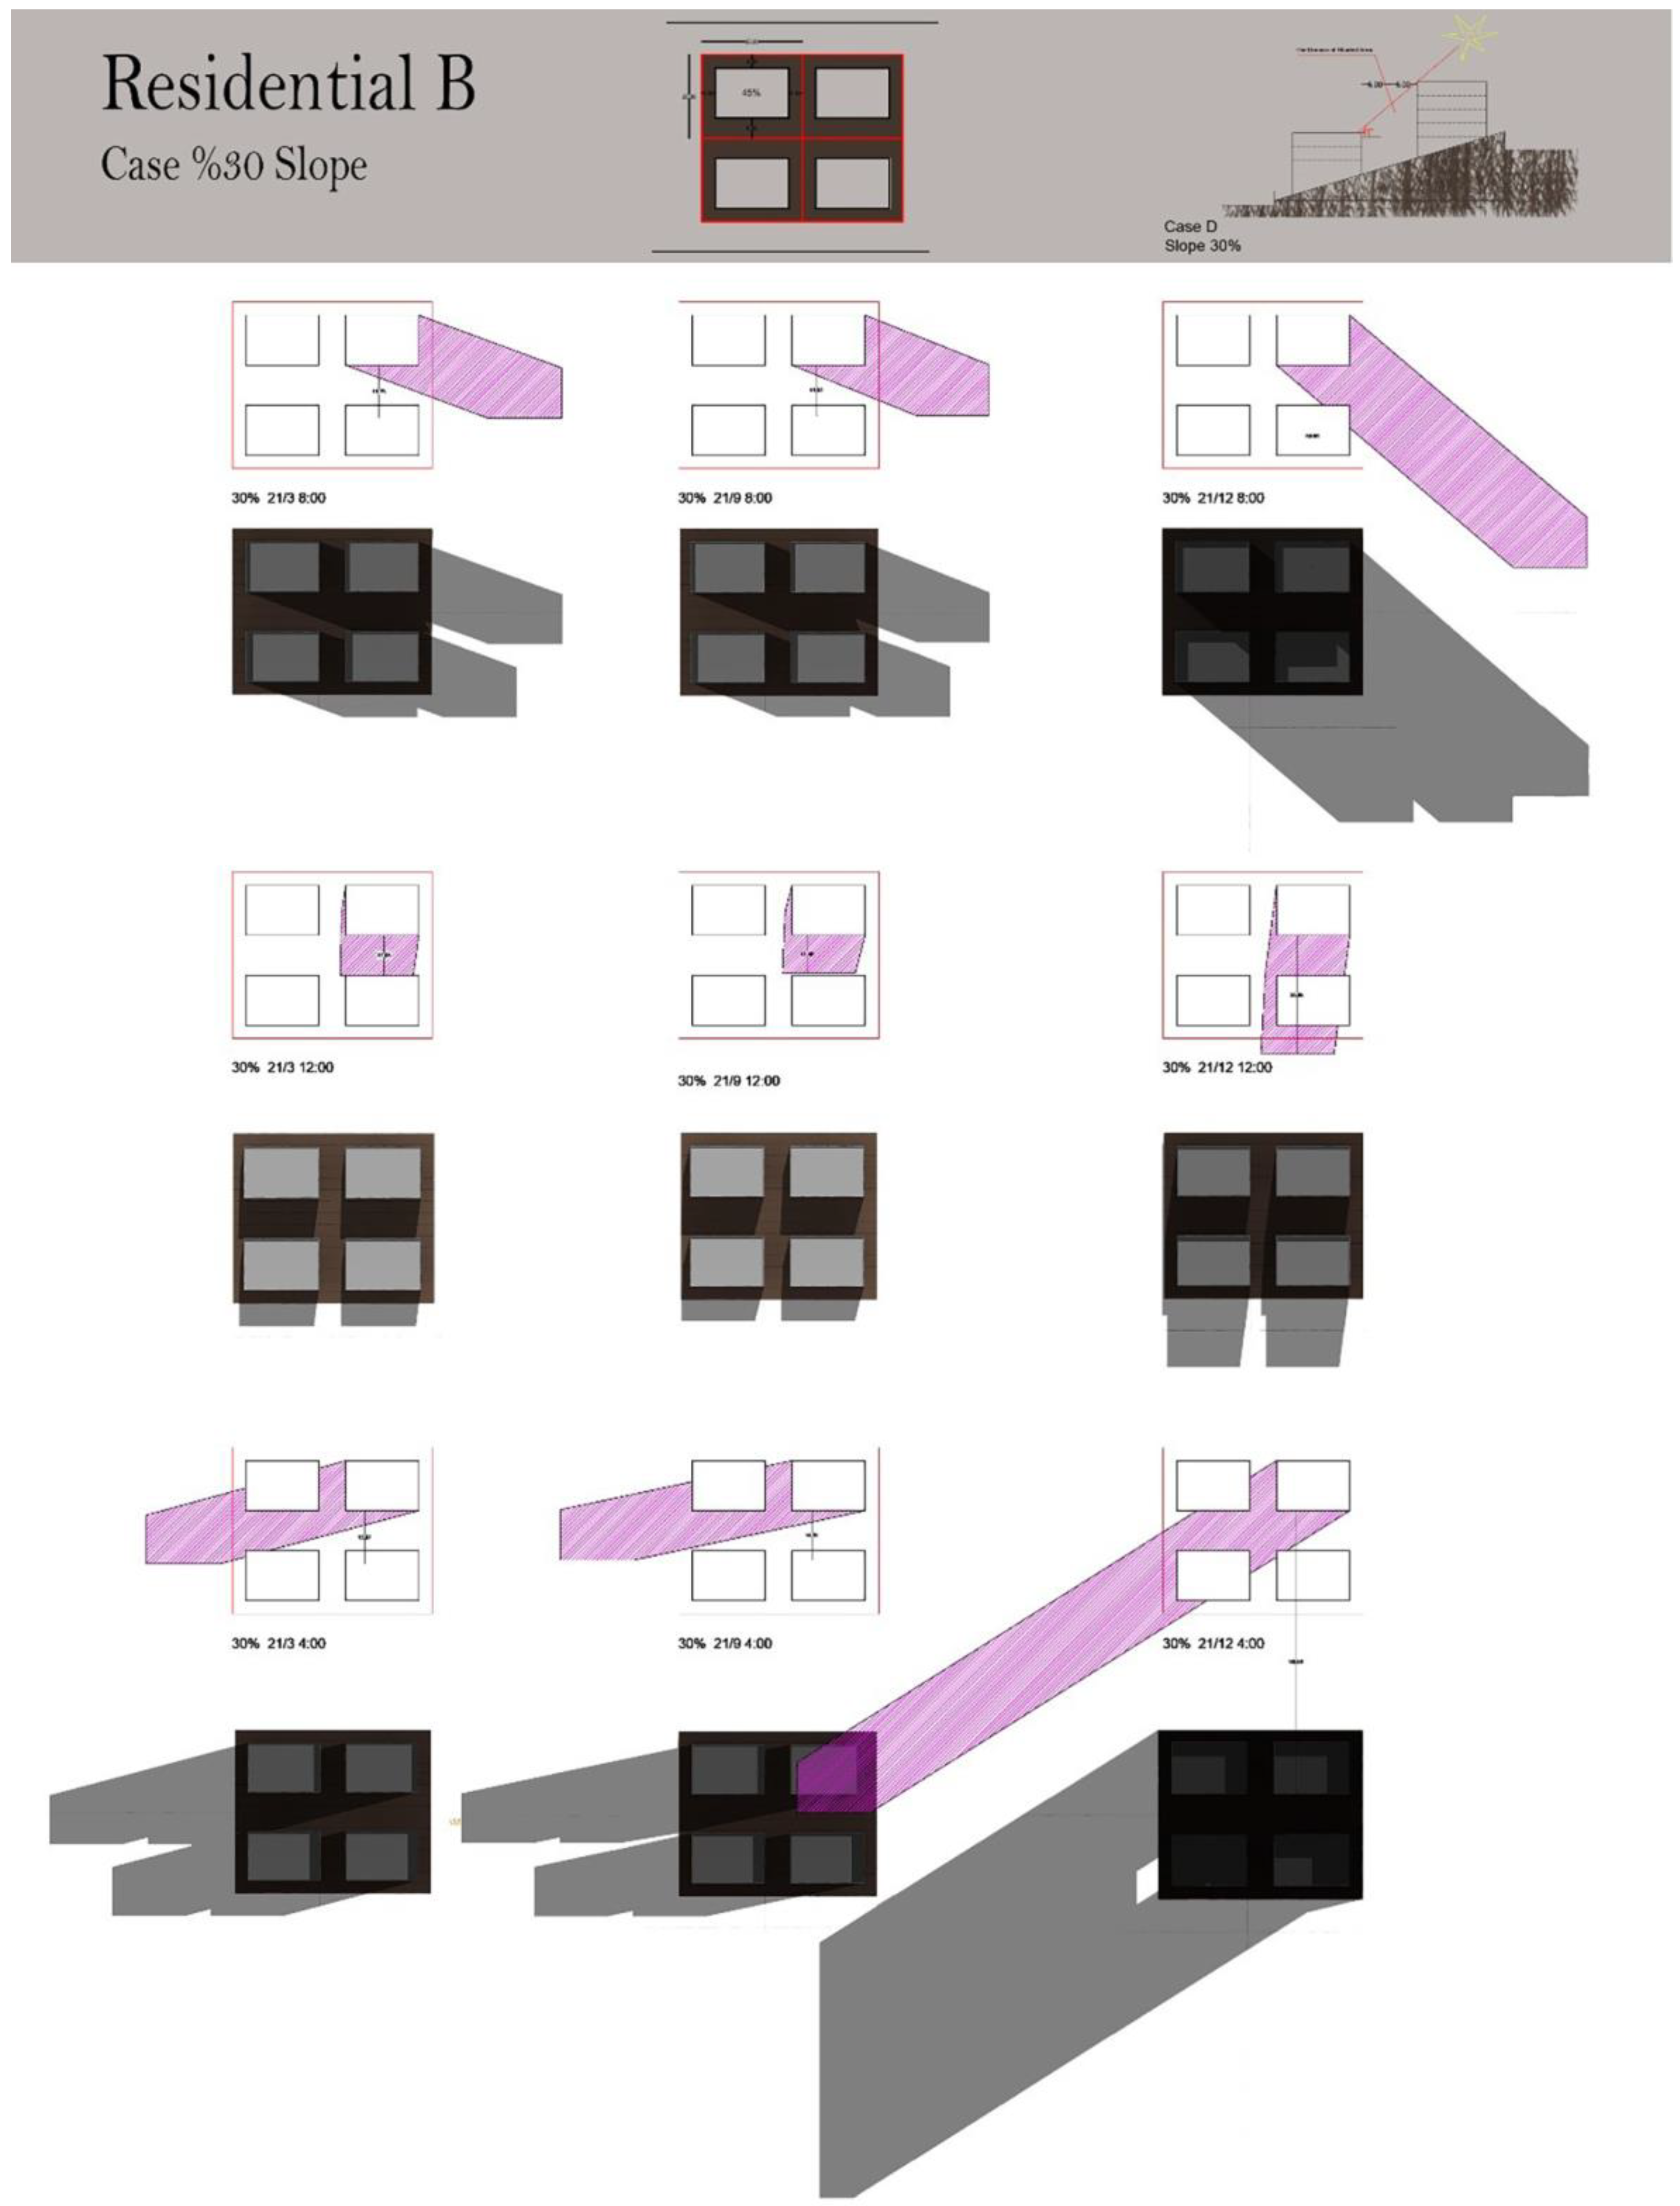
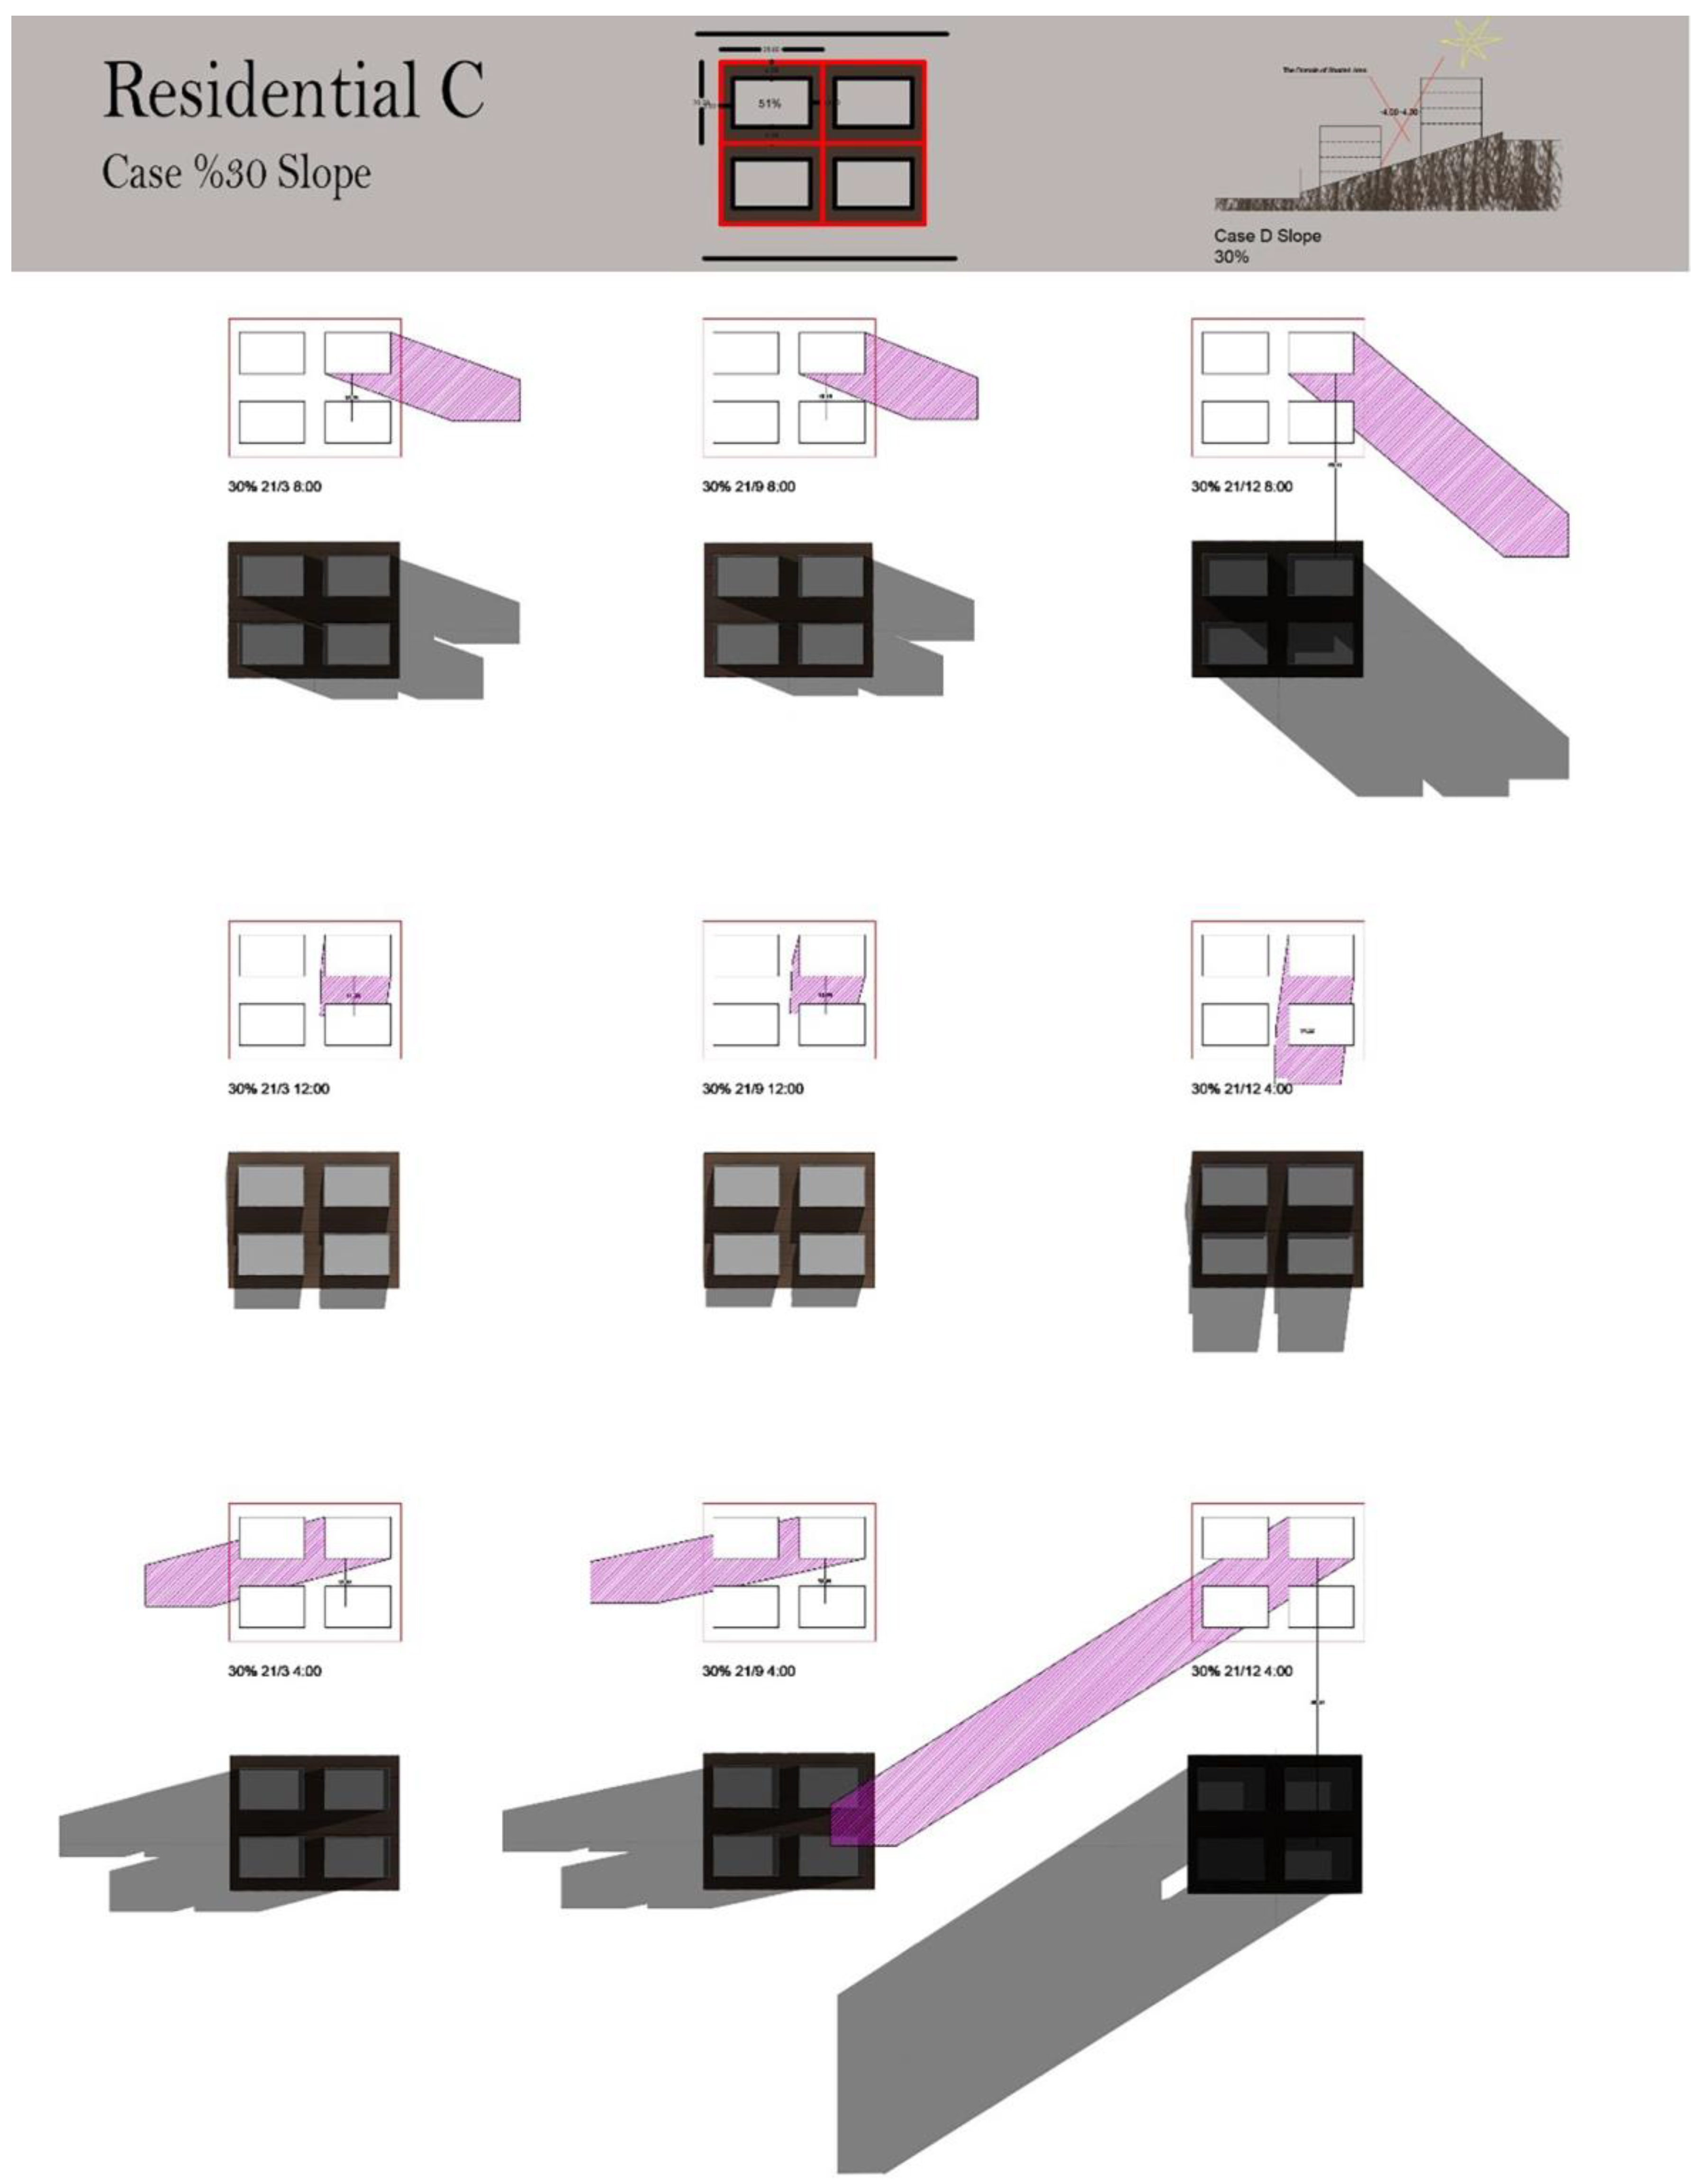
- Very steep slope (30%).
4.5. Data Integration into Revit
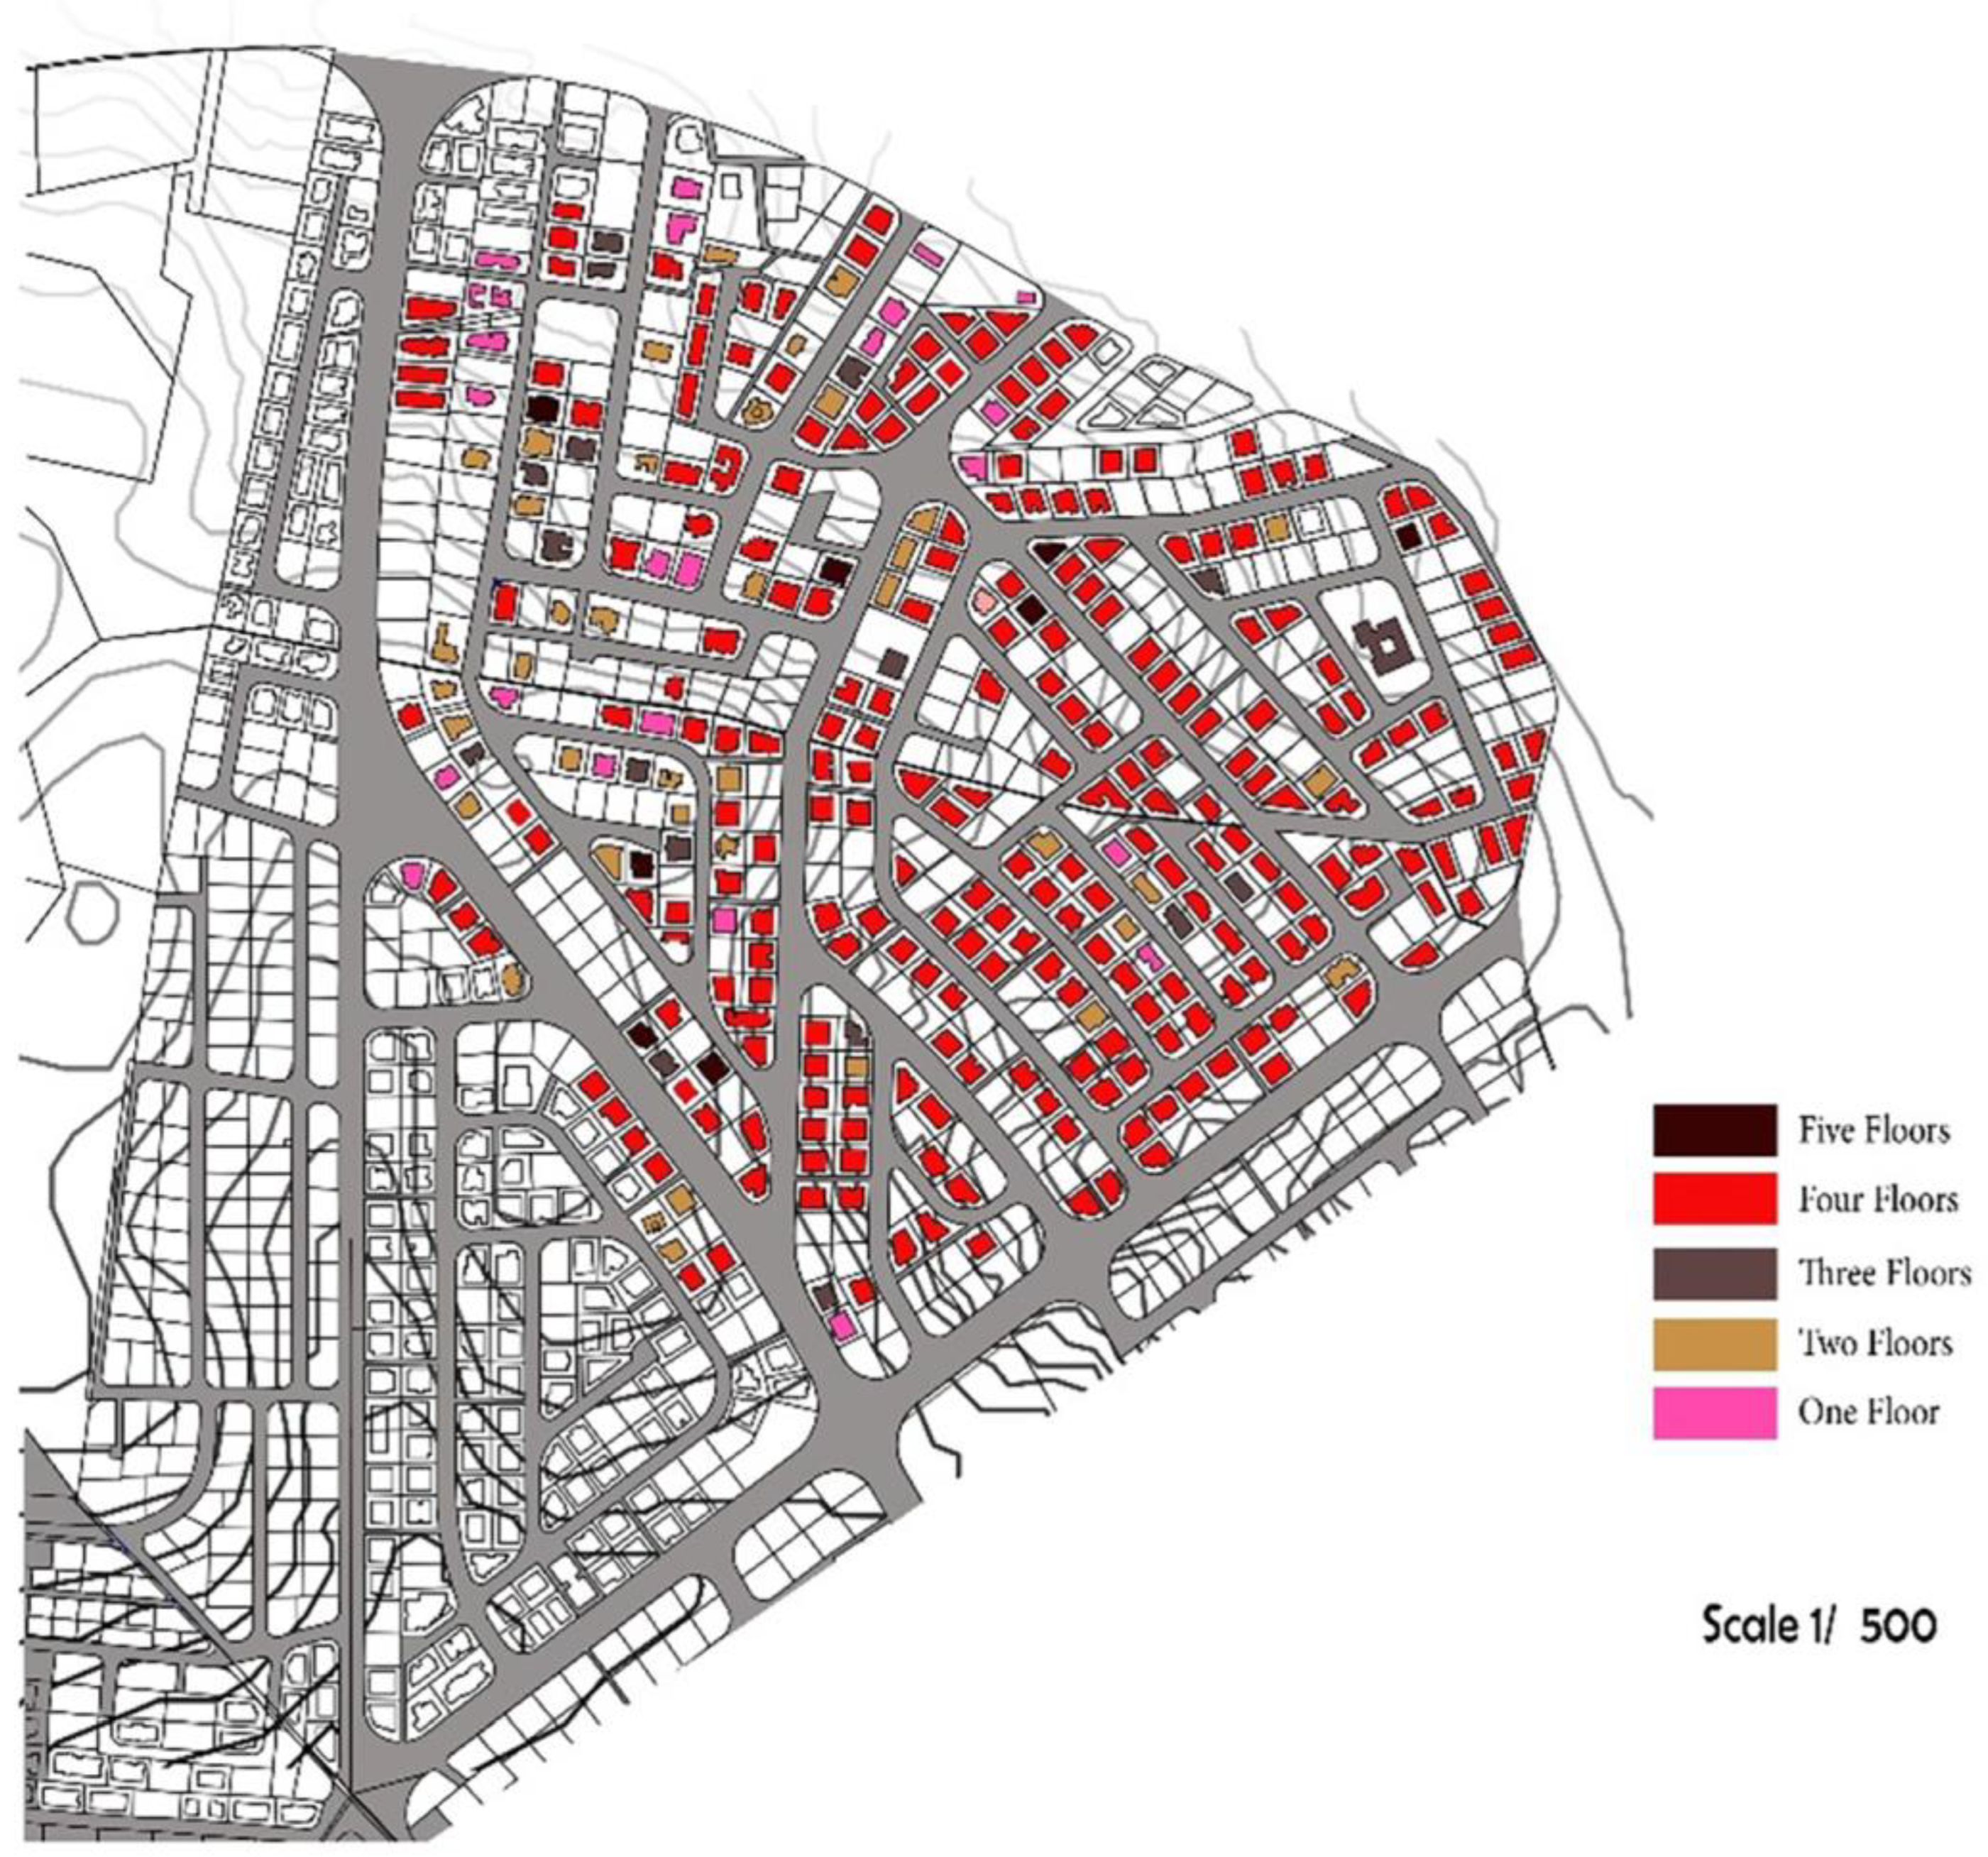
4.6. Digital Modeling
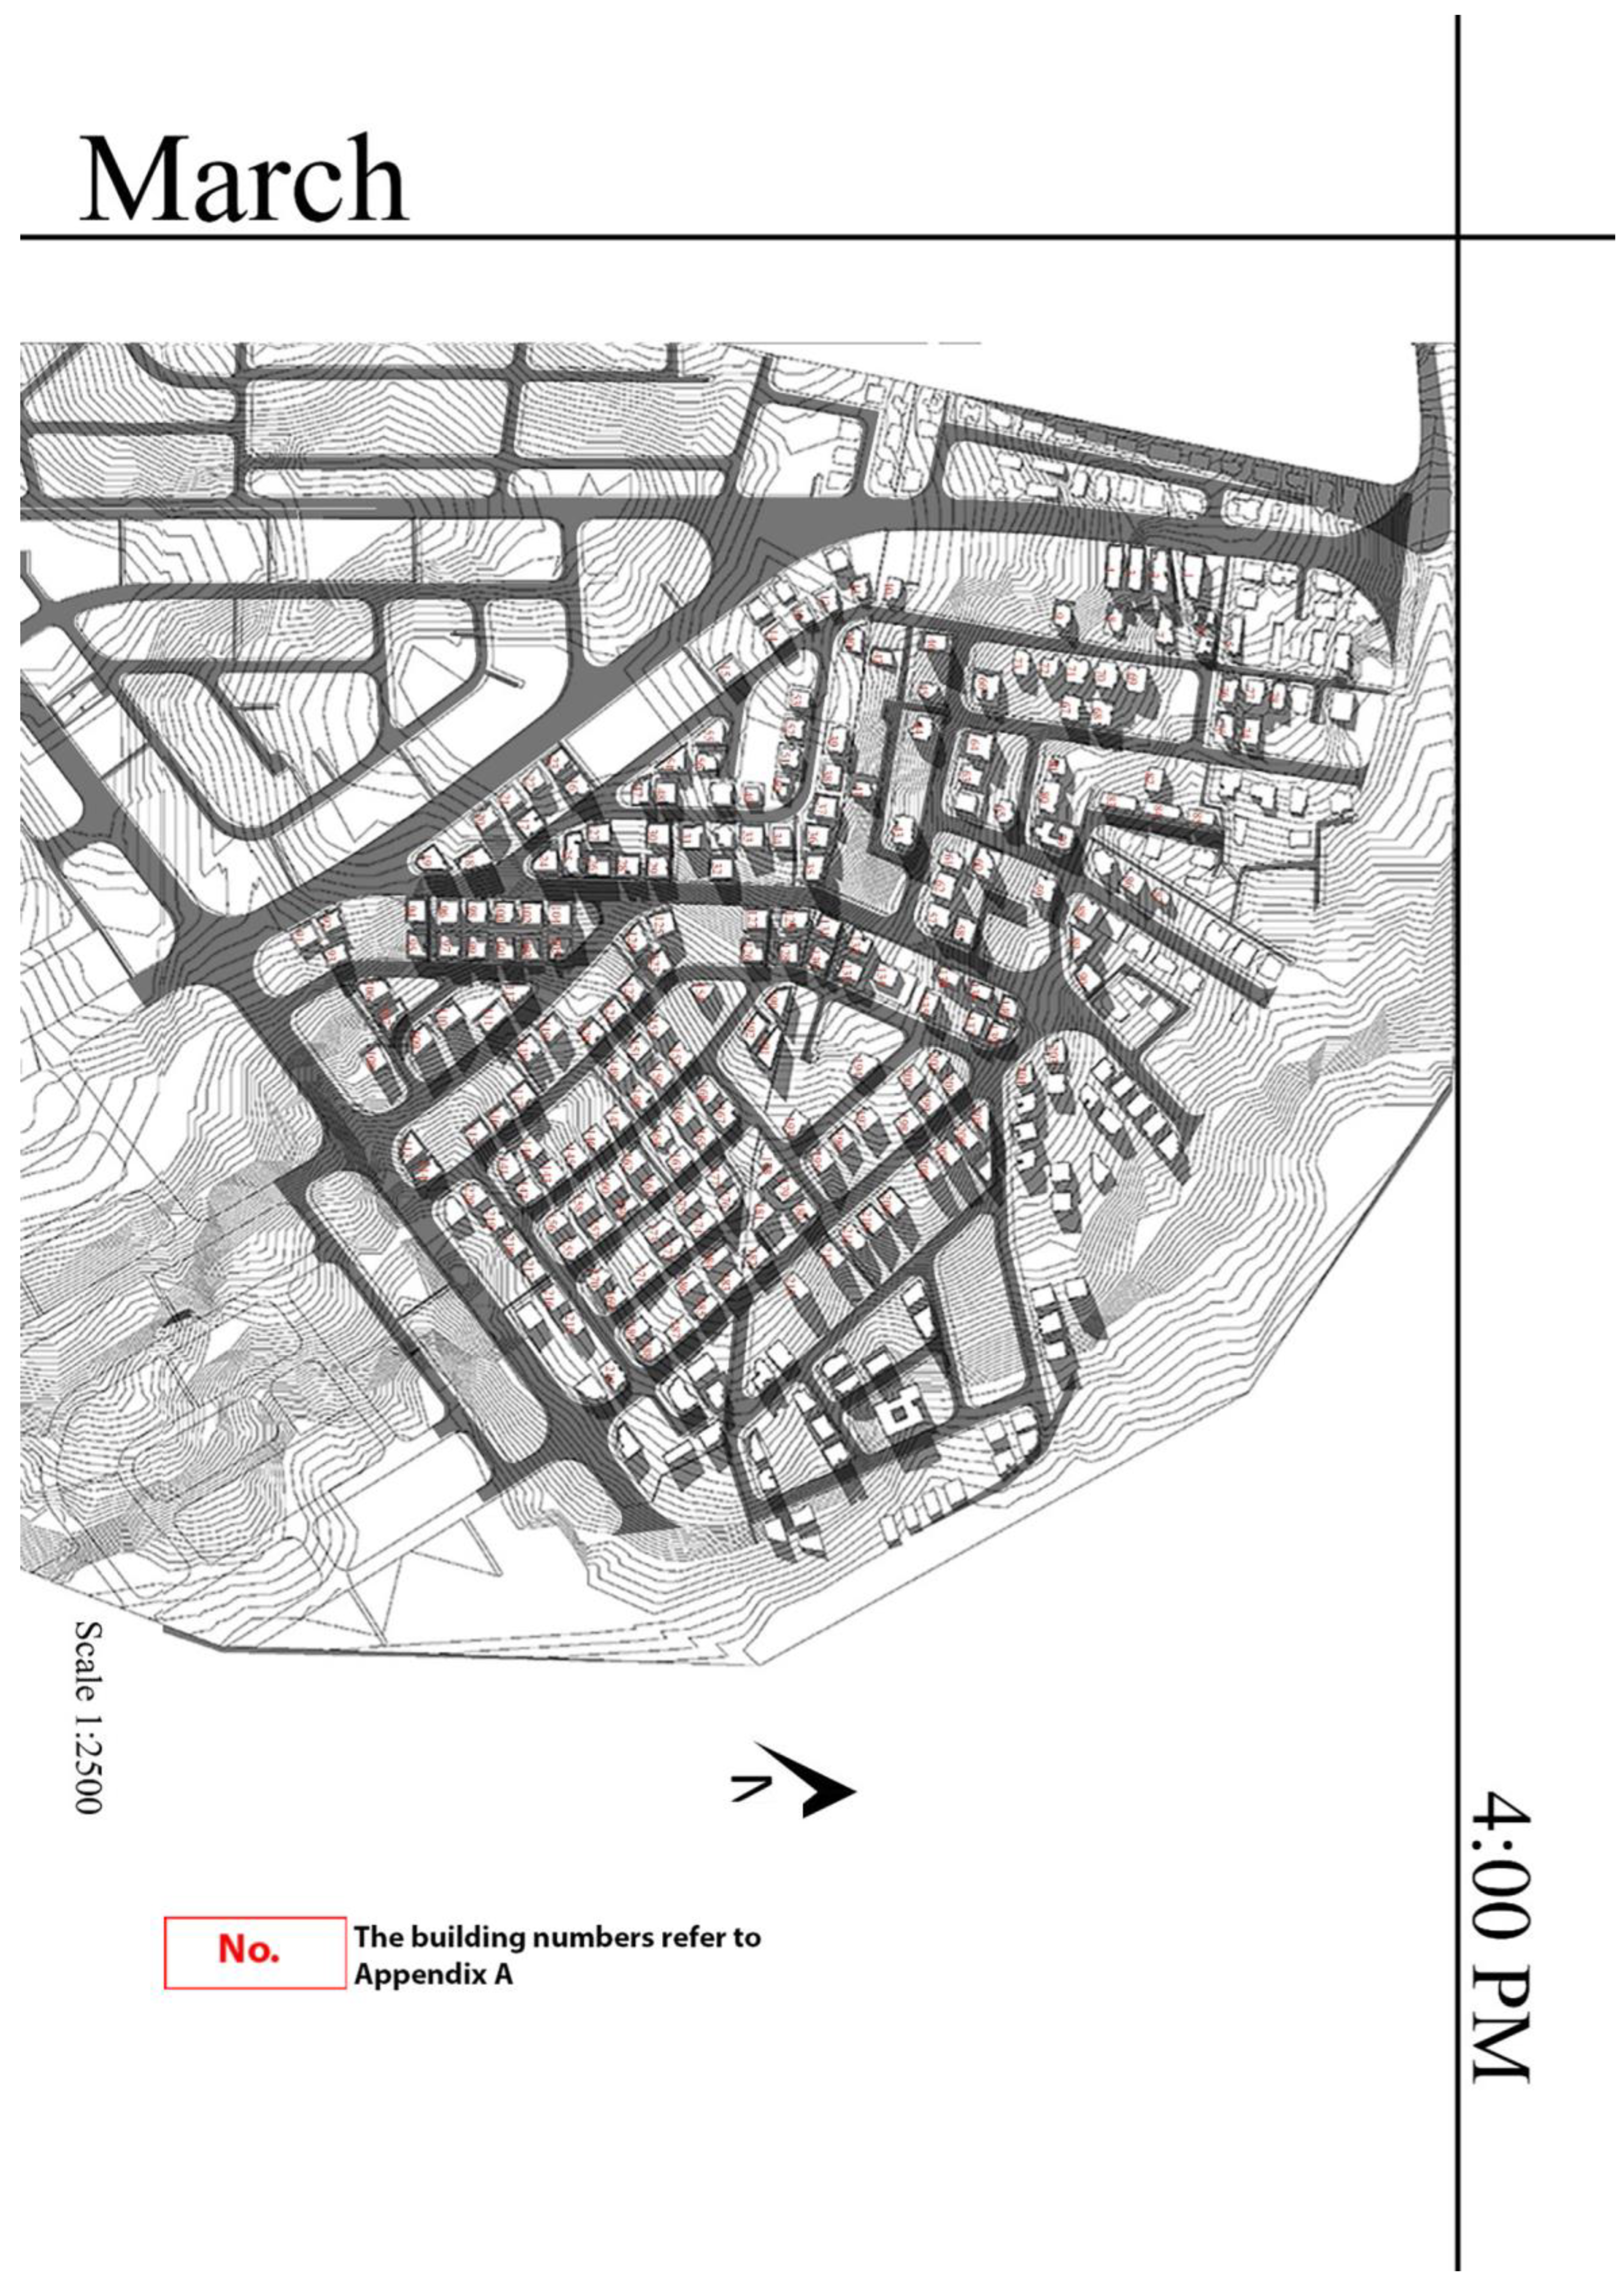
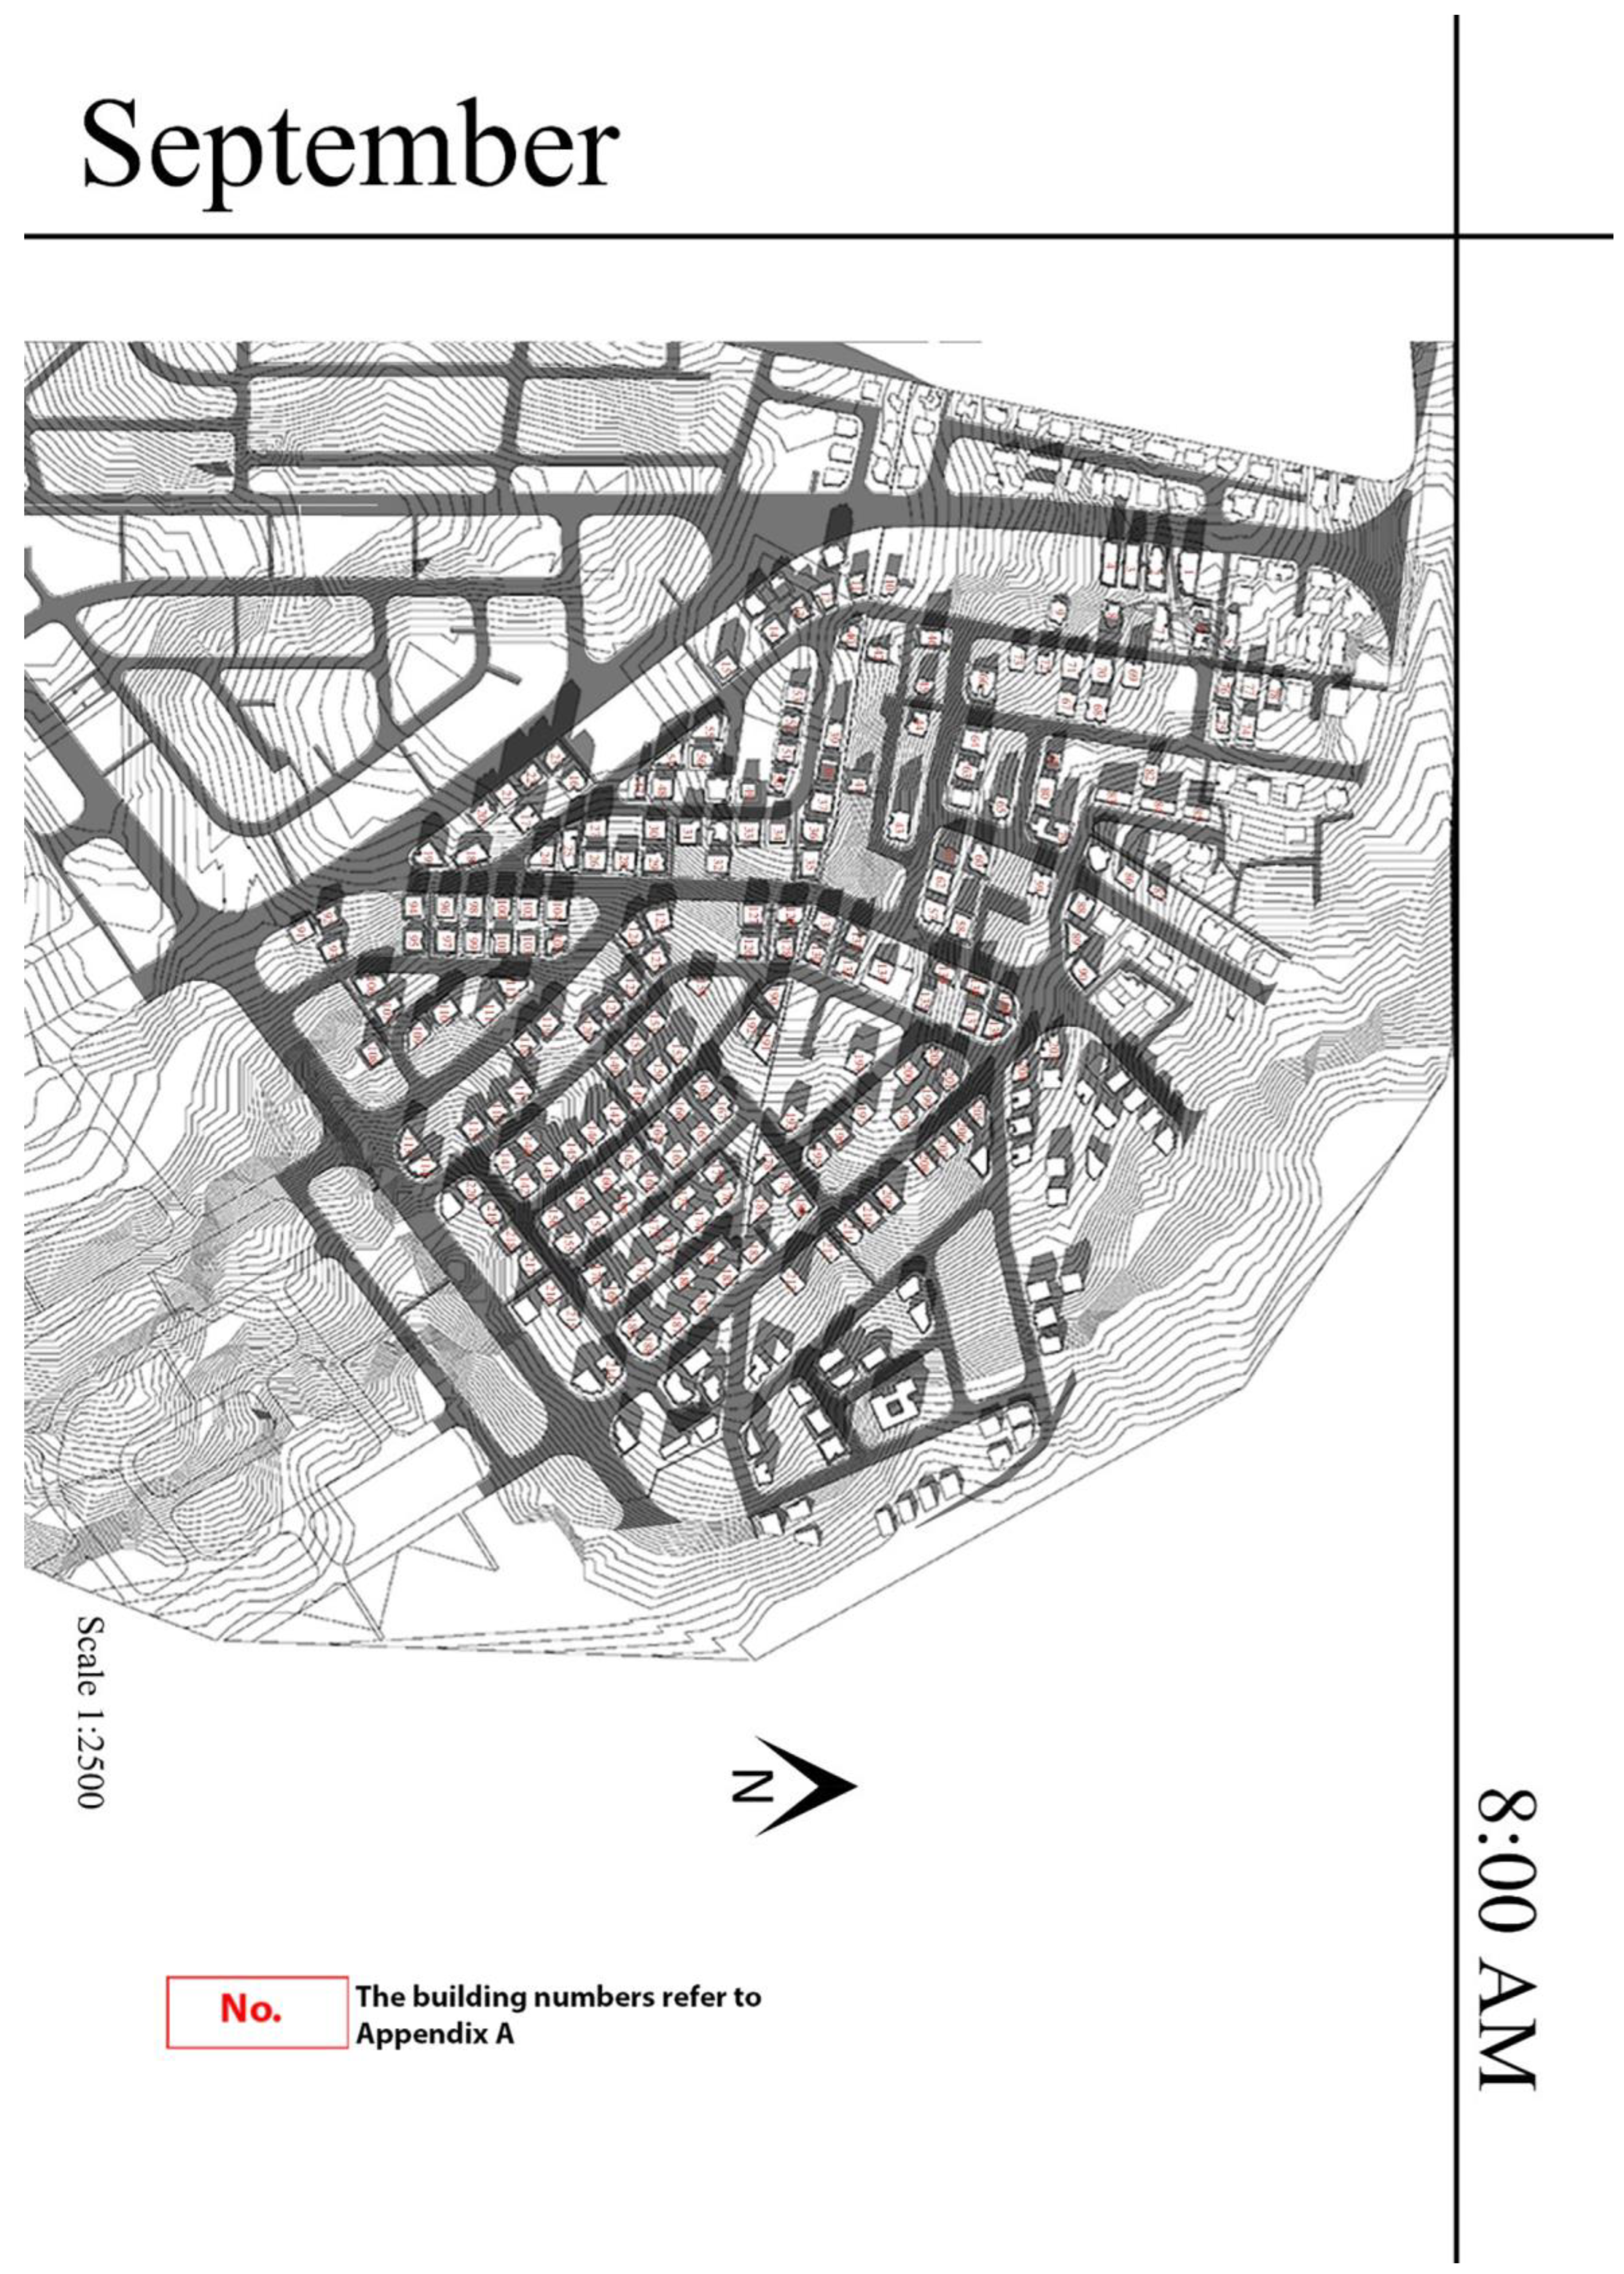
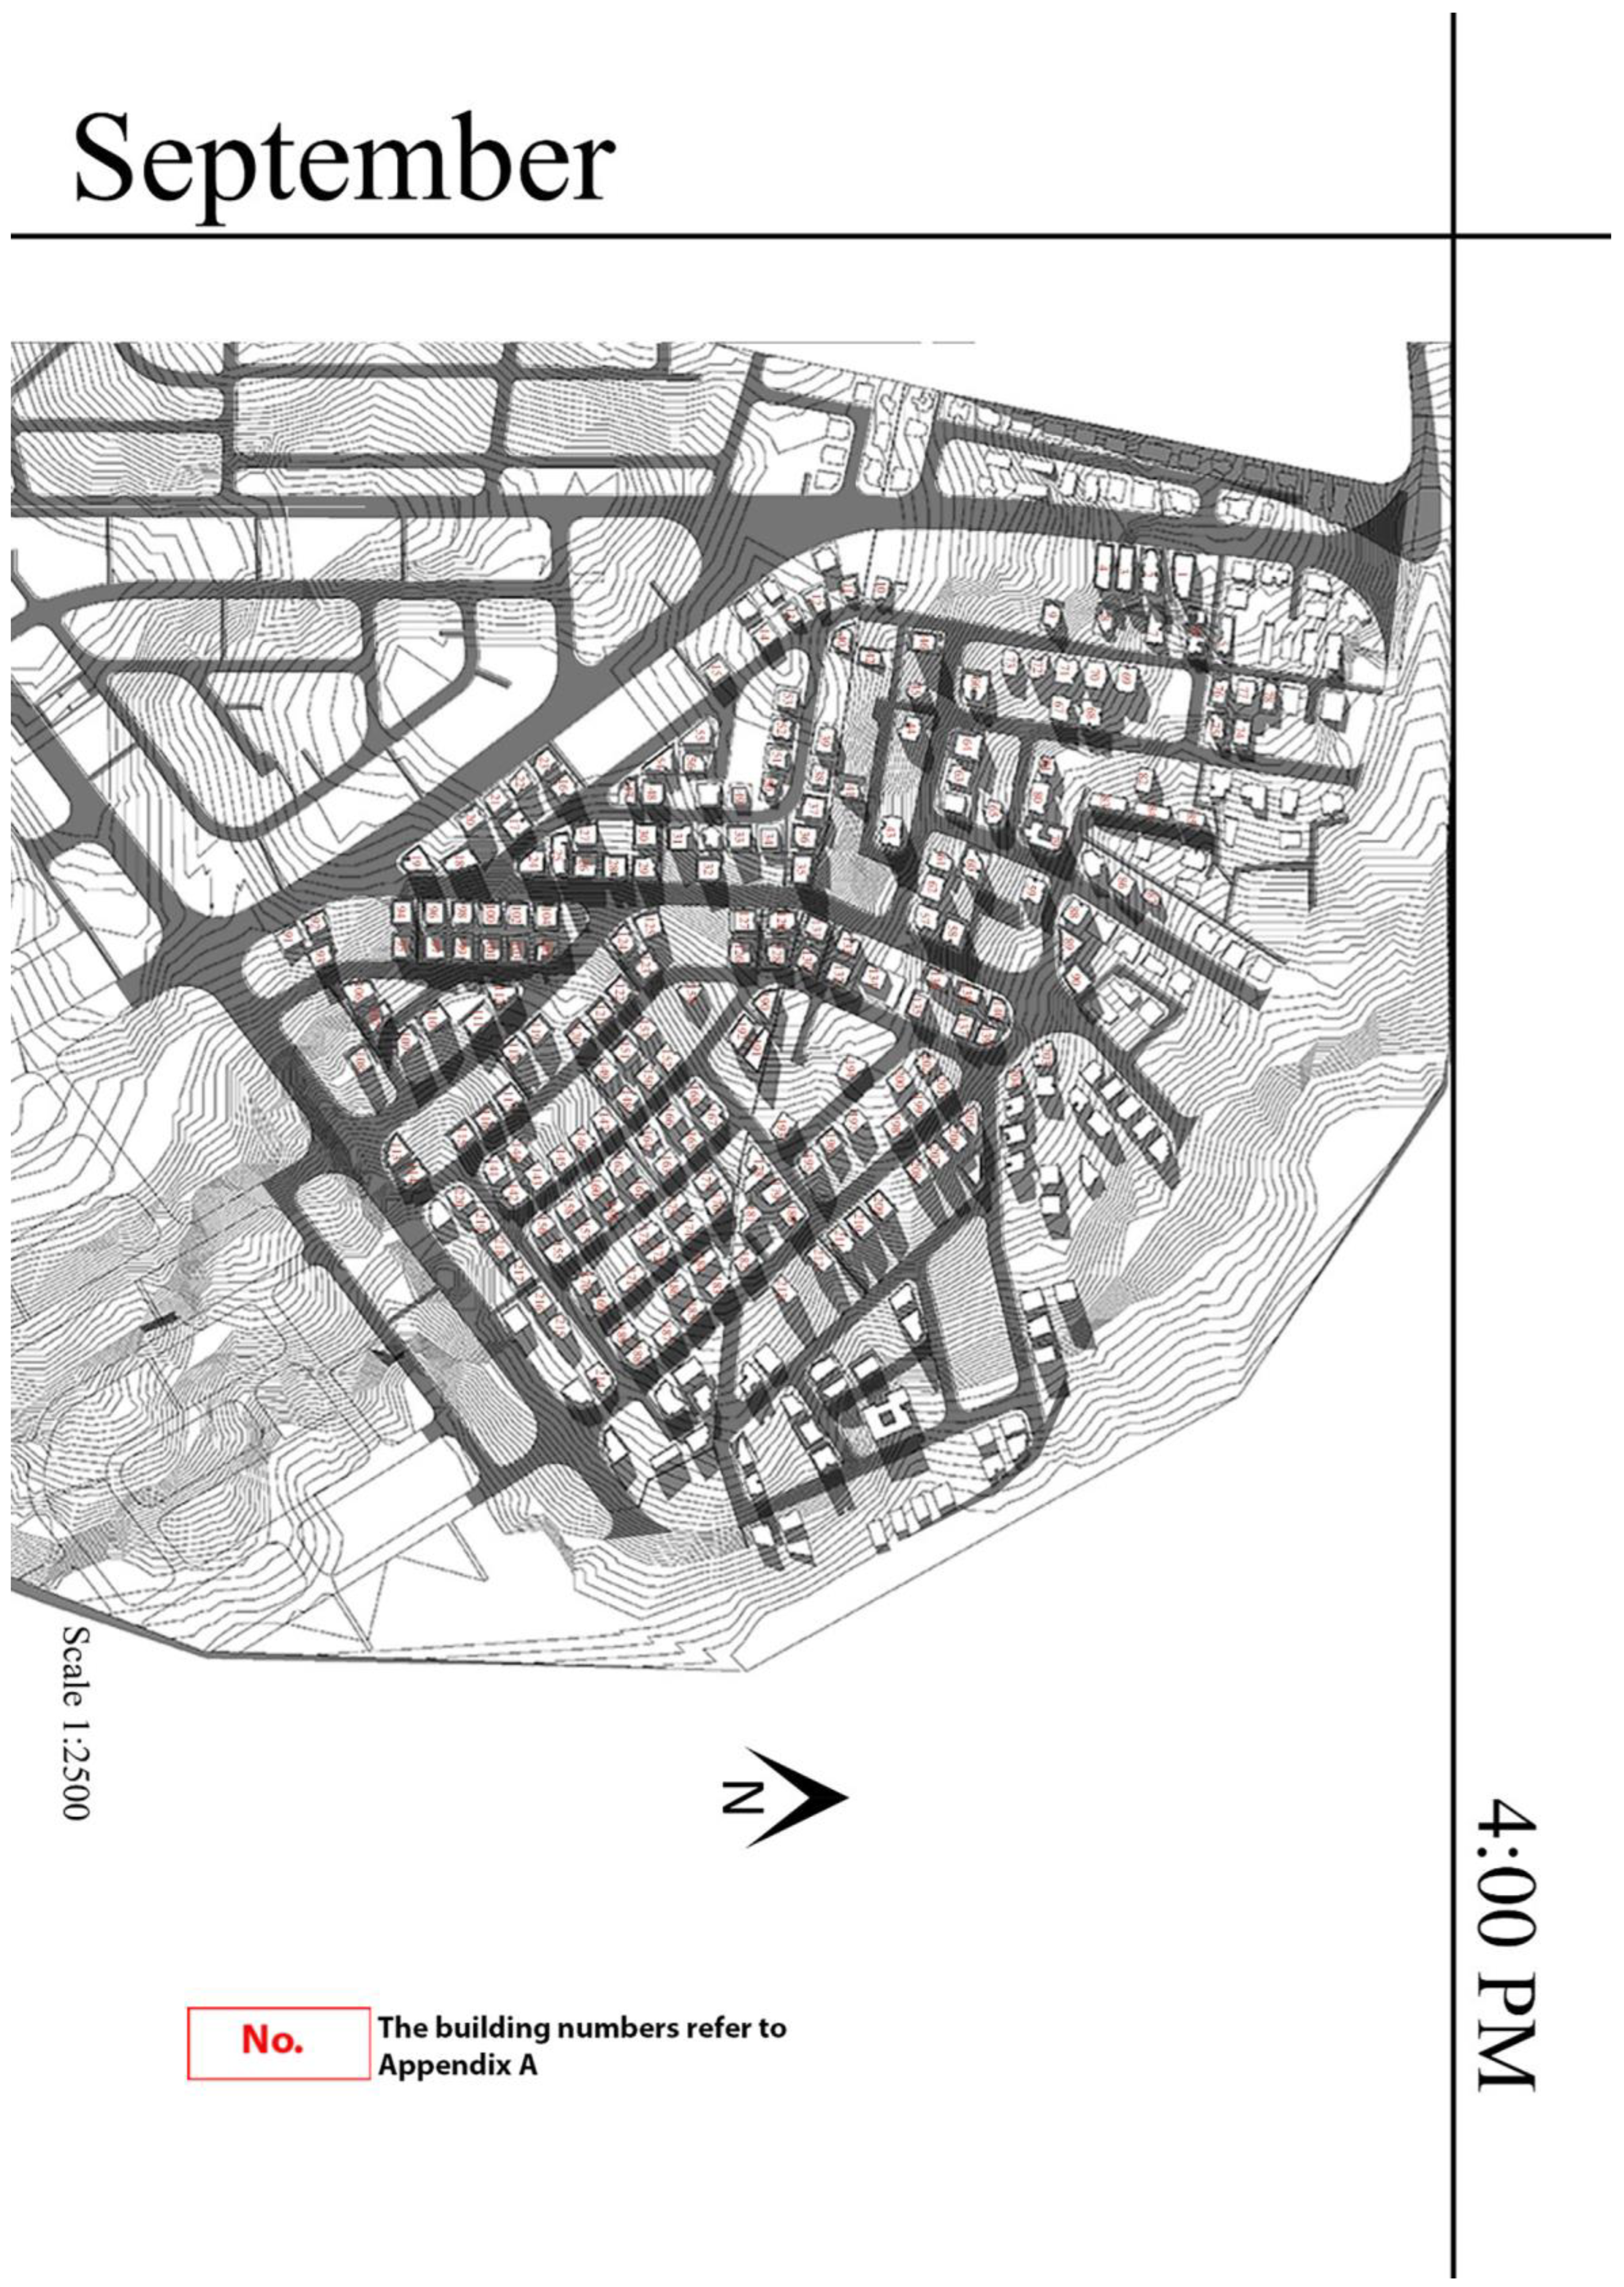
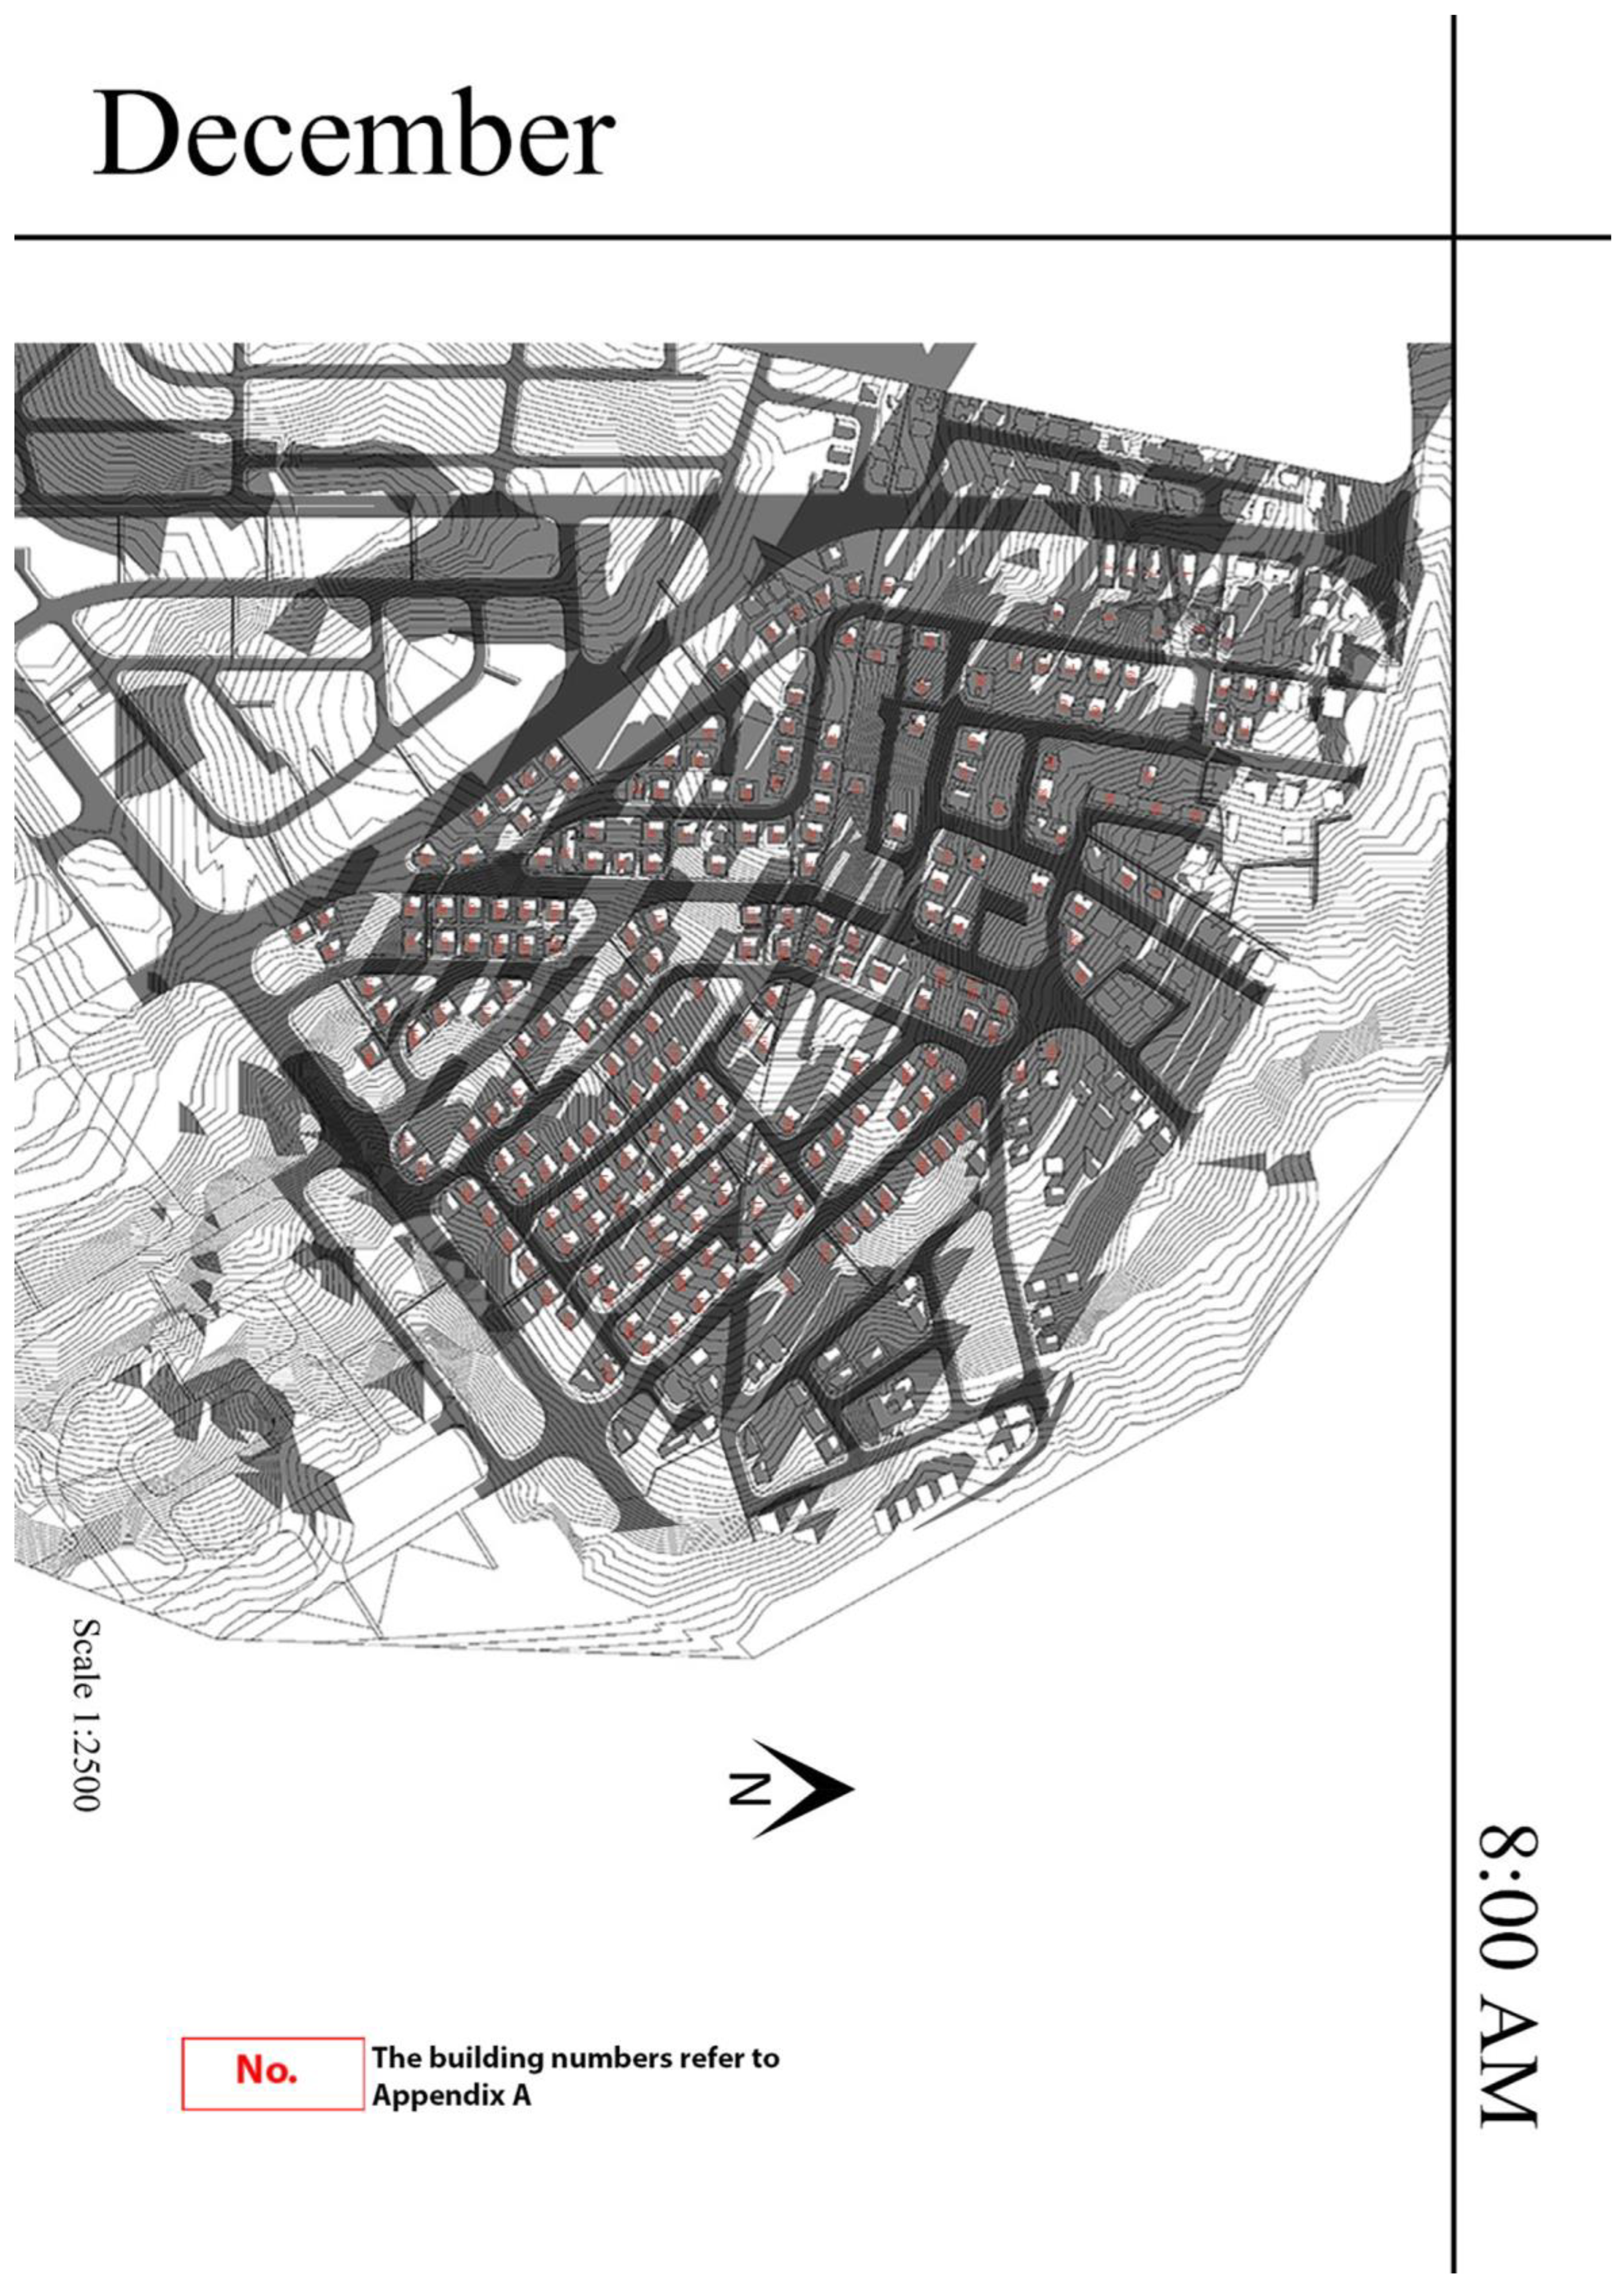
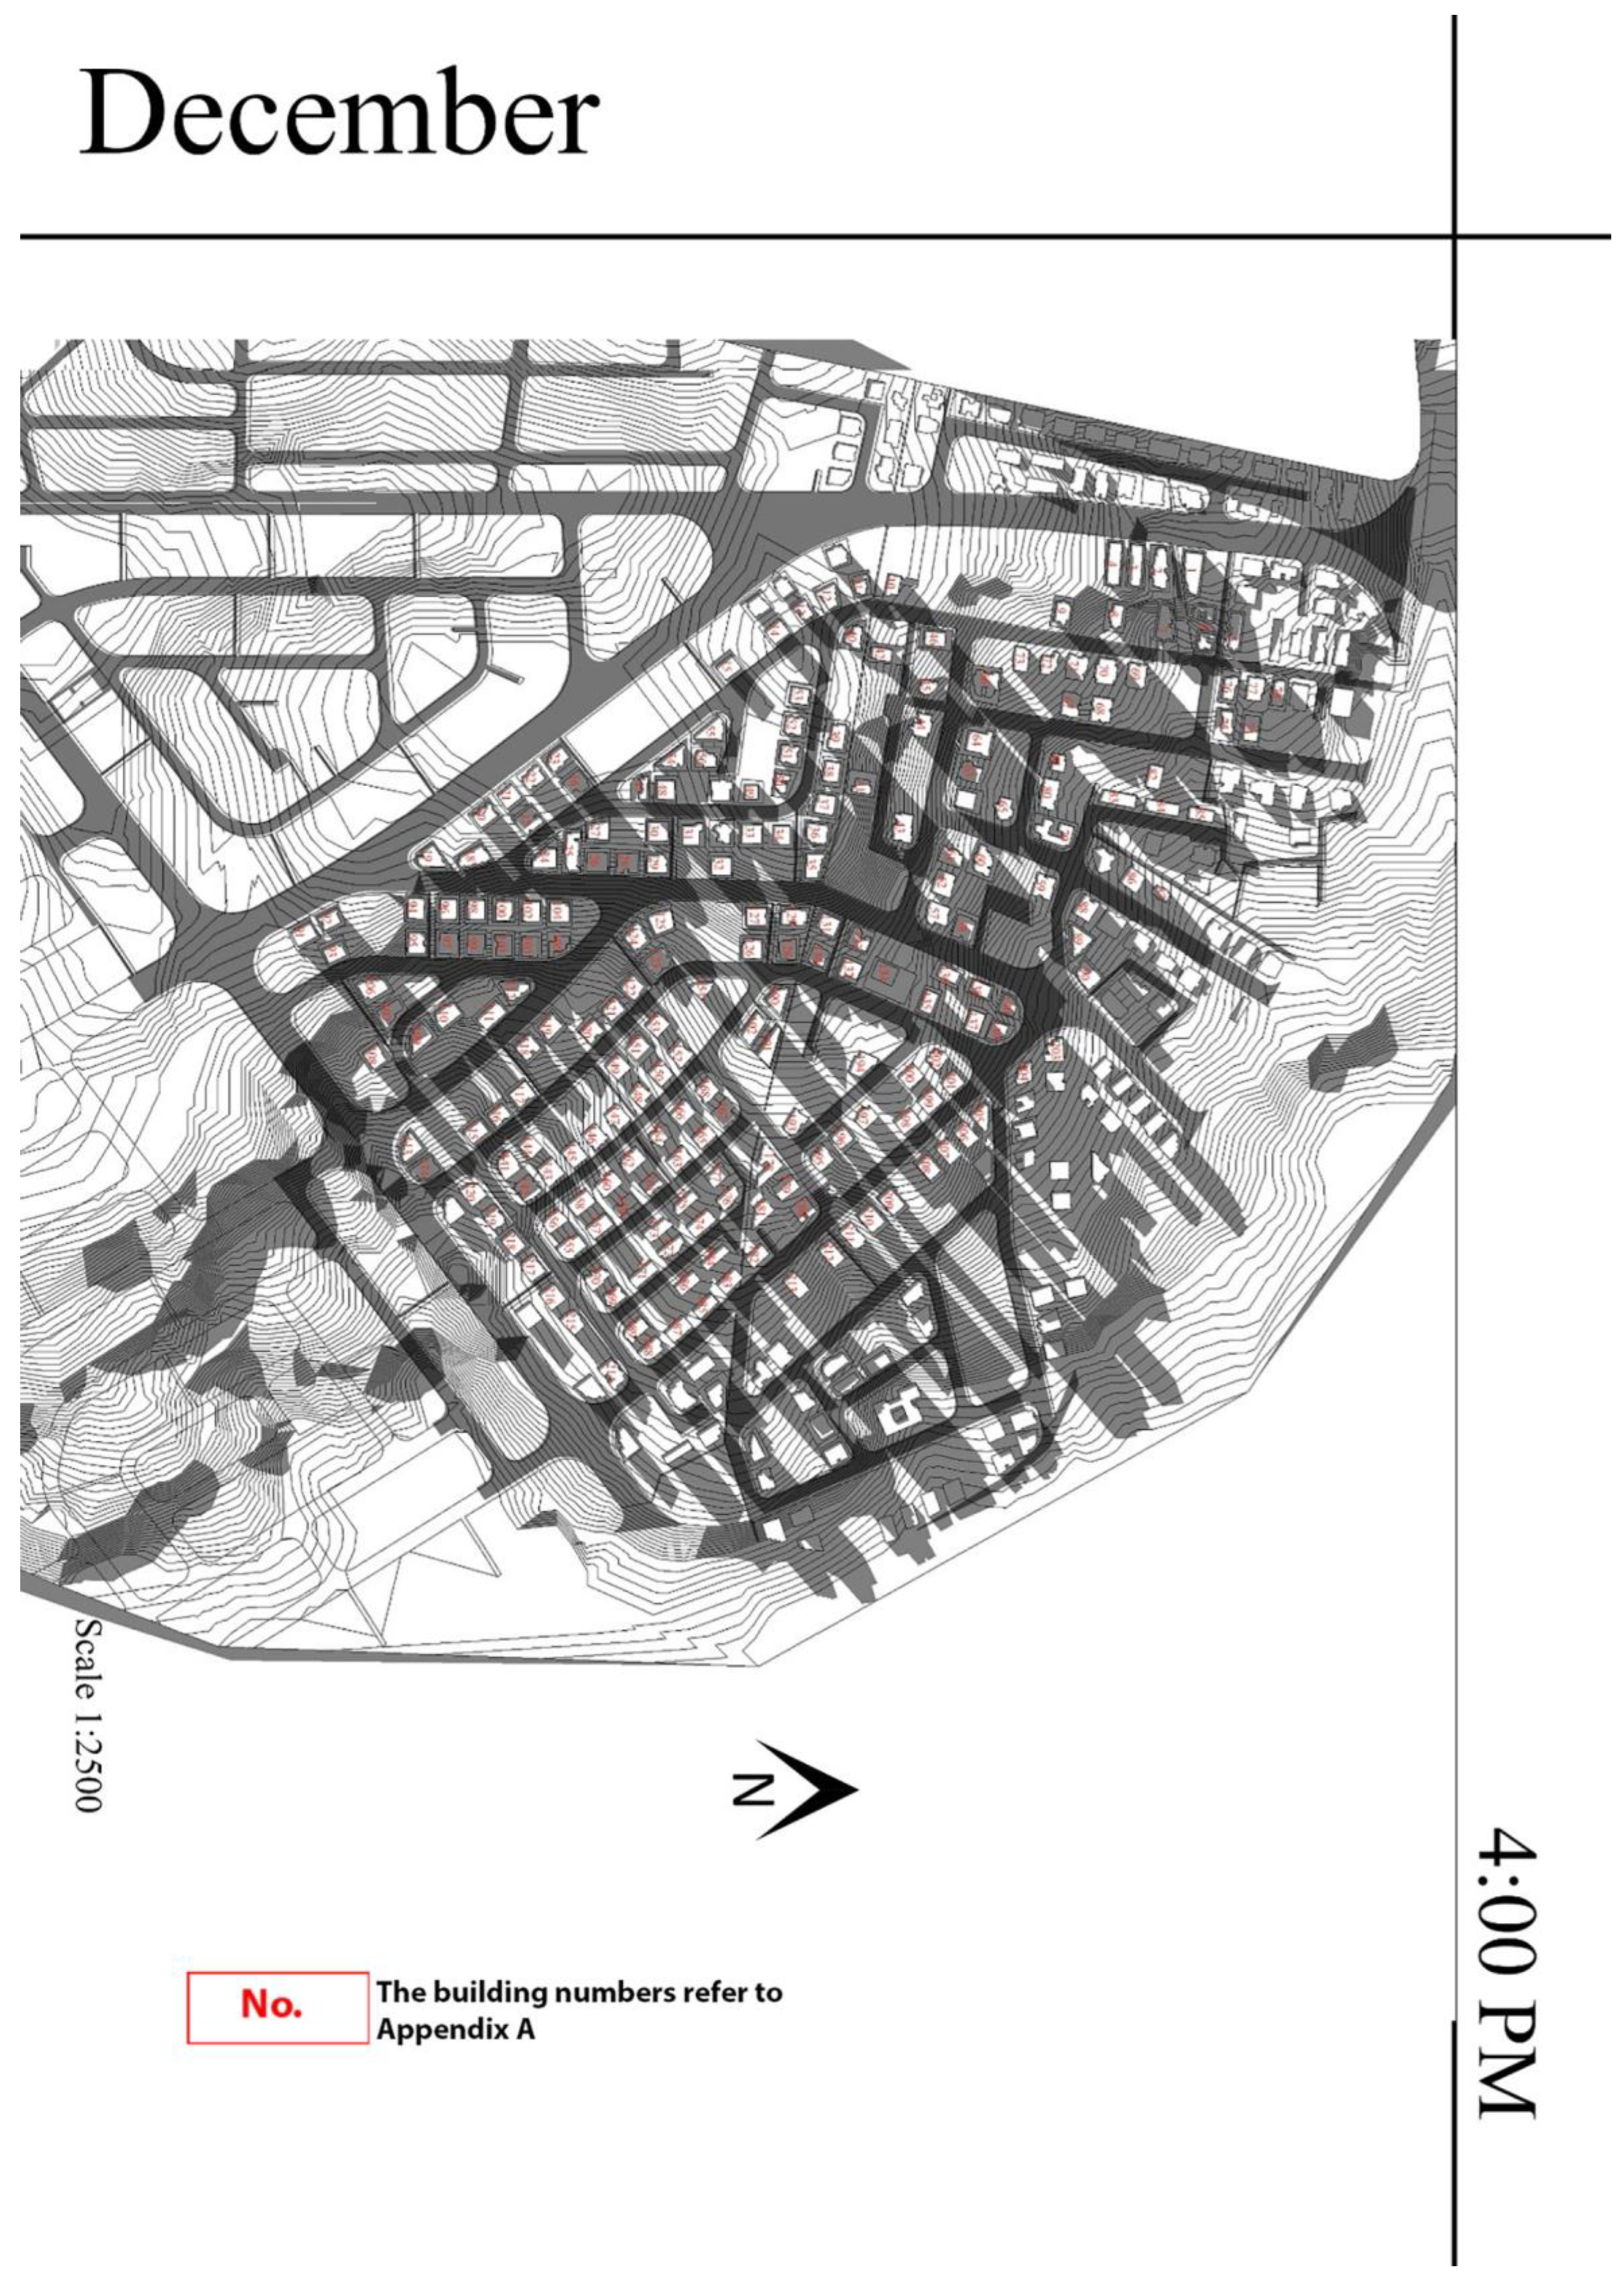
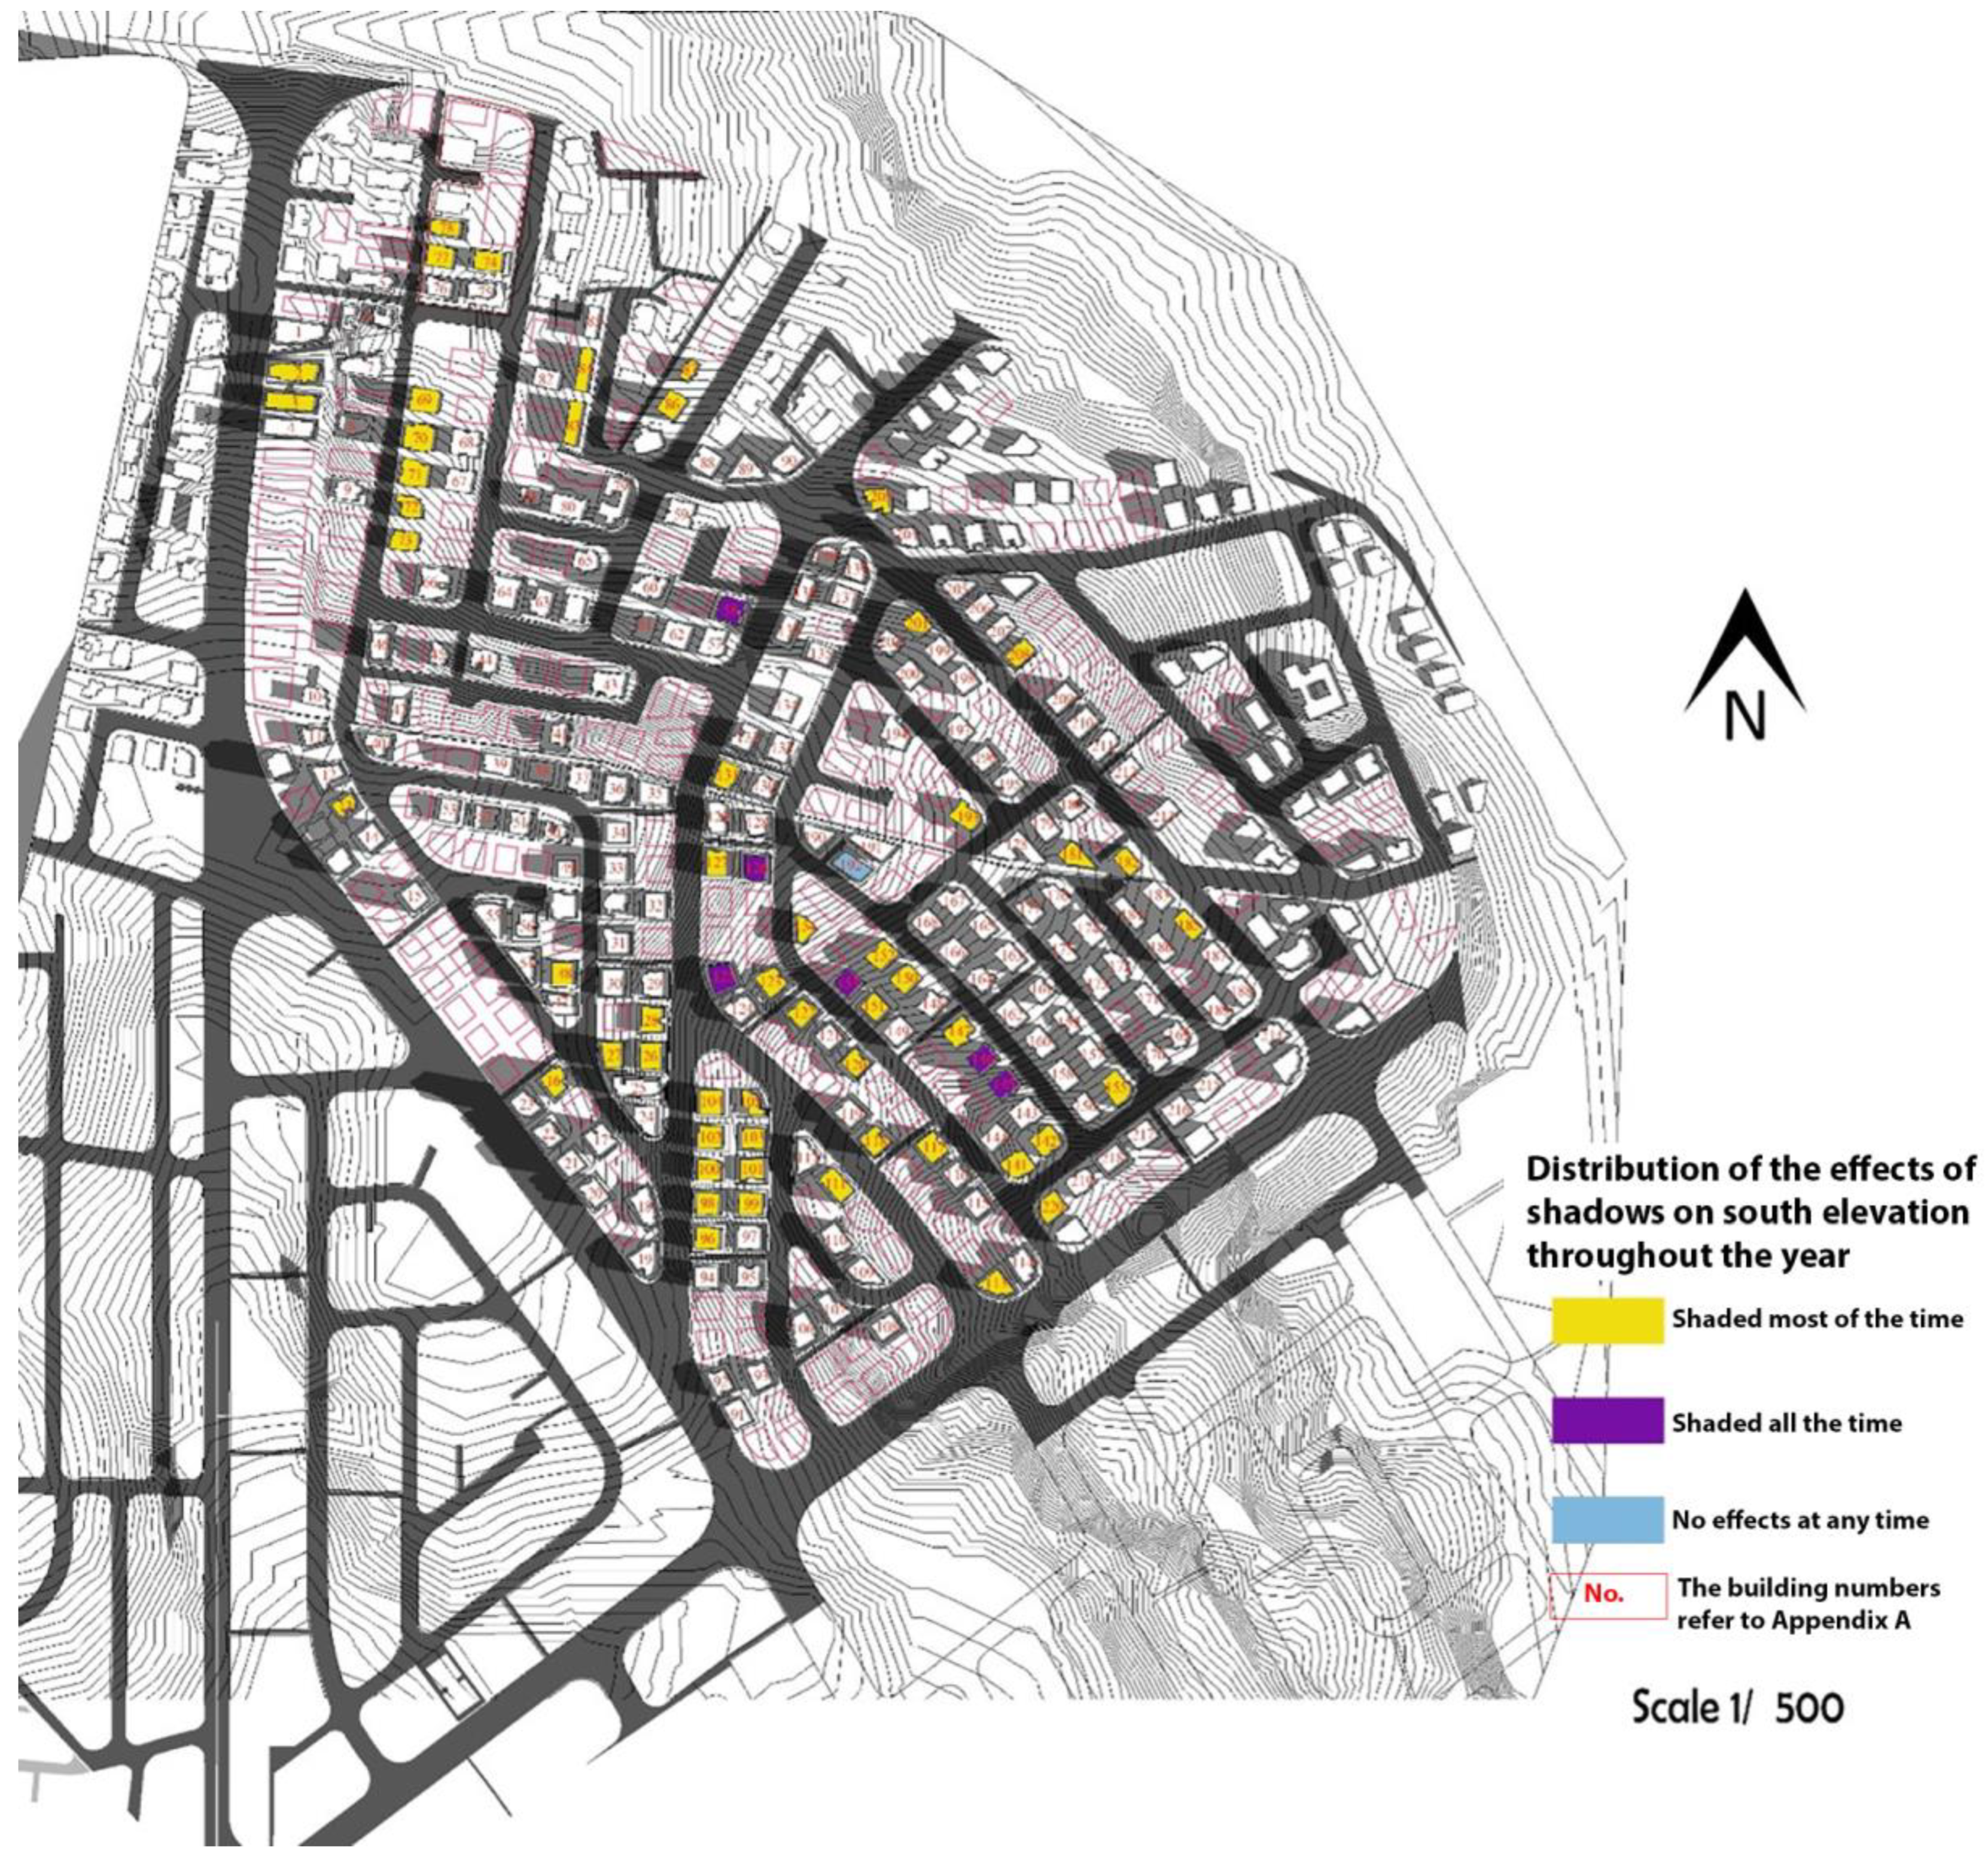
4.7. Shadow Analysis
5. Conclusions
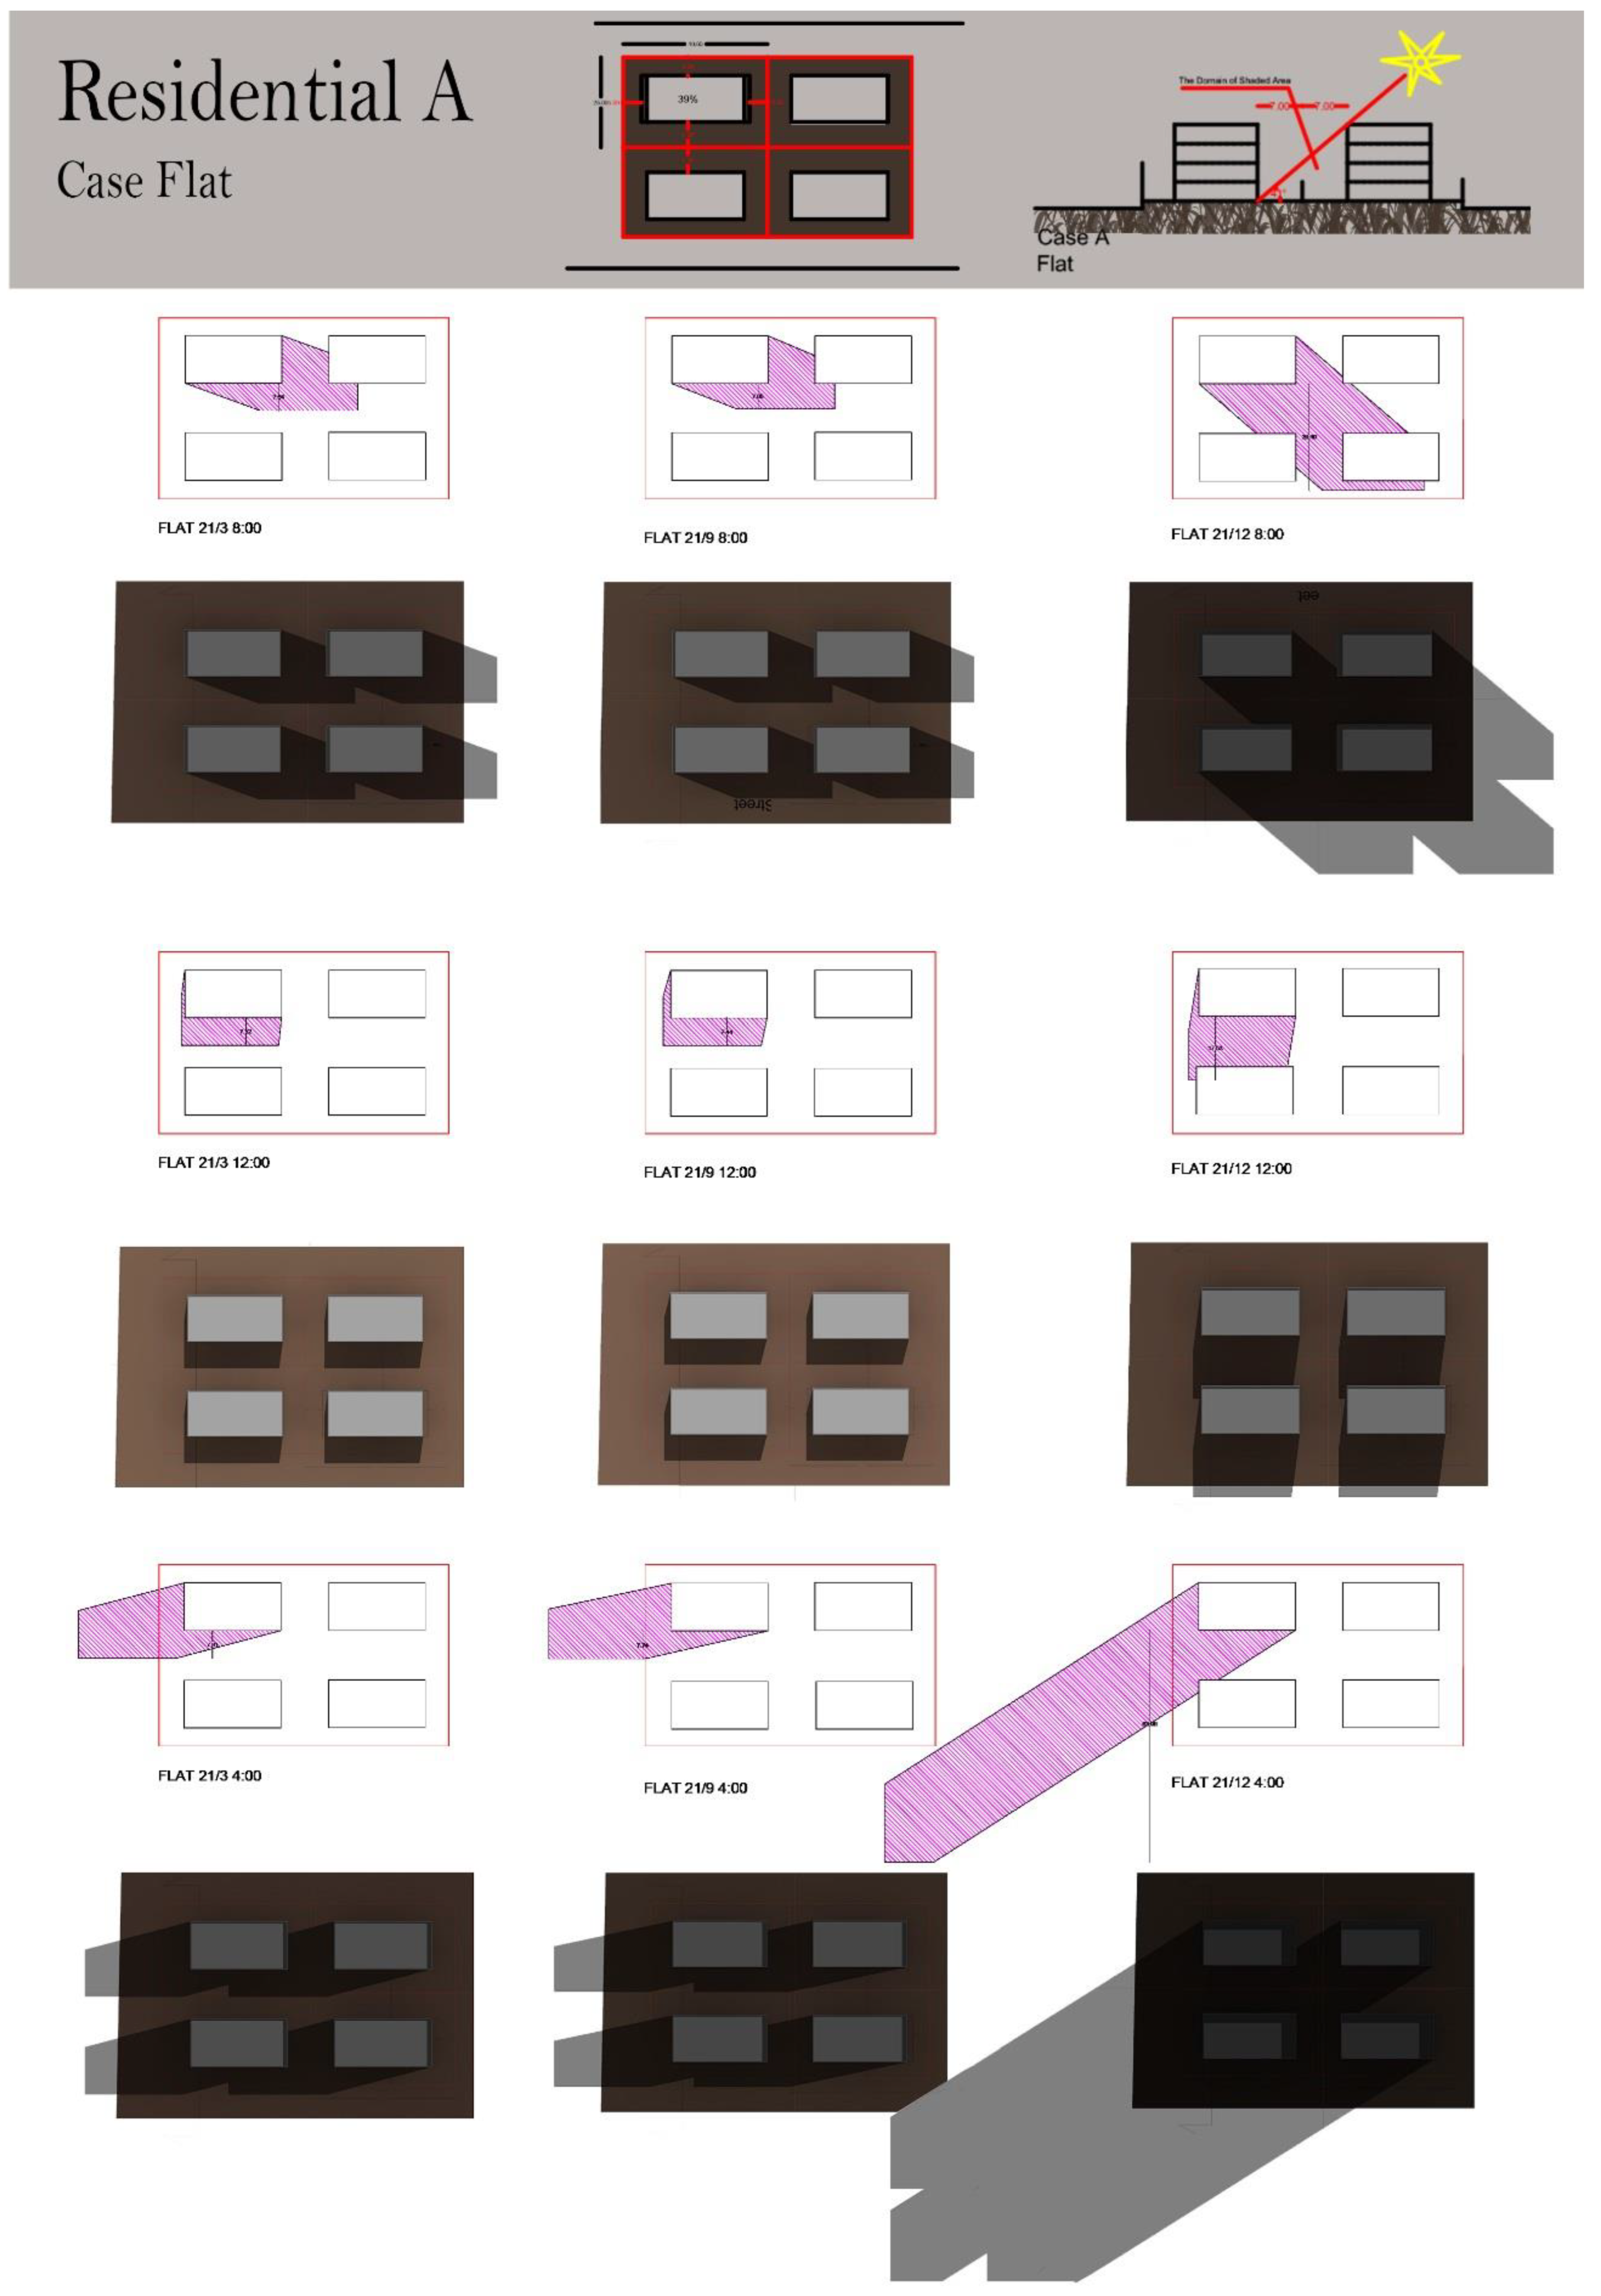
- Residential Zone A: When buildings are arranged back to back facing south, the distance between them generally allows daylight to enter, except during winter when shadows cover the lower building. However, when buildings are arranged side by side facing south, daylight access is often obstructed throughout the year, as the distance between blocks is only 10 m—less than in the back-to-back arrangement.
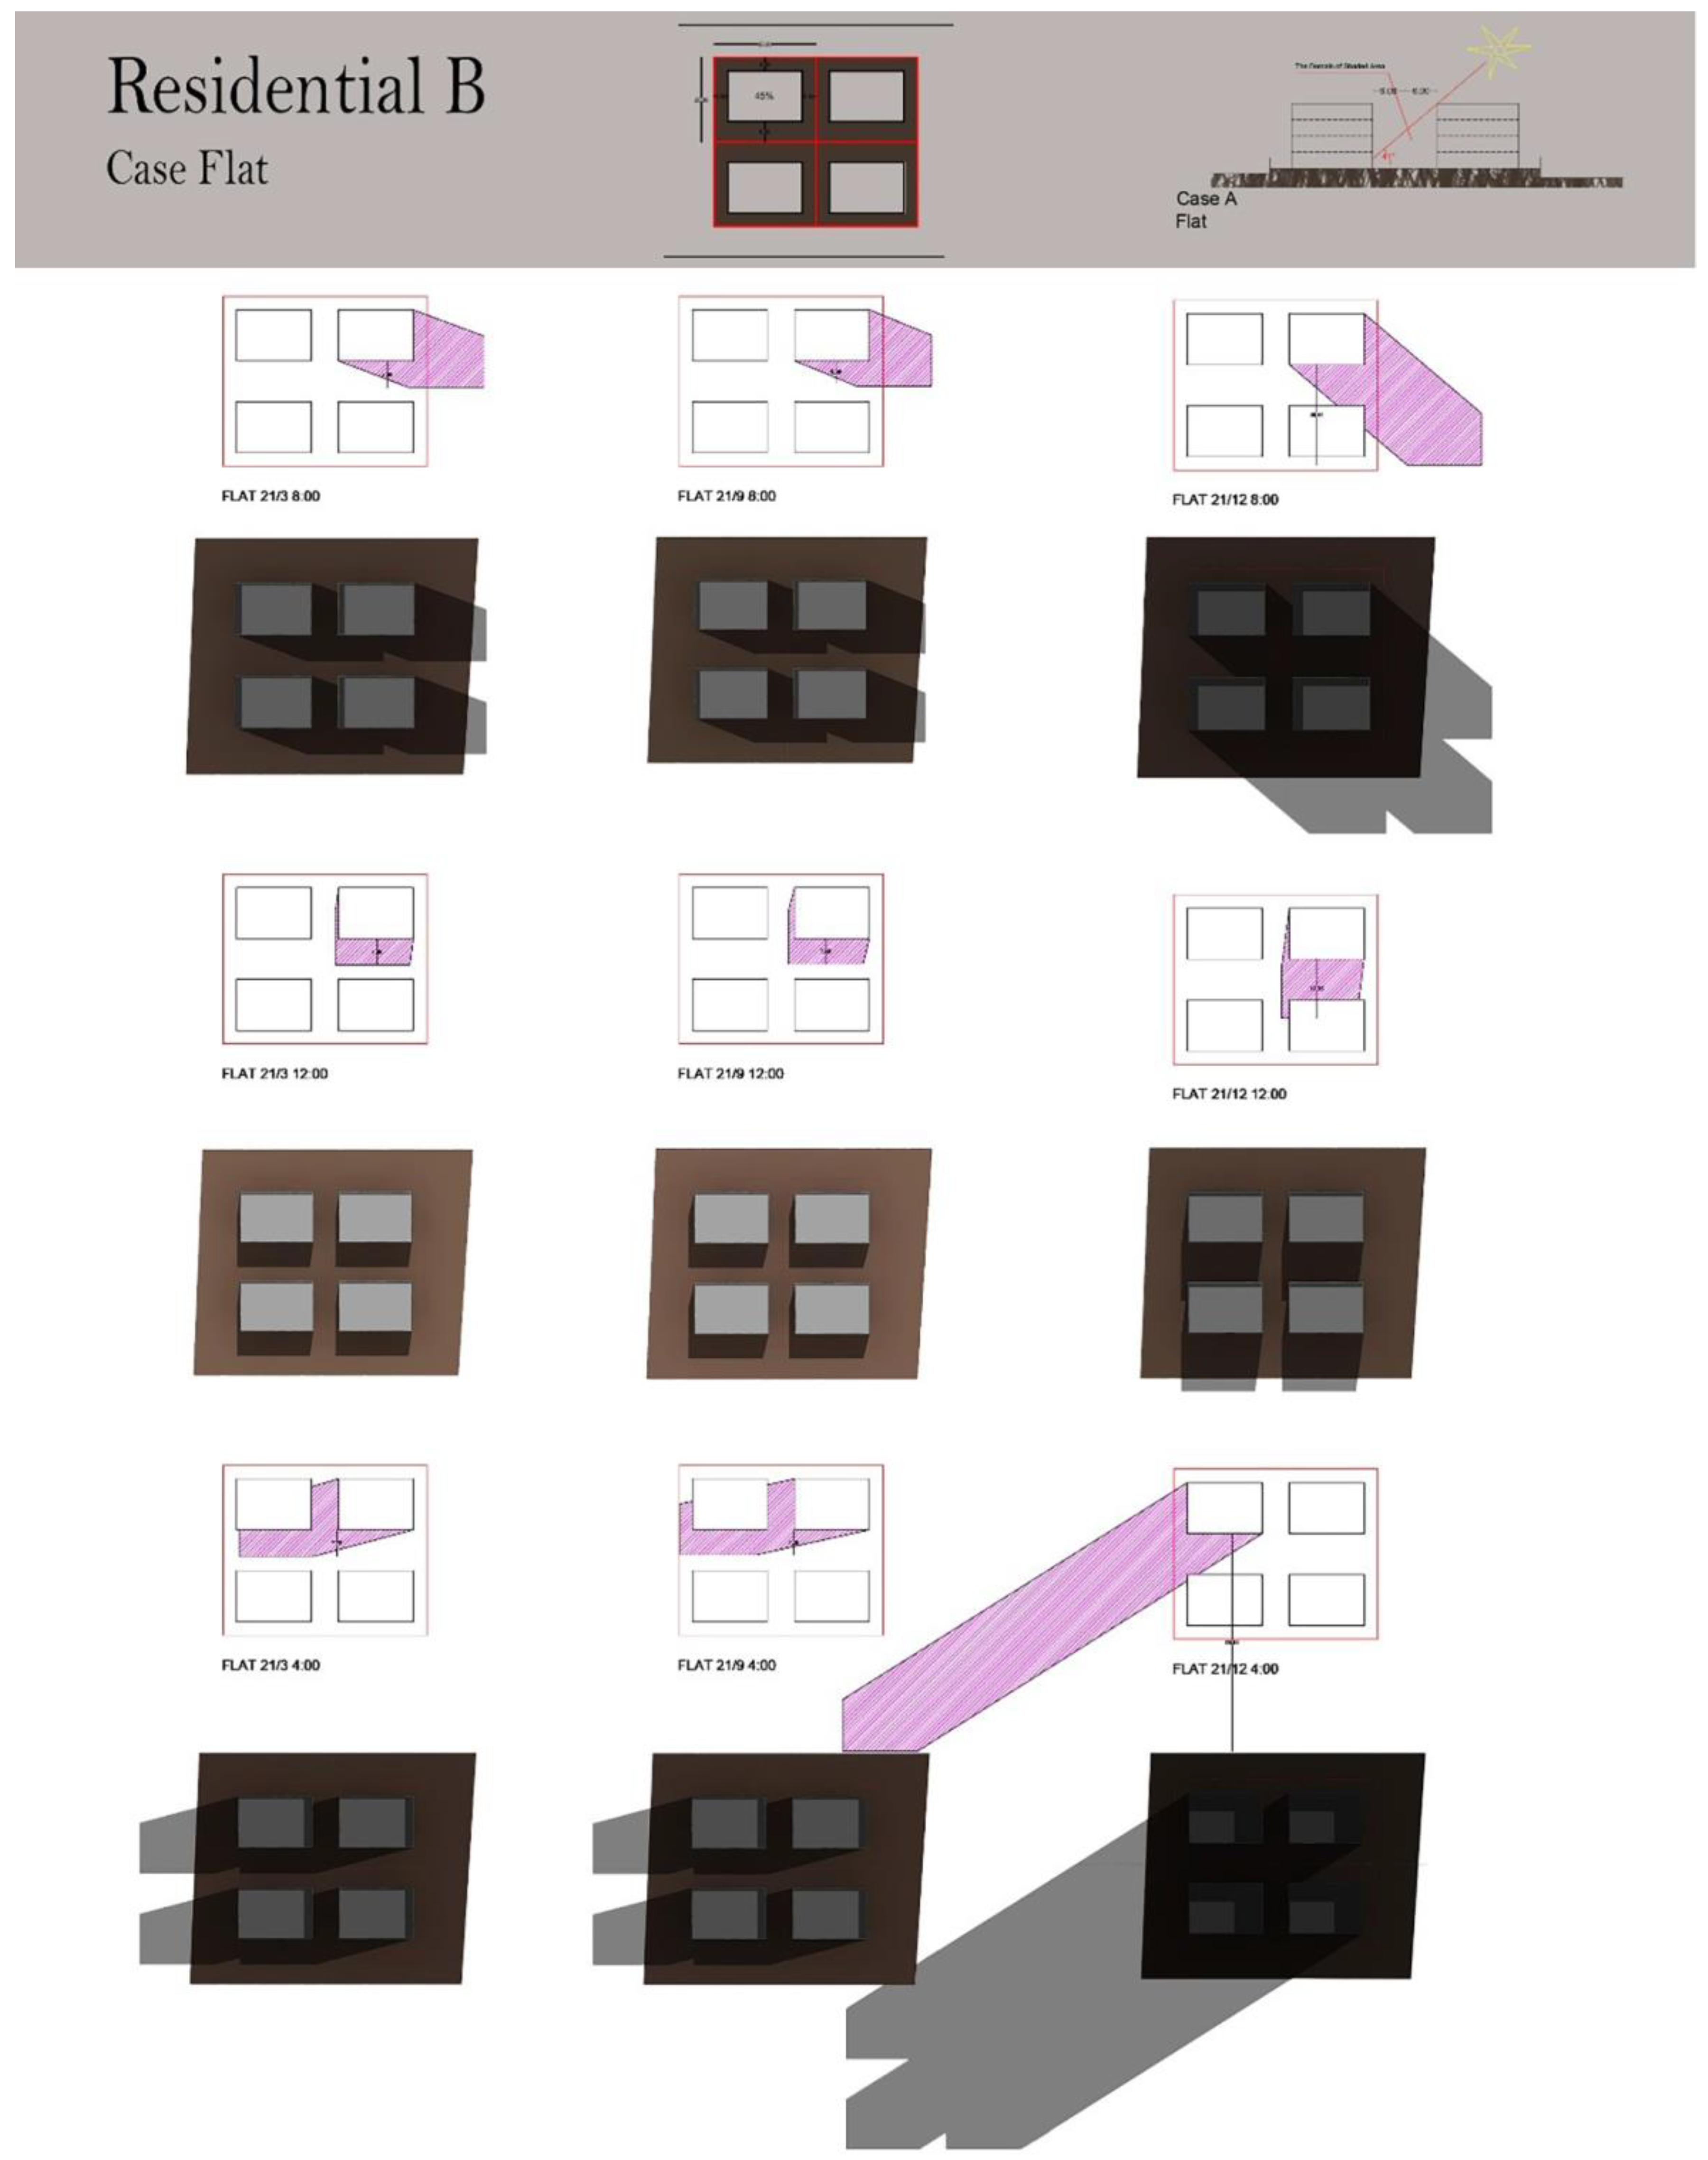
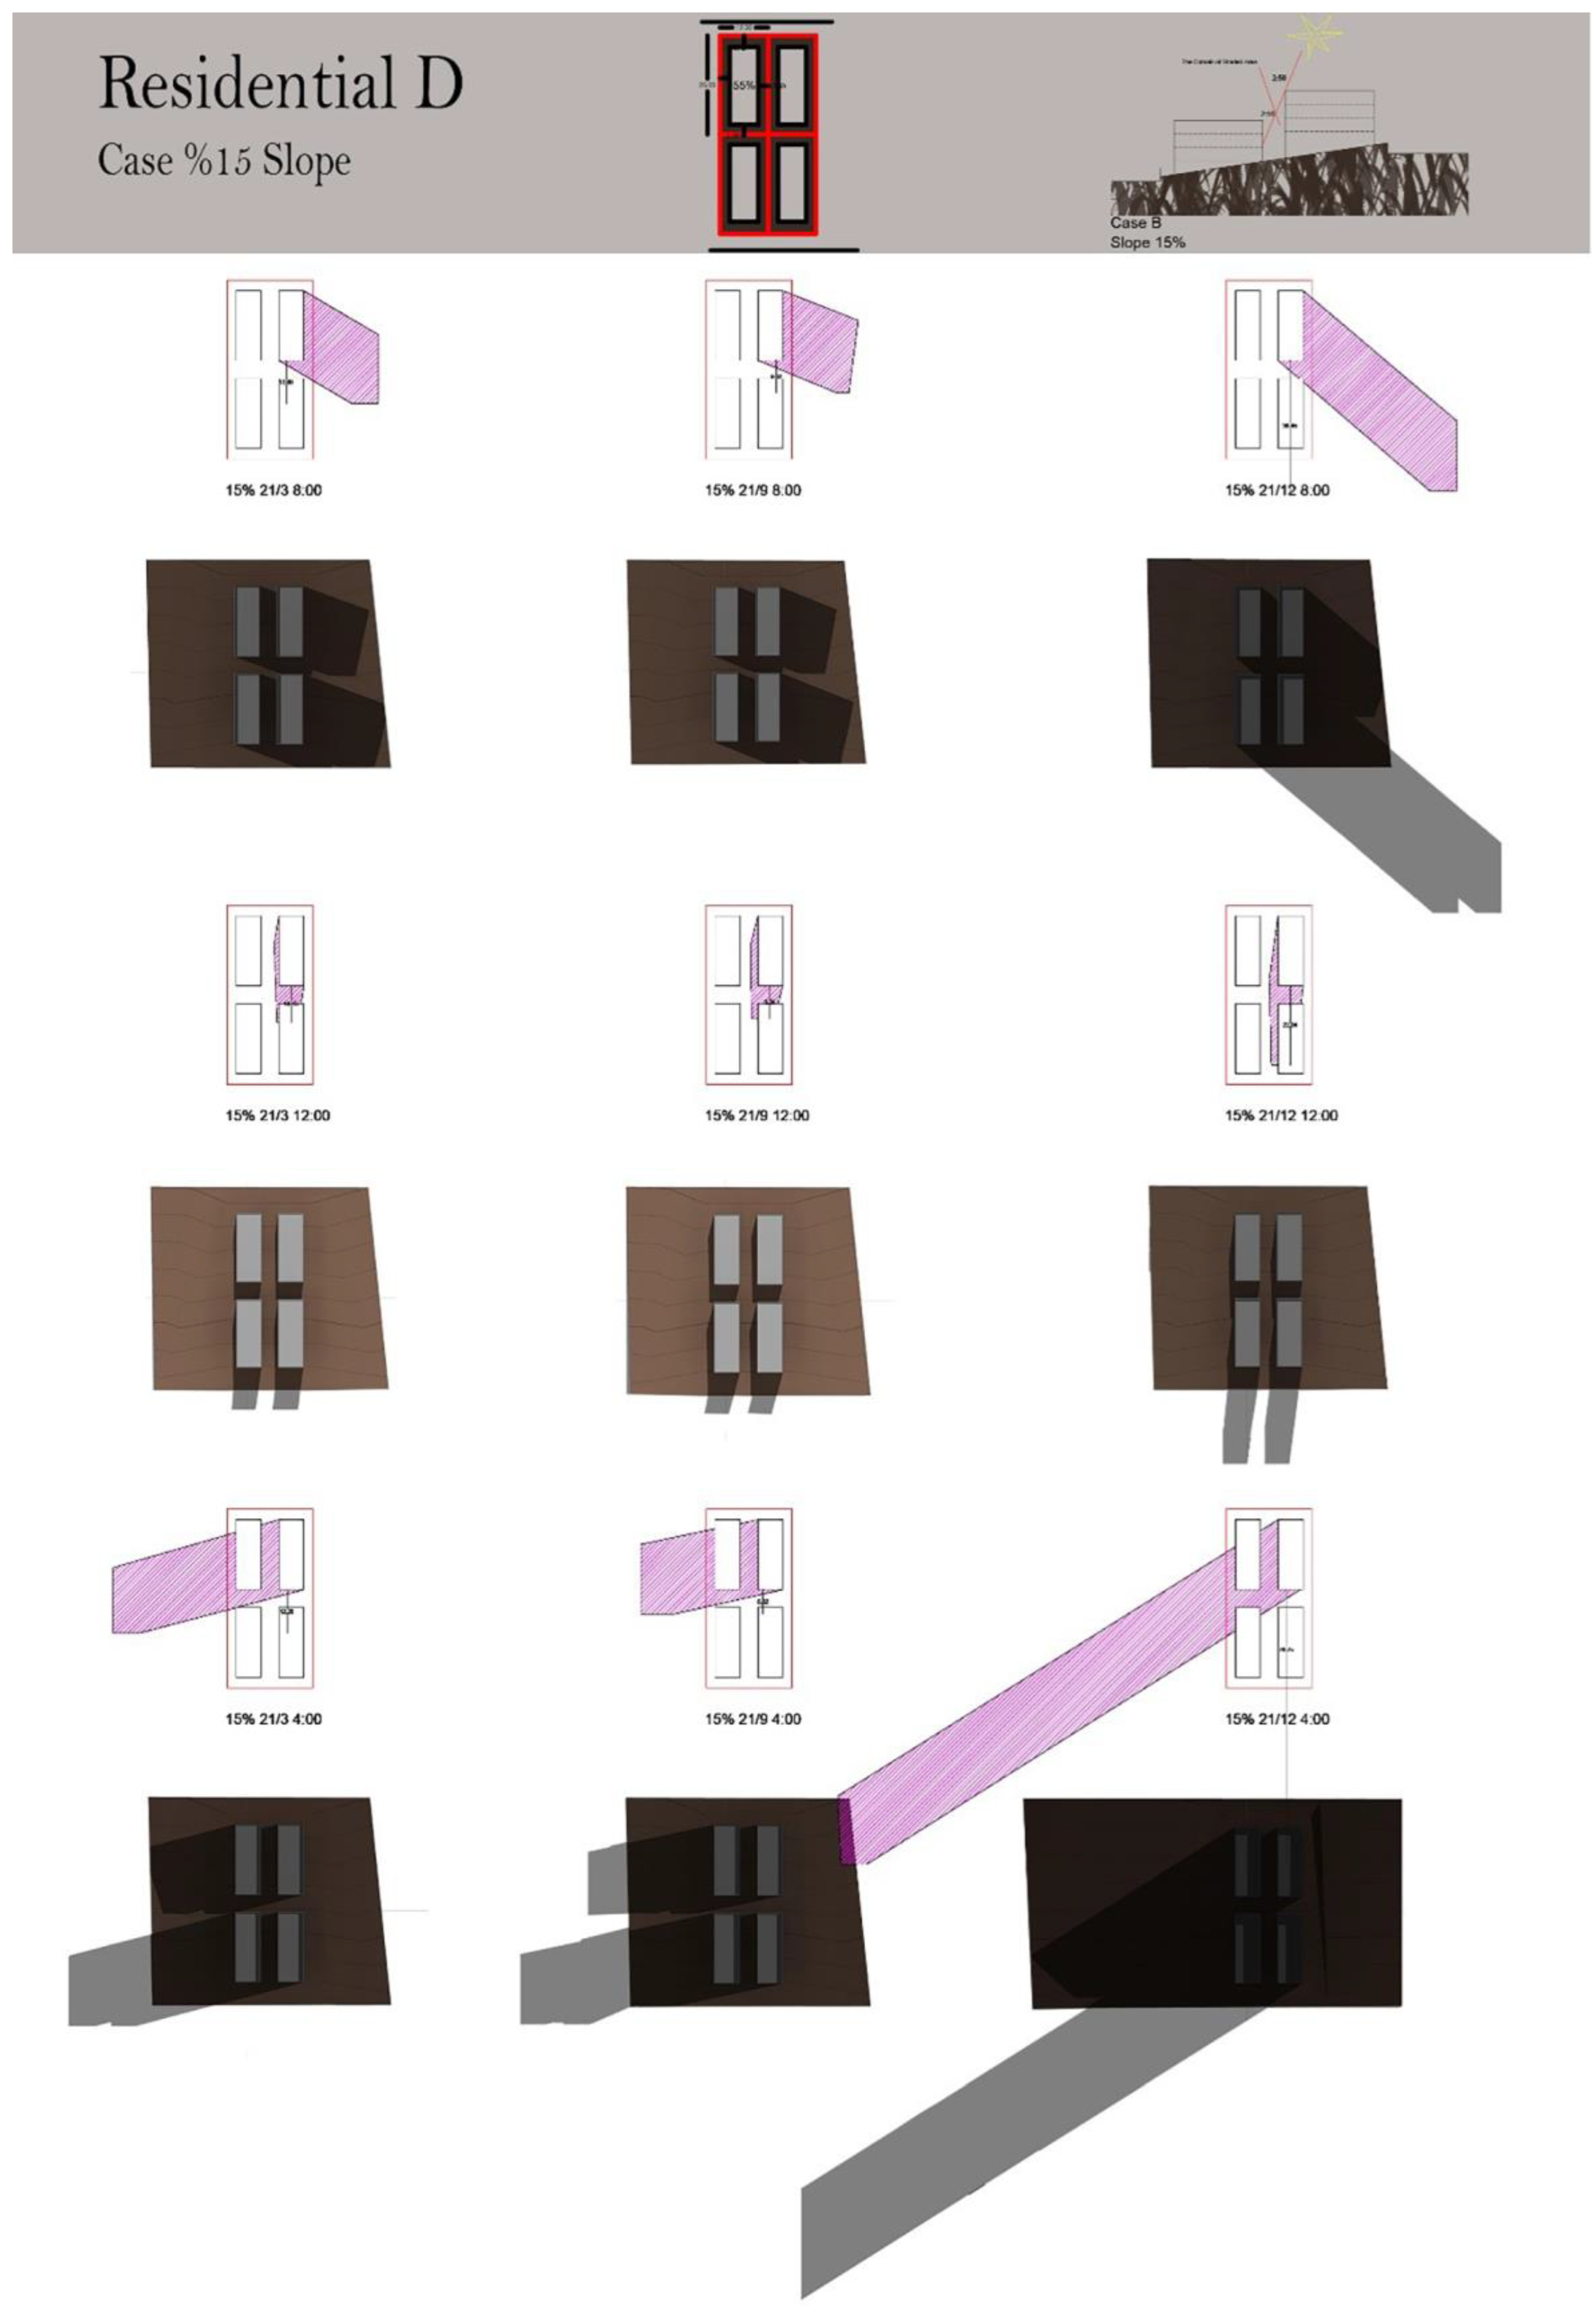
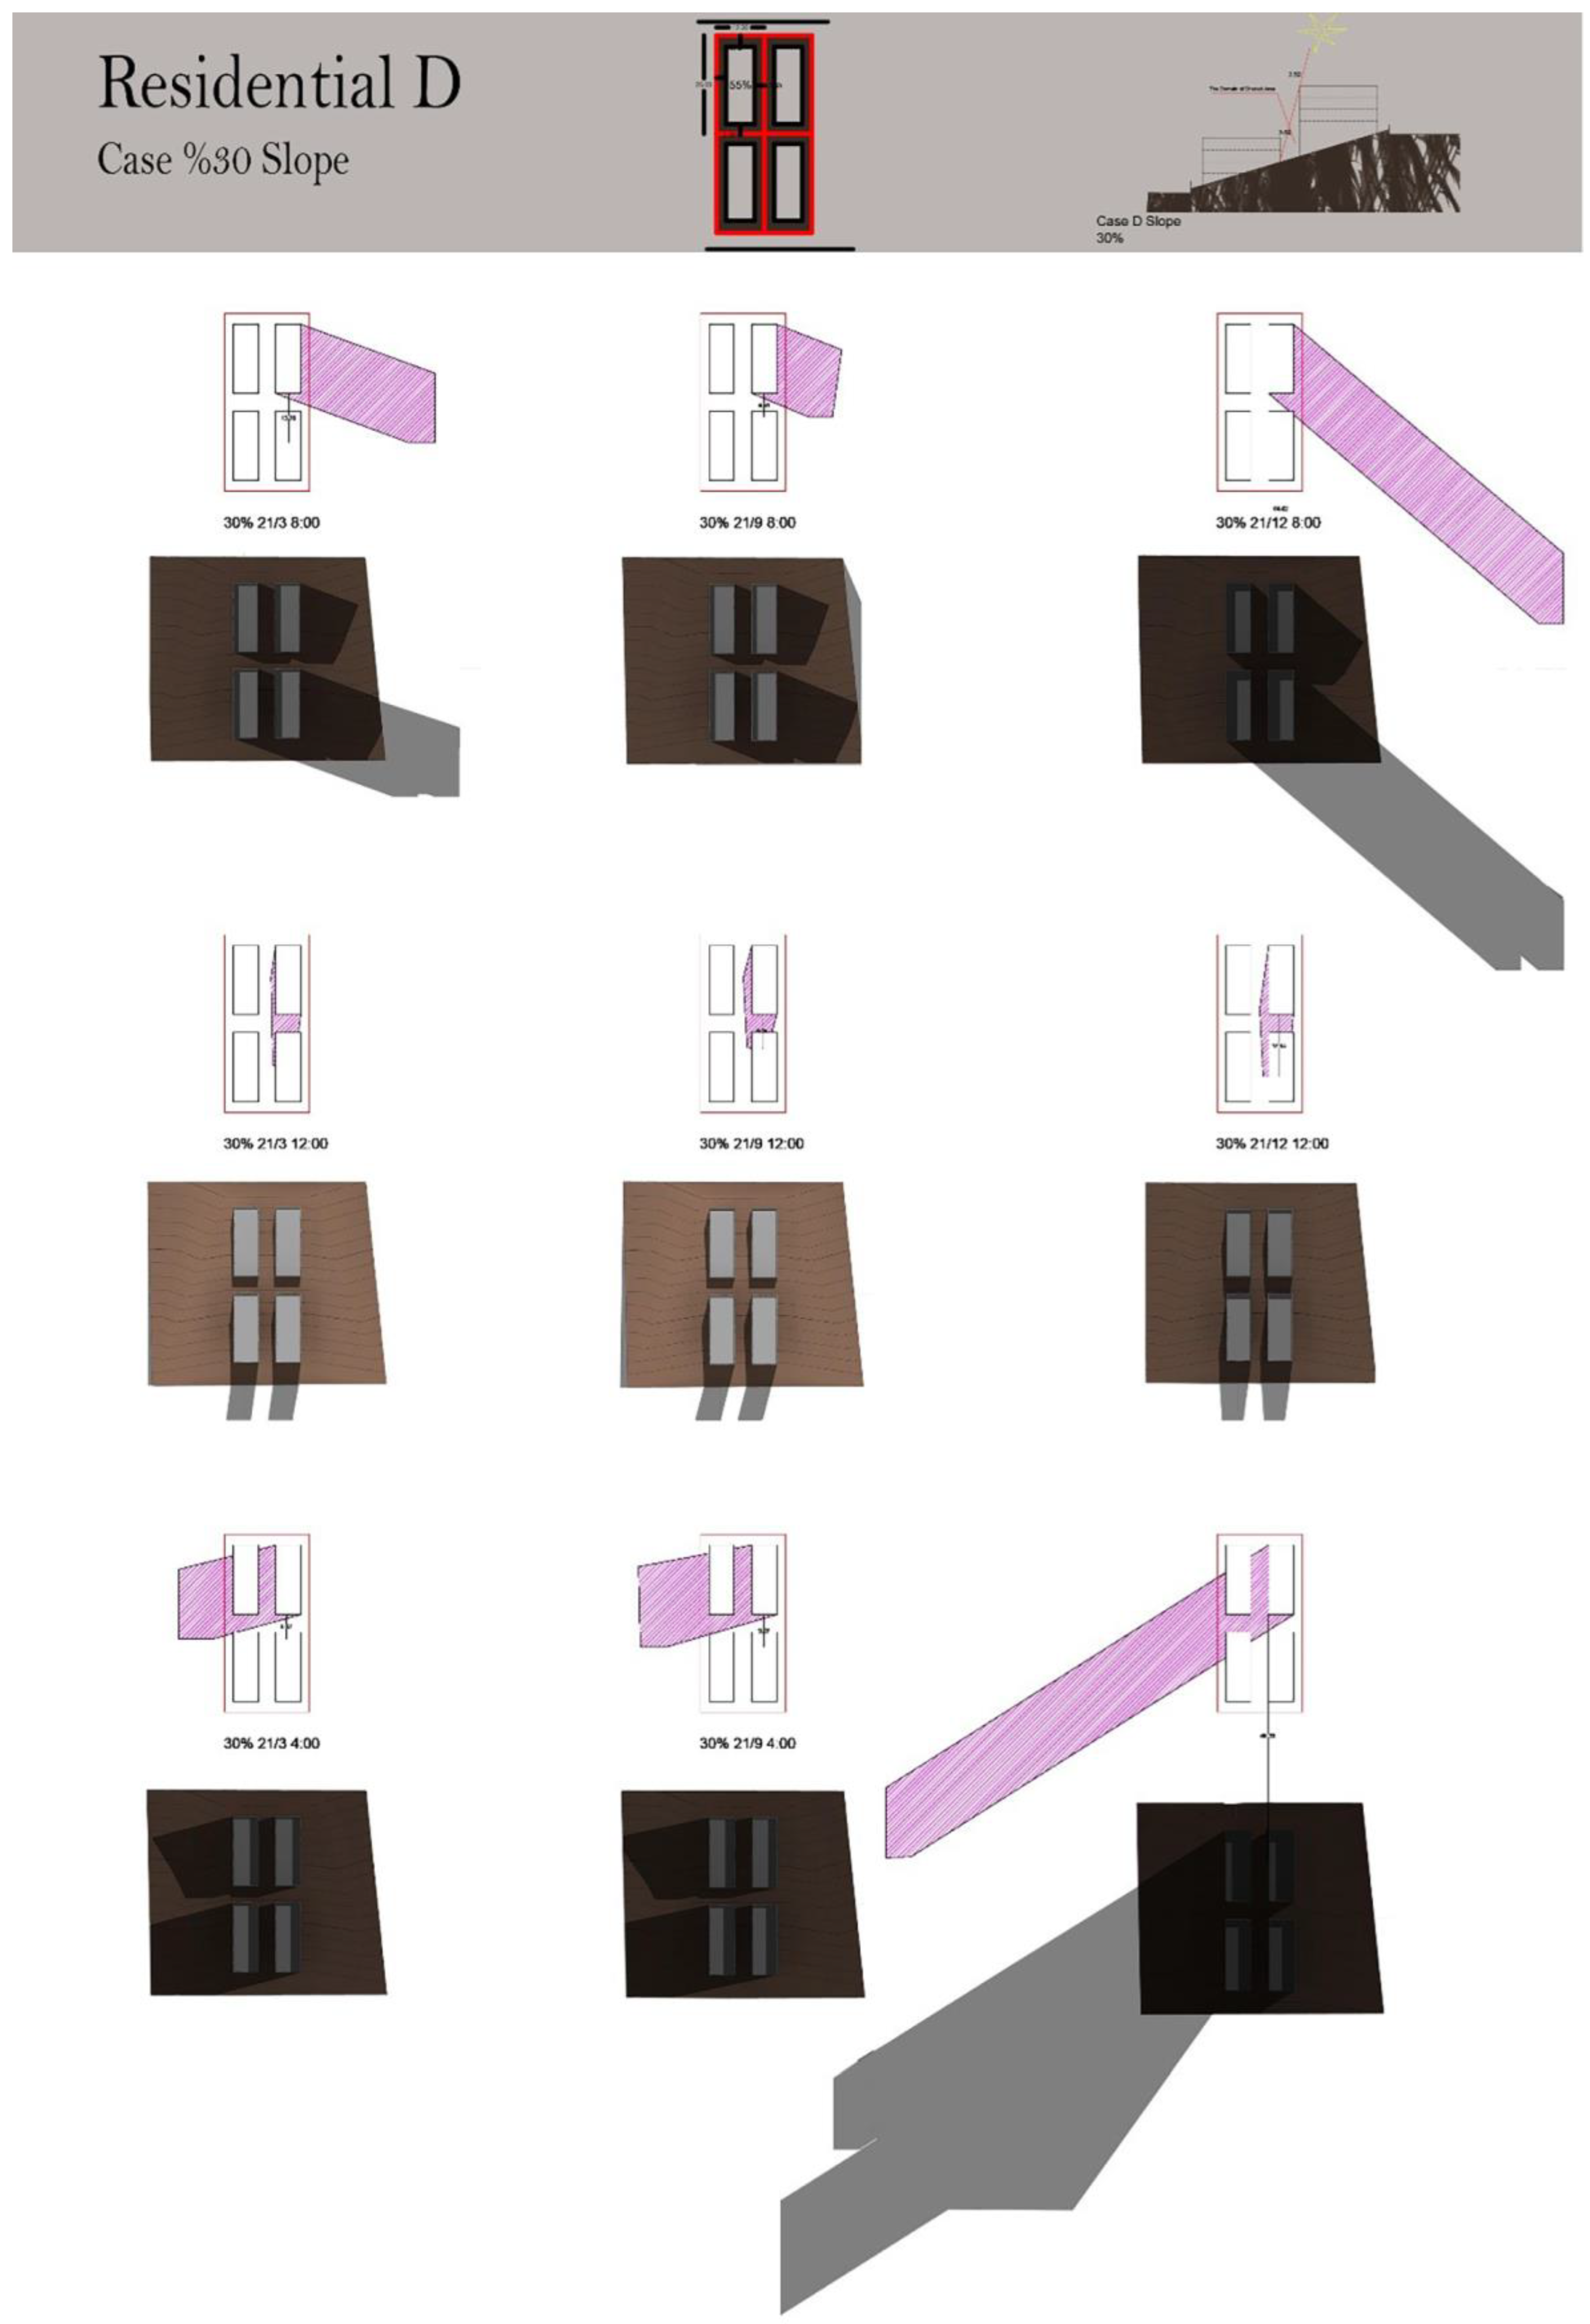
- Residential Zones B, C, and D: In back-to-back arrangements facing south, daylight is frequently blocked for much of the year. The situation worsens in side-by-side arrangements, where daylight access is significantly reduced.
6. Recommendations
6.1. Dynamic Setbacks Tied to Slope Percentages
6.2. Restrictions on Basement Habitation
6.3. Optimized Street Orientation
6.4. Increase Side Setbacks for Land at Higher Elevations
6.5. Adjust Rear Setbacks Based on Building Height and Solar Access
Author Contributions
Funding
Data Availability Statement
Conflicts of Interest
Appendix A
| No. | Slope | No. of Floors | No. of Basements | Side Setback | Side Setback | Front Setback | Rear Setback | Width of Streets | South Elev. 21/3 | South Elev. 21/9 | South Elev. 21/12 | Contour | Height of Slope (X) |
| Results According to Appendix B | |||||||||||||
| 1 | 5.2% | 4 | 2 | 4 | 3 * | 4 | 6 | 32 5 | No | No | Yes | Parallel to street | 2.5 |
| 2 | 1% | 4 | 2 | 4.8 | 4.5 * | 4.01 | 7.6 | 32 5 | No Yes Yes | No Yes Yes | Yes Yes Yes | Parallel to street | 0.5 |
| 3 | 21.4% | 4 | 4 | 4.86 | 4 | 4 | 6.15 | 32 | No Yes Yes | No Yes Yes | Yes Yes Yes | Parallel to street | 4.4 |
| 4 | 15.5% | 4 | 4 | 4.5 | 4.36 | 4 | 6 | 32 | No | No | Yes No No | Perpendicular to street | 3.2 |
| 5 | 9.2% | 1 | 0 | 6 | 3.61 * | 7.94 | 5.87 | 8.15 6 | No | No | No No Yes | Parallel to street | 4.5 |
| 6 | 18.3% | 1 | 0 | 6.47 | 12.09 | 12.4 | 3.68 | 11 6 | No | No | No No Yes | Parallel to street | 8.9 |
| 7 | 20.5% | 1 | 0 | 4.12 | 4 | 9.16 | 7.34 | 10.85 | No No Yes | No No Yes | Yes No Yes | Parallel to street | 10 |
| 8 | 13.7% | 1 | 0 | 4.86 | 6.96 | 12.04 | 12.45 | 11.87 | Yes No No | Yes No No | Yes No Yes | Perpendicular to street | 6.5 |
| 9 | 13.8% | 2 | 0 | 4.45 | 6.03 | 7.35 | 15.38 | 13.49 | No | No | Yes No No | Parallel to street | 6.3 |
| 10 | 21.5% | 2 | 1 | 28.39 | 8.18 | 5.25 | 5.65 | 14.9 | No No No | No No No | Yes No No | Perpendicular to street | 8 |
| 11 | 0.9% | 2 | 1 | 8.38 | 6.82 * | 5.41 | 8.39 | 12.32 4 | No No Yes | No No Yes | Yes Yes Yes | Perpendicular to street | 0.3 |
| 12 | 5.6% | 2 | 1 | 3.89 | 4.84 * | 3.08 | 5.97 | 19.99 4 | Yes No No | Yes No No | Yes Yes No | Perpendicular to street | 1.7 |
| 13 | 3.6% | 3 | 1 | 6.5 | 10.43 | 3.85 | 6 | 41.28 | Yes No Yes | Yes No Yes | Yes Yes Yes | Perpendicular to street | 1 |
| 14 | 4.7% | 4 | 1 | 4 | 4 | 4 | 6 | 11.98 | No | No | Yes No No | Parallel to street | 1.3 |
| 15 | 0% | 4 | 1 | 4 | 4 * | 4 | 6 | 18.47 4.30 | No | No | Yes Yes No | Flat | 0 |
| 16 | 11% | 4 | 1 | 4 | 4.67 * | 4 | 6 | 22.98 4.09 | Yes No Yes | Yes No Yes | Yes | Parallel to street | 3.1 |
| 17 | 15.9% | 5 | 1 | 3.41 | 3.91 | 3.9 | 6 | 12.13 | No No Yes | No No Yes | Yes | Parallel to street | 4.5 |
| 18 | 33.6% | 4 | 1 | 4 | 3.8 | 3 | 6 | 23.68 | No Yes No | No | Yes Yes No | Parallel to street | 8 |
| 19 | 16.2% | 4 | 4 | 4 * | 4 * | 4 * | 4 ** | 20.35 30.19 40.46 | Yes No No | Yes No No | Yes No No | Parallel to street | 4.4 |
| 20 | 11.8% | 4 | 1 | 4 | 4 | 4.48 | 6 | 30.13 | No | No | Yes No No | Perpendicular to street | 3.1 |
| 21 | 7.5% | 4 | 2 | 4 | 4 | 4 | 6 | 30.10 | No | No | Yes No No | Perpendicular to street | 2 |
| 22 | 2.3% | 3 | 1 | 4.64 | 4.03 | 4 | 6.14 | 30 | Yes No No | Yes No No | Yes No No | Perpendicular to street | 0.6 |
| 23 | 0% | 5 | 4 | 4.03 | 4.34 * | 4 | 6 | 30 4.1 | Yes No No | Yes No No | Yes Yes No | Flat | 0 |
| 24 | 41.2% | 4 | 3 | 4 ** | 4 * | 6.54 | 4 | 20 13.5 | No | No | Yes No Yes | Parallel to street | 11.7 |
| 25 | 26% | 4 | 4 | 3 | 3 | 4 | 4 * | 20 13.5 | No Yes No | No Yes No | Yes | Parallel to street | 12 |
| 26 | 23.9% | 4 | 1 | 4 | 4 | 4 | 6 | 20.4 | No Yes Yes | No Yes Yes | Yes | Parallel to street | 6.7 |
| 27 | 17.5% | 4 | 2 | 4 | 4 | 4 | 6 | 23.5 | Yes Yes No | Yes | Yes | Parallel to street | 4.7 |
| 28 | 25.7% | 4 | 0 | 4 | 4 | 4 | 6 | 44 | No Yes Yes | No Yes Yes | Yes Yes Yes | Parallel to street | 7.2 |
| 29 | 23.8% | 4 | 1 | 4 | 4 * | 4 | 5.8 | 23 4 | No Yes No | No Yes No | Yes | Parallel to street | 6.7 |
| 30 | 17.4% | 1 | 3 | 4 | 4 * | 4 | 6 | 12 4 | No | No | Yes No | Perpendicular to street | 4.9 |
| 31 | 11.3% | 4 | 4 | 4 | 4 * | 4 | 6 | 12 4 | No | No | Yes | Perpendicular to street | 3.2 |
| 32 | 21.7% | 4 | 0 | 4 | 4 | 4 | 6 | 20.3 | No No Yes | No No Yes | Yes No Yes | Parallel to street | 6.1 |
| 33 | 10.5% | 4 | 2 | 4 | 4 | 4 | 6 | 12 | No | No | Yes | Perpendicular to street | 3 |
| 34 | 4.7% | 2 | 0 | 4 | 4 * | 4 | 6 | 12 4 | No | No | No Yes Yes | Parallel to street | 1.4 |
| 35 | 21.3% | 4 | 2 | 4 | 4 * | 4 | 4 | 20 4 | No | No | Yes No Yes | Parallel to street | 6.8 |
| 36 | 7.7% | 4 | 3 | 4 | 4 | 4 | 6 | 4 | No | No | Yes Yes No | Perpendicular to street | 2.4 |
| 37 | 0% | 4 | 3 | 4 | 4 | 4 | 6 | 14 | No | No | Yes No Yes | Flat | 0 |
| 38 | 0% | 1 | 0 | 4 | 4 | 4 | 6 | 14 | Yes No No | Yes No No | Yes No Yes | Flat | 0 |
| 39 | 3.9% | 4 | 0 | 4 | 4 | 4 | 6 | 14 | Yes No No | Yes No No | Yes No Yes | Perpendicular to street | 1 |
| 40 | 5% | 1 | 1 | 4 | 6 * | 4.1 | 4.3 | 13.5 | No | No | Yes No Yes | Parallel to street | 1.2 |
| 41 ** | 35% | 4 | 1 | 5.6 | 10.9 | 8.4 | 6 | 12 | No | No | Yes | Parallel to street | 11.3 |
| 42 ** | 16.4% | 2 | 0 | 5 | 4 | 10.7 | 6 | 12 | No | No | Yes No Yes | Parallel to street | 6 |
| 43 ** | 23.4% | 4 | 3 | 4 | 4.2 * | 4 | 6.8 * | 16.5 12 12 | No | No | Yes No Yes | Parallel to street | 7.3 |
| 44 | 29.4% | 2 | 0 | 9.4 | 5.2 * | 10.3 | 4.3 * | 17.3 12.7 8.4 | No | No | Yes No Yes | Parallel to street | 10.4 |
| 45 | 23.3% | 2 | 0 | 4 | 4 * | 7.4 | 11 * | 15 12.7 8.4 | Yes No No | Yes No No | Yes No Yes | Parallel to street | 8.3 |
| 46 ** | 21.1% | 4 | 4 | 4 | 4 * | 4 | 4 * | 18.8 13 8.3 | No | No | Yes No Yes | Parallel to street | 7.5 |
| 47 | 9.6% | 4 | 2 | 4 | 4 * | 16.7 | 4 * | 29.6 12.6 12 | No No Yes | No | Yes No Yes | Parallel to street | 2.9 |
| 48 | 1.7% | 4 | 1 | 4 | 4 | 4 | 6 | 12 | No Yes Yes | No Yes Yes | Yes | Perpendicular to street | 0.5 |
| 49 | 0% | 2 | 0 | 9 | 7.6 | 5.6 | 5.5 | 12 | Yes No No | No | Yes | Flat | 0 |
| 50 ** | 0% | 4 | 1 | 6 | 10 * | 11 | 4 | 12 | Yes No No | No | Yes No No | Flat | 0 |
| 51 ** | 0% | 3 | 1 | 4 | 5.5 | 5.8 | 6.9 | 12 | No | No | Yes No No | Flat | 0 |
| 52 ** | 2.3% | 1 | 0 | 4 | 5.5 | 5.8 | 6.9 | 12 | No | No | Yes No No | Perpendicular to street | 0.7 |
| 53 ** | 1.7% | 2 | 0 | 4 | 4 | 4 | 6 | 12 | No | No | Yes No No | Perpendicular to street | 0.5 |
| 54 | 0% | 4 | 1 | 4 | 4 | 4 | 6 | 12.6 | Yes No No | Yes No No | Yes No No | Flat | 0 |
| 55 | 9.4% | 2 | 0 | 4 | 4 * | 4 | 4 * | 12.6 14.8 33 | No No No | No No No | Yes No No | Perpendicular to street | 2.7 |
| 56 | 10.3% | 5 | 1 | 4 | 4 | 4 | 6 | 14.8 | No Yes No | No Yes Yes | Yes | Parallel to street | 3.4 |
| 57 ** | 16% | 4 | 2 | 4 | 4 * | 4 | 4 | 16 20 | No | No | Yes No Yes | Parallel to street | 5.2 |
| 58 | 23.3% | 5 | 2 | 4 | 4 * | 4 | 4 | 20 8 | Yes | Yes | Yes | Perpendicular to street | 6.1 |
| 59 | 16.4% | 4 | 1 | 4 | 4 * | 4 | 4 | 12.5 17.3 | Yes No No | No | Yes No Yes | Perpendicular to street | 4.7 |
| 60 | 3.7% | 4 | 2 | 7.5 | 4.9 | 4 | 6 | 17.8 | Yes | No No Yes | Yes | Perpendicular to street | 1.3 |
| 61 ** | 16.2% | 2 | 1 | 4 | 4 * | 15 | 4 | 16.7 16.5 | Yes No No | Yes Yes No | Yes No Yes | Parallel to street | 5 |
| 62 ** | 17.1% | 4 | 1 | 4 | 4 | 4 | 6 | 16.5 | Yes No No | Yes No Yes | Yes No Yes | Parallel to street | 5.2 |
| 63 ** | 20.9% | 1 | 1 | 4 | 4 | 4 | 6 | 17.3 | No | No | Yes No Yes | Parallel to street | 7.2 |
| 64 ** | 21.2% | 4 | 3 | 4 | 4 * | 4 | 4 | 17.3 15.5 | No | No | Yes No Yes | Parallel to street | 7.2 |
| 65 | 13.2% | 4 | 1 | 9 | 4 * | 4 | 4 | 18 12.6 | Yes No No | Yes No No | Yes | Perpendicular to street | 4.4 |
| 66 | 20% | 3 | 0 | 4 | 4 * | 10.6 | 4 | 15.5 15.3 | Yes No No | Yes No No | Yes | Perpendicular to street | 7 |
| 67 | 16.6% | 3 | 1 | 4 | 4 | 4 | 6 | 15.5 | No No Yes | No No Yes | Yes | Perpendicular to street | 5.4 |
| 68 | 20.1% | 4 | 1 | 4 | 4 | 4 | 6 | 15.5 | No No Yes | No No Yes | Yes | Perpendicular to street | 6.7 |
| 69 | 6.5% | 4 | 1 | 4 | 4 | 4 | 6 | 11 | No Yes Yes | No Yes Yes | Yes | Perpendicular to street | 2.2 |
| 70 | 4.7% | 6 | 2 | 4 | 4 | 4 | 6 | 11 | No Yes Yes | No Yes Yes | Yes | Perpendicular to street | 1.6 |
| 71 | 6.6% | 2 | 2 | 4 | 4 | 4 | 6 | 11 | No Yes Yes | No Yes Yes | Yes | Perpendicular to street | 2.2 |
| 72 | 10.6% | 3 | 0 | 4 | 4 | 4 | 6 | 11 | No Yes Yes | No Yes Yes | Yes | Perpendicular to street | 3.5 |
| 73 | 10.4% | 2 | 0 | 4 | 4 | 4 | 6 | 12 | No Yes Yes | No Yes Yes | Yes | Perpendicular to street | 3.4 |
| 74 | 9.9% | 3 | 0 | 4 | 4 | 4 | 6 | 15.5 | No Yes Yes | No Yes Yes | Yes | Parallel to street | 3.6 |
| 75 | 13.8% | 3 | 1 | 4 | 7.8 * | 10.3 | 4 | 15.5 13 | No | No | Yes No No | Parallel to street | 4.9 |
| 76 | 12.4% | 4 | 3 | 4 | 6.7 * | 6.7 | 4 | 13 8 | No | No | Yes No No | Parallel to street | 4.3 |
| 77 | 13.7% | 4 | 2 | 4 | 4 | 4 | 6 | 8 | No Yes Yes | No Yes Yes | Yes | Parallel to street | 4.7 |
| 78 | 9.2% | 4 | 2 | 4 | 4 | 4 | 6 | 8 | No Yes Yes | No Yes Yes | Yes | Parallel to street | 3.3 |
| 79 ** | 16.8% | 4 | 3 | 4 | 4 * | 4 | 4 * | 13 17 12 | No | No | Yes | Parallel to street | 7.8 |
| 80 ** | 13.6% | 4 | 2 | 4 | 4 | 4 | 6 | 12 | No | No | Yes No Yes | Parallel to street | 3.5 |
| 81 ** | 14.7% | 2 | 1 | 4 | 16.4 * | 8 | 4 | 14.8 12 | Yes No No | Yes No No | Yes | Parallel to street | 3.8 |
| 82 | 13.1% | 2 | 1 | 9 | 10 | 4 | 6 | 14.8 | No | No | Yes | Perpendicular to street | 5.2 |
| 83 | 9% | 4 | 2 | 4 | 10 * | 4 | 4 * | 4 16 | No Yes Yes | No Yes Yes | Yes No Yes | Perpendicular to street | 1.8 |
| 84 | 9.8% | 4 | 2 | 4 | 4 | 4 | 6 | 12 | No Yes Yes | No Yes Yes | Yes No Yes | Perpendicular to street | 2 |
| 85 | 16.3% | 4 | 2 | 4 | 4 * | 4 | 4 | 12 4 4 | No | No | Yes | Perpendicular to street | 3.4 |
| 86 | 11.3% | 4 | 1 | 4 | 4 * | 4 | 4 | 16 4 | Yes No Yes | Yes No Yes | Yes | Perpendicular to street | 3.4 |
| 87 | 6.8% | 2 | 0 | 6.6 | 7.5 | 12.1 | 6.5 * | 16 4 | Yes No Yes | Yes No Yes | Yes | Perpendicular to street | 2.1 |
| 88 ** | 11.7% | 4 | 1 | 4 | 4 | 4 | - | 16 12 | Yes No No | Yes No Yes | Yes No Yes | Parallel to street | 3.4 |
| 89 | 16.3% | 4 | 2 | 4 | 4 * | 4 | 4 | 11 | No | No | Yes No Yes | Perpendicular to street | 4.4 |
| 90 | 19% | 4 | 2 | 4 | 4 * | 4 | 4 | 49.3 4 | No No Yes | Yes No Yes | Yes No Yes | Perpendicular to street | 5.9 |
| 91 | 10.8% | 1 | 1 | 4 | 4 | 4 | 6 | 30.5 | No | No | No | Perpendicular to street | 2.8 |
| 92 | 14.6% | 3 | 2 | 4 | 4 | 4 | 6 | 30.5 | Yes No No | Yes No No | No No Yes | Perpendicular to street | 3.9 |
| 93 | 16% | 4 | 1 | 4 | 4 | 4 | 6 | 17 | No | No | Yes | Parallel to street | 4.1 |
| 94 | 32.7% | 4 | 4 | 4 | 4 * | 4 | 4 | 20 4 | No | No | Yes No No | Parallel to street | 9.8 |
| 95 | 34.8% | 4 | 2 | 4 | 4 * | 4 | 4 | 16 4 | No | No | Yes No No | Parallel to street | 10.3 |
| 96 | 29.9% | 4 | 2 | 4 | 4 * | 4 | 4 | 20 4 | No Yes Yes | No Yes Yes | Yes | Parallel to street | 8.9 |
| 97 | 28.3% | 4 | 2 | 4 | 4 * | 4 | 4 | 16 4 | No No Yes | No No Yes | Yes | Parallel to street | 8.4 |
| 98 | 27.4% | 4 | 2 | 4 | 4 | 4 | 6 | 24.3 | No Yes Yes | No Yes Yes | Yes | Parallel to street | 8.2 |
| 99 | 23.2% | 4 | 0 | 4 | 4 | 4 | 6 | 17.7 | No Yes Yes | No Yes Yes | Yes | Parallel to street | 6.9 |
| 100 | 23.1% | 4 | 2 | 4 | 4 | 4 | 6 | 34 | No Yes Yes | No Yes Yes | Yes | Parallel to street | 6.9 |
| 101 | 24.3% | 4 | 0 | 4 | 4 | 4 | 6 | 16 | No Yes Yes | No Yes Yes | Yes | Parallel to street | 7.2 |
| 102 | 21.1% | 4 | 2 | 4 | 4 | 4 | 6 | 20 | No Yes Yes | No Yes Yes | Yes | Parallel to street | 6.3 |
| 103 | 25.9% | 2 | 0 | 4 | 4 | 4 | 6 | 16 | No Yes Yes | No Yes Yes | Yes | Parallel to street | 7.7 |
| 104 | 19.7% | 4 | 2 | 4 | 4 | 4 | 6 | 20 | No Yes Yes | No Yes Yes | Yes | Parallel to street | 5.9 |
| 105 | 27.2% | 3 | 0 | 4 | 4 | 4 | 6 | 30 | No No Yes | No No Yes | Yes | Parallel to street | 7.4 |
| 106 | 30.1% | 4 | 4 | 4 | 4 * | 4 | 4 | 16.7 4 | No | No | No No Yes | Parallel to street | 8.6 |
| 107 | 32.9% | 4 | 1 | 4 | 4 * | 4 | 4 | 13 4 | Yes No Yes | Yes No Yes | No No Yes | Perpendicular to street | 4.9 |
| 108 | 8.8% | 4 | 2 | 4 | 4 | 4 | 6 | 4 | No | No | No No Yes | Perpendicular to street | 2.4 |
| 109 | 29.5% | 4 | 3 | 4 | 4 * | 4 | 4 | 12.7 12 | No | No No Yes | No No Yes | Parallel to street | 7.7 |
| 110 | 26.6% | 4 | 3 | 4 | 4 | 4 | 6 | 12 | Yes Yes No | Yes Yes No | Yes | Parallel to street | 6.9 |
| 111 ** | 11.6% | 4 | 2 | 4 | 4 | 4 | 6 | 20.2 | No | No | No No Yes | Perpendicular to street | 2.9 |
| 112 | 20.8% | 4 | 1 | 4 | 4 * | 4 | - | 20.2 16 | Yes Yes No | Yes Yes No | Yes | Parallel to street | 6.1 |
| 113 | 23.9% | 4 | 4 | 4 | 4 * | 4 | - | 23 26 | No | No | Yes No No | Parallel to street | 6.1 |
| 114 | 12% | 4 | 4 | 4 | 4 * | 4 | - | 26.6 14 | No | No | Yes No Yes | Parallel to street | 3.3 |
| 115 | 11.4% | 4 | 2 | 4 | 4 | 4 | 6 | 14.5 | No | No | Yes No Yes | Perpendicular to street | 3.1 |
| 116 | 21% | 4 | 2 | 4 | 4 | 4 | 6 | 14.5 | Yes Yes No | Yes Yes No | Yes | Perpendicular to street | 5.7 |
| 117 | 8% | 4 | 2 | 4 | 4 * | 4 | 4 | 14.5 4 | Yes Yes No | Yes Yes No | Yes | Perpendicular to street | 2.2 |
| 118 | 7.3% | 4 | 1 | 4 | 4 * | 4 | 4 | 20 4 | Yes No Yes | Yes No Yes | Yes No Yes | Perpendicular to street | 2 |
| 119 | 15.7% | 4 | 2 | 4 | 4 | 4 | 6 | 20 | Yes Yes No | Yes Yes No | Yes | Perpendicular to street | 4.3 |
| 120 | 7% | 4 | 2 | 4 | 4 | 4 | 6 | 14.1 | No | No | Yes No No | Perpendicular to street | 4.3 |
| 121 | 9% | 4 | 2 | 4 | 4 | 4 | 6 | 14.1 | Yes Yes No | Yes Yes No | Yes | Perpendicular to street | 2.6 |
| 122 | 22.4% | 4 | 2 | 4 | 4 * | 4 | 4 | 14.1 4 | Yes Yes No | Yes Yes No | Yes | Perpendicular to street | 6.4 |
| 123 ** | 10% | 4 | 3 | 4 | 4 * | 4 | 4 | 41 4 | No | No | No | Perpendicular to street | 3 |
| 124 ** | 13.1% | 4 | 3 | 4 | 4 * | 4 | 4 | 14 4 | Yes | Yes | Yes | Perpendicular to street | 4.1 |
| 125 | 24.6% | 4 | 2 | 4 | 4 | 4 | 4 | 14 4 | Yes | Yes | Yes | Perpendicular to street | 6.9 |
| 126 | 26.5% | 4 | 3 | 4 | 4 | 4 | 6 | 24.3 | Yes Yes No | Yes Yes No | Yes | Perpendicular to street | 7.2 |
| 127 | 16.3% | 4 | 2 | 4.3 | 4.8 * | 4 | 5.4 | 14.6 4 | No | No | No Yes Yes | Perpendicular to street | 4.7 |
| 128 | 30% | 4 | 1 | 4 | 4 * | 4 | 6.3 | 20 4 | No No Yes | No No Yes | No Yes Yes | Parallel to street | 7.8 |
| 129 | 12.5% | 4 | 1 | 4.2 | 4.8 * | 4 | 5.9 | 14.8 4 | No | No | Yes | Parallel to street | 3.5 |
| 130 | 20.8% | 4 | 1 | 4 | 4 * | 4 | 6.2 | 20 4 | No Yes Yes | No Yes Yes | Yes | Parallel to street | 5.6 |
| 131 | 7.6% | 4 | 1 | 4.7 | 4.2 * | 4 | 5.8 | 16 4 | No | No | Yes | Perpendicular to street | 2.1 |
| 132 | 5.9% | 4 | 1 | 4 | 4 * | 4 | 5.6 | 20 4 | No No Yes | No No Yes | Yes | Perpendicular to street | 1.6 |
| 133 | 1.3% | 4 | 1 | 3.5 | 4 * | 4 | 6 | 16 4 | No | No | Yes | Perpendicular to street | 0.7 |
| 134 | 3.9% | 4 | 1 | 4.5 | 4.1 * | 5 | 4 | 20 4 | No No Yes | No No Yes | Yes | Perpendicular to street | 1.3 |
| 135 | 6.2% | 2 | 0 | 26.4 | 8 | 8 | 29.1 * | 16 20.5 | No No Yes | No No Yes | Yes | Perpendicular to street | 1.4 |
| 136 | 6.3% | 4 | 1 | 4 | 4 | 4 | 6 | 16 | Yes No No | Yes No No | Yes No Yes | Perpendicular to street | 2.1 |
| 137 | 7% | 4 | 1 | 4 | 4 | 4 | 6 | 20 | No No Yes | No No Yes | Yes No Yes | Perpendicular to street | 1.6 |
| 138 | 16.1% | 4 | 2 | 4 | 4 | 4 | 6 | 16 | No No Yes | No No Yes | Yes No Yes | Perpendicular to street | 4.6 |
| 139 | 16% | 4 | 2 | 4 | 4 | 4 | 6 | 20 | No No Yes | No No Yes | Yes | Perpendicular to street | 4.9 |
| 140 | 17.9% | 4 | 2 | 4 | 4 * | 4 | - | 20 18 | No Yes Yes | No Yes Yes | Yes | Perpendicular to street | 5.2 |
| 141 | 13.7% | 2 | 2 | 4 | 4 * | 4 | - | 23 21 | Yes No Yes | Yes No Yes | Yes | Perpendicular to street | 4.1 |
| 142 | 10.9% | 4 | 2 | 4 | 4 * | 4 | 4 | 12 12 | Yes No Yes | Yes No Yes | Yes No Yes | Perpendicular to street | 3.2 |
| 143 | 14.5% | 4 | 2 | 4 | 4 * | 4 | 4 | 14 12 | Yes No Yes | Yes No Yes | Yes No Yes | Perpendicular to street | 4.3 |
| 144 | 12% | 4 | 3 | 4 | 4 | 4 | 6 | 12 | Yes | Yes | Yes | Perpendicular to street | 3.6 |
| 145 | 6.5% | 4 | 3 | 4 | 4 | 4 | 6 | 14 | Yes | Yes | Yes | Perpendicular to street | 2 |
| 146 | 5.5% | 2 | 2 | 4 | 4 | 4 | 6 | 12.3 | Yes Yes No | Yes Yes No | Yes | Perpendicular to street | 1.7 |
| 147 | 5.4% | 4 | 1 | 4 | 4 | 4 | 6 | 12.3 | Yes No No | Yes No No | Yes | Perpendicular to street | 1.7 |
| 148 | 8.6% | 4 | 1 | 4 | 4 | 4 | 6 | 12.3 | Yes No No | Yes No No | Yes | Perpendicular to street | 2.6 |
| 149 | 3.6% | 4 | 1 | 4 | 4 * | 4 | 6 | 12 4 | Yes No Yes | Yes No Yes | Yes | Perpendicular to street | 1.1 |
| 150 | 6.3% | 4 | 1 | 5.1 | 4 * | 4 | 6 | 12 4 | Yes No Yes | Yes No Yes | Yes | Perpendicular to street | 1.9 |
| 151 | 5.6% | 4 | 1 | 4 | 4 * | 4 | 7.2 | 14.2 4 | Yes No Yes | Yes No Yes | Yes | Perpendicular to street | 1.7 |
| 152 | 3.4% | 4 | 1 | 4 | 4 | 4 | 6 | 12 | Yes | Yes | Yes | Perpendicular to street | 1 |
| 153 | 11.7% | 4 | 2 | 4 | 4 | 4 | 6 | 14 | Yes No Yes | Yes No Yes | Yes | Perpendicular to street | 2.8 |
| 154 | 16.8% | 4 | 2 | 4 | 4 | 4 | 6 | 12 | Yes No Yes | Yes No Yes | Yes | Perpendicular to street | 5.5 |
| 155 | 17.1% | 4 | 2 | 4 | 6 | 4 | - | 14.3 | No | No | Yes No Yes | Perpendicular to street | 5.6 |
| 156 ** | 2% | 4 | 1 | 4 | 4 * | 4 | 4 | 12 12 | Yes No Yes | Yes No Yes | Yes No Yes | Perpendicular to street | 0.5 |
| 157 ** | 8.5% | 4 | 2 | 4 | 4 * | 4 | 4 | 12 12 | Yes No No | Yes No Yes | Yes No Yes | Perpendicular to street | 2.3 |
| 158 ** | 2.4% | 4 | 1 | 4 | 4 | 4 | 6 | 12 | Yes No Yes | Yes No Yes | Yes No Yes | Perpendicular to street | 0.6 |
| 159 ** | 4.1% | 4 | 2 | 4 | 4 | 4 | 6 | 12 | Yes No No | Yes No Yes | Yes No Yes | Perpendicular to street | 1.1 |
| 160 ** | 0% | 1 | 1 | 4.1 | 4 | 6.5 | 7 | 12 | Yes No Yes | Yes No Yes | Yes No Yes | Flat | 0 |
| 161 ** | 0% | 4 | 2 | 4 | 4 | 4 | 6 | 12 | Yes No No | Yes No No | Yes No Yes | Flat | 0 |
| 162 ** | 0% | 2 | 0 | 4 | 4 * | 4 | 7 | 12 4 | Yes No Yes | Yes No Yes | Yes No Yes | Flat | 0 |
| 163 ** | 3% | 4 | 2 | 4 | 4 * | 4 | 6 | 12 4 | Yes No No | Yes No Yes | Yes No Yes | Perpendicular to street | 0.8 |
| 164 ** | 0% | 4 | 1 | 4 | 4 * | 4 | 6 | 12 4 | Yes No Yes | Yes No Yes | Yes No Yes | Flat | 0 |
| 165 ** | 0% | 4 | 0 | 4 | 4 * | 4 | 5 | 12 4 | Yes No No | Yes No Yes | Yes No Yes | Flat | 0 |
| 166 ** | 14.7% | 4 | 1 | 4 | 4 | 4 | 7.2 | 12 | Yes No Yes | Yes No Yes | Yes No Yes | Perpendicular to street | 4.5 |
| 167 ** | 16.9% | 4 | 1 | 4 | 4 | 4 | 6 | 12 | Yes No No | Yes No Yes | Yes No Yes | Perpendicular to street | 5.1 |
| 168 ** | 13.2% | 2 | 1 | 4 | 4 * | 4 | 4 | 12 12 | Yes No Yes | Yes No Yes | Yes No Yes | Perpendicular to street | 4.7 |
| 169 ** | 14.8% | 4 | 2 | 4 | 4 * | 4 | 4 | 12 12 | Yes No No | Yes No Yes | Yes No Yes | Perpendicular to street | 5.3 |
| 170 | 0% | 4 | 2 | 4 | 4 * | 8.7 | 6.5 | 12 12 | No No Yes | No No Yes | Yes No Yes | Flat | 0 |
| 171 | 3.6% | 4 | 1 | 4 | 4 * | 6.7 | 6.5 | 12 12 | Yes No Yes | Yes No Yes | Yes No Yes | Perpendicular to street | 0.8 |
| 172 | 0% | 4 | 2 | 4 | 4 | 4 | 6 | 12 | Yes No No | Yes No No | Yes | Flat | 0 |
| 173 | 5.7% | 4 | 1 | 4 | 4 | 4 | 6 | 12 | Yes No Yes | Yes No Yes | Yes No Yes | Perpendicular to street | 1.3 |
| 174 | 4.1% | 3 | 1 | 4 | 4 | 4 | 6 | 12 | Yes No No | Yes No Yes | Yes No Yes | Perpendicular to street | 0.9 |
| 175 | 9.3% | 4 | 2 | 4 | 4 | 4 | 6 | 12 | Yes No Yes | Yes No Yes | Yes No Yes | Perpendicular to street | 2.2 |
| 176 | 9.1% | 2 | 1 | 4 | 4 * | 4 | 6 | 12 4 | Yes No No | Yes No No | Yes No Yes | Perpendicular to street | 2.9 |
| 177 | 17.1% | 4 | 1 | 4.7 | 7.4 * | 5.5 | 4 | 22 4 | Yes No Yes | Yes No Yes | Yes No Yes | Perpendicular to street | 6.4 |
| 178 | 9.5% | 1 | 1 | 5.5 * | 5.5 * | 4 | 4 | 12 4 4 | Yes No Yes | Yes No Yes | Yes No Yes | Perpendicular to street | 3 |
| 179 ** | 25.1% | 4 | 3 | 4 | 4 * | 4 | 4 | 12.5 4 | No | No | Yes No Yes | Perpendicular to street | 7.3 |
| 180 ** | 8.6% | 4 | 2 | 4 | 4 | 4 | 6 | 13 | Yes No Yes | Yes No Yes | Yes | Perpendicular to street | 1.9 |
| 181 ** | 5.9% | 4 | 2 | 4 | 5.5 * | 4 | 4 | 16 12 | Yes No Yes | Yes No Yes | Yes | Parallel to street | 1.7 |
| 182 ** | 5.2% | 4 | 2 | 4 | 4 | 4 | 6 | 21 | Yes No No | Yes No No | Yes No Yes | Perpendicular to street | 1.3 |
| 183 ** | 6.5% | 4 | 1 | 4 * | 4 * | 6 | 9.4 | 31 16 6 | Yes No No | Yes No No | Yes | Perpendicular to street | 1.3 |
| 184 ** | 4.6% | 4 | 1 | 10 | 4 | 4 | 6 | 16 | Yes No Yes | Yes No Yes | Yes | Perpendicular to street | 1.1 |
| 185 ** | 1.7% | 4 | 1 | 4 | 4 * | 4 | 6 | 18 12 | Yes No Yes | Yes No Yes | Yes No Yes | Perpendicular to street | 0.4 |
| 186 ** | 4% | 4 | 1 | 4 | 4 | 4 | 6 | 16 | Yes No Yes | Yes No Yes | Yes No Yes | Perpendicular to street | 1 |
| 187 ** | 10.8% | 3 | 1 | 4 | 4 | 4 | 6 | 12 | Yes No No | Yes No No | Yes No Yes | Perpendicular to street | 3.5 |
| 188 ** | 13.5% | 4 | 1 | 4 | 4 | 4 | 6 | 16 | Yes No No | Yes No No | Yes | Perpendicular to street | 4.4 |
| 189 ** | 10.3% | 4 | 1 | 4 | 4 * | 4 | 4 | 16 12 | No No Yes | No No Yes | Yes No Yes | Perpendicular to street | 3.5 |
| 190 ** | 8.1% | 4 | 1 | 4 | 4 * | 4 | 4 | 12 12 | No No Yes | No No Yes | Yes No Yes | Perpendicular to street | 1.6 |
| 191 | 6.4% | 4 | 2 | 4 | 4 * | 4 | - | 15.6 4 | Yes No No | Yes No No | Yes No Yes | Perpendicular to street | 1.5 |
| 192 ** | 13% | 4 | 1 | 10.4 | 4 | 4 | 6 | 4 | Yes No Yes | Yes No Yes | Yes | Perpendicular to street | 3.2 |
| 193 ** | 3.6% | 4 | 1 | 4 | 4 * | 4 | 6 | 12.5 4 | Yes No No | Yes No No | Yes No Yes | Perpendicular to street | 1 |
| 194 ** | 17.3% | 4 | 2 | 4 | 4 * | 4 | 6 | 12 14 | Yes No No | Yes No No | Yes No No | Perpendicular to street | 4.7 |
| 195 ** | 3.3% | 4 | 1 | 4 | 4 | 4 | 6 | 14 | Yes No No | Yes No No | Yes No No | Perpendicular to street | 0.9 |
| 196 ** | 4.4% | 4 | 3 | 4 | 5 * | 4 | 4 | 14 12 | Yes No Yes | Yes No Yes | Yes No Yes | Parallel to street | 1.2 |
| 197 ** | 4.8% | 4 | 2 | 4 | 4 | 4 | 6 | 14 | Yes No No | Yes No No | Yes No Yes | Perpendicular to street | 1.3 |
| 198 ** | 1.1% | 4 | 2 | 4 | 4 | 4 | 6 | 14 | Yes No No | Yes No No | Yes No No | Perpendicular to street | 3 |
| 199 ** | 15.9% | 4 | 1 | 4 | 4 | 4 | 6 | 16 | Yes No No | Yes No No | Yes No Yes | Parallel to street | 4.3 |
| 200 ** | 22.8% | 5 | 1 | 4 | 4 | 4 | 6 | 16 | Yes No Yes | Yes No Yes | Yes | Parallel to street | 5.5 |
| 201 ** | 15.5% | 4 | 2 | 4 | 4 | 4 | 6 | 14 | Yes No No | Yes No No | Yes No No | Parallel to street | 4.5 |
| 202 ** | 15.8% | 4 | 2 | 5 | 4 | 4.5 | - | 14 16 | Yes No Yes | Yes No Yes | Yes | Parallel to street | 4.2 |
| 203 ** | 17.3% | 1 | 0 | 4 | 4 * | 4 | 4 | 16 16 | Yes No No | Yes No No | Yes Yes No | Parallel to street | 4.4 |
| 204 | 24.1% | 1 | 1 | 4 | 4 | 4 | 6 | 24 | Yes No No | Yes No No | Yes No Yes | Parallel to street | 7.6 |
| 205 | 22.8% | 4 | 4 | 7.7 | 7.4 * | 4 | 4 | 20 18 | Yes No No | Yes No No | Yes No Yes | Parallel to street | 7.7 |
| 206 | 19.2% | 5 | 3 | 6.8 * | 5 * | 4 | 4 | 14 16 | Yes No Yes | Yes No Yes | Yes No Yes | Parallel to street | 6.5 |
| 207 | 10.3% | 4 | 3 | 4 | 4 | 4 | 6 | 16 | Yes No Yes | Yes No Yes | Yes No Yes | Parallel to street | 3.5 |
| 208 | 8.6% | 4 | 2 | 4 | 4 | 4 | 6 | 16 | Yes No Yes | Yes No Yes | Yes No Yes | Parallel to street | 2.9 |
| 209 | 11.5% | 4 | 2 | 4 | 4 | 4 | 6 | 16 | Yes No Yes | Yes No Yes | Yes No Yes | Parallel to street | 3.9 |
| 210 | 19.8% | 4 | 3 | 4 | 4 | 4 | 6 | 16 | Yes No No | Yes No No | Yes No Yes | Perpendicular to street | 6.7 |
| 211 | 20.4% | 4 | 3 | 4 | 4 | 4 | 6 | 16 | Yes No No | Yes No No | Yes No Yes | Perpendicular to street | 7.2 |
| 212 | 19.7% | 4 | 3 | 5.8 | 5 * | 4 | 4 | 16 4 | Yes No No | Yes No No | Yes No Yes | Perpendicular to street | 7 |
| 213 | 14.9% | 4 | 3 | 4 | 4 * | 4 | 8 | 16 4 | Yes No Yes | Yes No Yes | Yes No Yes | Parallel to street | 3.7 |
| 214 | 13.2% | 4 | 2 | 4 | 4 | 4 | 6 | 16 | Yes No No | Yes No No | Yes No Yes | Parallel to street | 3.6 |
| 215 | 10.3% | 2 | 1 | 4 | 5 * | 4 | 4 | 16 12 | Yes No Yes | Yes No Yes | Yes Yes No | Parallel to street | 2.8 |
| 216 | 11.4% | 4 | 1 | 4 | 4 | 4 | 6 | 12 | No No Yes | No No Yes | Yes No No | Parallel to street | 3.1 |
| 217 | 5.9% | 4 | 1 | 4 | 4 * | 4 | 6 | 12.5 | Yes No Yes | Yes No Yes | Yes Yes No | Parallel to street | 1.6 |
| 218 | 11.2% | 4 | 2 | 4 | 4 * | 4 | 6 | 12 | Yes No Yes | Yes No Yes | Yes No No | Parallel to street | 3 |
| 219 | 11.2% | 4 | 2 | 4 | 4 * | 4 | 6 | 12 | Yes No Yes | Yes No Yes | Yes No No | Parallel to street | 3 |
| 220 | 7.9% | 4 | 3 | 4 | 4 * | 4 | 4 | 14 12 | Yes No Yes | Yes No Yes | Yes | Parallel to street | 2.1 |
* The side setback is a second front setback. ** The south elevation of the basements consists of a free-standing wall.  The number of basement floors exceeds the height of the slope. The number of basement floors exceeds the height of the slope.  Shaded most of the time. Shaded most of the time.  A street width of 12 m or less. A street width of 12 m or less.  The number of basement floors and the height of the slope. The number of basement floors and the height of the slope.  The slope is 20% or more. The slope is 20% or more.  The building has no effect on the shadow at any time. The building has no effect on the shadow at any time.  The building has an effect on the shadow all the time. The building has an effect on the shadow all the time. | |||||||||||||
Appendix B


Appendix C


References
- Al-Salaymeh, A. Modelling of Global Daily Solar Radiation on Horizontal Surfaces for Amman City. Emir. J. Eng. Res. 2006, 11, 49–56. [Google Scholar]
- Kumar, A. Impact of Building Regulations on Indian Hill Towns. HBRC J. 2016, 12, 316–326. [Google Scholar] [CrossRef]
- Ching, D.K. Architecture: Form, Space, and Order, 3rd ed.; John Wiley & Sons: Mississauga, ON, Canada, 2007. [Google Scholar]
- Odabaşıoğlu, S. Effects of Colored Lighting on the Perception of Interior Spaces. Master’s Thesis, Bilkent University, Ankara, Turkey, 2009. Available online: http://hdl.handle.net/11693/14821 (accessed on 1 June 2018).
- Boubekri, M. Life cycle cost analysis of building re-lamping alternatives. J. Renew. Sustain. Energy 2012, 4, 023119. [Google Scholar] [CrossRef]
- Mirrahimi, S.; Ibrahim, N.L.; Surat, M. Effect of Daylighting on Student Health and Performance. 2013. Available online: https://www.scribd.com/document/366020822/Effect-of-Daylighting-on-Student-Health-and-Performance (accessed on 1 June 2018).
- Van Bommel, W.J.M.; Van den Beld, G.J. Lighting for work: A review of visual and biological effects. Light. Res. Technol. 2004, 36, 255–266. [Google Scholar] [CrossRef]
- Zhang, L.; Wang, Y.; Chen, H. Daylight equity and mental health in mountainous cities: A case study of Chongqing, China. J. Urban Health 2022, 99, 567–582. [Google Scholar]
- Al-Masri, W.; Al-Haddad, H. The impact of topography on daylight access in low-income urban neighborhoods. J. Urban Des. 2023, 28, 135–150. [Google Scholar]
- Baker, N.; Steemers, K. Daylight Design of Buildings; Routledge: Abingdon, UK, 2002. [Google Scholar]
- Koch-Nielsen, H. Stay Cool: A Design Guide for the Built Environment in Hot Climates; Routledge: Abingdon, UK, 2013. [Google Scholar]
- Fernández, J.; Martínez, R.; López, M. Energy efficiency and daylight optimization in sloped urban environments. Sustain. Cities Soc. 2023, 87, 104230. [Google Scholar]
- Khan, A.; Ahmed, S. Social equity in urban design: Addressing the needs of marginalized communities in hilly terrains. J. Urban Plan. Dev. 2022, 148, 04522035. [Google Scholar]
- Heydarian, A.; Pantazis, E.; Carneiro, J.P.; Gerber, D.; Becerik-Gerber, B. Lights, building, action: Impact of default lighting settings on occupant behaviour. J. Environ. Psychol. 2016, 48, 212–223. [Google Scholar] [CrossRef]
- Columbia Square Project. Environmental Impact Analysis: Aesthetics, Views, Light/Glare, and Shading. 2009. Available online: https://planning.lacity.gov/eir/columbiasquare/deir/files/_A.%20Aesthetics,%20Views,%20Light_Glare,%20and%20Shading.pdf (accessed on 1 June 2018).
- Hui, C.M. Low energy building design in high density urban cities. Renew. Energy 2001, 24, 627–640. [Google Scholar] [CrossRef]
- Vargas-Cuervo, G.; Hernández-Peña, Y.T.; Zafra-Mejía, C.A. Challenges for sustainable urban planning: A spatiotemporal analysis of complex landslide risk in a Latin American megacity. Sustainability 2024, 16, 3133. [Google Scholar] [CrossRef]
- Salameh, M.M.; Touqan, B.A.; Awad, J.; Salameh, M.M. Heritage conservation as a bridge to sustainability assessing thermal performance and the preservation of identity through heritage conservation in the Mediterranean city of Nablus. Ain Shams Eng. J. 2022, 13, 101553. [Google Scholar] [CrossRef]
- Greater Amman Municipality. Building and Planning Regulations for the City of Amman. 2017. Available online: https://www.ammancitygis.gov.jo/ammanexplorer/ (accessed on 1 June 2018).
- Rafiadeh, N. Site Selection and Physical Proportions in Tall Buildings. Asian J. Civ. Eng. (Build. Hous.) 2005, 6, 583–595. [Google Scholar]
- Rodrigues Marques Sakiyama, N.; Frick, J.; Bejat, T.; Garrecht, H. Using CFD to evaluate natural ventilation through a 3D parametric modeling approach. Energies 2021, 14, 2197. [Google Scholar] [CrossRef]
- Al-Mumin, A.; Khattab, O.; Sadek, S. Daylighting in Architecture: A Case Study of Amman, Jordan. J. Archit. Plan. Res. 2003, 20, 234–248. [Google Scholar]
- Abu-Ghazalah, S.; Al-Salaymeh, A. The Impact of Urban Geometry on the Microclimate of Amman, Jordan. Build. Environ. 2010, 45, 801–812. [Google Scholar]


| Residential Zone | Plot Area/m2 | Percentage of Footprint | Front Setback/m | Side Setback/m | Rear Setback/m |
|---|---|---|---|---|---|
| A | 1000 | 39% | 5 | 5 | 7 |
| B | 750 | 45% | 4 | 4 | 6 |
| C | 500 | 51% | 4 | 3 | 4 |
| D | 300 | 55% | 3 | 2.5 | 2.5 |
| Day (Time) | |||||||||
|---|---|---|---|---|---|---|---|---|---|
| 21 March | 21 September | 21 December | |||||||
| 8:00 am | 12:00 pm | 4:00 pm | 8:00 am | 12:00 pm | 4:00 pm | 8:00 am | 12:00 pm | 4:00 pm | |
| Residential Zone A | Max distance = 7 m (rear setback) × for 2 lots = 14 | ||||||||
| Flat slope | 7.54 | 7.52 | 7.61 | 7.05 | 7.44 | 7.74 | 29.4 | 17.53 | 63.96 |
| 15% slope | 9.99 | 9.80 | 10.00 | 9.39 | 9.44 | 9.22 | 31.12 | 25.83 | 68.58 |
| 20% slope | 10.82 | 10.64 | 10.74 | 10.17 | 10.29 | 12.74 | 51.50 | 29.91 | 69.62 |
| 30% slope | 12.68 | 12.39 | 12.72 | 11.82 | 11.92 | 11.71 | 62.5 | 36.97 | 92.65 |
| Residential Zone B | Max distance = 6 m (rear setback) × for 2 lots = 12 | ||||||||
| Flat slope | 7.86 | 7.68 | 7.76 | 6.36 | 7.48 | 7.28 | 29.41 | 17.35 | 63.81 |
| 15% slope | 10.02 | 9.96 | 10.12 | 9.55 | 9.70 | 9.36 | 46.23 | 26.30 | 78.92 |
| 20% slope | 12.00 | 10.07 | 12.95 | 9.66 | 9.78 | 9.47 | 48.95 | 28.34 | 80.32 |
| 30% slope | 15.78 | 12.03 | 15.87 | 14.93 | 11.46 | 14.81 | 60.68 | 35.65 | 90.60 |
| Residential Zone C | Max distance = 4 m (rear setback) × for 2 lots = 8 | ||||||||
| Flat slope | 7.61 | 7.58 | 8.00 | 7.23 | 7.23 | 7.20 | 29.36 | 17.43 | 63.92 |
| 15% slope | 10.41 | 8.91 | 8.36 | 9.87 | 8.60 | 9.76 | 39.85 | 23.46 | 70.56 |
| 20% slope | 11.57 | 9.71 | 11.56 | 10.96 | 9.32 | 10.74 | 44.33 | 26.10 | 74.92 |
| 30% slope | 13.78 | 11.28 | 13.87 | 13.15 | 10.90 | 12.94 | 53.11 | 31.32 | 83.51 |
| Residential Zone D | Max distance = 2.5 m (rear setback) × for 2 lots = 5 | ||||||||
| Flat slope | 7.92 | 7.71 | 7.48 | 7.26 | 7.43 | 7.20 | 29.61 | 17.38 | 64.43 |
| 15% slope | 12.00 | 10.15 | 12.26 | 9.02 | 9.24 | 6.82 | 36.45 | 22.04 | 76.75 |
| 20% slope | 7.66 | 11.08 | 12.26 | 7.86 | 10.26 | 11.12 | 31.03 | 16.92 | 68.2 |
| 30% slope | 13.78 | 14.06 | 6.82 | 6.61 | 9.26 | 9.07 | 64.82 | 17.45 | 70.75 |
 .
.| Residential Zone | Front Setback | Side Setback | Rear Setback | Max Height | ||||
|---|---|---|---|---|---|---|---|---|
| Before | After | Before | After | Before | After | Before | After | |
| A | 5 | 5 | 5 | 5 | 7 | 6 | 15 | 16 |
| B | 4 | 4 | 4 | 4 | 6 | 5 | ||
| C | 4 | 4 | 3 | 3 | 4 | 3 | ||
| D | 3 | 3 | 2.5 | 2.5 | 2.5 | 3 | ||
| Guideline | Description | Implementation |
|---|---|---|
| Dynamic Setbacks | Setbacks increase with slope steepness to ensure adequate daylight penetration. | 15 m for flat terrain, 20 m for 15% slopes, 26.4 m for 30% slopes. |
| Restrictions on Basement Habitation | Limit basement habitation in areas with slopes >20% to prevent poor living conditions. | Mandate light wells and ventilation systems where basements are necessary. |
| Optimized Street Orientation | Align streets with the sun’s path to maximize daylight access. | Prioritize a north–south orientation in new developments. |
| Flat slope | ||
| Height of building | Distance (rear setback) | Diagram |
| 3 m | 2.8 m | 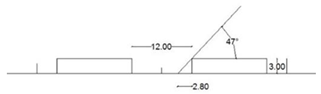 |
| 6 m | 5.2 m |  |
| 9 m | 8.3 m | 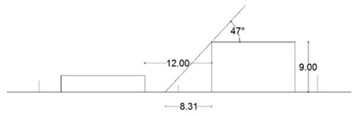 |
| 12 m | 11.7 m | 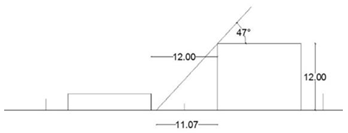 |
| 15 m | 13.8 m |  |
| 20% slope | ||
| 3 m | 11.0 m | 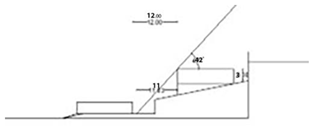 |
| 6 m | 12.9 m | 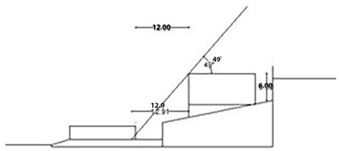 |
| 9 m | 16.6 m | 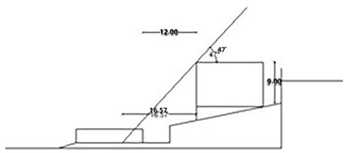 |
| 12 m | 19.3 m | 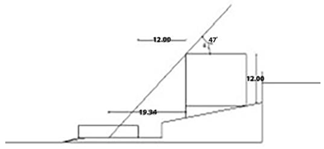 |
| 15 m | 22.1 m |  |
| 30% slope | ||
| 3 m | 15.3 m |  |
| 6 m | 17.3 m | 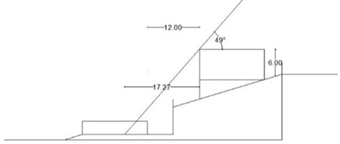  |
| 9 m | 20.8 m | |
| 12 m | 23.6 m | 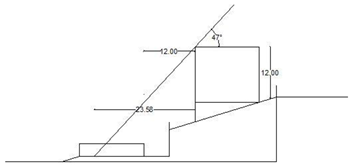 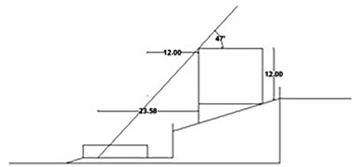 |
| 15 m | 26.4 m |  |
Disclaimer/Publisher’s Note: The statements, opinions and data contained in all publications are solely those of the individual author(s) and contributor(s) and not of MDPI and/or the editor(s). MDPI and/or the editor(s) disclaim responsibility for any injury to people or property resulting from any ideas, methods, instructions or products referred to in the content. |
© 2025 by the authors. Licensee MDPI, Basel, Switzerland. This article is an open access article distributed under the terms and conditions of the Creative Commons Attribution (CC BY) license (https://creativecommons.org/licenses/by/4.0/).
Share and Cite
AlBaik, M.; Muhsen, R.; Al-Azhari, W.W. Reconciling Urban Density with Daylight Equity in Sloped Cities: A Case for Adaptive Setbacks in Amman, Jordan. Buildings 2025, 15, 2071. https://doi.org/10.3390/buildings15122071
AlBaik M, Muhsen R, Al-Azhari WW. Reconciling Urban Density with Daylight Equity in Sloped Cities: A Case for Adaptive Setbacks in Amman, Jordan. Buildings. 2025; 15(12):2071. https://doi.org/10.3390/buildings15122071
Chicago/Turabian StyleAlBaik, Majd, Rabab Muhsen, and Wael W. Al-Azhari. 2025. "Reconciling Urban Density with Daylight Equity in Sloped Cities: A Case for Adaptive Setbacks in Amman, Jordan" Buildings 15, no. 12: 2071. https://doi.org/10.3390/buildings15122071
APA StyleAlBaik, M., Muhsen, R., & Al-Azhari, W. W. (2025). Reconciling Urban Density with Daylight Equity in Sloped Cities: A Case for Adaptive Setbacks in Amman, Jordan. Buildings, 15(12), 2071. https://doi.org/10.3390/buildings15122071