Article

Study on the Influence of Delay Time on the Propagation Law of Adjacent Blast Hole Cracks

1
School of Civil and Resources Engineering, University of Science and Technology Beijing, Beijing 100083, China
2
School of Mechanics and Civil Engineering, China University of Mining & Technology (Beijing), Beijing 100083, China
3
Panzhihua Iron and Steel Group Mining Co., Ltd., Panzhihua 617000, China
*
Author to whom correspondence should be addressed.
Buildings 2025, 15(12), 2030; https://doi.org/10.3390/buildings15122030
Submission received: 27 April 2025 / Revised: 30 May 2025 / Accepted: 6 June 2025 / Published: 12 June 2025
(This article belongs to the Section Building Structures)

Abstract

In open-pit bench pre-splitting blasting, the interaction of explosion-induced stress waves between blast holes is essential for safeguarding the rear rock mass. This study utilizes the caustic method to examine the propagation velocity of explosion-induced cracks, the stress intensity factor at the crack tip, and the final morphology of cracks between adjacent blast holes with varying delay times. Field pre-splitting blasting experiments were carried out to validate these effects. The experimental results reveal that, for short inter-hole delay times (0–12 μs), a “hook-like” crack intersection zone emerges between blast holes. Changes in delay time influence the patterns of crack propagation, leading to deviations in the propagation direction of cracks in subsequent blast holes due to the combined effects of stress waves and cracks from preceding holes. The fracture mechanism evolves from pure Mode I (tensile) to a mixed Mode I-II (tensile-shear). Vibration signals from the field blasting tests were analyzed using the variational mode decomposition (VMD) method. The findings indicate that optimized inter-hole delay times can reduce peak particle velocity (PPV) by 18.7–23.4% compared to simultaneous initiation, thereby significantly minimizing damage to the rear rock mass, a crucial factor for maintaining slope stability.

1. Introduction

The drilling and blasting method utilizes the instantaneous release of explosive energy to achieve effective rock fragmentation. It is widely used in various fields such as mining engineering [1,2,3], transportation engineering [4,5], hydropower, nuclear power infrastructure, etc. [6,7]. Drilling pressure, blockage material, boundary conditions, delay time, and complex stress wave interaction [8,9,10] play important roles. In engineering practice, rock blasting requires multiple boreholes to detonate simultaneously or in a delayed manner. The interaction of stress waves in multi-hole blasting is an essential factor affecting the blasting effect. Rossmanith et al. [11,12] conducted a simplified two-dimensional model, demonstrating that the superposition of blasting stress waves positively impacts rock fragmentation in smooth blasting and bench blasting. In addition, studies by McKinstri et al. [13], Lewis et al. [14], and Candela et al. [15] have shown that delay time can control the superposition effect of blasting stress waves between boreholes, effectively reducing blasting vibration velocity and improving rock fragmentation. Therefore, many researchers and previous studies believe that the superposition of stress waves between boreholes enhances the efficiency of rock fragmentation in rock blasting.
Delayed blasting can change the stress wave superposition state between holes, thereby affecting the control of explosion energy, ultimately affecting the crack propagation mode and rock fragmentation effect [8,16]. Changping Yi et al. [17] used theoretical analysis methods to analyze the stress field between adjacent boreholes and their extension lines under the assumptions of infinite detonation velocity and infinite charge length, with simultaneous detonation and delayed detonation of 1 ms. Hong Liangtang [18] conducted a double-hole step blasting model test, using a high-speed camera to record the fracture process of the specimen. The whole field strain of the step slope was analyzed using three-dimensional digital image correlation (3D-DIC) technology. The experimental results show that with the increase in delay time, the development direction of the strain concentration zone changes from horizontal to vertical, and the fragmentation of the stepped slope changes from horizontal cracks to vertical cracks. Kewei Liu [16] studied the effect of delay time on merging cracks between two boreholes in contour blasting using physical experiments and numerical calculation methods. The results indicate that in the delayed blasting of two holes, the stress superposition zone near the collision point of the stress wave generates local stress enhancement and approaches the rear blasting hole. The superposition of stress is beneficial for the cracks generated by the explosion to propagate along the borehole connection line preferentially, and the cracks in the later detonation hole extend further than those in the first detonation hole. When the delay time allows the stress wave to propagate approximately through the hole spacing, the optimal crack merging in the contour blasting archive occurs.
Delayed blasting can change the spectral distribution and energy characteristics of blasting vibration. Using methods such as HHT and EMD [19,20,21,22], the amplitude and frequency characteristics of blasting vibration waveforms can be analyzed, and the delay time of accurate short delay blasting signals can also be identified. Aldas et al. [23] used the blasting vibration test system and high-speed camera system to study the relationship between the delay time and the peak particle velocity (PPV), vibration amplitude, and vibration frequency in the stripping operation of the Demir Export Kangal/Sivas opencast coal mine in Türkiye. They determined the best delay time for blasting. Zhang Xiangyu [24] studied the frequency distribution and energy characteristics of blasting under different delay times and distances. The research results indicate that the influence mechanism of frequency energy transfer is the free surface generated by the first blasting, and the stress waves generated by subsequent blasting are superimposed with the reflected stress waves and initial stress waves, which will shorten the rise time and duration of the superimposed stress waves on site. Moreover, the faster the rise time of stress waves, the higher the high-frequency ratio. The longer the duration of stress waves, the greater the proportion of low frequencies. Wang Chenguang [25] conducted four different blasting vibration tests using digital electronic detonators and ordinary detonating tube detonators as controls in a flood discharge and sand removal tunnel, proving that digital detonators can significantly reduce the intensity of blasting vibration and increase the main frequency of blasting vibration.
Based on the research on pre-splitting blasting in domestic and foreign literature, the results show that the delay time between holes significantly impacts the effectiveness of pre-splitting blasting. However, research on the mechanisms of inter-hole crack formation and the selection of optimal delay times remains insufficiently explored. Therefore, based on the dynamic caustic test, the crack propagation characteristics between two adjacent blast holes under different delay times are quantitatively studied. In addition, the spectrum analysis of the on-site blasting vibration signal was carried out using the VMD [26,27,28,29] signal evaluation method, verifying the influence of the blasting vibration generated by the hole-by-hole detonation and simultaneous detonation on the protected rock mass. The experimental results have guiding significance for the pre-cracking blasting of large-scale open-pit mines to a certain extent.

2. Experimental Setup and Design

2.1. Experimental Device

The explosive loading dynamic caustics experimental system consists of the following parts, as shown in Figure 1. When the laser light source emitted by the laser passes through the aperture stop and beam expander, the laser beam reaches the concave reflection mirror, which collimates the light into parallel light. The parallel light is vertically incident on the explosive loading specimen. At this point, the explosive detonates, and the specimen is subjected to stress concentration caused by the explosive load, resulting in singular points. The thickness at this location becomes uneven, and the transmittance and refractive index of the specimen change. The refracted light passing through the specimen will deviate from the parallel state. The deviated light will form an image shadow area with uneven light intensity distribution on the reference plane at a distance of Z0 from the specimen on the propagation path, known as a focal spot; the light rays deviating from the parallel state converge and reflect at the focal length of the concave mirror onto the flat mirror. The flat mirror reflects the image in the test area to the high-speed camera, which records the propagation behavior of the explosion crack.

2.2. Experimental Principle

2.2.1. Calculation of Crack Propagation Speed

The captured caustic spot images are imported into Photoshop when calculating the crack propagation speed. By measuring the motion trajectory coordinates of the geometric center of the focal spot at the crack tip in the images, the center difference method is used to calculate the crack propagation speed [30,31]:
v t = d L ( t ) d t L ( t + t ) L ( t t ) 2 t
where vt is the crack propagation speed, m/s; L(t − ∆t) and L(t + ∆t) are the displacement of crack propagation trajectories in adjacent front and rear images, m; and ∆t is the interval time set for shooting, s.

2.2.2. Dynamic Stress Intensity Factor

The dynamic stress intensity factor indicates the dynamic stress intensity at the crack tip, and the stress intensity factors KI and KII at the crack tip can be expressed as follows [32,33,34]:
K I = 2 2 π 3 g 5 / 2 Z 0 d e f f C t D max 5 / 2 K II = μ K I
where KI and KII represent the dynamic stress intensity factors of type I and type II cracks, respectively, MN/m3/2; Dmax is the maximum diameter of the caustic spot along the crack direction, m; Z0 is the distance from the reference plane to the specimen plane, m; deff is the PMMA specimen thickness, mm; Ct is the stress optical constant of the PMMA specimen, m2/N; μ is the proportional coefficient of the stress intensity factor, obtained from the relationship curve between (DmaxDmin)/Dmax and (KII/KI), with μ = 0.21; G is the numerical coefficient describing the relationship between the characteristic length Dmax and the initial radius of the caustics r0, Dmax = gr0, and g = 3.17 for type I cracks, as shown in Figure 2.
Figure 3 shows the caustic curves at the crack tip for three types of I-II composite crack stress intensity factors with proportional coefficients of μ = −0.2, μ = 0, and μ = 0.2. When μ = 0, the caustic curves of the crack are symmetrical with the crack diameter, and the intersection of the caustic curves is on the crack diameter. When μ = −0.2, the caustics curve upwards, and the intersection of the caustics converges below the crack diameter, KII < 0. When μ = 0.2, the caustics curve downwards, and the intersection of the caustics converges above the crack diameter, with KII > 0.

2.3. Experimental Plan Design

The experiment used a 400 mm × 300 mm × 5 mm PMMA plate, and two holes with a diameter of 8 mm were prepared by laser in the specimen, with a distance of 100 mm between the two holes. The arrangement of the holes is shown in Figure 4. Using a plastic straw with an outer diameter of 5 mm, 120 mg of Pb(N3)2 explosive is loaded into the straw as the detonating charge. The detonating charge is placed in the center of the borehole and fixed with tape at the bottom to form a center uncoupled charge structure, with a decoupling coefficient Rd of 1.67.
Studying the propagation of inter-hole cracks in adjacent boreholes under different inter-hole delay times, a large number of dynamic caustics experiments were conducted in the early stage. It was found that in the same PMMA medium, the P-wave velocity is about 2320 m/s, and the time t = L/Cp = 43 μs for the P-wave from the first borehole explosion to propagate to the center of the adjacent borehole. According to the previous research conclusions, the strain and fractal dimension between holes exhibit a power function characteristic. Therefore, the delay time between holes also gradually increases according to the power function rule. The set delay times between holes are 5%, 12%, 19%, 28%, 58%, and 100% of the P-wave propagation time between holes. The experimental parameters are shown in Table 1.

3. Experimental Results

The experiment was based on the caustics theory to investigate crack propagation characteristics between holes under different delay times. It used a digital laser dynamic caustics testing system to conduct experimental research on crack propagation in double blast holes with varying delay times. The dynamic stress intensity factor and crack propagation speed of blast-induced cracks during dynamic propagation were compared and analyzed over time.

3.1. Analysis of Caustic Line Images

For example, using experimental images from Experiment 3. From Figure 5, at t = 23.07 μs, the two detonation holes generate opposing wavefronts that propagate outward in a concentric circle manner, meeting and overlapping in the middle region of the two holes. At t = 30.76 μs, the caustic spots appeared in both the left and right holes. In the middle area between the holes, under the compressive stress of the explosion stress wave, the explosion stress between the holes overlapped to produce a “diamond-shaped” bright stripe envelope area. At t = 38.45 μs, the caustic spots generated by the explosion of the two holes begin to expand outward, and the front edge of the explosion stress wave P wave generated by the explosion of the right hole reaches the vicinity of the caustic spots of the left blast hole. Taking the caustic spots as the object, the morphological changes of the caustic spots are analyzed in detail. At this point, the ratio of the transverse diameter to the longitudinal diameter of the caustic spot is DT/DL = 1.0, and the stress wave interference area in the middle of the borehole increases. At t = 46.14 μs, the stress field of the left blast hole is affected by the explosion stress wave of the right blast hole, significantly changing the stress state of the main crack generated by the explosion of the left blast hole. The caustic spots at the crack tip are subjected to the Bora stress of the explosion stress of the right blast hole, and the caustic spots show a “transverse flattening” shape, DT/DL = 1.429. At this point, the stress wave generated by the explosion of the left blast hole also reaches the vicinity of the focal spot at the crack tip of the right blast hole. At t = 53.83 μs, the front edge of the explosion stress wave in the right borehole has passed over the tip of the main crack between the left boreholes, and the shape of the focal spot at the crack tip is “elliptical”, DT/DL = 1.050, and the interference area between the stress waves of the two boreholes is larger. At t = 61.52 μs, the stress wave from the explosion on the right side of the borehole immediately followed and acted on the crack tip on the left side of the borehole, causing a sudden decrease in the focal spot, DT/DL = 0.769. At this point, the stress intensity factor at the crack tip is relatively low. When t = 69.21–76.90 μs, the front-end explosion stress wave passes over the crack tip, and the subsequent lower intensity explosion stress wave acts on the caustic spot again. DT/DL increases from 0.778 to 1.0, and the type of caustic spot changes from I-II composite caustic spot to type I caustic spot. At t = 84.59 μs, the explosion stress wave from the right borehole acts again on the crack tip of the left borehole, causing the caustic spot to be “longitudinally elongated”, DT/DL = 0.813. At t = 92.28–115.35 μs, the morphology of the caustic spots at the tip of the left blast hole crack remained unchanged compared to the previous image, and the DT/DL decreased from 1.0 to 0.941, while the crack continued to propagate at a low speed. At t = 138.42 μs, the caustic spots at the crack tips between the two holes are about to meet, and the crack tips attract each other. The diameters of both caustic spots increase, indicating an increase in the stress intensity factor at the main crack tip and an increase in stress concentration, DT/DL = 1.056. The two caustic spots are not directly connected but show a “hand-in-hand” shape in the lower left and upper right. Currently, the stress field at the crack tip is a composite stress field composed of normal and shear stress, and the stress concentration at the crack tip is complex. At t = 146.11 μs, the two caustic spots gradually began to separate and continued to propagate towards each other. Both cracks deviated when they met and separated, DT/DL = 0.957. At t = 153.80 μs, the two separated caustic spots continued to propagate towards the crack surface that had already formed on the other side, and the crack tip showed a significant deflection, DT/DL = 1.0. At t = 230.70 μs, the focal spot stops propagating and the crack stops, with DT/DL = 0.944 at the crack stop.
According to the traditional theory of caustics, when the ratio of the transverse diameter to the longitudinal diameter DT/DL of the caustic spot is a critical value of 1.056, the shape of the caustics is elliptical, and the tip of the Type I crack is subjected to simple tensile action. Figure 6 shows the variation curve of the diameter DT/DL of the focal spot with time when the inter-hole delay is 5 μs. Figure 6 shows a significant change in the DT/DL of the focal spot within 30 μs to 60 μs. The main crack is strongly overlapped by the front end of the P-wave of the first blast hole, and the pressure and tension of the P-wave cause the shape of the caustic spot to rapidly change from “longitudinal elongation” to “transverse flattening”. As the crack propagates, the tensile effect at the tail of the P-wave weakens, and the DT/DL of the caustic spot diameter is less than the critical value, resulting in a compressed state at the crack tip. At 138 μs to 146 μs, the caustic spots at the crack tip meet, and the diameter of the caustic spots increases, but the diameter DT/DL fluctuates around 1.056. The shape of the caustic spots does not change significantly, indicating that the effect of the stress wave from the first blast hole explosion is further weakened, and the crack deflects towards the direction of the free surface where the crack has already formed. The propagation of the crack is still dominated by the explosion stress of the subsequent blast hole itself, and the shape of the caustic spots at the crack tip is strongly affected by the front end of the subsequent blast stress wave, while the tail end is weaker.

3.2. Main Crack Propagation Speed Between Holes

Figure 7 shows the velocity time curve of the principal crack propagation between the twin holes simultaneously detonated. It can be seen from the figure that the velocity curves of the principal cracks L1 and R1 are similar. The initial propagation velocities of the principal cracks L1 and R1 between the blast holes are 292.59 m/s and 346.87 m/s, respectively, and then quickly reach the first peak velocities of 425.32 m/s and 491.98 m/s. As the cracks propagate and the explosion energy decays, the crack propagation velocity oscillates and decreases. At t = 123.04 μs, the tips of the two cracks are about to meet, and the propagation speed of the L1 and R1 principal cracks decreases to valley values of 180.02 m/s and 162.55 m/s, respectively. At t = 130.73 μs, the caustic spots at the crack tips between the two holes meet, and the propagation speed of the L1 and R1 principal cracks suddenly increases from the valley value to 486.60 m/s and 422.63 m/s, respectively. At t = 138.42 μs, the caustic spots at the tips of the two cracks gradually began to separate after meeting, and the principal cracks L1 and R1 reached the second peak velocities of 560.55 m/s and 587.87 m/s, respectively. As the principal cracks between the holes gradually separate, the crack propagation speed also rapidly decreases. At t = 161.49 μs, the two cracks stop, and the speed at the time of stopping is 110.99 m/s.
Figure 8 shows the velocity time curves of the principal crack propagation between two holes with different delay times for detonation. It can be observed from the figure that when the delay time is 0–8 μs, the velocity time curves of the left and right holes are almost the same. When the delay time reaches 12 μs, the velocity time curves of the left and right holes show significant differences. Taking Δt = 12 μs as an example, as shown in (d) of the figure, it can be found that the effect of delayed detonation between holes causes the tip of the principal crack L1 in the later detonation hole to be subjected to the superposition of explosive stress waves, and the overall crack propagation velocity is smaller than the fluctuation range of the principal crack R1 in the first detonation hole. At t = 45 μs, the principal crack R1 initiates first with an initial propagation speed of 83.86 m/s. At t = 80 μs, the principal crack L1 initiates with an initial propagation speed of 240.82 m/s, and the initial propagation speed of the principal crack L1 is significantly greater than that of the principal crack R1. Subsequently, the principal cracks L1 and R1 rapidly reached their first peak velocities of 282.92 m/s and 374.05 m/s, respectively. As the cracks expanded and the explosion energy decreased, the crack propagation velocity oscillated and decreased. At t = 80 μs, the first valley value of the principal crack R1 is 120.25 m/s; at t = 95 μs, the first valley value of the main crack L1 is 155.37 m/s. The valley velocity of L1 is also greater than that of the principal crack R1. Subsequently, the propagation speeds of the two principal cracks oscillated and changed. At t = 180 μs, the tips of the two cracks were about to meet. At this time, the propagation speeds of the L1 and R1 principal cracks reached their peak values of 314.24 m/s and 283.54 m/s, respectively. As the principal cracks between the holes gradually separate, the crack propagation speed also rapidly decreases. At t = 220 μs, the principal crack L1 stops first, with a stopping speed of 29.43 m/s. The main crack, R1, oscillates, with a stopping speed of 166.78 m/s at t = 280 μs.

3.3. Stress Intensity Factor at the Tip of the Main Crack Between Holes

Figure 9 shows the stress intensity factor curve at the tip of the principal crack between the holes. The figure shows that the dynamic stress intensity factor K of the principal cracks L1 and R1 shows a similar trend. The initial stress intensity factors at the tips of the two cracks are 0.75 MN/m3/2 and 1.42 MN/m3/2, respectively, and then quickly reach the first peak stress intensity of 1.08 MN/m3/2 and 1.57 MN/m3/2. As the cracks propagate and the explosion energy decays, the stress intensity factor oscillates and decreases. The principal crack L1 reached a valley value of 0.62 MN/m3/2 at t = 69.21 μs, oscillating repeatedly. The principal crack R1 remained stable and extended at 0.91 MN/m3/2 from t = 84.59 to 115.35 μs. At t = 123.04 μs, the tips of the principal cracks L1 and R1 are about to meet, and the stress intensity factor begins to increase. At t = 130.73 μs, the caustic spots at the crack tip meet. Due to the stress wave generated by the explosion, a singular stress field is formed at the tips of the two principal cracks. The shape of the caustic spot at the crack tip is distorted, and the stress intensity factor continues to increase. At t = 138.42 μs, the caustic spots at the tips of the two cracks gradually separated after meeting, and the stress intensity factors at the crack tips reached peak values of 1.57 MN/m3/2 and 1.52 MN/m3/2 respectively; As the principal cracks between the holes gradually separate, the stress intensity factor also rapidly decreases. At t = 161.49 μs, the two cracks stop propagating, and the stress intensity factors at crack arrest are 0.82 MN/m3/2 and 0.62 MN/m3/2, respectively.
When Δt = 12 μs, as shown in Figure 10d, at t = 40 μs, the principal crack R1 first cracks and appears as a caustic spot, with an initial stress intensity factor of 0.67 MN/m3/2. At t = 75 μs, the principal crack L1 cracks, with an initial stress intensity factor of 0.77 MN/m3/2. Subsequently, the principal cracks L1 and R1 rapidly reached their first peak intensities of 1.11 MN/m3/2 and 1.26 MN/m3/2, respectively. As the cracks expanded and the explosion energy decreased, the stress intensity factor at the crack tip began to oscillate and decrease. At t = 70 μs, the first valley value of the main crack R1 is 0.48 MN/m3/2, and at t = 95 μs, the first valley value of the main crack L1 is 0.79 MN/m3/2. Subsequently, the stress intensity factor at the tip of the principal crack began to oscillate and increase. At t = 150 μs, the stress intensity factor of the principal crack R1 reached a peak of 1.93 MN/m3/2 under the quasi-static action of explosive gas and then rapidly decayed to 1.35 MN/m3/2. At t = 180 μs, the tips of the two cracks are about to meet, and the stress intensity factors of the principal cracks L1 and R1 reach their second peak values of 1.61 MN/m3/2 and 1.52 MN/m3/2, respectively. As the principal crack gradually separates between the holes, the stress intensity factor at the crack tip also rapidly decreases. At t = 220 μs, the principal crack L1 stops first, with a stress intensity factor of 1.06 MN/m3/2 at the time of stopping. The main crack R1 continues to oscillate and decreases and stops at t = 280 μs, with a stress intensity factor of 0.79 MN/m3/2 at the time of stopping.

3.4. Inter-Hole Crack Morphology

The post-explosion photo of the double hole delay is shown in Figure 11. The right blast hole is detonated first. It can be seen that the crack morphology between the holes is similar when delayed for 2 μs, 5 μs, 8 μs, and 12 μs. The crack in the right blast hole that detonated first is on top, and the crack in the left blast hole that detonated later is on the bottom. The central area between the holes forms a crack intersection zone. With the increase in delay, the vertical spacing and intersection area of the two interacting cracks gradually increase and move towards the direction of the rear blast hole. During the propagation of the two cracks, they were affected by the stress wave of the rear blast hole explosion, resulting in a certain degree of deflection. The crack type changed from simple tensile type I to complex tensile shear mixed type I–II.
When delayed detonation occurs between 25 μs and 43 μs, the right blast hole detonates first, and the crack starts from the hole wall and then extends approximately horizontally along the direction between the holes. When the P wave generated by the first blast hole explosion exceeds the center position between the holes, the left hole detonates. The explosion crack in the right blast hole oscillates due to multiple compressions and stretches of the P wave in the left blast hole. Influenced by the left blast hole crack, it deflects to a certain extent when the crack is about to stop. Finally, the main crack R1 stops at 77.3 mm and 89.5 mm, respectively. The delay between the holes is relatively long, and the effect of the stress wave from the explosion of the first blasting hole on the crack caused by the explosion of the second blasting hole is relatively weak, similar to the crack propagation under a single-hole explosion.
The main cracks between the two holes generated by the explosion deviated during the propagation process, presenting a “hook-like” shape that draws each other from top to bottom, forming an approximately elliptical or irregular polygonal crack intersection area between the holes, as shown in Figure 12.
When the inter-hole delay is 2 μs, 5 μs, 8 μs, and 12 μs, the vertical spacing increases linearly, with values of 11.49 mm, 12.47 mm, 14.06 mm, and 14.89 mm, respectively. The fitted growth relationship is y = 0.35x + 10.84 (R2 = 0.95). When the inter-hole delay is 2 μs, 5 μs, 8 μs, and 12 μs, the area of the crack intersection zone increases linearly, with values of 144.02 mm2, 274.78 mm2, 346.98 mm2, and 447.75 mm2, respectively. The fitted growth relationship is y = 29.58x + 103.72 (R2 = 0.97). In the experiment, when the delay time was up to 25 μs and 43 μs, the stress wave generated by the first blast hole explosion had already been transmitted to the middle and rear blast hole areas. At this time, the rear blast hole exploded again, and the interaction between the stress waves between the holes only occurred near the rear blast hole. The interaction between the stress waves between the holes was weak, and the crack propagation was similar to single-hole detonation. Furthermore, the fracture crack created by the first blast hole offers a free surface for the propagation of the crack from the subsequent blast hole. At 25 μs, the crack formed by the subsequent blast hole did not deflect, while at 43 μs, the crack deviated. The cracks’ vertical spacing and intersection area no longer follow the law of short delay detonation conditions between holes.
The above results indicate a significant difference in the propagation of the principal crack when delayed detonation is carried out with equal dosage in dual holes and between different holes. When the inter-hole delay is between 0 μs and 12 μs, the focal spots at the crack tip deflect when they meet, forming a “hooked” crack intersection zone between the holes. At 25 μs and 43 μs, the superposition effect of stress waves is weak, the principal crack of the first explosion expands horizontally along the direction between the holes, and the stress waves propagate to the vicinity and center of the rear explosion blast holes, respectively. The interaction effect of stress waves between the holes is weakened. The propagation of the crack is inhibited to a certain extent; the principal crack of the first explosion is slightly deflected when it is close to the hole of the rear explosion, and then the crack is stopped. The vertical spacing and intersection area of cracks show a linear increase within 2 μs to 12 μs, but a sudden change occurs at 25 μs and 43 μs. The principal crack is strongly affected by the front end of the P-wave from the rear blast hole, while the effect at the tail end is weaker, indicating that the control effect of short delay on crack propagation is more significant. In addition, the inter-hole delay exhibits characteristic peak-valley changes in the dynamic propagation behavior of cracks, and the stress intensity factor and dynamic energy release rate are the intrinsic drivers of crack propagation, which are more sensitive and advanced. The dynamic characteristic curves of crack propagation are basically similar from 0 μs to 12 μs, and detonation causes significant crack deflection. However, the dynamic characteristic curves at 25 μs and 43 μs have very different shapes, and the influence of crack deflection is minimal.

4. Verification of Experimental Results

4.1. On-Site Experimental Situation

Study the difference in blasting vibration between pre-split hole simultaneous blasting and hole-by-hole blasting, and monitor the step blasting vibration of the two blasting methods separately. The experiment was conducted under the same step and lithology conditions. The simultaneous pre-split blasting test site was the CY2314 blasting area on platform 3516, mainly composed of angular rock. The hole-by-hole pre-split blasting test site was the CY2306 blasting area on platform 3516, mainly composed of angular rock. During blasting vibration measurement, all vibration meters were mainly arranged at suitable positions behind the pre-split holes in this part. The blasting parameters are shown in Table 2 and Table 3.
Five measuring points are set up behind the blasting area to monitor blasting vibration. Due to the test’s proximity to the permanent slope foot, it is not possible to place the instrument on the same step surface of the blasting area. Based on the actual situation on site, the vibration measuring instrument is placed on the inner side of the upper step of the horse track behind the blasting area. The layout of the measuring points is shown in Figure 13.
Figure 14 and Figure 15 show the measured vibration waveforms of measuring points 1 and 4 when the pre-split holes are detonated uniformly and one by one, respectively.
The above figure shows that the vibration induced by the simultaneous blasting of pre-split holes far exceeds the vibration caused by the central blasting zone. The clamping effect of pre-split holes is substantial when there is only one free surface, and they are adjacent to the preserved rock mass, causing damage to the preserved rock mass beyond the main blasting zone. This is also the focus of pre-split blasting. The peak velocity of the induced vibration during the detonation of each pre-split hole is significantly reduced compared to the peak velocity of the main detonation zone and the simultaneous detonation of the pre-split holes, with an average reduction of 68.36% and 54.28%, respectively.

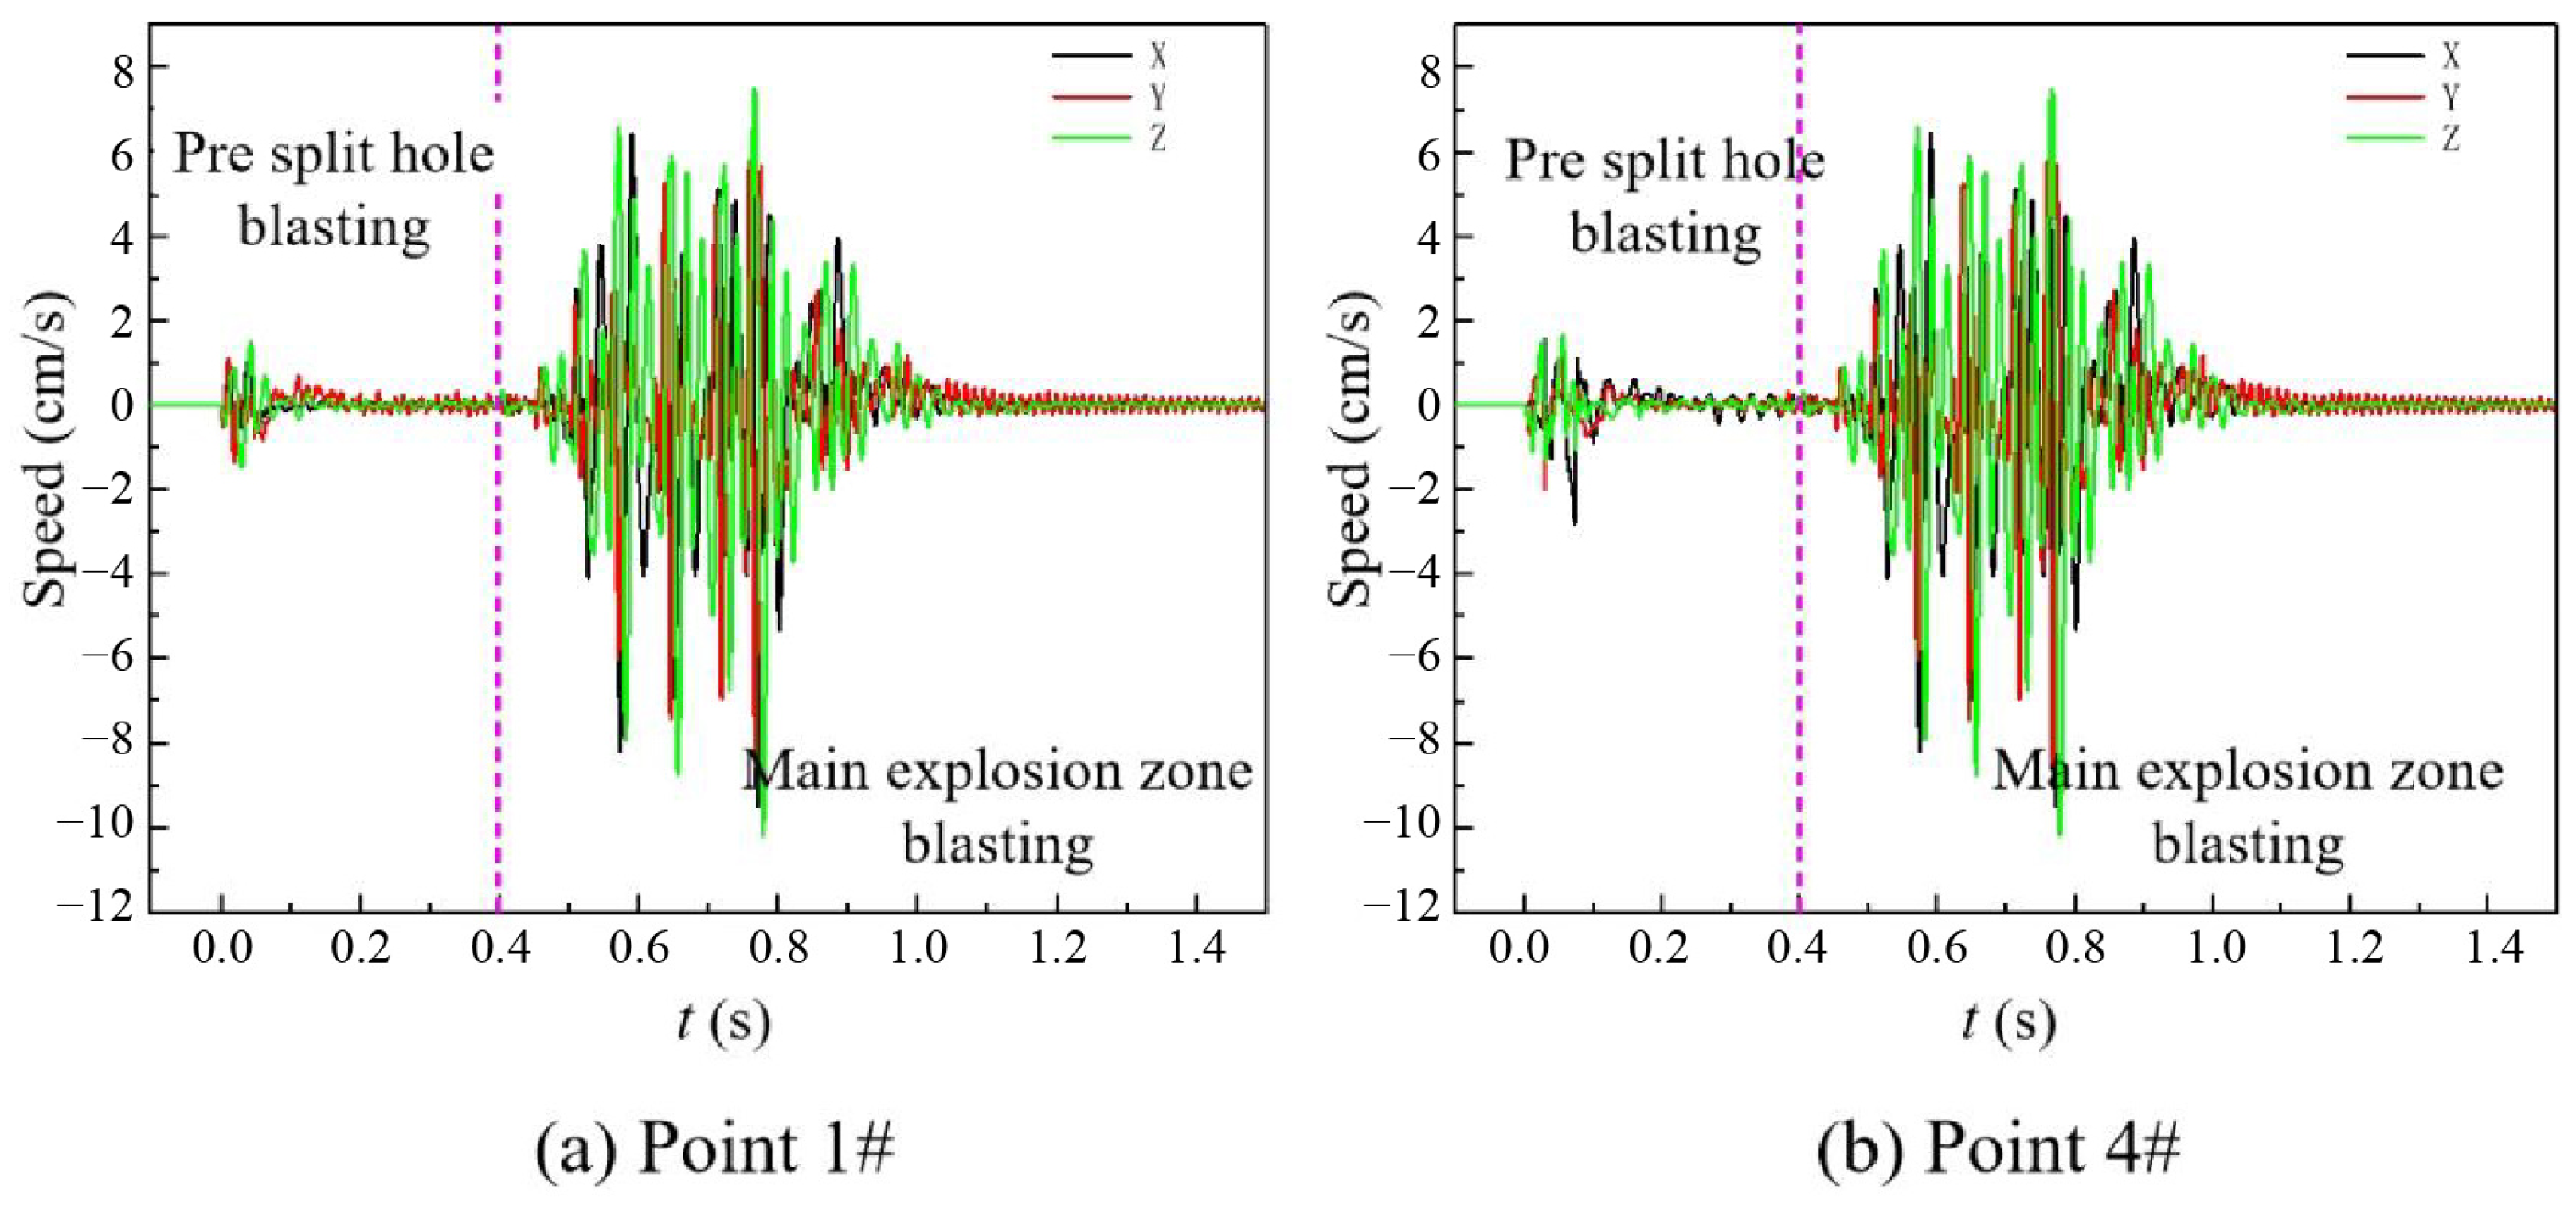
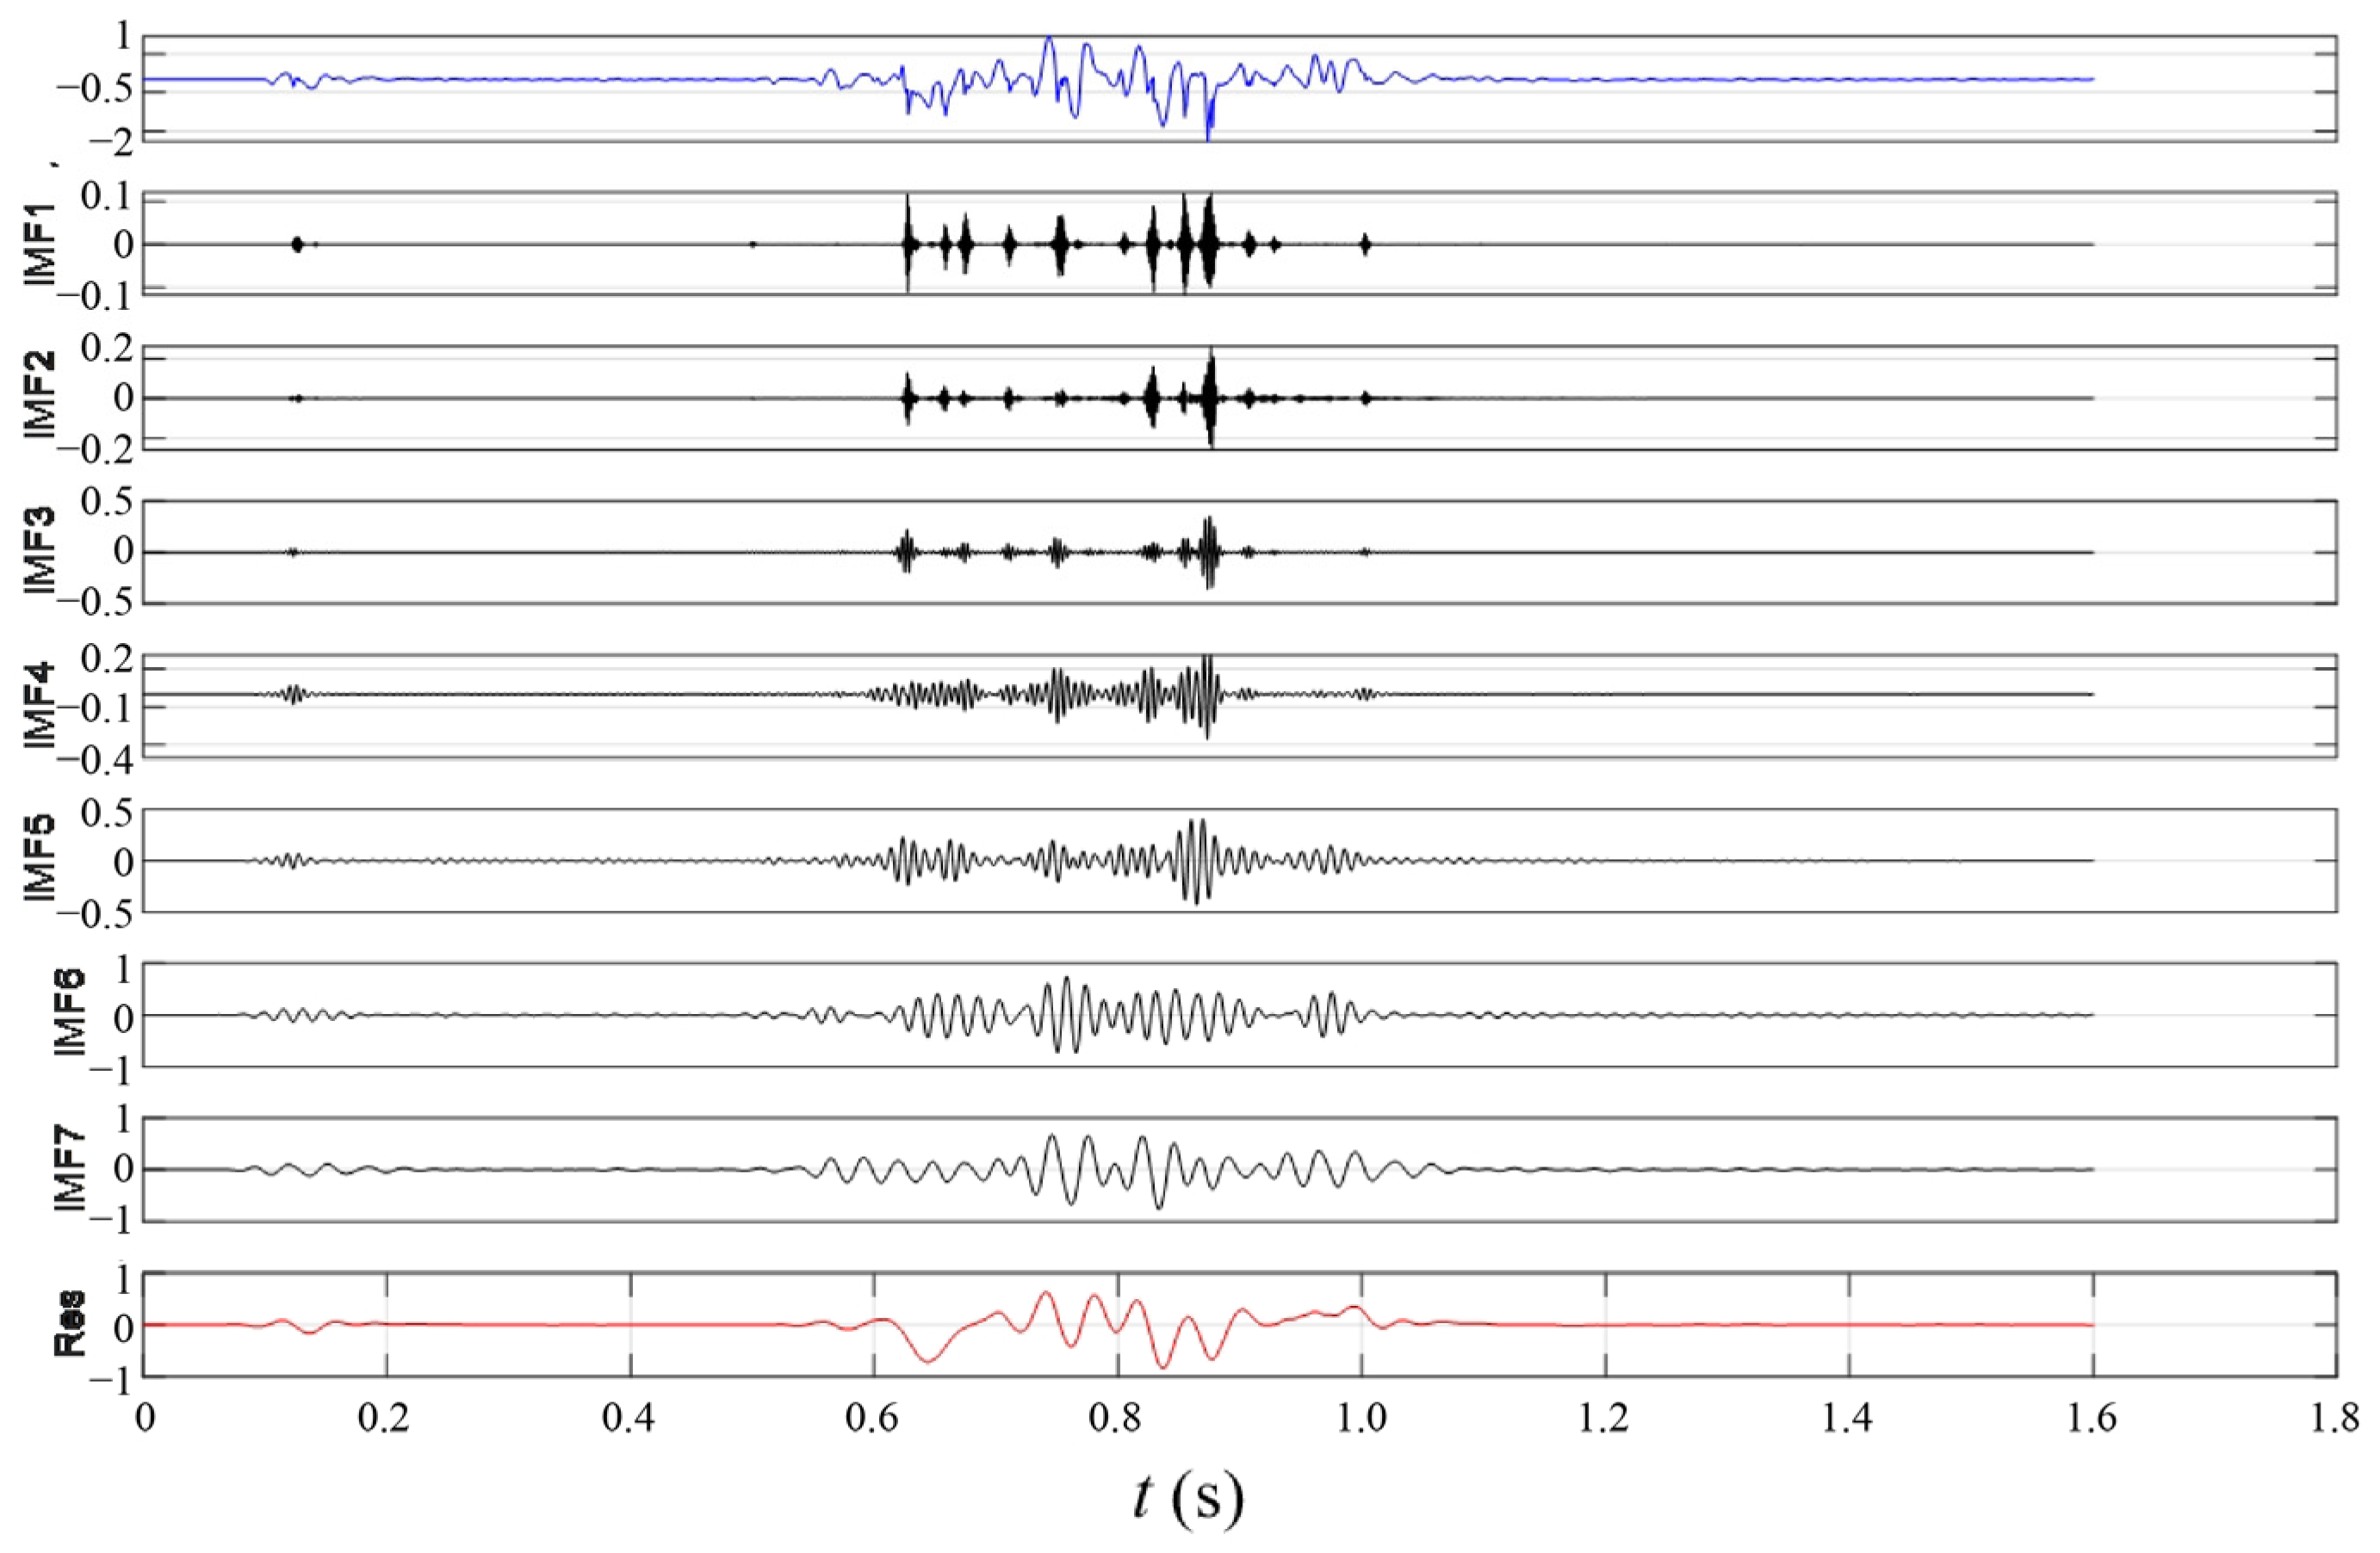
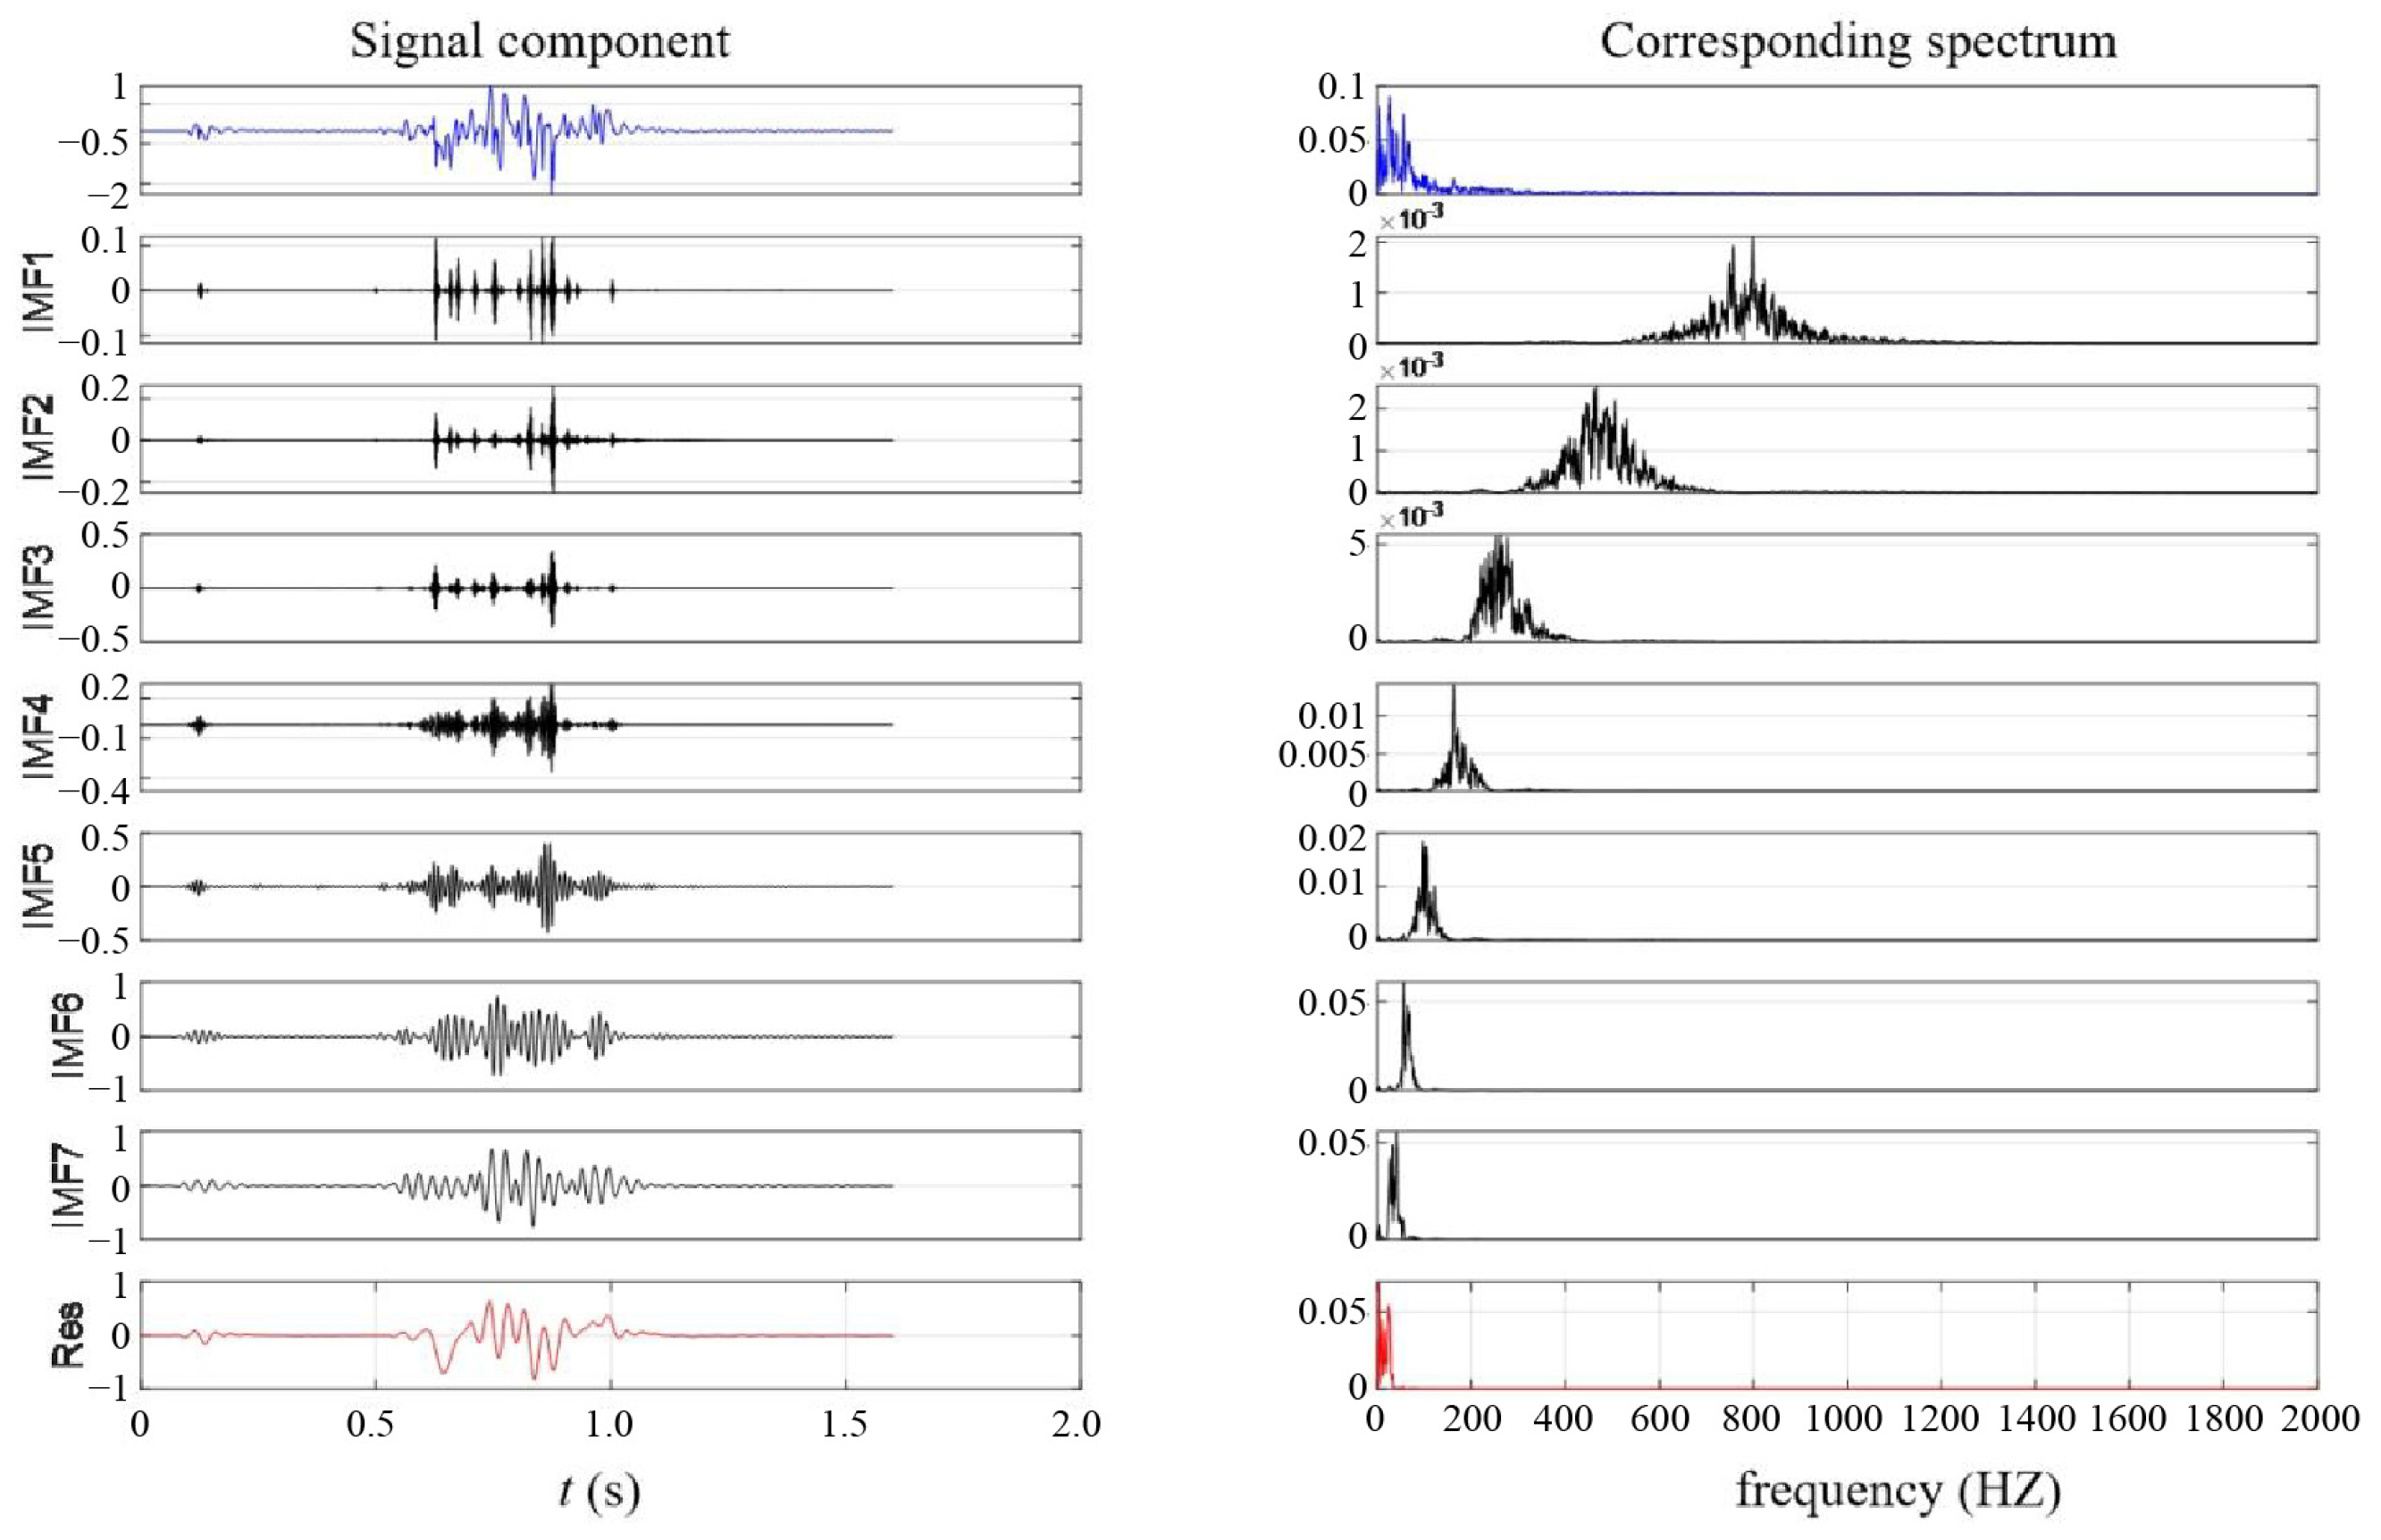
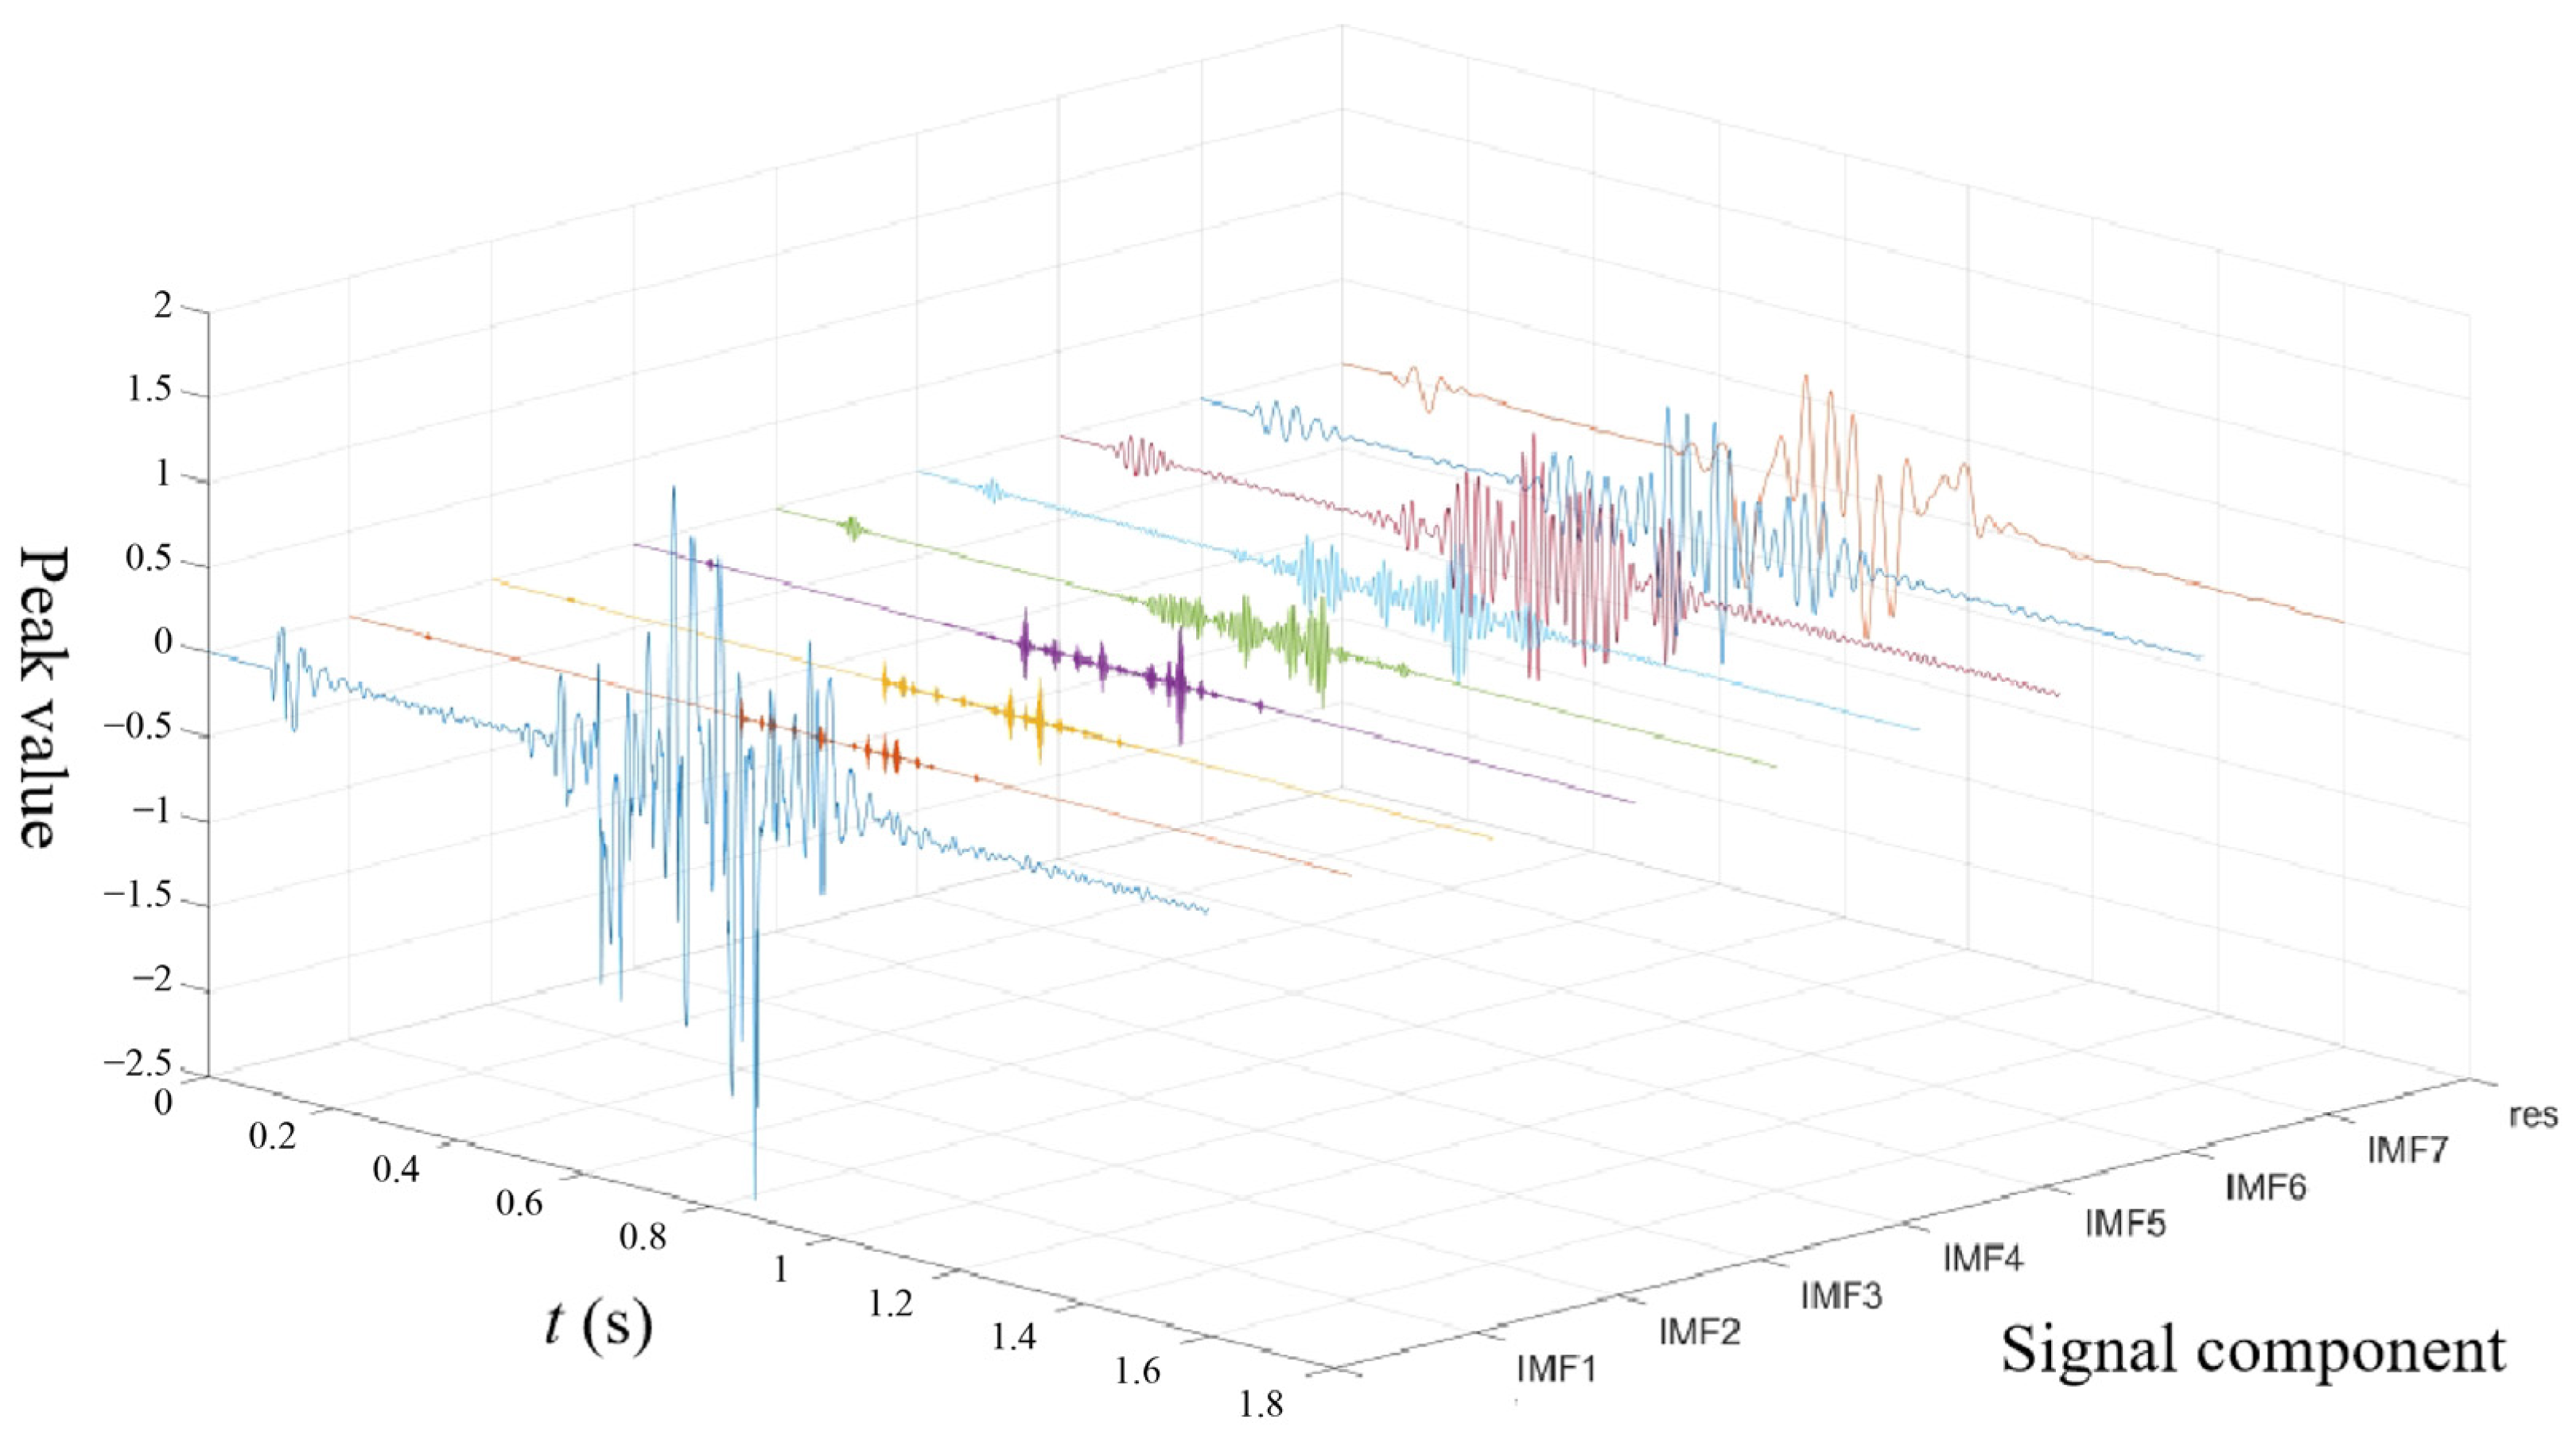
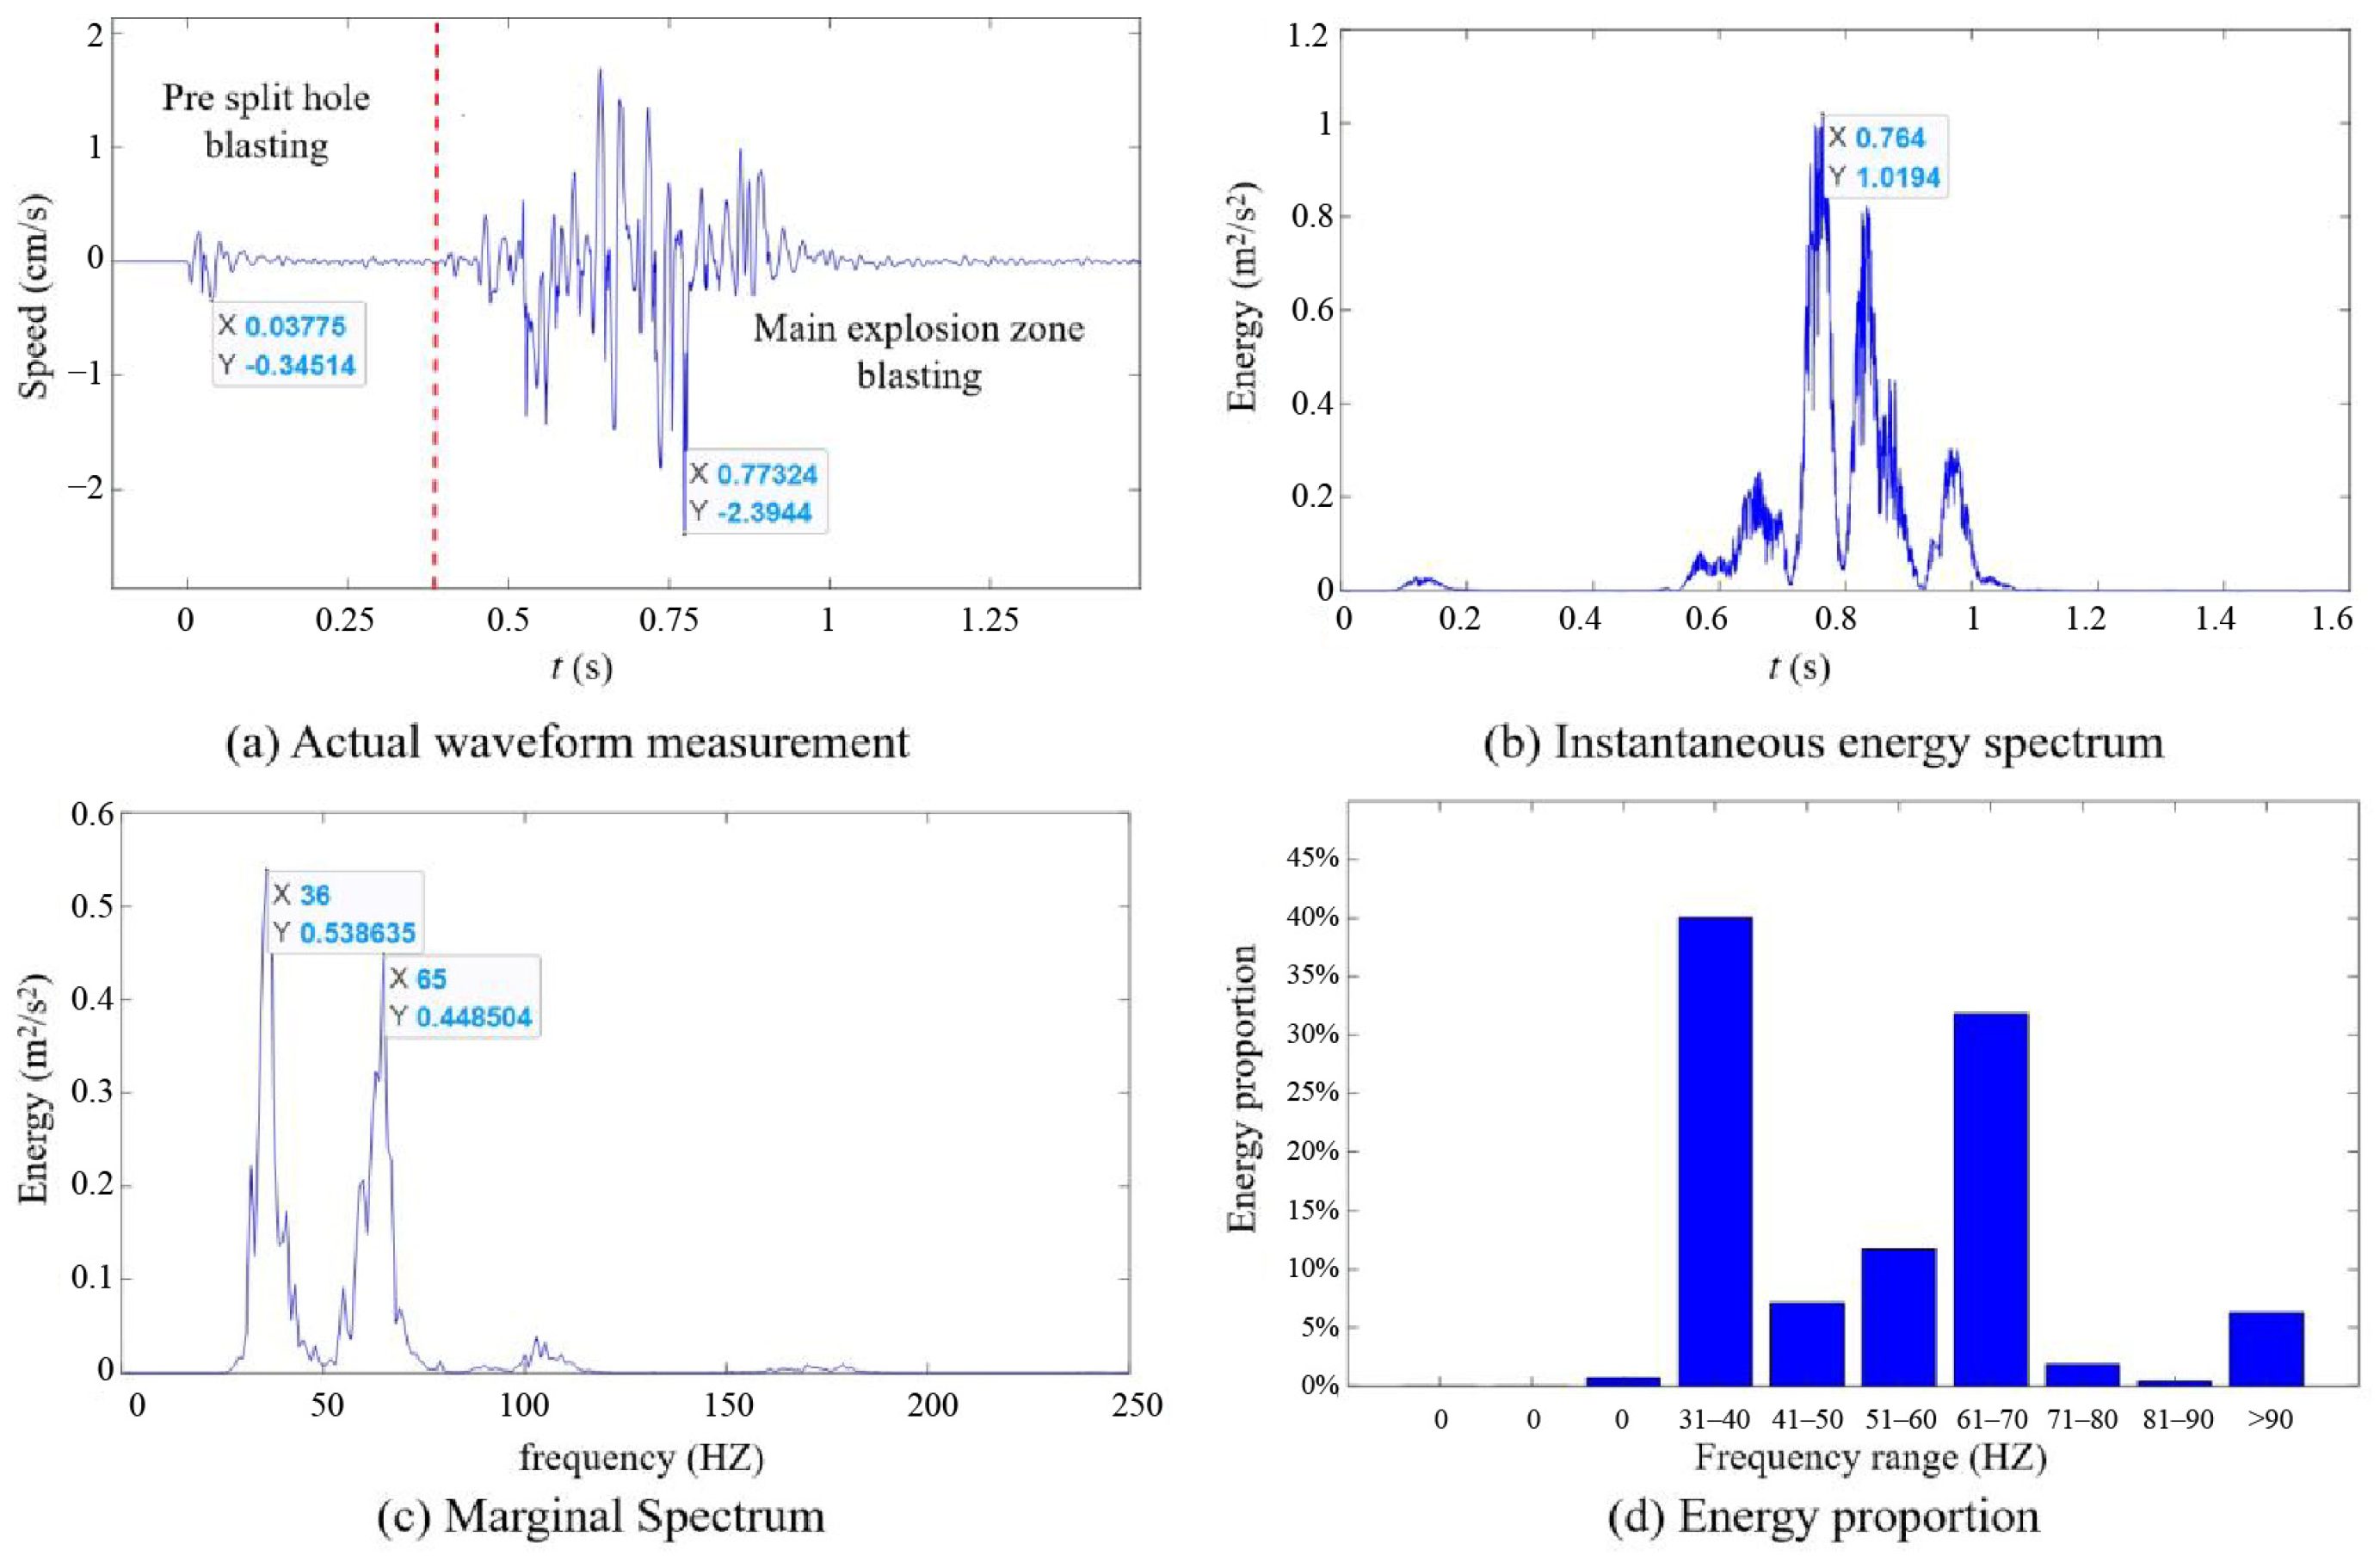
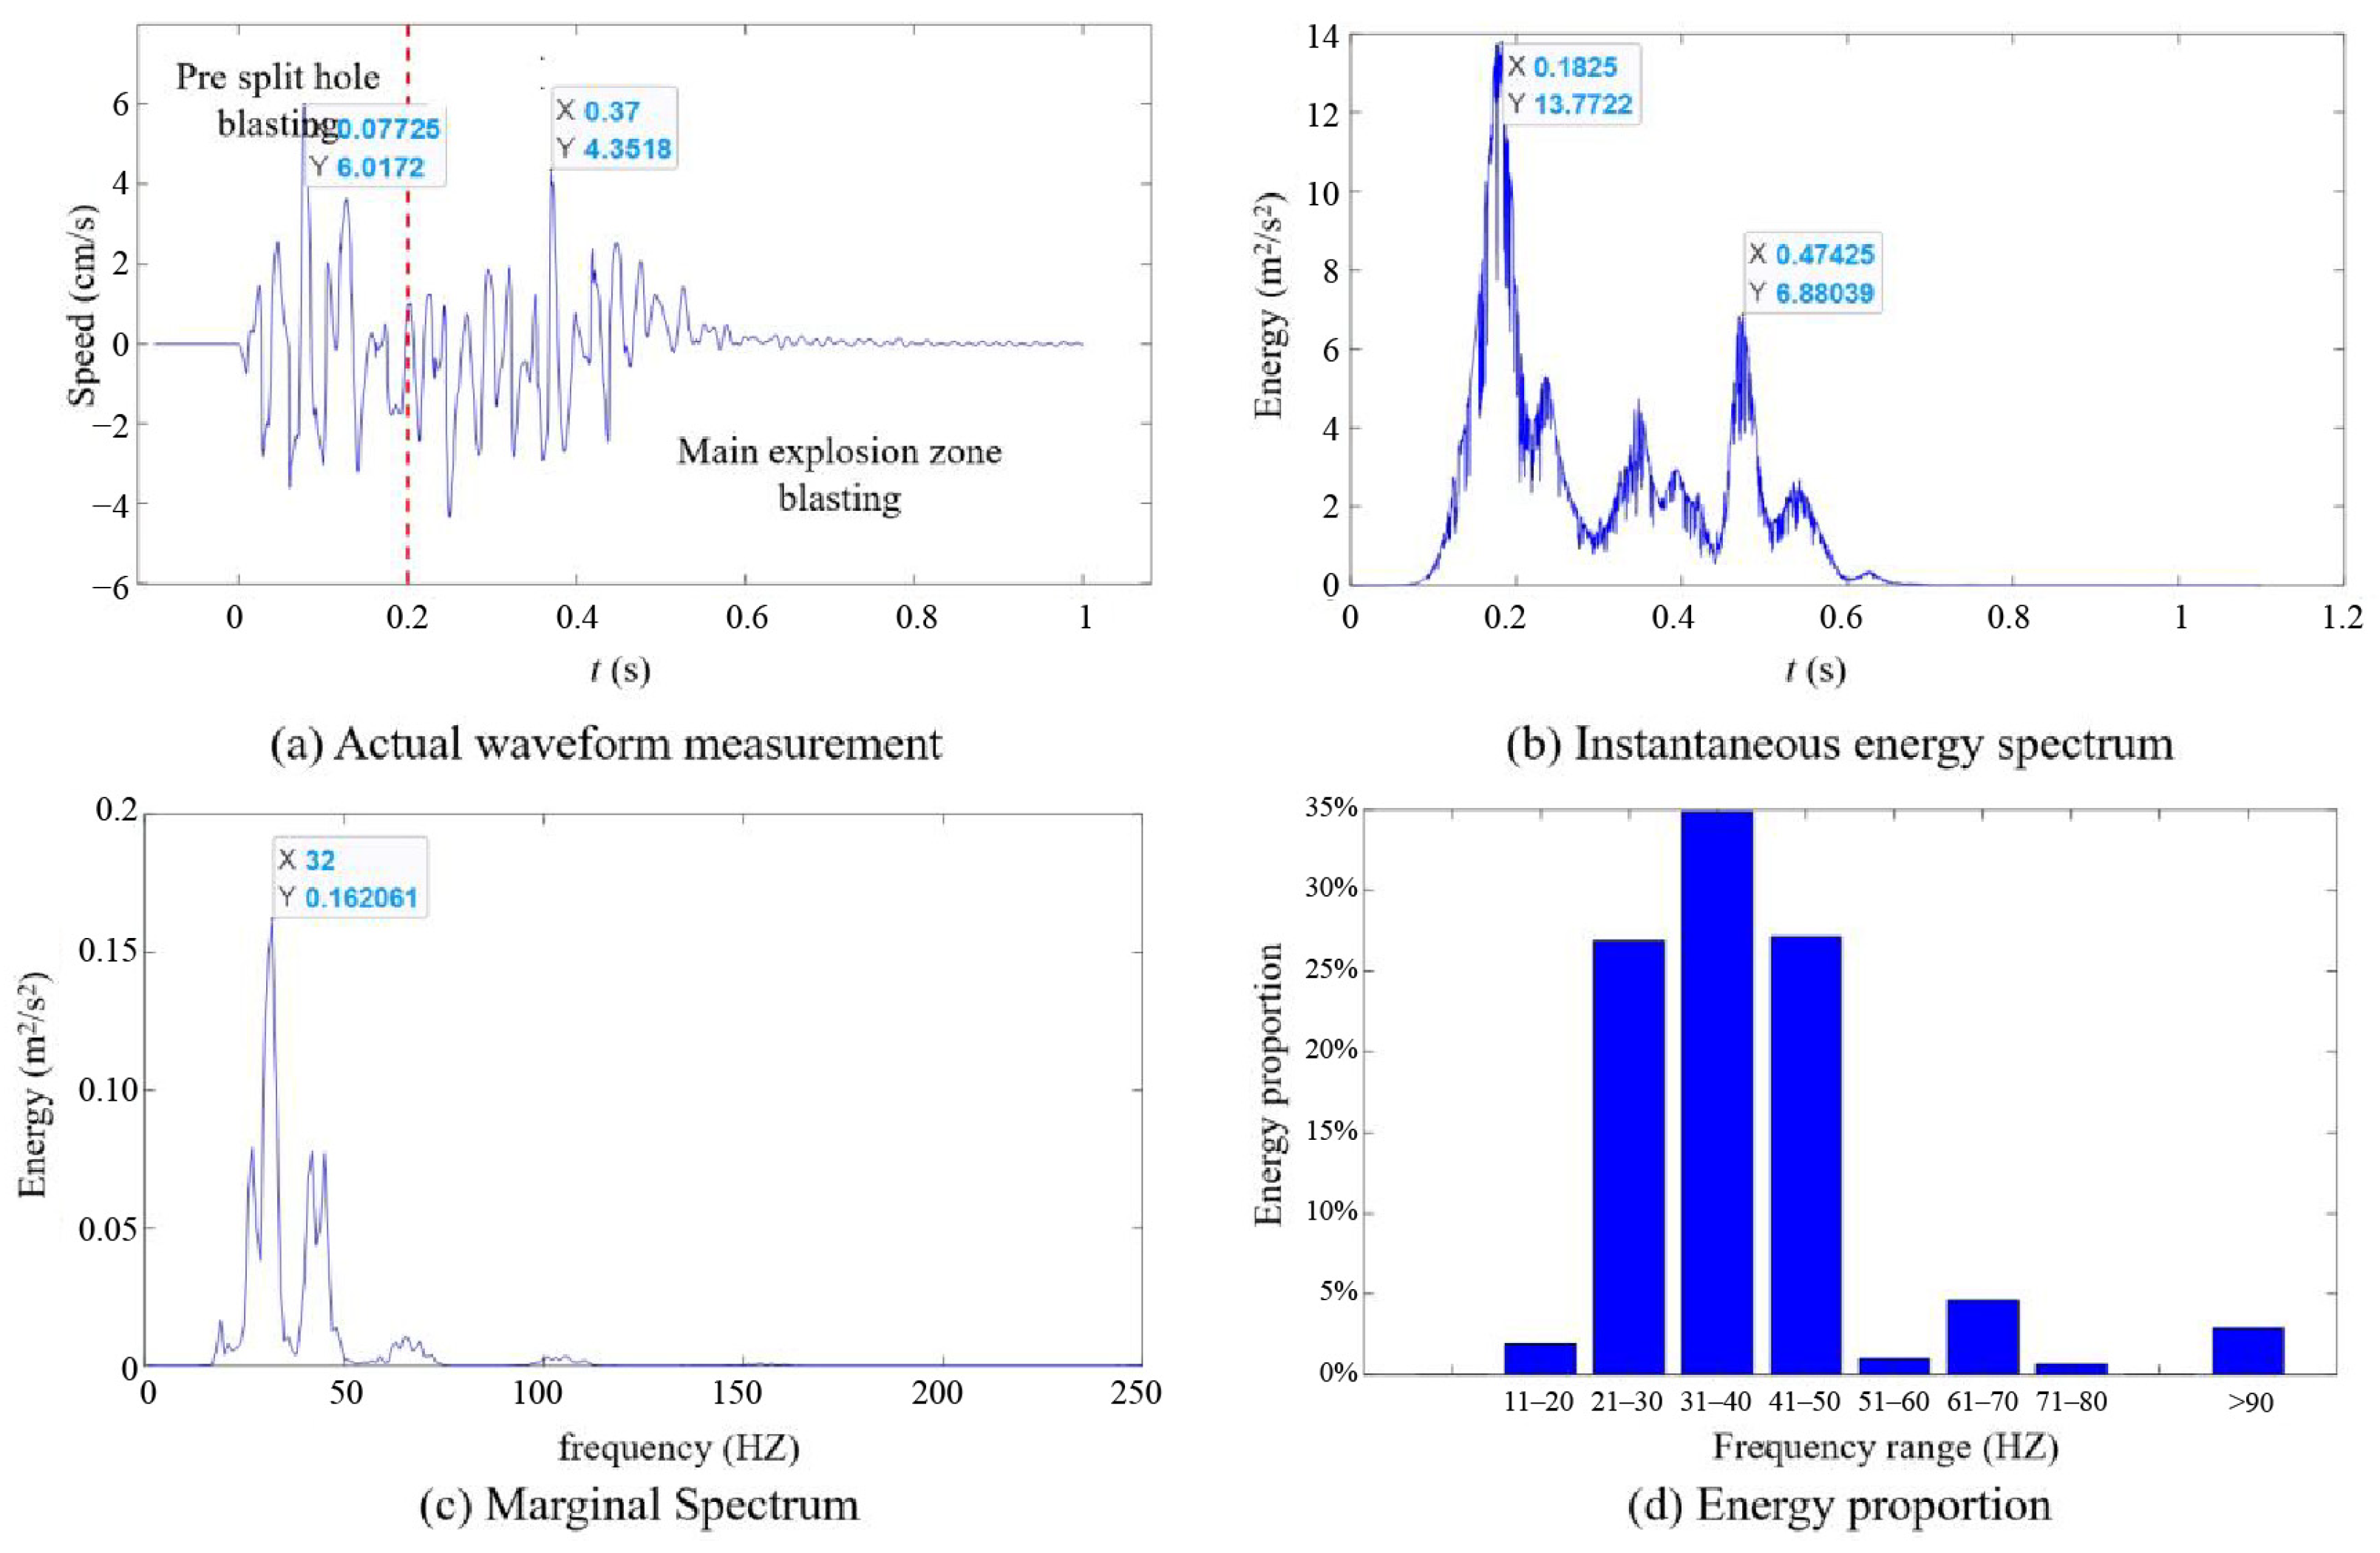
4.2. Spectral Characteristics of Vibration Signals

Select the Y-direction vibration data from measuring point 3, and use the VMD signal processing method to decompose the pre-split hole blasting vibration signal measured on site. Among these, the number of VMD modal decompositions is K = 8, along with the penalty factor and the convergence tolerance. The decomposition results of the IMF component of the blasting vibration signal when each pre-split hole is blasted are shown in Figure 16, and the IMF component corresponds to the frequency spectrum in Figure 17. The three-dimensional expansion of VMD decomposition is shown in Figure 18.
Seven IMF components and one remainder were obtained through VMD decomposition, effectively avoiding under-decomposition or over-decomposition. The decomposed IMF spectrum can be well separated without mode mixing. The HHT transform is currently one of the primary methods for analyzing blasting vibration signals. By integrating the Hilbert spectrum obtained from the HHT transform, the marginal spectrum and instantaneous energy spectrum of the blasting vibration signal can be derived, which can subsequently be employed to analyze the main frequency and energy distribution characteristics of the blasting vibration signal.

4.2.1. Spectral Analysis of Vibration Signals from Pre-Split Hole-by-Hole Blasting

Perform VMD decomposition on the measured vibration signal, filter it, and conduct HHT transformation to obtain the waveform, instantaneous energy spectrum, marginal spectrum, and energy distribution across frequency bands of the blasting vibration signal, as shown in Figure 19.
According to Figure 19, it can be seen that during the blasting of each pre-split hole, the peak velocity of the pre-split zone appears at 0.3451 cm/s at 0.037 s, and the peak velocity of the main blast zone appears at 2.3944 cm/s at 0.773 s. The peak vibration velocity of the main blast zone is significantly higher than that of the pre-split zone, and the self-induced vibration during the blasting of each pre-split hole is minimal. The harm caused by blasting vibration still originates from the main blast zone. From (b) in the figure, it can be observed that the maximum amplitude of its instantaneous energy occurs at 0.764 s, which corresponds to the vibration energy of the main explosion zone, while the instantaneous energy of the pre-cracking zone is also very low. From the frequency domain of the signal, it can be seen from (c) and (d) in the figure that the dominant frequency bands of signal energy are 31 Hz~40 Hz, accounting for 40% of the energy, and 61 Hz~70 Hz, accounting for 31.8% of the energy. Signal energy below 20 Hz accounts for 0.67%, and signal energy above 50 Hz accounts for 47.54%. The energy is mainly concentrated in the main explosion zone.

4.2.2. Spectral Analysis of Vibration Signals During Simultaneous Blasting of Pre-Split Holes

Figure 20 shows the on-site measured waveform, instantaneous energy spectrum, marginal spectrum, and energy distribution in different frequency bands of the pre-split hole simultaneous blasting.
As illustrated in Figure 20a, during the simultaneous blasting of the pre-split holes, the peak velocity in the pre-split zone is 6.0172 cm/s, occurring at 0.077 s, while the peak velocity in the main blast zone is 4.3518 cm/s, occurring at 0.37 s. The peak velocity in the pre-split zone surpasses that of the main blast zone, and the vibration induced by the pre-split holes themselves has surpassed that of the main blast zone. The harm of blasting vibration still comes from the pre-split zone. From (b) in the figure, it is evident that during the simultaneous blasting of the pre-splitting holes, two peaks in instantaneous energy occur at 0.182 s in the pre-splitting zone and 0.474 s in the main blasting zone. Additionally, the amplitude of instantaneous energy in the pre-splitting zone is significantly larger than that in the main blasting zone. As shown in (c) and (d) of the figure, from the frequency domain of the signal, the energy frequency band distribution range of the signal during the simultaneous blasting of the pre-split holes is relatively narrow. The dominant frequency band of the signal energy is 21 Hz~50 Hz, with an energy proportion of up to 88.83%. Among them, 21 Hz~30 Hz accounts for 26.86%, 31 Hz~40 Hz accounts for 34.85%, and 41 Hz~50 Hz accounts for 27.12%. The energy proportion of the signal below 20 Hz is only 1.92%, and the energy proportion above 50 Hz is 9.21%. The energy of the blasting vibration signal is in the low-frequency range, which is more unfavorable for the safety of the building (structure) compared to the pre-split blasting of each hole.

5. Conclusions

The experiment systematically explored the influence of inter-hole delay on crack propagation behavior and dynamic characteristics through a dual-hole delay detonation experiment, revealing the effect of inter-hole delay time on crack propagation, and compared the spectral characteristics of blast-induced vibrations between simultaneous and sequential blasting. The experimental results indicate the following points:
  • Under the same conditions of charge quantity and borehole size, the delay time exhibits a more effective directional blasting impact on the desired cracking result.
  • When the delay time between the holes is 0 to 12 μs, the caustics at the crack tip deflect upon meeting, causing the crack type to change from a type I tensile crack to a type I-II stretch mixed crack. As the delay time increases, the vertical distance of the crack between the holes and the area of the junction increase linearly with the delay time.
  • When the delay time between holes exceeds 25 μs, the propagation of the main crack between the holes is only weakly influenced by the superposition of stress waves. The cracking occurs primarily due to a slight deflection near the after-burst blast hole, and there is no clear correlation when comparing the vertical distance of the main crack between the holes to the area of the intersection in relation to the short delay.
  • The experimental results above indicate that the delay time between holes affects crack propagation, as a penetration crack can be formed by establishing a reasonable delay time. Furthermore, the results from field tests demonstrate that delayed detonation between holes can effectively mitigate the impact of blasting vibrations on the rear rock mass, offering a new approach to reducing slope damage.

Author Contributions

Y.W.: Writing—original draft, Methodology, Software, Conceptualization, Validation, Investigation, Data curation, Formal analysis; Y.Y.: Review & editing, Methodology, Conceptualization, Visualization, Resources; X.Z.: Writing—review & editing, Investigation, Visualization, Investigation, Software, Resources; Z.F.: Resources, Project administration, Supervision; F.H.: Resources, Project administration, Supervision; J.H.: Resources, Project administration, Supervision; J.Z.: Resources, Project administration, Supervision. All authors have read and agreed to the published version of the manuscript.

Funding

This research was funded by National Natural Science Foundation of China (52227805).

Data Availability Statement

The original contributions presented in this study are included in the article. Further inquiries can be directed to the corresponding author(s).

Conflicts of Interest

Author Fangqiang Hu was employed by the Panzhihua Iron and Steel Group Mining Co., Ltd. The remaining authors declare that the research was conducted in the absence of any commercial or financial relationships that could be construed as a potential conflict of interest.

References

  1. Li, M.; Zhu, Z.; Liu, R.; Liu, B.; Zhou, L.; Dong, Y. Study of the effect of empty holes on propagating cracks under blasting loads. Int. J. Rock. Mech. Min. Sci. 2018, 103, 186–194. [Google Scholar] [CrossRef]
  2. Hao, X.; Du, W.; Zhao, Y.; Sun, Z.; Zhang, Q.; Wang, S.; Qiao, H. Dynamic tensile behaviour and crack propagation of coal under coupled static-dynamic loading. Int. J. Rock. Mech. Min. Sci. 2020, 30, 659–668. [Google Scholar] [CrossRef]
  3. Ding, C.; Yang, R.; Lei, Z.; Wang, M.; Zhao, Y.; Lin, H. Fractal damage and crack propagation in decoupled charge blasting. Soil Dyn. Earthquake Eng. 2021, 141, 106503. [Google Scholar] [CrossRef]
  4. Ocak, I.; Bilgin, N. Comparative studies on the performance of a roadheader, impact hammer and drilling and blasting method in the excavation of metro station tunnels in Istanbul. Tunn. Undergr. Space Technol. 2010, 25, 181–187. [Google Scholar] [CrossRef]
  5. Mazaira, A.; Konicek, P. Intense rockburst impacts in deep underground construction and their prevention. Can. Geotech. J. 2015, 52, 1426–1439. [Google Scholar] [CrossRef]
  6. Haibo, L.; Xiang, X.; Jianchun, L.; Jian, Z.; Bo, L.; Yaqun, L. Rock damage control in bedrock blasting excavation for a nuclear power plant. Int. J. Rock. Mech. Min. Sci. 2011, 48, 210–218. [Google Scholar] [CrossRef]
  7. Li, X.; Gong, F.; Tao, M.; Dong, L.; Du, K.; Ma, C.; Zhou, Z.; Yin, T. Failure mechanism and coupled static-dynamic loading theory in deep hard rock mining: A review. J. Rock. Mech. Geotech. Eng. 2017, 9, 767–782. [Google Scholar] [CrossRef]
  8. Katsabanis, P.D. Analysis of the effects of blasting on comminution using experimental results and numerical modelling. Rock. Mech. Rock. Eng. 2020, 53, 3093–3109. [Google Scholar] [CrossRef]
  9. Li, X.; Liu, K.; Yang, J.; Song, R. Numerical study on blast-induced fragmentation in deep rock mass. Int. J. Impact Eng. 2022, 170, 104367. [Google Scholar] [CrossRef]
  10. Zhu, X.; Ding, C.; Sui, Z.; Su, H.; Guo, X. Rock fracture mechanism of buffer blasting with cushion layer at the borehole bottom. Int. J. Miner. Metall. Mater. 2025, 32, 325–334. [Google Scholar] [CrossRef]
  11. Rossmanith, H.P. The use of Lagrange diagrams in precise initiation blasting. Part I: Two interacting blastholes. Fragblast 2002, 6, 104–136. [Google Scholar] [CrossRef]
  12. Rossmanith, H.P.; Kouzniak, N. Supersonic detonation in rock mass-part 2: Particle displacements and velocity fields for single and multiple non-delayed and delayed detonating blastholes. Fragblast 2004, 8, 95–117. [Google Scholar] [CrossRef]
  13. McKinstry, R.; Floyd, J.; Bartley, D. Electronic detonator performance evaluation. In Proceedings of the 28th Annual Conference on Explosives and Blasting Technique, Las Vegas, NV, USA, 10–13 February 2002; pp. 1–20. [Google Scholar]
  14. Lewis, N.; Pereira, P. Operating improvements at Vuloan Materials McCook quarry using electronic detonators. In Proceedings of the 29th Annual Conference on Explosives and Blasting Technique. Nashville, Nashville, TN, USA, 2–5 February 2003; pp. 1–14. [Google Scholar]
  15. Khandelwal, M.; Singh, T.N. Prediction of blast-induced ground vibration using artificial network. Int. J. Rock. Mech. Min. Sci. 2009, 46, 1214–1222. [Google Scholar] [CrossRef]
  16. Liu, K.; Zhao, X.; Li, X.; Sha, Y.; Hong, Z.; Yang, J.; Ma, S. Effects of delay time on crack coalescence between two boreholes. Theor. Appl. Fract. Mech. 2024, 129, 104210. [Google Scholar] [CrossRef]
  17. Yi, C.; Johansson, D.; Nyberg, U.; Beyglou, A. Stress wave interaction between two adjacent blast holes. Rock. Mech. Rock. Eng. 2016, 49, 1803–1812. [Google Scholar] [CrossRef]
  18. Tang, H.L.; Liu, X.; Yang, J.; Yu, Q. Experimental study on the influence of delay time on rock fragmentation in bench blasting. Appl. Sci. 2022, 13, 85. [Google Scholar] [CrossRef]
  19. Huang, D.; Cui, S.; Li, X. Wavelet packet analysis of blasting vibration signal of mountain tunnel. Soil. Dyn. Earthq. Eng. 2019, 117, 72–80. [Google Scholar] [CrossRef]
  20. Chen, G.; Li, Q.Y.; Li, D.Q.; Wu, Z.Y.; Liu, Y. Main frequency band of blast vibration signal based on wavelet packet transform. Appl. Math. Model. 2019, 74, 569–585. [Google Scholar] [CrossRef]
  21. Wang, Z.-W.; Li, X.-B.; Peng, K.; Xie, J.-F. Impact of blasting parameters on vibration signal spectrum: Determination and statistical evidence. Tunn. Undergr. Space Technol. 2015, 48, 94–100. [Google Scholar] [CrossRef]
  22. Li, B.; Wang, E.; Li, Z.; Cao, X.; Liu, X.; Zhang, M. Automatic recognition of effective and interference signals based on machine learning: A case study of acoustic emission and electromagnetic radiation. Int. J. Rock. Mech. Min. Sci. 2023, 170, 105505. [Google Scholar] [CrossRef]
  23. Aldaş, G.G.U.; Bilgin, H.A.; Esen, S. Timing simulation for the selection of optimum delay time. In Proceedings of the 17th International Mining Congress and Exhibition of Turkey, Ankara, Turkey, 19–22 June 2001. [Google Scholar]
  24. Zhang, X.; Yan, P.; Lu, W.; Cheng, Y.; Sun, C.; Zhu, J.; Guo, W.; Cheng, X. Frequency spectrum characteristics of blast-induced vibration with electronic detonators in ground blasting. J. Build. Eng. 2023, 74, 106892. [Google Scholar] [CrossRef]
  25. Wang, C.; Du, X.; Wang, K.; Wang, K.; Sun, Y.; Hu, Z.; Wang, L.; Sun, D. Research on the vibration reduction characteristics of digital electronic detonators in the blasting of flood discharge and sand removal tunnels. Blasting 2023, 40, 205–212. [Google Scholar]
  26. Bai, X.; Li, M.; Di, Z.; Dong, W.; Liang, J.; Zhang, J.; Sun, H. Open circuit fault diagnosis of wind power converter based on VMD energy entropy and time domain feature analysis. Energy Sci. Eng. 2024, 12, 577–595. [Google Scholar] [CrossRef]
  27. Ambrożkiewicz, B.; Syta, A.; Georgiadis, A.; Gassner, A.; Litak, G.; Meier, N. Intelligent Diagnostics of Radial Internal Clearance in Ball Bearings with Machine Learning Methods. Sensors 2023, 23, 5875. [Google Scholar] [CrossRef]
  28. Konieczny, J.; Łata, W.; Stojek, J. Application of analysis of variance to determine important features of signals for diagnostic classifiers of displacement pumps. Sci. Rep. 2024, 14, 6098. [Google Scholar] [CrossRef]
  29. Li, J.; Guo, J.; Zhu, X.; Yu, Y. Nonlinear characteristics of damaged bridges under moving loads using parameter optimization variational mode decomposition. J. Civ. Civil. Struct. Health Monit. 2022, 12, 1009–1026. [Google Scholar] [CrossRef]
  30. Washabaugh, P.D.; Knauss, W.G. The effect of aligned defects on the propagation speed of a dynamic crack in PMMA. Int. J. Solids Struct. 1995, 32, 2481–2496. [Google Scholar] [CrossRef]
  31. Liu, W.; Yao, X.; Yang, R.; Yue, Z. Multi-crack propagation in PMMA plates under dynamic out-of-plane impact. Opt. Lasers Eng. 2020, 124, 105849. [Google Scholar] [CrossRef]
  32. Xiao, C.; Yang, R.; Zuo, J.; Chen, J.; Zhao, J.; Yang, Y. Influence of open joints on blasting damage and crack propagation of PMMA. Mech. Adv. Mater. Struct. 2024, 31, 3204–3215. [Google Scholar] [CrossRef]
  33. Faye, A.; Parameswaran, V.; Basu, S. Dynamic fracture initiation toughness of PMMA: A critical evaluation. Mech. Mater. 2016, 94, 156–169. [Google Scholar] [CrossRef]
  34. Yang, R.; Zhao, Y.; Fang, S.; Zhao, J.; Wang, Y.; Liu, Z. Effect of the detonation method on the stress field distribution and crack propagation of spacer charge blasting. Chin. J. Eng. 2023, 45, 714–737. [Google Scholar]
Figure 1. Explosion loading dynamic caustics experimental system.
Buildings 15 02030 g001
Figure 2. Parameter selection analysis.
Buildings 15 02030 g002
Figure 3. Caustic curve at the tip of composite crack type I-II.
Buildings 15 02030 g003
Figure 4. Double-hole precise delayed detonation scheme.
Buildings 15 02030 g004
Figure 5. Dynamic focal spot photograph of principal crack propagation between holes with a delay of 5 μs.
Buildings 15 02030 g005
Figure 6. 5 μs time history curve of the ratio of the transverse and longitudinal diameters of the caustic spot.
Buildings 15 02030 g006
Figure 7. Velocity curve of principal crack propagation between holes.
Buildings 15 02030 g007
Figure 8. Velocity curve of the principal crack between the delayed detonation holes.
Buildings 15 02030 g008
Figure 9. Stress intensity factor curve at the tip of the principal crack between holes.
Buildings 15 02030 g009
Figure 10. Stress intensity factor curve at the tip of the main crack between delayed detonation holes.
Buildings 15 02030 g010
Figure 11. Trajectory and intersection zone of inter-hole cracks.
Buildings 15 02030 g011
Figure 12. Vertical spacing of cracks and area of crack intersection.
Buildings 15 02030 g012
Figure 13. Layout of blasting vibration monitoring points.
Buildings 15 02030 g013
Figure 14. Pre-split hole simultaneous blasting.
Buildings 15 02030 g014
Figure 15. Pre-split hole blasting hole by hole.
Buildings 15 02030 g015
Figure 16. VMD decomposition.
Buildings 15 02030 g016
Figure 17. IMF components correspond to spectra.
Buildings 15 02030 g017
Figure 18. VMD decomposition three-dimensional expansion diagram.
Buildings 15 02030 g018
Figure 19. Spectral characteristics of vibration signals from pre-split hole-by-hole blasting.
Buildings 15 02030 g019
Figure 20. Spectral characteristics of vibration signals during simultaneous blasting of pre-split holes.
Buildings 15 02030 g020
Table 1. Experimental parameters.
NumberCharge (mg)Delay Time (μs)Proportion of Delay Time (%)
Left (A)Right (B)
112012000%
212012025%
3120120512%
4120120819%
51201201228%
61201202558%
712012043100%
Table 2. Parameters of simultaneous blasting of pre-split holes.
NO.NameD/mmH/mL
/m
Charge
/mm
Single-Pore Dosage
/kg
Maximum Segment Dosage
/kg
Total Dosage
/kg
1Presplit hole12010.5~14.81.332126729792
2Buffer hole1205.0~8.22.59015~33550
3Main explosion hole1205~12.859051~66756
Table 3. Pre-splitting hole-by-hole blasting parameters.
NO.NameD/mmH/mL
/m
Charge
/mm
Single-Pore Dosage
/kg
Maximum Segment Dosage
/kg
Total Dosage
/kg
1Presplit hole12010.8~14.61.33212129792
2Buffer hole1204.7~7.82.59016~32586
3Main explosion hole1203.2~15.559052~68858
Disclaimer/Publisher’s Note: The statements, opinions and data contained in all publications are solely those of the individual author(s) and contributor(s) and not of MDPI and/or the editor(s). MDPI and/or the editor(s) disclaim responsibility for any injury to people or property resulting from any ideas, methods, instructions or products referred to in the content.

