Article

Evaluation of Smart Building Integration into a Smart City by Applying Machine Learning Techniques

by
Mustafa Muthanna Najm Shahrabani
* and
Rasa Apanaviciene
*
Faculty of Civil Engineering and Architecture, Kaunas University of Technology, Studentų Str. 48, LT-51367 Kaunas, Lithuania
*
Authors to whom correspondence should be addressed.
Buildings 2025, 15(12), 2031; https://doi.org/10.3390/buildings15122031
Submission received: 13 May 2025 / Revised: 2 June 2025 / Accepted: 4 June 2025 / Published: 12 June 2025
(This article belongs to the Section Construction Management, and Computers & Digitization)

Abstract

Smart buildings’ role is crucial for advancing smart cities’ performance in achieving environmental sustainability, resiliency, and efficiency. The integration barriers continue due to technology, infrastructure, and operations misalignments and are escalated due to inadequate assessment frameworks and classification systems. The existing literature on assessment methodologies reveals diverging evaluation frameworks for smart buildings and smart cities, non-uniform metrics and taxonomies that hinder scalability, and the low use of machine learning in predictive integration modelling. To fill these gaps, this paper introduces a novel machine learning model to predict smart building integration into smart city levels and assess their impact on smart city performance by leveraging data from 147 smart buildings in 13 regions. Six optimised machine learning algorithms (K-Nearest Neighbours (KNNs), Support Vector Regression (SVR), Random Forest, Adaptive Boosting (AdaBoost), Decision Tree (DT), and Extra Tree (ET)) were employed to train the model and perform feature engineering and permutation importance analysis. The SVR-trained model substantially outperformed other models, achieving an R-squared of 0.81, Root Mean Square Error (RMSE) of 0.33 and Mean Absolute Error (MAE) of 0.27, enabling precise integration prediction. Case studies revealed that low-integration buildings gain significant benefits from progressive target upgrades, whilst those buildings that have already implemented some integrated systems tend to experience diminishing marginal benefits with further, potentially disruptive upgrades. The conclusion of this study states that by utilising the developed machine learning model, owners and policymakers are capable of significantly improving the integration of smart buildings to build better, more sustainable, and resilient urban environments.

1. Introduction

Smart cities harness cutting-edge information and communication technologies (ICTs) to maintain healthy and prosperous communities, embrace socio-economic efficiency, and instigate the future of urban modelling. Smart cities use different technology solutions to better manage resources, enhance urban services, and create engaged and responsive urban communities [1,2,3], as well as to improve transportation systems, enhance energy efficiency, promote sustainable resource management, and facilitate improved governance and citizen engagement [1,4,5]. The concept of smart cities is multifaceted: smart infrastructures refer to smart dimensions such as energy, mobility, living, building, water management, environment, smart governance, and economy [1,3,6]. Together, these domains provide the foundation for a mutually reinforcing and sustainable urban environment.
Smart buildings are one of the key elements of the smart city system [7], contributing a significant share to the objectives of the smart city in the context of sustainability, resilience, and efficiency. These buildings are designed to be extremely energy-efficient and sustainable by utilising advanced automation, the integration of renewable energy, and end-user engagement [4,8,9]. Buildings pave the way for smart city development. Nonetheless, they were developed at different timeframes, by different stakeholders, leading to a misalignment in their functionalities and capabilities [9]. This misalignment results in technological [9,10,11,12], infrastructural [13], and operational gaps [12,14]. The consequences of these gaps are extensive. Perhaps the most pernicious type of misalignment is that which relates to technological and infrastructure misalignment, as these can lead to unwanted inefficiencies and hence increased costs in urban development. These costs are constrained by operational limitations, such as insufficient data sharing and inadequate regulatory infrastructures, which deprive the potential advantages of urban smart applications. However, complex and sprawled cities, such as Berlin and London, even with well-established smart city agendas, have mostly not embraced urban sharing due to these difficulties [15]. Solutions to these barriers will require a concerted effort to build interoperable systems, strong data-sharing capabilities, and broad classification systems to support the efficiency, sustainability, and quality of life of their residents. Furthermore, with the ongoing evolution of cities, evaluating and classifying the level of integration will facilitate the process of connecting the gap between individual building performance and city-wide performance [16], paving the way for truly interconnected and responsive urban ecosystems.
Emphasising earlier statements, several studies have underscored the significance of smart building and smart city integration and its implications for multiple facets of urban development, especially for service-sharing scenarios [17,18,19]. To promote interoperability within the smart city ecosystem, research conducted by [20] presented an open standard framework as a part of the mySMARTLife project. This project addresses issues including data interoperability, services interoperability, openness, and the replicability of lighthouse cities like Nantes, Hamburg, and Helsinki. This framework emphasises the need for a common urban platform to promote interoperability inside the smart city ecosystem. Ref. [21] underlines the need to integrate resilience and smart city ideas into urban systems. Though there are no generally accepted frameworks, the research underlined the possible benefits of combining these ideas to enhance the general sustainability and adaptability of smart cities [22]. Moreover, a study by [9] identified the metrics influencing the integration of smart buildings into smart cities through the development of a framework (SBISC) that underlines the need to grasp the characteristics of the smart buildings and the innovations driving their capabilities in the urban setting by treating the city as a tech system.
Although evaluation frameworks of the smart building and smart city framework have been developed over different timeframes, the current frameworks assiduously consider energy efficiency [23], urban management, and sustainability, while also integrating advanced technologies, including artificial intelligence (AI) [24,25,26]. These assessment frameworks for the smart building often lack on various accounts due to unclear definitions [27], the absence of taxonomy that makes the arrangement and categorisation of different elements and subsystems complex [9], scalability [28], unclear core dimensions in the smart city framework [11,29], a lack of automation schema [9,11], and challenges with predicting the upgraded cycle and technological modifications of the chosen systems, following long-term objectives and among constraints of incorporation [9,24,30]. Therefore, it is important to create a classification system of smart buildings and to evaluate the relative progress of smart buildings’ integration in the context of smart cities. The first requirement is that it demonstrates a systematic way to assess and improve smart buildings’ performance and alignment with higher-level smart city challenges, including sustainability, efficiency, and resilience [11,31]. A well-defined classification system helps align the functionalities of smart buildings with the smart city infrastructure [27], thus enabling smooth integration and interoperability. As smart buildings and smart cities evolved in different eras and by different players, this alignment is crucial to exploring their true potential. In addition, a classification system helps to create benchmarks for smart buildings and compare their performance so that stakeholders are in a position to see where the good practices are and where improvements can be made [6,32].
The growth of machine learning solutions in construction accentuates the significance of its applications. The application of machine learning in smart buildings and smart cities can create an interconnected framework and promote the emergence of smarter cities, including explainability [33,34], optimisation [35], and prediction [36]. The explainable artificial intelligence (XAI) serves as a pillar that ensures transparency and confidence in decision-making processes [34]. This clarity allows for creative optimisation, hence enabling appropriate system tuning for HVAC in buildings and transit networks in urban environments. Evolving systems produce data essential for ML models, hence enabling the precise forecasts of occupancy trends, energy needs, and traffic. The machine learning models, for instance, predict usage patterns and adjust the settings of engineering systems in smart buildings toward greater efficiency and comfort. The SmartLaundry system uses machine learning for the daily estimation of public laundry machines’ usage, improving their allocation and reducing waiting time [37]. These predictions then form recommendation systems, providing personalised recommendations for energy use, transportation routes, and policy choices, among other things. This is an iterative process, where the generation of these recommendations creates new data, which are then analysed and interpreted through XAI, which in turn creates more recommendations. By leveraging advanced techniques, including deep learning and reinforcement learning, this integrative approach creates a closed-loop system that continually optimises and refines the intelligence and performance of smart buildings and cities.
Despite mounting smart city development interests, there are three research gaps yet to be addressed: the absence of scalable and predictive frameworks for assessing smart building integration, the lack of standardised taxonomy to categorise smart building services across infrastructure domains and their integration, and the infrequent usage of interpretable ML techniques for analysing building integration at the city level. While all three gaps are conceptually considered, the empirical focus is primarily on the development of predictive ML models and interpretable feature analysis, with the taxonomy gap serving as a conceptual foundation. Thus, this study seeks to achieve three central objectives:
  • To build and fine-tune machine learning models for assessing the level of smart building integration into a smart city and enabling predictive and scalable evaluation;
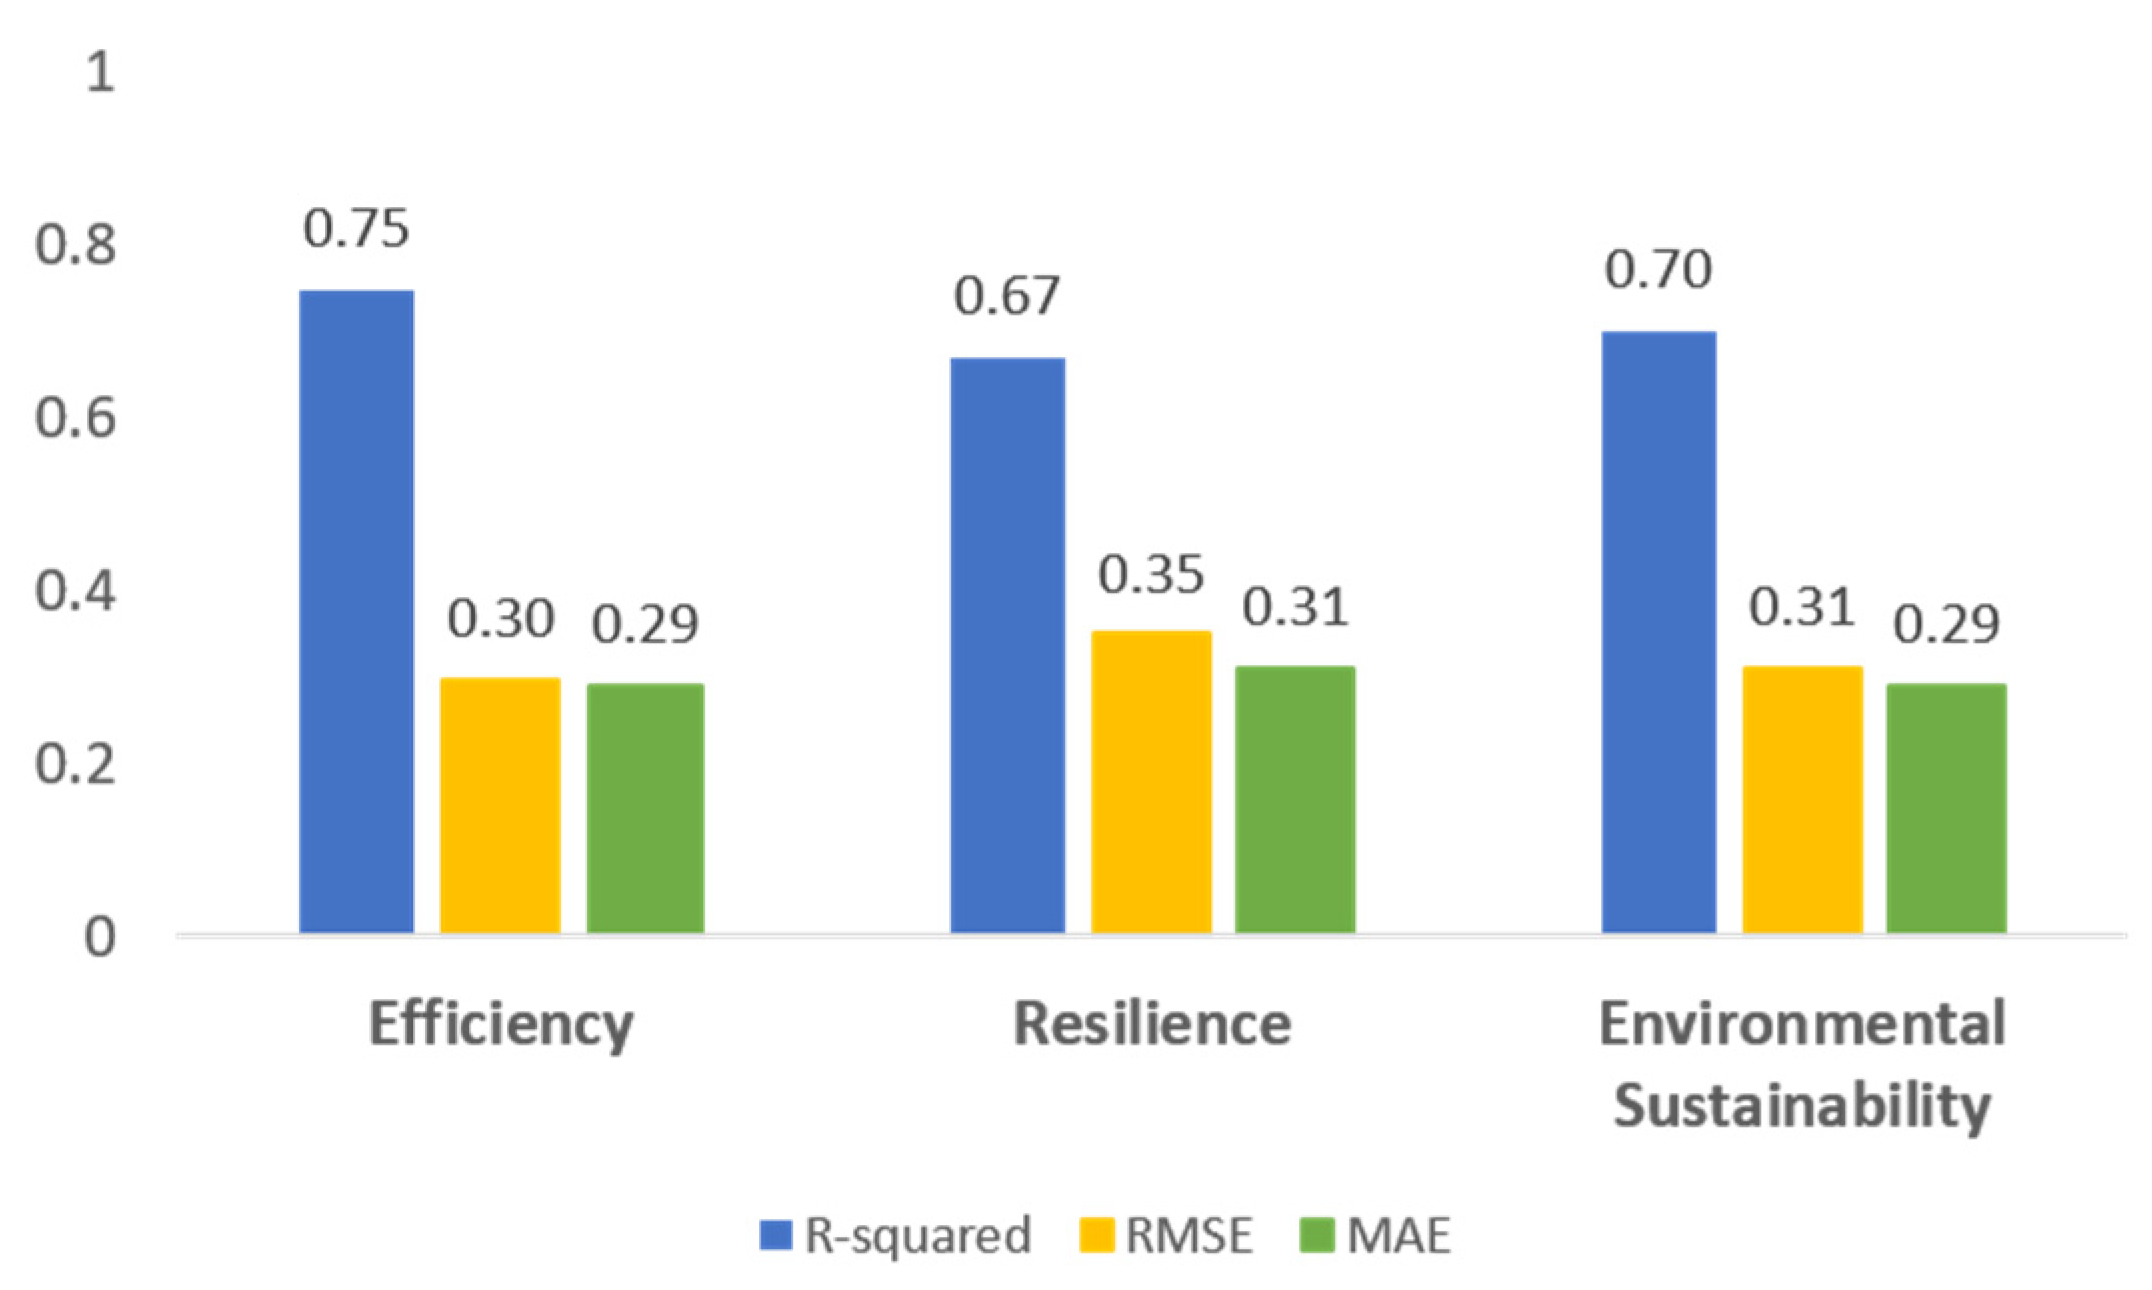
  • To evaluate, from an evidence-based perspective, the impact of smart building integration on smart city efficiency, resilience, and environmental sustainability, thereby operationalising integration at the core of urban performance;
  • To inform urban planners and decision-makers on how smart buildings’ integration in smart cities could be enhanced to help policymaking and strategic thinking, by utilising a validated and explainable AI-based evaluation framework.
This paper is organised in the following structured approach: Section 2 provides a state-of-the-art desk analysis of the assessment methodologies and applications of machine learning for smart buildings and smart cities. Section 3 elaborates on the presentation of the theoretical framework and experimental method employed in this study. The output results from Section 3 are analysed, described, and comprehensively discussed in Section 4. Finally, the authors present the conclusion, highlighting their contributions to the field and suggesting potential directions for future research in Section 5.

2. Literature Review

2.1. Assessment Frameworks for Smart Buildings and Smart Cities

The rapid advancement of technology and the growing emphasis on sustainability have spurred the development of numerous rating systems and evaluation frameworks. From green building certifications such as LEED and BREEAM to smart city assessment schemes, these tools aim to provide standardised metrics for measuring the various aspects of urban intelligence and environmental performance. However, the current landscape of assessment methodologies shows limitations in representing the diversity of a “smartness” that varies across scales and development contexts. It has some inherent properties of integration and generality, and it has also become an important research theme in the field of decision-making and industry applications [38,39,40,41].
The evaluation methodology of existing buildings is a critical aspect of ensuring their safety, functionality, and sustainability. Various rating systems and schemes have been developed to provide guidelines and standards for evaluating different aspects of buildings, such as energy efficiency, indoor environmental quality, and overall environmental impact. Green building rating schemes are widely used in different countries in North America, Europe, and Asia: Green Globes (Canada), LEED (USA), BREEAM (United Kingdom), DGNB (Germany), GRIHA (India), Green Mark (Singapore), CASBEE (Japan), ESTIDAMA (Pearl Rating System) (UAE), GSAS (Qatar), Green Star (Australia) and others. These building rating systems provide frameworks for assessing and improving the sustainability of buildings [42,43]. Each system has its unique focus and regional applicability, but all aim to reduce the environmental impact and enhance occupants’ well-being through sustainable design and construction practices. For instance, the UAE and Qatar developed their own rating systems (ESTIDAMA [44,45] and GSAS (formally QSAS) [46], respectively), which were created to meet the needs of the local environment, regulations, and sustainability priorities for sustainable building design that differ from those in international systems such as LEED and BREEAM.
Moreover, those assessment frameworks have their own set of indicators, weights, and evaluation mechanisms. For instance, research by [47,48] reported the complexity of the system and the heterogeneity of the indicators, such as multi-level indicator hierarchies and classification standards, which are established in some indicator frameworks, such as a 15 s-level and 45 three-level indicator system with a 4-level classification standard in China, indicating diverse structures and levels of certification among regions and systems. A further review stresses the importance of developing flexible and regionally specific evaluation indicators and integration with interdisciplinary research and life-cycle assessments in order to correct the discrepancies in current systems [49]. For example, the Pearl Rating System (PBR) was developed specifically for the government buildings in Abu Dhabi, which is the first rating system to ensure a good performance in terms of energy, water, materials, and local use. The Ministry of Education, for instance, should set a minimum score for the use of renewable energy [50]. GSAS, on the other hand, is designed as a Qatar-specific tool to assess buildings based on energy, water, urban connectivity, and culture, and is supported by LCA to prove the reductions in the environmental impact. The range of definitions and lack of uniform methodology to determine weight and select indicators also highlight the inconsistency in green building certification systems.
A study by [51] presented a “typology of smart city evaluation tools and indicator sets” based on the analysis of 34 smart city assessment schemes. The author addresses that the smart city comprises many more domains than smart buildings; this heterogeneity stems from the lack of a universal consensus definition of the smart city, which inherently makes the standardisation task a complex one. Further, ref. [52] highlights that the confusion stems from different application scenarios, designers, and decision-makers who often ascertain their desired assessment frameworks swiftly and effectively. Similarly, Ref. [53] notes that the results of the smart city assessment framework create biases due to a lack of a common and shareable comprehensive evaluation system, as well as fragmented definitions. Thus, considering this reasoning, not every smart building is equipped to function and fully leverage the various potentials of a smart city network.
Researchers have conducted several studies to evaluate the smartness of cities and buildings and to develop frameworks and tools for assessing their integration into smart city environments [6,11,54]. The features that smart buildings should fulfil to be compatible with the overall context of a smart city platform are introduced by [9,11,31,55]. However, as previously observed, most studies focus on evaluating specific aspects at the periphery of the smart city [56], such as energy efficiency. Lately, integrated intelligent transportation systems are attempting to address urban transport issues alongside sustainable mobility and smart water management [57]. In contrast, several frameworks have been proposed by researchers to enhance the development of smart cities by intermingling with smart buildings. Another study by [9] emphasises the importance of smart buildings adopting features such as smart materials, services, and construction to make integration easier in the specific smart city domains. Moreover, Ref. [19] developed an extensive methodology by combining the KPIs of smart buildings and smart sustainable cities. This method makes it possible to estimate the smartness impact of one building and advise on which part needs to be adjusted, especially for future retrofit action based on complete KPIs. Concerning the findings of the study, the author emphasises the difficulty of reaching a consensus on an international smart building assessment standard due to holistic differences (cultural and development level) between countries.
The modified EU Energy Performance of Buildings Directive (EPBD) 2018/844 presented the Smart Readiness Indicator (SRI), a calculation technique for buildings, established in 2018 by the European Commission DG Energy. The SRI evaluates the technological preparedness of buildings by examining their ability to engage with inhabitants and energy grids, thus facilitating enhanced operation and optimum performance through the utilisation of ICTs. The SRI score provides a conclusive assessment of the smart-ready capability levels of 52 building services across 10 primary domains. The SRI technique is anticipated to serve as an effective EU-wide instrument for intelligently conducting smart-readiness assessments from the standpoint of energy efficiency. Further, Ref. [58] addressed that for the cold climate conditions in European countries, the baseline settings of the SRI are not directly suitable. Without any adjustment in the methodology, the SRI is unable to fulfil its original role as a universally applicable EU-wide framework.
A number of challenges persist in the assessment framework of smart buildings and smart cities. These include technological challenges, resilience, scalability, and the need for standardisation and interoperability [59,60]. Technological issues such as interoperability problems and seamless communication between different building systems and city-wide platforms still pose a challenge [61]. In addition, the large amount of data generated from the smart buildings raises concerns about cybersecurity and personal privacy protection. Legacy infrastructure also poses technical challenges because the integration of new technology within existing systems can be even more difficult. The significant initial capital investment required for smart building systems highlights scalability challenges and may constrain widespread adoption. However, multiple systems lack consistent standards, which further impede scaling [39,61], while a shortage of trained personnel to develop and manage these increasingly complex systems exacerbates this issue. As the urban community needs to evolve, questions of resilience and sustainability will often be wrapped up in how to ensure that smart building technologies are viable in the long term. Another key issue is balancing the long-term sustainability benefits against the environmental impact of using technology. Moreover, it remains exceedingly important to develop systems that can adapt to shifting climatic conditions and unexpected urban challenges.
The comprehensive analysis of the assessment methodology reveals the need for a paradigm shift in urban intelligence evaluation. These gaps reveal the complexity of gauging “smartness” in a shifting tech landscape. Future research needs to develop dynamic, automated, and flexible frameworks to respond to rapid innovation in diverse urban contexts. However, AI-powered analytics may be used to deal with the vast quantities of data generated by hundreds of municipal systems, enabling more nuanced and real-time smart city performance. And we need consistent and adaptable metrics that extend across both building-level and city-wide assessments. This may require some kind of hierarchical indicator scaling from the smart device to the urban ecosystem. The aim is to offer assessment instruments that determine current performance and predict and guide future smart city advances by maintaining urban sustainability and resilience.

2.2. Application of Machine Learning Techniques in Smart Building and Smart City Assessment

The previous section demonstrated that there are important gaps in the current evaluation frameworks, which are at the core of the proposed assessment methodologies. They can be related to the gap in the tools’ lack or the gap in standardised metrics. To overcome these challenges, artificial intelligence (AI), especially machine learning techniques, offers the possibility of improving the evaluation of smart building incorporation in the greater smart city ecosystem. In order for the framework to provide solutions to emerging complexities that need to be addressed, this subsection delves into the ML application in smart urban environments.
The integration of AI is becoming increasingly popular in the ICT platforms of smart cities since it can be used to manage the urban system and improve urban performance and efficiency [62,63]. AI may optimise traffic flow, control energy consumption in smart grids, and improve waste management systems [64,65,66]. One area of focus in this realm is the application of explainable AI (XAI) approaches that seek to enhance the transparency and interpretability of the AI models, enabling users to understand the rationale behind the decisions made by these systems [67]. Understanding the decisions made by the complex models of machine learning, the interpretable models play a pivotal role in this scenario; they are divided into intrinsic and post hoc interpretability as addressed by [68]. Intrinsic interpretability involves embedding transparency into the actual architecture of machine learning models and is typically accomplished by reducing the complexity of the model structure (e.g., Regression and Random Forest). These types of methods remain interpretable, as relationships between input and output can be directly read at the cost of limiting the knowledge of what kind of more complex functions can be captured [69]. Contrast this with post hoc interpretability, a class of techniques that explain model decisions once training has occurred [70], which describes how a model reached a given output. An explanatory analysis is widely known as a post hoc approach and is used to assess the importance of different features for some outcome [71].
Machine learning is a pillar delivering modern capabilities in prediction, optimisation, and decision-making. However, the complexity of these systems demands that explainable artificial intelligence (XAI) methods be leveraged to ensure transparency, interpretability, and trustworthiness. In the domain of smart cities, Ref. [33] reviewed different use cases on explainable AI and provided its potentials and challenges in smart city applications, while a systematic review focused on the concept of smarter eco-cities resulted in a strategy for leveraging AI and the Internet of Things (IoT) in strengthening various dimensions of urban life [62]. Through the application of XAI techniques, such as feature importance analysis, stakeholders gain clearer insights into the essential factors influencing smart building performance in these eco-cities. This method can assist in pinpointing essential characteristics that influence energy use [72], occupant satisfaction, and overall building performance [73], resulting in more informed decision-making. One challenge when utilising XAI methods is to make sure that the provided explanations are both comprehensive and trustworthy. Adding to the challenges, bias and fairness from training data can exacerbate environmental inequities and sustain existing integrative resource allocation trends [33,62,73]. The permutation feature importance technique is a powerful explanation method for machine learning models, especially in the context of predicting building energy use and managing traffic in smart cities. Permutation importance was used to interpret the XGBoost model estimates of building energy usage in the research by [74]. The study highlighted other determinants of projected energy use, such as “Energy Star Rating”, “Facility Type”, and “Floor Area”. This approach increased model transparency and fostered confidence in forecasts, thereby providing actionable insights for energy optimisation.
Researchers have explored the potential challenges and limitations of utilising machine learning in various domains of the smart city [75], such as the accuracy of prediction and optimisation. This matter is actually due to the nature and heterogeneity of the data. Data from smart cities result in a considerable amount of diverse data in terms of volume and sample diversity; the data require sophisticated pre-processing techniques to make it machine learning-compliant and machine learning-reliable [76]. The supervised machine learning algorithms can help in taking advantage of both labelled and unlabelled data. However, they may not have universal pre-processing standards, leading to performance discrepancies across the studies [77]. An example of that would be the balancing of the data, as such a dataset usually faces a class imbalance problem, which is considered a big problem in smart building techniques like SMOTE (Synthetic Minority Over-Sampling Technique) [78] and ROS (Random Over-Sampling) [79] have been utilised; however, their effectiveness varies from dataset to dataset, which can result in the overfitting or underrepresentation of minor classes.
In summary, the literature analysis highlights three recurring existing gaps: (1) diverging evaluation frameworks for smart buildings and smart cities, (2) non-uniform metrics and taxonomies that hinder scalability, and (3) the low use of machine learning in predictive integration modelling. Although a variety of frameworks exist, such as rating systems (LEED, BREEAM, SRI) and city-level readiness indicators, few research studies holistically align and integrate building-level functions and smart city performance dimensions. Furthermore, although a lot of studies realise the key role of AI, few of them use machine learning models in an interpretable and scalable way. This overlapping evidence motivates an integrative approach that leverages machine learning in classifying smart building integration and its impact on urban efficiency, resilience, and sustainability.

3. Methodology

The methodology of the presented study consists of several key components, including a theoretical framework, data collection and preparation, model development, and optimisation. This article continues the authors’ previous research for the development of the Evaluation Framework for Smart Building Integration into Smart City [10,31] and employs a comprehensive supervised machine learning approach to analyse and identify the most essential features and predict the integration level of smart buildings into smart cities.

3.1. An Overview of the Theoretical Framework

The conceptual framework presented by the authors provides a comprehensive vision of how smart buildings can be integrated into the fabric of smart cities, considering the role of digitalisation and technological aspects [10]. It is built upon three key layers, including the physical infrastructure layer, data layer, and functional or smart services layer. This holistic approach provides a structured way to analyse the complex process of integrating smart buildings into smart cities from a technological point of view. The study identified 26 factors related to smart building services that influence smart building integration into the smart city. These factors span five infrastructure domains of the smart city: energy, mobility, water, waste management, and security.
This detailed breakdown offers a comprehensive understanding of the technological aspects involved in integration and highlights how smart buildings contribute to overall smart city performance, considering efficiency, resilience, and environmental sustainability aspects. Due to the challenges in handling dynamic urban situations and rapid technology development, a unique methodology was applied for the development of the Evaluation Framework for Smart Building Integration into Smart City. Large Language Models (LLMs), specifically OpenAI’s ChatGPT and Google’s Bard, were utilised as AI experts to rate the impacts of the 26 smart service factors and their domains’ importance on their contribution to smart city performance; then, two rounds of the Delphi method involved human experts for the framework validation [31]. This approach allows for a dynamic, more nuanced, and comprehensive assessment of how smart building services impact SC performance across three key dimensions: efficiency, resilience, and environmental sustainability. It also provides a quantitative assessment of the relative importance of different SC infrastructure domains in facilitating smart building integration into the smart city. The validated framework demonstrates the potential of AI in analysing complex urban systems and generating valuable insights and is provided in Appendix A.

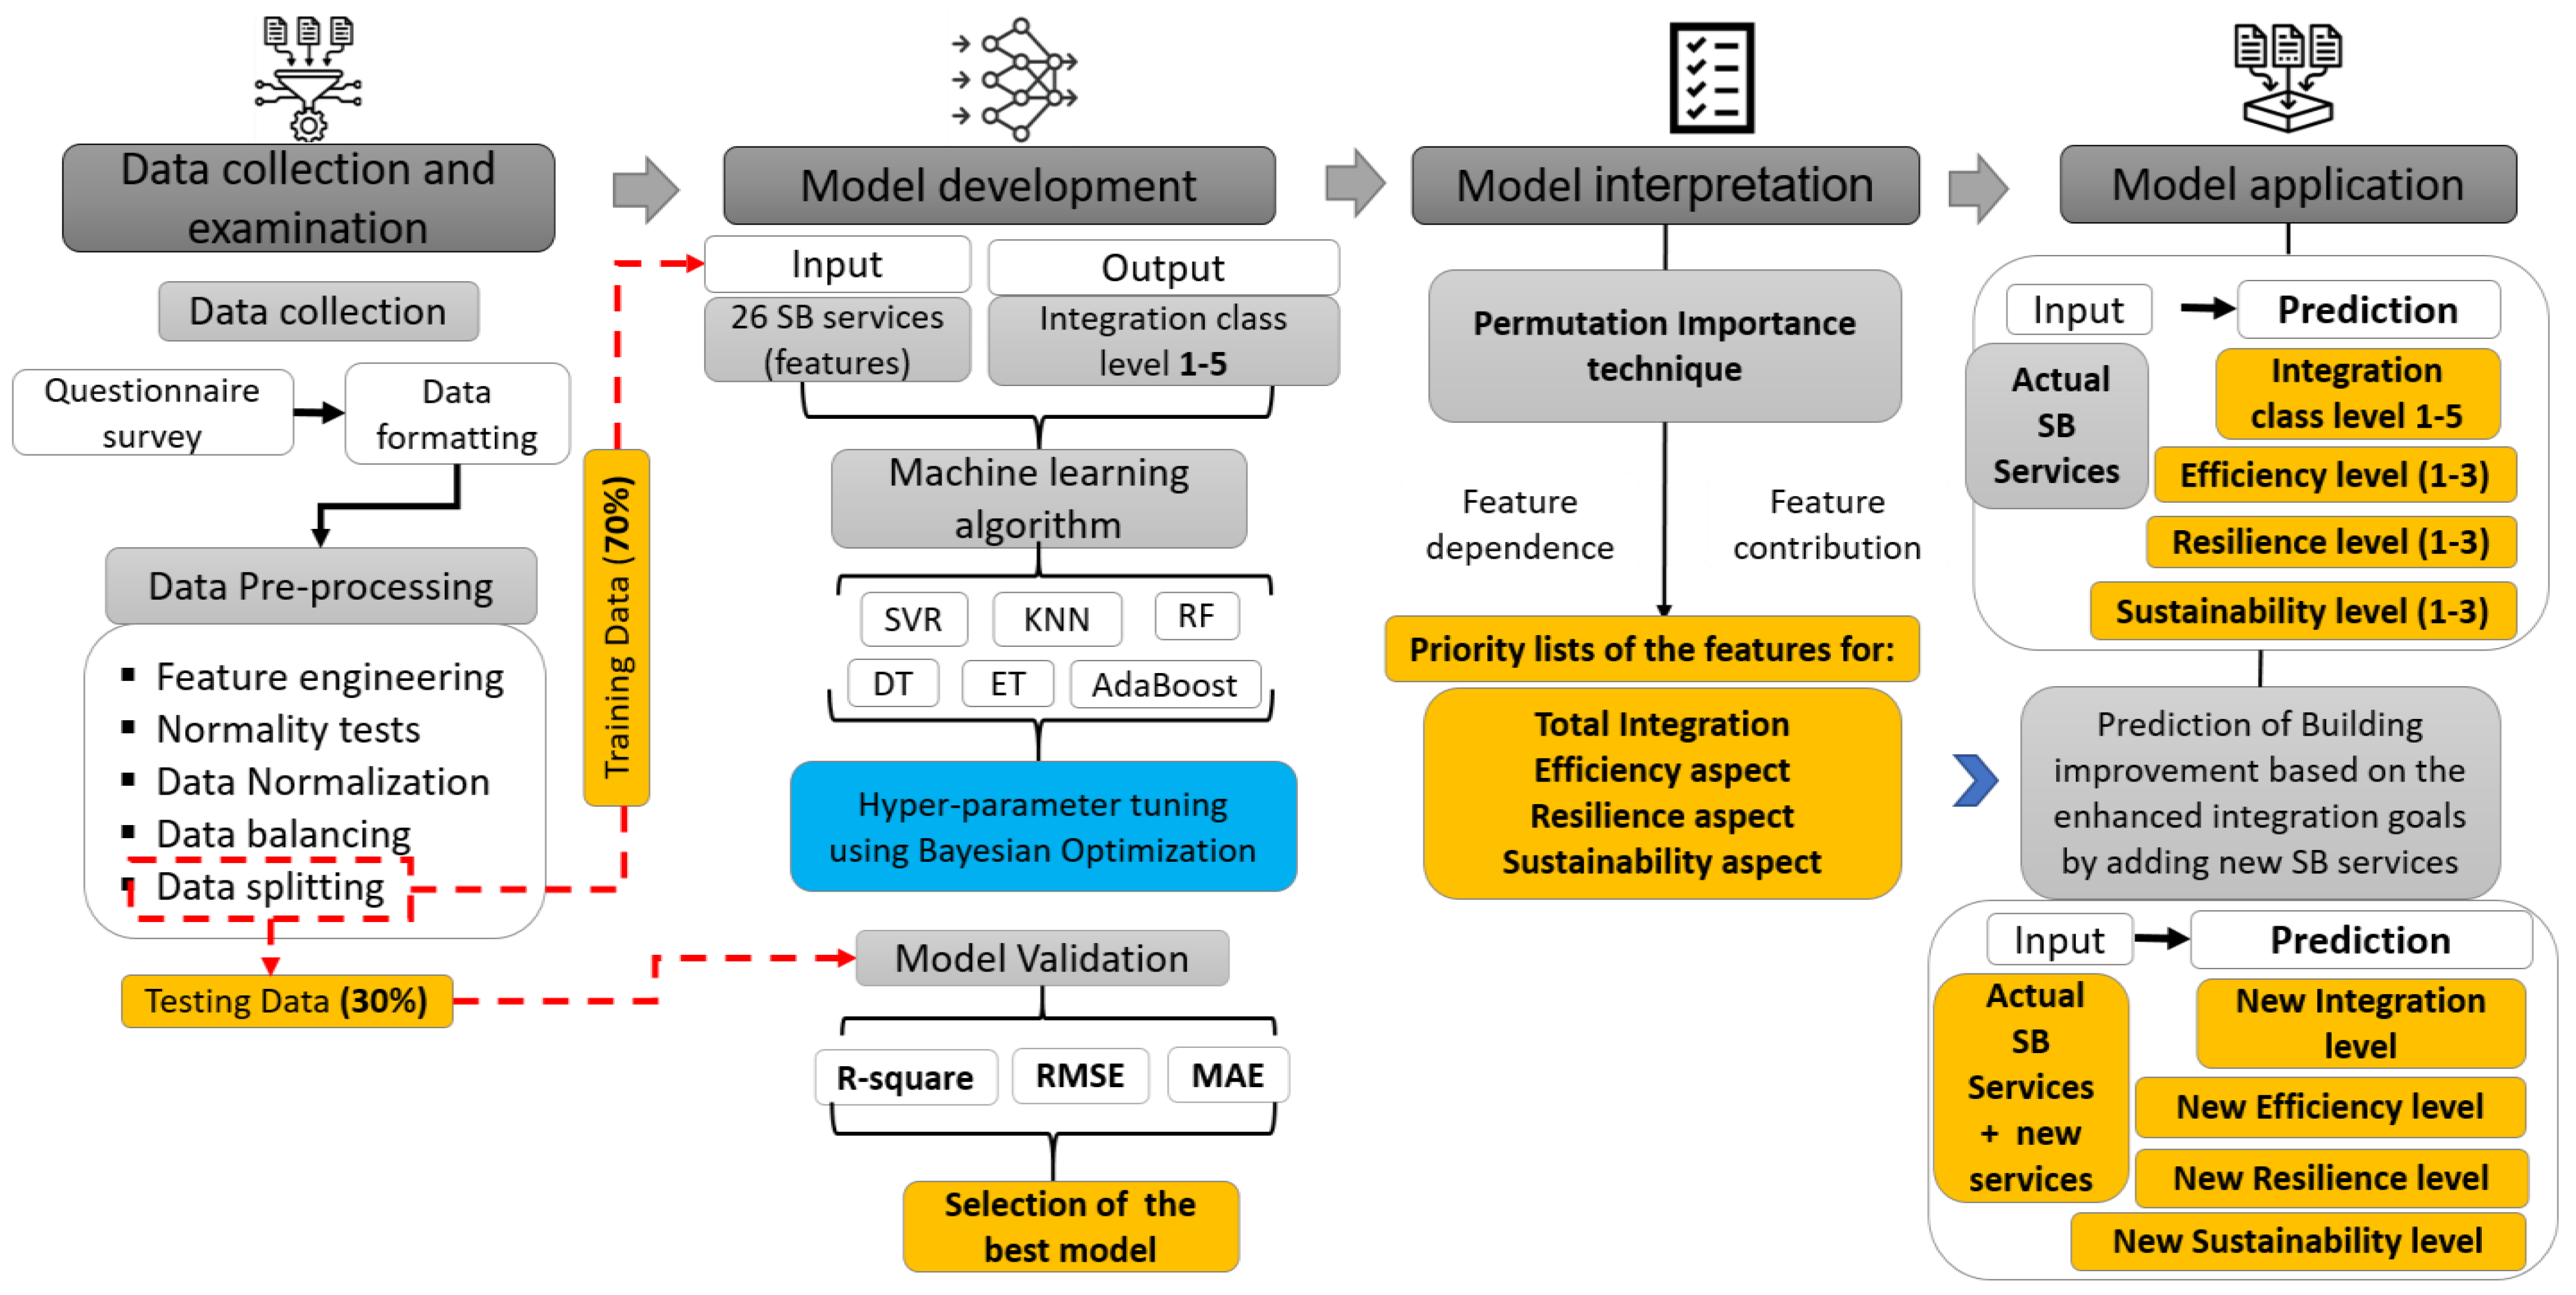
3.2. Development of the ML Model for Smart Building Integration into a Smart City

This study uses a dataset collected through a wide-scale survey from different geographical locations. The data collection period was active from February 2024 to December 2024.
Six machine learning algorithms were employed, which are K-Nearest Neighbours (KNNs), Support Vector Regression (SVR), Random Forest, Adaptive Boosting (AdaBoost), Decision Tree (DT), and Extra Tree (ET) on the Google Colab platform. Before model training and testing, the raw data were initially analysed and pre-processed to reduce the complexity of the model training. Finally, each model was evaluated using validation metrics. Consequently, the machine learning modelling for smart building integration into the smart city consists of several interrelated parts. Figure 1 below shows the process from the data preparation to the generation of the final model and its application for new building cases:
  • Step 1: Data collection, examination, and pre-processing;
  • Step 2: ML model development (training, testing, optimisation);
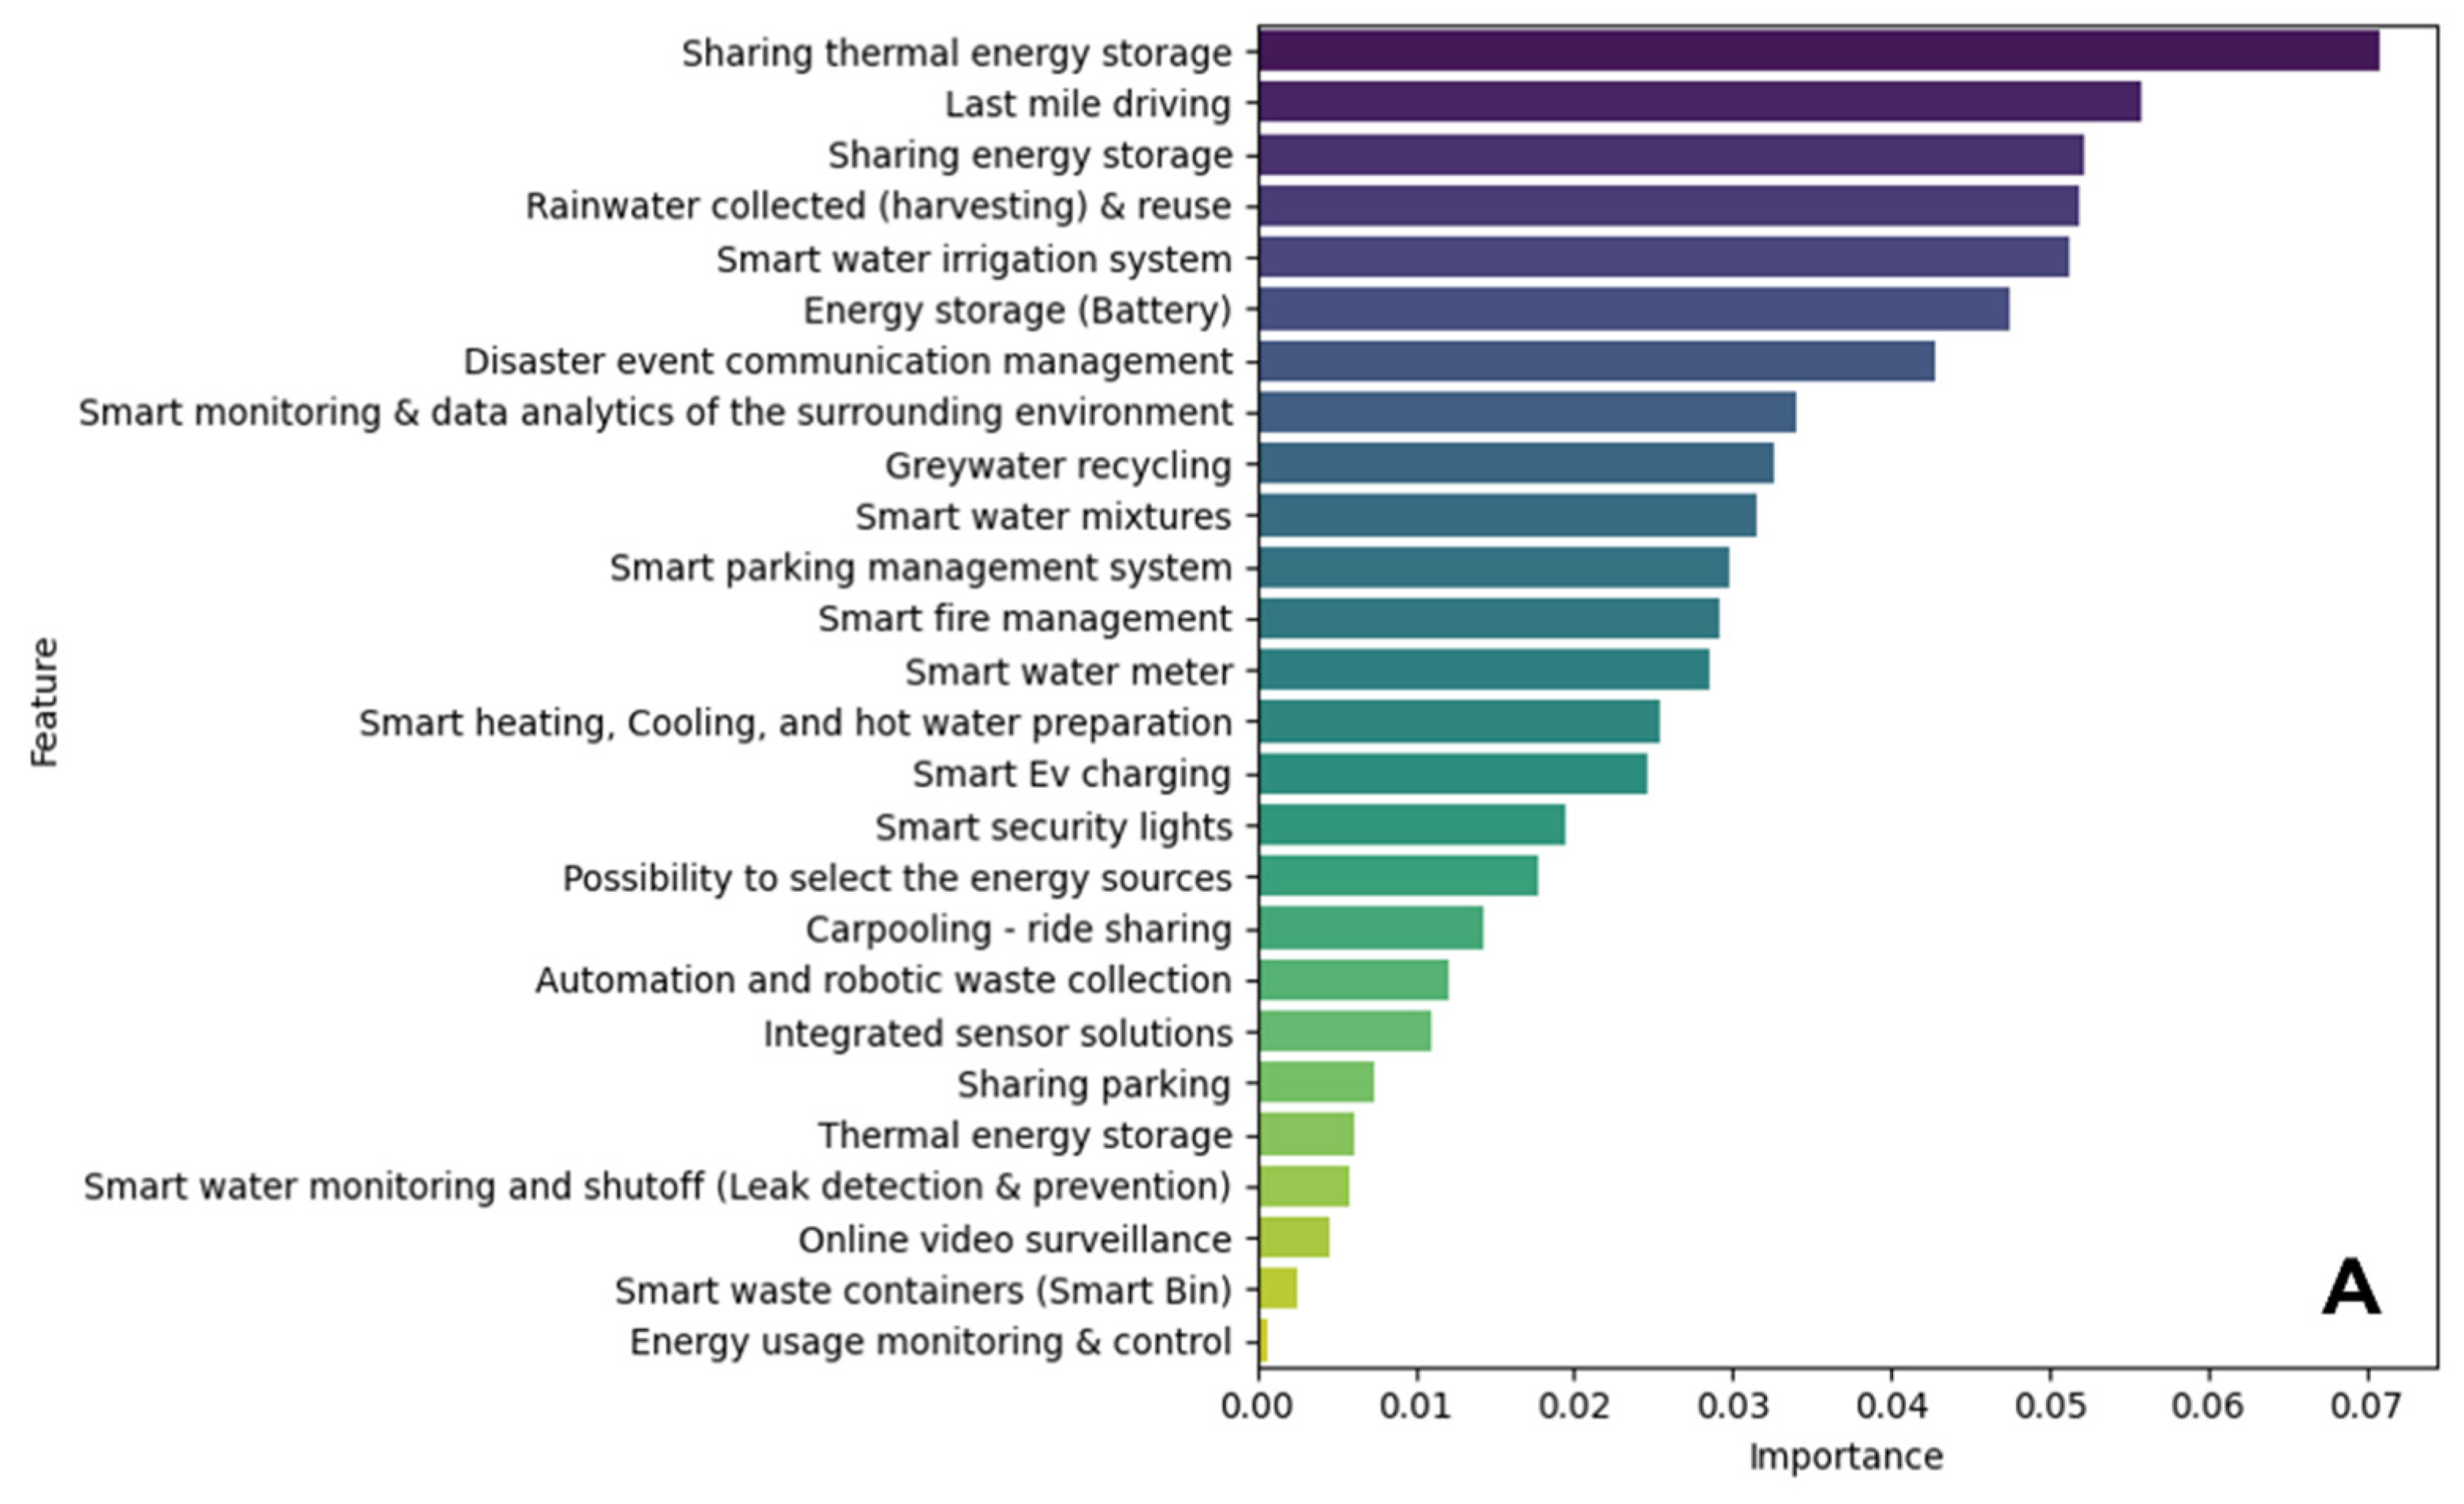
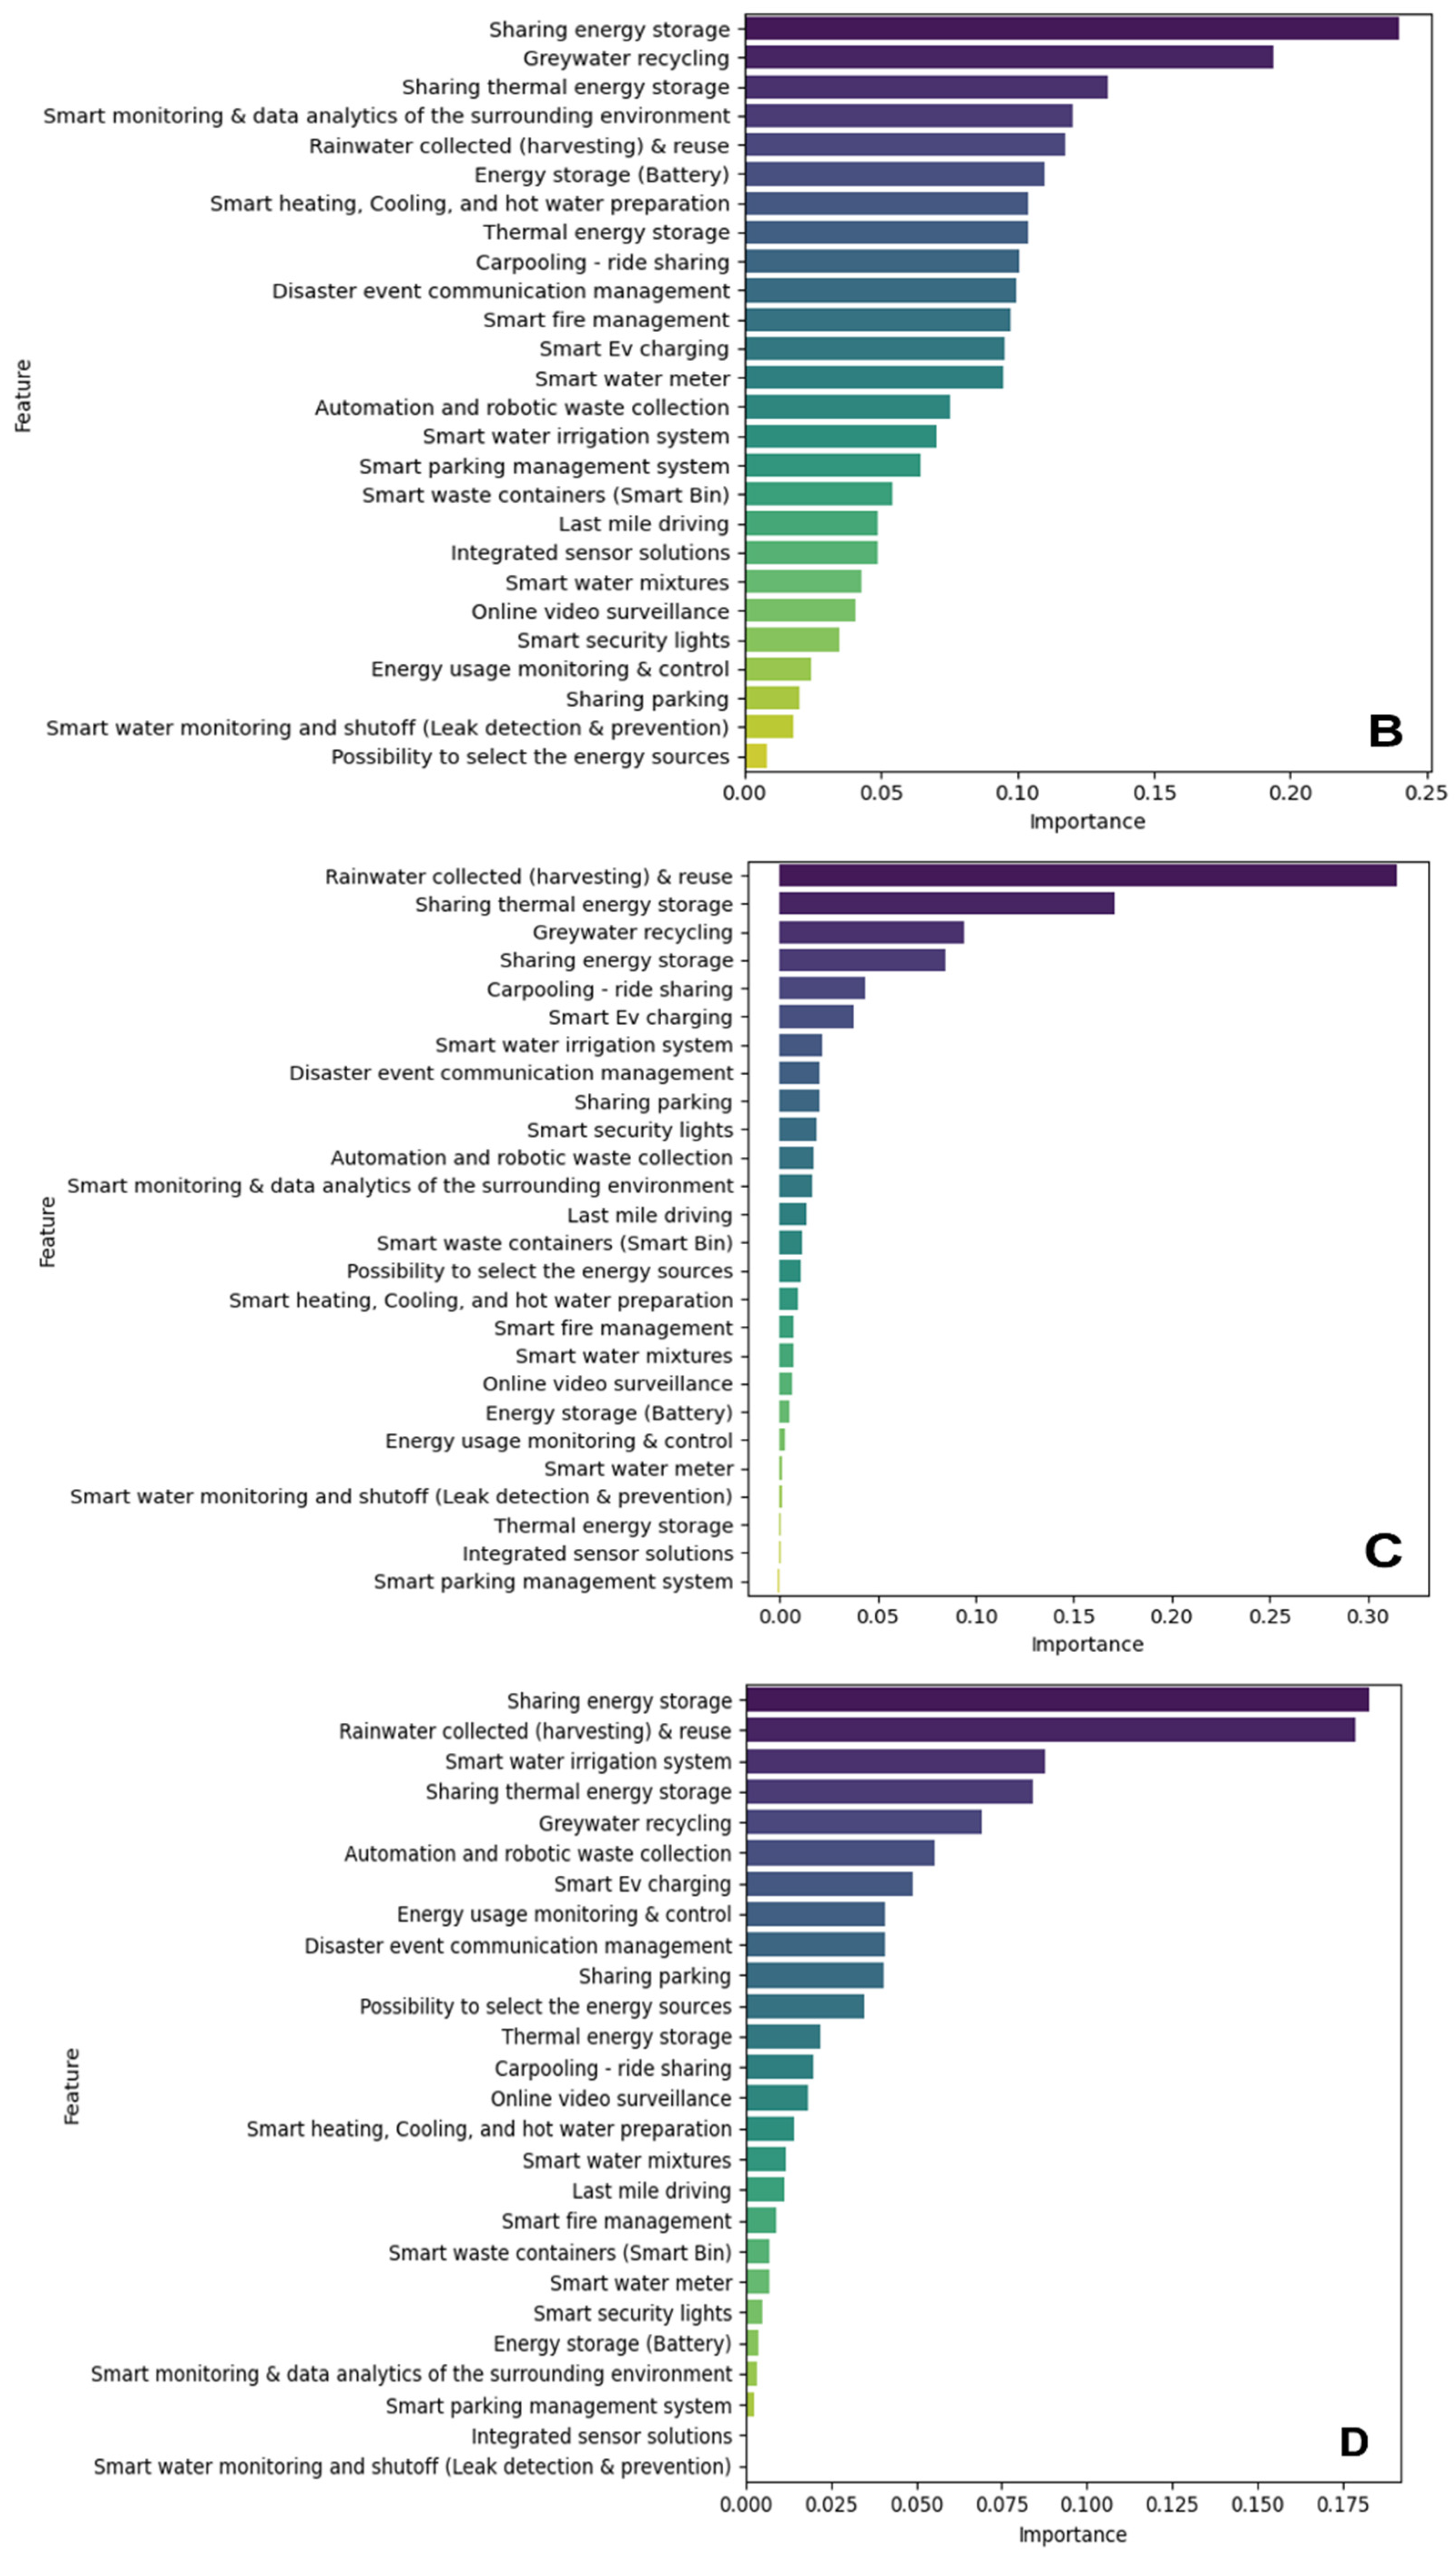
  • Step 3: ML model interpretation by using the permutation importance technique;
  • Step 4: ML model application for future predictions.
  • Step 1: Data collection, examination, and pre-processing
To address the scalability and diversity of the topic, this study used a comprehensive questionnaire to collect data on the integration of smart buildings into smart cities. We created and distributed an anonymised survey using Google Forms, reaching out to the buildings’ owners, operators, facility managers, and administrators.
The questionnaire is structured into three main sections related to building information. In the first section, information on the basic details of the building, such as its name, area, and location (city and country), was gathered. Further, the participants were asked to indicate if their building had undergone evaluation by any established rating system, such as the SRI, LEED, BREEAM, etc. This step serves as an initial filter, maintaining the importance of data quality in the building selection by having specific performance, impact, and technology measures. The survey’s third section focuses on evaluating the implementation of 26 smart services in five key domains: energy, mobility, water, waste management, and security. For each domain, the participants were asked to indicate whether the specific smart services were implemented in their building or not. Moreover, additional open-ended questions were included to capture any additional smart services not covered in the structured sections and to gather insights on potential future improvements. Accordingly, a dataset of 147 smart buildings, specifically smart offices, was collected from 13 distinct countries.
The dataset inspection phase is crucial for understanding the characteristics of the dataset and identifying potential issues before proceeding with further analysis. This phase involved handling missing data, feature engineering, and statistical normality tests.
  • Handling missing data: Missing values were explored after the collection of data and were addressed as a crucial aspect for the validity of any machine learning application. Two principles were used in this work to handle missing data: (1) the technical logic of the smart building systems’ interrelation and interdependency, and (2) data integrity and distribution consistency. Despite the fact that smart building features are often interconnected (e.g., if energy storage systems are installed, then energy monitoring infrastructure is deployed), the missing entries were contextually evaluated instead of treated as randomly dropped entries. Logic-based imputation was applied where relevant missing values were inferred based on system-level dependencies and prior distributions. In cases of features that did not have reliable inferential patterns or the values were missing completely at random, those records were removed or indicated to ensure structural bias did not exist. This approach guarantees the internal consistency of the output dataset and its suitability for prediction modelling, in particular when complex interactions among building properties have an effect on the integration results.
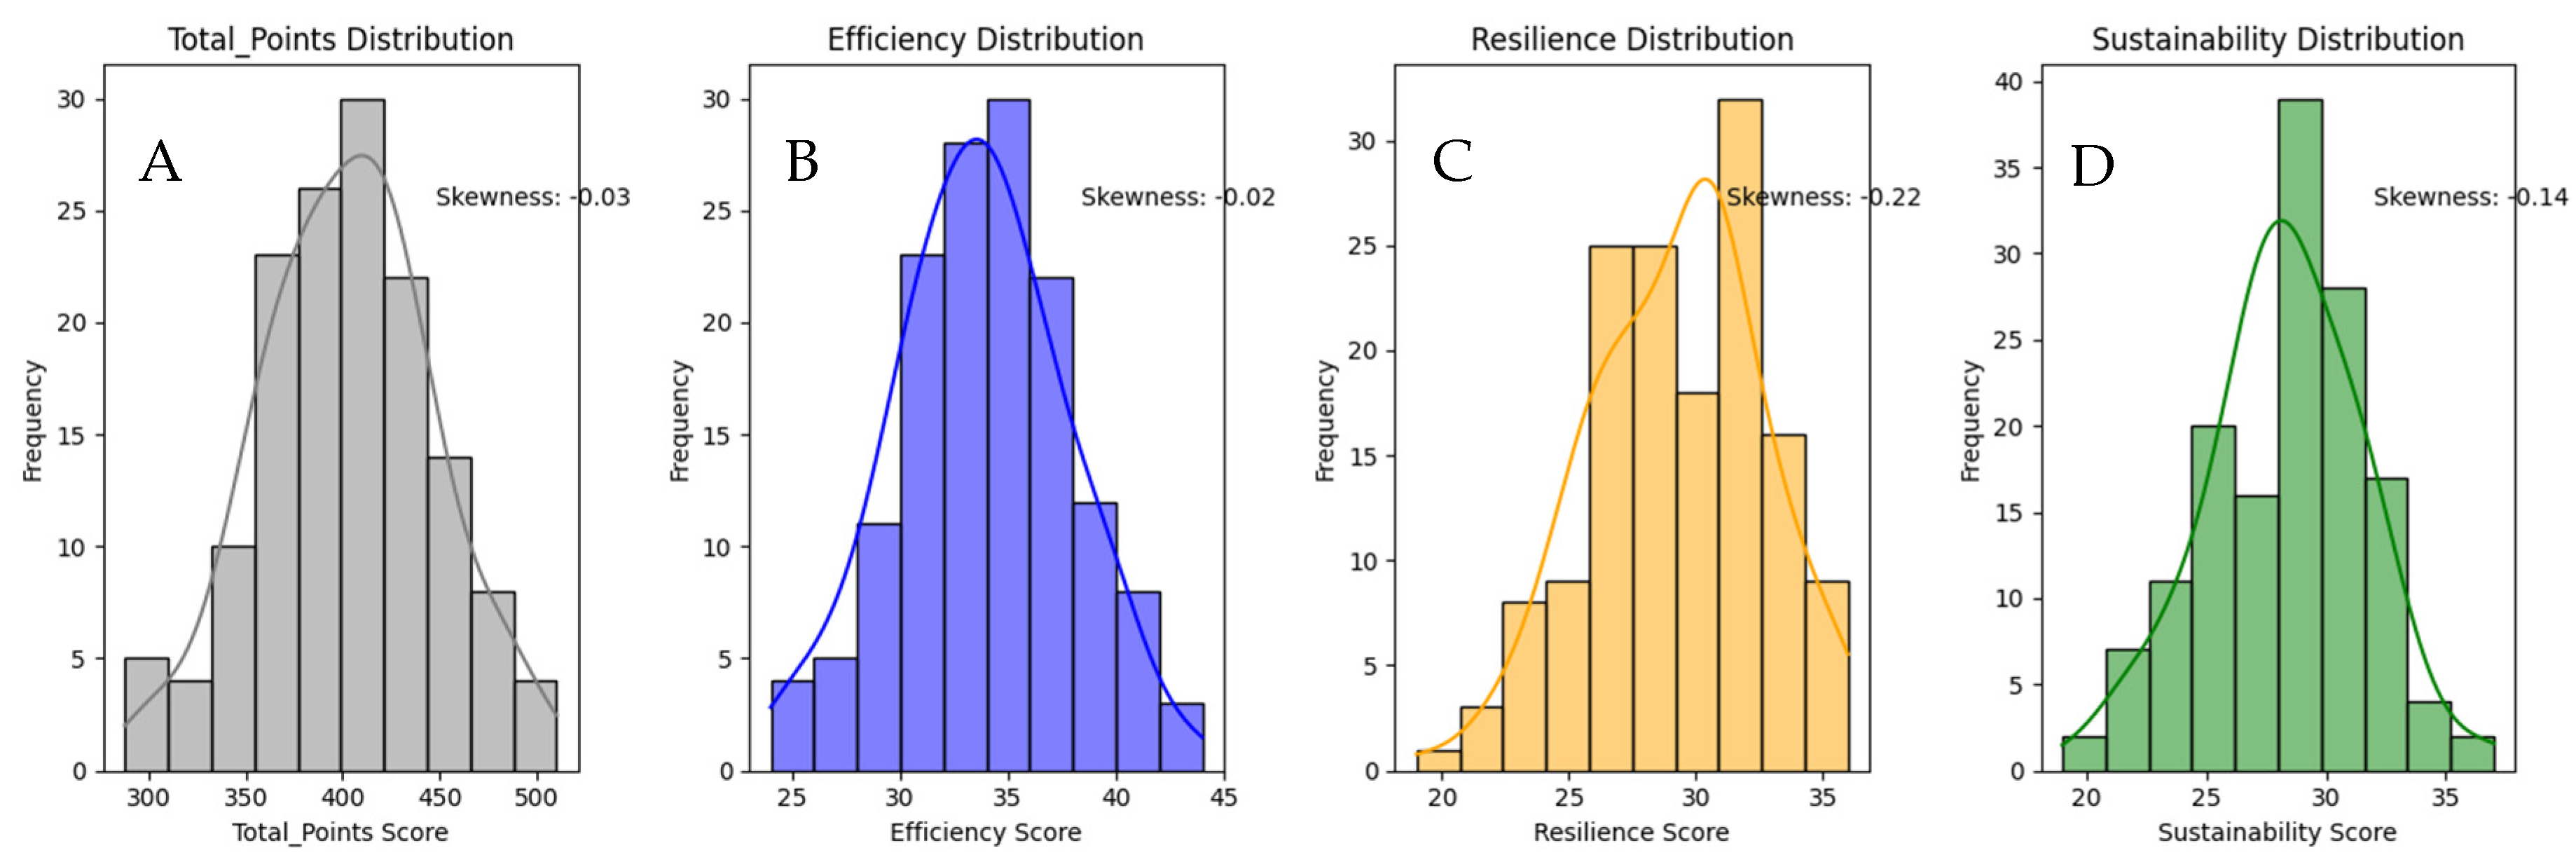
  • Feature engineering: Total points were calculated for each building based on the theoretical framework. The establishment range of total points was observed in the dataset by determining the minimum and maximum of the feature aggregation, and the range of total points was divided into five equal intervals, representing five distinct class levels. Buildings were then categorised into specific class levels based on their total points. Furthermore, scores for total integration and the impact on the efficiency, resilience, and environmental sustainability of smart city performance have been aggregated based on the factors’ actual impact presented in Appendix A. These scores were further assigned, accordingly, to the potential class level [80] of the SC performance aspects for each building.
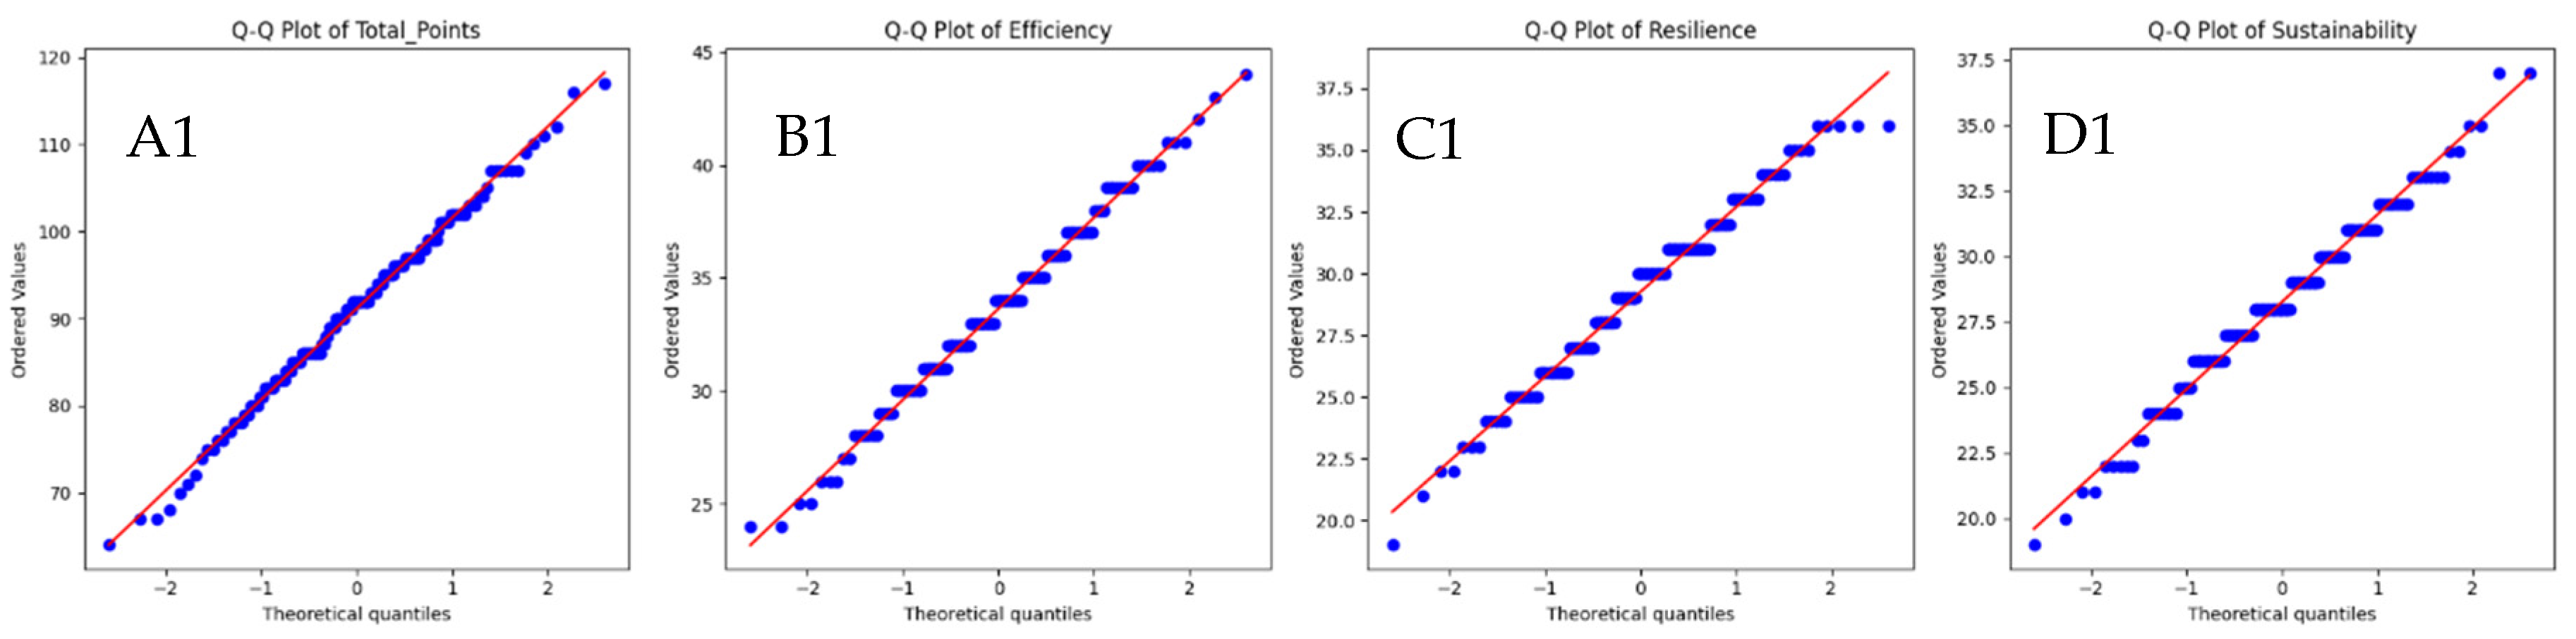
  • Statistical normality tests: Understanding dataset distribution remains relevant for predictive modelling. Although normality tests become negligible for samples over 100 [81], the Shapiro–Wilk test was conducted to assess whether the dataset followed a normal distribution. This method is particularly useful with small sample sizes of datasets by testing the null hypothesis that the data are normally distributed. Rejection of the null hypothesis suggests non-normally distributed data.
The preliminary dataset inspection and arrangement are grounded in established statistical principles and data analysis techniques for the next step of data pre-processing. The calculation of total points provides a quantitative measure of overall building performance, enabling objective comparisons between buildings. The classification approach employs a data-driven approach by determining the class intervals based on the observed range of total points. Dividing the range into equal intervals facilitates a clear interpretation of performance levels. Further, we elaborate on the machine learning model employed to systematically analyse the data gathered on smart building services.
Proceeding with data inspection is crucial in machine learning, and it usually consumes much time and computational power to ensure that the input data are suitable for the model training and analysis conducted through sequence phases. To prepare the dataset for model training, the following procedures are applied:
  • Data normalisation or standardisation is a standard procedure in machine learning and statistical analysis that ensures that no single variable disproportionately influences the model due to its scale, especially when models are sensitive to feature magnitude, such as KNN and SVR [82]. The two most widely used normalisation methods are min–max scaling (rescale the values to a [0, 1] range) and z-score standardisation (centre the data by subtracting the mean and scaling with the standard deviation to have unit variance).
    In this study, the features were all binary representations (0 or 1) of the availability of a smart building service in a building; thus, no transformation was necessary, as the features already had the same scale and similar semantic meanings (Appendix B and Appendix C). Attempts to apply normalisation might blur the discrete data. Therefore, the dataset was directly used in its raw binary format for model training and testing.
  • Data balancing: Given the potential for class imbalance in the target variable (integration level), the SMOTE (Synthetic Minority Over-Sampling) technique was applied to oversample the minority class and enhance model performance on imbalanced data [78]. Class imbalance occurs when one class has significantly more instances than another. This can lead to biassed models that favour the majority class. SMOTE addresses this issue by generating synthetic samples of the minority class to balance the class distribution, improving model performance for the underrepresented class.
  • Data splitting: Before training the algorithms, the dataset was split into training (70%) and testing (30%) sets, ensuring reproducibility and unbiased model evaluation.
After splitting the data, six machine learning algorithms were trained and tested using training and testing datasets, respectively, to identify the class level. The input values for the machine learning models were the 26 features available for each smart building in the training set to reach the target of predicting the integration class level for each building and their performance class level within the smart city in the context of efficiency, resilience, and sustainability.
  • Step 2: ML model development
The model development stage involves applying supervised machine learning principles and techniques to predict the class of the integration level for each building. The choice of algorithms, hyperparameter tuning methods, and model performance evaluation metrics is based on the theoretical foundations and empirical evidence from the field of machine learning. After the data were inspected, they were ready to be used by the ML algorithm. Before implementing the machine learning algorithms and generating the model, data partitioning was performed to separate the data into two sets: a training set and a testing set. The training set of data was used to train each machine learning algorithm and generate a predictive model that could output the class of the building integration level, while the rest of the data were held back to be used to test the trained predictive model. The partitioning process often raises several challenges that may affect the reliability and generalisability of the machine learning model. In this research, the imbalance for certain classes is disproportionately represented in the testing sample. This type of issue performs well on overrepresented classes but poorly on underrepresented ones, which can lead to biassed models. To mitigate this issue, the SMOTE technique was implemented to ensure the proportional representation of classes in both sets.
Then, six machine learning algorithms were used for this research, which were K-Nearest Neighbour (KNN), Support Vector Regression (SVR), Random Forest (RF), Adaptive Boosting (AdaBoost), Decision Tree (DT), and Extra Tree (ET), and the best-performing model was selected based on its ability to generalise well to unseen data. Table 1 explains why we chose each of the six algorithms based on their unique strengths, weaknesses, and how well they fit different data situations, thereby allowing us to assess model performance under various learning paradigms (e.g., instance-based, kernel-based, tree-based, and ensemble methods).
We leveraged Scikit-Learn [87], a robust Python machine learning module for importing these models. Further, instead of manually trying different combinations of hyperparameters, Bayesian optimisation techniques for hyperparameter tuning across different models were employed. This approach efficiently explores the hyperparameter space to find the set of values that yield the best model performance. Each model has its own specific search space tailored to its hyperparameters, and the optimisation process aims to maximise a chosen metric, usually R-squared. The optimisation process iteratively evaluates the model performance with different hyperparameter settings, updates the surrogate model based on the observed performance, and uses the acquisition function to select the next set of hyperparameters to try. This process continues for a specified number of iterations or until a satisfactory performance level is reached. In this research, 20 iterations were conducted for each model to find the best model parameter settings. Finding the delicate balance between complexity and predictive freedom determines the extent to which each model can be expected to generalise well. For example, depth-limiting parameters in the tree-based model and margin adjustment in the SVR are crucial for overfitting control. The functions and impact of hyperparameters on the model performance are summarised based on the information provided in the Scikit-learn user guide ensemble documentation [87] and presented in Table 2.
The entire modelling process was conducted using the Google Colab cloud platform environment hosted by Google. It provides free access to computing resources, including GPUs and TPUs, which are crucial for running complex machine learning models.
After finishing repeated tuning to its respective best parameters, each model was evaluated based on the R-squared (R2), Root Mean Square Error (RMSE), and Mean Absolute Error (MAE) to identify the best model for each ML algorithm. R-squared, RMSE, and MAE [88,89] are widely recognised for monitoring model selection and reflect different aspects of predictive performance and the purposes of this study. R-squared, as a measure of variance explained, in turn, favours models such as SVR, RF, and ET, which are successful in capturing complex, non-linear relationships, matching well with the goal to identify models that generalise well across a variety of building integration contexts. The RMSE gives more emphasis to a larger error and can identify a model that is more sensitive to the extreme failure of prediction and, therefore, gives more power to models like AdaBoost and RF, which include variance reduction a bit more easily when the large deviation cannot be operated on. On the contrary, MAE, treating all errors equally, allows us to pick models such as KNN and DT, which provide stable, interpretable predictions in the presence of noisy or skewed data. Overall, these measures jointly prevent model selection driven by a single criterion, and hence accuracy, robustness, and applicability to real-world data are traded off.
In the formulas as shown in Equations (1)–(3), respectively, given that Yt is the target (actual) value of the integration level from the dataset, Yp is the predicted value of the integration level by the machine learning model, n refers to the total number of data points (smart buildings) in the dataset during the testing, while i represents the specific number of each data point, which helps to identify which specific prediction (Yp) and actual value (Yt) pair are being used within summation.
R 2 = 1 Y t Y p 2 Y t m e a n   ( Y t   ) 2  
R M S E = i = 1 n ( Y t Y p 2 ) n  
M A E = i = 1 n | Y t Y p | n  
  • Step 3: ML model interpretation
The prediction modelling for this research was integrated with the permutation feature importance technique to obtain the importance of smart building services based on their impact on the trained machine learning model’s output parameter prediction. This method offers a robust means of understanding the model’s prediction process at a global level and provides highly compressed insights into the model [90,91]. It involves the identification of the features (smart building factors—SB services) that have the highest impact on the model’s output parameter (smart building integration level) prediction and enables the establishment of the importance and priority of each feature. This is very essential for the decision-making process when the building owners consider the building’s performance improvement to enhance the overall integration level, or specifically, efficiency, resilience, and environmental sustainability levels.
These insights can guide the decision-making process and prioritise the implementation of specific technologies for maximising the integration benefits for the building owner. Hence, each algorithm ranks features based on their contribution to prediction accuracy and inherently provides feature importance scores. Using the results from the feature importance analysis, a ranked list of priority factors is generated based on their significance and is recommended to be used in predicting future integration levels while considering the construction of the new or renovation/upgrade of the existing buildings. This list helps focus on the most critical features, reducing dimensionality and improving ML model interpretability.
  • Step 4: ML model application for future predictions
To demonstrate the practical applicability and effectiveness of the developed model for smart building performance and the improvement of integration level prediction, four buildings were selected to serve as case studies for detailed actual performance analysis and future improvement prediction. The selected buildings represent a variety of smart building implementation levels and feature combinations. For each selected case study, the best predictive model was used to predict the original performance level based on their existing features. Then, a simulated improvement scenario was introduced by proportionally increasing the values of the implemented top features. This simulated the impact of enhancing or adding specific functionalities to the building. The best model was then used to predict the new performance level after the potential feature enhancements and quantify the potential improvement in each performance dimension, i.e., efficiency, resilience, and environmental sustainability.

4. Results

4.1. Data Collection, Examination, and Pre-Processing

We conducted the data collection for this research using an online questionnaire survey. The approval of the Research Ethics Commission of Kaunas University of Technology No. M6-2024-02 was obtained in the prior stage to ensure the rigorous quality control of the protection of data privacy.
The survey includes data from 13 diverse countries, as displayed in part A of Figure 2, with a higher concentration of smart buildings in the United Arab Emirates (35 buildings) and the United States of America (34 buildings). Other notable countries include Saudi Arabia (17), Qatar (14), and Malaysia (12). The rating systems used in these buildings are shown in part B of Figure 2, where the most common certification is LEED (48.3%), covering 71 buildings and representing the predominant rating system, reflecting its global recognition, followed by BREEAM (25.9%), accounting for 38 buildings. Other certification systems include DGNB (8.8%, 13 buildings), SRI (6.1%, 9 buildings), and others (10.9%, 16 buildings), which may include various regional or proprietary rating systems. The areas of these buildings range from 3000 to 65,000 m2, with the total number of floors between 3 and 44. Furthermore, the majority of the buildings were constructed between 2011 and 2018, and very few were built between 2019 and 2022.
The collected data contain information on 147 smart office buildings comprising 26 features related to smart building services. These services represent five smart city domains: smart energy, smart mobility, smart water, smart waste management, and smart security, as presented in Appendix A.
In this study, to handle missing data provided in the survey, we analysed the data on a building-by-building basis. To address data inconsistencies, we applied a logical imputation strategy: if a building had implemented advanced services, we assumed that the prerequisite or less-advanced related services were also present, even if not explicitly reported. Particularly, as this study focused on smart buildings, such assumptions are reasonable within the technological context. For instance, in some cases, buildings were reported to have implemented the sharing of electrical energy storage, while the foundational services, such as electrical storage and renewable sources, are missing. Similarly, in the water system, we also noticed that a few buildings have implemented smart systems to detect water leakage, while the smart meters are missing. Therefore, we corrected these inconsistencies by assuming the availability of logically dependent services, as reported for advanced systems.
The total smart building integration into the smart city score was calculated as a sum of the factor scores, which show the impact of smart services on smart city performance, multiplied by the smart city domain weight. With a total of 147 smart building samples collected, the score for every single smart building in the dataset was calculated by aggregating the existing services that were implemented in the smart building. This results in four scores for each building: total integration points, total efficiency, total resilience, and total environmental sustainability points. The procedure for calculating the class level is based on a statistical approach [80]. Based on the range of scores, the class levels are defined as presented in Table 3 and Table 4.
In most real-world datasets, class imbalance is a common issue [92]. However, when there are too many classes to be efficient, resilient, or sustainable, it may be that some categories will be underrepresented and the model will generalise poorly. A system with three classes can help to ensure statistical stability, pushing predictive accuracy up while still keeping the meanings of the differentiable elements. At the total score level, a 5-class system is justifiable because the aggregation process smooths out fluctuations, making it possible to establish finer categories. This allows for a more nuanced distinction between buildings with small but meaningful differences in overall integration levels.
The tested normality distribution of the dataset is presented in Figure 3. The comprehensive analysis of the building scores distribution across buildings reveals crucial insights into the integration levels of smart buildings within smart cities, where the minimum and maximum scores were observed (288–512), respectively. The histogram demonstrates a nearly symmetrical bell-shaped distribution with a slight skewness of −0.03, with most buildings scoring between 380 and 440 and peaking around 410 (Figure 3A). This indicates that the data are central around this range, with a moderate spread and no apparent extreme outliers, and this finding is complemented by the Q-Q plot’s visual assessment of how closely the data points align with the diagonal line representing the theoretical quantiles of normal distribution (Figure 3(A1)). However, minor deviations are observed at the extreme tails, which are not substantial enough to suggest heavy-tailed behaviour of significant non-normality. Further, statistical validation through the Shapiro–Wilk test corroborates these observations (p-value = 0.91) and refers to rejecting the null hypothesis of normality at common significance levels (p-value ≥ 0.05). This statistical evidence, combined with the visual alignment in the Q-Q plot and the bell-shaped histogram, confirms that the data are approximately normally distributed.
The histograms in Figure 3B–D and Q-Q plots in Figure 3(B1–D1) indicate that all variables exhibit approximately normal distributions, with slight left skewness in resilience (skewness = −0.22) and environmental sustainability (skewness = −0.14). Shapiro–Wilk test results confirm the normality assumption for efficiency (p = 0.534), resilience (p = 0.076), and environmental sustainability (p = 0.173). Further, the Q-Q plots assess the normality by comparing the distribution of observation data (points) against a theoretical normal distribution (diagonal line), which confirms the dataset’s suitability for ML modelling, ensuring robust predictions of smart building integration levels that leverage features such as efficiency, resilience, and environmental sustainability.
Before training the model by applying the selected ML algorithms, the dataset was split into training (104 buildings) and testing (43 buildings) sets, ensuring reproducibility and unbiased model evaluation.

4.2. ML Model Development

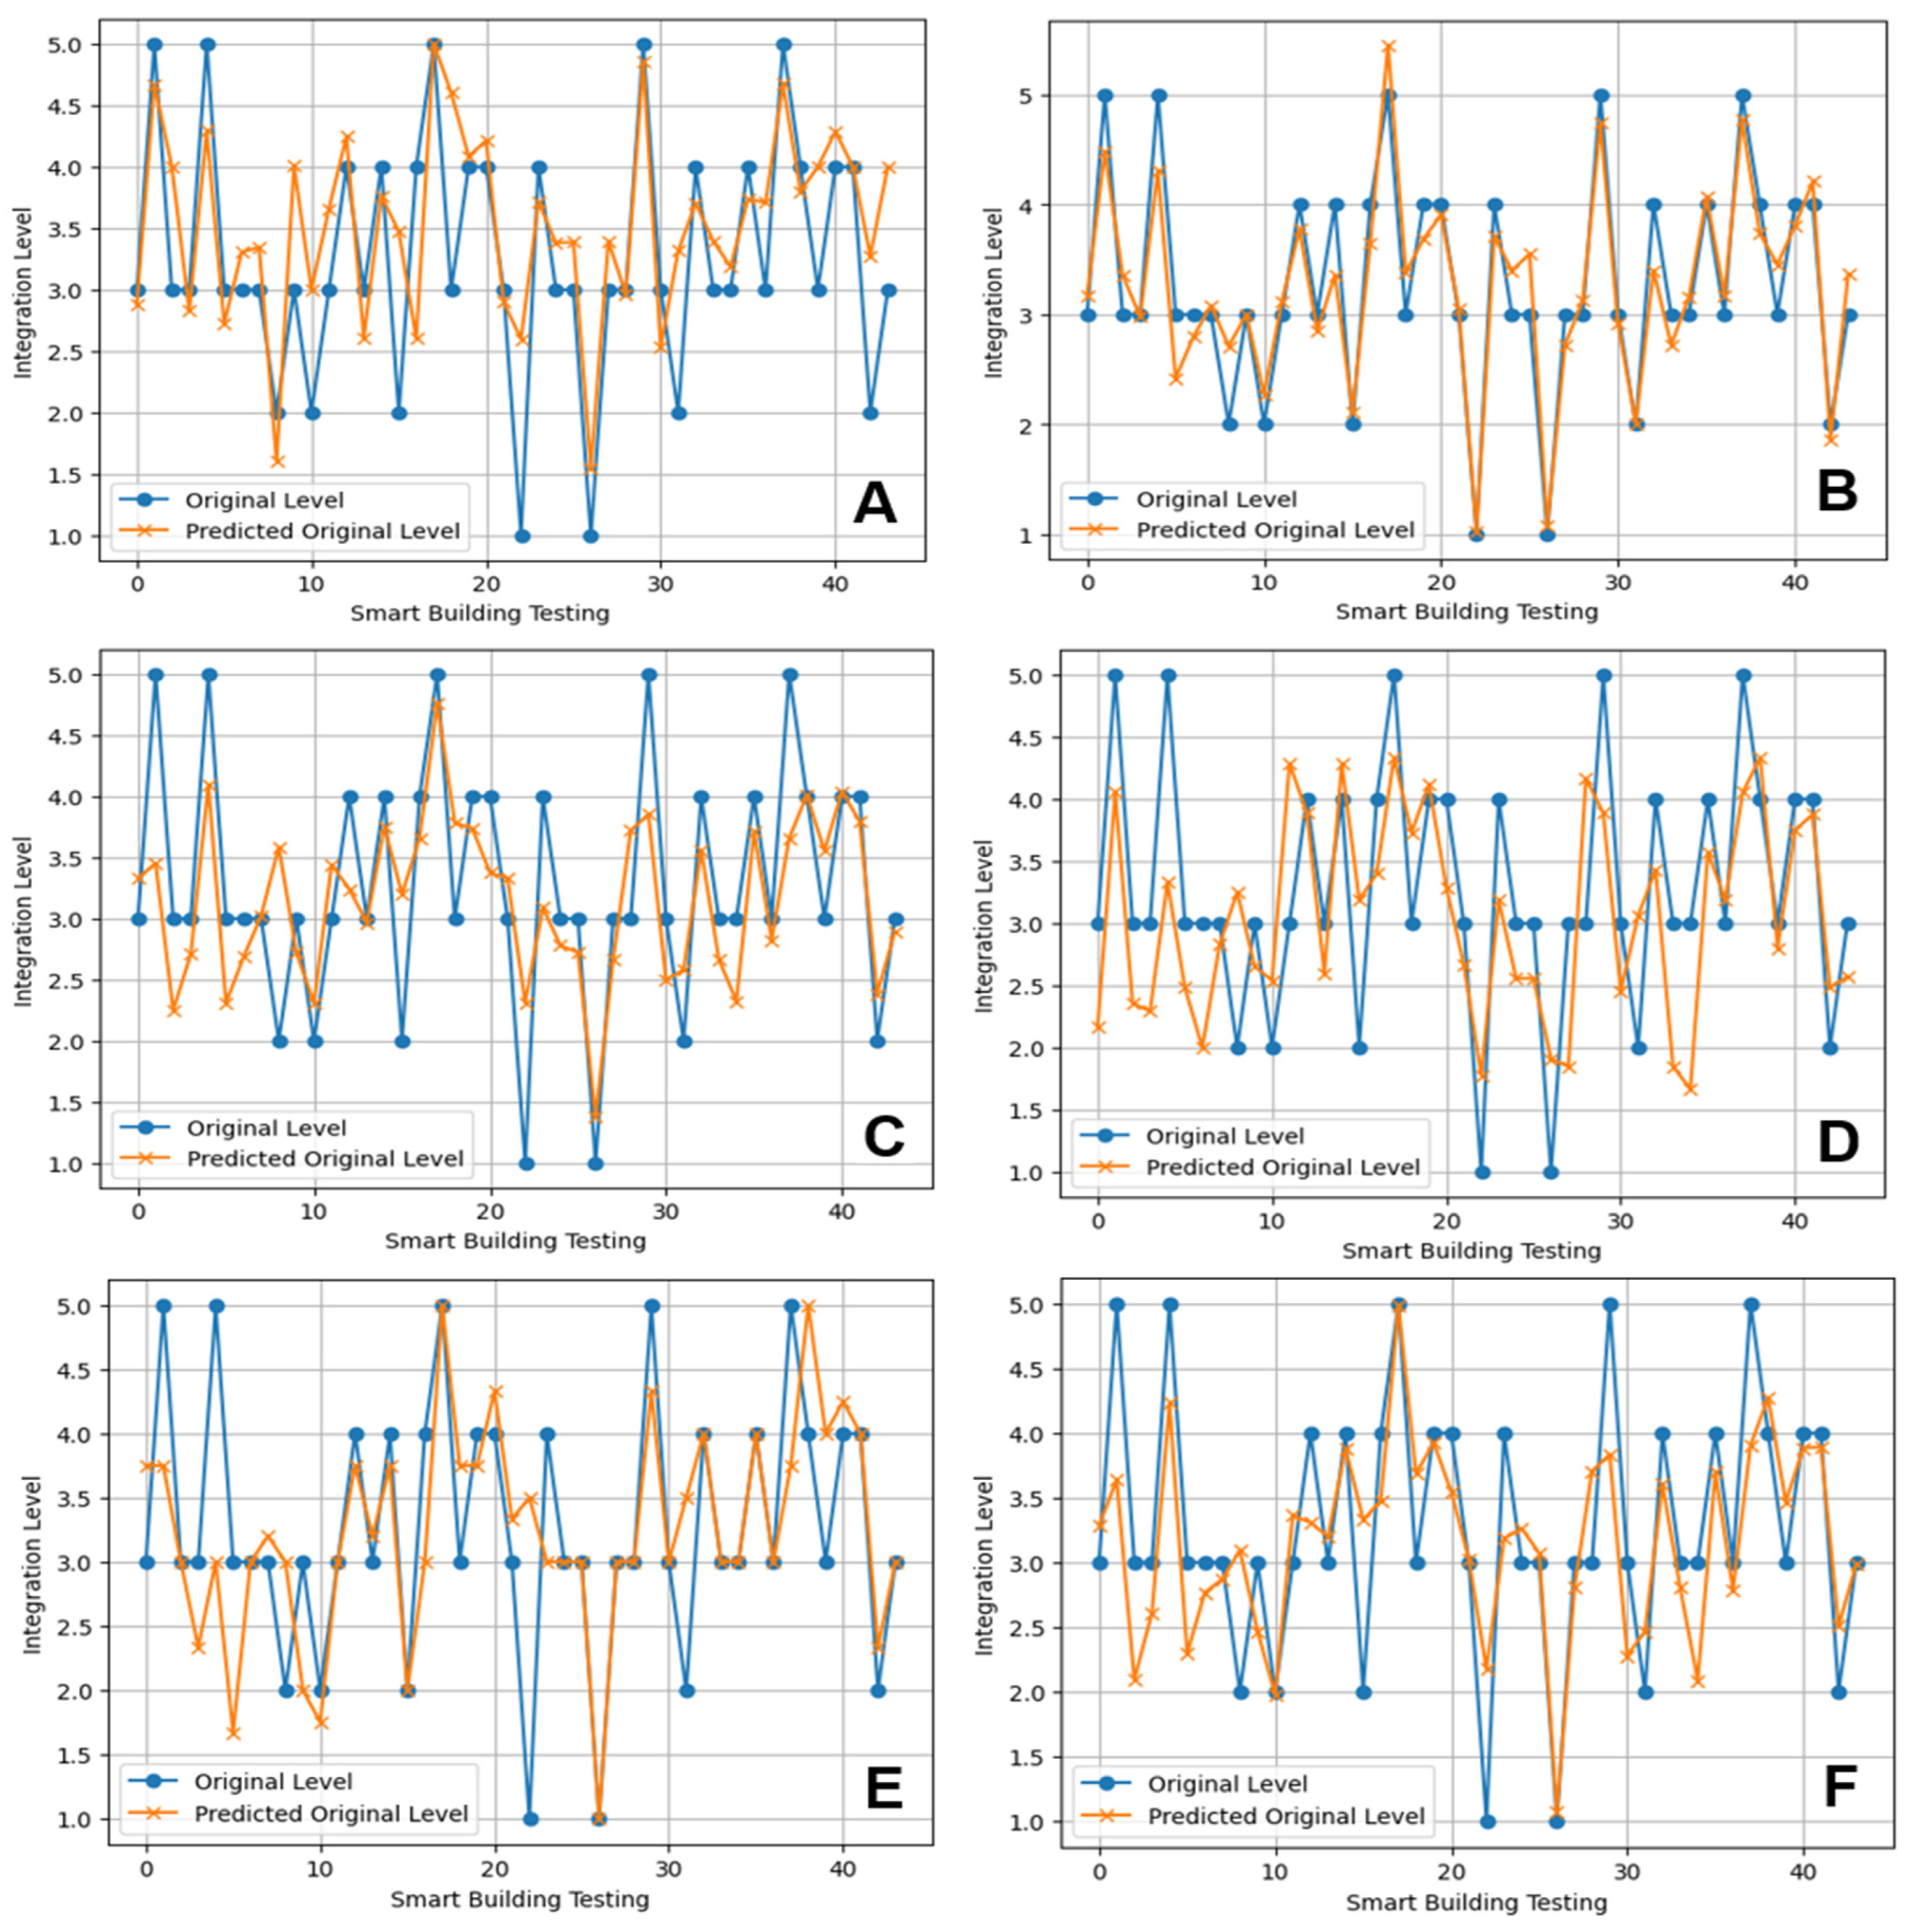
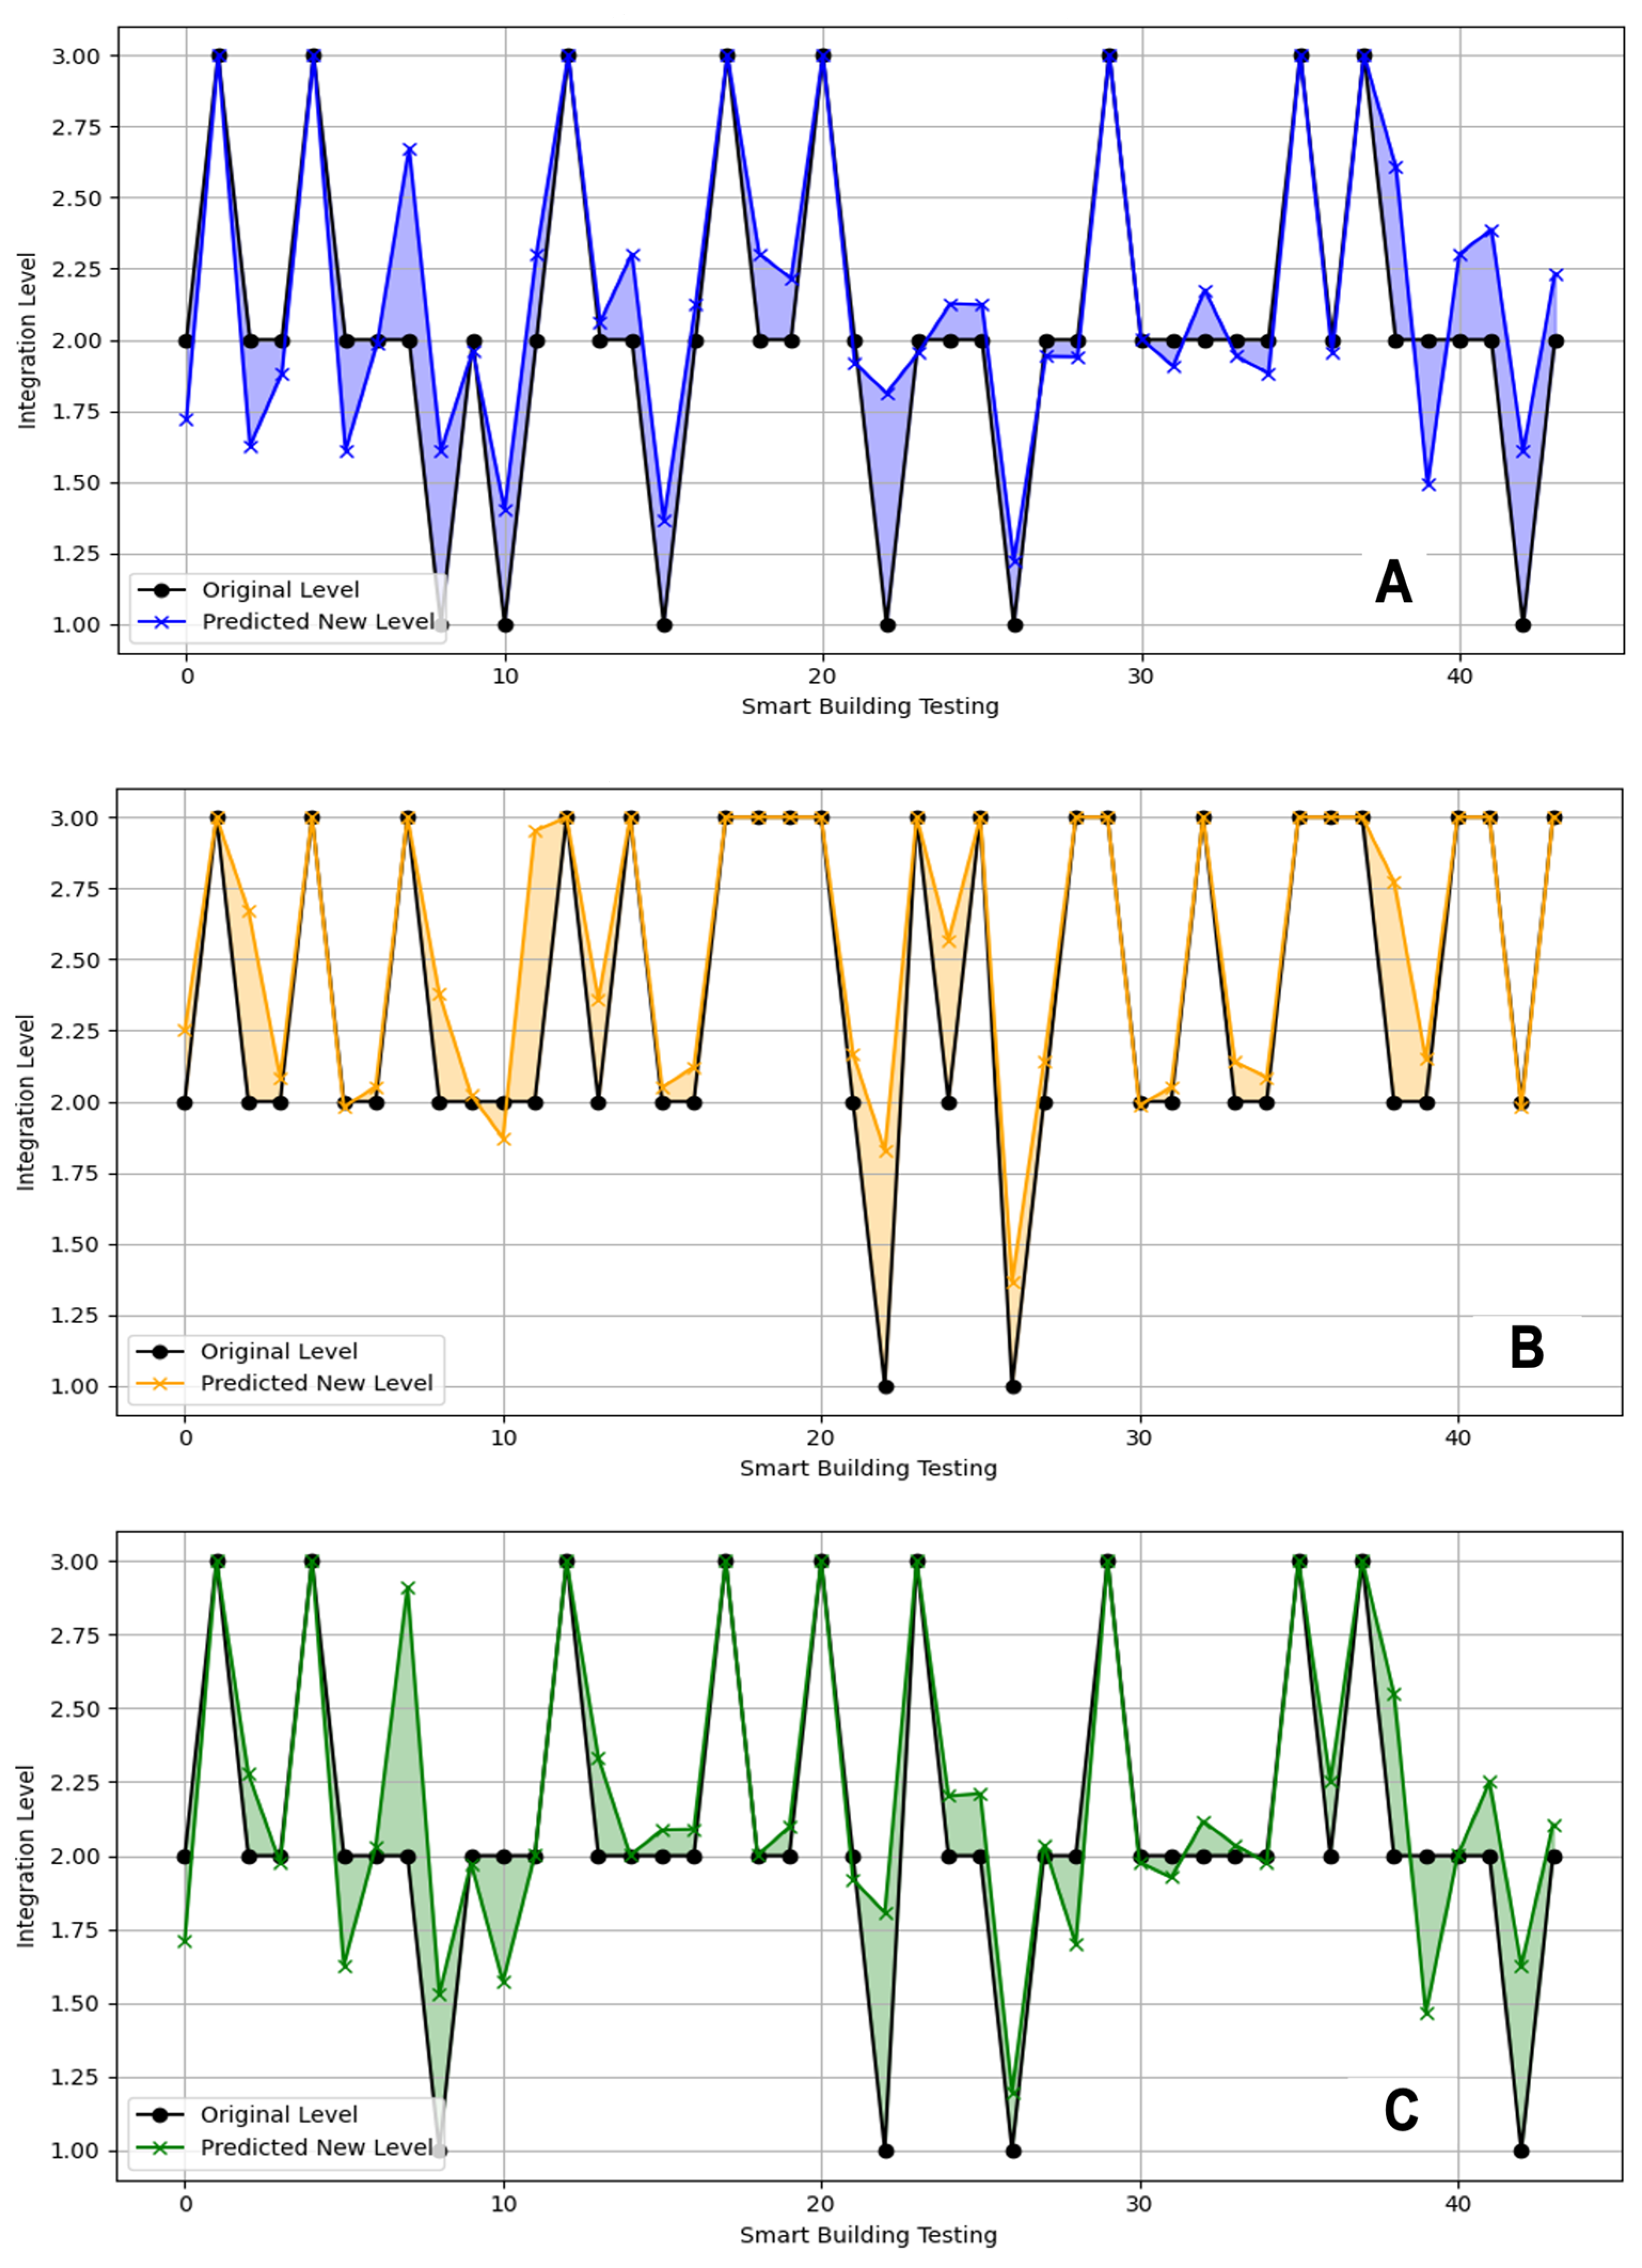
4.2.1. Training, Testing, and Optimisation

Six machine learning models were applied systematically in classifying and predicting the actual smart building integration levels. The efficacy of machine learning models heavily relies on their hyperparameters [68,86]. We optimised the ML algorithm’s performance by fine-tuning its hyperparameters using the Bayesian optimisation algorithm during the training phase, which is an iterative method that uses a probabilistic model that exhaustively searches for the optimal hyperparameters [93]. By hyperparameterisation, each model was designed to work at the optimal point of bias and variance, which improves the robustness of the predictions of the smart building integration level. The tuning criteria were established to maximise the R2 and reduce the RMSE and MAE to the lowest value. Table 5 represents the best parameters for the ML model produced out of 20 iterations. Furthermore, the best tuning settings that enabled reaching a high R2 and a minimum RMSE and MAE for each model are highlighted in yellow in Table 5.
Figure 4 illustrates the fit between the predicted and actual integration levels of each model. SVR (Figure 4B) shows the closest alignment with little erratic movement, which indicates good generalisation for varying levels of integration. Conversely, AdaBoost (Figure 4D) fails to follow quick changes, with noticeable differences between prediction output and actual values, demonstrating poor performance. Extra Trees (Figure 4F) and Random Forest (Figure 4C) show moderate agreements but still exhibit clear misalignments at higher levels of integration. KNN (Figure 4A) and Decision Tree (Figure 4E) have higher instability, especially in closely varying regimes, indicating the poor generalisation of the model. These results collectively suggest that SVR is the most viable method to accurately predict smart building integration levels, providing support for their application in the evaluation frameworks of smart cities.

4.2.2. Selection of the ML Model

Figure 5 shows the further validation of these findings, where the comparison of the predicting performance of six machine learning models enables us to observe a significant difference in predicting the performance of smart building integration levels. Results indicate that SVR shows the best performance, having the best R-squared, which is 0.81, the lowest RMSE, which is 0.33, and the lowest MAE, which is only 0.27, which reconfirms the previous findings of the SVR model’s strong predictive accuracy and the least error deviation. On the other hand, AdaBoost yields the worst results in every metric with an R-squared of 0.34, an RMSE of 0.78, and an MAE of 0.68, suggesting that it fails to capture integration level variations. Finally, Extra Trees and Random Forest have moderate performance, with R-squared of 0.59 and 0.52, but their RMSE and MAE are still a little higher than the rest, indicating a moderate prediction inconsistency. The tree models (KNN and Decision Tree models) seem to underfit, with both R-squared scores below 0.50, emphasising their unsuitability for the data.
Support Vector Regression stands out as the most reliable model for smart building integration level prediction due to its balance of accuracy, interpretability, and robustness across various scenarios. Its performance improvement is due to the effective utilisation of prioritised features. In addition, the post-optimisation accuracy makes it suitable for scenarios requiring precise predictions but demands computational resources for fine-tuning.
Figure 6 illustrates the fit between the predicted and actual levels derived from the SVR model predictions for the smart buildings’ integration into smart city impact on the efficiency, resilience, and environmental sustainability of smart city performance. The model performance has effectively captured the variability in the efficiency levels in smart buildings, with minimal deviation across the testing data (Figure 6A). In contrast, the model’s ability to predict the resilience levels of the testing data (Figure 6B) demonstrates moderate alignment with the actual level for each building. This suggests that while the SVR model is capable of approximating resilience levels, it may not fully capture the variability stemming from more complex or event-driven features like redundancy, adaptive capacity, or fault response systems. These are generally accurate for environmental sustainability (Figure 6C): large deviations occur during periods of sharp fluctuation, which may indicate that the environmental sustainability-related features are more complex.
Figure 7 presents the SRV model performance for predicting SB integration classes based on the impact on SC performance aspects, indicating statistical coefficients of determination (R-squared) of 0.75, 0.67, and 0.7 for efficiency, resilience, and sustainability, respectively. Additionally, the RMSE and MAE show low values, indicating strong predictive performance with low average deviation from the actual values. These statistical metrics demonstrate that the SVR model fits the data perfectly and is robust for predicting smart building integration impacts across key city performance aspects.

4.3. Model Interpretation

After the model training, the permutation feature importance technique was performed to evaluate the importance of each feature by randomly shuffling its values and measuring the impact on the model’s performance, which quantifies the contribution of each feature to the model’s predictions while considering feature interactions. To assess the model’s ability to identify the influencing factors in smart building services analysis, we employed a bar plot visualisation as displayed in Figure 8.
The results of the permutation feature importance analysis across six machine learning algorithms reveal notable patterns in the prioritisation of smart building services for integration into a smart city framework. Across all models, certain features consistently emerge as highly influential. For instance, rainwater collection (harvesting and reuse) and sharing thermal energy storage are among the top-ranked features in most algorithms, highlighting their universal importance in predicting integration levels. Similarly, greywater recycling and sharing energy storage frequently rank high, suggesting their pivotal role in enhancing the environmental sustainability and efficiency of smart buildings.
The Random Forest and Extra Tree (Figure 8C,F, respectively) models exhibit sharper feature differentiation, with a few services like rainwater collection and sharing thermal energy storage showing significantly higher importance compared to others. In contrast, KNN and SVR (Figure 8A,B, respectively) distribute feature importance more evenly, indicating a broader reliance on multiple features for prediction. Decision Tree (Figure 8E) results are more concentrated, with only a few features dominating the importance rankings, reflecting its tendency to focus on key splitting criteria. The AdaBoost model also emphasises a narrower set of features but aligns closely with Random Forest in identifying top priorities. Interestingly, features such as a smart water irrigation system, carpooling—ride sharing, and disaster event communication management show moderate importance across most algorithms, indicating their secondary but consistent relevance. Lower-ranked features like smart parking management systems and energy usage monitoring and control suggest that they may have limited predictive power for integration levels in this dataset.
While all models agree on the criticality of water management and energy-sharing services, tree-based algorithms exhibit a sharper focus on a few dominant features. This suggests their suitability for scenarios where the prioritisation of key services is essential. On the other hand, KNN and SVR provide broader insights into the relative contributions of a wider range of features because KNN relies on distance metrics that inherently involve all features equally, making it sensitive to even weakly predictive variables, while SVR uses kernel-based transformations and global optimisation, which consider complex interactions between features [83].

4.4. Case Study

4.4.1. Smart Building Integration into Smart City Predictions

To demonstrate the capabilities of the model and offer pertinent insights into the significance of its features, we applied the SVR model to predict the possible improvement in the building integration level and its implications for smart city performance regarding efficiency, resilience, and environmental sustainability.
Four individual smart buildings (Table 6) were analysed with varying services at different class levels. Table 7 represents the current status of the smart buildings, while Table 8 represents the improvement in the buildings’ integration according to the SVR model. Appendix B and Appendix C demonstrate the present and newly added services for building integration improvement in detail.
The selected case studies provide a comprehensive validation of the generalisability of the SVR model for buildings with varying initial conditions, covering low-to-high integration levels, varying service implementations, and different performance baselines to predict integration improvements across different starting conditions and assess multi-dimensional performance gains (efficiency, resilience, environmental sustainability). In addition, these cases were not included in the training or testing dataset, ensuring an objective assessment of the model’s ability to make predictions about new, unseen buildings.
Table 8 demonstrates the results of incorporating the permutation feature importance to predict the improvement in total integration, efficiency, resilience, and environmental sustainability levels of the four types of buildings. The predicted newer levels of integration are presented.
Building 1 is built in Houston, which is known as an advanced smart city with a high smartness level [94], with city-wide IoT-connected platforms, renewable energy adoption, and data-driven resource management. The city’s grid innovation, real-time environmental monitoring, and sophisticated security systems foster an atmosphere that enhances the operational efficiency and resilience of smart buildings, although the transportation sector lags slightly behind other sectors [95].
The initial level of smart service activation at Building 1 was low (Table 7), with only 13 out of 26 services activated (Appendix B). The total integration represents Class Level 1 and is the lowest one in the integration classification. It similarly scored at Class Level 1 on the impact on smart city performance, including efficiency and environmental sustainability. The goal after improving was to upgrade this building to Class Level 4 of total integration, where priority services allowing interoperability, inter-system communication, and inter-building resource sharing are available, which have the most weight for integration improvement. The following new services were added: sharing energy storage, sharing thermal energy storage, smart EV charging, greywater recycling, smart monitoring and environmental data analytics, and disaster event communication management. These additional features complement the underlying subsystems with robustness per the integration criteria of the framework. As a result, the predicted integration level increased to Class Level 4, while efficiency increased to Class Level 2, resilience to Class Level 3, and environmental sustainability to Class Level 2. The total number of active services went up from 13 to 19, resulting in a remarkable overall improvement. The city’s robust digital infrastructure is a key enabler for maximising the benefits of smart building upgrades. Further, the exacting shift reflects that service investment with integration costs, particularly having the capability to share systems within organisational entities, can serve as a major factor in exploiting multi-dimensional smart performance improvements.
Building 2 is situated in Kuala Lumpur, a city with a dynamic but uneven smart city landscape. Kuala Lumpur exhibits advanced smartness in mobility and security [96], driven by AI, 5G, and digital access control, while energy [97] and waste management [98] are in the progress stages of city-wide integration. Before the predicted improvement, Building 2 had 17 services developed and obtained a score in total integration of Class Level 2, while the efficiency was Class Level 1. The aim was to raise its efficiency rate to the highest Class Level 3. Although the levels of integration, resilience, and environmental sustainability were low, the overall low-efficiency score revealed that the internal resource flows and energy systems were poorly optimised. After the predicted enhancement, five extra services were recognised, including sharing energy storage, smart heating, cooling, and hot water preparation; sharing parking spaces; greywater recycling; and smart waste containers. Predicted efficiency increased to Class Level 3, and a remarkable increase in total integration to Class Level 5 was achieved, while resilience and environmental sustainability also improved to Class Level 3. The overall improvement was across all metrics, a massive gain attributable chiefly to the optimisation of the energy and waste systems. This case shows how efficiency-driven interventions can act as spill-overs in total integration and environmental sustainability dimensions due to interdependencies in infrastructure use and performance analytics. Nevertheless, the city is advanced in energy, mobility, and waste management infrastructure that enables the building to achieve significant gains in total integration and efficiency class, as evidenced by the predicted leap to Class Level 5 in total integration and Class Level 3 in efficiency. Continued progress in city-level smart infrastructure will be critical for sustaining and expanding these improvements.
Building 3 and Building 4 are situated in Dubai, UAE. Dubai is a city globally recognised for its leadership in smart city innovation and digital infrastructure. Dubai ranks 12th in the global Smart Cities Index [99], reflecting its comprehensive adoption of advanced technologies. The city’s ambitious strategies, such as the Dubai Clean Energy Strategy 2050 [100] and the Smart Dubai strategy [101], prioritise sustainability, efficiency, and resident well-being through large-scale investments in IoT, AI, and data analytics [102].
Building 3 started with a strong technical baseline of 20 active services. The total integration score was at Class Level 3, and the efficiency, resilience, and environmental sustainability scores were already at Class Level 2. Despite an advanced technical profile, building performance related to resilience was relatively moderate, with few features related to crisis preparedness or redundancy in system functionality. So, to improve this score to resilience Class Level 3, two supplementary features, namely sharing energy storage and disaster event communication management, provided the highest contribution to improve from the initial resilience and complete with overall improvement. These attributes ensure that the building system can continue to operate in the event of disruption and respond adaptively. The outcome of the resilience in this experiment went from Class Level 2 to Class Level 3, even though only a couple of services were added, thus confirming the domain-specific significance of communication and backup capacity in modelling resilience. The city’s digital maturity further ensured that such upgrades are not only technically feasible but also highly effective, maximising the building’s operational reliability and adaptive capacity.
Building 4 is the most sophisticated, with 21 services available before the predicted upgrade. It obtained Class Level 4 in integration and Class Level 2 in environmental sustainability. Class Levels 2 and 3 in other performance areas were considered good. With the addition of just two services (thermal energy storage and smart water irrigation system), environmental sustainability, after predicted enhancement, scored at Class Level 3. The overall improvement for this case was the lowest of all these cases because the building was already the most mature. However, this case study illustrates the challenge of delivering performance improvement in already high-performing buildings, where incremental improvements require advanced solutions like real-time environmental analytics and closed-loop water and energy systems. As it is a backbone, the infrastructure of the city allows the highest-performing features to function and integrate, therefore illustrating the principle of diminishing returns in high-performing environments but also the importance of accurate, data-informed interventions.
To sum up, the machine learning model in this context can help building owners and operators find the best option for improving smart building integration capabilities, and the case studies illustrate this. The model successfully pinpointed priority services not only based on the target objectives (efficiency, resilience, or environmental sustainability) but also on whether they achieved co-benefits across the other categories. The indirect benefits, seen as environmental sustainability improvements in resilience-driven upgrades, underscore the interconnected nature of smart building services. Moreover, the integration level of Building 1 might be dramatically transformed, which highlights the model’s power to recommend effective solutions for failure-prone buildings. These results reinforce the merits of AI in augmenting smart building integration into smart cities, unpacking where progression lies while still being cohesive in addressing efficiency, resilience, and environmental sustainability.

4.4.2. Insights into Smart Building Integration into Smart City Enhancement

The case study analysis, derived from the SVR model and augmented with permutation feature importance, evidences substantial and quantifiable improvements in smart building performance along the four dimensions of total integration, efficiency, resilience, and environmental sustainability. In particular, Building 1, initially the least integrated, with only thirteen services, reached a predicted overall performance increase to Class Level 4 by implementing six high-impact services. This transformation demonstrates how properly applied prioritisation, supported by data, will yield the highest improvement potential by focusing on low-performing buildings. The displacement of Building 2, optimised for efficiency (from efficiency Class Level 1 to Class Level 3), resulted in significant co-benefits in total integration and resilience. Conversely, Building 3 and Building 4, with already elevated baselines, saw lower but well-targeted gains in resilience and environmental sustainability, respectively, validating the principle of diminishing marginal returns and the necessity for precision interventions in high-functioning systems. These findings provide additional validation of the targeted machine learning model and the potential utility of broad-spectrum enhancers across diverse baseline conditions, with SVR-based predictions given the highest reliability (R-squared = 0.81).
These findings highlight two important paradigms. First, not all services create an equal impact across performance domains; second, the most impactful selection of enhancement strategies should be aligned with each building’s specific profile and goals for improvement. The fact that the model identifies shared energy systems, disaster event communication management, smart water management, and thermal control as key services is directly compatible with the validated conceptual framework, which ascribes different domains of service interconnectivity to smart building integration across domains of energy, mobility, water, waste, and security. Integration is a fundamental enabler from a system engineering perspective and is expected to drive improvements in efficiency, resilience, and environmental sustainability through greater operational interoperability and improved data responsiveness. In addition, the co-benefits observed across dimensions, such as resilience gains arising from efficiency-led upgrades, highlight the non-linear and interdependent character of smart city performance metrics. These incremental calls are further validated by the prior research [31] commentary proposing the use of AI-enhanced frameworks that facilitate low-level classification but that offer even higher-level architecture in the transformation of smart infrastructure through dynamic, explainable, and adaptive intelligence. The explanatory element for the SVR model works well along with the permutation-based feature ranking by justifying the use of explainable AI (XAI) to interpret the knowledge learned from urban data and convert it to retrofitting strategies and performance elements of buildings.
As urban systems grow more complex and interdependent, digital twins might evolve as the next step and integrate with this framework, as their capability to provide virtual replicas of physical assets, processes, etc., enables real-time simulation, monitoring, and prediction. This involvement implementation might include a sequence approach starting with real-time data acquisition through utilising the data produced by IoT sensors; these real-time data then feed into the DT platform with the trained SVR model. As the DT allows for real-time simulation, the impact of specific service enhancements on the smart building could be simulated before deployment, while the DT platform might have a real-time data feed from the city as well. In this case, it will show the actual impact across the four dimensions (total integration, efficiency, resilience, and environmental sustainability) assessed by the SVR model. The results then feed into a decision-support dashboard that recommends the most impactful retrofitting strategy. As a final phase, a feedback loop is incorporated to retrain the SVR model periodically using active learning loops or online learning techniques to ensure that the model adapts to system evolution.

4.5. Discussion

This study is based on extensive data collection from 147 smart buildings in 13 countries. According to the global survey, LEED certification was the most widely used internationally; BREEAM and DGNB were most prominent in specific locations. The normality test indicates that the dataset is fairly normally distributed, although some skewness can be observed among the resilience and environmental sustainability measures. These results are corroborated by statistics from the Shapiro–Wilk test and, consequently, are acceptable for predictive models. This component ensures that the dataset’s reliability for machine learning applications does not have non-normal distribution biases or distortions, thereby ensuring that it is possible to train predictive models.
Problems of compatibility with different smart systems and technologies may arise from a lack of uniformity and universal definitions [103,104,105]. Finding the success indicators of smart building and smart city integration is the goal of the suggested evaluation approach. It presents a collection of indicators for every smart city domain that can evaluate their performance in many areas and identify weaknesses and possible enhancements to achieve a smarter state. Further, the various infrastructure components within smart cities operate separately without cohesive integration [106,107]. The suggested framework addresses this fragmentation by assessing interoperability at both the building and city levels and provides a practical predictive analytical tool for stakeholders to assess integration capabilities and potential areas for long-term performance improvement.
Machine learning and explainable AI (XAI) have been recently used to tackle these problems by supplying powerful tools for prediction, optimisation, and decision-making. Techniques like permutation feature importance provide critical information on the most crucial features, dictating building performance and integration into smart cities. However, challenges remain in ensuring data quality, addressing bias and fairness, and developing cross-cutting standards for data pre-processing.
The predictive modelling conducted on case study buildings demonstrated the actual significance of feature prioritisation for advancing the integration levels. Those that start at a lower level of integration have more room for improvement, and targeted upgrades can bring them to a level of smart city readiness. This observation illustrates the concept of misalignment in technological and operational areas, as ref. [10,11] mentioned: while initial integration efforts generate considerable enhancements, continual upgrades may result in discordances or inefficiencies, as a consequence of legacy systems and infrastructure constraints. This pattern shows that there are strategic ways to upgrade a building to a so-called smart building system, but these pathways should all consider the overall smart city ecosystem to maximise the benefits.
The permutation feature importance method further helped in determining the prioritised services affecting the integration. The outcome of the analysis confirms the idea that smart buildings are important elements of the urban ecosystem and contribute to sustainability and resilience [7]. These findings corroborate earlier frameworks emphasising the importance of interoperable systems and standardised and purpose-oriented classification schemes to close the gaps between building-level and city-level smart functionalities [16,27]. However, to achieve a more balanced development, future research should explore the interplay between technological integration and operational efficiency, identifying complementary strategies that drive both infrastructure and performance enhancements. Additionally, further refinement of the model, such as integration with the digital twin model, may better capture the threshold effect seen in buildings like Building 1.
Existing assessment frameworks, such as LEED and BREEAM, and various tools to evaluate smart city initiatives, though they tend to focus on energy efficiency and sustainability, often lack comprehensive metrics for assessing the complex interactions between smart buildings and broader urban systems [43,47]. Our machine learning-based methodology provides a scalable solution to fill these gaps by measuring levels of integration and predicting their impact on measures of urban performance. This introduces a predictive dimension which can assist planners and policymakers to add another dimension to previous efforts directed at categorisation systems and integration systems [9,31].
Similarly, the predictive modelling approach also facilitates scenario testing in real time, allowing stakeholders to simulate the effect of different technological replacements and enhancements before committing to full-scale implementation, thereby minimising financial losses and further maximising returns on investment. The framework is, therefore, suitable for developing a comprehensive understanding of active and passive urban ecosystem dynamics, which will become increasingly important as cities evolve and start to integrate with the digital twin technologies of smart grids and IoT-powered automation. Furthermore, it is an adaptable framework that may be changed and further developed. It may contain new factors for the introduction of next-generation technologies.
This assessment methodology, incorporating the power of machine learning, has the potential to significantly enhance their practical value and impact and can move beyond static assessments and develop dynamic, adaptive systems that continuously learn and improve over time. This will not only lead to more efficient and sustainable buildings but it can also help municipalities, real estate developers, contractors, and owners. It would assist them in making well-informed investment decisions on smart advancements in the future.

5. Conclusions

The integration of smart buildings into smart cities is a multi-dimensional issue that needs data-informed solutions. The research presents the assessment methodology that determines current performance and predicts future smart building integration class levels into smart cities through the application of machine learning techniques. This study also provides a practical roadmap for the sector to reach the targets of smart building integration, showing its impact on smart city performance efficiency, resilience, and environmental sustainability.
Although there has been considerable progress in developing various rating schemes and methodologies for assessing smart buildings and smart cities, the literature analysis highlights three recurring gaps: diverging evaluation frameworks for smart buildings and cities, non-uniform metrics and taxonomies hindering scalability, and the low usage of machine learning in predictive integration modelling.
The development of the evaluation model for integrating smart buildings into a smart city employed six supervised ML algorithms. The research utilised data on the application of smart services in smart buildings gathered from a survey of 147 smart offices across 13 different geographic areas.
Among the six machine learning algorithms employed, we found that the model trained using the SVR algorithm was the most reliable, achieving the highest R2 (0.81), a low RMSE (0.33), a minimal MAE (0.27), and better generalisation across various scenarios. Permutation feature importance analysis revealed that water and energy management systems (rainwater harvesting, greywater recycling, thermal energy sharing) are the most influential factors for total smart building integration, emphasising the need for resource-efficient technologies. Case studies further demonstrated the practical applicability of the SVR model and its ability to predict improvements in integration as a result of targeted enhancements to core smart building elements.
The methodology might serve as a decision-support tool for policymakers, urban planners, and building owners seeking to optimise smart building contributions to smart cities. By leveraging AI-driven insights, this study bridges the gap between theoretical smart building integration models and real-world implementation, ultimately advancing the performance of the smart city. Future works should look further into testing hybrid AI models and incorporating data from real-time IoT-integrated devices.
The main limitation of this research is that it mainly focuses on the technological aspects of smart building integration into the smart city infrastructure domains. We acknowledge that the incorporation of other domains, including socio-economic and policy dimensions, might further improve the context sensitivity, interpretability, and scalability of the framework. Multi-domain models provide a more accurate description of the interconnections inherent in the smart city’s systemic nature and serve for more holistic evaluations, corresponding to the complex reality of urban development and governance.

Author Contributions

Conceptualisation, M.M.N.S.; formal analysis, M.M.N.S. and R.A.; methodology, M.M.N.S. and R.A.; writing—original draft, M.M.N.S.; writing—reviewing and editing, R.A. and M.M.N.S.; visualisation, M.M.N.S. and R.A.; validation, R.A.; software, M.M.N.S.; investigation, R.A. and M.M.N.S.; data curation, M.M.N.S. All authors have read and agreed to the published version of the manuscript.

Funding

This research received no external funding.

Institutional Review Board Statement

The study was conducted in accordance with the Declaration of Helsinki and approved by the Research Ethics Commission of the Kaunas University of Technology (protocol No M6-2024-02) for studies involving humans.

Informed Consent Statement

Informed consent was obtained from all subjects involved in the study.

Data Availability Statement

The data presented in this study are available on request from the corresponding author.

Conflicts of Interest

The authors declare no conflicts of interest.

Appendix A. Evaluation Framework for Smart Building Integration into Smart City [31]

Smart City
Infrastructure Domain
Smart Building ServicesImpact on the Smart City PerformanceSmart City Infrastructure Domain ImportanceFactor ScoreSmart City Infrastructure Domain Impact, %
EfficiencyResilienceEnvironmental Sustainability
EnergyE1Electrical Energy Storage (Battery)221525
E2Shared Electrical Energy Storage22125
E3Ability to Work Off-Grid (Renewable Energy Sources: Solar and Wind)12120
E7Energy Usage Monitoring and Control and Demand Side Management21225
E5Smart Heating, Cooling, and Hot Water Preparation22230
E6Thermal Energy Storage22125
E7Shared Thermal Energy Storage22230
18032.67%
MobilityM1Smart EV Charging 212420
M2Carpooling–Ride Sharing21220
M3Smart Parking Management System (e-Parking)21116
M4Sharing Parking Space20112
M5Online Video Surveillance12116
M6Last Mile Driving20112
9617.42%
WaterW1Smart Water Mixtures212420
W2Smart Water Monitoring and Shut-Off (Leak Detection and Prevention)22224
W3Smart Water Irrigation System21220
W4Smart Water Meter21220
W5Greywater Recycling22224
W6Rainwater Collection (Harvesting) and Reuse22224
13223.96%
Waste ManagementWS1Smart Waste Containers (Smart Bins)212315
WS2Automation and Robotic Waste Collection (Underground Waste Collection)22218
335.99%
SecurityS1Smart Monitoring and Data Analytics of the Surrounding Environment (Face Detection and Car Plate Detection)121520
S2Smart Fire Management22125
S3Disaster Event Communication Management22125
S4Smart Security Lights12120
S5Integrated Sensor Solutions12120
11019.96%
Ideal Integration Score47403921551100%

Appendix B. Case Study Buildings and Their Present Services

Smart City Infrastructure DomainSmart Building ServicesBuilding 1Building 2Building 3Building 4
EnergyElectrical Energy Storage (Battery)1111
Shared Electrical Energy Storage0001
Ability to Work Off-Grid (Renewable Energy Sources: Solar and Wind)1111
Energy Usage Monitoring and Control and Demand Side Management1111
Smart Heating, Cooling, and Hot Water Preparation1001
Thermal Energy Storage1110
Shared Thermal Energy Storage0100
MobilitySmart EV Charging 0011
Carpooling–Ride Sharing0110
Smart Parking Management System (e-Parking)0111
Sharing Parking Space0011
Online Video Surveillance0111
Last Mile Driving1000
WaterSmart Water Mixtures1111
Smart Water Monitoring and Shut-Off (Leak Detection and Prevention)1111
Smart Water Irrigation System0100
Smart Water Meter1111
Greywater Recycling0011
Rainwater Collection (Harvesting) and Reuse1111
Waste ManagementSmart Waste Containers (Smart Bins)0011
Automation and Robotic Waste Collection (Underground Waste Collection)0011
SecuritySmart Monitoring and Data Analytics of the Surrounding Environment (Face Detection and Car Plate Detection)0111
Smart Fire Management1111
Disaster Event Communication Management0101
Smart Security Lights1011
Integrated Sensor Solutions1111
Total number of actual services13172021

Appendix C. Case Study Buildings and Their Newly Added Services (Yellow) for the Enhanced Integration

Smart City Infrastructure DomainSmart Building ServicesBuilding 1Building 2Building 3Building 4
EnergyElectrical Energy Storage (Battery)1111
Shared Electrical Energy Storage1111
Ability to Work Off-Grid (Renewable Energy Sources: Solar and Wind)1111
Energy Usage Monitoring and Control and Demand Side Management1111
Smart Heating, Cooling, and Hot Water Preparation1101
Thermal Energy Storage1111
Shared Thermal Energy Storage1100
MobilitySmart EV Charging 1011
Carpooling–Ride Sharing0110
Smart Parking Management System (e-Parking)0111
Sharing Parking Space0111
Online Video Surveillance0111
Last Mile Driving1000
WaterSmart Water Mixtures1111
Smart Water Monitoring and Shut-Off (Leak Detection and Prevention)1111
Smart Water Irrigation System0101
Smart Water Meter1111
Greywater Recycling1111
Rainwater Collection (Harvesting) and Reuse1111
Waste ManagementSmart Waste Containers (Smart Bins)0111
Automation and Robotic Waste Collection (Underground Waste Collection)0011
SecuritySmart Monitoring and Data Analytics of the Surrounding Environment (Face Detection and Car Plate Detection)1111
Smart Fire Management1111
Disaster Event Communication Management1111
Smart Security Lights1011
Integrated Sensor Solutions1111
Total number of actual services19222223
Number of newly added services6522

References

  1. Ismagilova, E.; Hughes, L.; Dwivedi, Y.K.; Raman, K.R. Smart cities: Advances in research—An information systems perspective. Int. J. Inf. Manag. 2019, 47, 88–100. [Google Scholar] [CrossRef]
  2. Vodák, J.; Šulyová, D.; Kubina, M. Advanced Technologies and Their Use in Smart City Management. Sustainability 2021, 13, 5746. [Google Scholar] [CrossRef]
  3. Yigitcanlar, T.; Kamruzzaman, M.; Buys, L.; Ioppolo, G.; Sabatini-Marques, J.; da Costa, E.M.; Yun, J.J. Understanding ‘smart cities’: Intertwining development drivers with desired outcomes in a multidimensional framework. Cities 2018, 81, 145–160. [Google Scholar] [CrossRef]
  4. Nižetić, S.; Djilali, N.; Papadopoulos, A.; Rodrigues, J.J.P.C. Smart technologies for promotion of energy efficiency, utilization of sustainable resources and waste management. J. Clean. Prod. 2019, 231, 565–591. [Google Scholar] [CrossRef]
  5. Singh, T.; Solanki, A.; Sharma, S.K.; Nayyar, A.; Paul, A. A Decade Review on Smart Cities: Paradigms, Challenges and Opportunities. IEEE Access 2022, 10, 68319–68364. [Google Scholar] [CrossRef]
  6. Samarakkody, A.; Amaratunga, D.; Haigh, R. Characterising Smartness to Make Smart Cities Resilient. Sustainability 2022, 14, 12716. [Google Scholar] [CrossRef]
  7. Singh, T.; Solanki, A.; Sharma, S. Role of Smart Buildings in Smart City—Components, Technology, Indicators, Challenges, Future Research Opportunities. In Digital Cities Roadmap: IoT-Based Architecture and Sustainable Buildings; Wiley: Hoboken, NJ, USA, 2021; pp. 449–476. [Google Scholar] [CrossRef]
  8. Al Dakheel, J.; Del Pero, C.; Aste, N.; Leonforte, F. Smart buildings features and key performance indicators: A review. Sustain. Cities Soc. 2020, 61, 102328. [Google Scholar] [CrossRef]
  9. Apanaviciene, R.; Vanagas, A.; Fokaides, P.A. Smart Building Integration into a Smart City (SBISC): Development of a New Evaluation Framework. Energies 2020, 13, 2190. [Google Scholar] [CrossRef]
  10. Apanavičienė, R.; Shahrabani, M.M.N. Key Factors Affecting Smart Building Integration into Smart City: Technological Aspects. Smart Cities 2023, 6, 1832–1857. [Google Scholar] [CrossRef]
  11. Domingos, L.; Sousa, M.J.; Resende, R.; Pizarro Miranda, B.; Rego, S.; Ferreira, R. Establishment of a smart building assessment framework in the context of smart cities. Built Environ. Proj. Asset Manag. 2024; ahead-of-print. [Google Scholar] [CrossRef]
  12. Li, G.; Luan, T.H.; Li, X.; Zheng, J.; Lai, C.; Su, Z.; Zhang, K. Breaking Down Data Sharing Barrier of Smart City: A Digital Twin Approach. IEEE Netw. 2024, 38, 238–246. [Google Scholar] [CrossRef]
  13. Setijadi Prihatmanto, A.; Andrian, R.; Danar Sunindyo, W.; Sutriadi, R. Transforming Public Services: A Systematic Review of Smart Government Frameworks, Architectures, and Implementation Challenges. IEEE Access 2024, 12, 135799–135810. [Google Scholar] [CrossRef]
  14. Weber, M.; Podnar Žarko, I. A Regulatory View on Smart City Services. Sensors 2019, 19, 415. [Google Scholar] [CrossRef] [PubMed]
  15. Zvolska, L.; Lehner, M.; Palgan, Y.V.; Mont, O.; Plepys, A. Urban sharing in smart cities: The cases of Berlin and London. In Smart and Sustainable Cities? Routledge: London, UK, 2020. [Google Scholar]
  16. Um-e-Habiba; Ahmed, I.; Asif, M.; Alhelou, H.H.; Khalid, M. A review on enhancing energy efficiency and adaptability through system integration for smart buildings. J. Build. Eng. 2024, 89, 109354. [Google Scholar] [CrossRef]
  17. Chan, B. Smart Buildings—What’s the Value to Smart Cities? Part Two. Available online: https://www.iiot-world.com/smart-cities-buildings-infrastructure/smart-buildings/smart-buildings-whats-the-value-to-smart-cities-part-two/ (accessed on 10 June 2023).
  18. Elbracht, O.; Farah, F.; Joudi, I.; Mueller, M.; Bilz, B. Smart Cities—From City Theory to Smart Tech Reality. Siemens. July 2022. Available online: https://www.builtenvironmentme.com/news/real-estate/smart-cities-from-city-theory-to-smart-tech-reality (accessed on 21 February 2025).
  19. Parlak, A.S. Integrating Smart City and Smart Building Key Performance Indicators (KPI) for Development of an Integrated Smart Building Assessment Methodology. Master’s Thesis, Middle East Technical University, Ankara, Türkiye, 2020. Available online: https://open.metu.edu.tr/handle/11511/45564 (accessed on 16 January 2025).
  20. Hernández, J.L.; García, R.; Schonowski, J.; Atlan, D.; Chanson, G.; Ruohomäki, T. Interoperable Open Specifications Framework for the Implementation of Standardized Urban Platforms. Sensors 2020, 20, 2402. [Google Scholar] [CrossRef]
  21. Tzioutziou, A.; Xenidis, Y. A Study on the Integration of Resilience and Smart City Concepts in Urban Systems. Infrastructures 2021, 6, 24. [Google Scholar] [CrossRef]
  22. Shahrabani, M.M.N.; Apanavičienė, R. Towards integration of smart and resilient city: Literature review. IOP Conf. Ser. Earth Environ. Sci. 2022, 1122, 012019. [Google Scholar] [CrossRef]
  23. Ferrari, S.; Zoghi, M.; Paganin, G.; Dall’O’, G. A Practical Review to Support the Implementation of Smart Solutions within Neighbourhood Building Stock. Energies 2023, 16, 5701. [Google Scholar] [CrossRef]
  24. Baharetha, S.; Soliman, A.M.; Hassanain, M.A.; Alshibani, A.; Ezz, M.S. Assessment of the challenges influencing the adoption of smart building technologies. Front. Built Environ. 2024, 9, 1334005. [Google Scholar] [CrossRef]
  25. Smart Readiness Indicator—European Commission. Available online: https://energy.ec.europa.eu/topics/energy-efficiency/energy-efficient-buildings/smart-readiness-indicator_en (accessed on 25 July 2024).
  26. SPIRE. UL Solutions. Available online: https://www.ul.com/services/spire-qualification-program (accessed on 25 July 2024).
  27. Mölsä, A. Classifying Smart Buildings. Available online: http://www.theseus.fi/handle/10024/783376 (accessed on 11 December 2024).
  28. Zamanidou, A.; Magliozzi, A.; Fokaides, P. From Buildings to Neighborhoods: Upscaling Smartness Assessment for Enhanced Sustainability. In Proceedings of the 2024 9th International Conference on Smart and Sustainable Technologies (SpliTech), Bol and Split, Croatia, 25–28 June 2024; pp. 1–5. [Google Scholar]
  29. Kasznar, A.P.P.; Hammad, A.W.A.; Najjar, M.; Linhares Qualharini, E.; Figueiredo, K.; Soares, C.A.P.; Haddad, A.N. Multiple Dimensions of Smart Cities’ Infrastructure: A Review. Buildings 2021, 11, 73. [Google Scholar] [CrossRef]
  30. Apanaviciene, R.; Urbonas, R.; Fokaides, P.A. Smart Building Integration into a Smart City: Comparative Study of Real Estate Development. Sustainability 2020, 12, 9376. [Google Scholar] [CrossRef]
  31. Shahrabani, M.M.N.; Apanaviciene, R. An AI-Based Evaluation Framework for Smart Building Integration into Smart City. Sustainability 2024, 16, 8032. [Google Scholar] [CrossRef]
  32. Lin, S.-H.; Zhang, H.; Li, J.-H.; Ye, C.-Z.; Hsieh, J.-C. Evaluating smart office buildings from a sustainability perspective: A model of hybrid multi-attribute decision-making. Technol. Soc. 2022, 68, 101824. [Google Scholar] [CrossRef]
  33. Ghonge, M.M.; Pradeep, N.; Jhanjhi, N.Z.; Kulkarni, P.M. Advances in Explainable AI Applications for Smart Cities; IGI Global: Pennsylvania, PA, USA, 2024; Available online: https://www.igi-global.com/gateway/book/301208 (accessed on 4 February 2025).
  34. Thakker, D.; Mishra, B.K.; Abdullatif, A.; Mazumdar, S.; Simpson, S. Explainable Artificial Intelligence for Developing Smart Cities Solutions. Smart Cities 2020, 3, 1353–1382. [Google Scholar] [CrossRef]
  35. Ali, D.M.T.E.; Motuzienė, V.; Džiugaitė-Tumėnienė, R. AI-Driven Innovations in Building Energy Management Systems: A Review of Potential Applications and Energy Savings. Energies 2024, 17, 4277. [Google Scholar] [CrossRef]
  36. Saini, J.S.; Arora, S.; Kamboj, S. Prediction of Smart Building and Smart City Resources using AI-techniques. In Proceedings of the 2023 2nd International Conference for Innovation in Technology (INOCON), Bangalore, India, 3–5 March 2023; pp. 1–5. [Google Scholar]
  37. Portase, R.L.; Tolas, R.; Potolea, R. SmartLaundry: A Real-Time System for Public Laundry Allocation in Smart Cities. Sensors 2024, 24, 2159. [Google Scholar] [CrossRef]
  38. Abu-Rayash, A. Chapter Four—Physical and technological domains. In Smart City Assessment; Abu-Rayash, A., Ed.; Elsevier: Amsterdam, The Netherlands, 2024; pp. 135–184. [Google Scholar] [CrossRef]
  39. Affonso, E.O.T.; Branco, R.R.; Menezes, O.V.C.; Guedes, A.L.A.; Chinelli, C.K.; Haddad, A.N.; Soares, C.A.P. The Main Barriers Limiting the Development of Smart Buildings. Buildings 2024, 14, 1726. [Google Scholar] [CrossRef]
  40. Alamoudi, A.K.; Abidoye, R.B.; Lam, T.Y.M. Implementing Smart Sustainable Cities in Saudi Arabia: A Framework for Citizens’ Participation towards SAUDI VISION 2030. Sustainability 2023, 15, 6648. [Google Scholar] [CrossRef]
  41. Yan, Z.; Jiang, L.; Huang, X.; Zhang, L.; Zhou, X. Intelligent urbanism with artificial intelligence in shaping tomorrow’s smart cities: Current developments, trends, and future directions. J. Cloud Comput. 2023, 12, 179. [Google Scholar] [CrossRef]
  42. Braulio-Gonzalo, M.; Jorge-Ortiz, A.; Bovea, M.D. How are indicators in Green Building Rating Systems addressing sustainability dimensions and life cycle frameworks in residential buildings? Environ. Impact Assess. Rev. 2022, 95, 106793. [Google Scholar] [CrossRef]
  43. Varma, C.R.S.; Palaniappan, S. Comparision of green building rating schemes used in North America, Europe and Asia. Habitat Int. 2019, 89, 101989. [Google Scholar] [CrossRef]
  44. Alhamlawi, F.; Alaifan, B.; Azar, E. A comprehensive assessment of Dubai’s green building rating system: Al Sa’fat. Energy Policy 2021, 157, 112503. [Google Scholar] [CrossRef]
  45. Al Dakheel, J.; Tabet Aoul, K.; Hassan, A. Enhancing Green Building Rating of a School under the Hot Climate of UAE; Renewable Energy Application and System Integration. Energies 2018, 11, 2465. [Google Scholar] [CrossRef]
  46. Awadh, O. Sustainability and green building rating systems: LEED, BREEAM, GSAS and Estidama critical analysis. J. Build. Eng. 2017, 11, 25–29. [Google Scholar] [CrossRef]
  47. Ayoobi, A.W.; Inceoğlu, G.; Inceoğlu, M. Prioritizing sustainable building design indicators through global SLR and comparative analysis of AHP and SWARA for holistic assessment: A case study of Kabul, Afghanistan. J. Build. Rehabil. 2024, 9, 139. [Google Scholar] [CrossRef]
  48. Liu, Y.; Pedrycz, W.; Deveci, M.; Chen, Z.-S. BIM-based building performance assessment of green buildings—A case study from China. Appl. Energy 2024, 373, 123977. [Google Scholar] [CrossRef]
  49. Mao, J.; Yuan, H.; Xiong, L.; Huang, B. Research Review of Green Building Rating System under the Background of Carbon Peak and Carbon Neutrality. Buildings 2024, 14, 1257. [Google Scholar] [CrossRef]
  50. Awadh, O. Estidama Pearl Building Rating System of Abu Dhabi and Al Sa’fat of Dubai: Comparison and Analysis. In Proceedings of the 3rd International Sustainable Buildings Symposium (ISBS 2017), Dubai, United Arab Emirates, 15–17 March 2017; Fırat, S., Kinuthia, J., Abu-Tair, A., Eds.; Springer International Publishing: Cham, Switzerland, 2018; pp. 328–337. [Google Scholar] [CrossRef]
  51. Sharifi, A. A typology of smart city assessment tools and indicator sets. Sustain. Cities Soc. 2020, 53, 101936. [Google Scholar] [CrossRef]
  52. Shi, F.; Shi, W. A Critical Review of Smart City Frameworks: New Criteria to Consider When Building Smart City Framework. ISPRS Int. J. Geo-Inf. 2023, 12, 364. [Google Scholar] [CrossRef]
  53. Li, C.; Dai, Z.; Liu, X.; Sun, W. Evaluation System: Evaluation of Smart City Shareable Framework and Its Applications in China. Sustainability 2020, 12, 2957. [Google Scholar] [CrossRef]
  54. Abu-Rayash, A. Chapter Five—Smart city ranking. In Smart City Assessment; Abu-Rayash, A., Ed.; Elsevier: Amsterdam, The Netherlands, 2024; pp. 185–223. [Google Scholar] [CrossRef]
  55. Froufe, M.M.; Chinelli, C.K.; Guedes, A.L.A.; Haddad, A.N.; Hammad, A.W.A.; Soares, C.A.P. Smart Buildings: Systems and Drivers. Buildings 2020, 10, 153. [Google Scholar] [CrossRef]
  56. Hernández, J.L.; de Miguel, I.; Vélez, F.; Vasallo, A. Challenges and opportunities in European smart buildings energy management: A critical review. Renew. Sustain. Energy Rev. 2024, 199, 114472. [Google Scholar] [CrossRef]
  57. Alanazi, F.; Alenezi, M. A framework for integrating intelligent transportation systems with smart city infrastructure. J. Infrastruct. Policy Dev. 2024, 8, 3558. [Google Scholar] [CrossRef]
  58. Janhunen, E.; Pulkka, L.; Säynäjoki, A.; Junnila, S. Applicability of the Smart Readiness Indicator for Cold Climate Countries. Buildings 2019, 9, 102. [Google Scholar] [CrossRef]
  59. Ishaq, K.; Farooq, S.S. Exploring IoT in Smart Cities: Practices, Challenges and Way Forward 2023. arXiv 2023, arXiv:2309.12344. [Google Scholar] [CrossRef]
  60. Okonta, D.E.; Vukovic, V. Smart cities software applications for sustainability and resilience. Heliyon 2024, 10, e32654. [Google Scholar] [CrossRef]
  61. Mutambik, I. Unlocking the Potential of Sustainable Smart Cities: Barriers and Strategies. Sustainability 2024, 16, 5061. [Google Scholar] [CrossRef]
  62. Bibri, S.E.; Krogstie, J.; Kaboli, A.; Alahi, A. Smarter eco-cities and their leading-edge artificial intelligence of things solutions for environmental sustainability: A comprehensive systematic review. Environ. Sci. Ecotechnol. 2024, 19, 100330. [Google Scholar] [CrossRef]
  63. Szpilko, D.; Jiménez Naharro, F.; Lăzăroiu, G.; Nica, E.; de-la-torre-Gallegos, A. Artificial Intelligence in the Smart City—A Literature Review. Eng. Manag. Prod. Serv. 2023, 15, 53–75. [Google Scholar] [CrossRef]
  64. Alahi, M.E.E.; Sukkuea, A.; Tina, F.W.; Nag, A.; Kurdthongmee, W.; Suwannarat, K.; Mukhopadhyay, S.C. Integration of IoT-Enabled Technologies and Artificial Intelligence (AI) for Smart City Scenario: Recent Advancements and Future Trends. Sensors 2023, 23, 5206. [Google Scholar] [CrossRef]
  65. Allam, Z.; Dhunny, Z.A. On big data, artificial intelligence and smart cities. Cities 2019, 89, 80–91. [Google Scholar] [CrossRef]
  66. Ullah, Z.; Al-Turjman, F.; Mostarda, L.; Gagliardi, R. Applications of Artificial Intelligence and Machine learning in smart cities. Comput. Commun. 2020, 154, 313–323. [Google Scholar] [CrossRef]
  67. Hassija, V.; Chamola, V.; Mahapatra, A.; Singal, A.; Goel, D.; Huang, K.; Scardapane, S.; Spinelli, I.; Mahmud, M.; Hussain, A. Interpreting Black-Box Models: A Review on Explainable Artificial Intelligence. Cogn. Comput. 2024, 16, 45–74. [Google Scholar] [CrossRef]
  68. Feng, S.; Liu, G.; Shan, T.; Li, K.; Lai, S. Predicting green technology innovation in the construction field from a technology convergence perspective: A two-stage predictive approach based on interpretable machine learning. J. Environ. Manag. 2024, 372, 123203. [Google Scholar] [CrossRef] [PubMed]
  69. Kim, J.; Lee, G.; Lee, S.; Lee, C. Towards expert–machine collaborations for technology valuation: An interpretable machine learning approach. Technol. Forecast. Soc. Change 2022, 183, 121940. [Google Scholar] [CrossRef]
  70. Retzlaff, C.O.; Angerschmid, A.; Saranti, A.; Schneeberger, D.; Röttger, R.; Müller, H.; Holzinger, A. Post-hoc vs ante-hoc explanations: xAI design guidelines for data scientists. Cogn. Syst. Res. 2024, 86, 101243. [Google Scholar] [CrossRef]
  71. Glanois, C.; Weng, P.; Zimmer, M.; Li, D.; Yang, T.; Hao, J.; Liu, W. A Survey on Interpretable Reinforcement Learning. arXiv 2022, arXiv:2112.13112. [Google Scholar] [CrossRef]
  72. Khan, M.A.; Farooq, M.S.; Saleem, M.; Shahzad, T.; Ahmad, M.; Abbas, S.; Abu-Mahfouz, A.M. Smart buildings: Federated learning-driven secure, transparent and smart energy management system using XAI. Energy Rep. 2025, 13, 2066–2081. [Google Scholar] [CrossRef]
  73. Javed, A.R.; Ahmed, W.; Pandya, S.; Maddikunta, P.K.R.; Alazab, M.; Gadekallu, T.R. A Survey of Explainable Artificial Intelligence for Smart Cities. Electronics 2023, 12, 1020. [Google Scholar] [CrossRef]
  74. Airlangga, G. Decoding Energy Usage Predictions: An Application of XAI Techniques for Enhanced Model Interpretability. Indones. J. Artif. Intell. Data Min. 2024, 7, 275–284. [Google Scholar] [CrossRef]
  75. Dou, X.; Chen, W.; Zhu, L.; Bai, Y.; Li, Y.; Wu, X. Machine Learning for Smart Cities: A Comprehensive Review of Applications and Opportunities. Int. J. Adv. Comput. Sci. Appl. 2023, 14. [Google Scholar] [CrossRef]
  76. Pioli, L.; de Macedo, D.D.J.; Costa, D.G.; Dantas, M.A.R. Towards an AI-Driven Data Reduction Framework for Smart City Applications. Sensors 2024, 24, 358. [Google Scholar] [CrossRef] [PubMed]
  77. Golazad, S.; Mohammadi, A.; Rashidi, A.; Ilbeigi, M. From raw to refined: Data preprocessing for construction machine learning (ML), deep learning (DL), and reinforcement learning (RL) models. Autom. Constr. 2024, 168, 105844. [Google Scholar] [CrossRef]
  78. Guo, S.; Liu, Y.; Chen, R.; Sun, X.; Wang, X. Improved SMOTE Algorithm to Deal with Imbalanced Activity Classes in Smart Homes. Neural Process. Lett. 2019, 50, 1503–1526. [Google Scholar] [CrossRef]
  79. Johnson, J.M.; Khoshgoftaar, T.M. Survey on deep learning with class imbalance. J. Big Data 2019, 6, 27. [Google Scholar] [CrossRef]
  80. GeeksforGeeks. Class Interval. Formula. Available online: https://www.geeksforgeeks.org/class-interval/ (accessed on 16 February 2025).
  81. Mishra, P.; Pandey, C.M.; Singh, U.; Gupta, A.; Sahu, C.; Keshri, A. Descriptive Statistics and Normality Tests for Statistical data. Ann. Card. Anaesth. 2019, 22, 67–72. [Google Scholar] [CrossRef]
  82. Rahman, A. (Ed.) Statistics for Data Science and Policy Analysis; Springer: Singapore, 2020. [Google Scholar] [CrossRef]
  83. Boateng, E.Y.; Otoo, J.; Abaye, D.A. Basic Tenets of Classification Algorithms K-Nearest-Neighbor, Support Vector Machine, Random Forest and Neural Network: A Review. J. Data Anal. Inf. Process. 2020, 8, 341–357. [Google Scholar] [CrossRef]
  84. Islam, M.A.; Sufian, M.A. Employing AI and ML for data analytics on key indicators: Enhancing smart city urban services and dashboard-driven leadership and decision-making. In Technology and Talent Strategies for Sustainable Smart Cities: Digital Futures; Emerald Publishing: Leeds, UK, 2023; pp. 275–325. [Google Scholar] [CrossRef]
  85. Al-Quhfa, H.; Mothana, A.; Aljbri, A.; Song, J. Enhancing Talent Recruitment in Business Intelligence Systems: A Comparative Analysis of Machine Learning Models. Analytics 2024, 3, 297–317. [Google Scholar] [CrossRef]
  86. Villalobos-Arias, L.; Quesada-López, C.; Guevara-Coto, J.; Martínez, A.; Jenkins, M. Evaluating hyper-parameter tuning using random search in support vector machines for software effort estimation. In Proceedings of the 16th ACM International Conference on Predictive Models and Data Analytics in Software Engineering, PROMISE 2020, Virtual, 8–9 November 2020; Association for Computing Machinery: New York, NY, USA, 2020; pp. 31–40. [Google Scholar]
  87. Pedregosa, F.; Varoquaux, G.; Gramfort, A.; Michel, V.; Thirion, B.; Grisel, G.; Blondel, M.; Prettenhofer, P.; Weiss, R.; Dubourg, V.; et al. Scikit-Learn: Machine Learning in Python-Scikit-Learn 1.5.2 Documentation. 2011, 12, 2825–2830. Available online: https://scikit-learn.org/stable/user_guide.html (accessed on 2 May 2025).
  88. Chicco, D.; Warrens, M.J.; Jurman, G. The coefficient of determination R-squared is more informative than SMAPE, MAE, MAPE, MSE and RMSE in regression analysis evaluation. PeerJ Comput. Sci. 2021, 7, e623. [Google Scholar] [CrossRef]
  89. Hodson, T.O. Root-mean-square error (RMSE) or mean absolute error (MAE): When to use them or not. Geosci. Model Dev. 2022, 15, 5481–5487. [Google Scholar] [CrossRef]
  90. Chen, Q.; Mao, P.; Zhu, S.; Xu, X.; Feng, H. A decision-aid system for subway microenvironment health risk intervention based on backpropagation neural network and permutation feature importance method. Build. Environ. 2024, 253, 111292. [Google Scholar] [CrossRef]
  91. Huang, N.; Lu, G.; Xu, D. A Permutation Importance-Based Feature Selection Method for Short-Term Electricity Load Forecasting Using Random Forest. Energies 2016, 9, 767. [Google Scholar] [CrossRef]
  92. Chen, Q.; Wang, W.; Wu, F.; De, S.; Wang, R.; Zhang, B.; Huang, X. A Survey on an Emerging Area: Deep Learning for Smart City Data. IEEE Trans. Emerg. Top. Comput. Intell. 2019, 3, 392–410. [Google Scholar] [CrossRef]
  93. Victoria, A.H.; Maragatham, G. Automatic tuning of hyperparameters using Bayesian optimization. Evol. Syst. 2021, 12, 217–223. [Google Scholar] [CrossRef]
  94. Weller, T.; Bandura, C. Smart City District Gets Green Light from City of Houston. Smart Cities World. Available online: https://www.smartcitiesworld.net/commercial-buildings/smart-city-district-gets-green-light-from-city-of-houston-7135 (accessed on 2 May 2025).
  95. Mistretta, A.J. Mayor Turner Creates Smart Cities Council to Speed Tech Adoption. Available online: https://www.houston.org/news/mayor-turner-creates-smart-cities-council-speed-tech-adoption (accessed on 2 May 2025).
  96. Hamamurad, Q.H.; Jusoh, N.M.; Ujang, U. Factors Affecting Stakeholder Acceptance of a Malaysian Smart City. Smart Cities 2022, 5, 1508–1535. [Google Scholar] [CrossRef]
  97. Shafiullah, M.; Rahman, S.; Imteyaz, B.; Aroua, M.K.; Hossain, M.I.; Rahman, S.M. Review of Smart City Energy Modeling in Southeast Asia. Smart Cities 2023, 6, 72–99. [Google Scholar] [CrossRef]
  98. Sharji, E.A.; Tan, J.Y.; Wong, S.Y.; Koo, A.C.; Sharji, E.A. A Review of Future Household Waste Management for Sustainable Environment in Malaysian Cities 2022. Preprints 2022, 2022050074. [Google Scholar] [CrossRef]
  99. Renn, A.M. IMD Smart City Index. 2024. Available online: https://www.coit.es/sites/default/files/imd_-smartcityindex-2024-full-report.pdf (accessed on 2 June 2025).
  100. Mohammed, S. Dubai Clean Energy Strategy | The Official Portal of the UAE Government. Available online: https://u.ae/en/about-the-uae/strategies-initiatives-and-awards/strategies-plans-and-visions/environment-and-energy/dubai-clean-energy-strategy (accessed on 2 May 2025).
  101. Sabri, S. Chapter 10—Smart Dubai IoT strategy: Aspiring to the promotion of happiness for residents and visitors through a continuous commitment to innovation. In Smart Cities for Technological and Social Innovation; Kim, H.M., Sabri, S., Kent, A., Eds.; Academic Press: Cambridge, MA, USA, 2021; pp. 181–193. [Google Scholar] [CrossRef]
  102. El Khatib, M.; Ahmed, G.; Alshurideh, M.; Al-Nakeeb, A. Interdependencies and Integration of Smart Buildings and Smart Cities: A Case of Dubai. In The Effect of Information Technology on Business and Marketing Intelligence Systems; Alshurideh, M., Al Kurdi, B.H., Masa’deh, R., Alzoubi, H.M., Salloum, S., Eds.; Springer International Publishing: Cham, Switzerland, 2023; pp. 1637–1656. [Google Scholar] [CrossRef]
  103. Alohan, E.O.; Oyetunji, A.K.; Amaechi, C.V.; Dike, E.C.; Chima, P. An Agreement Analysis on the Perception of Property Stakeholders for the Acceptability of Smart Buildings in the Nigerian Built Environment. Buildings 2023, 13, 1620. [Google Scholar] [CrossRef]
  104. El-Motasem, S.; Khodeir, L.M.; Fathy Eid, A. Analysis of challenges facing smart buildings projects in Egypt. Ain Shams Eng. J. 2021, 12, 3317–3329. [Google Scholar] [CrossRef]
  105. Kozlowski, W.; Suwar, K. Smart City: Definitions, Dimensions, and Initiatives. Eur. Res. Stud. 2021, XXIV, 509–520. [Google Scholar] [CrossRef]
  106. Barletta, V.S.; Caivano, D.; Dimauro, G.; Nannavecchia, A.; Scalera, M. Managing a Smart City Integrated Model through Smart Program Management. Appl. Sci. 2020, 10, 714. [Google Scholar] [CrossRef]
  107. Dalla Longa, R. The Smart City: Integration; Springer: Cham, Switzerland, 2023; pp. 247–275. [Google Scholar] [CrossRef]
Figure 1. Research workflow.
Buildings 15 02031 g001
Figure 2. Dataset characteristics: (A) geographical distribution; (B) applied rating systems.
Buildings 15 02031 g002
Figure 3. Distribution and normality assessment of smart building integration metrics. (AD) represent histograms with fitted normal distribution curves for the following scores: Total Points Score, Efficiency Score, Resilience Score and Sustainability Score respectively.
Buildings 15 02031 g003aBuildings 15 02031 g003b
Figure 4. Comparison of predicted vs. actual smart building integration levels across ML models, where (AF) represent the models KNN, SVR, RF, AdaBoost, DT, and ET, respectively.
Buildings 15 02031 g004
Figure 5. Performance evaluation of ML models for smart building integration prediction.
Buildings 15 02031 g005
Figure 6. SVR model prediction vs. original level; (A): efficiency; (B): resilience; (C): environmental sustainability.
Buildings 15 02031 g006
Figure 7. Performance evaluation of the model for predicting SB integration classes based on the impact on SC performance aspects.
Buildings 15 02031 g007
Figure 8. Feature importance analysis from various ML models: (AF) from the models KNN, SVR, RF, AdaBoost, DT, and ET, respectively.
Buildings 15 02031 g008aBuildings 15 02031 g008bBuildings 15 02031 g008c
Table 1. Summary of ML algorithms employed.
ML
Algorithm
Key Performance
Characteristics
Rationale of
Selection/Limitations
References
KNNSimple, interpretable, and effective for small datasets.
Performance is highly sensitive to feature scaling and irrelevant attributes.
No training time; prediction can be computationally expensive.
Chosen for its simplicity and efficacy in classification challenges predicated on feature similarity.
Used as a baseline model to compare against more complex algorithms.
Sensitive to scales and lacks interpretability.
[83,84]
SVRStrong generalisation ability.
Handles high-dimensional feature spaces efficiently.
Performs well even with limited data when properly regularised.
Chosen for its robustness, well-suited for complex, high-dimensional data, and effectiveness in achieving clear margins of separation due to its ability to model non-linear relationships using the Kernel function.
Requires Kernel tuning.
[84,85]
RFHigh accuracy with low variance.
Effective for ranking the features’ importance.
Handles missing data and mixed variable types.
Used for its ensemble learning method, which generates several Decision Trees and combines their results. This gives it great accuracy and helps it deal with noise and overfitting.
Tends to overfit small data.
[83,84,86]
AdaBoostEffective on moderately clean and balanced datasets.
Boosting algorithm focusing on correcting predecessor errors.
Chosen for its Adaptive Boosting method, which focusses on reducing mistakes by changing the weights of misclassified instances over and over again.
Less effective in noisy datasets.
[83,84,85]
DTFully interpretable, with clear splitting rules.
Prone to overfitting, but useful for benchmarking.
Fast computing and low complexity.
Easy to understand and follow for the decision making process.
Served as a baseline to contrast with ensemble methods (RF and Extra Tree).
Prone to overfitting.
[76,83,84]
ETSimilar to RF but with randomised splits for faster training.
Generally, less prone to overfitting on large datasets.
Robust for high-dimensional datasets.
A variation in RF increases diversity through greater randomness in feature splitting and data sampling, improving variance reduction.
Tested as a variant of RF to assess the impact of randomness on integration predictions.
Less robust on heterogeneous datasets.
[83]
Table 2. Overview of the hyperparameters and training settings for the employed machine learning models [87].
ML AlgorithmTuned
Hyperparameters
Functions of HyperparametersImpacts on Performance
KNNn_neighbours,
weight,
metric
n_neighbours: defines locality size. Weights: adjust the distance influence.
Metric: chooses a similarity function.
Affects the model’s ability to capture local structures in the data.
SVRC,
Epsilon,
Kernel
C: controls the trade-off between training error and model complexity.
Epsilon: defines the margin of tolerance.
Kernel: determines the type of non-linearity.
Appropriate parameter tuning may explore the trade-off between bias and variance and improve generalisation, and Kernel choice significantly impacts on effectively capturing non-linear relations and that in turn affects the flexibility and complexity of decision boundary.
RFn_estimators, max_depth,
min_samples_split, min_samples_leaf, max_features
n_estimators: sets the number of Decision Trees in the ensemble. Typically, more trees reduce variance and improve performance.
max_depth: reduces overfitting.
min_samples_split: is required to split an internal node. Larger values make the model more conservative.
min_samples_leaf: higher values reduce complexity and prevent overfitting.
max_features: proportion or number of features considered at each split. Lower values increase randomness, which improves generalisation and reduces overfitting.
Impacts accuracy and resistance to overfitting by limiting depth and adjusting split criteria; more estimators increase stability but may increase computation.
AdaBoostn_estimators,
learning_rate
n_estimators: sets the number of weak learners.
learning_rate: determines the weight of each learner’s contribution.
Has a significant impact on learning stability and enhances focus on misclassified instances. Low learning rates with more estimators improve robustness, while high values risk overfitting or instability.
DTmax_depth,
min_samples_split, min_samples_leaf
max_depth: limits how deep the tree can grow. A shallower tree generalises better; deeper trees may overfit.
min_samples_split: the higher values make the tree more conservative and reduce model complexity.
min_samples_leaf: refers to the number of samples required to be at a leaf node. Controls the granularity of decision boundaries.
Tuning ensures the balance between capturing the structure and avoiding high-variance errors.
ETn_estimators, max_depth,
min_samples_split, min_sample_leaf, max_features
n_estimators: refers to the number of trees in the ensemble. More trees generally improve stability and reduce variance.
max_depth: controls the depth of each tree. Shallow trees generalise better; deep trees may memorise noise.
min_samples_split: controls the minimum samples to split a node.
min_samples_leaf: refers to the minimum number of samples required to be at a leaf node.
max_features: controls how many features to consider when looking for the best split. Lower values increase randomness.
Greater randomness reduces variance and overfitting; proper depth and minimum split tuning improve generalisation on diverse datasets.
Table 3. Smart building integration into smart city classes.
ClassMin ScoreMax Score
1288332
2333377
3378422
4423467
5468512
Table 4. Integration classes that represent the impact on the efficiency, resilience and environmental sustainability of smart city performance.
ClassEfficiencyResilienceEnvironmental Sustainability
Min ScoreMax Score Min ScoreMax ScoreMin ScoreMax Score
1243118241925
2323925312632
3404732383339
Table 5. Optimal parameters selected for the ML algorithms.
ModelHyperparameter SettingValue Range
KNNneighbours = (1, 30)
weight = (0, 1)
metric = (0, 1)
neighbours = (5.525, 7.158, 10.95, 9.613, 9.258)
weight = (0.156, 0.181, 0.968, 0.047, 0.977)
metric = (0.598, 0.832, 0.0041, 0.916, 0.885)
SVRC = (0.1, 10.0)
Epsilon = (0.01, 1.0)
Kernel = (0, 1)
C = (6.027, 7.11, 8.261, 5.174, 3.5822)
Epsilon = (0.1645, 0.0338, 0.04605, 0.03093, 0.03123)
Kernel = (0.156, 0.9699, 0.991, 0.1038, 0.0124)
RFn_estimators = (50, 500)
max_depth = (3, 50)
min_samples_split = (2, 20)
min_sample_leaf = (1, 10)
max_features = (0.1, 1.0)
n_estimators = (181.1, 255.2, 241.1, 239.7, 247.1)
max_depth = (11.62, 31.76, 40.43, 28.37, 36.85)
min_samples_split = (9.775, 8.595, 6.335, 2.574, 2.787)
min_sample_leaf = (5.723, 3.629, 2.473, 1.777, 1.279)
max_features = (0.373, 0.225, 0.714, 0.995, 0.563)
AdaBoostn_estimators = (50, 300)
learning_rate = (0.01, 1.0)
n_estimators = (199.7, 227, 271)
learning_rate = (0.734, 0.605, 0.794)
DTmax_depth = (3, 50) min_sample_split = (2, 20)
min_samples_leaf = (1, 10)
max_depth = (31.14, 49.1)
min_sample_split = (4.88, 6.963)
min_samples_leaf = (2.404, 1.272)
ETn_estimators = (50, 500)
max_depth = (3, 50)
min_samples_split = (2, 20)
min_sample_leaf = (1, 10)
max_features = (0.1, 1.0)
n_estimators = (368.6, 181.1, 255.2, 154.6)
max_depth = (10.33, 11.62, 31.76, 30.45)
min_samples_split = (12.82, 9.775, 8.595, 3.881)
min_sample_leaf = (8.796, 5.723, 3.629, 1.322)
max_features = (0.1523, 0.3738, 0.2255, 0.143)
Table 6. External case study overview.
Building No.City, CountryYearTypeArea (m2)Floors NoRating System
Building 1Houston, USA2013Commercial; Office130,00053N/A
Building 2Kuala Lumpur, Malaysia2017Office62,00045Green Mark
Building 3Dubai, UAE 2019Commercial Building; Office59,00015LEED
Building 4Dubai, UAE 2020Commercial; Warehouse; Office86,00032LEED
Table 7. Case study summary of present integration status.
Available ServicesTotal IntegrationEfficiencyResilienceEnvironmental Sustainability
Class LevelClass LevelClass LevelClass Level
Building 113/261111
Building 217/262121
Building 320/263222
Building 421/264232
Table 8. Case study summary of predicted integration improvement.
Available ServicesTotal IntegrationEfficiencyResilienceEnvironmental Sustainability
Class LevelClass LevelClass LevelClass Level
Building 119/264232
Building 222/265333
Building 322/264232
Building 423/265333
Disclaimer/Publisher’s Note: The statements, opinions and data contained in all publications are solely those of the individual author(s) and contributor(s) and not of MDPI and/or the editor(s). MDPI and/or the editor(s) disclaim responsibility for any injury to people or property resulting from any ideas, methods, instructions or products referred to in the content.

