Article

A Modified Shapley Value Model for Equitable Benefit Distribution in Design-Led EPC Consortia

by
Jiangtao Lao
and
Zhongfu Qin
*
College of Civil Engineering and Architecture, Zhejiang University, Hangzhou 310058, China
*
Author to whom correspondence should be addressed.
Buildings 2025, 15(12), 2024; https://doi.org/10.3390/buildings15122024
Submission received: 16 May 2025 / Revised: 9 June 2025 / Accepted: 11 June 2025 / Published: 12 June 2025
(This article belongs to the Section Construction Management, and Computers & Digitization)

Abstract

:
The Engineering, Procurement, and Construction (EPC) model—particularly the design-led consortium structure—has proven effective in enhancing design quality, improving construction feasibility, and reducing project costs. Nonetheless, its broader application remains constrained by difficulties in quantifying consortium members’ future benefits and establishing an equitable benefit distribution mechanism. These issues often undermine cooperation and limit the scalability of the model. To address these challenges, this study proposes a benefit distribution model that incorporates two quantifiable indicators of members’ future benefits: the bid-winning rate and the profit margin of future projects. The model further enhances fairness by modifying the classical Shapley value method. It introduces a cost compensation factor and a benefit entitlement influence factor to account for differences in both resource input and initial contractual entitlements. Results from a case study of a national highway reconstruction project in Hangzhou, China, demonstrate that the proposed model produces distribution outcomes more closely aligned with actual contractual benchmarks and improves fairness and acceptance among consortium members.

1. Introduction

With the rapid development of the construction industry, the complexity of engineering projects has been continuously increasing, accompanied by rising demands for technology integration, management efficiency, and interdisciplinary collaboration [1]. The construction industry is witnessing a technological revolution [2], and traditional project management models are increasingly inadequate in addressing challenges such as multi-party coordination, dynamic demand adjustments, and cost–schedule control. Against this backdrop, the EPC model consolidates the design, procurement, and construction phases under a single contractual entity. This integrated approach addresses the fragmentation found in traditional contracting methods. By enabling unified scheduling and centralized coordination, the EPC model significantly enhances collaboration across project stages [3]. The model is particularly well-suited for large-scale and complex projects that require high levels of technological innovation and are constrained by tight construction schedules. It helps optimize management processes, improves resource allocation, and supports the successful delivery of project objectives [4]. As a result, it is gradually becoming a major development trend in the construction industry [5].
EPC projects can be undertaken either by a single enterprise independently or jointly by multiple enterprises in the form of a consortium. However, due to the high technical complexity, large-scale investment, and the need for multi-party coordination typically involved in such projects, most enterprises are currently not capable of handling them alone. To promote the development of the EPC model, the government has introduced a series of policies encouraging enterprises to participate in EPC projects through joint organizations [6]. Driven by both policy support and market demand, forming consortiums to jointly undertake EPC projects has gradually become a key practical approach in the engineering contracting sector. Currently, EPC consortiums are mainly categorized into two types: construction-led and design-led models [7]. Among them, the latter, led by a design enterprise, enhances construction feasibility, optimizes cost structures, and effectively controls project risks through early-stage design optimization and technological innovation [8]. This model improves project quality from the source, reduces construction complexity, strengthens cost management, and shortens the construction period. It has demonstrated outstanding performance in enhancing project management efficiency and overall effectiveness. As a result, the design-directed approach is being increasingly adopted in the engineering contracting sector and has gradually evolved into a major organizational form of EPC consortiums.
Despite the theoretical advantages of this design-led structure, its practical application continues to face several challenges. The most prominent issues include low collaboration efficiency among consortium members and frequent disputes over benefit distribution, both of which hinder its effective promotion and widespread adoption [9]. These challenges primarily stem from significant disparities in the levels of investment and actual contribution among participating members. However, existing benefit distribution mechanisms often rely on fixed ratios or predetermined contractual agreements, which fail to adequately reflect each member’s true contribution. As a result, the distribution of benefits tends to be ambiguous or inequitable, ultimately undermining member motivation and weakening the consortium’s overall cohesion.
Cooperative game theory offers a rigorous analytical framework for benefit distribution in multi-agent collaborative environments, emphasizing that returns should be allocated based on each participant’s marginal contribution to ensure the fairness and sustainability of cooperation. Among these approaches, the Shapley value method has been widely adopted in the field of construction management. By quantifying each member’s marginal contribution across all possible coalition permutations, it enables benefits to be distributed proportionally to actual contributions. However, existing applications of the Shapley value in EPC consortium settings have primarily focused on cost disparities among members, while largely overlooking the influence of initial benefit entitlements. This omission has led to allocation schemes that may be perceived as unfair by members with greater initial claims, and fails to adequately explain the benefit distribution ratios commonly observed in design-led EPC models. As a result, such schemes often lack acceptance among key stakeholders, particularly the design lead, thereby weakening the model’s practical effectiveness.
This study aims to enhance the fairness and incentivization of benefit distribution among members of design-led EPC consortia by addressing the limitations of traditional allocation models. A modified Shapley value framework is proposed, which incorporates two critical factors: cost contribution and initial benefit entitlement. This adjustment ensures a more equitable and realistic distribution mechanism. To validate the model, a case study is conducted using a national highway reconstruction project. The proposed approach is expected to improve member engagement, promote value creation, and enhance the overall effectiveness and acceptability of benefit distribution within consortium-based project delivery structures.
The remainder of this paper is structured as follows. Section 2 presents a literature review on the EPC consortium model and existing research on benefit distribution. Section 3 introduces a method for quantifying the net benefits of consortium members. Section 4 proposes a benefit distribution model tailored to design-led EPC consortia. Section 5 validates the proposed model through a case study. Finally, Section 6 concludes the paper by summarizing the key findings and implications of this study.

2. Literature Review

2.1. EPC Model

The EPC model is an integrated project delivery approach that encompasses the entire process from design and procurement to construction. Originating in the engineering markets of Europe and North America, the EPC model was initially applied to large-scale projects in sectors such as petrochemicals, energy, and infrastructure. During the 1970s, it gradually gained traction in the international engineering market and became the dominant management model for major global projects [10]. At present, research on the EPC model by scholars both domestically and internationally primarily focuses on its management mechanisms. Some scholars have explored the coordination mechanisms of EPC general contractors from the perspective of collaborative relationships. For instance, Sun et al. [11] established an evolutionary game model between project owners and general contractors concerning the level of BIM (Building Information Modeling) application, analyzing the dynamic collaboration in BIM-related decision-making under conditions of bounded rationality. Wagner [12], addressing the decline in EPC business performance and competitiveness in Europe, proposed the concept of “EPC 4.0,” which includes six potential areas of improvement—such as digitalization, partnership models, and supply chain flattening—to optimize the EPC business model and reduce the total project budget costs. In addition, Gao et al. [13] identified nine key factors influencing contractor collaboration in international construction projects through surveys and applied structural equation modeling to evaluate the interrelationships among these variables. Du et al. [14] explored the causal relationships among the degree of partnership application, risk management practices, organizational capabilities, and the performance level of EPC projects, providing a solid foundation for contractors’ decision-making during project implementation. Wang et al. [15], through empirical research, revealed the interdisciplinary linkages among risk management, partnership relations, and contractors’ capabilities in delivering international EPC projects. Baghalzadeh et al. [16] explore the interconnections between IoT, Building Information Modeling (BIM), and Digital Twin (DT) technologies and their implications for contractual coordination in the construction industry.
At the level of EPC project performance, Kabirifar et al. [17] employed a multi-attribute group decision-making technique to analyze the factors influencing the performance of large-scale residential EPC projects in Iran, identifying engineering design, project planning, and project control as key determinants. Shen et al. [18], using seven international EPC hydropower projects as case studies, modeled and empirically tested the causes of contractor claims, revealing the interrelationships between external risks, owner organizational behavior, project definition in contracts, and claims within EPC projects. Aldhaheri et al. [19] employed a structural equation modeling approach to identify the factors influencing the effectiveness of oil and gas EPC projects, establishing causal relationships and the relative contribution of each factor. Liu et al. [20] analyzed how contractors’ behaviors—such as diligence and opportunism—under varying levels of contract and task complexity affect value-added performance in EPC projects. Wang et al. [21], based on the case of the Aplohuo Hydropower Station, utilized a mediation model to examine the causal relationships among partnership, design management, and EPC project outcomes. They proposed that contractors should systematically enhance their design management capabilities through planning and execution, dispute resolution, design optimization, and technological improvement. Lee et al. [22] investigated the direct impact of joint contract functionality on BIM-supported EPC project performance, exploring the mediating effects of perceived fairness, inter-organizational trust, and distrust, thereby offering a theoretical foundation for optimizing contract frameworks in BIM-supported EPC projects. Fan et al. [23], through a literature review, case studies, and expert interviews, identified 15 key elements in the coordination mechanism between design and construction in railway design-led EPC projects. Using social network analysis, they found that coordination and communication mechanisms, organizational development, and design management systems are the core network elements influencing collaborative management in railway EPC projects.
In summary, current research on the EPC model primarily focuses on single-contractor entities, while studies specifically addressing EPC consortium models remain relatively limited. Moreover, the existing literature is predominantly qualitative in nature, emphasizing internal collaboration mechanisms and organizational structures within the consortium. Quantitative research on profit or benefit distribution mechanisms in EPC consortium models is comparatively scarce.

2.2. Benefit Distribution in Consortia

The consortium model has been widely applied across various fields, including corporate alliances, scientific collaborations, and infrastructure development. A well-designed benefit distribution mechanism not only affects the enthusiasm and cooperative stability among consortium members, but also plays a crucial role in the long-term sustainability of the consortium itself. Existing research primarily focuses on measuring members’ contributions, ensuring fairness in distribution, and optimizing distribution models. These studies often adopt approaches from game theory, cooperative theory, and economics, and have developed a variety of distribution mechanisms tailored to different application scenarios, aiming to achieve optimal benefit allocation while maintaining both fairness and incentive effectiveness.
Cooperative game theory—a major branch of game theory—focuses on how multiple decision-makers, such as individuals, firms, or organizations, form coalitions and allocate benefits and costs under binding agreements. Its foundational framework was first introduced by von Neumann and Morgenstern in their 1944 seminal work Theory of Games and Economic Behavior [24]. A central issue in cooperative games is the design of fair and satisfactory benefit distribution mechanisms among coalition members. Scholars have proposed various allocation methods based on different axiomatic assumptions. Nash [25] laid the foundation for bilateral cooperation by introducing an axiomatic solution to bargaining problems based on Pareto optimality and symmetry. Shapley [26] proposed the Shapley value, which distributes benefits based on each member’s marginal contribution across all possible coalition permutations, ensuring fairness. To address coalition stability, Gillies [27] introduced the concept of the Core, which ensures that no subgroup can gain more by deviating, though it may yield multiple or no solutions. To overcome this, Schmeidler [28] proposed the Nucleolus, a unique solution concept aimed at minimizing dissatisfaction within the coalition. Although theoretically robust, its computational complexity limits its practical application.
Gulati et al. [29] examined the impact of trust mechanisms within consortia on benefit distribution and found that long-term and stable partnerships can reduce friction among members, thereby enhancing fairness and sustainability in benefit allocation. Feng et al. [30], addressing the issue of profit distribution in multi-tier supply chains, proposed a two-round benefit distribution model: the first round determines the initial profit allocation, while the second round adjusts the distribution based on the reliability of each member to improve the overall cooperation stability and member trustworthiness. Guo et al. [31], using the Holmstrom–Milgrom model from principal-agent theory, analyzed the effort levels of participants in integrated project delivery (IPD) and calculated each party’s benefit distribution coefficient to maximize the overall project gains. Liu et al. [32] applied utility theory to comprehensively evaluate factors such as capital contribution ratios, bargaining power, risk management capabilities, and risk-bearing willingness among various stakeholders in quasi-public water conservancy PPP projects. They then constructed utility objective functions for each participant and modified their risk-sharing ratios using the Shapley value. Shang et al. [33], from the stakeholder perspective, employed the Analytic Hierarchy Process (AHP) and fuzzy comprehensive evaluation to determine risk assessment indicators and stakeholder-specific risk coefficients. They then normalized the risk coefficients and used them to revise the Shapley value, ultimately deriving the final energy-saving benefit distribution scheme for energy performance contracting projects. Yu et al. [34] proposed the Federated Learning Incentivizer (FLI), a payoff-sharing scheme that dynamically allocates a given budget among data owners in a federation. The scheme is context-aware and aims to jointly maximize collective utility while minimizing disparities in both the payoff received and the waiting time for receiving rewards, thereby enhancing fairness and efficiency in federated learning environments.

2.3. Benefit Distribution in EPC Project Consortia

In recent years, scholars have conducted in-depth research on the benefit distribution mechanisms within EPC project consortia, with a primary focus on measuring member contributions and adjusting for fairness. For example, Hosseinian et al. [35] investigated the outcome-sharing mechanism among contractors in EPC consortium contracts. By analyzing the optimal profit distribution ratios based on different levels of risk aversion, they found that under ideal conditions, contractors with similar risk preferences should share profits in proportion to their contribution levels. However, for contractors with higher risk aversion, their share of profits should be relatively lower, even when their contribution level is the same. Ding et al. [36], drawing on principal-agent theory, studied the allocation of benefits and risks between owners and contractors in hydropower EPC projects under the framework of Target Cost Contracts (TCCs). They examined the issue of benefit distribution under both discrete and continuous relationships between value-added contributions and effort levels by EPC contractors.
To address this issue, some researchers have begun to focus on the application of the Shapley value method in benefit distribution within EPC consortium models. By incorporating various compensation mechanisms or revenue-sharing strategies, they aim to improve the fairness and rationality of distribution outcomes. As one of the most representative allocation methods in cooperative game theory, the Shapley value was proposed by Nobel laureate Lloyd Shapley in 1953 [26]. Its core principle lies in evaluating each participant’s marginal contribution across all possible coalition combinations, thereby determining a fair share for each member in the overall cooperative game. Due to its theoretical advantage in reflecting actual contributions, the Shapley value has been widely applied in fields such as resource allocation, cost sharing, and benefit distribution. For example, Yue et al. [37] proposed an improved entropy-weighted TOPSIS method based on the Shapley value for prefabricated building EPC projects, aiming to balance the actual contributions of participants with fairness in benefit distribution. Liu et al. [38] studied profit distribution in water-saving management contracts in PPP and EPC projects and proposed an improved expected Shapley value method to optimize profit allocation in multi-party cooperation and enhance the internal stability of the consortium.
In summary, existing research on benefit distribution within EPC project consortia has primarily focused on disparities in cost and contribution, while paying limited attention to the role of initial benefit entitlements. As illustrated in Table 1, the current models often neglect the impact of pre-existing advantages and fail to address how these initial entitlements affect distribution outcomes. Moreover, there is a noticeable lack of methodological frameworks for quantifying future-oriented benefits, including enhanced reputation, capacity building, and sustained collaboration potential. These gaps underscore the need for a more comprehensive and equitable model that integrates both tangible contributions and intangible initial advantages into the allocation process.

3. Quantification of Net Benefits for Consortium Members

In the design-led EPC model, the EPC project consortium is typically composed of multiple parties working collaboratively to ensure efficient project execution and take full responsibility for the entire process of design, procurement, and construction. Within this structure, the design lead is primarily responsible for optimizing the design scheme, integrating resources, and overseeing project management to ensure a seamless connection between design and construction. The contractor, on the other hand, is tasked with providing construction technology and management solutions to guarantee timely and high-quality project delivery. In practice, the procurement function is often not handled by an independent procurement entity, but is instead jointly managed by either the design lead or the contractor [4]. Therefore, this study defines the design-led EPC consortium as comprising a design lead and a contractor, with all procurement activities fully undertaken by the design lead.
The total benefits of the consortium—comprising direct economic benefits (e.g., project revenue) and future benefits (e.g., strategic gains from reputation or future bidding potential)—do not represent the amount directly available for distribution. As shown in Figure 1, during project execution, members incur various costs, including labor, materials, and capital expenditures. These must be deducted before calculating the net benefit, which is the actual return attributable to value creation activities. This residual benefit pool provides the basis for designing a scientific and equitable distribution mechanism among consortium members.

3.1. Cost Analysis of Consortium Members

Consortium members’ resource inputs in construction activities can be categorized into four main types: personnel input, material input, capital input, and time input. Personnel input primarily refers to the allocation of professional human resources such as project managers, technical staff, and engineers. Material input includes the procurement and utilization of equipment, raw materials, and other necessary tools required for project execution. Capital input encompasses direct financial expenditures on technological development, external consulting, contract formulation, and implementation. Time input reflects the duration of material and personnel resource usage.
In cost estimation for consortium members, time input is not treated as an independent cost category; rather, it is embedded within labor and material costs in the form of labor hours or material usage periods, with its economic value quantified and incorporated into the overall cost calculations. For example, increased time input directly raises labor expenses or prolongs the duration of equipment use and leasing periods, thereby increasing material costs. Based on this, the study defines the cost structure of consortium members as consisting of three dimensions: labor cost, material cost, and capital cost.
For clarity, this study denotes the total cost of the design lead party as C D , where C D 1 represents labor cost, C D 2 represents material cost, and C D 3 represents capital cost. Similarly, the total cost of the construction party is denoted as C C , with C C 1 for labor cost, C C 2 for material cost, and C C 3 for capital cost. Thus, the total cost of the design lead party and the construction party are expressed as Equations (1) and (2):
C D = C D 1 + C D 2 + C D 3
C C = C C 1 + C C 2 + C C 3

3.2. Benefit Analysis of Consortium Members

This study defines the benefits of consortium members as the economic returns and enhancement of long-term market competitiveness obtained directly or indirectly during the implementation of EPC projects through activities such as design optimization, procurement management, technological innovation, and the improvement of communication mechanisms. Based on the origin and nature of these benefits, the value creation benefits of consortium members are further categorized into two dimensions: direct economic benefits and future benefits.
(1)
Direct economic benefits refer to the immediate financial returns earned by consortium members through their own activities during the execution of the EPC project. These mainly include the following:
  • Contractual Income: Payments received according to the contract terms upon the completion of project tasks;
  • Cost-saving Benefits: Additional gains achieved through cost reduction measures such as design optimization, technical innovation, and improved communication;
  • External Financial Rewards: Economic incentives or bonuses granted due to outstanding performance in project management during implementation.
(2)
Future benefits refer to the long-term strategic gains beyond the current EPC project, derived from value-adding activities carried out during project implementation. Based on enterprise needs, future benefits can be classified into three main pathways:
  • Improved Corporate Reputation: Corporate reputation is a key indicator of a consortium member’s recognition within the industry, market, and client base. By delivering high-quality project services, consortium members can build a strong reputation, enhance client trust, and increase market credibility. An improved reputation not only attracts more potential partners, but also offers a competitive advantage in future EPC project bidding, thereby increasing the likelihood of contract awards;
  • Enhanced Organizational Abilities: Through the practice and experience gained in managing EPC projects, consortium members can continuously refine and establish standardized project management systems, improve collaboration efficiency, and enhance resource integration abilities—thus reducing management costs in future projects. Meanwhile, the introduction of innovative technologies and methodologies not only increases the value of the current project, but also helps firms to develop efficient, cost-effective, and standardized procedures. This facilitates the undertaking of more complex and higher-level projects, while improving future cost control and profitability;
  • Improved Cooperative Relationships: Maintaining collaborative relationships is a cornerstone of long-term development for consortium members. This includes sustained cooperation with owners, subcontractors, and suppliers. The performance of consortium members in EPC projects directly influences their future cooperation opportunities. During project execution, members can establish a stable strategic network through efficient information sharing, optimized collaboration processes, and strengthened mutual trust. This not only increases the likelihood of securing future projects, but also reduces transaction and procurement costs, enhances supply chain stability, and improves the overall effectiveness of future projects.
For clarity, this study denotes the total benefit of the design lead party as B D , where B D 1 represents direct economic benefits and B D 2 represents future benefits. Similarly, the total benefit of the construction party is denoted as B C , with B C 1 for direct economic benefits and B C 2 for future benefits. Thus, the total benefits of the design lead party and the construction party are expressed as Equations (3) and (4):
B D = B D 1 + B D 2
B C = B C 1 + B C 2

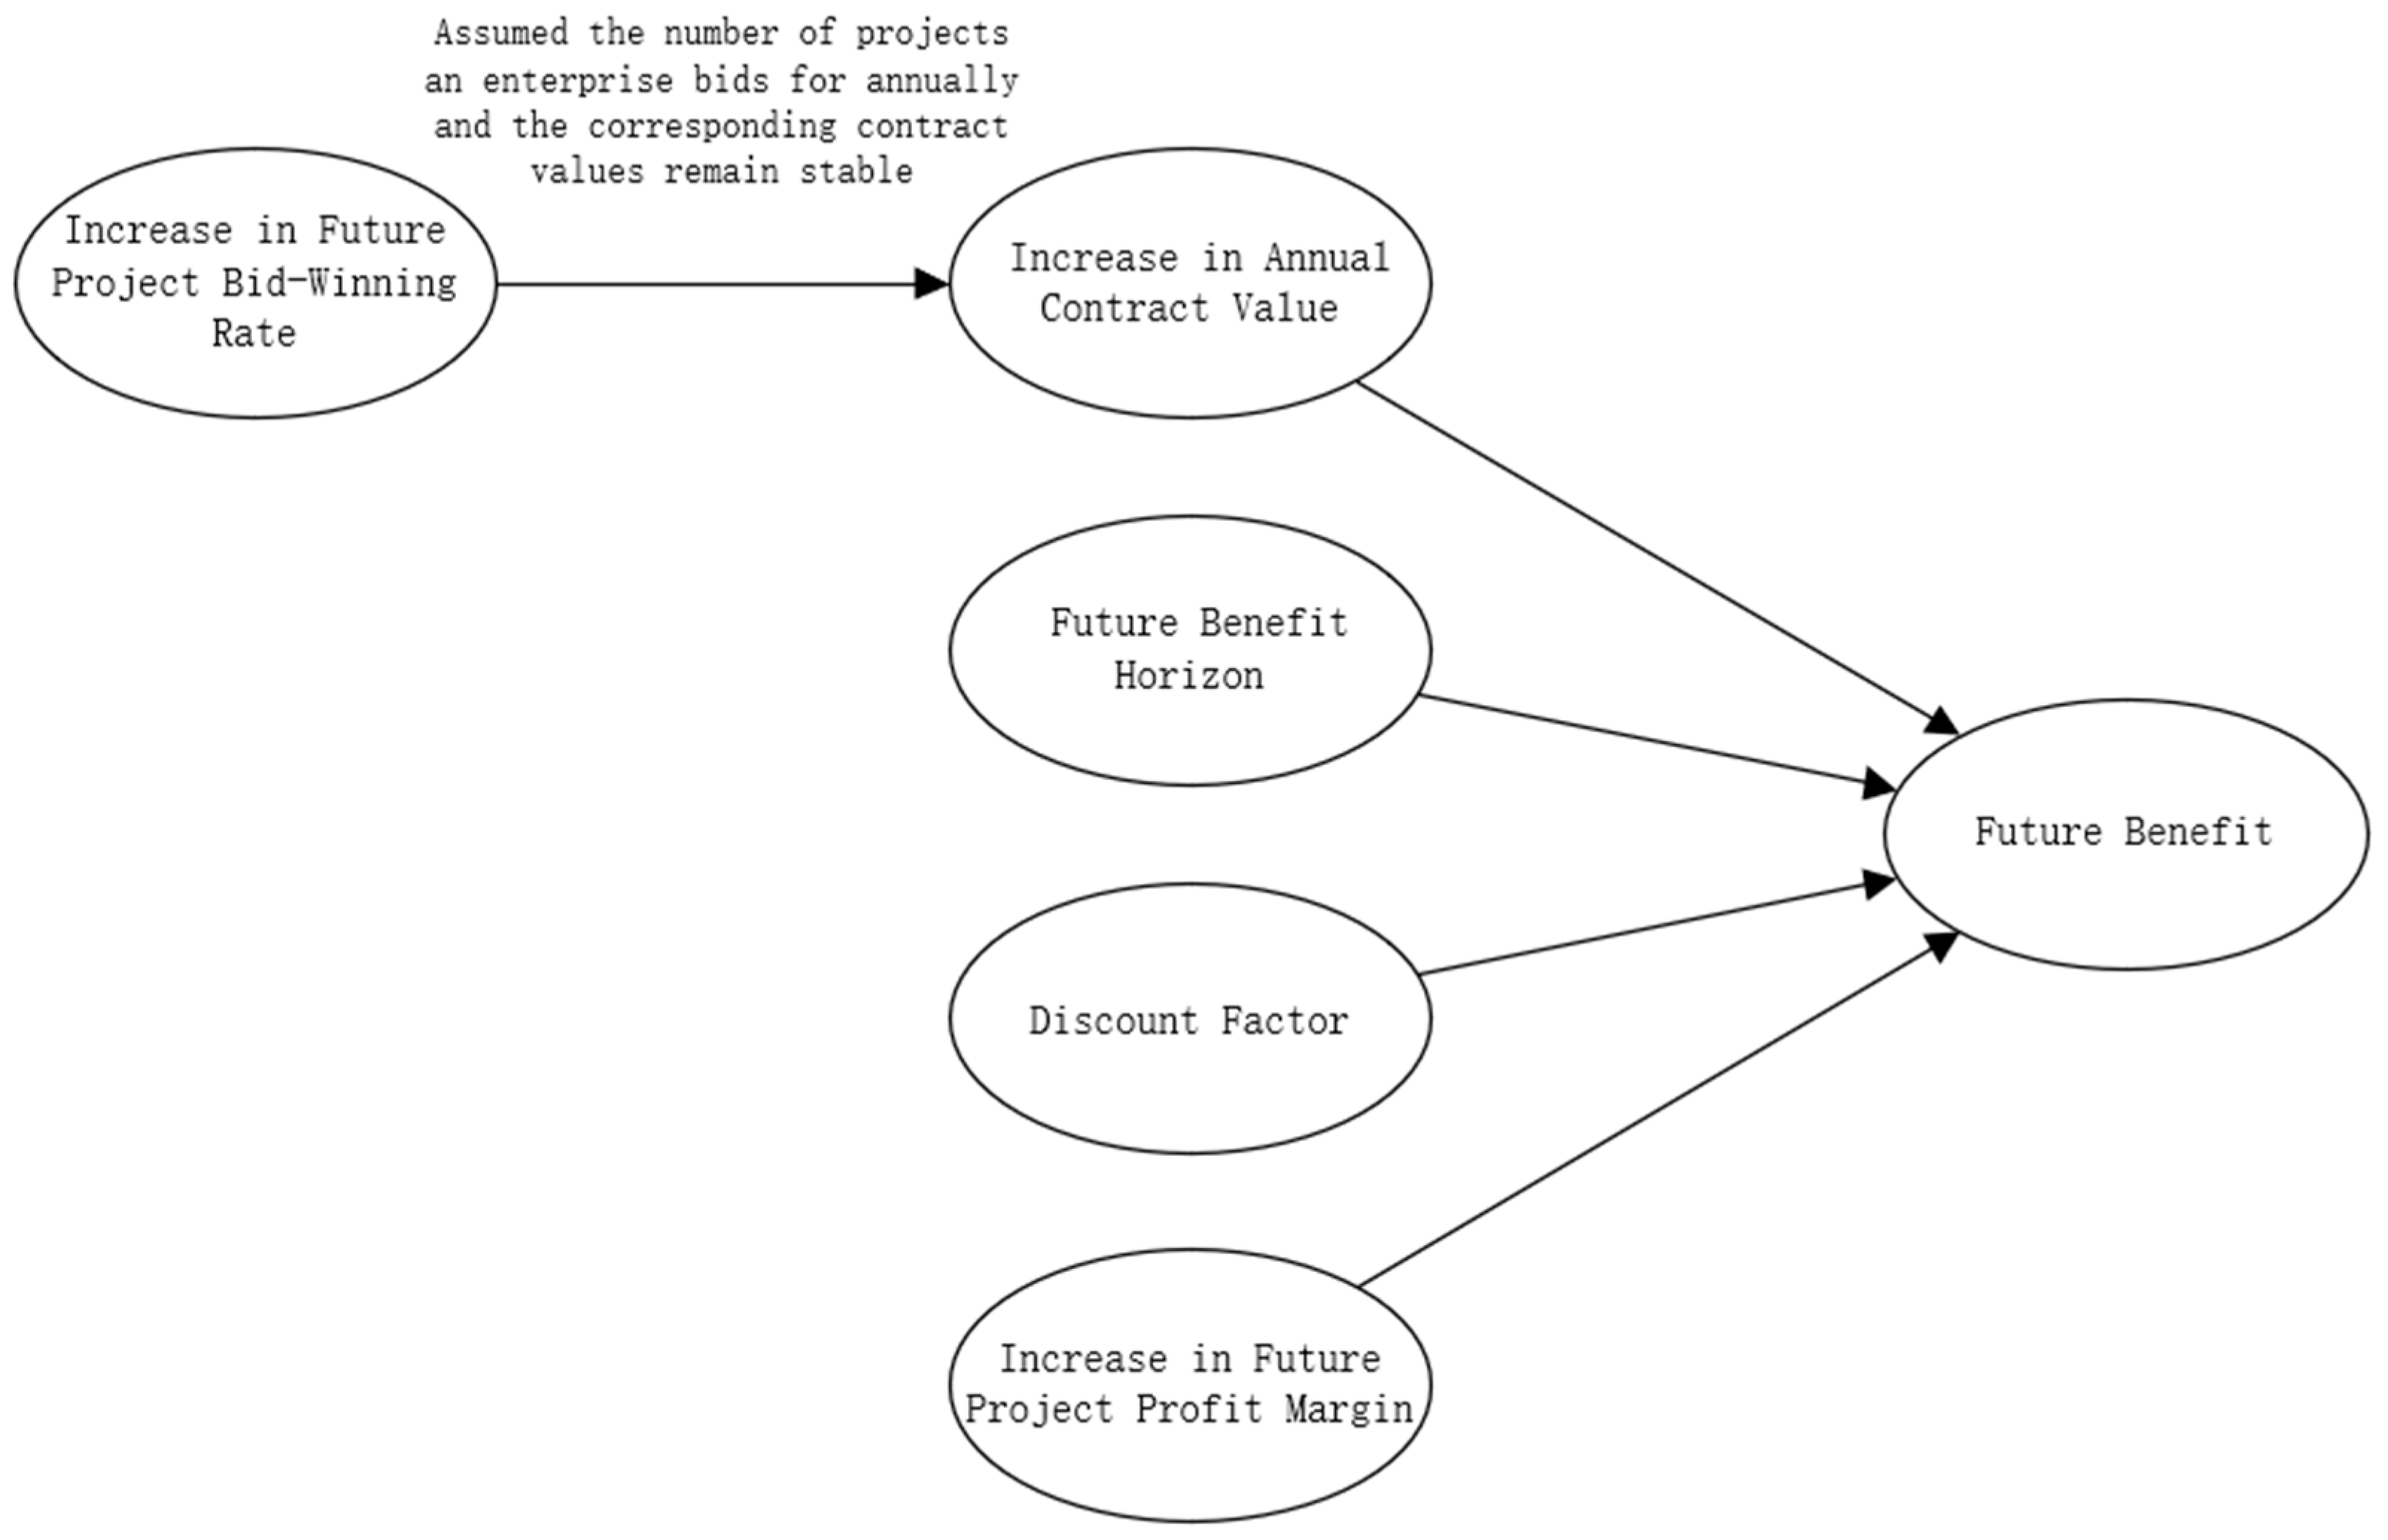
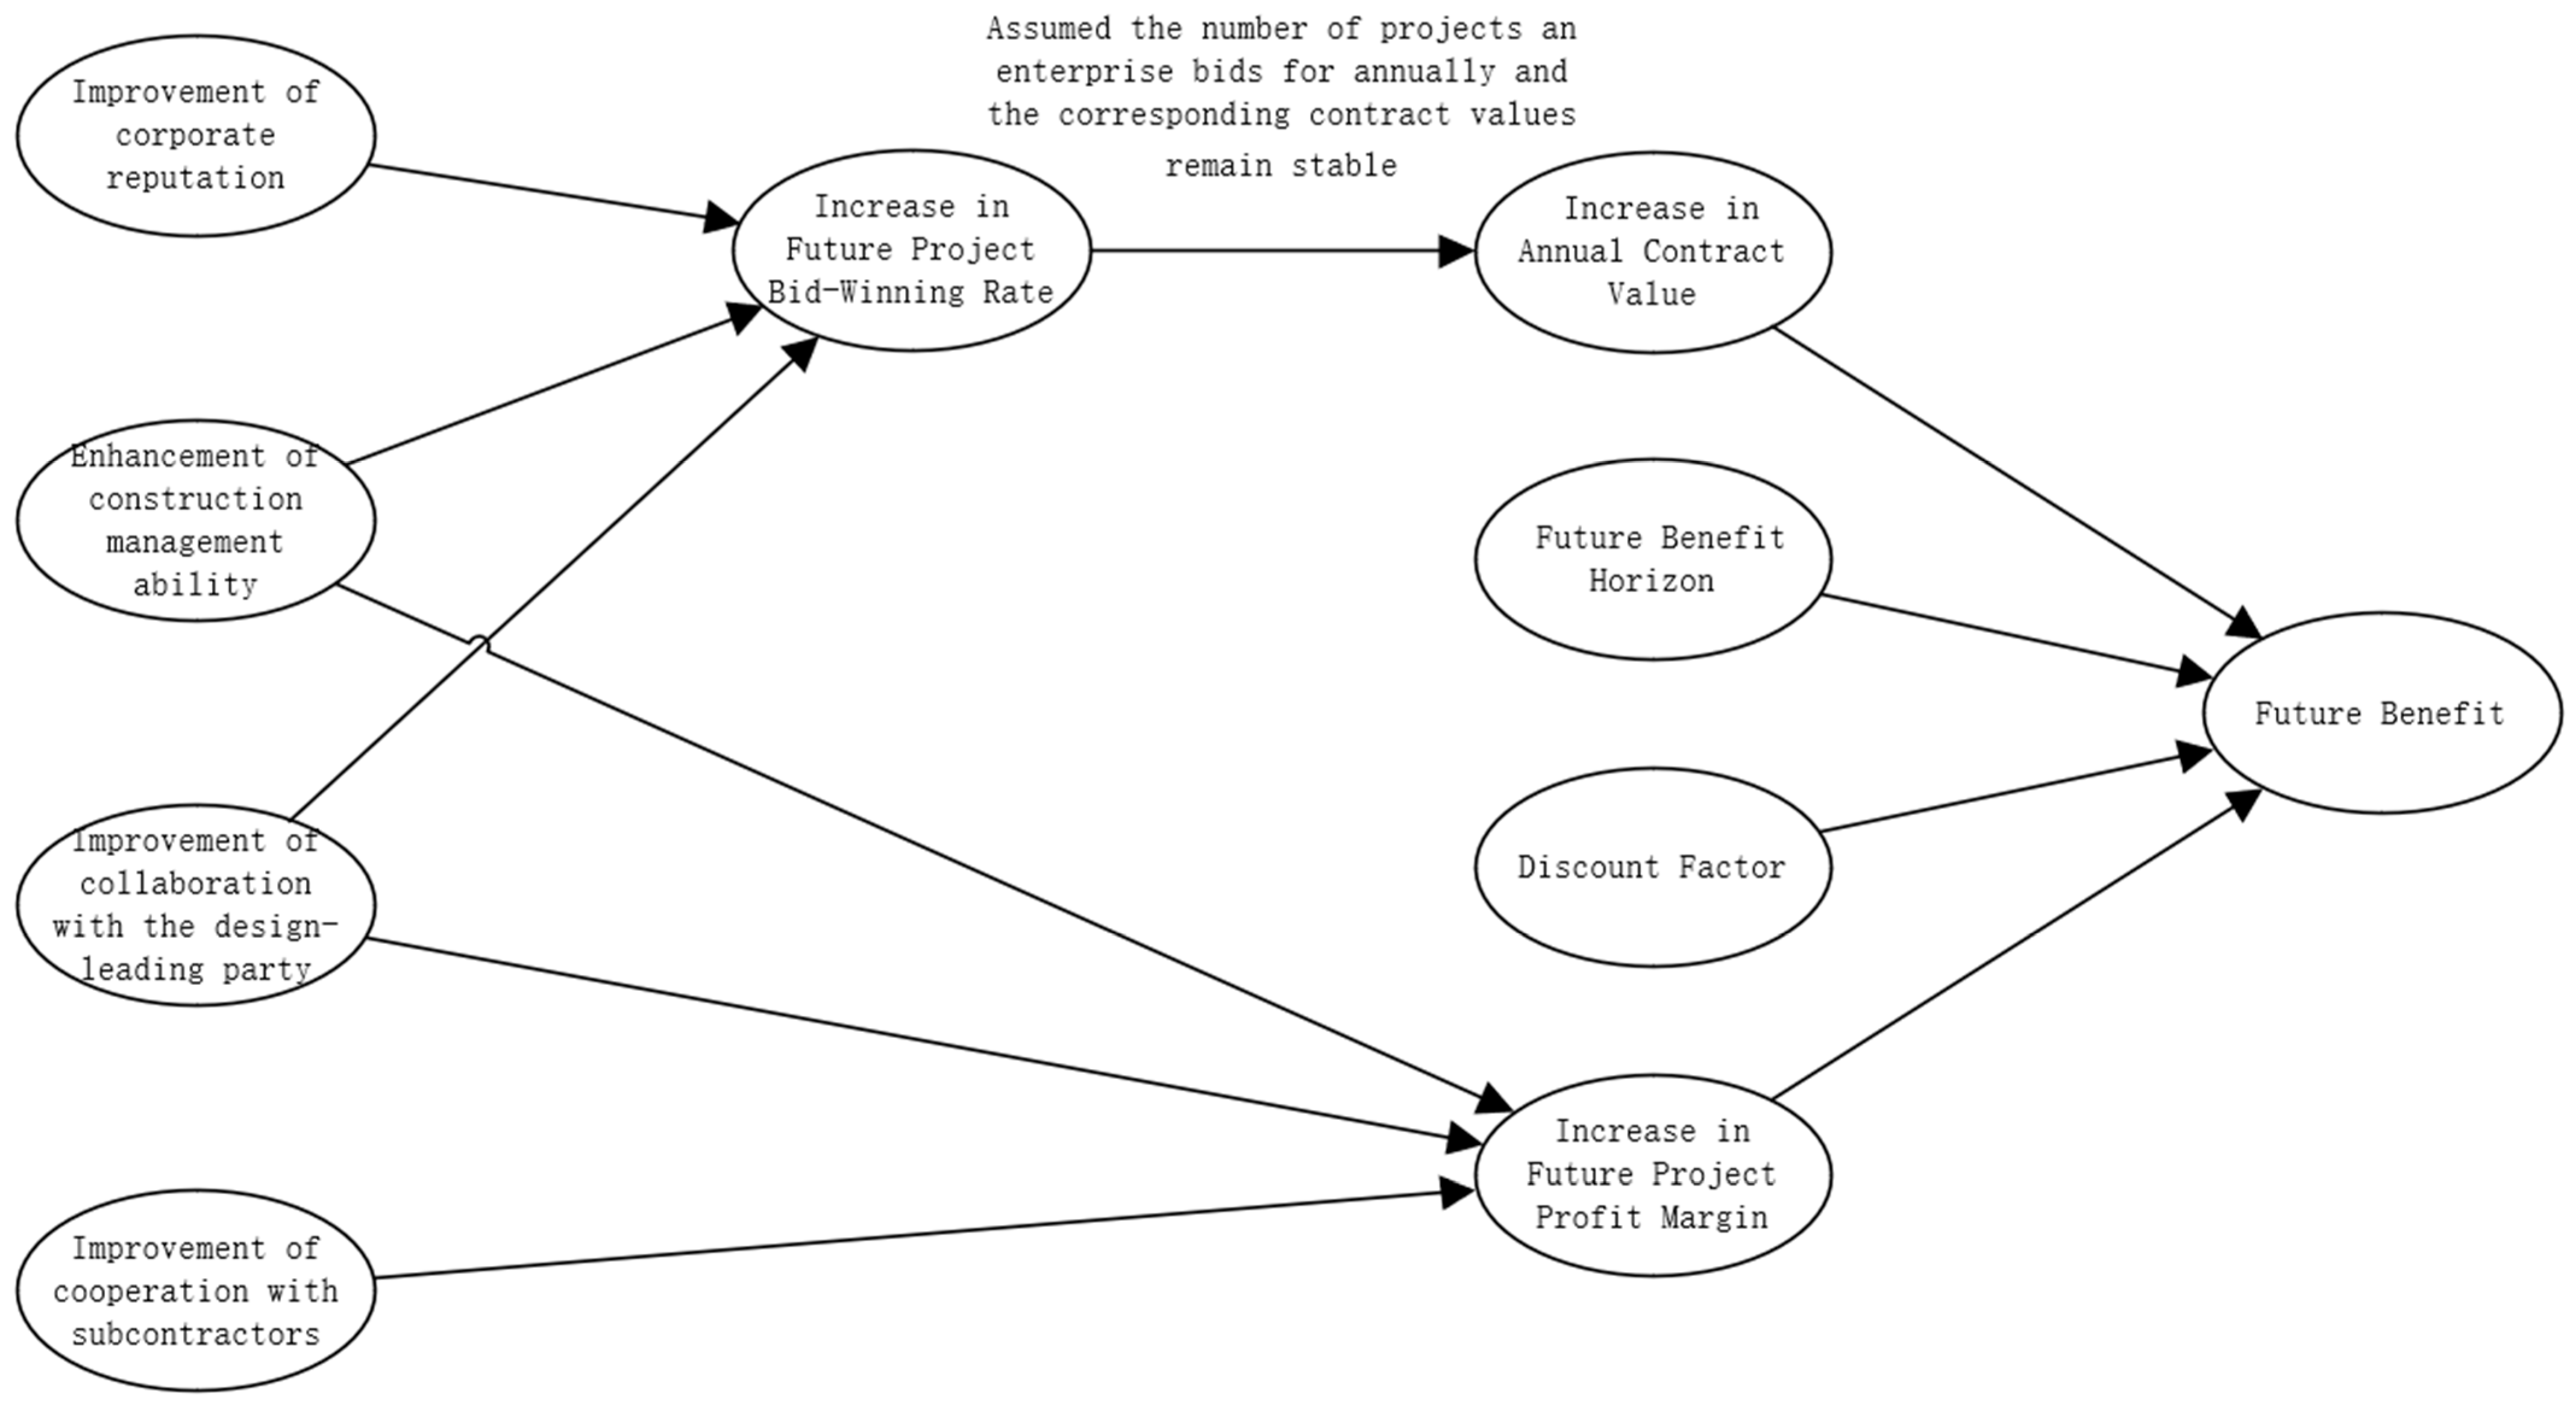
3.3. Quantification of Consortium Members’ Future Benefits

The costs and direct economic benefits of consortium members can be quantified in monetary terms, while their future benefits are influenced by multiple factors. Among these, market expansion, client retention, future project bid-winning rate, and profit margin are key indicators of an enterprise’s long-term profitability. While all four dimensions contribute to future benefit, market expansion and client retention are difficult to quantify or estimate accurately due to their qualitative nature. Therefore, in this study, they are assumed to remain stable over the evaluation period, with their influence coefficients set to 1. As a result, the analysis focuses on the two quantifiable indicators—future project bid-winning rate and profit margin—as proxies for estimating the future benefits of consortium members in a computationally feasible and analytically tractable manner.
Assume that the initial profit margin and bid-winning rate of the enterprise are denoted by p and w , respectively, and that the enterprise’s annual contract value is Q . After implementing value-enhancing activities, both the profit margin and bid-winning rate may improve. Let the profit margin increase to β p β 1 , and the bid-winning rate rise to γ w γ 1 . Since it is difficult to directly measure the initial bid-winning rate, this study assumes that both the number of projects and enterprise bids annually and the corresponding contract values remain stable. Thus, the contribution to the bid-winning rate can be equivalently reflected by an increase in the annual contract value, which becomes γ Q γ 1 . Under this assumption, the annual increase in future profits for a consortium member, denoted as P , can be estimated using Equation (5):
P = β p γ Q p Q = p Q β γ 1
Assume that a consortium member’s enterprise initially has a profit margin p of 8%, a bid-winning rate w of 20%, and an annual contract value Q of 50 million. Through value-enhancing measures such as digital transformation or design innovation, the enterprise improves its profit margin by 25% and its bid-winning rate by 20%. In this case, the profit margin multiplier β = 1.25, and the bid-winning multiplier γ = 1.20. Substituting into Equation (5) yields Equation (6):
P = p Q β γ 1 = 0.08 × 50,000,000 × ( 1.25 × 1.20 1 ) = 2   million
This means that the annual future profit increase for this member, attributable to their actions, is estimated at 2 million.
Considering the time value of money, let n represent the future benefit horizon (in years), and σ denote the discount rate. The computational logic underlying the estimation of future benefits is illustrated in Figure 2.
The future benefit B 2 can be calculated using Equation (7):
B 2 = t = 1 n p Q β γ 1 1 + σ t = p Q β γ 1 1 + σ n 1 σ 1 + σ n
(1)
Quantification of the Design-leading Party’s Future Benefits
Based on the preceding discussion, improvements in the future project bid-winning rate and profit margin of the design-leading party are influenced by a combination of key factors, including improved corporate reputation, enhanced technical abilities, and strengthened long-term cooperative relationships. Specifically, an improved corporate reputation contributes to increased competitiveness in bidding and greater client trust. The enhancement of the enterprise’s specialized design ability allows it to offer more competitive design solutions during both the bidding and execution phases. Enhanced EPC project management ability improves project implementation efficiency and quality, thereby reducing project risks and increasing profitability. Furthermore, after analyzing the stakeholder relationships closely tied to the design-leading party, this study further refines the improvement in long-term cooperation into three aspects: collaboration with the project owner, contractors, and suppliers. A stable partnership with the project owner increases the likelihood of securing future projects; smooth collaboration with contractors enhances execution efficiency; and strong partnerships with suppliers help to reduce procurement costs and improve supply chain management. Together, these factors contribute to the growth of the design-leading party’s future benefits. The mechanism is illustrated in Figure 3.
As shown in Figure 3, the profit margin adjustment coefficient for the design-leading party’s future projects ( β D ) is influenced by enhancements in design ability, EPC project management ability, and cooperation with project owners, contractors, and suppliers. Meanwhile, the adjustment coefficient for the future project bid-winning rate ( γ D ) is affected by improvements in corporate reputation, design abilities, project management abilities, and cooperation with the project owner.
This study posits that all six influencing factors of the design-leading party’s value-creation future benefits are positively correlated with its future project profit margin and bid-winning rate. To facilitate quantitative analysis, it is assumed that within a reasonable range, the growth rates of the design-leading party’s profit margin and bid-winning rate are linearly related to the improvement levels of these influencing factors. This linearity assumption is based on expert experience and empirical observation, which suggest that, under moderate variations, the relationship between influencing factors and performance outcomes is approximately linear and does not exhibit significant nonlinear behavior. Although the true relationship may be more complex in practice, a linear model allows for tractable estimation and interpretation, which aligns with the scope and methodological focus of this study. However, the contribution degree of each factor to future benefits varies. For instance, successful project delivery may only moderately enhance the reputation of large and well-established enterprises, whereas for firms engaging in a first-time collaboration, improvement in cooperative relationships could have a much more significant impact on future earnings. The influence of ability enhancement by the design-leading party also depends on the specific project context.
Given that the adjustment coefficients for the profit margin and bid-winning rate are difficult to derive theoretically, yet are practically significant, this study adopts an empirical approach based on expert judgment. Specifically, a 10% increase in each influencing factor is used as the baseline to estimate the sub-correction coefficients for the design-leading party’s future project profit margin and bid-winning rate—denoted as β D k D and γ D k D , where k D = 1 , 2 , , 6 . These coefficients were obtained through a structured questionnaire survey targeting experienced professionals from design enterprises and academic experts with backgrounds in EPC project management. The survey was conducted using one-on-one questionnaires to ensure response authenticity and clarity. Details of the questionnaire’s design and content are provided in Appendix A.
A total of 51 questionnaires were distributed—29 to design enterprise professionals with project management experience and 22 to academic researchers specializing in engineering and construction management. Of these, 49 were returned and 46 were deemed valid, resulting in a 90.20% effective response rate. The final coefficients were calculated as the average values of all valid responses. Although the questionnaire itself is not included due to space limitations, the survey outcomes have been reviewed and acknowledged as reasonable by domain experts. The results are summarized in Table 2.
Assuming that each influencing factor of the design-leading party’s future benefits increases by δ D k D %, where k D = 1 , 2 , , 6 , the correction coefficients for the profit margin ( β D ) and bid-winning rate ( γ D ) can be calculated using Equations (8) and (9), respectively.
β D = 1 + 1 10 k D = 2 6 δ D k D β D k D 1
γ D   = 1 + 1 10 k D = 1 4 δ D k D γ D k D 1
(2)
Quantification of the Contractor’ Future Benefits
Improvement in the contractor’s future project bid-winning rate and profit margin is jointly influenced by factors such as improvements in corporate reputation, enhancements in construction management ability, and the establishment of long-term cooperative relationships. Among these, improvements in corporate reputation can increase the contractor’s competitiveness in the market and boost the owner’s recognition of its construction and performance abilities, thereby improving its bid-winning rate. An enhanced construction management ability helps to improve construction efficiency, reduce costs, and optimize project execution quality, thus improving the profitability of future projects. Furthermore, this study categorizes the contractor’s long-term cooperative relationships into those with the design-leading party and those with subcontractors. Improved cooperation with the design-leading party facilitates future participation in joint EPC projects, while long-term collaboration with subcontractors helps to ensure a stable supply of construction resources, reduce costs, and enhance construction quality. The influencing factors and mechanisms behind the contractor’s future benefits are illustrated in Figure 4.
As shown in Figure 4, the correction coefficient for the contractor’s future project profit margin ( β C ) is influenced by factors such as enhancements in construction management ability and improvements in cooperation with the design-leading party and subcontractors. Meanwhile, the correction coefficient for the contractor’s bid-winning rate ( γ C ) is affected by improvements in corporate reputation, construction management abilities, and cooperation with the design-leading party.
Similarly, the four influencing factors on the contractor’s future benefits are all positively correlated with the contractor’s future project profit margin and bid-winning rate. It is assumed that within a certain range, the growth rates of these two metrics exhibit a linear relationship with the degree of improvement in the respective influencing factors. Likewise, this study employs a questionnaire survey to obtain the adjustment coefficients for the contractor’s future project profit margin and bid-winning rate when each influencing factor improves by 10%, denoted as β C k C and γ C k C , respectively, where k C = 1 , 2 , 3 , 4 .
The respondents of the questionnaire included construction enterprise practitioners and relevant scholars. A total of 70 questionnaires were distributed, 69 were returned, and 63 were valid, yielding a response rate of 90.00%. Details of the questionnaire design and content are provided in Appendix B. The survey results are shown in Table 3.
Assuming that the value creation activities of the consortium members lead to a δ C k C % improvement in the contractor’s influencing factors k C = 1 , 2 , 3 , 4 , the correction coefficients for the contractor’s future project profit margin β C and bid-winning rate γ C can be calculated using Equations (10) and (11), respectively.
β C = 1 + 1 10 k C = 2 4 δ C k C β C k C 1
γ C = 1 + 1 10 k C = 1 3 δ C k C γ C k C 1

4. Benefit Distribution of EPC Consortium Based on Modified Shapley Value

With a clear understanding of the net benefits attributable to each consortium member, this section turns to the question of how these benefits should be distributed. The Shapley value is a commonly adopted method in benefit allocation for construction consortia. It accounts for each member’s marginal contribution across all possible coalition permutations and effectively avoids the pitfalls of equal distribution. However, the classical model is based on the equal weight assumption, treating each member’s input as uniformly distributed (i.e., 1/n), which oversimplifies the diversity of cost contributions and initial benefit entitlements. This simplification may lead to distribution outcomes that do not accurately reflect the actual contributions during project execution and may fail to gain acceptance from members with higher initial stakes or entitlements. To address these shortcomings, this study proposes a modified Shapley value model that explicitly incorporates disparities in both cost inputs and initial benefit entitlements, aiming to construct a distribution scheme that is more equitable and acceptable to all consortium members.
To optimize the traditional Shapley value method in benefit distribution for EPC consortia, this study introduces two correction factors: the cost compensation factor ( λ i ) and the initial benefit entitlement factor ( τ ) . The cost compensation factor λ i addresses disparities in project-related expenditures among consortium members, correcting potential imbalances that may arise when resource inputs vary significantly. The initial benefit entitlement factor τ , in contrast, incorporates the baseline entitlement of each member as determined by contractual arrangements or pre-existing resource commitments. This two-stage adjustment process is illustrated in Figure 5. The left side of the figure represents the traditional Shapley value as the starting point. In the first adjustment stage, the model accounts for the cost differences among consortium members, generating intermediate allocation values. In the second stage, these values are further adjusted based on each member’s initial benefit entitlement, yielding a final, corrected distribution scheme.
This modification improves the realism and fairness of benefit allocation by balancing objective contributions (e.g., costs) and subjective rights (e.g., entitlement expectations), thus enhancing the applicability of the Shapley framework in real-world design-led EPC consortia.

4.1. Basic Assumptions of Benefit Distribution

Assumption 1.
All consortium members are rational economic agents, meaning that throughout the project implementation and benefit distribution process, members make decisions based on rational judgment, unaffected by short-term emotions or external non-economic factors. Their core objective is to maximize their own returns.
Assumption 2.
The external environment of the EPC project consortium remains stable during the implementation phase. This implies that key external factors such as policies, market conditions, and technical standards do not undergo significant changes, ensuring the validity of the analysis. Meanwhile, the internal resource allocation and organizational structure of the consortium remain relatively stable without structural adjustments.
Assumption 3.
Consortium members have complete information symmetry during project execution, i.e., all members fully understand the key data related to value creation, such as costs, benefits, and contributions, thereby enabling the formulation of profit distribution schemes under a complete information game framework.
Assumption 4.
All costs and benefits of consortium members are measurable and can be monetized, ensuring the operability of profit distribution.
Assumption 5.
The net benefit generated through cooperation among consortium members is strictly greater than the sum of net benefits obtained by each member operating independently, satisfying the super-additivity condition in the Shapley value principle. Under this condition, all consortium members are incentivized to participate, as the benefit each receives from the collective arrangement exceeds what they would gain by acting alone. If the super-additivity condition is not satisfied—that is, if some members can achieve equal or greater benefits independently—then the incentive to form or sustain a consortium weakens. In such cases, the resulting allocation may no longer be stable or accepted by all parties, undermining the applicability of the model. Therefore, this assumption is crucial for ensuring both the feasibility of coalition formation and the validity of benefit distribution based on marginal contributions.

4.2. Determination of Classical Shapley Value for Consortium Members

This study employs the Shapley value method from classical cooperative game theory to conduct an initial distribution of net benefits among consortium members by quantifying their marginal contributions to establish a baseline allocation scheme. However, in real-world EPC projects, variations in resource input and initial benefit entitlement among consortium members significantly influence profit distribution outcomes. To further optimize the allocation mechanism, this study introduces a cost and benefit entitlement correction mechanism. Building upon the classical Shapley values, the profit distribution scheme is adjusted based on the actual cost contributions and initial benefit entitlements of each member, thereby enhancing the fairness and rationality of the distribution. This improvement is aimed at reinforcing the willingness of consortium members to create value and promote the efficient implementation of design-led EPC projects.
Let N , v denote a three-party cooperative game, where N = 1 , 2 , 3 represents the set composed of Design Firm X, Construction Firm Y, and Construction Firm Z. The subsets of this set are denoted as S , and the characteristic function v S represents the net benefit that coalition  S can obtain by participating in the EPC project. When none of the enterprises participate in the EPC project, the net benefit of the coalition is zero.
In the EPC project consortium, the benefit allocated to member i is denoted by φ i   , where i = 1 , 2 , 3 , representing Design Firm X, Construction Firm Y, and Construction Firm Z, respectively. According to the Shapley value method, the benefit distribution expression is shown in Equation (12):
φ i v = S 1 ! n S ! n ! v S v S i  
  • When the subset S is an empty set, none of the enterprises participate in the implementation of the EPC project. In this case, the net benefit of the consortium is obviously zero, denoted as v = 0 ;
  • When the subset S contains only one element, each of the three firms participates in the EPC project independently. The corresponding net benefits are denoted as v 1 , v 2 , and v 3 ;
  • When S = 1 , 2 , it indicates that Design Firm X and Construction Firm Y jointly participate in the EPC project. The net benefit of the consortium at this time is denoted as v 1 , 2 ;
  • When S = 1 , 3 , it indicates that Design Firm X and Construction Firm Z jointly participate in the EPC project. The net benefit of the consortium at this time is denoted as v 1 , 3 ;
  • When S = 2 , 3 , it indicates that Construction Firms Y and Z jointly participate in the EPC project. The net benefit of the consortium at this time is denoted as v 2 , 3 ;
  • When S = 1 , 2 , 3 , it indicates that Design Firm X, Construction Firm Y, and Construction Firm Z jointly participate in the EPC project. The net benefit of the consortium at this time is denoted as v 1 , 2 , 3 .
Taking Design Firm X as an example, its marginal contributions in different subsets and the corresponding probabilities are shown in Table 4.
In the Shapley value method, each member’s contribution is assessed based on all possible coalition formation sequences. In Table 3, each row represents a different coalition S that includes or excludes a given member i , specifically as follows:
  • S denotes the number of members in coalition S , reflecting its size;
  • v S represents the total benefit generated by the full coalition S ;
  • v S i is the total benefit of the same coalition without member i ;
  • The difference v S v S i captures the marginal contribution of member i —that is, the added value generated by its inclusion;
  • The term S 1 ! n S ! n ! indicates the probability of coalition S forming in a random sequence.
By summing the marginal contributions of member i across all possible coalition scenarios—weighted by their formation probability—the Shapley value ensures a fair and comprehensive representation of each member’s role. Table 3 thus serves as a step-by-step illustration of how each scenario contributes quantitatively to the final allocation value for a member.
By substituting the values from Table 4 into Equation (12), the classical Shapley values for Design Firm X, Construction Firm Y, and Construction Firm Z can be derived, as shown in Equations (13)–(15), respectively.
φ 1 v = v 1 + v 1 , 2 , 3 v 2 , 3 3 + v 1 , 2 v 2 + v 1 , 3 v 3 6
φ 2 v = v 2 + v 1 , 2 , 3 v 1 , 3 3 + v 1 , 2 v 1 + v 2 , 3 v 3 6
φ 3 v = v 3 + v 1 , 2 , 3 v 1 , 2 3 + v 1 , 3 v 1 + v 2 , 3 v 2 6

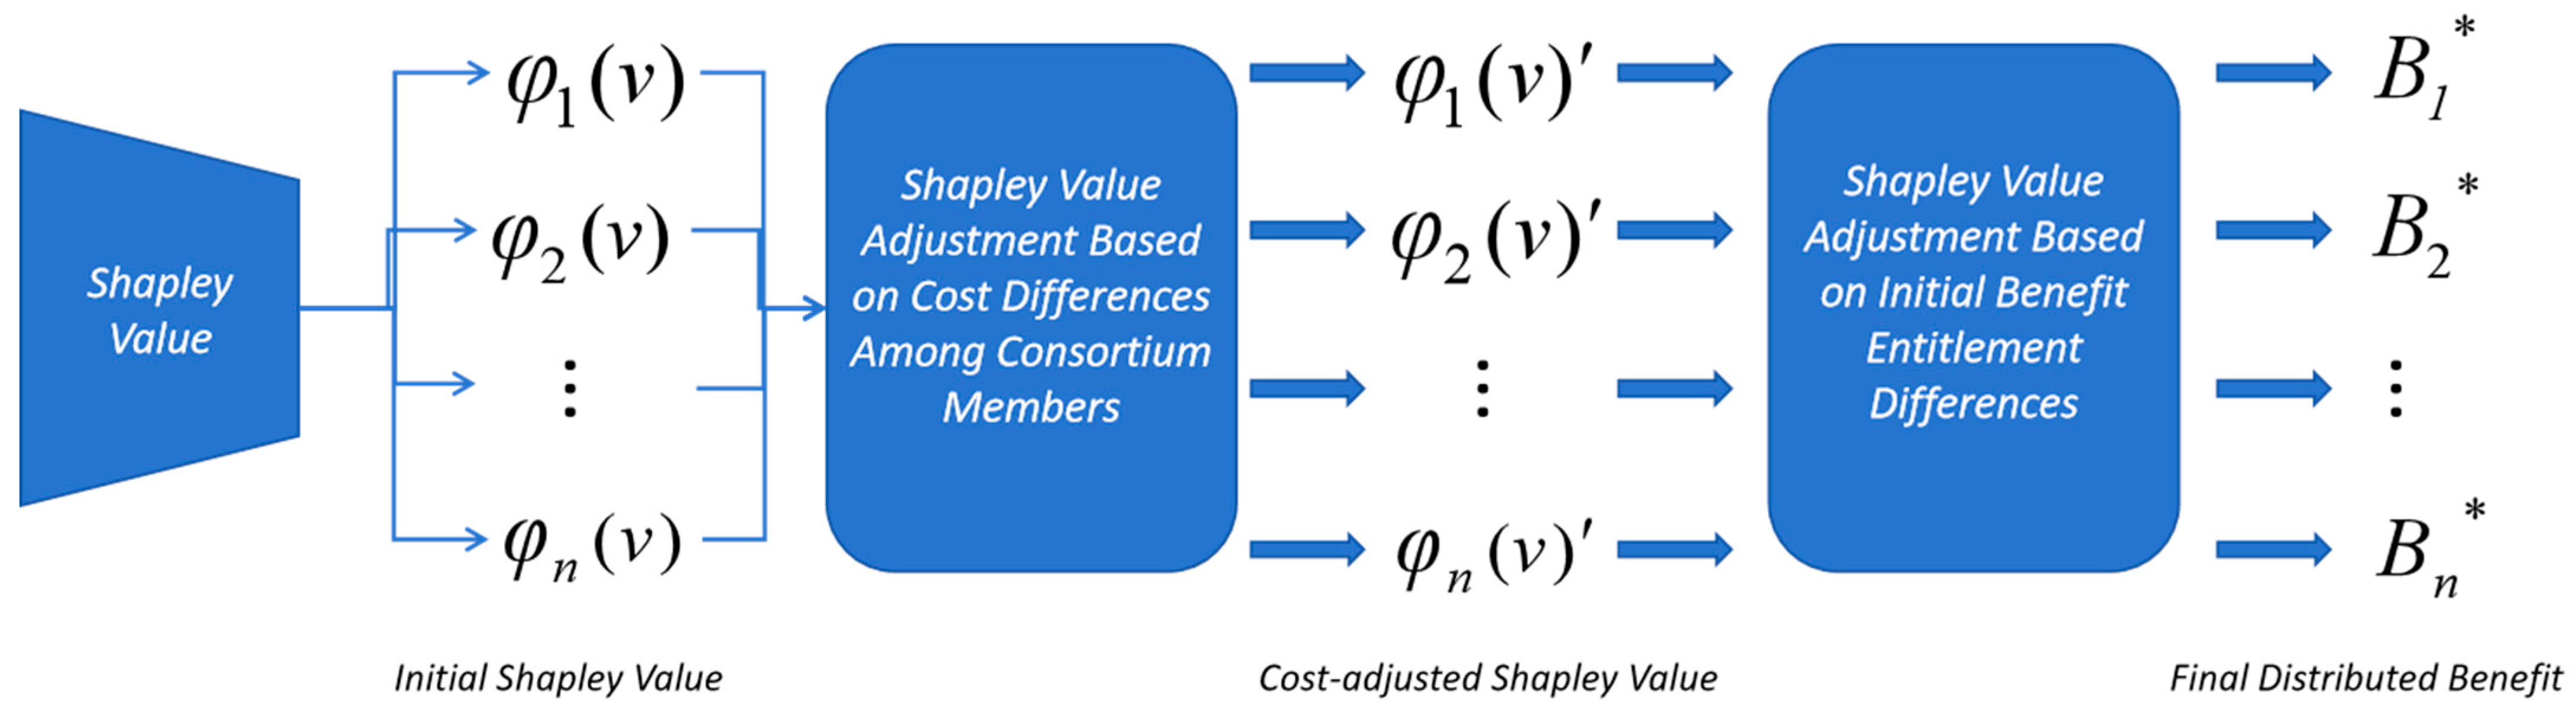
4.3. Construction of the Modified Shapley Value Model

(1)
Shapley Value Adjustment Based on Cost Differences Among Consortium Members
According to the analysis in Section 3.1, the costs incurred by consortium members are composed of three dimensions: labor costs, material costs, and capital costs. Let C i denote the total project cost of each consortium member—namely, Design Firm X, Construction Firm Y, and Construction Firm Z. The cost compensation factor  λ i for each member is then defined as shown in Equation (16):
λ i = C i i = 1 n C i
Considering the cost compensation factor, the cost-adjusted Shapley value for each member, denoted as φ i v , is calculated using Equation (17):
φ i v = φ i v + λ i 1 n   v N
When λ i > 1 n , it indicates that the member’s cost input is above the average level, and that the adjusted Shapley value φ i v increases accordingly to compensate for the additional cost. Conversely, when   λ i < 1 n , the member’s cost input is below average, and their adjusted Shapley value   φ i v decreases, shifting more of the benefit distribution toward members with higher cost contributions.
(2)
Shapley Value Adjustment Based on Initial Benefit Entitlement Differences
Unlike differences in cost inputs among consortium members, disparities in initial benefit entitlements are fundamentally different in nature. These entitlements are inherently embedded within the consortium’s contractual structure. Certain portions of project income are contractually or legally pre-assigned to specific members at the outset, thereby enhancing their bargaining power in profit distribution. For example, construction firms often undertake large-scale, high-value construction tasks, which naturally grant them a stronger position in the initial entitlement of project benefits within the consortium. This advantage not only reflects in directly allocated economic returns specified in contracts, but also shapes the broader redistribution pattern of project gains. By controlling a greater portion of distributable revenue, construction firms possess stronger negotiating leverage and can secure more favorable profit shares.
From a distribution logic perspective, cost contributions made by consortium members during value creation can be seen as “negative earnings” and should be reasonably compensated. Thus, this study adjusts the traditional Shapley value using an additive method to reward high-cost contributors, thereby enhancing fairness and rationality in profit allocation. However, initial benefit entitlement differences are not merely compensatory; they play a decisive role in shaping distribution ratios. Enterprises with initial entitlement advantages typically secure higher allocation weights due to their ownership of revenue at the project’s outset. To capture this dynamic, this study introduces a benefit entitlement influence factor τ and modifies the Shapley value using a multiplicative approach. This ensures that the distribution proportion of the dominant party aligns more closely with the actual conditions.
Although the consortium in question consists of three companies, in practice, Construction Firm Y and Construction Firm Z each signed contracts with Design Firm X to jointly implement the project. To more accurately depict the internal benefit distribution mechanism within the consortium, this study denotes B i as the initial total benefit of Design Firm X, Construction Firm Y, and Construction Firm Z, respectively. Similarly, B i ° represents the initial net benefit of each member. The calculation formula is shown in Equation (18). Specifically, the initial net benefit of Design Firm X, B 1 ° , can be further divided into B 1 Y ° and B 1 Z ° , which correspond to its initial net benefits in the segments managed by Construction Firm Y and Construction Firm Z, respectively.
B i ° = B i C i
To reflect the negotiation advantage and distributional influence of consortium members with stronger initial benefit entitlements, this study introduces the benefit entitlement influence factor, denoted as τ , which adjusts the Shapley value to reflect asymmetrical bargaining power. The factor τ is bounded within a reasonable range, assumed as τ 1,1.5 , where a value of 1 indicates no entitlement advantage, and higher values reflect increasing influence over benefit distribution outcomes. The value of τ is determined by a combination of three factors [39]:
  • Initial Benefit Proportion ( I B P i ): The proportion of initial net benefits controlled by member i ;
  • Willingness to Cooperate ( W i ): The degree to which other consortium members are willing to accept the dominant party’s proposed distribution;
  • Bargaining Power ( B P i ): Reflects the strategic or contractual authority a member holds in internal negotiations.
The specific value of the benefit entitlement influence factor τ is generally determined through internal negotiations among consortium members and is valid upon mutual agreement. Hence, this study does not prescribe a specific value. Given the large contract values typically undertaken by construction firms, this study takes Construction Companies Y and Z as examples of parties holding advantage in the initial benefit entitlement, i.e., B 2 ° > B 1 Y ° and B 3 ° > B 1 Z ° , and possessing stronger bargaining or negotiation capabilities.
Assuming that the initial benefit entitlement influence factors for Construction Firms Y and Z are τ Y and τ Z respectively, their final distributed benefits B 2 < B 1 Y ° + B 2 ° and B 3 < B 1 Z ° + B 3 ° can be calculated using Equations (19) and (20):
B 2 * = τ Y φ 2 v
B 3 * = τ Z φ 3 v
Accordingly, the final distributed benefit for Design Firm X, B 1 , is calculated using Equation (21):
B 1 * = B 1 ° + B 2 ° + B 3 ° B 2 B 3

5. Case Study

5.1. Case Analysis

The EPC project for the reconstruction of a national highway is located in Hangzhou, Zhejiang Province. The total contract value of the design-led EPC consortium is CNY 1.1 billion, including a detailed design and survey fee of CNY 10.02 million. This fee mainly covers specialized tasks such as subgrades, pavements, bridges and culverts, interchanges, traffic safety and electromechanical systems, greening, and environmental protection. The total route length of the project is approximately 3.69 km, encompassing the Keji Avenue Interchange, mainline viaduct, separated subgrade-type roads, and surface roads, as well as necessary river and road realignment works. The planned construction period is 32 months, including 2 months for design and 30 months for construction. This case project adopts a “1 + 2” model within the design-led EPC consortium. Design Firm X acts as the consortium leader, responsible for the survey and design work, material procurement, organization and coordination during contract execution, and leading all matters related to this contract section. Construction Firms Y and Z are responsible for the construction and management of their designated sections within the consortium.
Survey results indicate that in this case project, members of the EPC consortium primarily focus on the direct economic benefits generated by design optimization and the corresponding distribution plan, while relatively less attention is paid to future project revenues. Additionally, during the EPC bidding process, the project owner typically places greater emphasis on performance or experience in similar regional projects within the past two years. Accordingly, this study sets the evaluation period for consortium members’ future returns at n = 2 years, with a discount factor of σ = 20%. Using design optimization as an example, the study explores its impact on the future returns of consortium members and the corresponding profit distribution mechanism within the consortium. Further investigations and interviews reveal that Design Firm X has an annual contract value of approximately CNY 100 million in Zhejiang Province, with an initial profit margin of around 15%. Construction Firm Y has an annual contract value of approximately CNY 1.5 billion, with an initial profit margin of about 3%. Construction Firm Z has an annual contract value of around CNY 1 billion, also with a 3% initial profit margin.
Taking the joint implementation of design optimization and coordination by Design Firm X, Construction Firm Y, and Construction Firm Z in an EPC project as an example, the design lead and construction parties are required to collaborate closely. The goal is to dynamically optimize the design plan, enhance construction efficiency, reduce construction costs, and ensure that the project quality meets the expected standards. In this process, the design lead primarily provides technical support for design optimization, while the construction parties are responsible for site feedback and the implementation of the optimized design. Specifically, the design lead must deploy a professional design team to conduct detailed construction drawing optimization, refine structural nodes, and propose material substitution schemes based on on-site conditions. The optimized plans must undergo simulation and feasibility evaluation, followed by timely communication with the construction teams to ensure that the solutions are effectively applied on site. The construction parties, in turn, must monitor real-time site conditions during implementation and provide accurate, detailed feedback to the design lead. This enables responsive adjustments to the design to address specific construction challenges. Moreover, the construction side must assign a skilled project management team to coordinate the progress of various trades, ensuring the smooth execution of the optimized design scheme.

5.2. Quantification of Net Benefits in the Case Project

(1)
Estimating Future Benefits for Consortium Members
In this scenario, the future benefits of the design lead in the case project primarily stem from improved collaboration with construction firms, an enhanced EPC project management ability, and strengthened professional design ability. This study employed a questionnaire survey to determine the correction coefficients for the design lead’s future project profit margin ( β D ) and bid-winning rate ( γ D ). The survey targeted 13 managerial personnel from the design lead of the case project, with 12 valid responses received, yielding a response rate of 92.31%. According to the results, the respondents estimated a 6.60% improvement in professional design ability, a 7.52% increase in EPC project management ability, and a 6.65% improvement in cooperation with the construction parties. By substituting these values into Equations (7) and (8), the revised profit margin correction coefficient β D is calculated as 1.15, and the bid-winning rate correction coefficient γ D as 1.08. Thus, the future benefit of Design Firm X under this scenario is approximately CNY 4.10 million.
For the construction firms, future benefits are mainly derived from improved long-term cooperation with the design lead and enhanced construction management abilities. A questionnaire survey was also conducted to determine the corresponding correction coefficients: β C for profit margin and γ C for bid-winning rate. The survey targeted 35 managerial personnel from the construction side, with 32 valid responses collected, resulting in a 91.43% response rate. According to the results, the construction firms reported a 7.97% improvement in construction management abilities and an 8.27% improvement in their relationship with the design lead. By substituting these values into Equations (10) and (11), the corrected profit margin coefficient β C is calculated as 1.12, and the bid-winning rate coefficient γ C as 1.04. Therefore, the estimated future benefits for Construction Firms Y and Z are approximately CNY 11.25 million and CNY 7.50 million, respectively.
(2)
Estimating Net Benefits for Consortium Members
The study obtained the cost data of each consortium member through field research and interviews, as summarized in Table 5.
According to the data, the total cost for Design Firm X in this scenario is CNY 10 million, while the total costs for Construction Firm Y and Construction Firm Z are CNY 16.8 million and CNY 14.3 million, respectively. The aggregate cost of the design-led consortium is therefore CNY 41.1 million. These total cost values are subsequently used to derive the cost compensation factor (λi) for each member, which adjusts the classical Shapley value to reflect the differences in financial input.
Meanwhile, the direct economic benefit for consortium members is CNY 70 million, among which Design Firm X earns CNY 12 million, and Construction Firms Y and Z earn CNY 31 million and CNY 27 million, respectively. These benefits—combined with each member’s future benefit projections—contribute to the total consortium benefit of CNY 92.85 million, from which the net benefit (total benefit minus cost) is calculated as CNY 51.75 million, as shown in Table 6. This net benefit serves as the distribution pool in the modified benefit allocation model. By quantifying both cost and income components at this level of detail, the model ensures that each member’s cost burden and value contribution are explicitly factored into the benefit distribution mechanism.

5.3. Analysis of Benefit Distribution in the Case Project

(1)
Construction of the Modified Shapley Value Model in the Case Project
To support the computation of Shapley values, this study constructs the characteristic function v s for all non-empty subsets S of consortium members. These values represent the estimated net benefit that each subset of members could jointly generate through cooperation, assuming no participation from non-members. The benefit estimates are based on the following:
  • Historical data from similar EPC projects with comparable size, scope, and structure;
  • Expert assessments from project managers involved in the case study;
  • The actual cost–revenue structure and task allocation observed in the Hangzhou national highway reconstruction project.
For singleton coalitions (e.g., {1}, {2}, {3}), v s reflects the hypothetical outcome if a member operated independently under the standard market conditions. For multi-member subsets, the values incorporate potential synergies or redundancies, including overlapping responsibilities or savings from resource integration; the results are shown in Table 7.
Each v s is then used in the Shapley value formula to compute the marginal contribution of each member across all possible coalition orders, thus forming the basis of the benefit distribution. By substituting the data from Table 6 into Formulae (13)–(15), the classical Shapley values for the design enterprise X, construction enterprise Y, and construction enterprise Z are approximately CNY 20.59 million, CNY 17.58 million, and CNY 13.58 million, respectively.
(2)
Construction of the Modified Shapley Value Model in the Case Project
We now apply Equation (16) to derive the cost compensation factor ( λ i ) for each consortium member. By substituting their respective cost input values into the equation, we obtain the following results:
  • Design Firm X: λ 1 ≈ 0.24;
  • Construction Firm Y: λ 2 ≈ 0.41;
  • Construction Firm Z: λ 3 ≈ 0.35.
These values reflect the relative cost burden borne by each member and serve to adjust the original Shapley value to more accurately represent their actual contributions.
Next, using the derived λi values, we substitute them into Equation (17) to compute the cost-adjusted Shapley values. The resulting allocations are as follows:
  • Design Firm X: CNY 15.76 million;
  • Construction Firm Y: CNY 21.55 million;
  • Construction Firm Z: CNY 14.44 million.
These results highlight how incorporating cost differences alters the original distribution, shifting a greater share of benefits to members with higher cost contributions, thereby enhancing the equity of the allocation scheme.
Clearly, the net benefit initial entitlements of Construction Firms Y and Z are significantly higher than that of the Design Firm X, granting them a stronger advantage in benefit distribution. However, since all three enterprises operate under the same parent company system with a well-established internal collaboration mechanism, interest coordination tends to be relatively smooth, reducing the likelihood of distributional disputes.
To reflect this collaborative context while preserving the relative entitlement advantage of firms Y and Z, this study assigns their benefit entitlement influence factor ( τ ) a modest value of 1.05. This value was determined based on consultations with project managers involved in the case project, who indicated that although Y and Z have stronger baseline entitlements, internal negotiations typically favor compromise and stable long-term cooperation. Assigning τ = 1.05 provides a conservative yet meaningful adjustment, consistent with expert opinion and within the recommended range of [1, 1.5].
By substituting this data into Formulae (19) and (20), the final distributed benefits B 2 and B 3 for Construction Firms Y and Z can be obtained, respectively, as shown in Equations (22) and (23).
B 2 * = 1.05 21.55 = 22.63
B 3 * = 1.05 14.44 = 15.16
By substituting into Equation (21), the final distributed benefit B 1 for the Design Firm X can be obtained, as shown in Equation (24):
B 1 * = 51.75 22.63 15.16 = 13.96
Under the optimized model developed in this study, the final allocated benefits for the Design Firm X, Construction Firm Y, and Construction Firm Z are CNY 13.96 million, CNY 22.63 million, and CNY 15.16 million, respectively. Notably, the design firm’s share accounts for approximately 27% of the total benefits. After removing the projected future benefits, its share of direct economic benefits is about 34%, which is very close to its actual entitlement in the case project (35%). This 35% figure was obtained through consultation with project management personnel and verified against an internal consortium agreement.
To validate the effectiveness and realism of the proposed benefit distribution model, we compare the results against three commonly used baseline allocation methods: equal distribution, the classical Shapley value, and contract-based allocation. The comparative outcomes are summarized in Table 8.
In contrast, the equal distribution scheme assigns identical values (CNY 17.25 million) to all members, ignoring disparities in cost and contribution. The classical Shapley value model partially adjusts for marginal contributions, but does not reflect differences in initial entitlement or cost burden. The contract-based method, while grounded in pre-negotiated terms, may not adapt dynamically to performance-based value creation.
Compared to these alternatives, the modified model more effectively integrates cost input, future value potential, and initial benefit entitlement, resulting in a distribution scheme that is both mathematically balanced and practically aligned with the real-world case. The comparison across multiple schemes demonstrates that the proposed model not only aligns with actual contractual outcomes, but also enhances transparency, fairness, and incentive compatibility. Its dual consideration of cost and entitlement factors improves the acceptability of the results among consortium members. As evidenced by the case scenario, this model serves as a practical and adaptable decision support tool for benefit distribution in design-led EPC projects, with potential applicability in a broader range of collaborative project delivery contexts.
While this study is based on a design-led EPC project in China, the underlying principles of the modified Shapley value model are not inherently bound to region-specific policies or contractual frameworks. As long as project participants can quantify cost contributions, estimate future value potential, and identify initial entitlements, the model can be adapted to other types of EPC consortia or sectors such as industrial facilities, transportation infrastructure, or public–private partnerships. Additionally, the model’s structure is compatible with varying contractual norms and governance models, making it suitable for international application. Nonetheless, differences in regulatory environments, organizational cultures, and incentive structures should be considered when applying the model outside the Chinese context.

6. Conclusions

This study proposes a refined approach to benefit distribution in design-led EPC consortia by addressing the key limitations in traditional allocation models. It examines the determinants of consortium members’ net benefits from both cost and benefit perspectives. On the cost side, the study disaggregates expenditures into three distinct categories: labor, materials, and capital. On the revenue side, the analysis extends beyond direct economic benefits to future benefits, including improvements in bid-winning rates and profit margins in future projects. Drawing on principles from engineering economics, a quantitative model is developed to evaluate these future benefits. To overcome the classical Shapley value method’s omission of initial benefit entitlements, the proposed model introduces two new parameters: a cost compensation factor λ i and a benefit entitlement influence factor τ. By integrating both objective inputs and subjective entitlements, the optimized model offers a more balanced, equitable, and realistic approach for internal benefit distribution within EPC consortia.
The proposed model offers meaningful applications for practitioners involved in consortium-based EPC projects. By incorporating cost compensation and initial benefit entitlement factors, the model enables a more balanced integration of objective inputs and subjective expectations, helping stakeholders to reach more equitable outcomes in profit-sharing negotiations. Consortium members can use the future benefit quantification method to assess their long-term gains more accurately, thereby clarifying their acceptable benefit thresholds. This supports more transparent and evidence-based decision-making in contract drafting, reduces negotiation time, and lowers transaction costs. Additionally, the model contributes to the theoretical advancement of cooperative game-based allocation mechanisms by extending the Shapley value to reflect real-world disparities in initial entitlements—an aspect often overlooked in the existing literature.
The model also offers actionable insights for EPC stakeholders, including contractors, designers, and project owners. By quantifying future benefits through indicators such as the bid-winning rate and profit margin, consortium members can better assess long-term value creation and clarify their acceptable thresholds in benefit-sharing negotiations. The integration of both objective cost input and subjective entitlement expectations helps to reduce ambiguity and supports evidence-based, transparent decision-making in contract drafting. Practically, this can shorten negotiation timelines, reduce transaction costs, and enhance coalition stability—particularly in design-led EPC projects where role asymmetry is common.
Several limitations and assumptions inherent in this study should be acknowledged. The quantification of future benefits assumes stable bid frequency and contract value over time. However, as a firm’s reputation and technical capabilities evolve, project scale and profit margins may change nonlinearly. The model also presumes a linear relationship between influencing factors and outcome variables, which may oversimplify real-world dynamics. Furthermore, it assumes complete information symmetry among consortium members, whereas information asymmetry and cognitive biases are common in practice. Members may perceive identical costs or benefits differently, leading to negotiation friction. Finally, the model relies on the rational actor assumption, overlooking the role of fairness perceptions and psychological expectations. Even objectively fair allocations may be challenged if perceived as inequitable, potentially undermining cooperation and long-term stability.
Future research can extend this study in several focused directions. First, the estimation of the benefit entitlement influence factor τ could be enhanced by integrating insights from behavioral economics, particularly in relation to perceived fairness and bounded rationality. This would allow for a more nuanced representation of how consortium members subjectively evaluate equity in benefit distribution. Second, to improve its external validity, the model should be tested across diverse project types and geographic contexts using real-world datasets. Such empirical validation would assess the model’s adaptability to different institutional environments, cultural norms, and contractual practices. Additionally, future work may explore the role of strategic information disclosure and asymmetry, incorporating these dynamics into game-theoretic frameworks to build more robust and incentive-compatible allocation mechanisms.

Author Contributions

Conceptualization, J.L.; methodology, J.L.; software, J.L.; validation, J.L.; formal analysis, J.L.; resources, Z.Q.; data curation, J.L.; writing—original draft preparation, J.L.; writing—review and editing, Z.Q.; visualization, J.L.; supervision, Z.Q.; project administration, Z.Q.; funding acquisition, Z.Q. All authors have read and agreed to the published version of the manuscript.

Funding

This research was funded by the Zhejiang University Scientific Research Project on Management Systems and Value Creation Pathways for Design-Led EPC Projects, grant number S横20240218.

Data Availability Statement

The data presented in this study are available on request from the corresponding author.

Conflicts of Interest

The authors declare no conflicts of interest.

Appendix A. Questionnaire on Correction Coefficients for the Future Benefit of the Design-Leading Party

  • Dear respondent,
  • This questionnaire aims to investigate how various influencing factors affect the Future Benefit of the design-leading party in a design-led EPC model. Your participation is critical to the success of this study. Thank you for taking the time to contribute.

Appendix A.1

This study posits that the increase in the Future Project Bid-Winning Rate and Future Project Profit Margin of the design-leading party is influenced by multiple factors. These include improvements in corporate reputation, enhancement in professional design ability, advancement in EPC Project Management Ability, and the establishment of long-term cooperative relationships. Specifically, an improved corporate reputation enhances bidding competitiveness and builds greater client trust. Strengthened professional design ability enables the design firm to offer more competitive design solutions during both the bidding and execution phases. Enhanced EPC Project Management Ability improves project implementation efficiency and quality, thereby reducing operational risk and increasing profitability. Long-term cooperative relationships can be further categorized into improved collaboration with the owner, contractor, and suppliers. Stable cooperation with the owner increases opportunities to secure future projects. Effective collaboration with the contractor helps to optimize project execution efficiency. Closer partnerships with suppliers contribute to reduced procurement costs and improved supply chain management. These factors collectively drive the growth of the design-leading party’s future benefit.
To quantify the impact of various influencing factors on the Future Project Profit Margin and Future Project Bid-Winning Rate of the design-leading party, this study assumes that the initial profit margin and bid-winning rate of the design enterprise are denoted by p and w , respectively. After implementing value-creation activities, both indicators are expected to improve. Let the Future Project Profit Margin increase to β p   β 1 , and the Future Project Bid-Winning Rate rise to γ w γ 1 . Furthermore, it is assumed that, within a certain range, the growth rates of the profit margin and bid-winning rate are linearly related to the improvement levels of their respective influencing factors. A 10% improvement is adopted as the baseline, and a structured questionnaire survey is conducted to obtain the sub-correction coefficients for the Future Project Profit Margin and Bid-Winning Rate when each influencing factor increases by 10%.
  • If the corporate reputation of the design firm improves by 10%, how will its Future Project Bid-Winning Rate change?
    No significant change
    The Future Project Bid-Winning Rate increases by ( )%
  • If the professional design ability of the design firm improves by 10%, how will its Future Project Profit Margin change?
    No significant change
    The Future Project Profit Margin increases by ( )%
  • If the professional design ability of the design firm improves by 10%, how will its Future Project Bid-Winning Rate change?
    No significant change
    The Future Project Bid-Winning Rate increases by ( )%
  • If the EPC Project Management Ability of the design firm improves by 10%, how will its Future Project Profit Margin change?
    No significant change
    The Future Project Profit Margin increases by ( )%
  • If the EPC Project Management Ability of the design firm improves by 10%, how will its Future Project Bid-Winning Rate change?
    No significant change
    The Future Project Bid-Winning Rate increases by ( )%
  • If the cooperation with the owner improves by 10%, how will the design firm’s Future Project Profit Margin change?
    No significant change
    The Future Project Profit Margin increases by ( )%
  • If the cooperation with the owner improves by 10%, how will the design firm’s Future Project Bid-Winning Rate change?
    No significant change
    The Future Project Bid-Winning Rate increases by ( )%
  • If the cooperation with the contractor improves by 10%, how will the design firm’s Future Project Profit Margin change?
    No significant change
    The Future Project Profit Margin increases by ( )%
  • If the cooperation with suppliers improves by 10%, how will the design firm’s Future Project Profit Margin change?
    No significant change
    The Future Project Profit Margin increases by ( )%

Appendix A.2

Taking the scenario of the design firm conducting “coordination and design optimization of an EPC project” as an example, this value-creation activity requires close collaboration between the design firm and the contractor, with the goal of dynamically optimizing design solutions to improve construction efficiency, reduce costs, and ensure that the project quality meets the expected standards.
This study assumes that in this scenario, the design firm’s path to obtaining future benefits primarily stems from improvements in three key influencing factors: (1) long-term cooperation with the contractor, (2) EPC Project Management Ability, and (3) professional design ability. To quantify the impact of this value-creation activity on the design firm’s Future Project Profit Margin and Future Project Bid-Winning Rate, it is necessary to determine the extent of improvement in these three factors following the implementation of “coordination and design optimization during the construction phase of the EPC project.”
10.
After implementing “coordination and design optimization during the construction phase of the EPC project,” how will the design firm’s professional design ability change?
No significant change
The design firm’s professional design ability improves by ( )%
11.
After implementing “coordination and design optimization during the construction phase of the EPC project,” how will the design firm’s EPC Project Management Ability change?
No significant change
The design firm’s EPC Project Management Ability improves by ( )%
12.
After implementing “coordination and design optimization during the construction phase of the EPC project,” how will the cooperation with the contractor change?
No significant change
The cooperation with the contractor improves by ( )%

Appendix B. Questionnaire on Correction Coefficients for the Future Benefit of the Contractor

  • Dear respondent,
  • This questionnaire aims to investigate how various influencing factors affect the Future Benefit of the Contractor in a design-led EPC model. Your participation is critical to the success of this study. Thank you for taking the time to contribute.

Appendix B.1

This study posits that the Future Project Bid-Winning Rate and Future Project Profit Margin of the contractor are influenced by multiple factors, including improvements in corporate reputation, enhancement in construction capability, advancement in EPC Project Management Ability, and the establishment of long-term cooperative relationships. Specifically, an enhanced corporate reputation increases the contractor’s competitiveness in the market and strengthens client recognition of its construction and contract performance capabilities, thereby boosting its project bid-winning rate. An improved construction management ability contributes to higher construction efficiency, reduced costs, and improved execution quality, thus enhancing future project profitability. Furthermore, this study refines the contractor’s long-term cooperative relationships into two key dimensions: collaboration with the design firm and with subcontractors. Strengthened cooperation with the design firm facilitates future joint bidding and project execution under consortium arrangements, while long-term collaboration with subcontractors ensures stable resource supply, lowers costs, and improves construction quality.
To quantify the impact of various influencing factors on the Future Project Profit Margin and Future Project Bid-Winning Rate of the contractor, this study assumes that the initial profit margin and bid-winning rate of the construction enterprise are denoted by p and w , respectively. After implementing value-creation activities, both indicators are expected to improve. Let the Future Project Profit Margin increase to   β p β 1 , and the Future Project Bid-Winning Rate rise to γ w γ 1 . Furthermore, it is assumed that, within a certain range, the growth rates of the profit margin and bid-winning rate are linearly related to the improvement levels of their respective influencing factors. A 10% improvement is adopted as the baseline, and a structured questionnaire survey is conducted to obtain the sub-correction coefficients for the Future Project Profit Margin and Bid-Winning Rate when each influencing factor increases by 10%.
  • If the corporate reputation of the contractor improves by 10%, how will its Future Project Bid-Winning Rate change?
    No significant change
    The Future Project Bid-Winning Rate increases by ( )%
  • If the construction management ability of the contractor improves by 10%, how will its Future Project Profit Margin change?
    No significant change
    The Future Project Profit Margin increases by ( )%
  • If the construction management ability of the contractor improves by 10%, how will its Future Project Bid-Winning Rate change?
    No significant change
    The Future Project Bid-Winning Rate increases by ( )%
  • If the cooperation with the design firm improves by 10%, how will the contractor’s Future Project Profit Margin change?
    No significant change
    The Future Project Profit Margin increases by ( )%
  • If the cooperation with the design firm improves by 10%, how will the contractor’s Future Project Bid-Winning Rate change?
    No significant change
    The Future Project Bid-Winning Rate increases by ( )%
  • If the cooperation with subcontractors improves by 10%, how will the contractor’s Future Project Profit Margin change?
    No significant change
    The Future Project Profit Margin increases by ( )%

Appendix B.2

Taking the scenario of the construction firm conducting “coordination and design optimization of an EPC project” as an example, this value-creation activity requires close collaboration between the design firm and the contractor, with the goal of dynamically optimizing design solutions to improve construction efficiency, reduce costs, and ensure that the project quality meets the expected standards.
This study posits that in this scenario, the contractor’s pathway to achieving future benefits primarily involves improvements in its cooperation with the design firm and its construction management ability. To quantify the effect of the contractor’s participation in “coordination and design optimization during the construction phase of the EPC project” on its Future Project Profit Margin and Future Project Bid-Winning Rate, it is necessary to assess the level of improvement in these influencing factors following the activity.
7.
After participating in “coordination and design optimization during the construction phase of the EPC project,” how will the contractor’s construction management ability change?
No significant change
The construction firm’s construction management ability improves by ( )%
8.
After participating in “coordination and design optimization during the construction phase of the EPC project,” how will the cooperation with the design firm change?
No significant change
The cooperation with the design firm improves by ( )%

References

  1. Amoah, A.; Berbegal-Mirabent, J.; Marimon, F. Making the Management of a Project Successful: Case of Construction Projects in Developing Countries. J. Constr. Eng. Manag. 2021, 147, 4021166. [Google Scholar] [CrossRef]
  2. Toyin, J.O.; Sattineni, A.; Wetzel, E.M.; Fasoyinu, A.A.; Kim, J. Augmented reality in US Construction: Trends and future directions. Autom. Constr. 2025, 170, 105895. [Google Scholar] [CrossRef]
  3. Chen, Y.; Ren, Z.; Hu, B.; Zheng, H. Investigation of the Critical Factors Influencing Multi-Stakeholders’ Participation in Design Optimization of EPC Projects. Buildings 2023, 13, 1654. [Google Scholar] [CrossRef]
  4. Tang, L.; Shen, Q.; Cheng, E.W.L. A review of studies on Public–Private Partnership projects in the construction industry. Int. J. Proj. Manag. 2010, 28, 683–694. [Google Scholar] [CrossRef]
  5. Turner, R. Gower Handbook of Project Management; Routledge: Abingdon, UK, 2016. [Google Scholar]
  6. Zhou, Z. Research on Procurement Management of EPC Project Led by Design Institute. Constr. Econ. 2024, 45, 43–47. (In Chinese) [Google Scholar]
  7. Tian, R. Research on Profit Distribution of EPC Project Consortium in Transportation Infrastructure Construction. Master’s Thesis, Changsha University of Science & Technology, Changsha, China, 2020. (In Chinese). [Google Scholar]
  8. Jiang, W.; Tang, S. The cooperation establishment mechanism of EPC project consortium in context of China: Form the perspective of trust. Sustainability 2023, 15, 1266. [Google Scholar] [CrossRef]
  9. Li, H.; Lv, L.; An, X.; Dong, G.; Ozmen, H.B. Profit Sharing Mechanism of Large EPC Project considering the Behavior of Fairness Concern. Adv. Civ. Eng. 2020, 2020, 3725254. [Google Scholar] [CrossRef]
  10. Kwak, Y.H.; Sadatsafavi, H.; Walewski, J.; Williams, N.L. Evolution of project based organization: A case study. Int. J. Proj. Manag. 2015, 33, 1652–1664. [Google Scholar] [CrossRef]
  11. Sun, C.; Wang, M.; Zhai, F. Research on the Collaborative Application of BIM in EPC Projects: The Perspective of Cooperation between Owners and General Contractors. Adv. Civ. Eng. 2021, 2021, 4720900. [Google Scholar] [CrossRef]
  12. Wagner, R.F. EPC 4.0: The quest for reducing CAPEX in EPC projects. Organ. Technol. Manag. Constr. Int. J. 2020, 12, 2245–2255. [Google Scholar] [CrossRef]
  13. Gao, L.; Deng, X.; Yang, W.; Chang, T.; Liu, X. Exploring Critical Factors Affecting Contractors’ Coopetition Relationship in International Construction Projects. Adv. Civ. Eng. 2021, 2021, 8897395. [Google Scholar] [CrossRef]
  14. Du, L.; Tang, W.; Liu, C.; Wang, S.; Wang, T.; Shen, W.; Huang, M.; Zhou, Y. Enhancing engineer–procure–construct project performance by partnering in international markets: Perspective from Chinese construction companies. Int. J. Proj. Manag. 2016, 34, 30–43. [Google Scholar] [CrossRef]
  15. Wang, T.; Tang, W.; Du, L.; Duffield, C.F.; Wei, Y. Relationships among Risk Management, Partnering, and Contractor Capability in International EPC Project Delivery. J. Manag. Eng. 2016, 32, 4016017. [Google Scholar] [CrossRef]
  16. Baghalzadeh Shishehgarkhaneh, M.; Keivani, A.; Moehler, R.C.; Jelodari, N.; Laleh, S.R. Internet of Things (IoT), Building Information Modeling (BIM), and Digital Twin (DT) in construction industry: A review, bibliometric, and network analysis. Buildings 2022, 12, 1503. [Google Scholar] [CrossRef]
  17. Kabirifar, K.; Mojtahedi, M. The impact of Engineering, Procurement and Construction (EPC) Phases on Project Performance: A Case of Large-scale Residential Construction Project. Buildings 2019, 9, 15. [Google Scholar] [CrossRef]
  18. Shen, W.; Tang, W.; Yu, W.; Duffield, C.F.; Hui, F.K.P.; Wei, Y.; Fang, J. Causes of contractors’ claims in international engineering-procurement-construction projects. J. Civ. Eng. Manag. 2017, 23, 727–739. [Google Scholar] [CrossRef]
  19. Aldhaheri, M.; Bakchan, A.; Sandhu, M.A. A structural equation model for enhancing effectiveness of engineering, procurement and construction (EPC) major projects. Eng. Constr. Archit. Manag. 2018, 25, 1226–1252. [Google Scholar] [CrossRef]
  20. Liu, J.; Wang, Z.; Skitmore, M.; Yan, L. How Contractor Behavior Affects Engineering Project Value-Added Performance. J. Manag. Eng. 2019, 35, 4019012. [Google Scholar] [CrossRef]
  21. Wang, T.; Tang, W.; Qi, D.; Shen, W.; Huang, M. Enhancing Design Management by Partnering in Delivery of International EPC Projects: Evidence from Chinese Construction Companies. J. Constr. Eng. Manag. 2016, 142, 4015099. [Google Scholar] [CrossRef]
  22. Lee, C.; Chong, H.; Li, Q.; Wang, X. Joint Contract–Function Effects on BIM-Enabled EPC Project Performance. J. Constr. Eng. Manag. 2020, 146, 4020008. [Google Scholar] [CrossRef]
  23. Fan, Z.; Liu, Y.; Li, Y. Research on Collaborative Mechanisms of Railway EPC Project Design and Construction from the Perspective of Social Network Analysis. Systems 2023, 11, 443. [Google Scholar] [CrossRef]
  24. Von Neumann, J.; Morgenstern, O. Theory of Games and Economic Behavior; Princeton University Press: Princeton, NJ, USA, 1944. [Google Scholar]
  25. Nash, J.F. The bargaining problem. Econometrica 1950, 18, 155–162. [Google Scholar] [CrossRef]
  26. Shapley, L.S. Contributions to the Theory of Games II; Princeton University Press: Princeton, NJ, USA, 1953. [Google Scholar]
  27. Gillies, D.B. Contributions to the Theory of Games IV; Princeton University Press: Princeton, NJ, USA, 1959. [Google Scholar]
  28. Schmeidler, D. The Nucleolus of a Characteristic Function Game. SIAM J. Appl. Math. 1969, 17, 1163–1170. [Google Scholar] [CrossRef]
  29. Gulati, R.; Wohlgezogen, F.; Zhelyazkov, P. The Two Facets of Collaboration: Cooperation and Coordination in Strategic Alliances. Acad. Manag. Ann. 2012, 6, 531–583. [Google Scholar] [CrossRef]
  30. Feng, X.; Moon, I.; Ryu, K. Revenue-sharing contracts in an N-stage supply chain with reliability considerations. Int. J. Prod. Econ. 2014, 147, 20–29. [Google Scholar] [CrossRef]
  31. Guo, S.; Wang, J.; Xiong, H. The influence of effort level on profit distribution strategies in IPD projects. Eng. Constr. Archit. Manag. 2022, 30, 4099–4119. [Google Scholar] [CrossRef]
  32. Liu, D.; Liu, L.; Tan, X. Risk sharing in quasi-public-welfare water conservancy (PPP) public-private participation projects: An integrated application of Shapley value and utility theory. Front. Earth Sci. 2023, 11, 1234319. [Google Scholar] [CrossRef]
  33. Shang, T.; Liu, P.; Guo, J. How to allocate energy-saving benefit for guaranteed savings EPC projects? A case of China. Energy 2020, 191, 116499. [Google Scholar] [CrossRef]
  34. Yu, H.; Liu, Z.; Liu, Y.; Chen, T.; Cong, M.; Weng, X.; Niyato, D.; Yang, Q. A Fairness-Aware Incentive Scheme for Federated Learning. In Proceedings of the AAAI/ACM Conference on AI, Ethics, and Society, New York City, NY, USA, 7–8 February 2020; pp. 393–399. [Google Scholar]
  35. Hosseinian, S.M.; Carmichael, D.G. Optimal outcome sharing with a consortium of contractors. J. Civ. Eng. Manag. 2016, 22, 655–665. [Google Scholar] [CrossRef]
  36. Ding, J.; Chen, C.; An, X.; Wang, N.; Zhai, W.; Jin, C. Study on Added-Value Sharing Ratio of Large EPC Hydropower Project Based on Target Cost Contract: A Perspective from China. Sustainability 2018, 10, 3362. [Google Scholar] [CrossRef]
  37. Yue, Y.; Wang, S.; Que, Z. Analysis of revenue distribution of assembly building under EPC model based on entropy weight-TOPSIS improved Shapley value. Bioresources 2025, 20, 322–330. [Google Scholar] [CrossRef]
  38. Liu, X.; Wang, X.; Guo, H.; An, X. Benefit Allocation in Shared Water-Saving Management Contract Projects Based on Modified Expected Shapley Value. Water Resour. Manag. 2021, 35, 39–62. [Google Scholar] [CrossRef]
  39. Kalai, E.; Smorodinsky, M. Other solutions to Nash’s bargaining problem. Econom. J. Econom. Soc. 1975, 43, 513–518. [Google Scholar] [CrossRef]
Figure 1. Consortium members’ cost–benefit structure for modified Shapley value allocation.
Buildings 15 02024 g001
Figure 2. Computational process for quantifying future benefits of consortium members.
Buildings 15 02024 g002
Figure 3. Computational process for quantifying future benefits of the design-leading party.
Buildings 15 02024 g003
Figure 4. Computational process for quantifying future benefits of the contractor.
Buildings 15 02024 g004
Figure 5. Schematic diagram of the Shapley value adjustment process for consortium members.
Buildings 15 02024 g005
Table 1. Summary of existing studies.
Existing MethodsLimitations
CoreComputationally complex with limited practical applicability
Nucleolus
Classical Shapley ValueAssumes equal distribution of all factors
Existing Modified Shapley ValueFails to account for differences in initial benefit entitlements among consortium members
Table 2. Summary of standardized sub-correction coefficients for factors affecting the future benefits of the design-leading party.
Impact FactorsSub-Correction Coefficient of Future Project Profit MarginSub-Correction Coefficient of Future Project Bid-Winning Rate
Improvement in corporate reputation/1.06
Enhancement in professional design ability1.091.07
Enhancement in EPC project management ability1.081.05
Improvement in cooperation with the owner1.041.07
Improvement in cooperation with the contractor1.06/
Improvement in cooperation with suppliers1.05/
Note: The sub-correction coefficients are based on a 10% increase in the respective influencing factors.
Table 3. Summary of standardized sub-correction coefficients for factors affecting the future benefits of the contractor.
Impact FactorsSub-Correction Coefficient of Future Project Profit MarginSub-Correction Coefficient of Future Project Bid-Winning Rate
Improvement in corporate reputation/1.07
Enhancement in construction management ability1.071.05
Improvement in collaboration with the design-leading party1.081.05
Improvement in cooperation with subcontractors1.05/
Note: The sub-correction coefficients are based on a 10% increase in the respective influencing factors.
Table 4. Initial net benefit distribution for Design Firm X based on classical Shapley value.
S 1 1 , 2 1 , 3 1 , 2 , 3
v S v 1 v 1 , 2 v 1 , 3 v 1 , 2 , 3
v S i 0 v 2 v 3 v 2 , 3
v S v S i v 1 v 1 , 2 v 2 v 1 , 3 v 3 v 1 , 2 , 3 v 2 , 3
S 1 ! n S ! n ! 1 3 1 6 1 6 1 3
S 1 ! n S ! n ! v S v S i v 1 3 v 1 , 2 v 2 6 v 1 , 3 v 3 6 v 1 , 2 , 3 v 2 , 3 3
Table 5. Summary of cost components for consortium members.
Consortium MemberLabor Cost
(CNY Million)
Material Cost
(CNY Million)
Capital Cost
(CNY Million)
Design Firm X6.52.51
Construction Firm Y76.53.3
Construction Firm Z65.52.8
Table 6. Summary of net benefits for consortium members.
Consortium MemberDesign Firm XConstruction Firm YConstruction Firm Z
Cost (CNY million)10.0016.8014.30
Direct Economic Benefit (CNY million)12.0031.0027.00
Future Benefit (CNY million)4.1011.257.50
Net Benefit (CNY million)6.1025.4520.20
Table 7. Summary table of characteristic functions of all non-empty subsets in the consortium.
Non-Empty Subsets 1 2 3 1 , 2 1 , 3 2 , 3 1 , 2 , 3
Consortium MembersXYZX, YX, ZY, ZX, Y, Z
Characteristic Functionv(1)v(2)v(3)v(1,2)v(1,3)v(2,3)v(1,2,3)
Net Benefit (CNY million)37529231351.75
Table 8. Summary table of multiple benefit distribution schemes.
Consortium MemberDesign Firm XConstruction Firm YConstruction Firm Z
Equal Distribution (CNY million)17.2517.2517.25
Classical Shapley (CNY million)20.5917.5813.58
φi(v)′ (CNY million)15.7621.5514.44
B i * (CNY million)13.9622.6315.16
Contract-Based Distribution (CNY million)14.2222.5215.01
Disclaimer/Publisher’s Note: The statements, opinions and data contained in all publications are solely those of the individual author(s) and contributor(s) and not of MDPI and/or the editor(s). MDPI and/or the editor(s) disclaim responsibility for any injury to people or property resulting from any ideas, methods, instructions or products referred to in the content.

