Article

Research on the Mechanical Behavior of External Composite Steel Bar Under Cyclic Tension-Compression Loading

School of Civil and Transportation Engineering, Beijing University of Civil Engineering and Architecture, Beijing 100044, China
*
Author to whom correspondence should be addressed.
Buildings 2025, 15(12), 2019; https://doi.org/10.3390/buildings15122019
Submission received: 11 May 2025 / Revised: 6 June 2025 / Accepted: 10 June 2025 / Published: 12 June 2025

Abstract

A self-centering prefabricated concrete frame structure has good seismic performance, and its seismic capacity is mainly provided by the recovery force of the unbonded prestressing tendons and the energy-dissipation deformation capacity of embedded steel reinforcement. Relocating embedded reinforcement to external positions enables replaceability of energy dissipation components. And the configuration of external energy dissipation components is the primary factor influencing their energy dissipation capacity. Based on the existing external “Plug & Play” configuration, the internal steel bar size and material properties such as those of steel bar and filling material were varied in this study, and then, cyclic tension-compression experimental studies and numerical simulations were conducted to investigate the energy dissipation performance index and key influencing factors of this type of external composite steel bar. The research results showed that the composite steel bars designed in the experiments exhibited superior overall energy dissipation performance. Specimens utilizing Q345B steel as the core material outperformed those with Grade 30 steel. Moreover, the slenderness ratio of the composite steel bars and the diameter ratio between the end region and weakened segment of the internal steel bars were identified as critical parameters governing energy dissipation performance, and recommendations for optimal parameter ranges were discussed. This study provides a theoretical foundation for implementing external composite steel bars in self-centering structural systems.

1. Introduction

The seismic performance improvement of precast concrete frame structures is currently a key research focus, and the seismic behavior of beam–column joints is critical to the overall structural seismic performance. Compared to traditional reinforced concrete frames, self-centering precast concrete frames demonstrate certain advantages, such as simpler and faster construction, as well as superior seismic performance. The seismic resistance of self-centering precast concrete frames primarily relies on the restoring force of unbonded prestressing tendons and the energy dissipation capacity of embedded longitudinal reinforcement. To enable post-earthquake replacement of energy-dissipating components, an increasing number of studies are focusing on externally mounted components and their connection methods as alternatives to embedded longitudinal reinforcement [1].
Among the ductile connections for prefabricated structures, beam–column joints with prestressing tendons are widely used because of their excellent self-centering capability. In contrast, the energy dissipation capacity of beam–column joints provided only with prestressing tendons is limited [2,3]. To resolve this problem, some researchers have attached energy dissipators, such as friction dampers [4] and steel connectors with different forms [5,6,7,8], to joints. Certain energy dissipators with replaceable connections have been applied individually to beam–column joints [9,10,11,12,13,14]. Among these dissipators, buckling-restrained braces (BRBs) have attracted attention because of their replaceability, stable hysteretic performance, and high bearing capacity. A BRB connector for a beam–column joint needs to withstand significant loads, and the corresponding yield load is substantial. Consequently, energy cannot be dissipated by a BRB connector under smaller earthquake intensity. To realize energy dissipation under earthquakes of different intensities, a graded-yielding design method can be adopted. Dai et al. [15] introduced a new double-stage coupling damper consisting of a friction component and a buckling restrained component in series. Lu et al. [16] investigated the hysteretic behavior of a bending-friction coupled damper. Chen et al. [17] proposed a damper combining X-shaped and triangular-shaped steel plates. A shear panel damper, which has high initial stiffness and small yield displacement, can be used as a first-stage yielding device [18]. Deng et al. [19] proposed a shear panel damper with two restraining plates, which could effectively restrain the out-of-plane buckling of the damper. Lin et al. [20] conducted a series of tests on a buckling-restrained shear panel damper with slotted holes. They verified that the damper had stable energy dissipation capacity and excellent deformation capacity. To enhance the structural resilience and realize energy dissipation of connectors under earthquakes of different intensities, Li et al. [21] proposed a replaceable graded-yielding energy-dissipating connector.
In 2009, Marriott et al. [22] conducted component tests on energy dissipators with different attenuation diameters and lengths of different attenuation segments of external fuse-type energy dissipators. The test results show that when the energy dissipator is compressed to the negative displacement range, the larger diameter of the steel rod is in contact with the surrounding epoxy resin, which increases the stiffness of the damper in compression. Stefano Pampanin et al. [23] proposed an external “Plug & Play” component applicable to structural joints experiencing large deformations. It can be installed at prefabricated self-centering frame beam–column joints, connections between prefabricated prestressed walls and foundations, etc., effectively achieving low damage in self-centering structures and replaceability of energy-dissipating components. Subsequently, F. Sarti et al. [24] conducted a series of experiments on the “Plug & Play” system. The experimental results demonstrated that the energy-dissipating components exhibited stable hysteretic behavior and could reliably dissipate seismic energy. However, there was a lack of in-depth investigation into the factors influencing energy dissipation. In addition, several researchers proposed novel external components aimed at reducing damage to self-centering joints. For example, Haishen Wang [6] installed external steel bars into precast prestressed beam–column joints and analyzed their energy dissipation capacity through experiments and finite element analysis. Chun-Lin Wang [25] utilized buckling restrained devices to limit compression buckling and maintain the stable hysteretic behavior of the precast concrete connections. Although easily repaired, precast connections with external dissipators face issues such as indirect internal force transfer and the tendency to fail in between dissipators and structural elements. To overcome these problems, Chunyu Li [26] proposed a replaceable connector (REDC-PCF) composed of steel-based bending and shear components, which provides flexural resistance during minor earthquakes and functions as an energy dissipation device under moderate to severe seismic events. The results showed that the connector had excellent hysteretic behavior and was easy to repair post-earthquake. Based on the original “Plug & Play” configuration, XiuShu Qu [27] added compression bolts and conducted cyclic tension tests on six specimens. The findings indicated that the addition of compression bolts significantly enhanced compressive performance; however, the weak point shifted from the weakened section at the steel bar to the bolt connection at the ends, which was not intended.
In summary, the use of externally mounted small-scale energy-dissipating components can enhance the energy dissipation capacity of joints and enable post-earthquake replaceability, as illustrated in Figure 1. However, current design codes lack specific provisions regarding the parameters and performance of these devices, thereby limiting their practical application in engineering projects. Therefore, based on previous research on the “Plug & Play” composite steel bars, parameters such as the material and dimensions of the internal steel bars were modified in this study. Cyclic tension-compression tests, numerical simulations, and theoretical analyses were conducted to investigate the key factors affecting the energy dissipation performance of composite steel bars, analyze their impact mechanisms, and provide a basis for practical engineering applications, as illustrated in Figure 2.

2. Experimental Investigation on External Composite Steel Bars

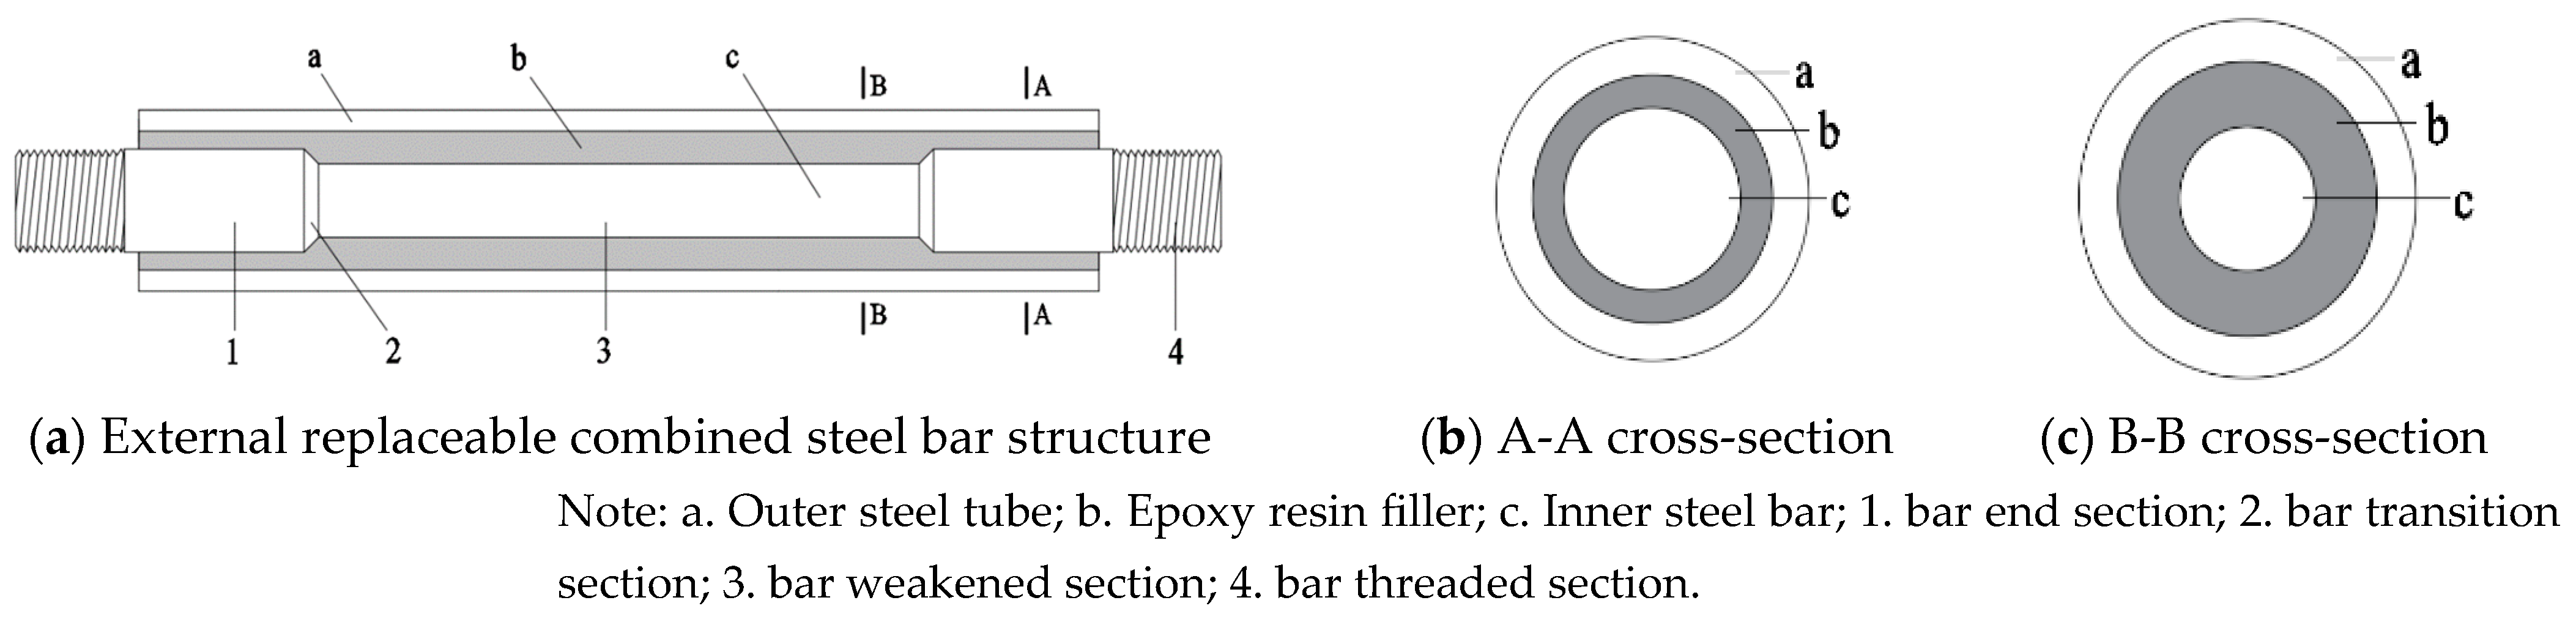
2.1. Specimen Design

A total of 30 external composite steel bar specimens were designed in the tests. Each specimen comprises an inner steel bar, epoxy resin as the filler material, and an outer steel tube, and the surface roughness of the inner steel bars and outer steel tubes is not disposed, as illustrated in Figure 3. Both ends of the specimen include threaded segments with a length of 150 mm. The thickness of the outer steel tube is 3 mm, and the length of both ends of the steel bar is 50 mm. The key variables considered in the experiment include the material of the inner steel bar, the slenderness ratio of the composite bar (λtot), and the diameter ratio between the bar ends and the weakened section (Dex/Dfuse). Two methods are used to calculate the slenderness ratio, the basic slenderness ratio (λfuse), which is based only on the dimensions of the inner steel bar, as shown in Equation (1), and the dimensions of Dfuse and Lfuse are designed within a reasonable range based on the diameter of the reinforcing bars to be connected and the required anchorage length. The equivalent slenderness ratio (λtot), which incorporates the influence of the filler and the inner steel bar dimensions, is as shown in Equation (2). The specific dimensions are presented in Table 1, where Dw is the thickness of the steel tube, Lfuse is the length of the weakened section, Ltube is the steel tube length, and μ is the ductility coefficient. Specimens are designated as “D” (diameter) and “L” (length) followed by the steel material grade. For example, “D14L210-Q345B” denotes a specimen with a 14 mm diameter weakened section, 210 mm length, and Q345B-grade steel.
λ fuse = 4 L fuse D fuse ,
λ tot = L fuse A fuse + A tube + A eff , fil I fuse + I tube + I eff , fill ,
where
  • Afuse is the cross-sectional area of the weakened section of the inner steel bar;
  • Atube is the cross-sectional area of the outer steel tube;
  • Ifuse is to the moment of inertia of the weakened section of the inner steel bar;
  • Itube is the moment of inertia of the outer steel tube;
  • Aeff,fill is the effective cross-sectional area of the internal filler material;
  • Ieff,fill is the moment of inertia of the internal filler material.
Figure 3. Schematic diagram of externally mountable composite steel bar.
Buildings 15 02019 g003
Table 1. Design parameter table of composite steel bar dimensions.
Specimen Group
Number
Specimen Identification
Number
Dw (mm)Dex/DfuseLfuse (mm)Ltube (mm)λfuseλtot
Group 1D14L210-Q345B101.721031060.020.8
D16L200-Q345B81.520030050.020.0
D16L240-Q345B81.524034060.024.0
D16L280-Q345B81.528038070.028.0
D18L270-Q345B61.327037060.027.2
Group 2D20L300-Q345B101.530040060.030.5
D22L275-Q345B81.3627537550.028.2
D22L330-Q345B81.3633043060.033.8
D22L385-Q345B81.3638548570.039.5
D24L360-Q345B61.2536046060.037.2
Group 3D26L390-Q345B101.439049060.040.5
D28L350-Q345B81.335045050.036.4
D28L420-Q345B81.342052060.043.7
D28L490-Q345B81.349059070.051.0
D30L450-Q345B61.245055060.046.9
Group 4D14L210-30101.721031060.020.8
D16L200-3081.520030050.020.0
D16L240-3081.524034060.024.0
D16L280-3081.528038070.028.0
D18L270-3061.327037060.027.2
Group 5D20L300-30101.530040060.030.5
D22L275-3081.3627537550.028.2
D22L330-3081.3633043060.033.8
D22L385-3081.3638548570.039.5
D24L360-3061.2536046060.037.2
Group 6D26L390-30101.439049060.040.5
D28L350-3081.335045050.036.4
D28L420-3081.342052060.043.7
D28L490-3081.349059070.051.0
D30L450-3061.245055060.046.9

2.2. Material Properties

Two steel grades (Q345B and 30#) were used for the internal steel bars, while Q235 steel was used for the external steel tube. A mixture of Type E-44 epoxy resin and Type 650 hardener blended in a 1:1 ratio was used for the filler. The material properties of the epoxy resins are listed in Table 2. Uniaxial tensile tests were performed on the Q345B and 30# steel bars, and the values of the elastic modulus (E), yield strength (fy), ultimate tensile strength (fu), and elongation (δ) are listed in Table 3.

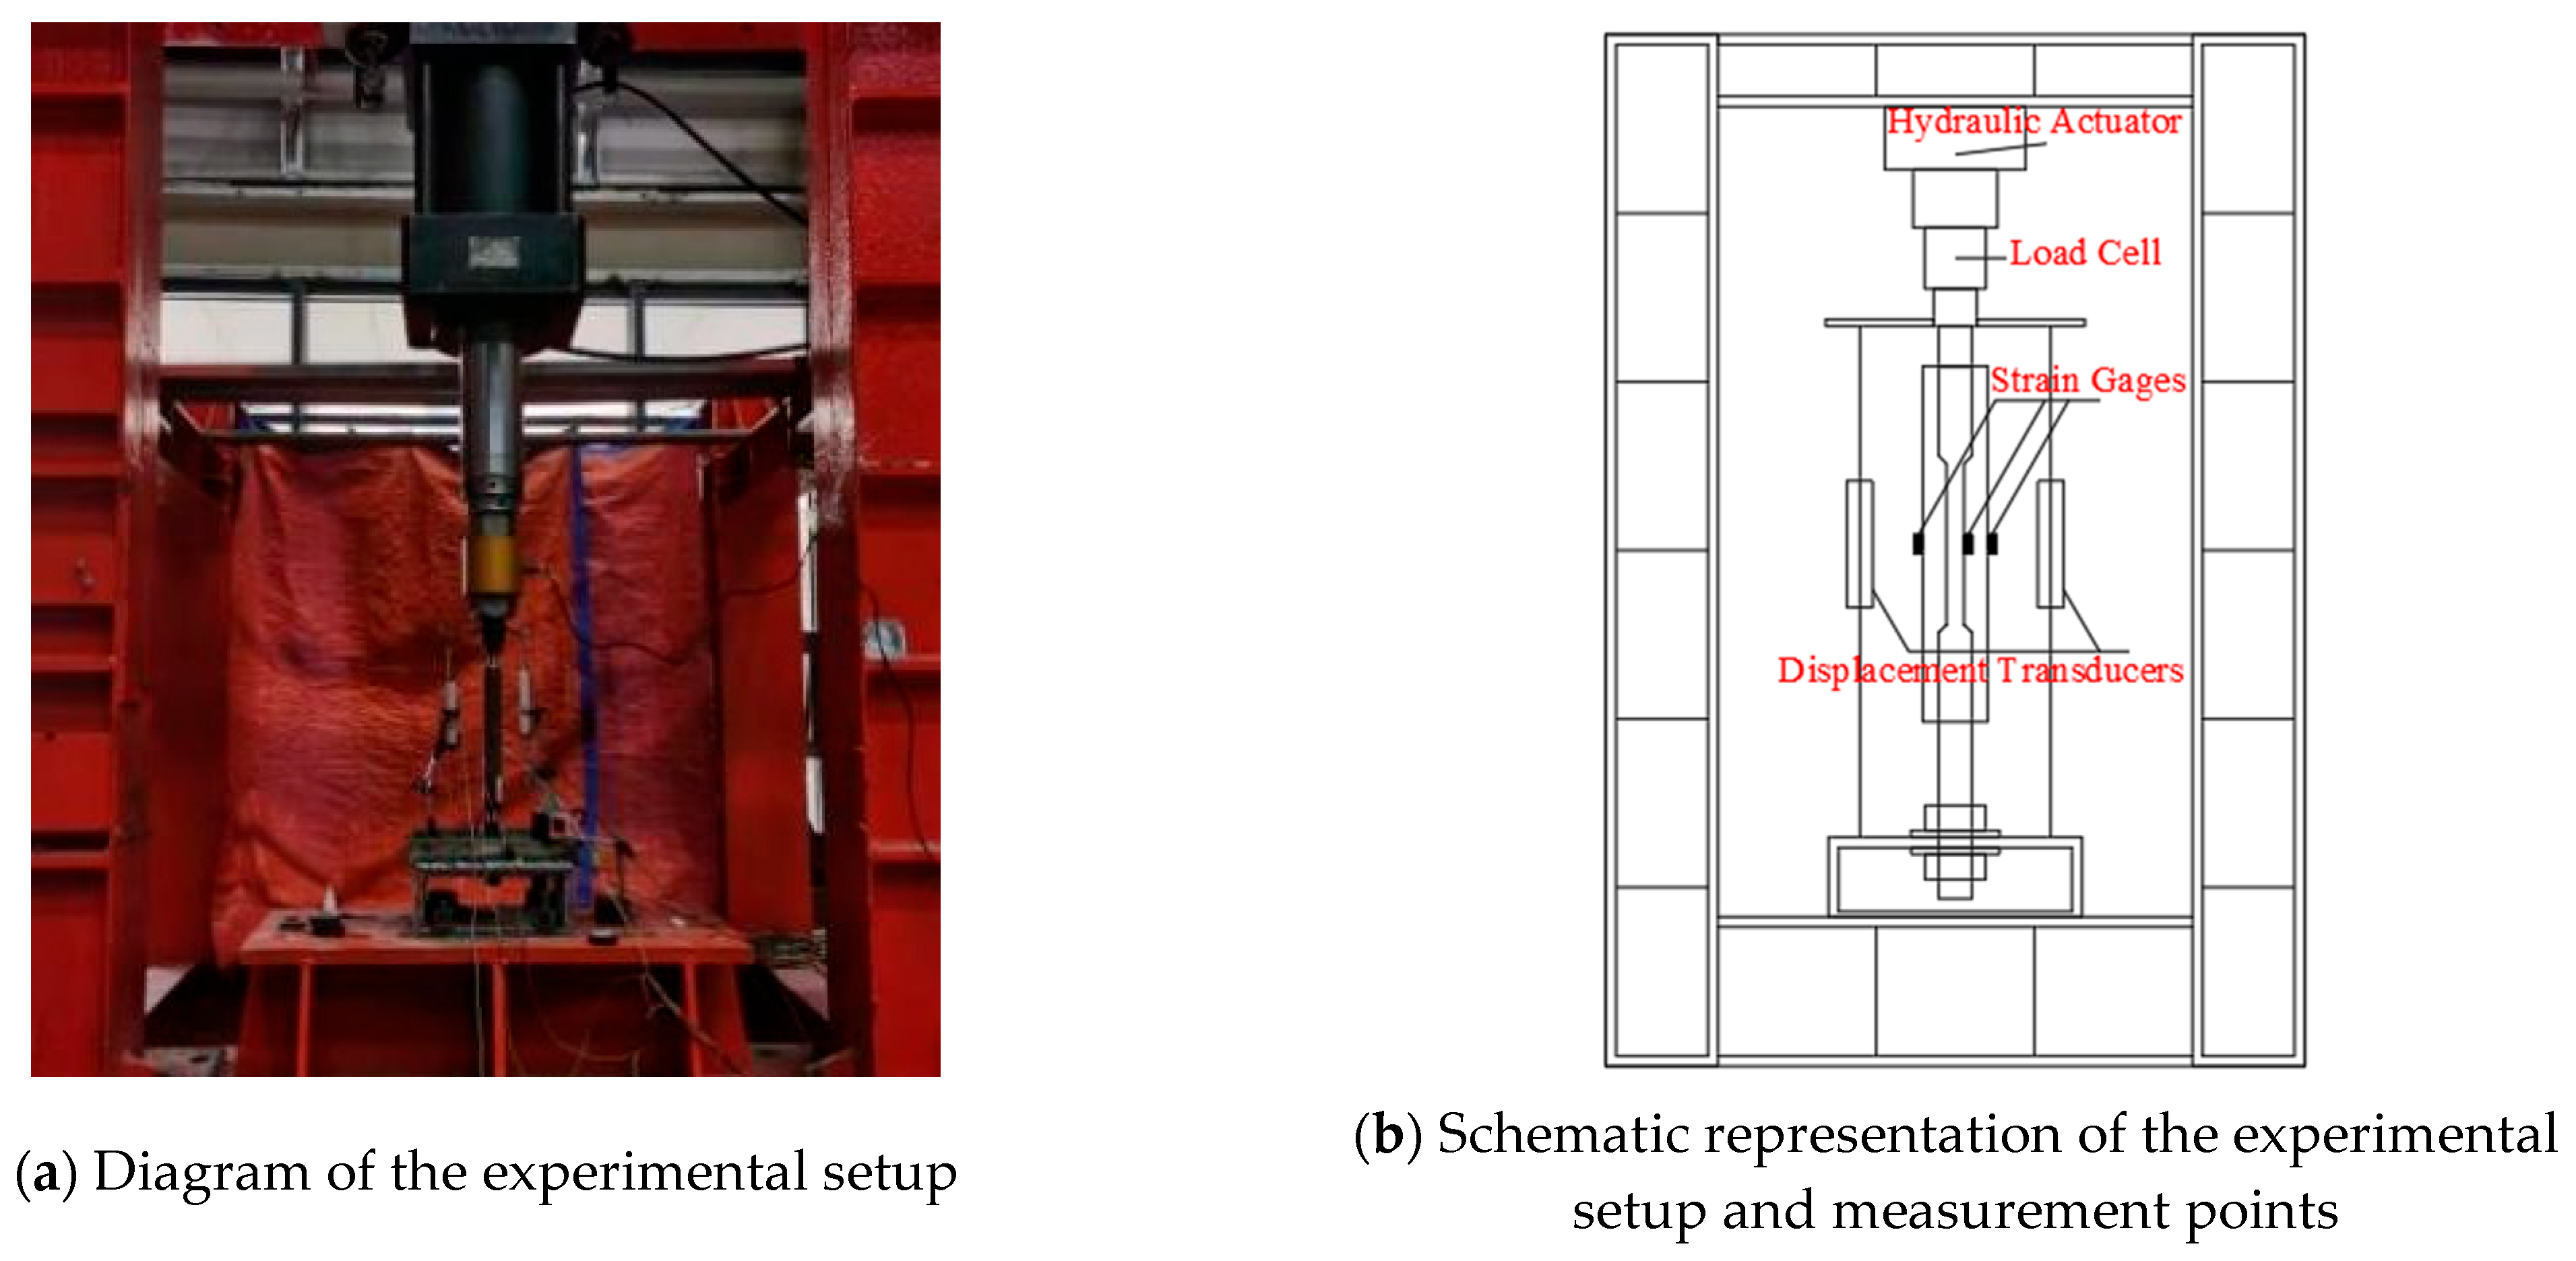
2.3. Test Loading and Measurement

The cyclic tension-compression experimental setup is illustrated in Figure 4a, while the measurement layout is shown in Figure 4b. The test loading was applied under displacement control. Based on ACI ITG-5.1-07 (ACI 2008) [28], the initial displacement amplitude was set to Δ = 1/200Lfuse. Subsequent displacement levels followed a sequence of 2Δ, 3Δ, 4Δ, 5Δ, etc., with each displacement level applied for three loading cycles.

2.4. Experimental Phenomena
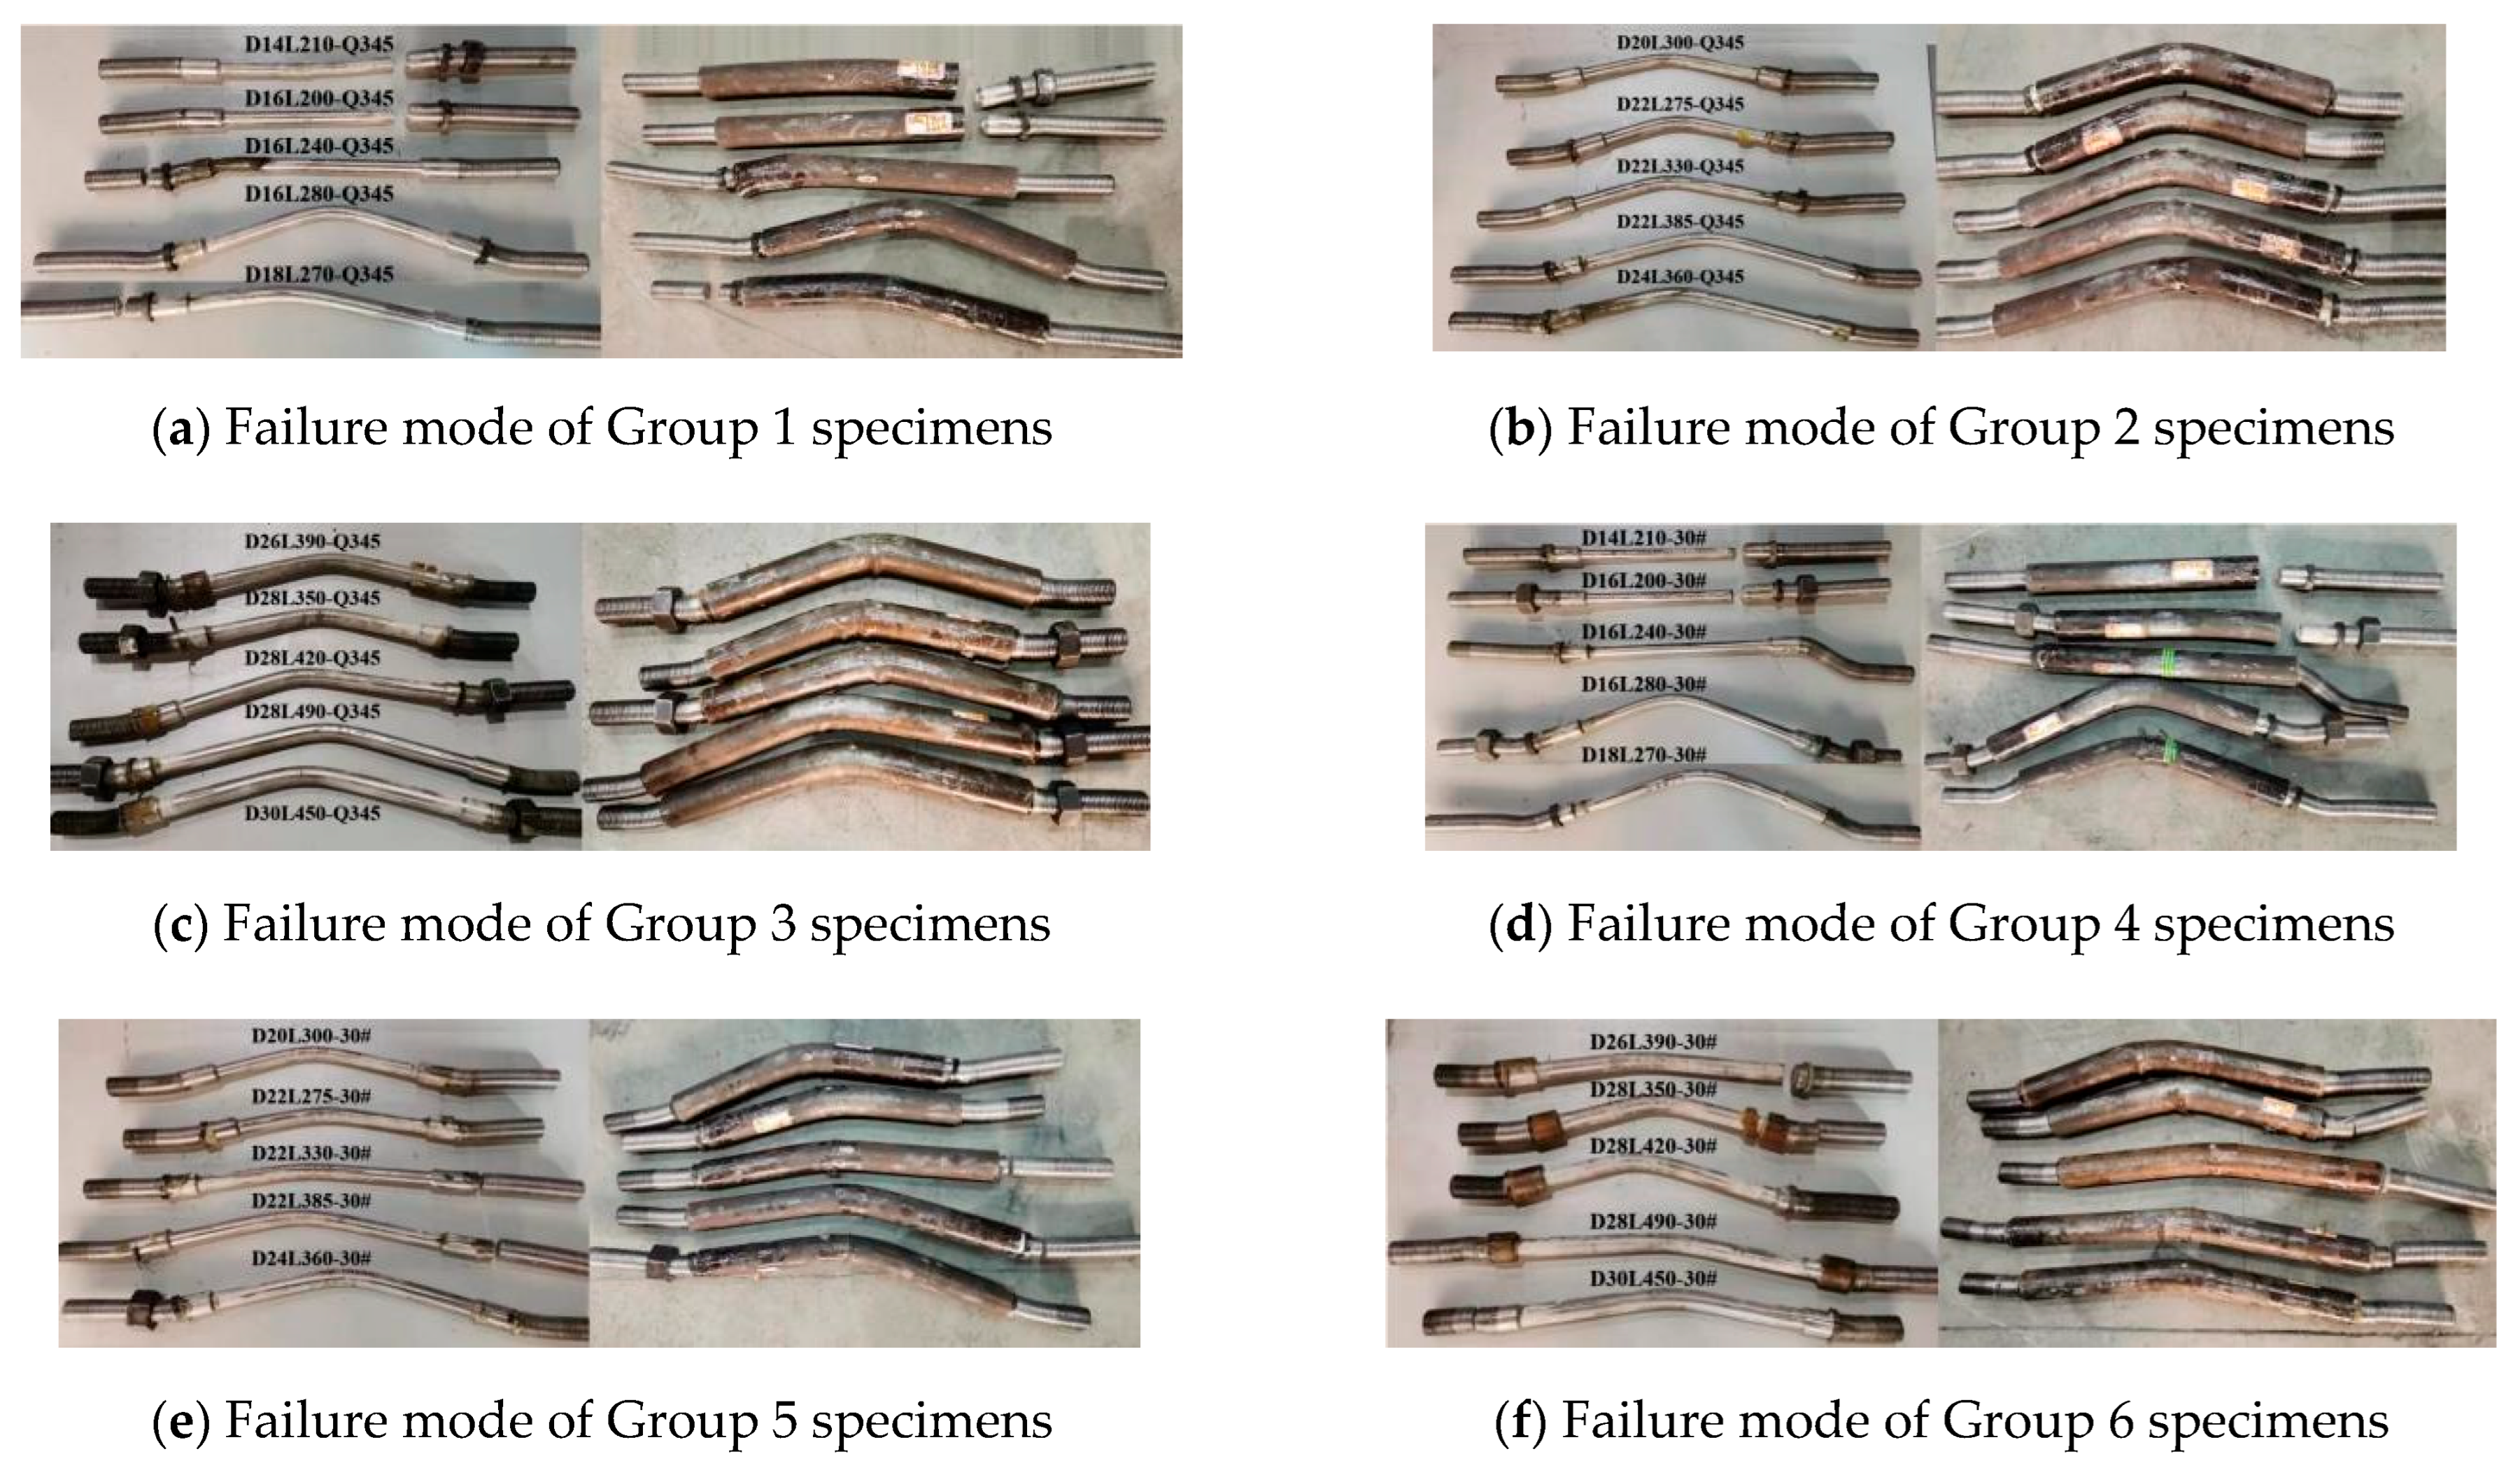
2.4.1. Failure Mode

During the loading process, the external composite steel bar specimens exhibited two kinds of failure mechanisms. The first was necking failure, characterized by axial low-cycle fatigue leading to fractures in the weakened and end sections. A few specimens exhibited threaded section fractures, and the reason is that the thread section had a certain weakening, and the strength of the combined cross-section was higher, so that the thread segment with a small cross-sectional area was fractured due to fatigue failure. The second failure mechanism was buckling failure, with most specimens showing overall structural instability. As the displacement increased, flexural deformation during compression became more pronounced and was not recoverable after tension. Figure 5 illustrates the failure modes of all specimens. It can be observed that specimens with a smaller equivalent slenderness ratio (λtot) and a larger diameter ratio (Dex/Dfuse) primarily experienced necking failure, whereas buckling was the dominant failure mode in the others. Specimens with identical geometric parameters but different material types exhibited similar failure modes, indicating that the influence of material properties on the failure mechanism was minimal. Among the two influencing parameters, λtot had a more significant effect on the failure mode than Dex/Dfuse.

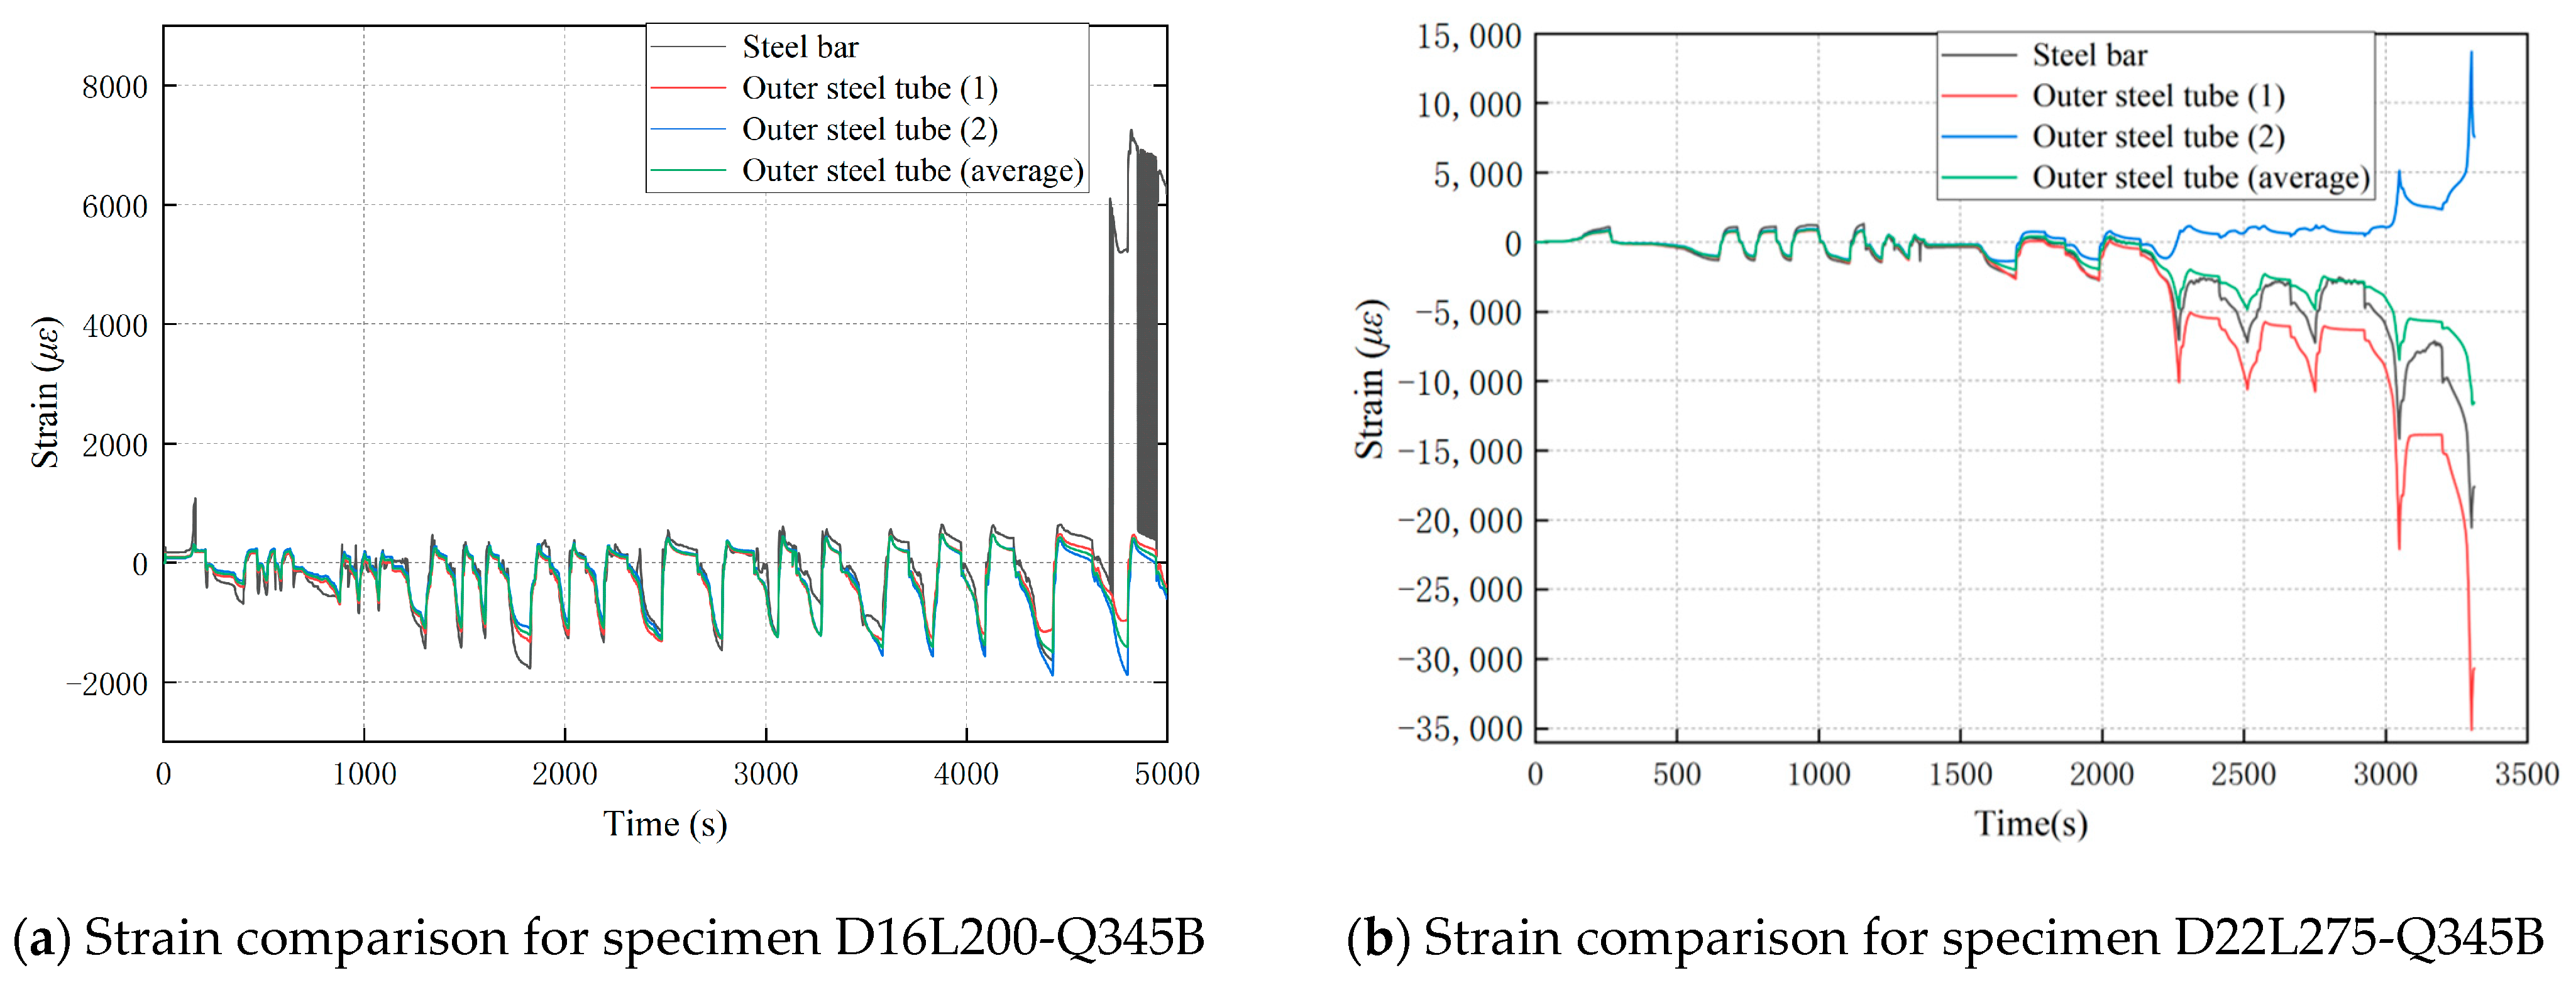
2.4.2. Strain Analysis

In the initial loading stage, the strain variation trends of the outer steel tube and steel bar were closely aligned. As the load increased, the strain behavior became correlated with the failure mode of the specimen: For specimens exhibiting necking failure, a sudden abrupt change occurred in the steel bar strain curve after failure. For specimens experiencing buckling failure, the strain difference between the two sides of the outer steel tube gradually increased post-deformation. The average strain of the outer steel tube was slightly lower than that of the steel bar, and both curves remained generally consistent.
As shown in Figure 6a, for specimen D16L200-Q345B that experienced necking failure, the strain in the steel bar and outer steel tube was nearly identical during the early stages of loading. In the final loading cycle, the strain in the steel bar increased abruptly due to the detachment between the epoxy resin and the steel bar, ultimately resulting in tensile fracture of the bar. At the beginning of loading, the strain curve of the steel bar closely matched that of the outer steel tube, but after fracture, the strain curve of the steel bar exhibited a sudden increase.
As shown in Figure 6b, when specimen D22L275-Q345B (which experienced buckling failure) underwent significant bending deformation in both the outer steel tube and steel bar, the strain curves on both sides of the outer steel tube exhibited opposite trends as the degree of bending increased. Nonetheless, the average strain curve of the outer steel tube closely aligned with that of the steel bar. With increasing load, the strain in the steel bar slightly exceeded that of the outer steel tube while remaining closely aligned with the average strain curves derived from both sides of the steel tube.

2.5. Analysis of Experimental Results

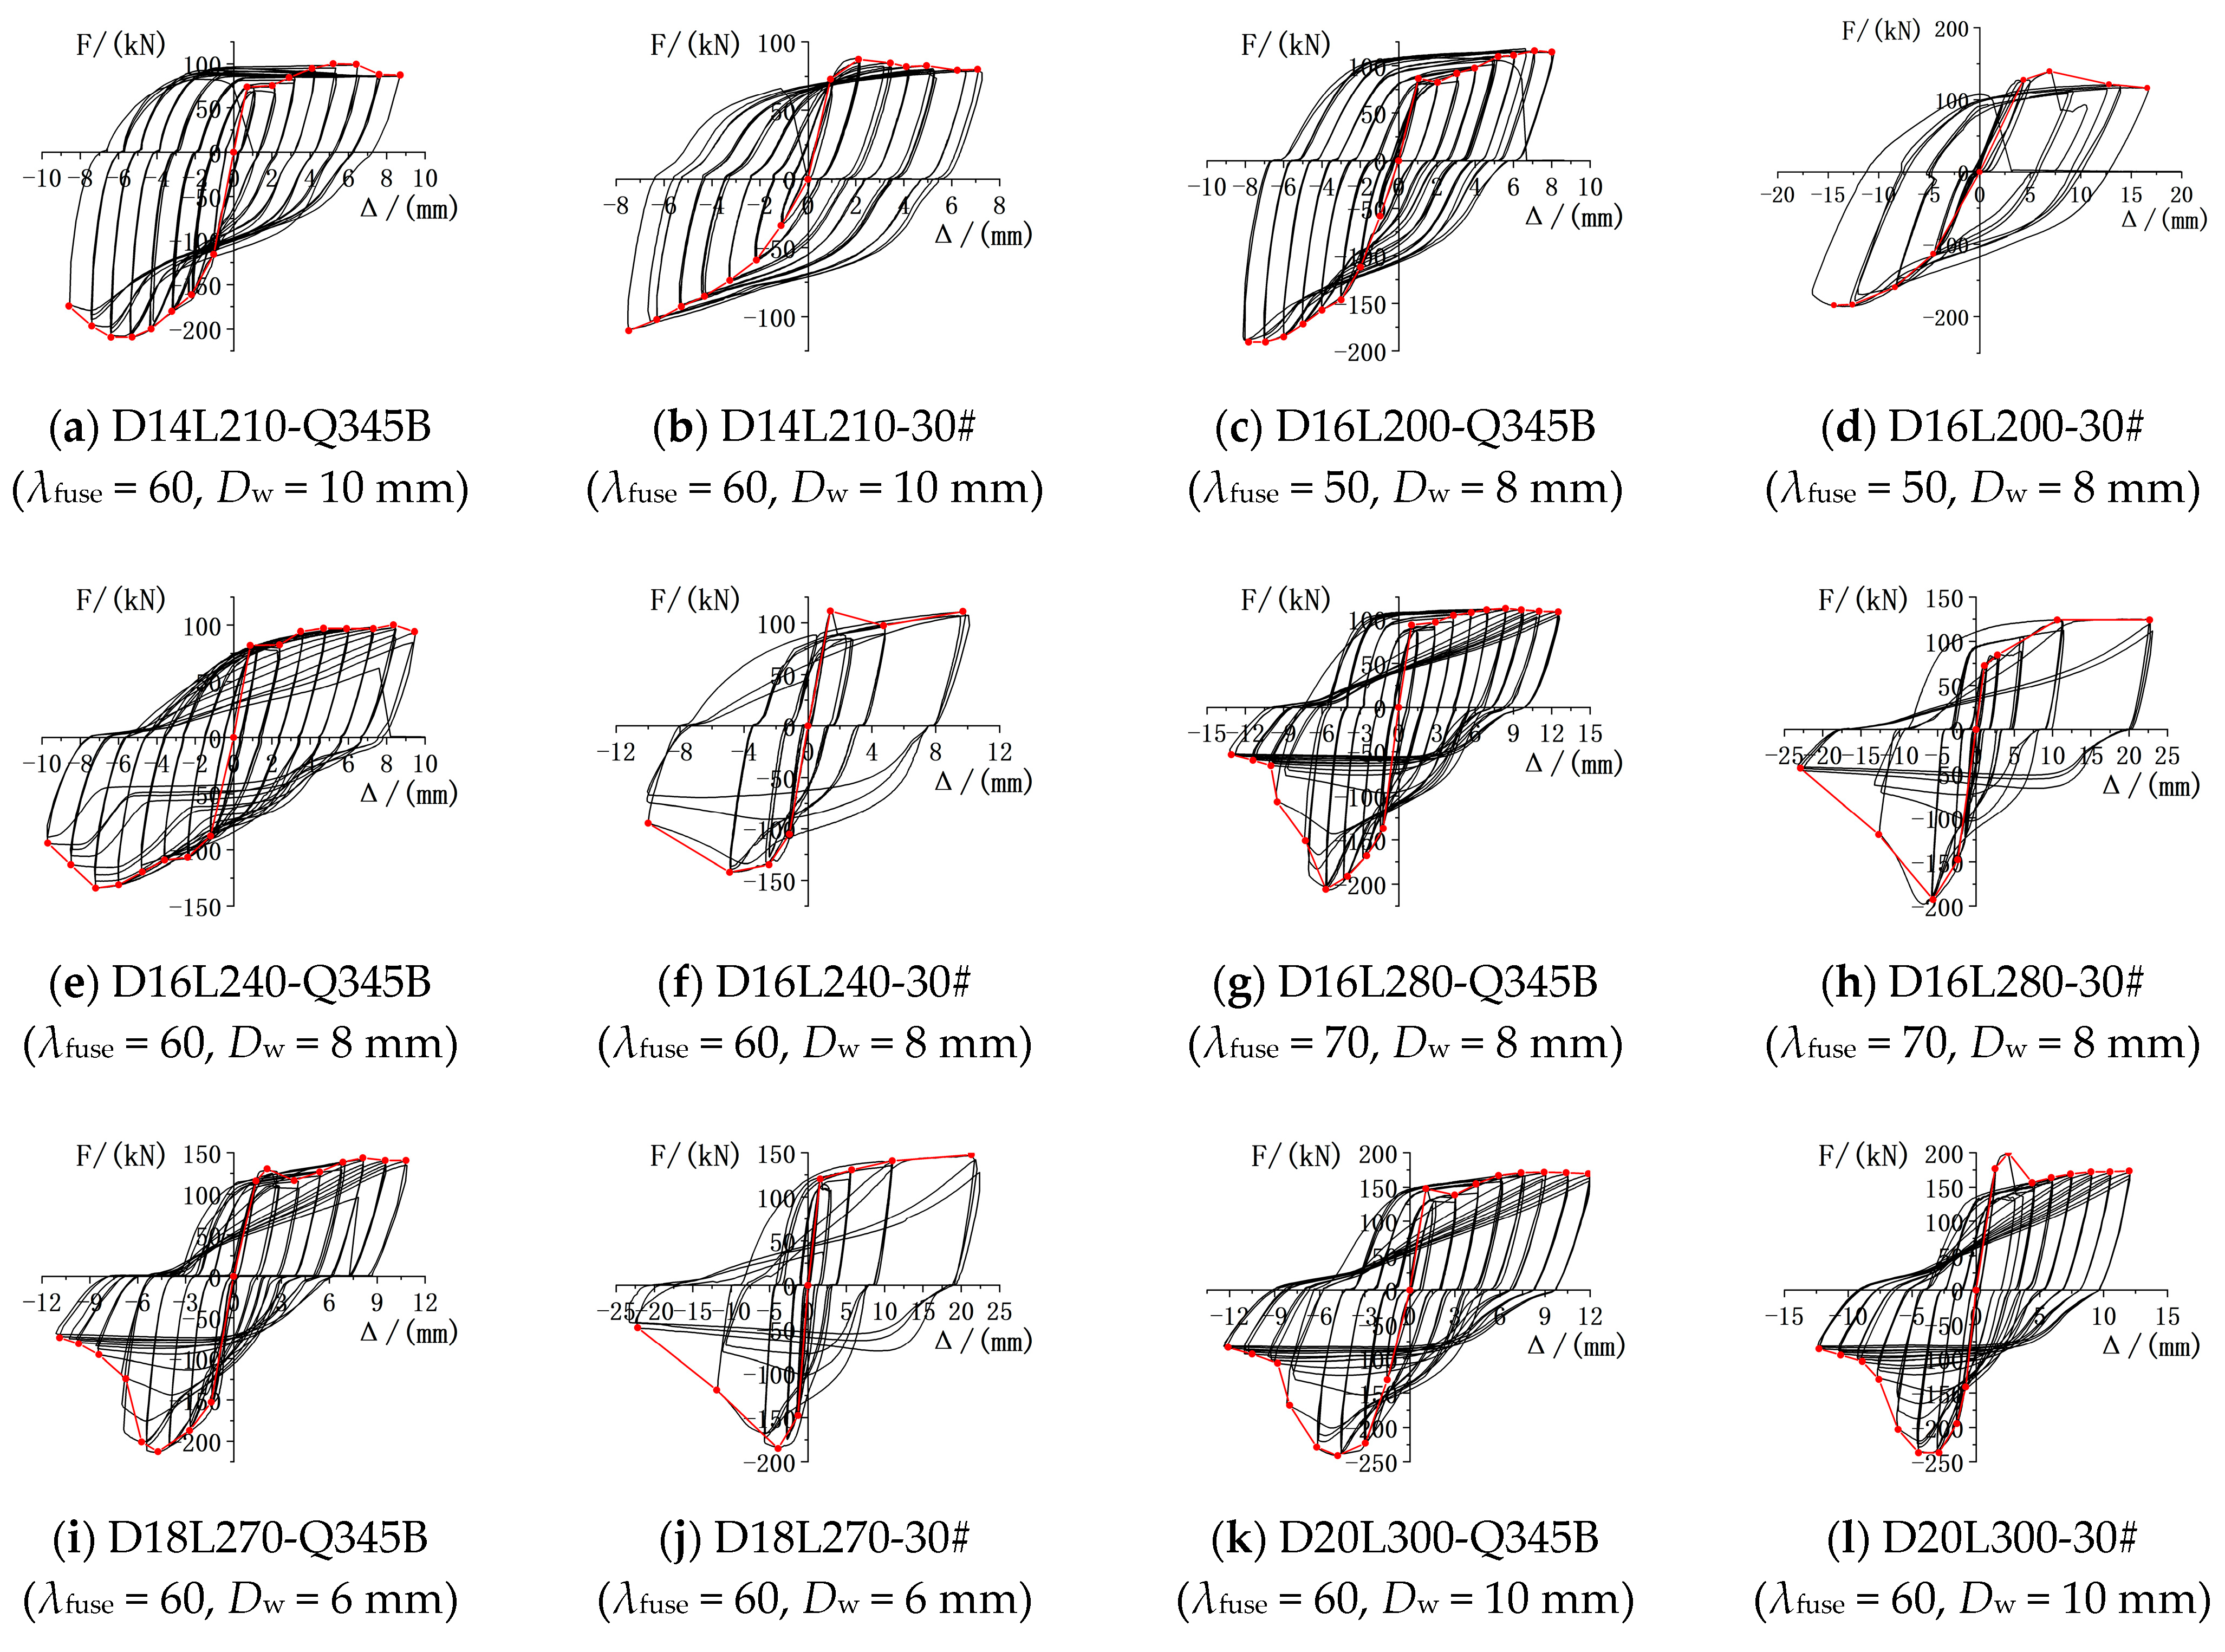
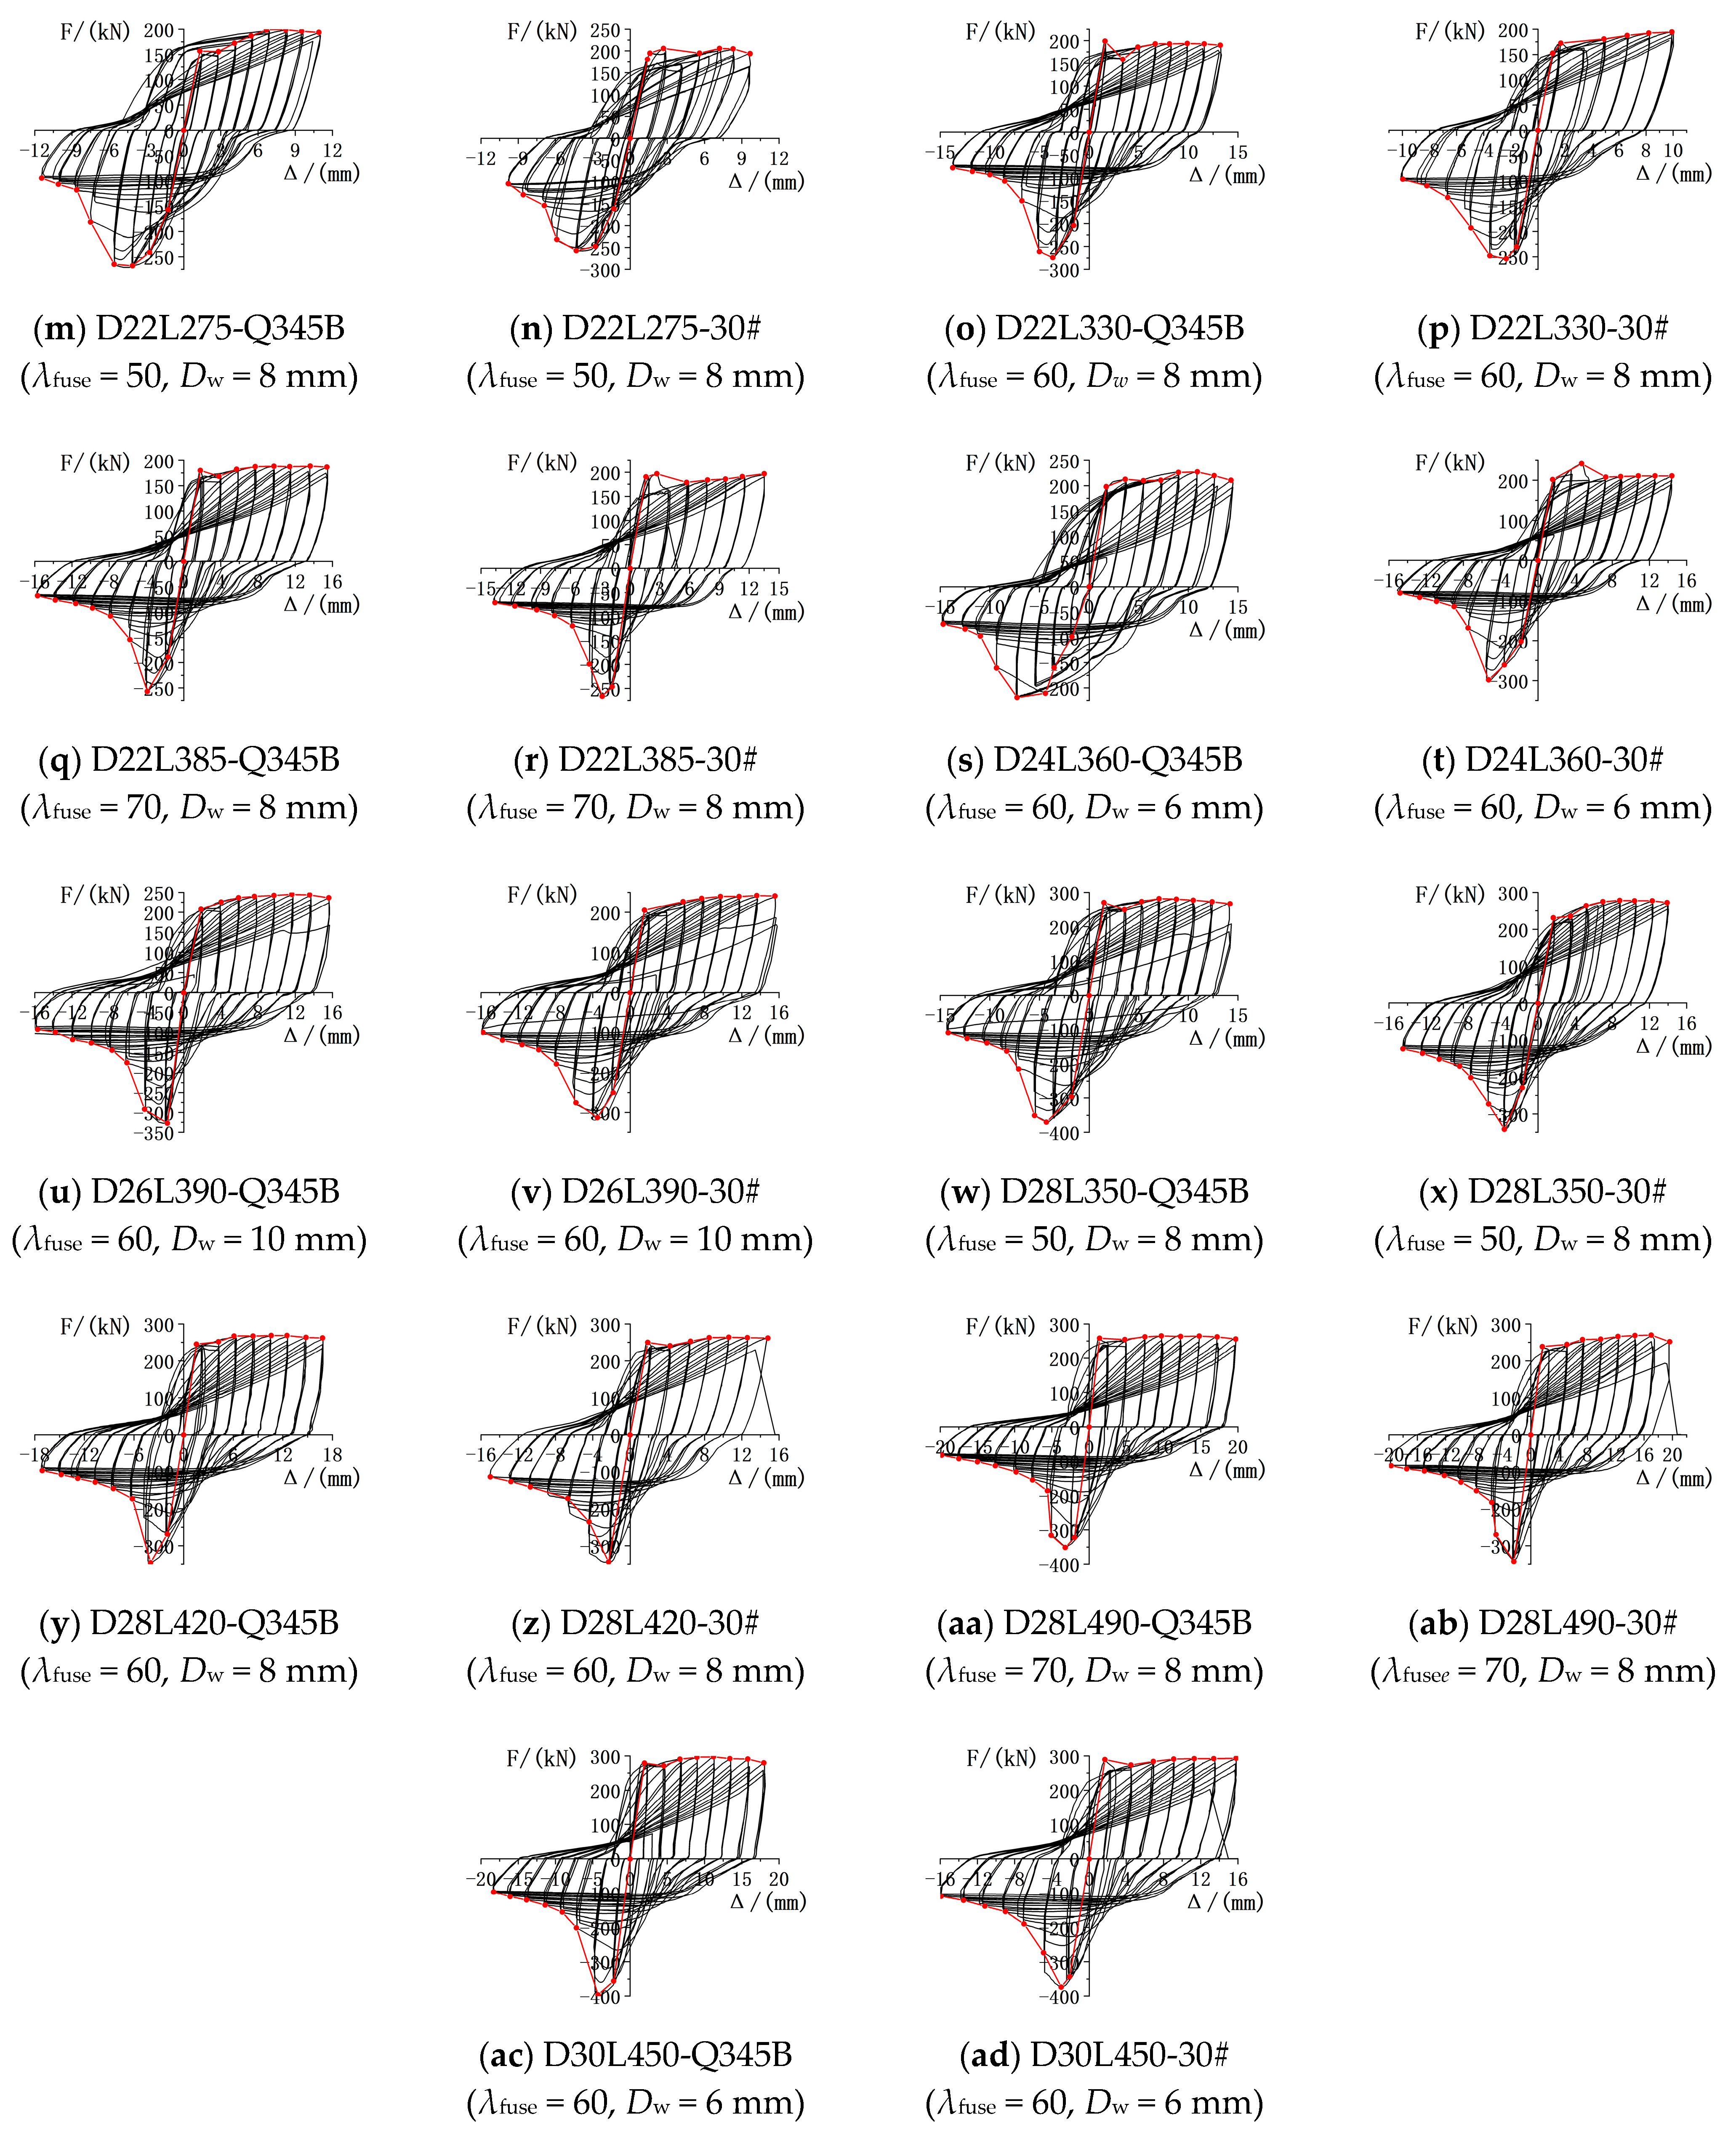
2.5.1. Hysteresis Curve

The displacement and load data for each specimen were extracted and used to plot the corresponding hysteresis curves, as illustrated in Figure 7. By calculating the equivalent viscous damping coefficient for each hysteresis curve, comparison figures of all specimens were drawn, as illustrated in Figure 8.
Q345 (low-alloy steel) provides superior cyclic ductility (uniform elongation > 20%) and strain-hardening capacity, enabling stable hysteretic behavior under seismic loads. The 30# steel (medium-carbon steel) delivers higher yield strength and fatigue resistance, optimizing energy absorption in high-stress zones where localized yielding prevents premature fracture. A comparison of the hysteresis curves and the equivalent viscous damping coefficients for all specimens reveals that specimens utilizing Q345B steel bars exhibit fuller hysteresis loops and superior energy dissipation capacity than those made with 30# steel due to its low yield strength. But some curves in the compression region did not have defined maxima, and the reason is that a few specimens exhibited fractures at the threaded section or axial low-cycle fatigue led to fracture at the end of the weakened segment. As shown in Figure 7, under the same degree of weakening in the internal steel bars, a lower slenderness ratio corresponds to a fuller hysteresis curve. In contrast, when the slenderness ratio remains constant, an increased degree of weakening results in a more pronounced hysteretic response. For composite steel bars with larger diameters, variations in slenderness ratio and weakening degree have a relatively minor effect on the hysteresis behavior. Therefore, for composite bars with smaller diameters, the design should focus on optimizing the diameter reduction and slenderness ratio of the weakened section.

2.5.2. Displacement Ductility

According to the data presented in Table 4, the displacement ductility generally ranges between 2.1 and 6.6, while the small tensile ductility coefficient is due to the large yield displacement and small maximum displacement of individual specimens, or a large decline after reaching the peak load under tension; the general small compressive ductility coefficient is due to the buckling instability of composite steel bars when reaching the peak load under compression, and the load drops sharply. The tensile ductility of the composite steel bars is superior to their compressive ductility, demonstrating both their deformation performance and their resistance to compression, which aligns with the intended design objectives. The data also reveal that, overall, the tensile ductility of the composite steel bars increases with the diameter of the energy-dissipation segment. However, within each group, the ductility coefficient is influenced by parameters such as the effective slenderness ratio λtot and the Dex/Dfuse ratio. Therefore, controlling the diameter of the energy dissipation segment is an effective approach to enhancing the displacement ductility of the composite steel bars.

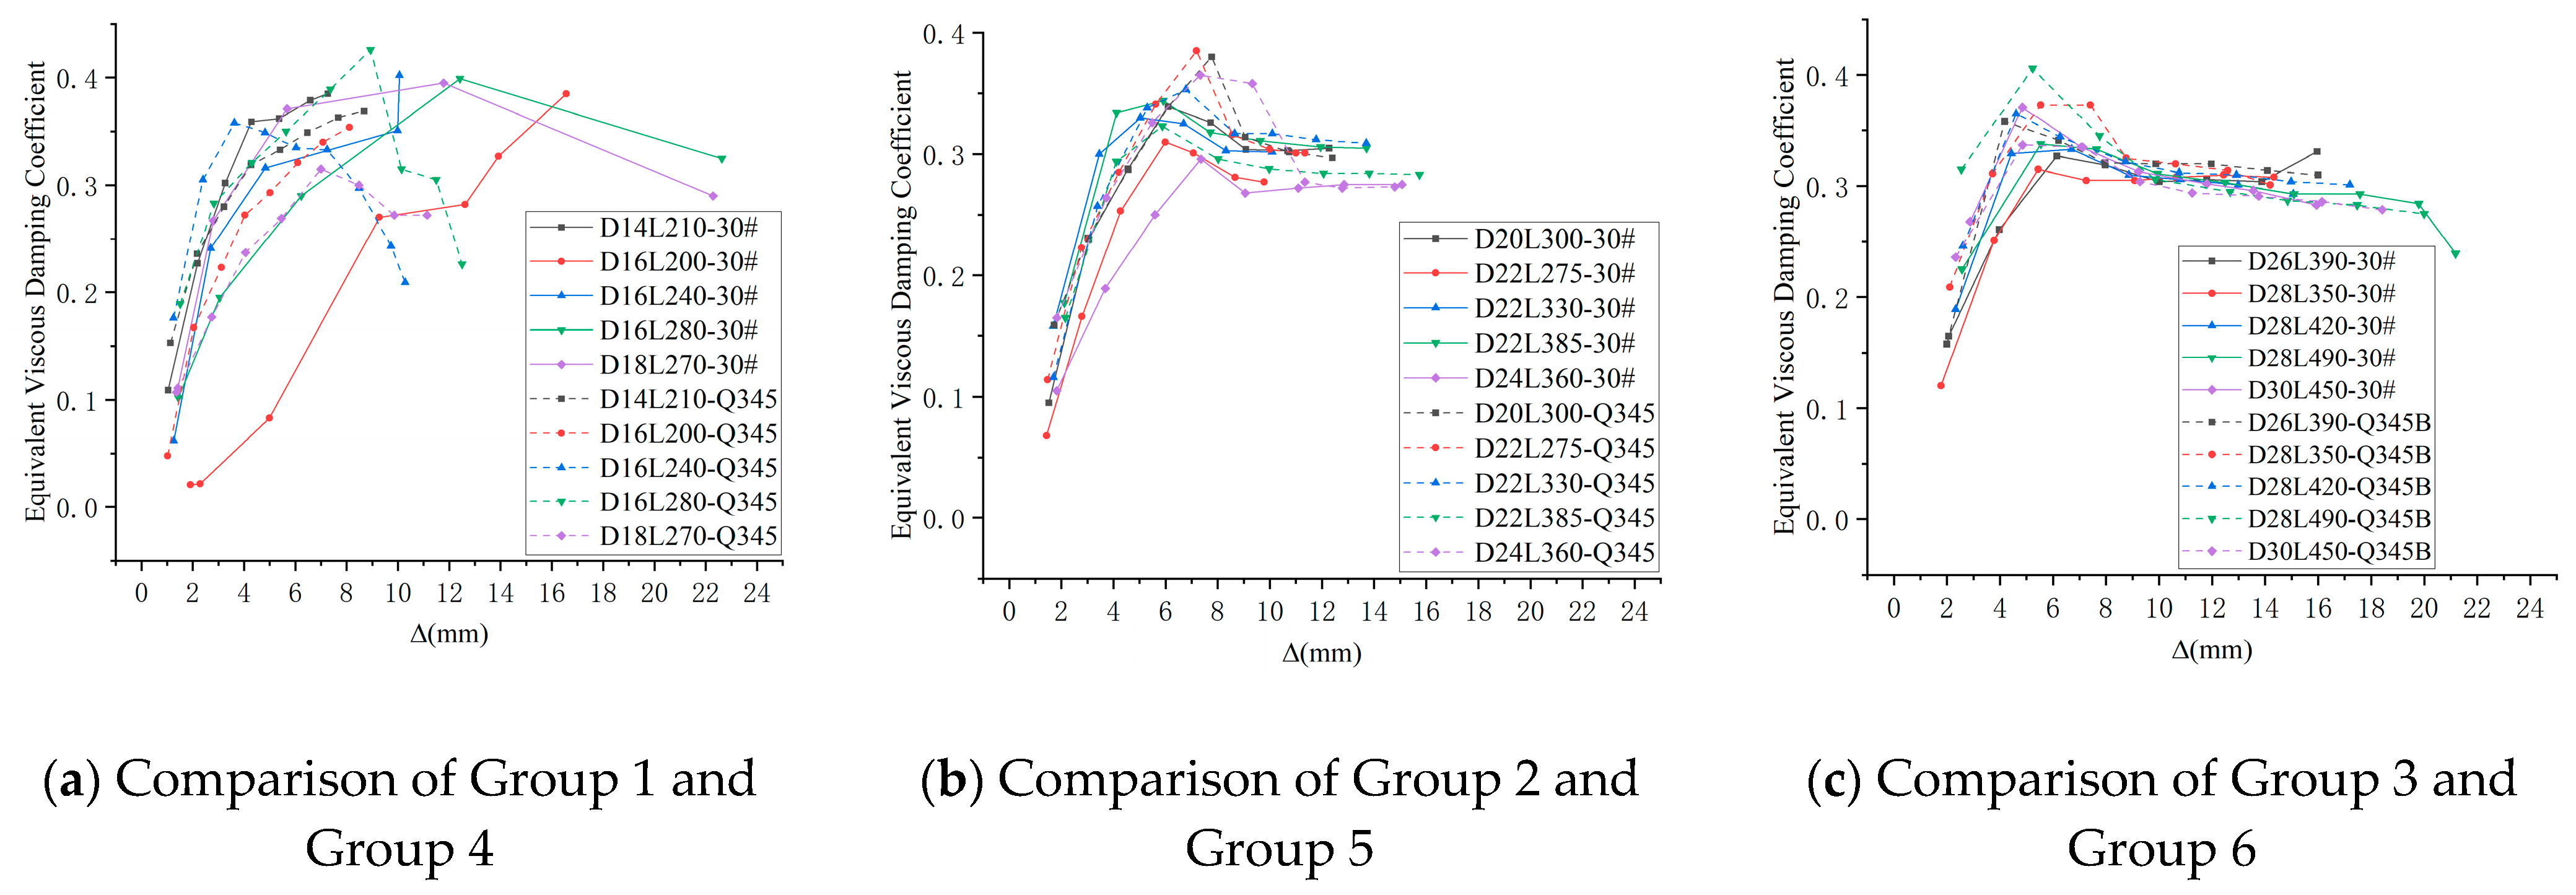
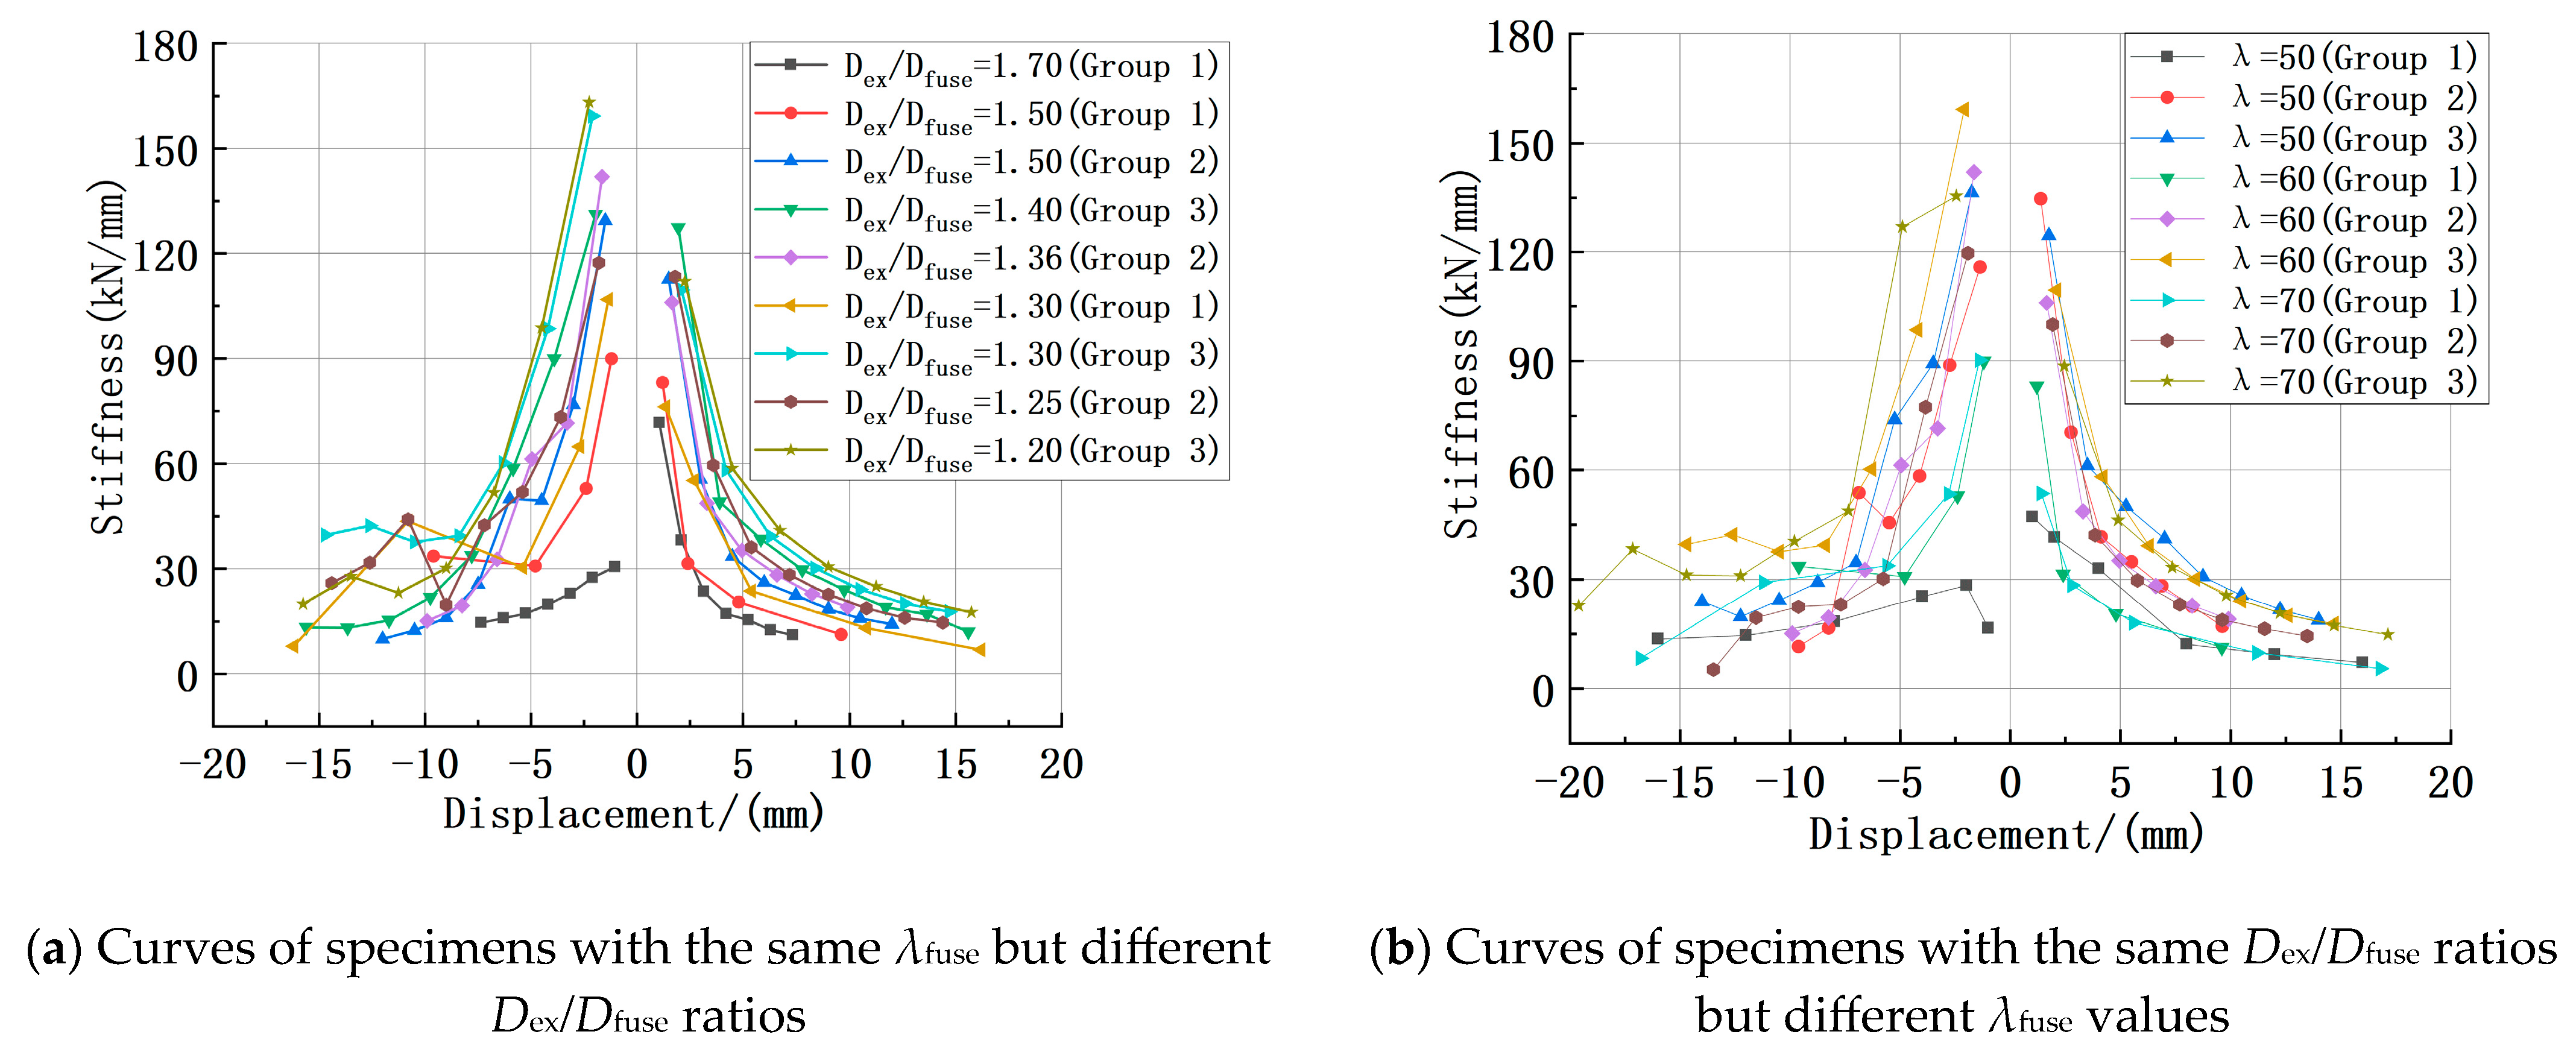
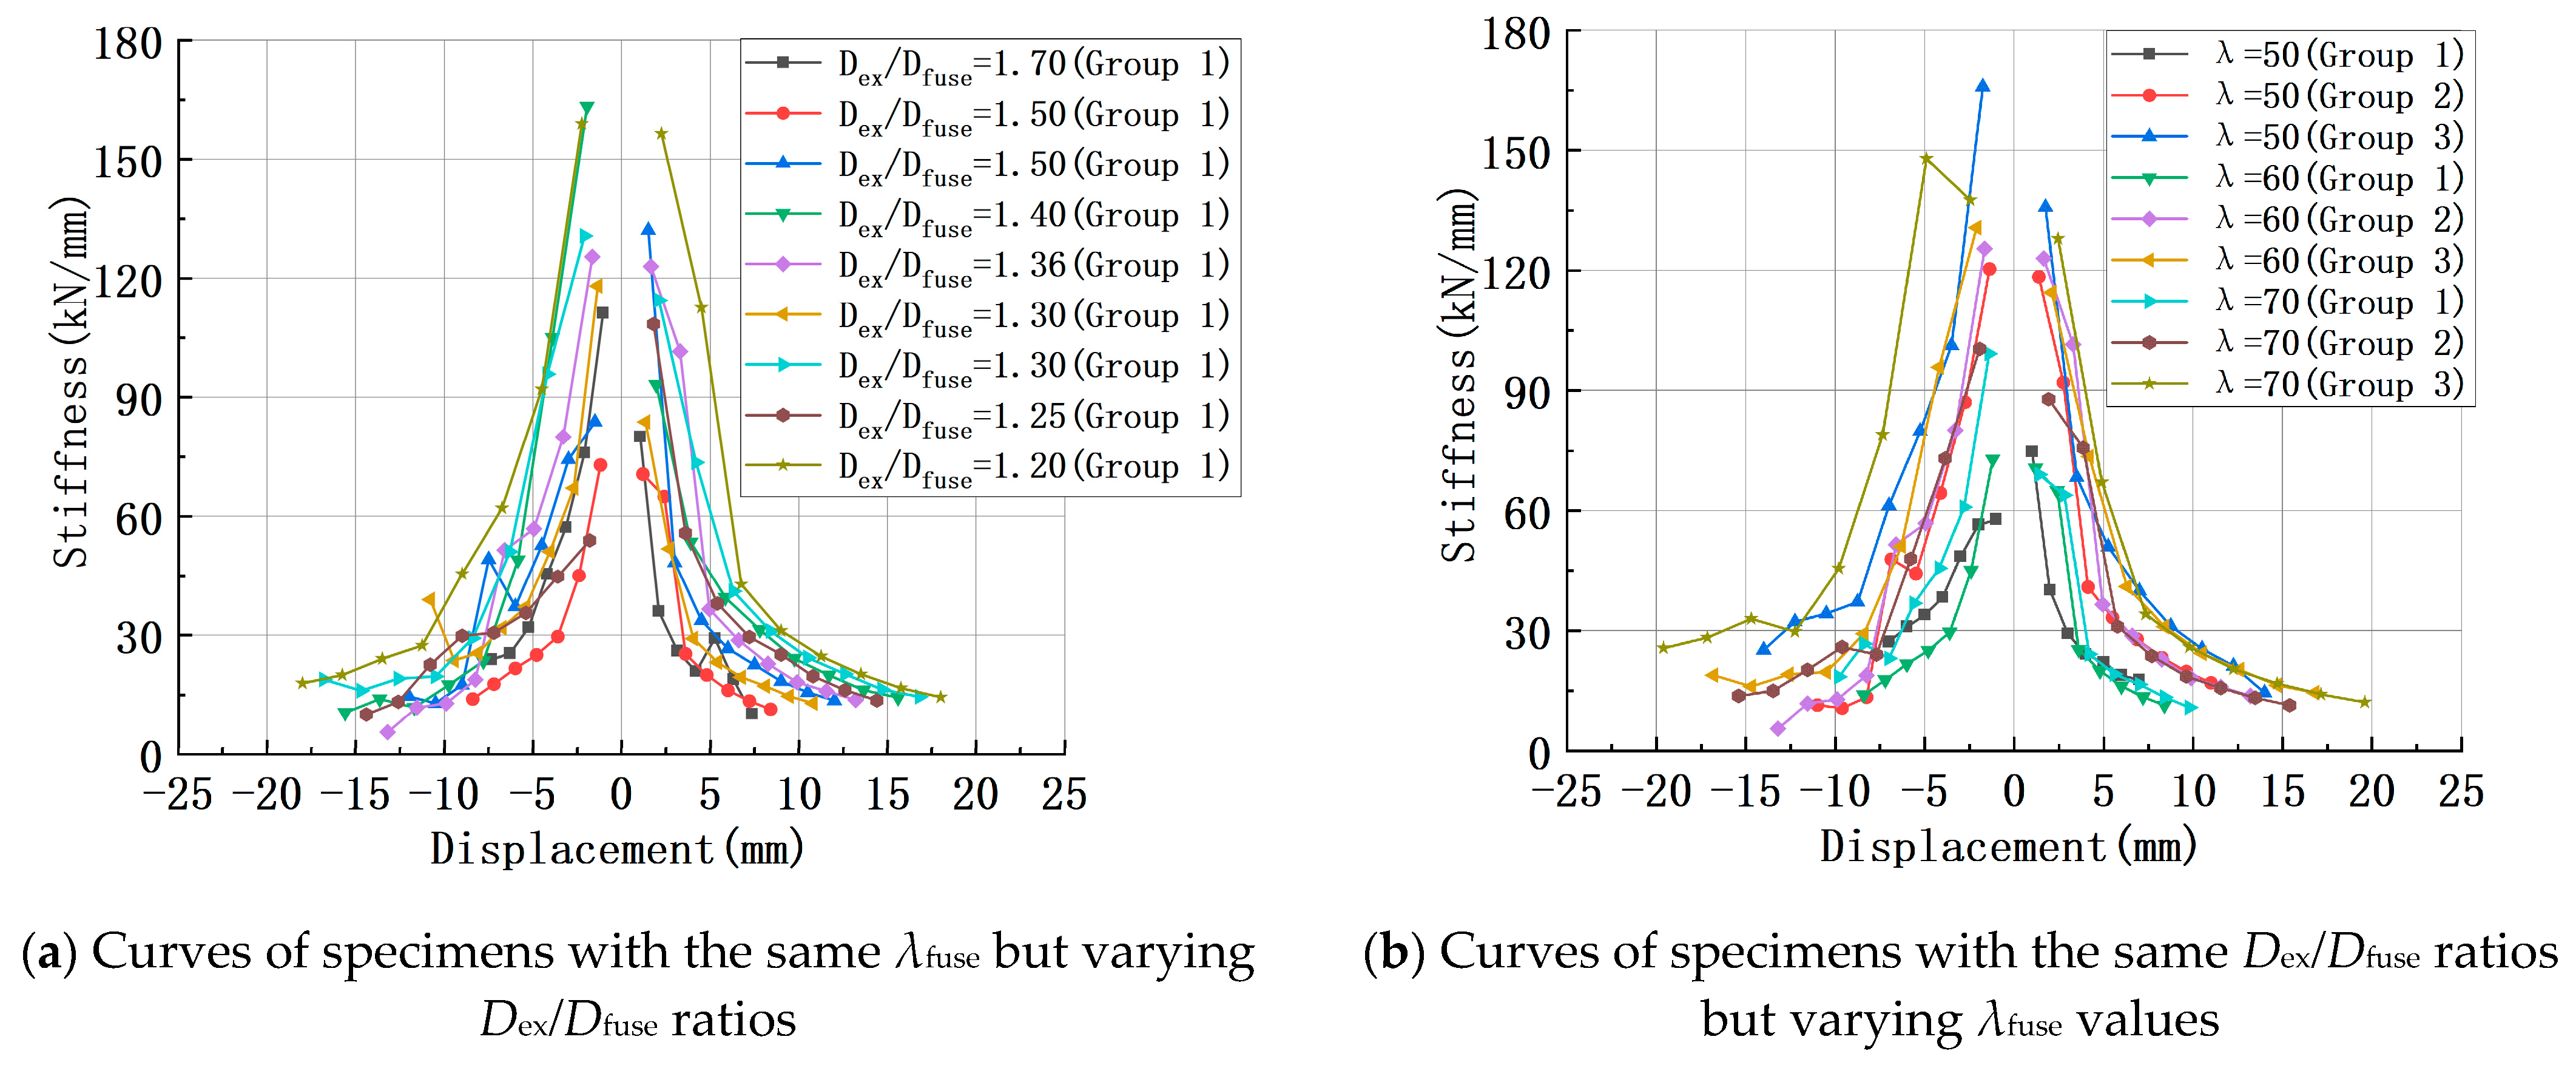
2.5.3. Stiffness Degradation

The degree of stiffness degradation of the composite steel bars can be evaluated using the secant stiffness derived from the skeleton curves. The calculation formula is presented in Equation (3), where Xi represents the peak displacement, Fi denotes the corresponding peak load, and Ki is the secant stiffness. The stiffness degradation behavior of the 30 specimens is illustrated in Figure 9 and Figure 10, with the positive and negative stiffness values calculated separately.
K i = + F i + F i + X i + X i ,
As shown in Figure 9 and Figure 10, the stiffness degradation trends of the specimens are generally consistent. In some cases, stiffness increases slightly with the rise in the fundamental slenderness ratio and the diameter ratio between the steel bar ends and the weakened segment. However, the magnitude of stiffness improvement remains limited, indicating that these parameters have a minimal influence on the overall stiffness of the specimens.
By integrating the results from Figure 7, Figure 8, Figure 9 and Figure 10, it can be concluded that when the fundamental slenderness ratio λfuse of the composite steel bar lies within the range of 60~70 (λtot = 24.0~51.0), and the diameter ratio Dex/Dfuse ranges from 1.2 to 1.5, the specimen is likely to exhibit a buckling failure mode, with stable and desirable deformation performance.

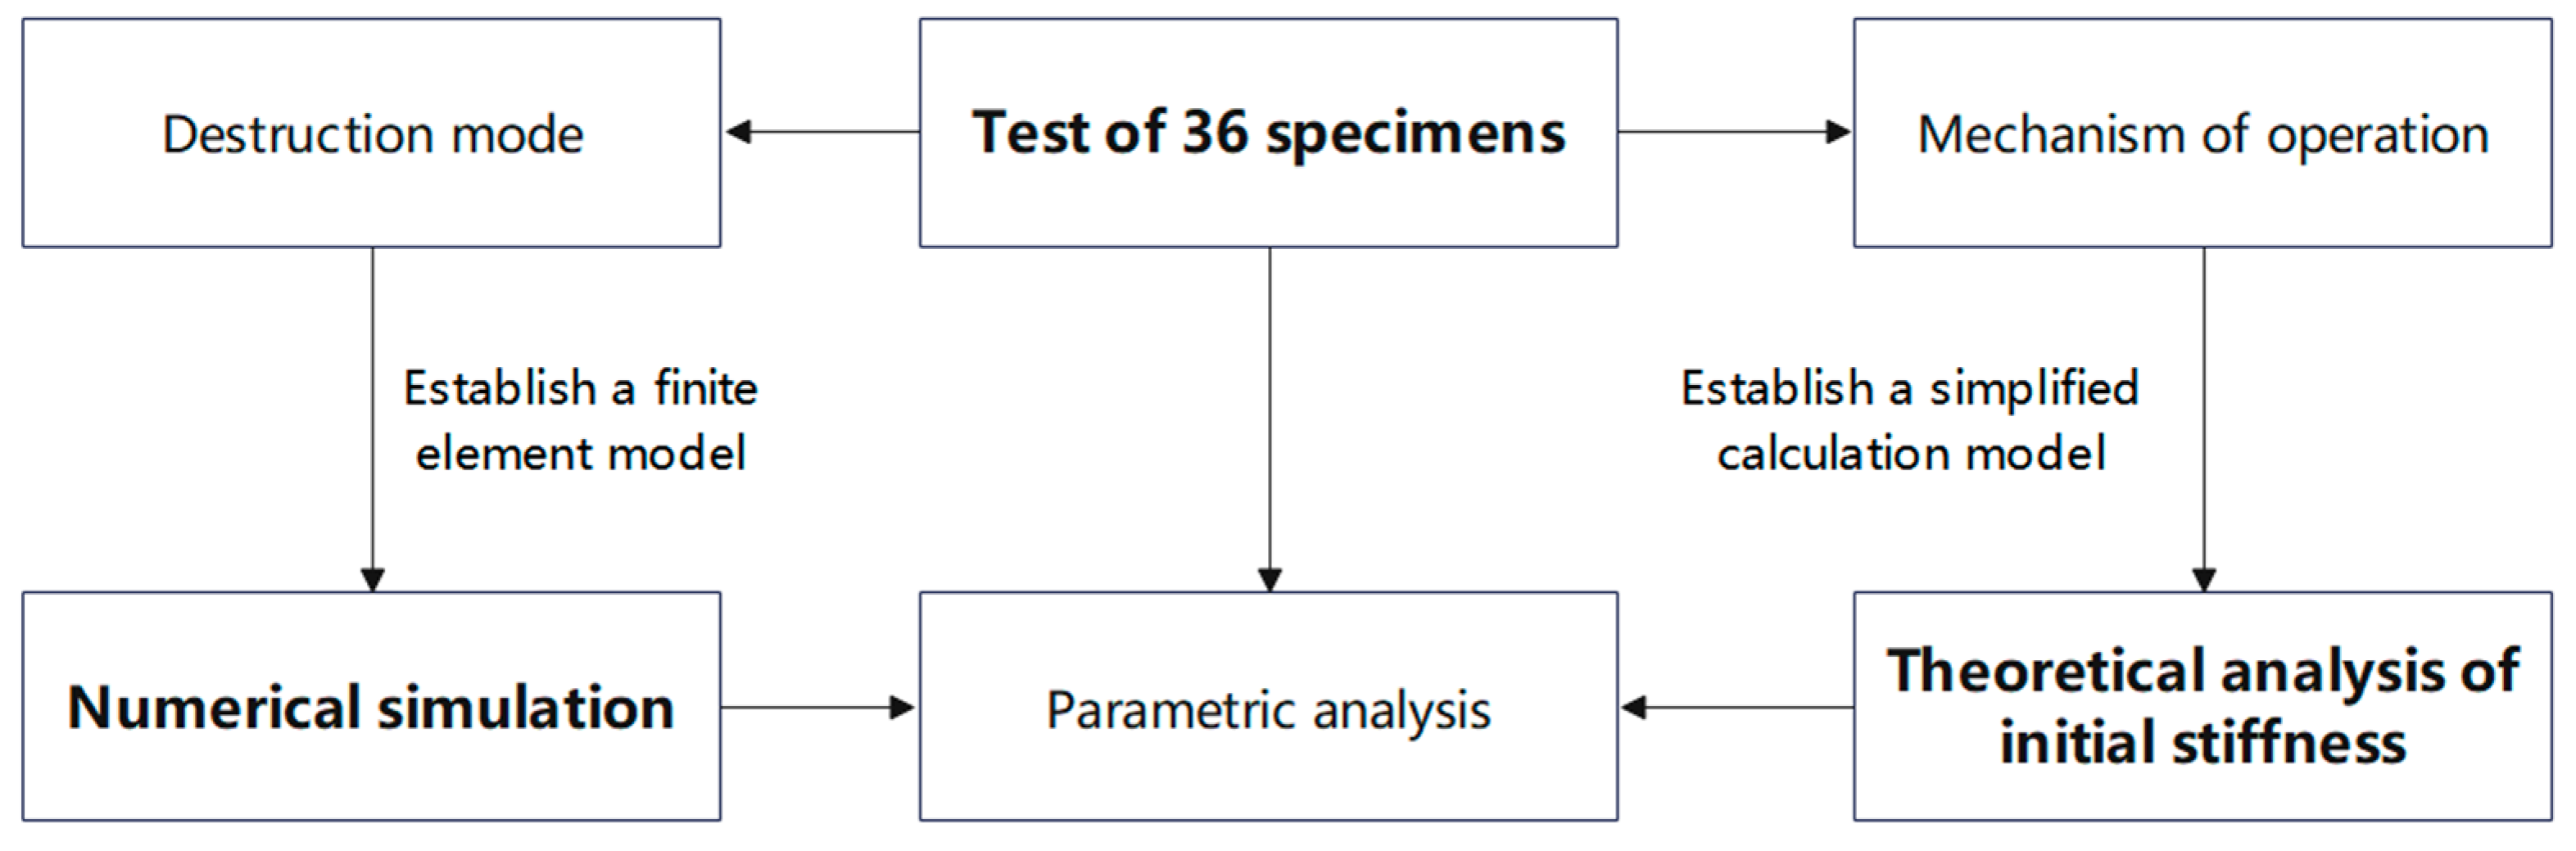
3. Numerical Simulation of External Composite Steel Bars

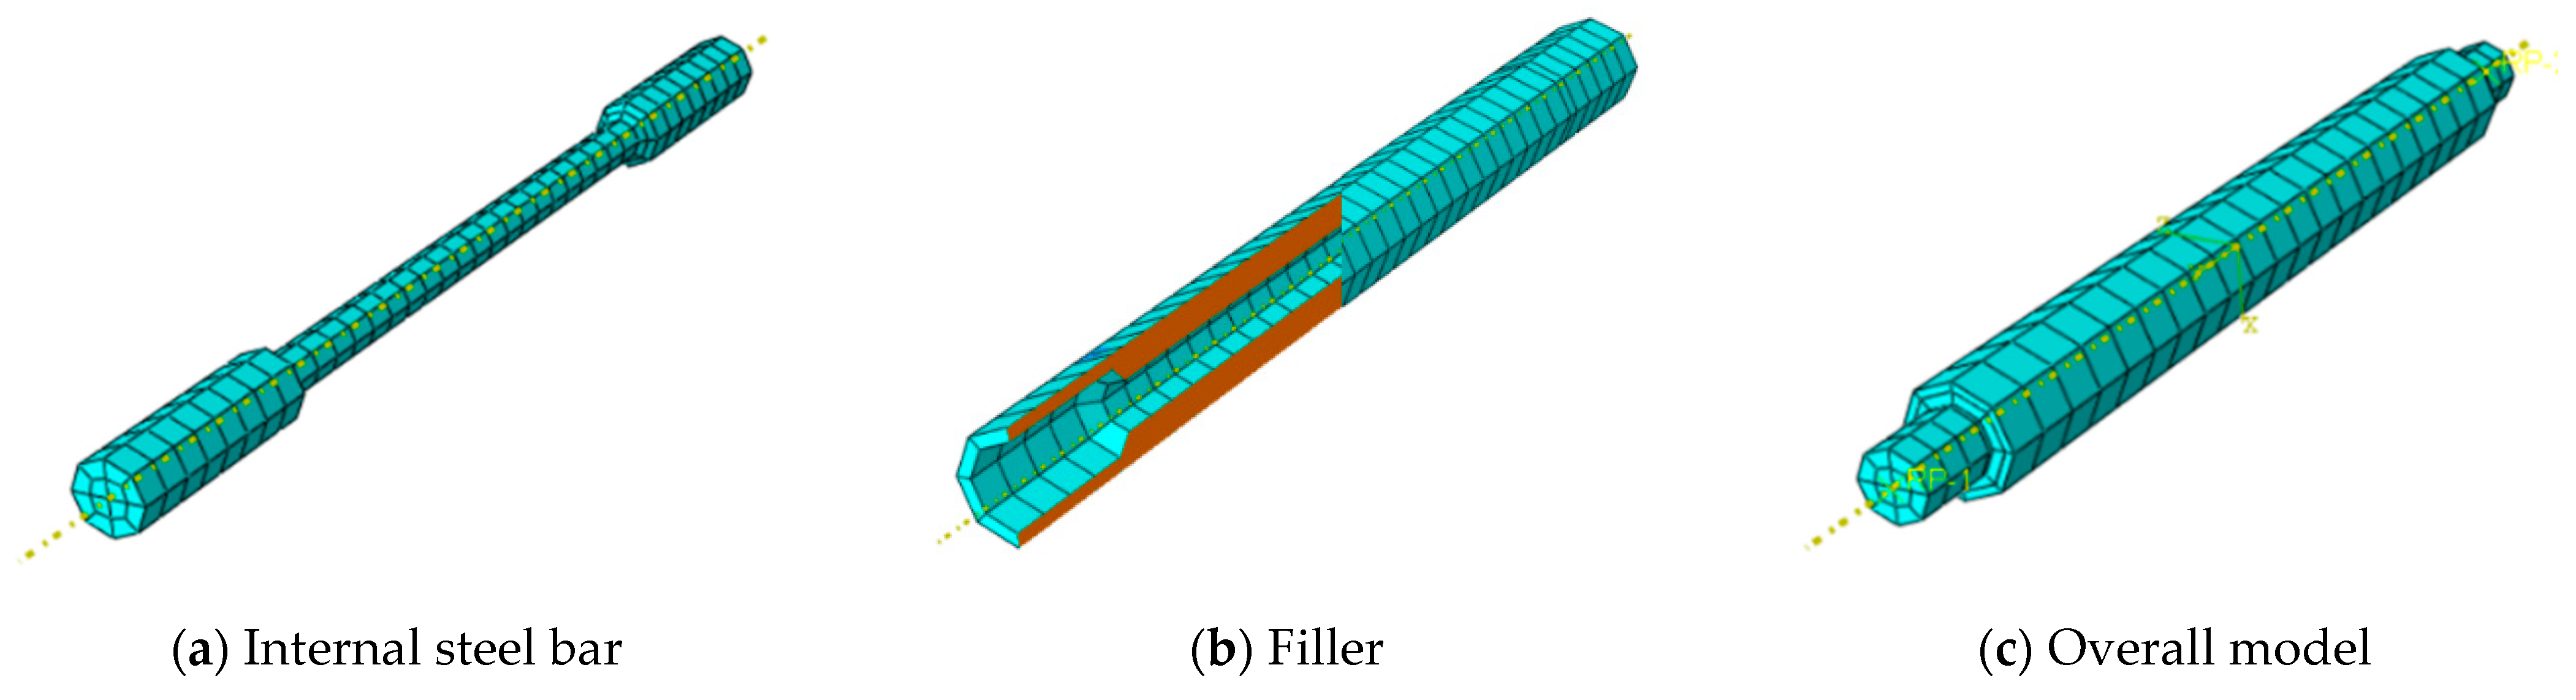
3.1. Model Establishment

The internal steel bars of the composite steel bars were composed of two materials: Q345B steel and 30# steel. The constitutive behavior of the materials was modeled using a bilinear kinematic hardening model, with yield strengths derived from the parameters presented in Table 3. Following the method for calculating the mechanical properties of epoxy resin outlined in the literature [29], the properties and applications of the E-44 epoxy resin material were similar to those discussed in the referenced studies. Consequently, the Johnson–Cook plasticity model [30,31,32] and strain hardening (Hurdenuny) [33] described for composite material properties, was comprehensively implemented to characterize the yield behavior of the epoxy resin. The composite steel bar was simulated using solid elements, with the internal steel bars, filled epoxy resin, and external steel tube all modeled using eight-node linear hexahedral elements (C3D8R). The mesh division of the finite element model is shown in Figure 11.
Because the epoxy resin adheres to the confined steel pipe and the bonding surface with the steel rod peels off when the specimen is broken, the internal steel bars and epoxy resin were modeled with surface-to-surface contact, with a friction coefficient of 0.4, and a tie constraint was set between the external steel tube and the epoxy resin. Following the experimental loading method, the upper end of the internal steel bar was assigned as the loading end, and the lower end as the fixed end. Two characteristic points, reference points (RP-1 and RP-2), were defined at the centroidal axes of cross-sections of the loading and fixed ends, respectively, to facilitate the application of boundary conditions and displacement loading.

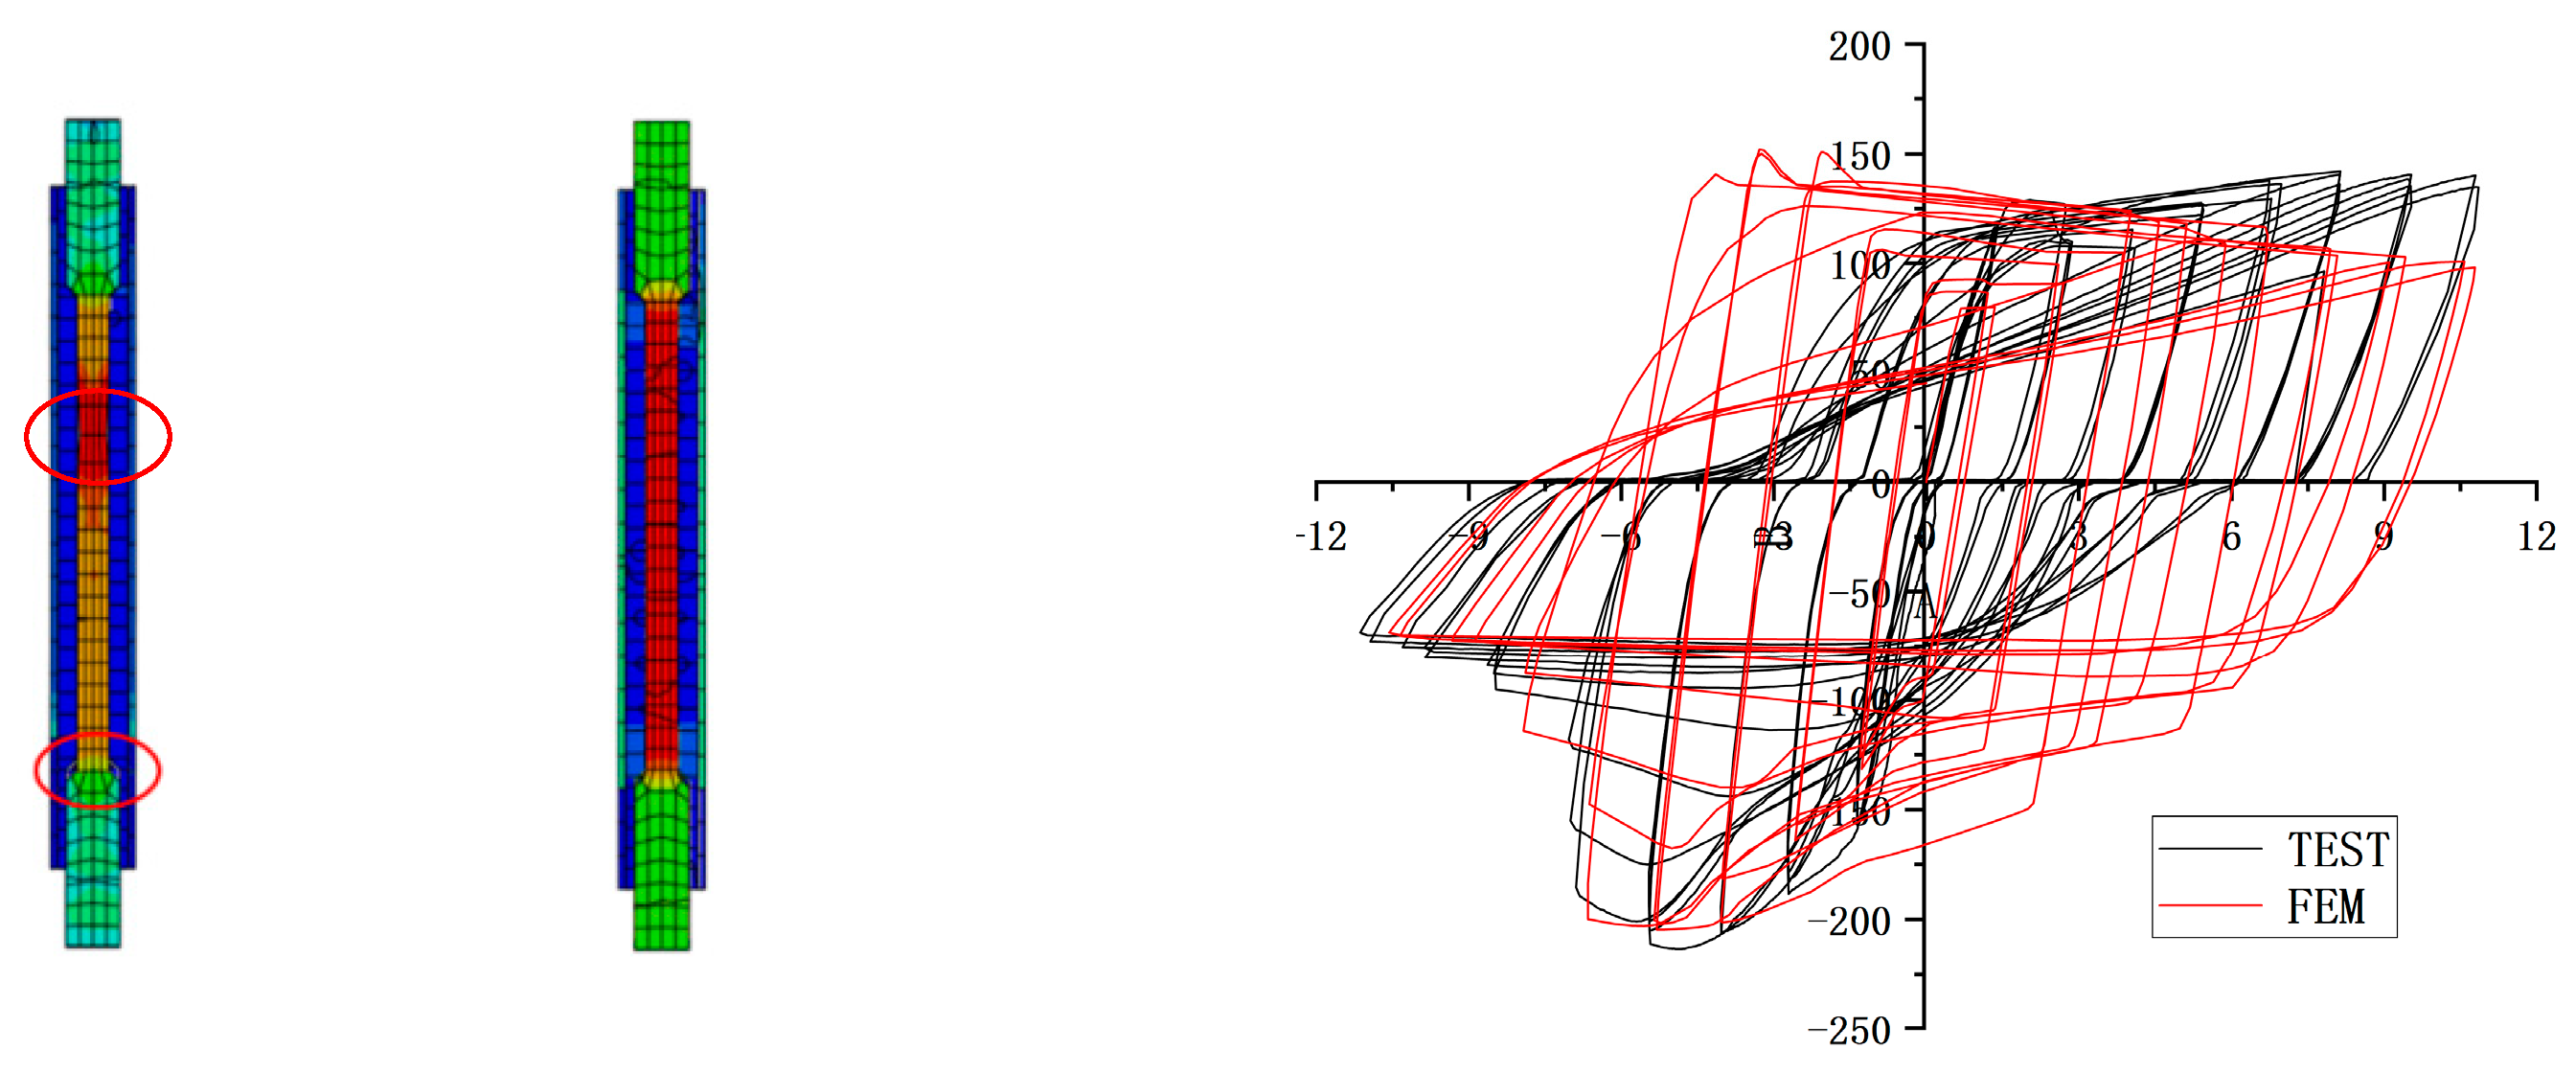
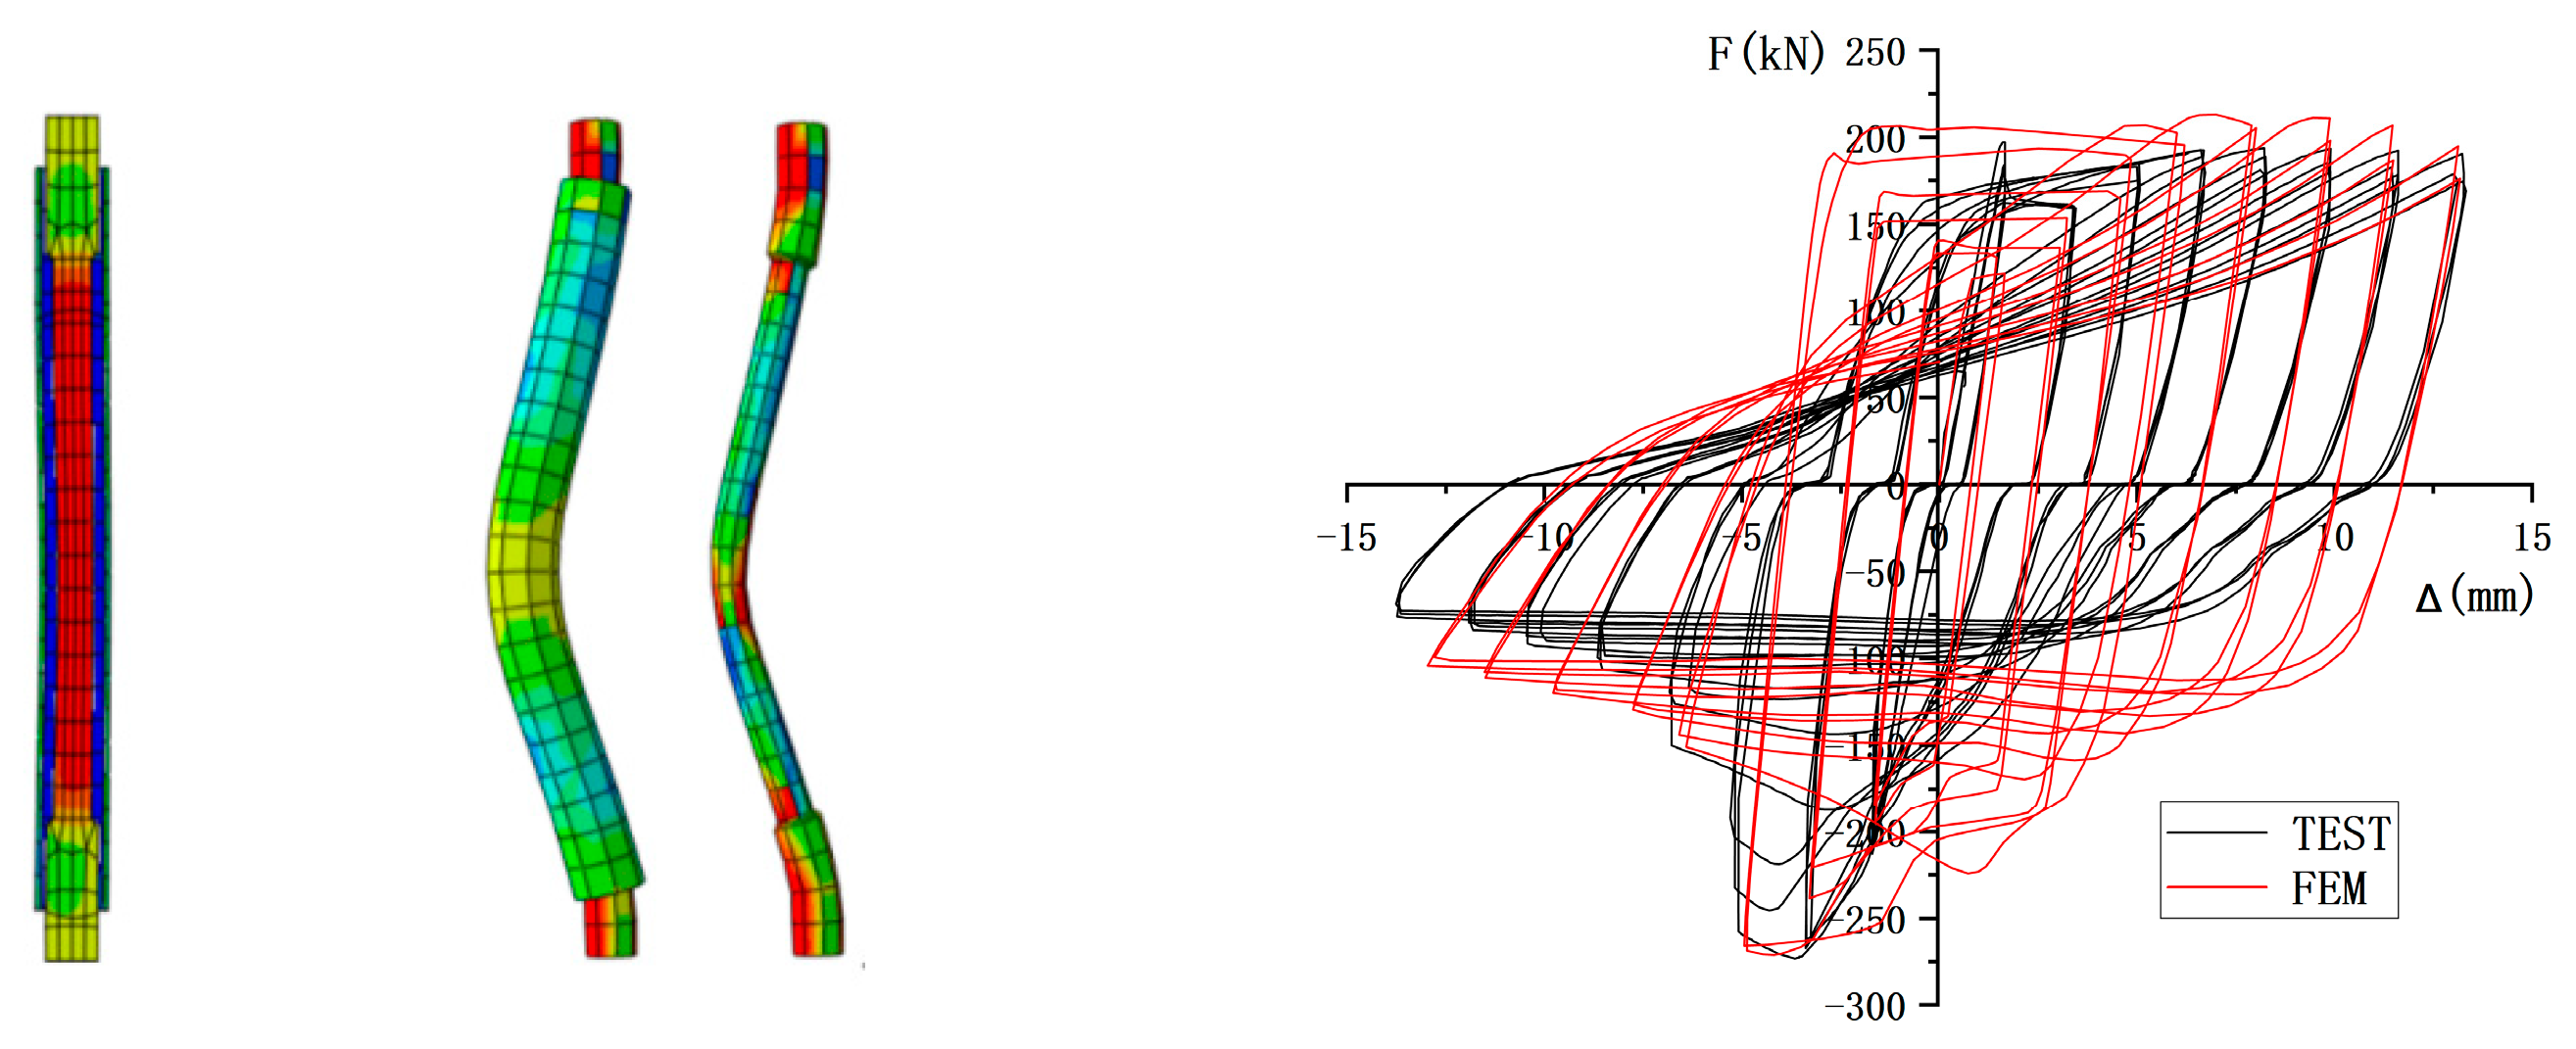
3.2. Finite Element Analysis Results

The finite element analysis results indicated that the 30 composite steel bar specimens exhibited failure modes consistent with the corresponding experimental observations. The numerical simulation revealed two distinct failure mechanisms for the specimens.
Taking specimen D18L270-Q345B as an example, as illustrated in Figure 12, no significant bending was observed at the yielding stage, and the load-bearing capacity continued to increase with the development of plastic deformation. Upon reaching the peak load, noticeable necking occurred in the weakened section of the internal steel bar, where the stress concentration was highest. An interfacial debonding was observed between the epoxy resin and the steel bar at the diameter transition near the fixed end. As shown in Figure 12, the reduction in contact area between the steel bar and the filler led to a weakened confinement effect from the epoxy resin and the steel tube. Consequently, the tensile capacity began to decline after reaching its peak due to the reduction in constraint.
For specimen D22L330-Q345B, as shown in Figure 13, the specimen remained in the elastic stage under small displacement loading. As the displacement increased, it entered the yielding phase, exhibiting both plastic deformation and lateral bending. Localized necking was observed at the most severely bent section of the weakened area, and both threaded ends of the steel bar underwent similar bending deformation. The stress was greatest at the point of maximum curvature, and a significant gap was also observed between the steel bar and the epoxy resin near the fixed end.
A comparative analysis of the hysteresis curves from both simulation and experimental results in Figure 12 and Figure 13 indicated that the energy dissipation capacity of the specimens was substantial, with 1% difference in peak loads closely matching, and curve trends showing high agreement. Other parameters also demonstrated good consistency, and the discrepancies fell within an acceptable range. The specimens began to yield at relatively small displacements, suggesting that in self-centering structures, they can initiate deformation earlier than other components, thereby effectively protecting the main structural members.

3.3. Parametric Numerical Analysis

3.3.1. Comparison of Materials of Steel Bars

The comparative results for the ultimate bearing capacity and stiffness of all specimens are presented in Figure 14 and Figure 15.
The analysis revealed that the differences between the composite steel bars made of Q345B and 30# steel were primarily manifested in the variations in load-bearing capacity and stiffness. As shown in Figure 14, the tensile load-bearing capacities of the two composite steel bars were nearly identical, while the compressive strength of the specimens with Q345B steel bars was higher. This indicates that material properties exert a significant influence on the load-bearing capacity of the composite steel bars. Furthermore, Figure 15 demonstrates that the specimens with Q345B steel bars exhibited superior initial stiffness under positive displacement, whereas the specimens with 30# steel bars showed higher initial stiffness under negative displacement.

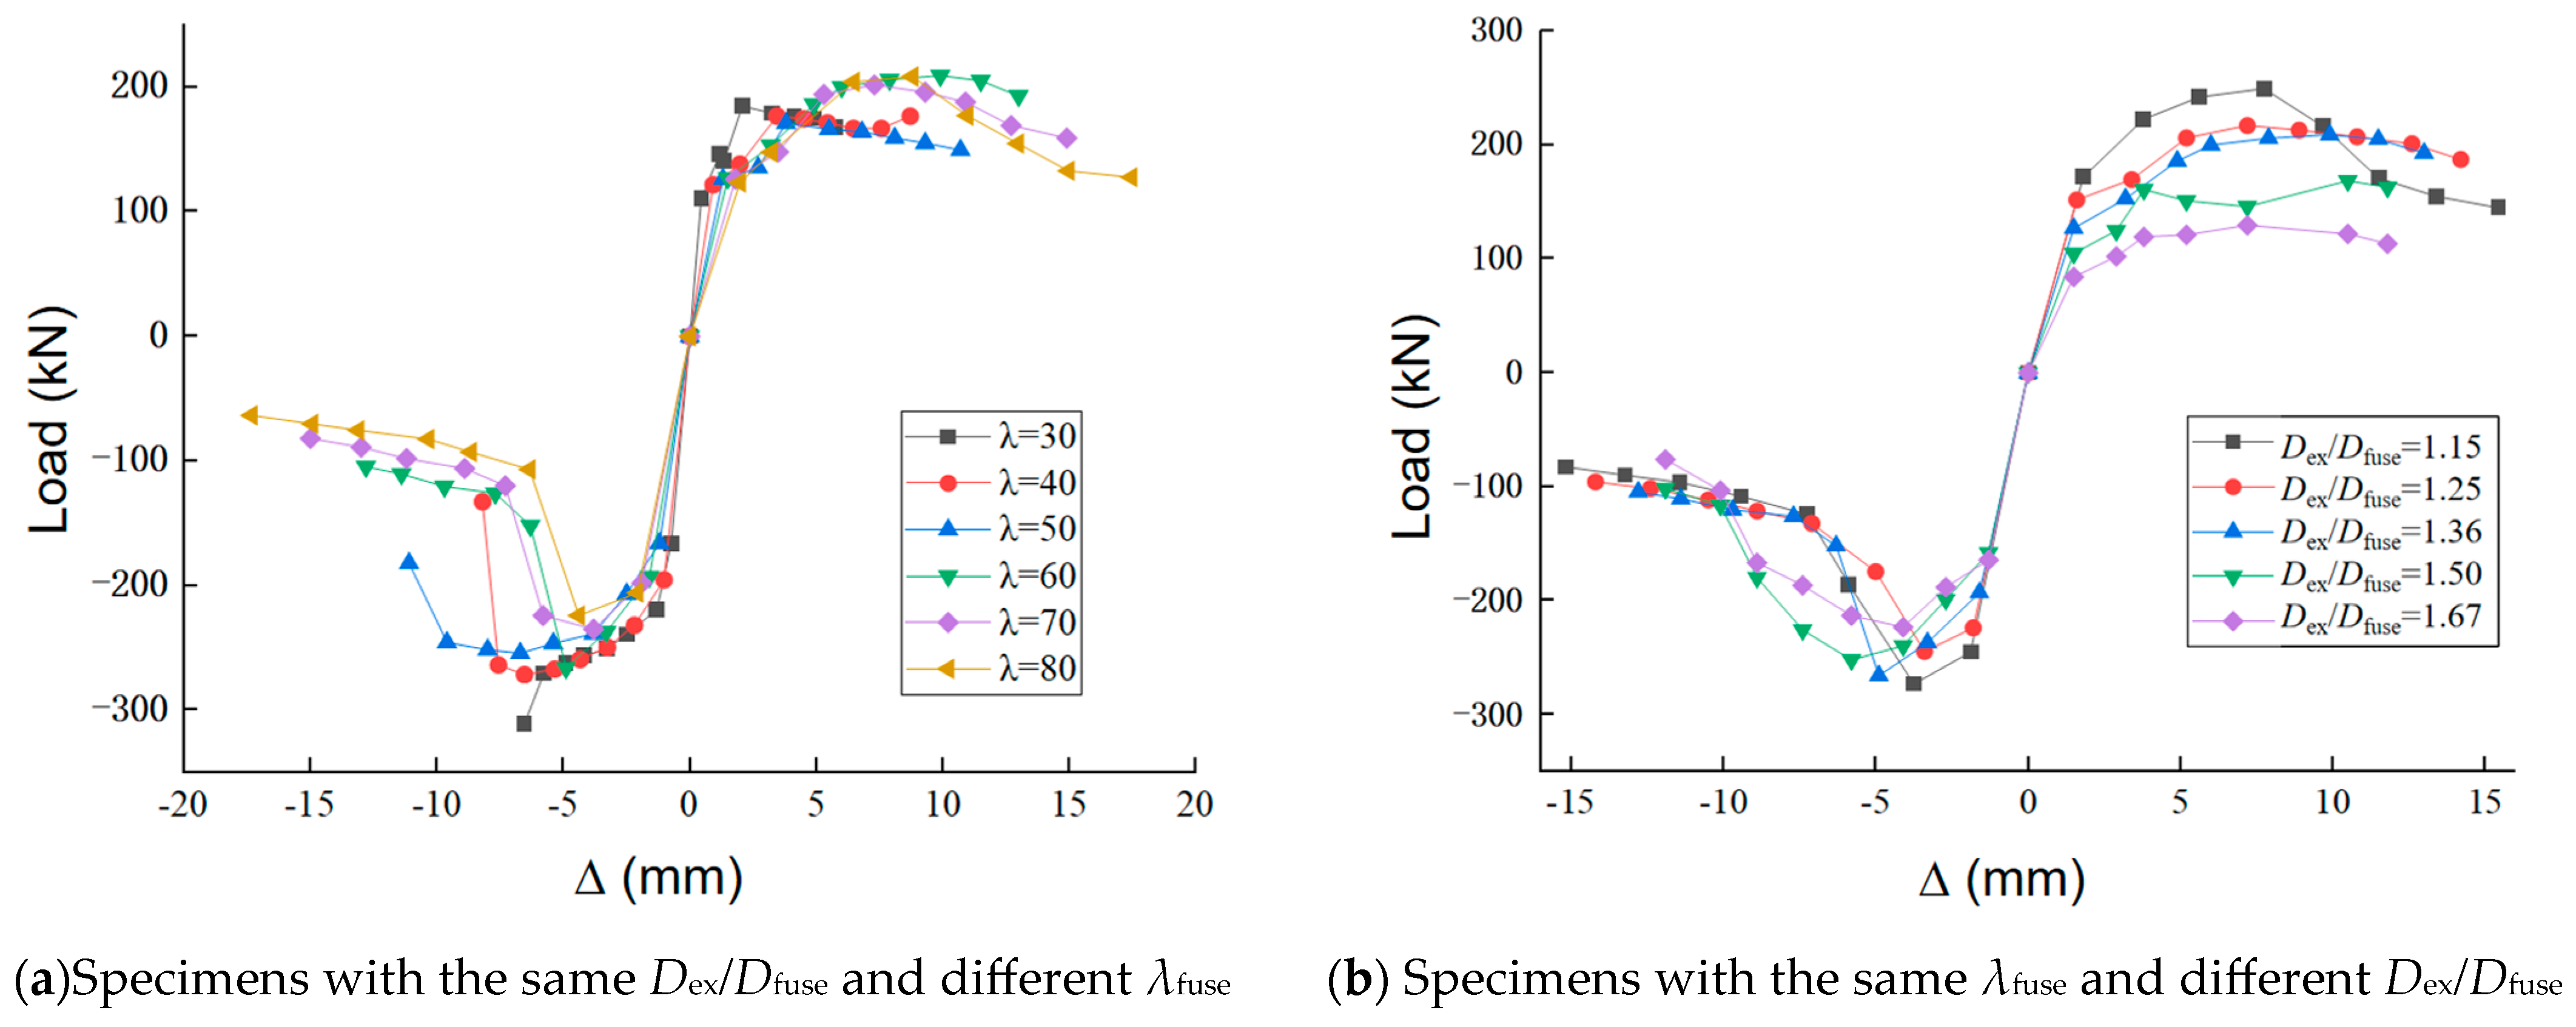
3.3.2. Slenderness Ratio of Test Specimens and Diameter Ratio of Core Steel Bar Segments

Based on the second group of specimens in the experimental study, the basic slenderness ratio λfuse and the diameter ratio of Dex/Dfuse in the core steel bars were modified, with all internal steel bars made of Q345B steel. In the parametric analysis, the specimens were categorized into two groups: the first group consisted of six specimens, where the diameter ratio of Dex/Dfuse was fixed at 1.36, with basic slenderness ratios of 30, 40, 50, 60, 70, and 80, as shown in Figure 16a; the second group comprised five specimens, where the basic slenderness ratio λfuse was held constant at 60, and the diameter ratios of Dex/Dfuse were controlled at 1.15, 1.25, 1.36, 1.50, and 1.67, as depicted in Figure 16.
Figure 16a illustrates that when the diameter ratio Dex/Dfuse was constant (1.36) and the basic slenderness ratio λfuse varied between 30 and 80, the initial stiffness of the specimens was essentially the same. However, the tensile yield displacement increased with the basic slenderness ratio λfuse, while the compressive yield displacement decreased as the basic slenderness ratio λfuse increased. Additionally, the ultimate compressive load-bearing capacity exhibited a decreasing trend.
Figure 16b demonstrates that when the basic slenderness ratio λfuse was 60 and the core steel bar weakening segment diameter ratio Dex/Dfuse varied between 1.15 and 1.67, the specimens exhibited consistent initial stiffness. During compression, a larger diameter ratio of the steel bars led to a smaller ultimate compressive capacity of the composite steel bars. However, this reduction in compressive capacity was less pronounced compared to the difference in ultimate tensile capacity observed during tension. Additionally, the yield displacement remained essentially unchanged. Overall, the optimal energy dissipation effect was observed when the basic slenderness ratio of the composite steel bars was between λfuse = 60 and 80 (λtot = 33.8~45.1), and the diameter ratio Dex/Dfuse was between 1.25 and 1.50.

4. Theoretical Calculation of the Initial Stiffness

During the elastic stage of the composite steel bars’ loading, the filler material remained intact. Based on experimental results, this study analyzed the synergistic tensile and compressive performance of each component in the composite steel bars and conducted theoretical calculations of their initial stiffness under tension and compression.
During the composite action of constituent components, the stiffness of the filler is significantly lower than that of the steel. Therefore, its role is limited to load transfer rather than bearing compressive force. Furthermore, the load transfer between the filler and both the inner steel bar and the outer steel tube occurs through shear stress. Thus, it is assumed that failure at these interfaces is governed solely by shear failure.

4.1. Theoretical Calculation of Initial Tensile Stiffness

At the initial stage of tensile loading, the epoxy resin filler, characterized by high stiffness and strong adhesion, effectively transfers the axial force borne by the steel bar, thereby enabling the outer steel tube to bear part of the tensile load. As the shear stress in the filler reaches its shear strength, shear failure progressively occurs, eventually leading to the separation of the outer steel tube from the core steel bar. Consequently, the tensile stiffness of the composite steel bar gradually decreases until the core steel bar undergoes yielding failure.
Assuming an axial tensile load F is applied at the end, the energy-dissipating segment of the steel bar and the outer steel tube share the load, denoted as F1 and F2, respectively. The schematic diagram of the force analysis is illustrated in Figure 17. The equilibrium equation of the axial force is given as follows:
F = F 1 + F 2 ,
Based on the assumption that the relative axial elongation between the steel bar and the outer steel tube is equal to the shear deformation of the filler material, the following deformation compatibility equation can be established:
F 1 L fuse 2 E s , t A fuse F 2 L fuse 2 E s A tube = F 2 ( D fill D fuse ) π G fill D fill L fuse ,
where Es,t represent the elastic modulus of the steel bar, Es the elastic modulus of the outer steel tube, and Gfill is the shear modulus of the filler material.
Through Equations (4) and (5), the tensile stiffness of the energy dissipation segment can be obtained.
K ix = K fuse + ( K anti buck 1 + K contact 1 ) 1 ,
The stiffness of each component within the energy dissipation segment can be calculated using the following Equations (7)–(9):
Kfuse= (Es,tAfuse)/Lfuse,
Kanti-buck= (EsAtube)/Lfuse,
Kcontact= (π/2·Gfill DfillLfuse)/(Dfill − Dfuse),
where
  • Kfuse: stiffness of the steel bar;
  • Kanti-buck: stiffness of the outer steel tube;
  • Kcontact: stiffness of the filling material.
Due to the fact that the external steel tube transmits stress gradually through the core energy-dissipating bar and is not constrained at the ends, the stress at the ends of the outer steel tube is relatively low. At both ends regions (Lex) of the composite steel bar, the tensile stiffness can be considered to be solely provided by the end section of the core steel bar. The corresponding calculation formula is given in Equation (10).
K ex = E s , t A ex 2 L ex ,
Based on the force analysis and Equations (6)–(10), the tensile stiffness of the composite steel bar is composed of the tensile stiffness from both the end and core regions. The simplified model is illustrated in Figure 18, and the corresponding calculation formula for the tensile stiffness of the composite steel bar is given in Equation (11).
K t = ( K ix 1 + K ex 1 ) 1 ,

4.2. Theoretical Calculation of Initial Compressive Stiffness

At the initial stage of compressive loading, the core steel bar undergoes out-of-plane deformation under axial load. The internal wall of the outer steel tube and the core bar interact through the epoxy resin filler, which transmits compressive force, enabling both components to jointly bear the load and enhance the overall stiffness of the composite steel bar. Experimental results indicate that the deformations of the core bar and the outer steel tube occurred almost synchronously. Due to the absence of end constraints on the outer steel tube, its compressive stiffness is considered only within the energy dissipation zone. The shear deformation of the filler is minimal, and thus, its contribution to compressive stiffness can be neglected. Consequently, a simplified model of the compressive stiffness of the composite steel bar is shown in Figure 19, and the corresponding compressive stiffness is expressed in Equation (12).
K c = ( K fuse + K anti buck ) 1 + K ex 1 1

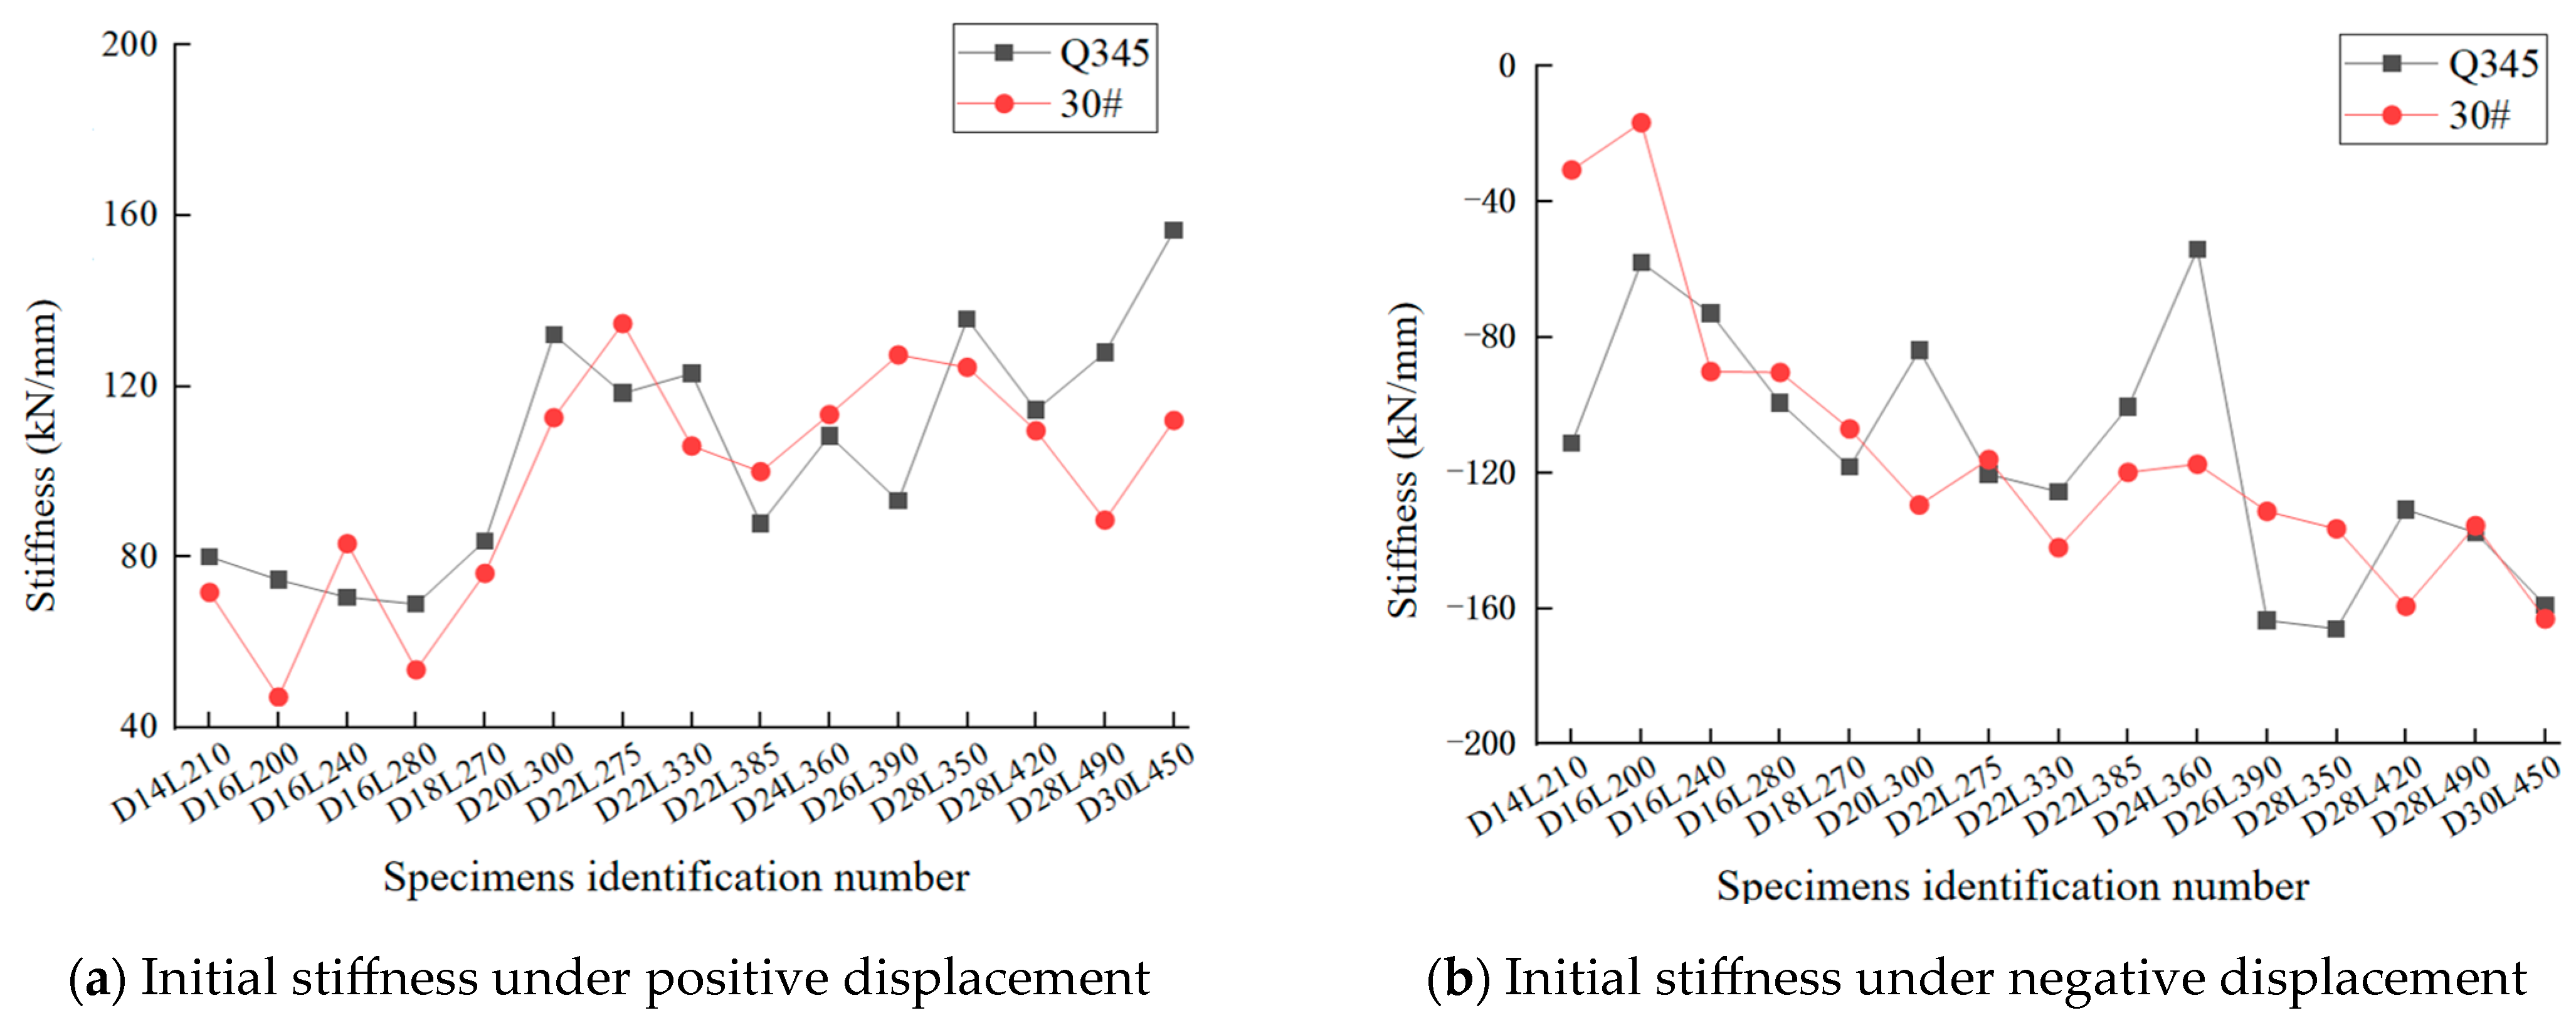
4.3. Analysis of Initial Stiffness

The outer steel tube of the composite bar can indirectly transmit shear stress through the filler, thereby enhancing the tensile and compressive stiffness of the composite system. Under tensile loading, the filler experiences significant shear strain, whereas under compressive loading, the shear strain is relatively minor. Consequently, the outer steel tube significantly contributes to the compressive stiffness but has a limited effect on the tensile stiffness of the composite bar, resulting in a disparity between compressive and tensile stiffness. To achieve a balanced performance, the initial compressive-to-tensile stiffness ratio Kc/Kt is used as an evaluation index. A Kc/Kt value closer to 1 indicates better compatibility between the initial compressive and tensile stiffness.
The initial compressive and tensile stiffness of the composite bar were calculated using the aforementioned Equations (11) and (12). The results were categorized based on different λfuse and various Dex/Dfuse. The comparison of the stiffness ratio (Kc/Kt) for composite bars under these classifications is illustrated in Figure 20.
As shown in Figure 20a, when the basic slenderness ratio of the steel bar is maintained at λfuse = 60, the stiffness ratio of the composite steel bar increases with the increase in the diameter reduction ratio of the steel bar. Moreover, the third group, which has a larger steel bar diameter, exhibits a slower increase rate. As illustrated in Figure 20b, when the basic slenderness ratio λfuse is 50, 60, and 70, the stiffness ratio of the composite steel bar decreases with the increasing basic slenderness ratio and also decreases with the decreasing diameter ratio of Dex/Dfuse.
In summary, within the parameter range considered in this study, the stiffness ratio of the specimens was positively correlated with the diameter ratio Dex/Dfuse of the steel bar and negatively correlated with the basic slenderness ratio λfuse. This type of composite steel bar primarily dissipates energy through the inner core steel bar, in conjunction with the outer steel tube. The stiffness ratio reflects the contribution of the outer steel tube, and thus, the initial stiffness ratio should ideally be maintained within the range of 1.0 to 1.1.

5. Conclusions

This study systematically investigated the cyclic tensile-compressive hysteretic behavior of external composite steel bars used in self-centering beam-to-column joints through experiments, numerical simulation, and theoretical analysis, and the optimal parameters were obtained through parameter analysis, as shown in Table 5. Key findings are as follows:
  • The composite steel bar specimens exhibited two failure modes: buckling and necking. For specimens exhibiting buckling failure, the compressive bearing capacity of the composite steel bar rapidly decreased to below 85% during the mid-to-later loading stages. Necking failure was observed in specimens with both low slenderness ratios and small diameters, typically occurring in the core steel bar or at its ends.
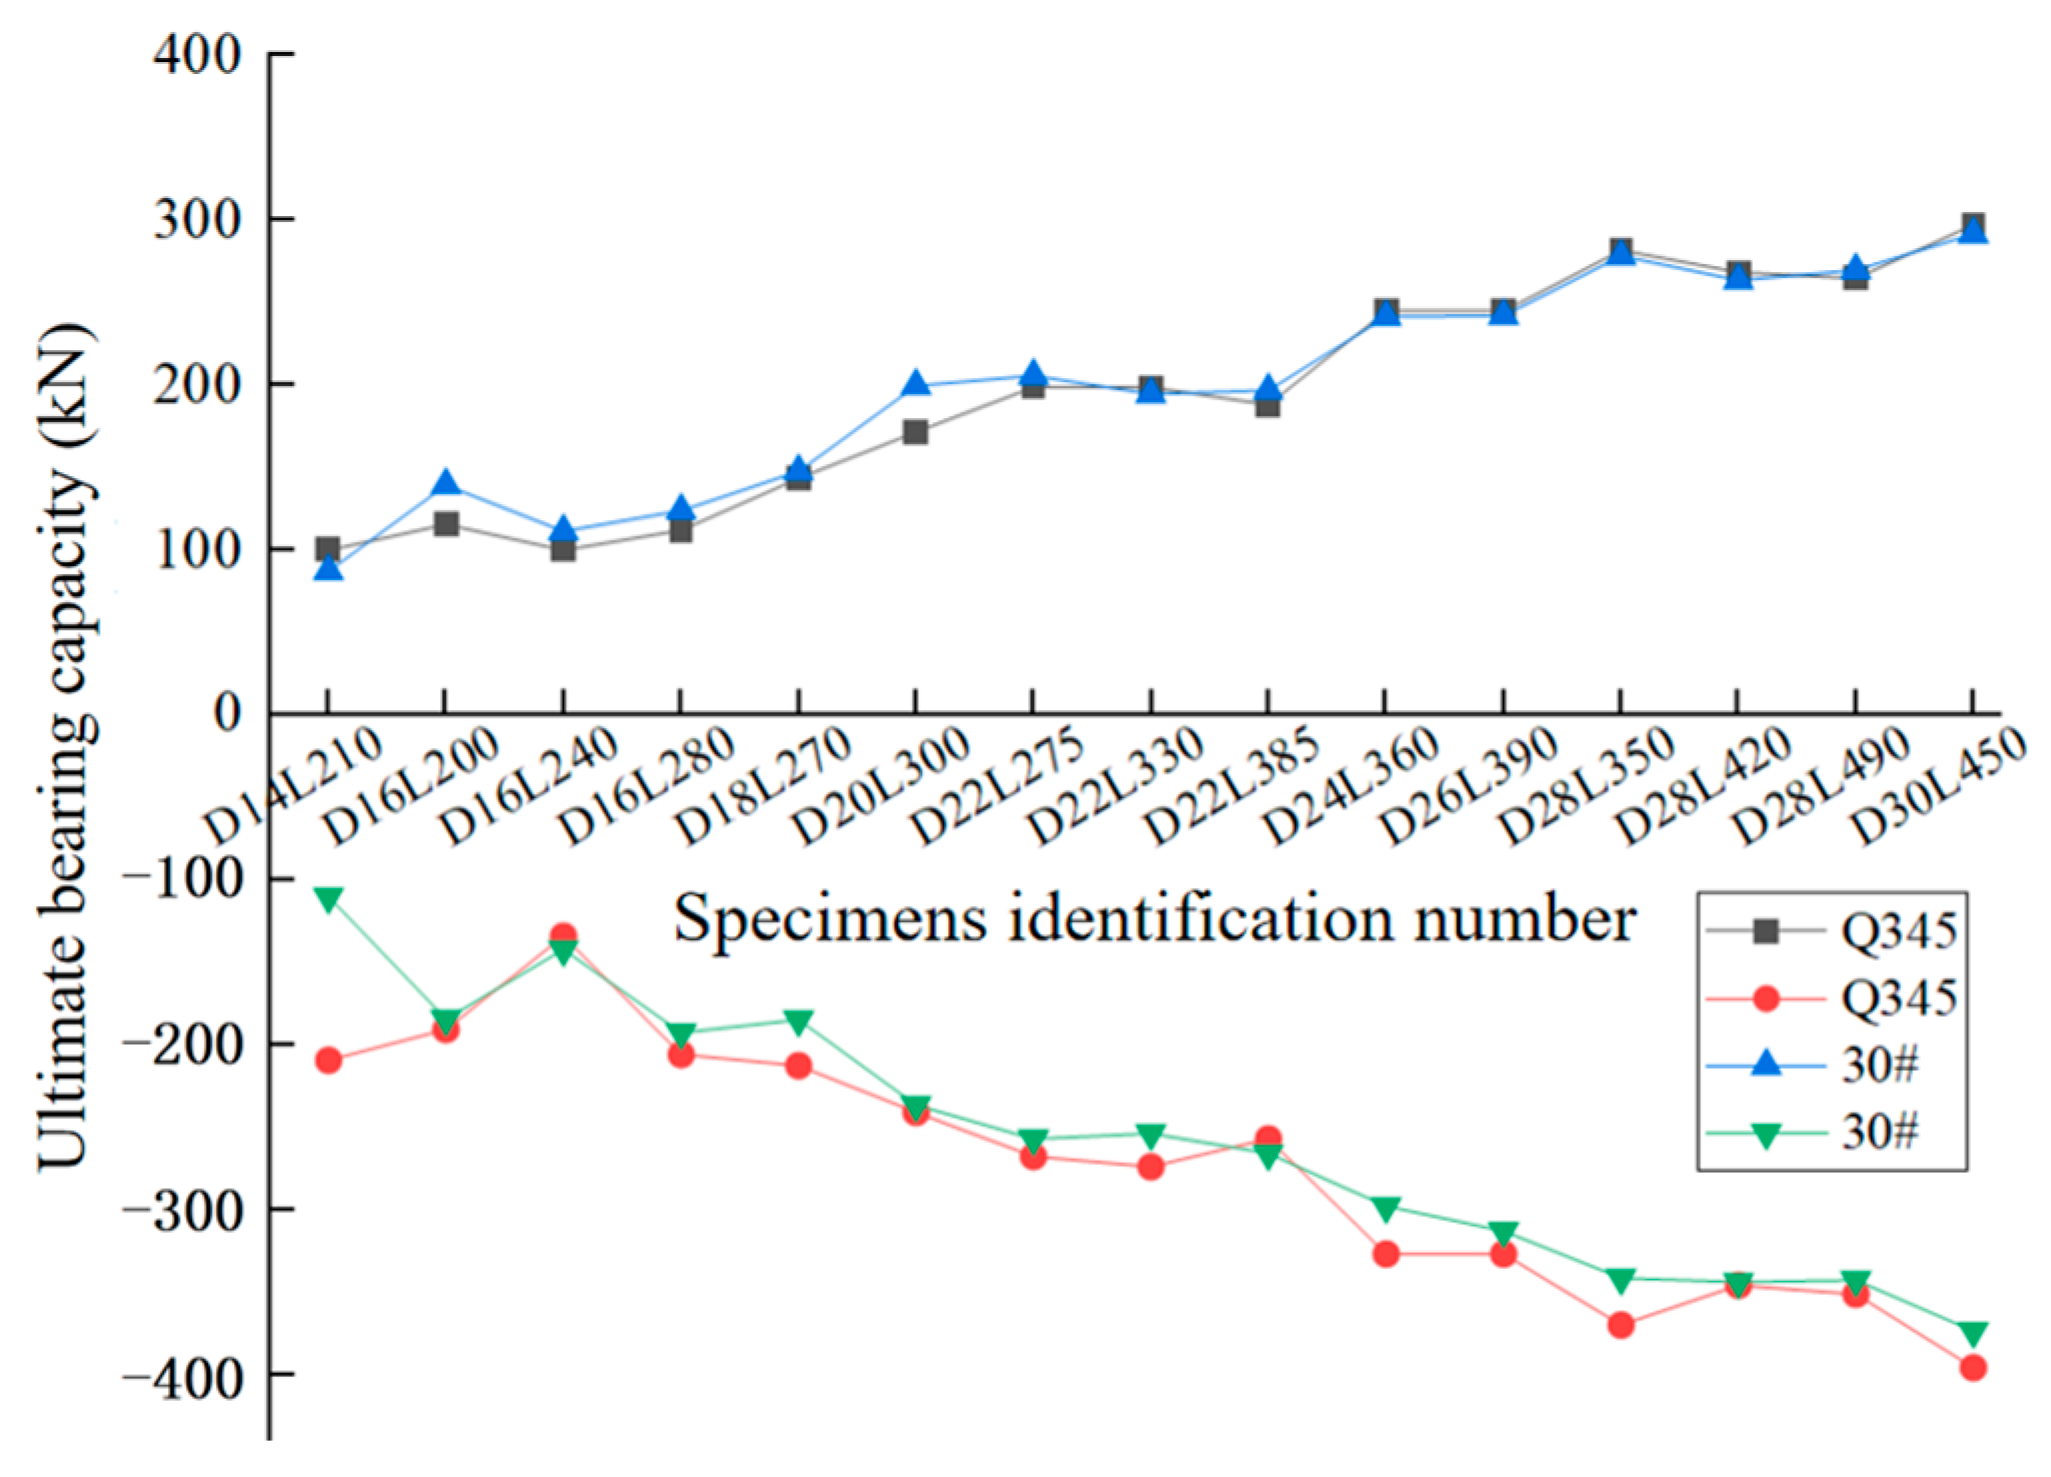
  • Analysis of the seismic performance indicators obtained from the experiments reveals that the composite steel bars demonstrated substantial deformation capacity and stable deformability. For most specimens, the tensile ductility factor exceeded the compressive ductility factor, indicating strong deformation capacity and high compressive stiffness, which reduces the likelihood of compression-induced failure. The slenderness ratio and the diameter ratio between the steel bar ends and the weakened segment had a pronounced influence on performance, whereas their influence on stiffness was less significant.
  • For the design and application of external composite steel bars, it is recommended to comprehensively consider the basic slenderness ratio λfuse and the diameter ratio between the loading end and the weakened section Dex/Dfuse. Based on experimental and numerical analysis, a stable energy dissipation performance can generally be achieved when λfuse is between 60 and 80 (λtot = 33.8–45.1) and Dex/Dfuse ranges from 1.25 to 1.50.
  • Analysis of the initial tensile-compressive stiffness of the externally replaceable composite steel bars suggests that when the diameter of the energy-dissipating segment is less than or equal to 18 mm, the diameter ratio of Dex/Dfuse should be below 1.25; when the diameter is greater than or equal to 20 mm, the diameter ratio of Dex/Dfuse should be below 1.5. These parameters help ensure optimal stiffness ratios and more stable energy dissipation.
  • It is recommended to use materials with a low yield point (lower than the connecting main reinforcement), high elongation capacity (elongation > 20%) and anti-fatigue for the composite steel bars to ensure lower yield loads and larger deformation displacements, thereby improving the failure mode and enhancing energy dissipation capacity. Meanwhile, the limitations of this study are the lack of consideration of the effect of the roughness of the metal surface bonded to the epoxy resin on the performance, and the lack of dynamic load tests to guide future research.

Author Contributions

Conceptualization, X.Q. and J.Y.; methodology, K.S.; software, H.L.; validation, J.Y., H.L. and K.S.; formal analysis, X.Q.; investigation, K.S.; resources, X.Q.; data curation, X.Q.; writing—original draft preparation, J.Y. and H.L.; writing—review and editing, X.Q.; visualization, J.Y.; supervision, X.Q.; project administration, X.Q.; funding acquisition, X.Q. All authors have read and agreed to the published version of the manuscript.

Funding

This research was funded by the General Program of Beijing Municipal Education Commission (KM201610016005) and the Beijing University of Civil Engineering and Architecture Pyramid Talents Cultivation Project (JDYC20160205).

Data Availability Statement

The authors confirm that the data supporting the findings of this study are available within the article.

Conflicts of Interest

The authors declare that there are no conflicts of interest.

Abbreviations

The following abbreviations are used in this manuscript:
FEMFinite element mode

References

  1. Zhou, Y. Design and Application of Anti-Buckling Energy Consumption Braced Structures; Architecture & Building Press: Beijing, China, 2007. (In Chinese) [Google Scholar]
  2. Priestley, M.N. Overview of PRESSS Research Program. PCI J. 1991, 36, 50–57. [Google Scholar] [CrossRef]
  3. Priestley, M.N.; Sritharan, S.; Conley, J.R.; Pampanin, S. Preliminary Results and Conclusions from the PRESSS Five-Story Precast Concrete Test Building. PCI J. 1999, 44, 42–67. [Google Scholar] [CrossRef]
  4. Huang, L.; Clayton, P.M.; Zhou, Z. Seismic Design and Performance of Self-Centering Precast Concrete Frames with Variable Friction Dampers. Eng. Struct. 2021, 245, 112863. [Google Scholar] [CrossRef]
  5. Wang, H.; Marino, E.M.; Pan, P.; Liu, H.; Nie, X. Experimental Study of a Novel Precast Prestressed Reinforced Concrete Beam-to-Column Joint. Eng. Struct. 2018, 156, 68–81. [Google Scholar] [CrossRef]
  6. Wang, C.-L.; Liu, Y.; Zheng, X.; Wu, J. Experimental Investigation of a Precast Concrete Connection with All-Steel Bamboo-Shaped Energy Dissipaters. Eng. Struct. 2019, 178, 298–308. [Google Scholar] [CrossRef]
  7. Chen, S.; Zheng, L.; Yan, W.; Kim, K.-S. Seismic Performance of Post-Tensioned Precast Concrete Joints Improved with Curved Steel Braces. J. Earthq. Eng. 2022, 26, 1461–1479. [Google Scholar] [CrossRef]
  8. Kim, S.; Kang, T.H.K.; Jung, D.; LaFave, J.M. Seismic behavior of precast and post-tensioned exterior connections with ductile headed rods. ACI Struct. J. 2021, 118, 87–100. [Google Scholar] [CrossRef]
  9. Yang, C.; Xie, L.; Li, A.; Wang, X. A Dry-Connected Rotational Friction Dissipative Beam-to-Column Joint for Precast Concrete Frame: Full-Scale Experimental and Numerical Investigations. J. Build. Eng. 2022, 54, 104685. [Google Scholar] [CrossRef]
  10. Yam, M.C.H.; Ke, K.; Huang, Y.; Zhou, X.; Liu, Y. A Study of Hybrid Self-Centring Beam-to-Beam Connections Equipped with Shape-Memory-Alloy-Plates and Washers. J. Constr. Steel Res. 2022, 198, 107526. [Google Scholar] [CrossRef]
  11. Zhu, L.; Ning, Q.; Han, W.; Zhao, C. Seismic Performance of Self-Centering Concrete-Filled Square Steel Tubular Column-to-Steel Beam Connection Equipped with SMA Bolts. Thin-Walled Struct. 2023, 183, 110351. [Google Scholar] [CrossRef]
  12. Li, Z.; Qi, Y.; Teng, J. Experimental Investigation of Prefabricated Beam-to-Column Steel Joints for Precast Concrete Structures under Cyclic Loading. Eng. Struct. 2020, 209, 110217. [Google Scholar] [CrossRef]
  13. Huang, W.; Hu, G.; Zhang, J. Experimental Study on the Seismic Performance of New Precast Concrete Beam-Column Joints with Replaceable Connection. Structures 2022, 35, 856–872. [Google Scholar] [CrossRef]
  14. Bai, J.; He, J.; Li, C.; Jin, S.; Yang, H. An RBS-Based Replaceable Precast Concrete Beam-Column Joint: Design Approach and Experimental Investigation. J. Build. Eng. 2022, 51, 104212. [Google Scholar] [CrossRef]
  15. Dai, K.; Sun, T.; Liu, Y.; Li, T.; Camara, A. Concept and Numerical Analysis of a Double-Stage Coupling Damper for Multilevel Seismic Protection. Thin-Walled Struct. 2023, 185, 110581. [Google Scholar] [CrossRef]
  16. Lu, Y.; Lv, Q.; Sun, T.; Liu, Y.; Tang, H. Experimental and Numerical Studies on Hysteretic Behavior of a Novel Bending-Friction Coupled Damper. Thin-Walled Struct. 2023, 183, 110385. [Google Scholar] [CrossRef]
  17. Chen, Y.; Yu, W.; Zhang, M.; Li, Y. A Novel Energy Dissipation Damper for Multi-Level Earthquakes. J. Constr. Steel Res. 2022, 192, 107214. [Google Scholar] [CrossRef]
  18. Wang, J.; Men, J.; Zhang, Q.; Fan, D.; Zhang, Z.; Huang, C.-H. Seismic Performance Evaluation of a Novel Shape-Optimized Composite Metallic Yielding Damper. Eng. Struct. 2022, 268, 114714. [Google Scholar] [CrossRef]
  19. Deng, K.; Pan, P.; Li, W.; Xue, Y. Development of a Buckling Restrained Shear Panel Damper. J. Constr. Steel Res. 2015, 106, 311–321. [Google Scholar] [CrossRef]
  20. Lin, X.; Wu, K.; Skalomenos, K.A.; Lu, L.; Zhao, S. Development of a Buckling-Restrained Shear Panel Damper with Demountable Steel-Concrete Composite Restrainers. Soil Dyn. Earthq. Eng. 2019, 118, 221–230. [Google Scholar] [CrossRef]
  21. Li, F.; Du, Y.; Hong, N.; Li, H.; Chi, P. Seismic Performance of Prefabricated Replaceable Graded-Yielding Energy-Dissipating Connectors. Eng. Struct. 2023, 297, 116962. [Google Scholar] [CrossRef]
  22. Marriott, D.; Pampanin, S.; Palermo, A. Quasi-static and Pseudo-dynamic Testing of Unbonded Post-tensioned Rocking Bridge Piers with External Replaceable Dissipaters. Earthq. Eng. Struct. Dyn. 2009, 38, 331–354. [Google Scholar] [CrossRef]
  23. Pampanin, S. Reality-Check and Renewed Challenges in Earthquake Engineering: Implementing Low-Damage Systems–from Theory to Practice. Bull. New Zealand Soc. Earthq. Eng. 2012, 45, 137–160. [Google Scholar] [CrossRef]
  24. Sarti, F.; Palermo, A.; Pampanin, S. Quasi-Static Cyclic Testing of Two-Thirds Scale Unbonded Posttensioned Rocking Dissipative Timber Walls. J. Struct. Eng. 2016, 142, E4015005. [Google Scholar] [CrossRef]
  25. Wang, H.; Marino, E.M.; Pan, P. Design, Testing and Finite Element Analysis of an Improved Precast Prestressed Beam-to-Column Joint. Eng. Struct. 2019, 199, 109661. [Google Scholar] [CrossRef]
  26. Li, C.; Wu, J.; Zhang, J.; Tong, C. Experimental Study on Seismic Performance of Precast Concrete Frame with Replaceable Energy-Dissipating Connectors. Eng. Struct. 2021, 231, 111719. [Google Scholar] [CrossRef]
  27. Qu, X.S.; Fu, X.; Sun, Y.B.; Liu, B. Study of hysteretic behavior of mild steel dissipaters under cyclic tension loading. Earthq. Resist. Eng. Retrofit. 2021, 43, 109–117. (In Chinese) [Google Scholar] [CrossRef]
  28. ACI Innovation Task Group 5. Acceptance Criteria for Special Unbonded Post-Tensioned Precast Structural Walls Based on Validation Testing and Commentary; American Concrete Institute: Farmington Hills, MI, USA, 2008. [Google Scholar]
  29. Yan, X.; Reiner, J.; Bacca, M.; Altintas, Y.; Vaziri, R. A Study of Energy Dissipating Mechanisms in Orthogonal Cutting of UD-CFRP Composites. Compos. Struct. 2019, 220, 460–472. [Google Scholar] [CrossRef]
  30. Kaddour, A.S.; Hinton, M.J.; Smith, P.A.; Li, S. Mechanical Properties and Details of Composite Laminates for the Test Cases Used in the Third World-Wide Failure Exercise. J. Compos. Mater. 2013, 47, 2427–2442. [Google Scholar] [CrossRef]
  31. Naik, N.K.; Shankar, P.J.; Kavala, V.R.; Ravikumar, G.; Pothnis, J.R.; Arya, H. High Strain Rate Mechanical Behavior of Epoxy under Compressive Loading: Experimental and Modeling Studies. Mater. Sci. Eng. A 2011, 528, 846–854. [Google Scholar] [CrossRef]
  32. Fiedler, B.; Hobbiebrunken, T.; Hojo, M.; Schulte, K. Influence of Stress State and Temperature on the Strength of Epoxy Resins. In Proceedings of the 11th International Conference on Fracture 2005, ICF11, Turin, Italy, 20–25 March 2005; Volume 3, pp. 2271–2275. [Google Scholar]
  33. Chen, J.; Ma, Y.W.; Yoon, K.B. Finite Element Study for Determination of Material’s Creep Parameters from Small Punch Test. J. Mech. Sci. Technol. 2010, 24, 1195–1201. [Google Scholar] [CrossRef]
Figure 1. The joint with external dissipator.
Buildings 15 02019 g001
Figure 2. Flowchart of the implementation of this article.
Buildings 15 02019 g002
Figure 4. Schematic diagram of experimental device and measurement scheme.
Buildings 15 02019 g004
Figure 5. Failure mode of each group of specimens.
Buildings 15 02019 g005
Figure 6. Strain comparison for test specimens.
Buildings 15 02019 g006
Figure 7. Hysteresis curves of specimens.
Buildings 15 02019 g007aBuildings 15 02019 g007b
Figure 8. Equivalent viscous damping coefficients for all specimens.
Buildings 15 02019 g008
Figure 9. Comparison of stiffness degradation of 30# steel test specimens.
Buildings 15 02019 g009
Figure 10. Comparison of stiffness degradation of Q345B steel test specimens.
Buildings 15 02019 g010
Figure 11. Mesh division.
Buildings 15 02019 g011
Figure 12. Stress cloud diagram and hysteresis curve comparison of specimen D18L270-Q345B.
Buildings 15 02019 g012
Figure 13. Stress cloud diagram and hysteresis curve comparison of specimen D22L330-Q345B.
Buildings 15 02019 g013
Figure 14. Comparison of ultimate bearing capacity of test specimens.
Buildings 15 02019 g014
Figure 15. Comparison of initial stiffness.
Buildings 15 02019 g015
Figure 16. Comparison of skeleton curves.
Buildings 15 02019 g016
Figure 17. Schematic diagram of force analysis.
Buildings 15 02019 g017
Figure 18. Simplified model of the tensile stiffness of composite steel bars.
Buildings 15 02019 g018
Figure 19. Simplified model of the compressive stiffness of composite steel bars.
Buildings 15 02019 g019
Figure 20. Comparison of the stiffness ratio of composite steel bars.
Buildings 15 02019 g020
Table 2. Material properties of epoxy resins.
Filler MaterialElastic Modulus (GPa)Shear Strength (MPa)Tensile Strength (MPa)
E-44 epoxy resin3.31280
Table 3. Mechanical properties of steel bars.
Type of Internal Steel BarSpecimen
Number
Elastic Modulus
E (GPa)
Yield Strength
fy (MPa)
Ultimate Tensile
Strength fu (MPa)
Elongation
δ (%)
Q345B1177399.68577.8220.44
2183402.48573.54
3194390.67549.69
30#4170379.80589.7020.00
5174403.57601.04
6197391.58588.72
Table 4. Coefficients of the specimens.
Specimen
Number
Loading DirectionYield-Displacement PointPeak-Load PointFailure-Displacement PointDuctility Coefficient
μ
Δy/mmPy/kNΔm/mmFm/kNΔu/mmFu/kN
D14L210-Q345B+ (tension)2.2077.755.20100.308.7087.603.95
− (compression)−2.91−174.44−6.40−209.50−8.38−178.082.88
D16L200-Q345B+3.0592.037.10115.708.00114.302.62
−4.25−160.60−6.95−190.60−6.95−190.601.64
D16L240-Q345B+1.7082.678.35100.309.4594.405.56
−3.30−108.32−7.20−134.00−8.44−113.902.56
D16L280-Q345B+2.3095.278.37112.2012.50108.305.43
−2.80−172.79−5.70−206.00−6.60−175.102.36
D18L270-Q345B+3.11122.278.10143.8010.80140.703.47
−2.58−182.34−4.74−212.70−6.02−180.802.33
D20L300-Q345B+2.49141.208.94171.9011.88169.504.77
−3.10−224.09−4.80−240.90−6.90−204.772.23
D22L275-Q345B+3.00158.476.68199.0010.90194.003.63
−2.69−238.19−4.12−267.80−6.45−227.632.40
D22L330-Q345B+2.20184.861.60199.002.94169.151.34
−2.49−235.18−3.66−274.00−5.45−232.902.19
D22L385-Q345B+2.52175.399.70188.3015.40186.506.11
−2.71−220.66−3.90−257.00−4.60−218.451.70
D24L360-Q345B+2.98207.7510.90227.1014.30210.604.80
−4.60−215.60−7.26−218.90−8.41−186.071.83
D26L390-Q345B+2.69225.8311.63245.2015.60236.705.80
−3.00−315.20−1.75−327.00−4.43−277.951.48
D28L350-Q345B+2.20262.507.05281.9014.20266.706.45
−2.70−323.26−4.30−370.20−5.93−314.672.20
D28L420-Q345B+2.25246.9610.60268.7016.80262.207.47
−2.89−303.19−4.00−346.00−4.66−294.101.61
D28L490-Q345B+1.80257.979.70265.1019.70256.0010.94
−2.25−328.74−3.20−351.30−5.16−298.612.29
D30L450-Q345B+2.72276.7711.20297.6017.96279.906.60
−2.59−363.34−4.30−396.00−5.18−336.602.00
D14L210-30+1.2977.432.1187.307.0880.105.49
−5.26−92.49−7.48−110.23−7.48−110.231.42
D16L200-30+4.89129.856.90139.5014.99118.583.07
−8.90−162.32−14.43−184.30−14.43−184.301.62
D16L240-30+2.43107.081.40111.509.70111.103.99
−1.95−124.02−4.90−142.10−7.18−120.793.68
D16L280-30+5.3196.9710.60124.2022.66124.204.27
−3.70−165.67−5.60−192.60−8.38−163.712.26
D18L270-30+4.48127.4521.30147.8021.30147.804.75
−2.07−158.39−3.90−184.80−7.26−157.083.51
D20L300-30+1.79183.522.54200.003.83170.002.14
−1.80−203.07−4.50−236.70−6.13−201.203.41
D22L275-30+1.70196.007.20206.009.67206.005.69
−2.45−226.45−4.33−257.00−6.06−218.452.47
D22L330-30+2.40174.539.90194.809.90194.804.13
−1.78−236.33−2.33−253.70−4.36−215.652.45
D22L385-30+1.68191.522.70197.0013.50197.008.04
−1.78−236.71−2.80−266.00−3.57−226.102.01
D24L360-30+2.37211.974.70241.8014.40211.206.08
−3.39−254.17−5.30−298.00−6.06−253.301.79
D26L390-30+3.00213.4913.60242.4015.56241.305.19
−2.50−276.19−3.50−313.00−6.01−266.051.73
D28L350-30+3.05234.668.80278.5013.90272.604.56
−2.85−297.00−3.60−341.60−4.86−290.361.74
D28L420-30+2.72247.7710.60264.0014.80262.005.44
−2.30−344.00−2.30−344.00−3.29−292.401.43
D28L490-30+3.28241.5517.00270.0019.60251.805.98
−2.38−342.80−2.38−342.80−4.15−291.381.71
D30L450-30+2.33285.8013.40292.1015.80293.406.78
−2.35−350.39−3.00−373.70−4.07−317.652.40
Table 5. Optimal parameters.
Dex (mm)Dex/Dfuseλfuse
≤18≤1.2560~80
≥20≤1.5
Disclaimer/Publisher’s Note: The statements, opinions and data contained in all publications are solely those of the individual author(s) and contributor(s) and not of MDPI and/or the editor(s). MDPI and/or the editor(s) disclaim responsibility for any injury to people or property resulting from any ideas, methods, instructions or products referred to in the content.

