Article

Seismic Performance Research of Self-Centering Single-Column Bridges Using Equivalent Stiffness Theory

1
School of Transportation Science and Engineering, Jilin Jianzhu University, Changchun 130118, China
2
Changchun Municipal Engineering Design and Research Institute Co., Changchun 130041, China
*
Author to whom correspondence should be addressed.
Buildings 2025, 15(12), 2000; https://doi.org/10.3390/buildings15122000
Submission received: 11 April 2025 / Revised: 4 June 2025 / Accepted: 9 June 2025 / Published: 10 June 2025
(This article belongs to the Section Building Structures)

Abstract

Single-column hybrid-reinforced self-centering segmental assembled bridges (SHR-SCSAB) exhibit vertical stiffness discontinuities, significantly impacting the refinement of their seismic design methodology. In this study, we investigate SHR-SCSAB by employing the finite strip method to calculate the maximum transverse bearing capability of segmental assembled piers, and the corresponding horizontal displacement at the pier top. By leveraging the mechanical properties of hybrid reinforcement materials, we further derive an analytical expression for the equivalent elastic stiffness of SHR-SCSAB as an integrated system. OpenSees software was used to establish a finite element model of the SHR-SCSAB, and the agreement between numerical simulations and analytical solutions validates the accuracy of the derived equivalent elastic stiffness expression. Additionally, this study evaluates the seismic performance of single-column SHR-SCSAB and examines the influence of key parameters on its behavior. The results demonstrate that hybrid reinforcement effectively addresses the low energy dissipation capacity inherent in self-centering bridges while preserving their advantage of minimal residual displacement. These findings significantly advance the refinement of seismic design methods for SHR-SCSAB.

1. Introduction

Segmental assembled bridges are bridge structures constructed by segmented manufacturing and assembly, which significantly improve construction efficiency and precision, especially in constrained site conditions such as mountainous or canyon areas [1,2]. However, their segmental joints easily form structural weak points, resulting in lower integrity than cast-in-place piers [3]. Extensive tests show that such joints cause stress concentration phenomena, significantly reducing the pier’s shear capacity by 15–30% and aggravating post-earthquake residual displacement [4]. To overcome this bottleneck, scholars including Priestley [5,6,7,8,9] proposed displacement-based and performance-based seismic design theory, overturning the traditional “strength-first” concept. This theory establishes a direct correlation between structural damage and displacement, advocating for the use of prestressing technology to provide structures with self-centering capabilities. This concept has continuously evolved over the past two decades, gradually forming a resilience design system centered on self-centering with supplemental energy-dissipation devices.
Numerous scholars have conducted experimental studies and numerical simulations to investigate the residual displacement characteristics and energy dissipation capacity of self-centering segmental assembled bridges (SC-SABs) under seismic action. Hewes et al. [10] used circular steel tubes to confine the bottom segment of the pier to prevent crushing of concrete in the compression zone at the bottom joint caused by rotation, while connecting pier segments with bonded prestressing tendons. Through low-cycle reversed loading tests, they studied the influence of parameters such as the shear–span ratio, circular steel tube wall thickness, and stirrup ratio on the seismic performance of the pier. The results show that the pier exhibits nonlinear elastic hysteretic behavior with small residual displacement but poor energy dissipation capacity. Xiong et al. [11,12] proposed a double-column rocking pier system using unbonded prestressing tendons to connect precast segments and configuring energy-dissipation reinforcement to enhance structural energy dissipation capacity. Through a combination of quasi-static tests and numerical simulation, they systematically studied the influence of parameters such as axial compression ratio, initial prestressing force, and energy-dissipation reinforcement ratio on the seismic performance of the system. Test results indicate that this double-column rocking pier system maintains good self-centering performance even under 7% inter-story drift angle conditions, with a residual displacement ratio of less than 0.3%, and exhibits stable flag-shaped hysteretic curves. Furthermore, scholars have further optimized additional energy-dissipation devices. Zhang Yan [13] developed a thin-walled wall-pier structure that improved energy dissipation capacity by 40%. Liu Zhengnan et al.’s [14] rubber friction dampers and Kocakaplan’s [15] SMA reinforcement application verified the effectiveness of replaceable energy-dissipation components and smart materials, respectively, in enhancing bearing capacity and energy-dissipation efficiency. Researchers have improved the weak energy-dissipation of SC-SABs through design methods such as composite structures and additional energy-dissipation devices. With technological evolution, hybrid reinforcement has also gained increasing attention from scholars. Chen Mengyuan et al. [16] adopted a hybrid reinforcement scheme of stainless steel and FRP bars, increasing the displacement ductility coefficient of segmental assembled piers to 6.8. Gao Huixing et al. [17] controlled the residual displacement ratio within 0.5% through the synergistic work of prestressing tendons and ordinary reinforcement. Cai Zhongkui [18] investigated the seismic performance of hybrid FRP–steel reinforced precast segmental assembled piers through quasi-static tests and numerical simulation. Hybrid-reinforced piers exhibited excellent self-centering capability, with residual displacement reduced by 40~60% compared to steel-only reinforced piers. Despite significant progress in improving the energy dissipation capacity of SC-SABs, critical theoretical gaps remain: the vertical discontinuity of SC-SABs leads to uneven distribution of lateral stiffness along the height [19], and there is a lack of equivalent elastic stiffness calculation models suitable for hybrid-reinforced self-centering systems [20]. Therefore, this paper focuses on the seismic performance and design methods of single-column hybrid-reinforced self-centering segmental assembled bridges (SHR-SCSAB), with emphasis on the equivalent stiffness mechanical behavior at the joints. Based on this equivalent stiffness, after calculating the equivalent natural vibration period and determining the damping ratio, inputting it into the displacement response spectrum directly yields the design displacement at the pier top [21]. This displacement response spectrum-based design method effectively avoids the limitations of traditional strength-based design methods and better aligns with the seismic philosophy of self-centering structures: “allowing large deformations but controlling residual displacements”. Research by Wu, J. et al. [1] shows that for self-centering piers designed using the displacement response spectrum method, residual displacement prediction errors can be controlled within 15%, significantly improving design reliability.
This paper proposes key parameter design for SHR-SCSAB under seismic excitation. Using the finite strip method and fundamental mechanical principles, an analytical solution for the equivalent elastic stiffness of SHR-SCSAB is derived. Numerical simulation analysis is conducted to compare the equivalent elastic stiffness simulation results with the analytical solution, verifying the correctness of the proposed analytical solution for SHR-SCSAB’s equivalent elastic stiffness. The influence of different parameters on the seismic performance of SC-SABs is also investigated. If the problem of incomplete seismic design methods caused by inconsistent lateral stiffness in SC-SABs is resolved through equivalent elastic stiffness theory, it will help advance the development of their seismic design methods.

2. Theory of Equivalent Elastic Stiffness for SHR-SCSAB

The research object of this paper is long columns, and the research is carried out under normal axial compression ratio conditions. The equivalent stiffness of SHR-SCSAB before it reaches the maximum bearing capacity was derived. In this section, we use the finite strip method to develop a phased analysis of the possible damage modes of SHR-SCSAB under the combined action of axial force and bending moment. Meanwhile, by applying the equal displacement criterion at the pier top under maximum lateral load capacity and incorporating the material mechanical behavior of the hybrid reinforcement system, the joint rotational stiffness of the SHR-SCSAB and the pier’s equivalent elastic stiffness are derived [22].

2.1. Finite Strip Method

The finite strip method can be used to analyze the moment-curvature in the cross-section of ductile members of SHR-SCSAB [23]. The fundamental premises of the finite strip method include the following [24]: (1) cross-sectional deformation adheres to the Bernoulli hypothesis (plane sections remain plane); (2) a uniform strain distribution exists across each strip; and (3) shear deformation effects are neglected.
As depicted in Figure 1,the cross-section is discretized into j equal-height strips, with each strip maintaining a consistent area A c i = ( b · h ) / j , where b and h denote the cross-sectional width and height, respectively. According to the flat section assumption, given the member section curvature , the height of the compression zone x can be derived through axial force equilibrium analysis, so as to determine the stress distribution law on the cross-section; the equilibrium condition of axial forces in SHR-SCSAB can be expressed as
N G + N p + i = 1 j σ c i A c i + i = 1 j σ s i A s i = 0
where N G is the self-weight of the superstructure, N p is the prestress generated by unbonded prestressing tendons, σ c i is the stresses of the concrete in strip i , A c i is the areas of the concrete in strip i , σ s i is the stresses of each longitudinal tendon, and A s i is the area of each longitudinal tendon.
When the SHR-SCSAB is in the elastic working stage, under the action of the external load, the stress and strain distribution of the cross-section can be determined according to the principal material relationships. The corresponding section bending bearing capacity M u can be obtained through the finite strip method. Then, the maximum horizontal bearing capacity of the top of the pier can be expressed as F m a x = M u / H . The expression for the SHR-SCSAB section flexural bearing capacity is as follows:
M u = ( N G + N p ) · ( h 2 a s ) + i = 1 j ( σ c i A c i ) · y c i + i = 1 j ( σ s i A s i ) y s i
where M u is the SHR-SCSAB bending bearing capacity, F m a x is the maximum horizontal bearing capacity, H is the SHR-SCSAB height, a s is the distance from the point of combined force of the longitudinal reinforcement to the edge of the nearest section on the tensioned side or the less compressed side, y c i is the distance from the concrete form center to the neutral axis at strip i in the compression zone, σ s i is the stress of each longitudinal reinforcement in the compressed zone, A s i is the area of each longitudinal reinforcement in the compressed zone, and   y s i is the distance from each longitudinal reinforcement in the compression zone to the neutral axis.

2.2. A Comprehensive Theoretical Framework for Sectional Collapse Analysis

The most reasonable damage mode of the hybrid-reinforced self-reinforcing segmental assembled pier section under the action of axial force and bending moment is as follows: energy-consuming reinforcement first enters the yielding stage, and then the concrete strength in the compression zone reaches the standard value of axial compressive strength, and the prestressing reinforcement and fiber-reinforced composite (FRP) reinforcement are always in the elasticity stage, which is close to the large bias damage mode of ordinary concrete columns. This damage mode is similar to that of the ordinary concrete column, the strength of energy-consuming reinforcement and concrete are fully utilized, and this damage mode is ductile damage, so it is a reasonable damage mode for the cross-section of SHR-SCSAB. According to the above reasonable damage mode, the stress–strain state of the SHR-SCSAB section can be divided into three stages, as shown in Figure 2. Points A and D are respectively the concrete edges on the cross-section. Points B and C represent the energy-dissipating steel bars on the cross-section.

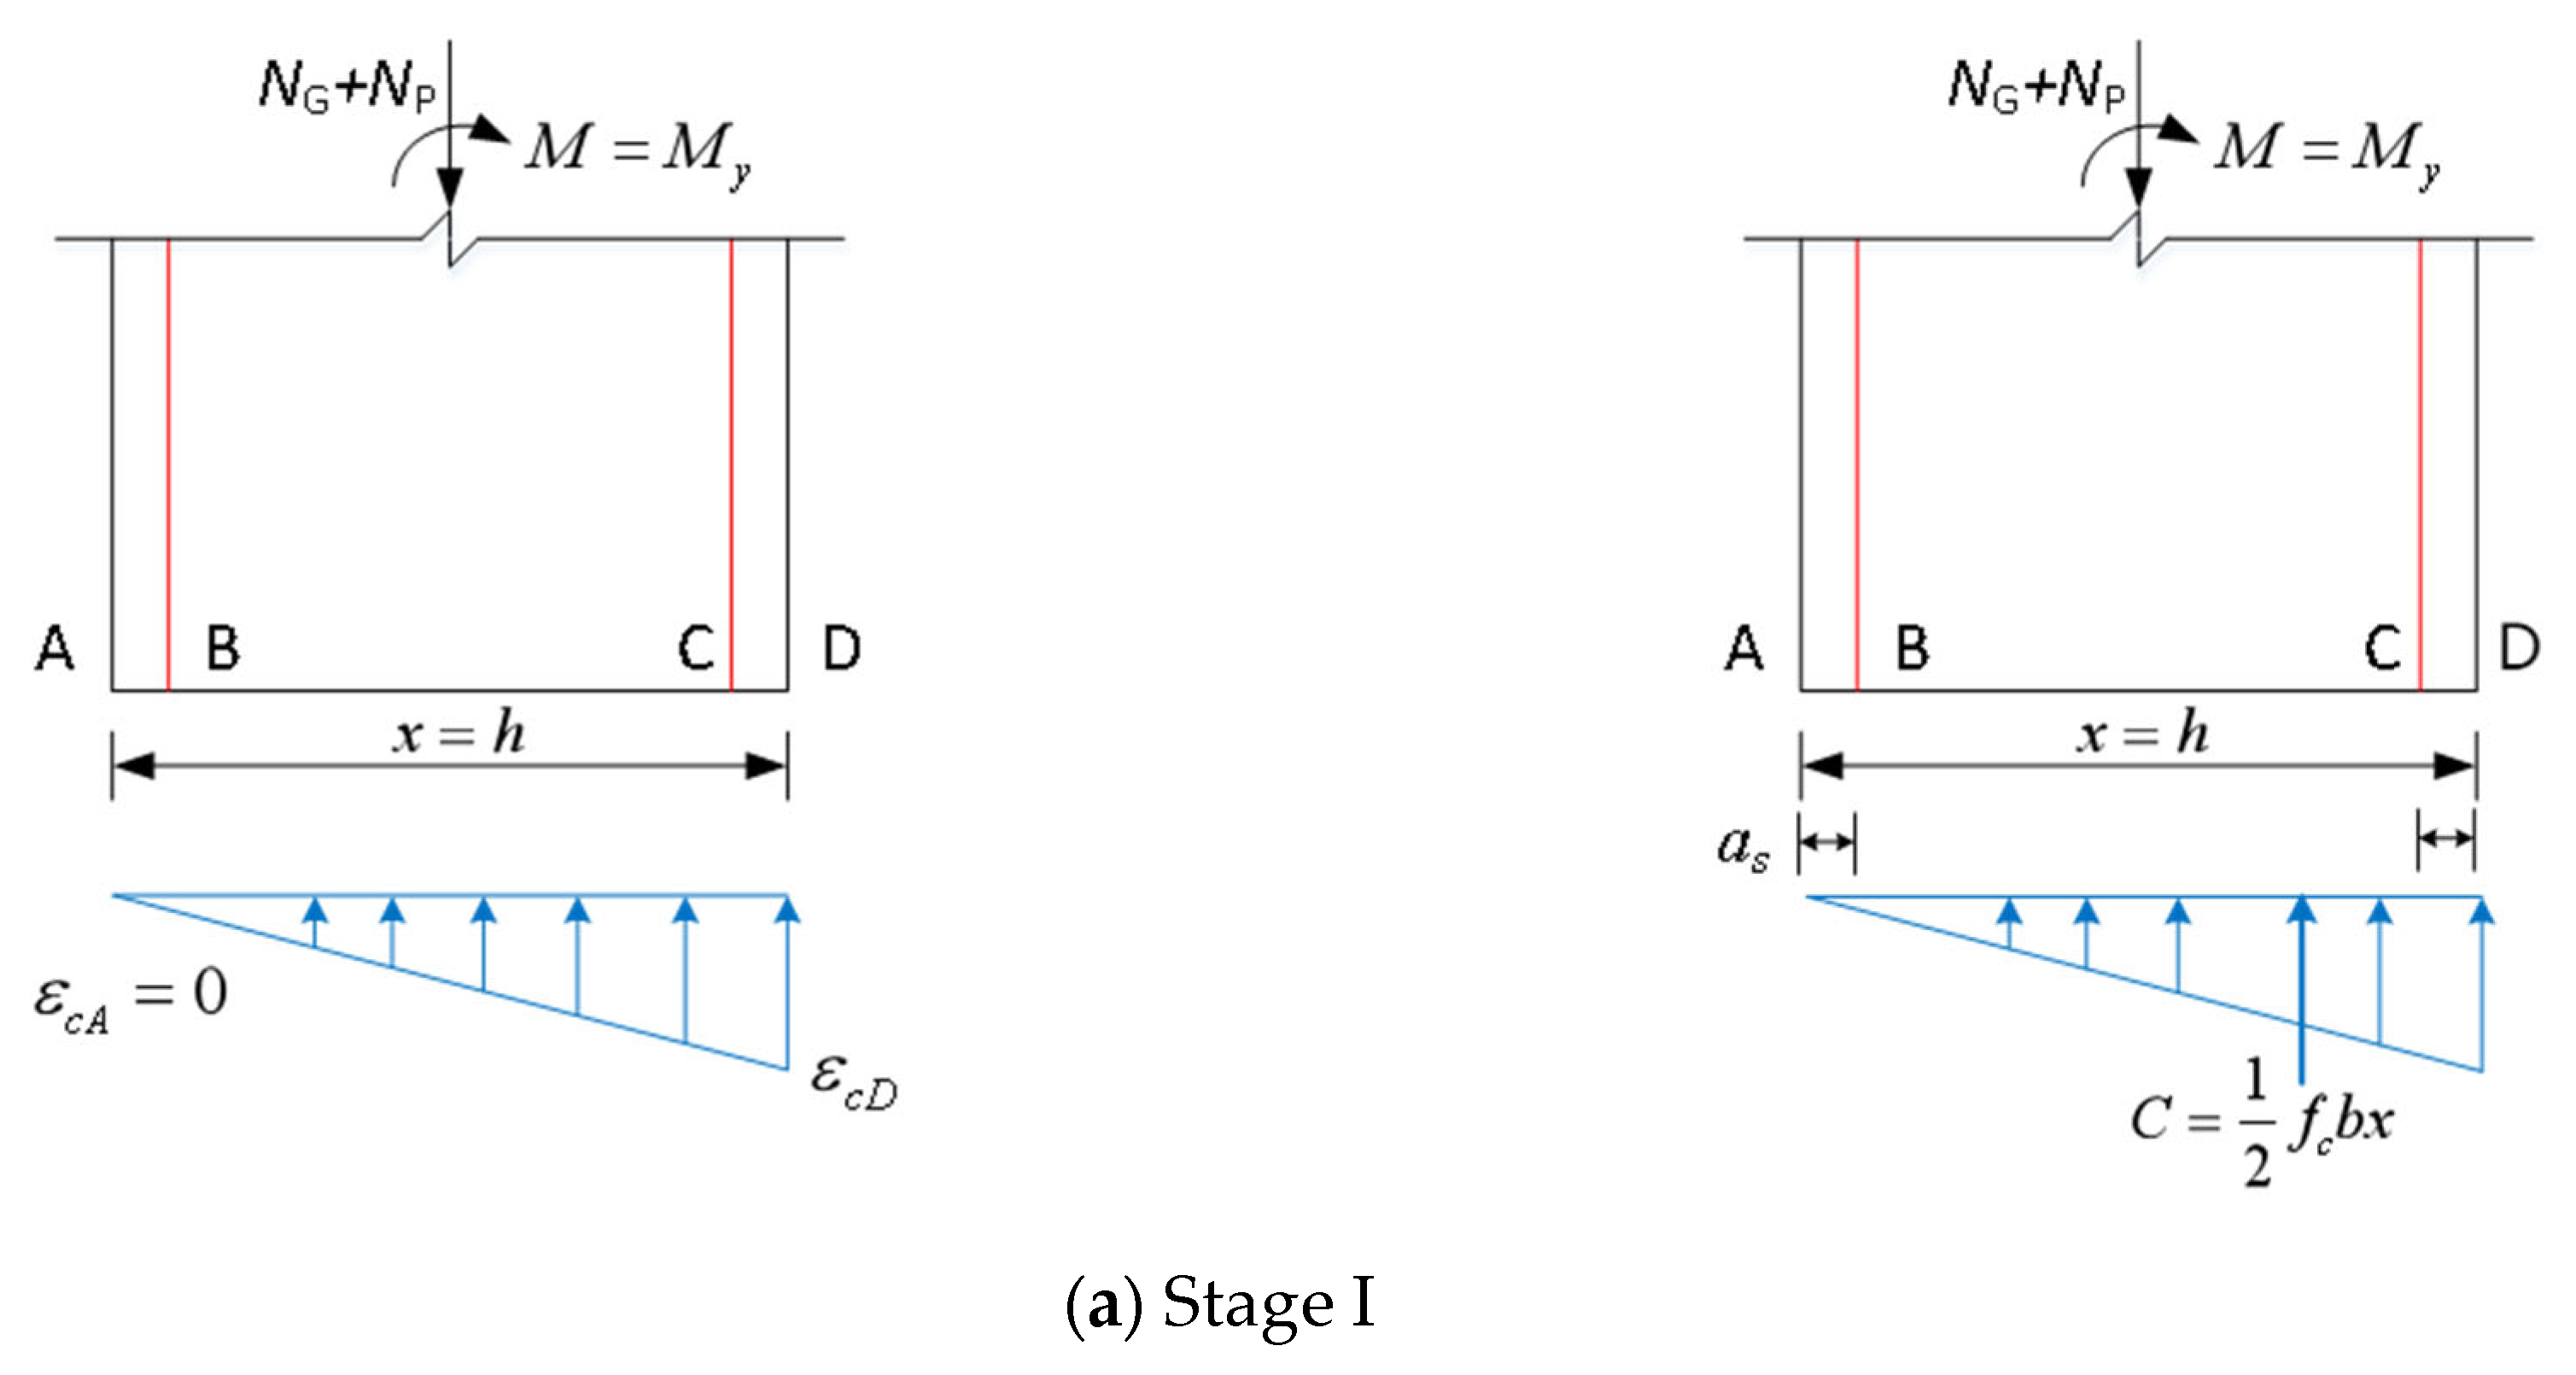
2.2.1. Stage I: Full Cross-Section Compression Stage, Increase in Bending Moment M from Zero to Dissipating Bending Moment
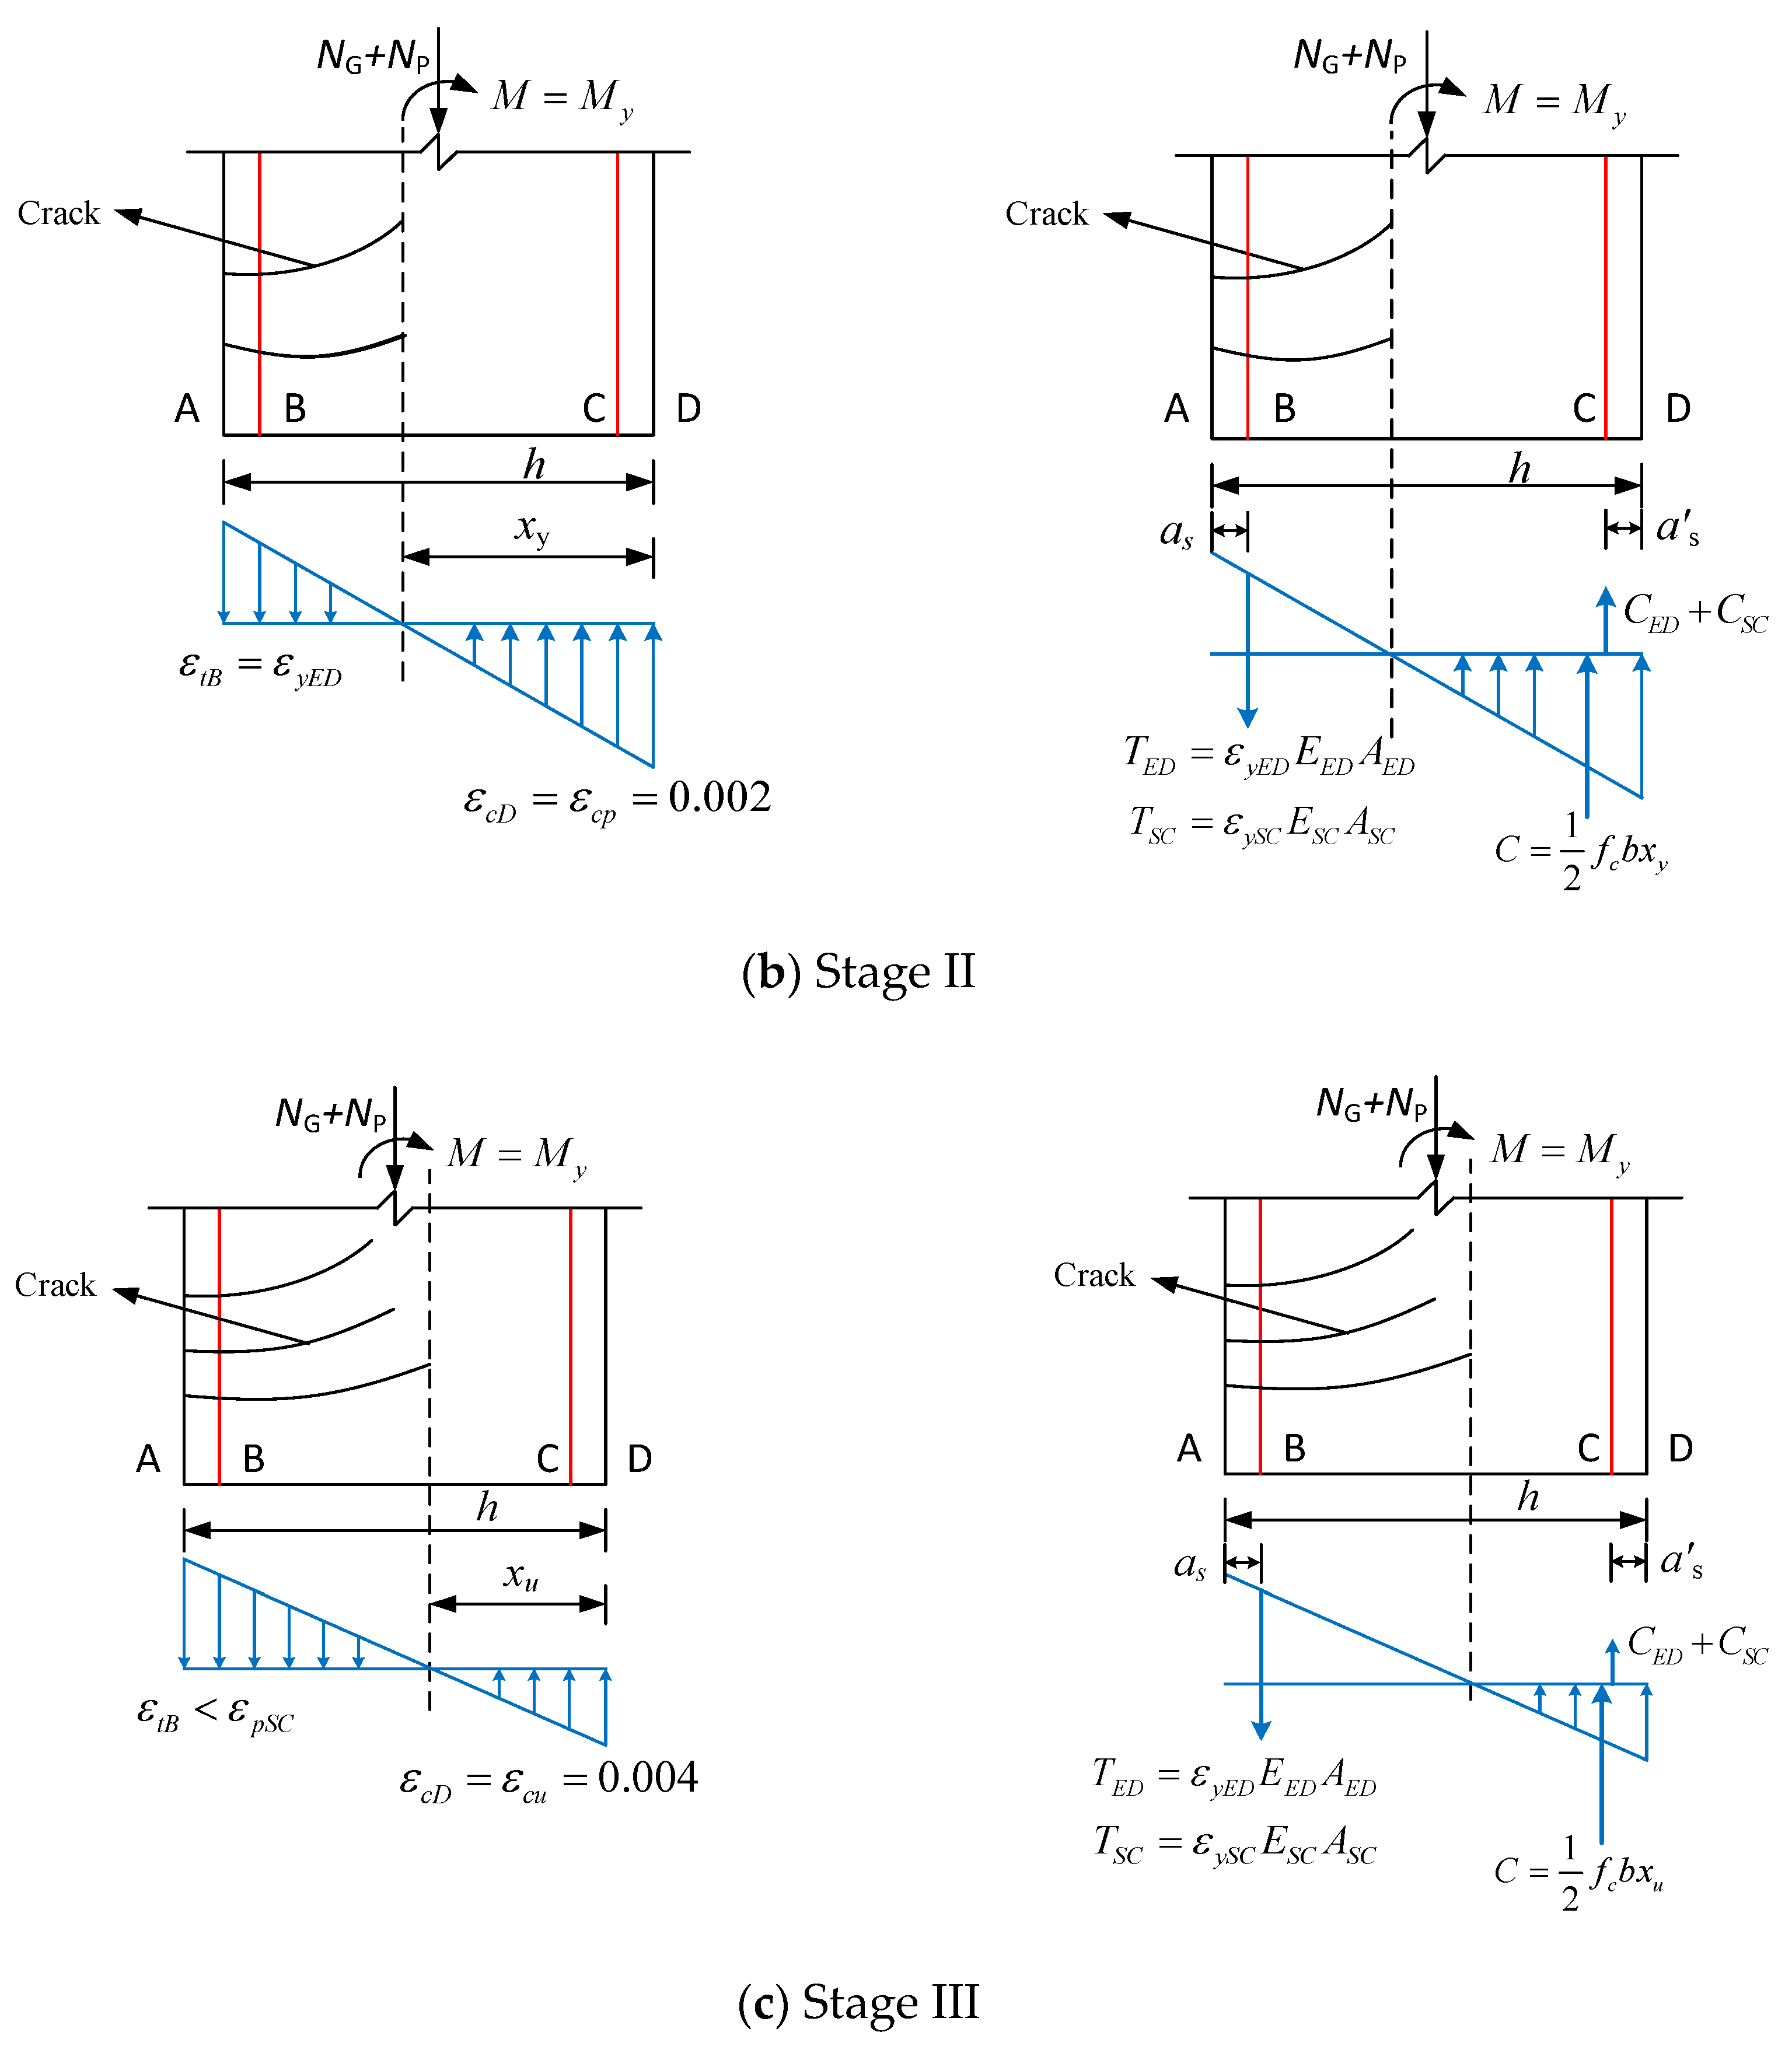
 M d e c

All the materials in the cross-section are in the elastic working state in this decompression stage. When the entire concrete cross-section is under compression with the minimum compressive stress reaching zero, the corresponding bending moment is termed the decompression moment. For the pier top, this decompression condition (associated with peak lateral capacity) can be formulated as   F d e c = M d e c / H . In the decompression stage, the cross-section axial force and bending moment equilibrium equation is
N G + N p 1 2 f c · b · h = 0                                                                                                           M d e c = 1 2 f c · b · h · 2 3 h a s ( N G + N p ) ( h 2 a s )
where f c is the design value of the concrete shaft.

2.2.2. Stage II: The Bending Moment M Continues to Increase Until the Energy-Consuming Reinforcement Enters the Yield State

When the bending moment M is larger than the decompression bending moment M d e c , the fibres on the A side of the cross-section start to be tensile, and when the bending moment   M continues to increase to the yielding moment   M y , the energy-consuming reinforcement B reaches the yielding moment, and the strain at B is the strain in the energy-consuming reinforcement, and the corresponding height of the compression zone of the cross-section is recorded as x y , and at this time, there is no damage to the concrete, prestressing reinforcement and FRP reinforcement. When the energy-consuming reinforcement yields in tension, the fiber compressive strain at the compression edge of concrete D in the diagram ε c D reaches the peak compressive strain of unconfined concrete. From the Kent–Scott–Park model [25], the uniaxial monotonic compressive stress–strain curve of unconfined concrete can be considered as linear, and   ε c p is taken as 0.002 before the peak compressive strain. In summary, the combined force provided by the concrete in the compression zone C c is
C c = 1 2 f c · b · x y
where x y is the height of the cross-sectional compression zone when the energy-consuming reinforcement yields. From Figure 2b, it can be seen that the reinforcement in the compression zone is not yielded, and the combined force of the energy-consuming reinforcement in the compression zone C E D and the combined force of the FRP reinforcement C S C are, respectively, as follows:
C E D = ( 0.002 x y a s x y ) E E D A E D C S C = ( 0.002 x y a s x y ) E S C A S C    
where a s is the distance between the resultant point of the longitudinal reinforcement on the large compressive stress in the compression area to the edge of the section, E E D is the compressive modulus of elasticity of energy-consuming reinforcement, E S C is the compressive modulus of elasticity of FRP reinforcement, A E D is the cross-sectional area of energy-consuming reinforcement in the compressive zone, and A S C is the cross-sectional area of FRP reinforcement in the compressive zone. The combined forces of energy-consuming reinforcement T E D and FRP reinforcement T S C in the tension zone are
T E D = ε y E D E E D A E D T S C = ε y S C E S C A S C  
where ε y E D is yield tensile strain of energy-consuming reinforcement (B-point tensile strain), ε y S C is the tensile strain of FRP reinforcement (B-point tensile strain), E E D is the tensile modulus of elasticity of energy-consuming reinforcement, E S C is the tensile modulus of elasticity of FRP reinforcement, A E D is the cross-sectional area of energy-consuming in the tensile zone, and A S C   is the cross-sectional area of FRP reinforcement in the tensile zone.
Therefore, the coupled equilibrium conditions governing axial forces and flexural moments at this critical state are derived as follows, and the yield horizontal bearing capacity of the corresponding member F y is equal to M y / H .
N G + N p + T E D + T S C C E D C S C = 0                                                                                                                                     M y = C c h x y 3 a s + C E D + C S C h a s a s ( N G + N p ) ( h 2 a s )

2.2.3. Stage III: The Bending Moment M Continues to Increase Until the Section Breaks

The bending moment M increases until the confined concrete at the compression edge attains its enhanced ultimate strain ε c u , at which time the bending moment M is called the ultimate bending moment of the cross-section of the hybrid-reinforced self-centering segmental assembled abutment M u , the compressive region extends to a height of x u , and the peak load carrying capacity is F u . The literature [26,27,28] shows that the peak compressive strain of FRP reinforcement is much larger than the ultimate compressive strain of unconfined concrete, and the FRP reinforcement is in an elastic working state when the concrete is damaged. In this case, ε c u is recorded as 0.004 . According to the calculation principle of stage II, the ultimate flexural capacity of the member section M u and the peak capacity of F u can be obtained.

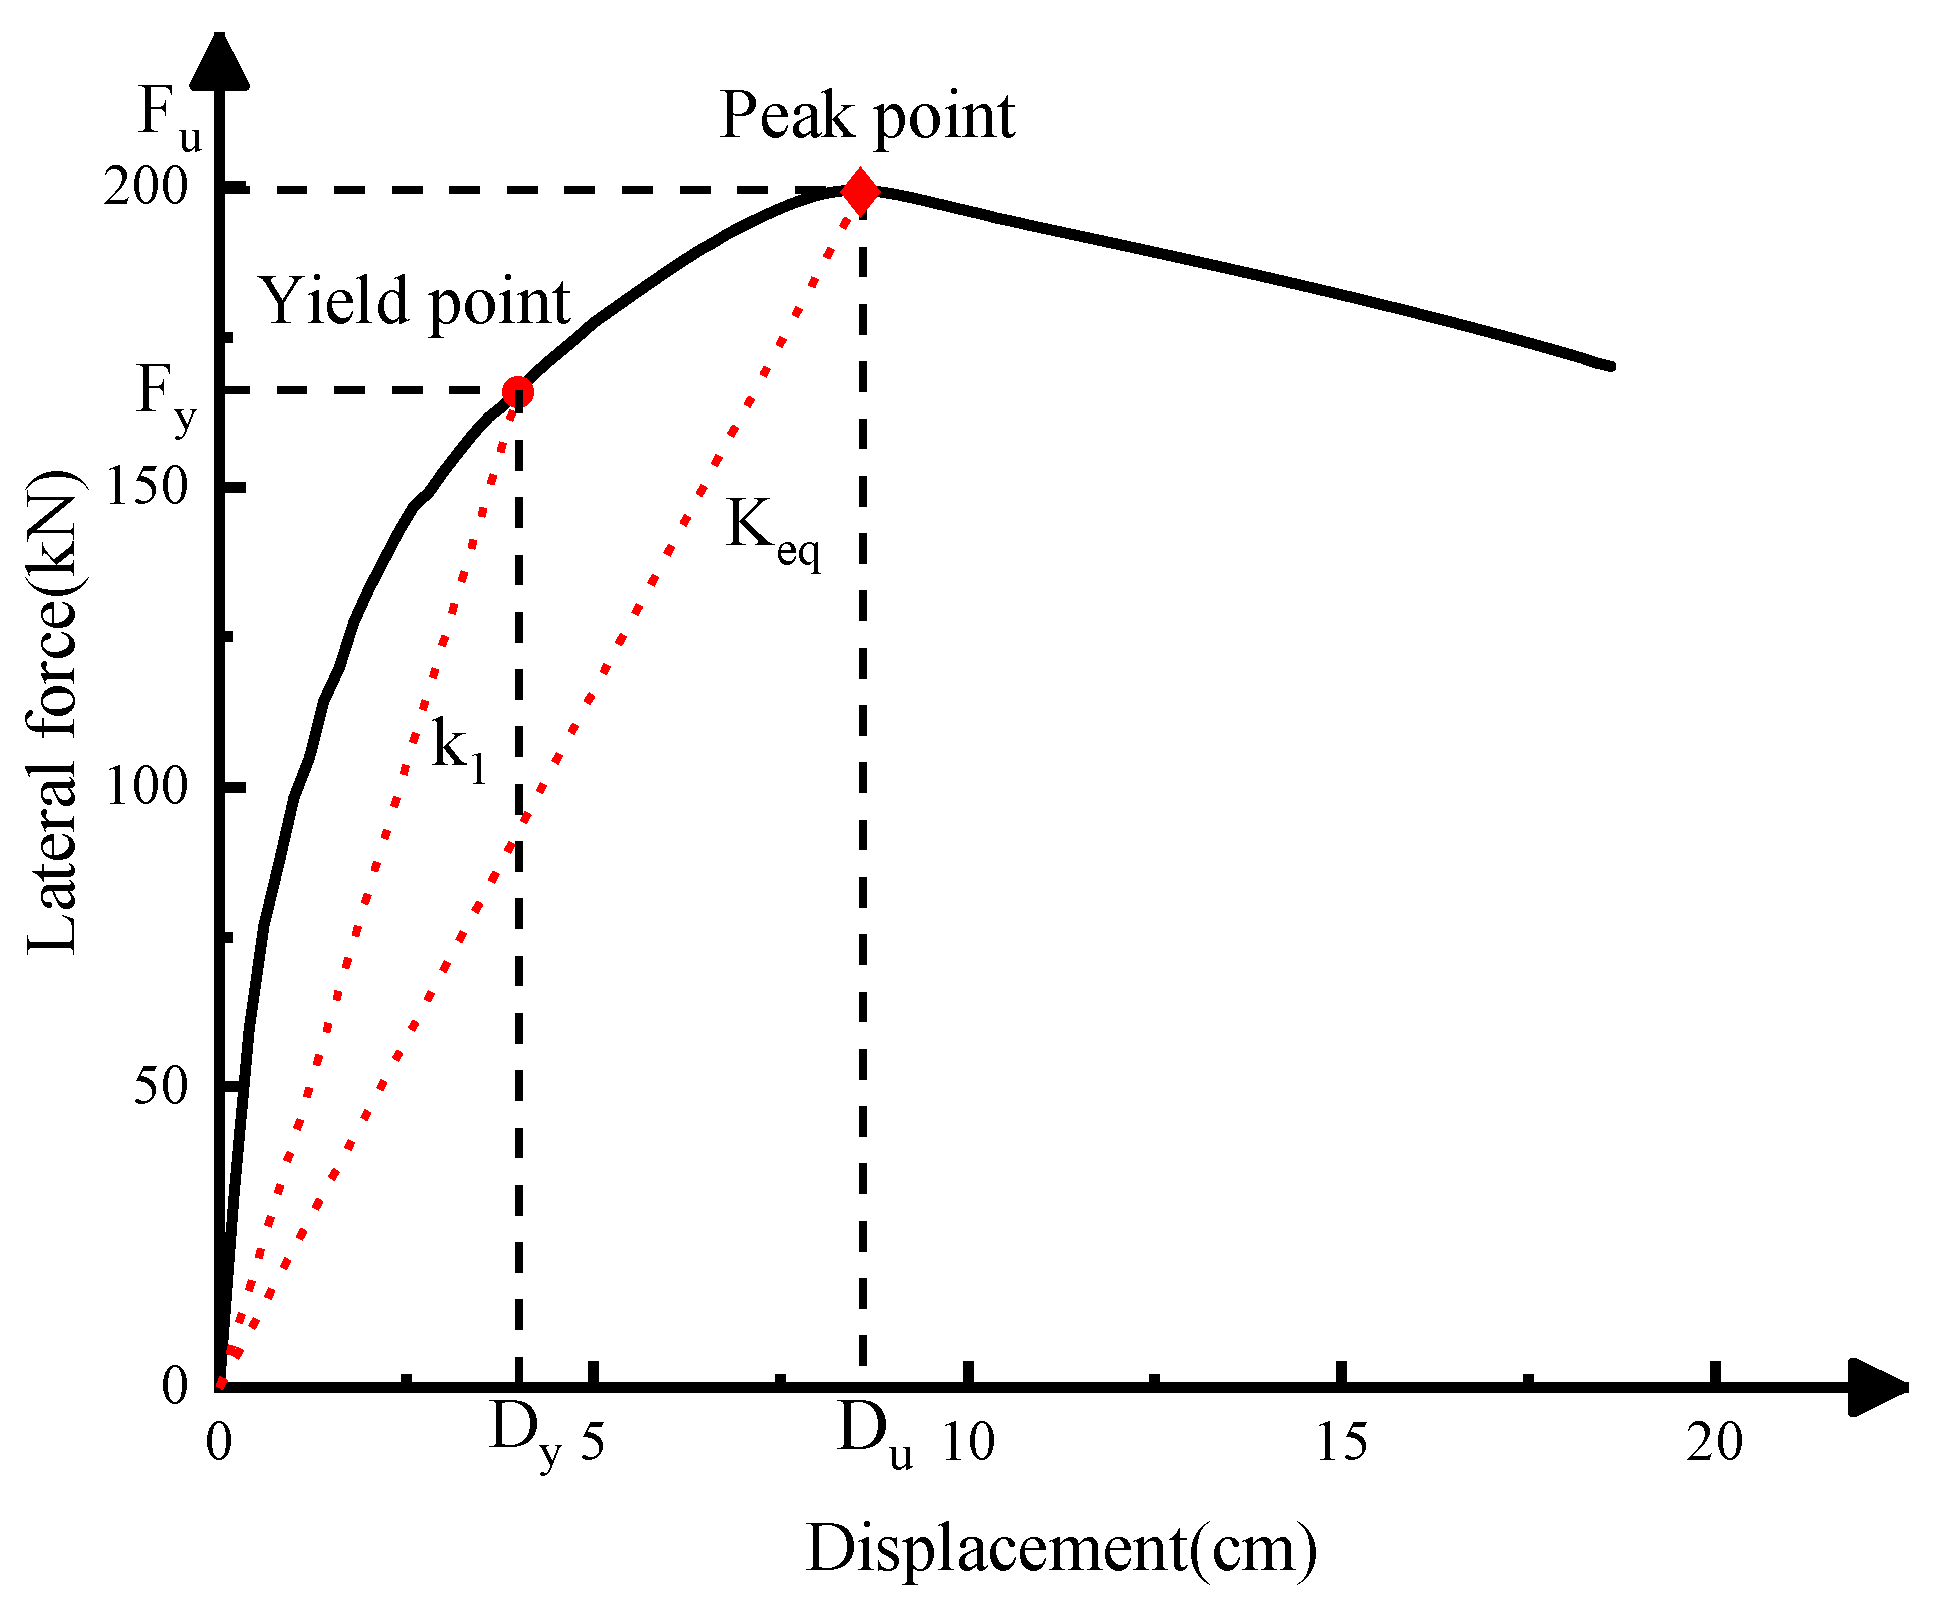
2.3. Equivalent Elastic Stiffness Derivation

To investigate the mechanical properties of SHR-SCSAB in the elastic stage under frequent earthquakes, the secant stiffness corresponding to the peak point of the backbone curve is defined as the equivalent elastic stiffness of the segmental piers. In this section, the sectional rotational stiffness is derived based on the stress and deformation characteristics of the cross-section at the joint and the mechanical properties of each material in the hybrid reinforcement. Through displacement equivalence enforcement at ultimate lateral resistance, the equivalent elastic stiffness of the SHR-SCSAB pier system is analytically formulated.
When the load bearing capacity F d e c < F < F u , the abutment base joints undergo tensile separation, as shown in Figure 3, at which time the external load produces a bending moment on the section I-I at the joints:
M I I = F H N G + N P ( h 2 x u )
where F is the horizontal force exerted on the top of the bridge pier and h is the pier width. N P This can be calculated according to the following formula:
N p = N p 0 + N p = N p 0 + σ p · A p
where N p 0 is the initial pretension of the prestressing reinforcement, A p represents the total prestressing area, and σ p characterizes the stress increment in prestressing tendons induced by pier base opening. The stress increment in prestressing tendons, induced by pier base joint displacement, is determined using the following formulation. The corresponding mechanical behavior is illustrated in Figure 4.
σ p = M I I · y 3 A i y i 2 = M I I ( h 2 x u ) A i y i 2
where A i is the area of tension and compression steel ( A s i ,   A p ) and the area of compression concrete ( A c ), and y i is the distance from the point of action of the compressive stress in section I-I to the point O ( i = 1, 2, 3, 4).
In the analysis of pier section I I , a triangular stress profile is adopted for the concrete compression zone extending over depth x u , with the stress resultant positioned at 1/3 x u from the extreme compression fiber. Then, the stress of each tensile reinforcement at σ s 1 , the stress of each compressive reinforcement at σ s 2 , and the equivalent stress of the concrete in the compression zone at σ c can be calculated using the following formula:
σ s 1 = M I I · y 1 A i y i 2 = M I I ( h 2 x u + ( h 2 a s ) ) A i y i 2 σ s 2 = M I I · y 2 A i y i 2 = M I I ( x u a s ) A i y i 2                                       σ c = M I I · y 4 A i y i 2 = M I I · 2 3 x u A i y i 2                                                
It is postulated that prestressing tendon elongation primarily results from pier base joint opening, while elongation induced by flexural deformation of the abutment pier body is negligible. As demonstrated in Figure 4, the resulting tendon elongation L p is
L p = ε p H = σ p E p H
where ε p is the strain of the prestressing tendon caused by the joint tensioning and E p is the modulus of elasticity of prestressing tendon. From the geometric relationship at section I-I (Figure 4), the corner at the joint at the bottom of the abutment θ is
θ = L p h 2 x u = σ p E p · H h 2 x u
The bending moment at the abutment’s base section I I can be determined using the following equation:
M I I = ( σ s i · A s i ) y i + σ p · A p · ( h 2 x u ) + σ c · ( b · x u ) · 2 3 x u
Then, the rotational stiffness K θ of the section I-I at the abutment base joint can be expressed as
K θ = ( σ s i · A s i ) y i + σ p · A p · y p + σ c · ( b · x u ) · 2 3 x u σ p E p · H h 2 x u
Bringing (Equation (10)) into (Equation (15)) gives
K θ = [ A s 1 h x u a s 2 + A s 2 x u a s 2 + A p h 2 x u 2 + A c 2 3 x u 2 ] E p H
where A c is the area of concrete in the compression zone, i.e., A c = b · x u . From Equations (8) and (16), the corner θ of the section I−I at the joint at the abutment base joint is
θ = H [ F H N G + N P h 2 x u ] [ A s 1 h x u a s 2 + A s 2 x u a s 2 + A p h 2 x u 2 + A c 2 3 x u 2 ] E p
The yield stiffness of the pier of a hybrid-reinforced segmental assembled abutment k 1 [29] can be expressed as
k 1 = a 1 f c A 100 ( a 2 ρ E D + a 3 r H + a 4 n G + a 5 E S C f c + 1 a 6 λ + a 7 + a 8 )
where the regression coefficients a 1 a 8 are as follows: a 1 = 7.03 ; a 2 = 151.14 ; a 3 = 0.87 ; a 4 = 6.15 ; a 5 = 0.33 ; a 6 = 0.038 ; a 7 = 0.14 ; a 8 = 6.71 .
Where E S C is in G P a , f c is in M P a , A is the cross-sectional area of the pier column, in m 2 , and the unit of calculation results is k N / m m . Then, using Equations (17) and (18), the maximum transverse bearing capability of SHR-SCSAB corresponding to the displacement of the top of the pier can be expressed as follows:
= F k 1 + H 2 [ F H N G + N P h 2 x u ] [ A s 1 h x u a s 2 + A s 2 x u a s 2 + A p h 2 x u 2 + A c 2 3 x u 2 ] E p
Therefore, the equivalent shear stiffness at the joint of the SHR-SCSAB can be obtained by the ratio of the horizontal force acting on the pier to the displacement generated at the joint. The equivalent elastic stiffness of the pier is the ratio of the horizontal force acting on the pier to the sum of the elongation caused by the yielding of the reinforcement and the joint displacement. They can be calculated according to Equation (19).
K v θ = F A s 1 h x u a s 2 + A s 2 x u a s 2 + A p h 2 x u 2 + A c 2 3 x u 2 E p H 2 [ F H N G + N P h 2 x u ]
K e q = F F k 1 + H 2 [ F H N G + N P h 2 x u ] [ A s 1 h x u a s 2 + A s 2 x u a s 2 + A p h 2 x u 2 + A c 2 3 x u 2 ] E p

3. Analytical Models for Hybrid Systems

This section develops the finite element modeling protocol for SHR-SCSAB systems, addressing two primary components: the numerical treatment of pre-stressing tendons and structural joints, and the complete characterization of geometric dimensions and material properties required for model implementation.

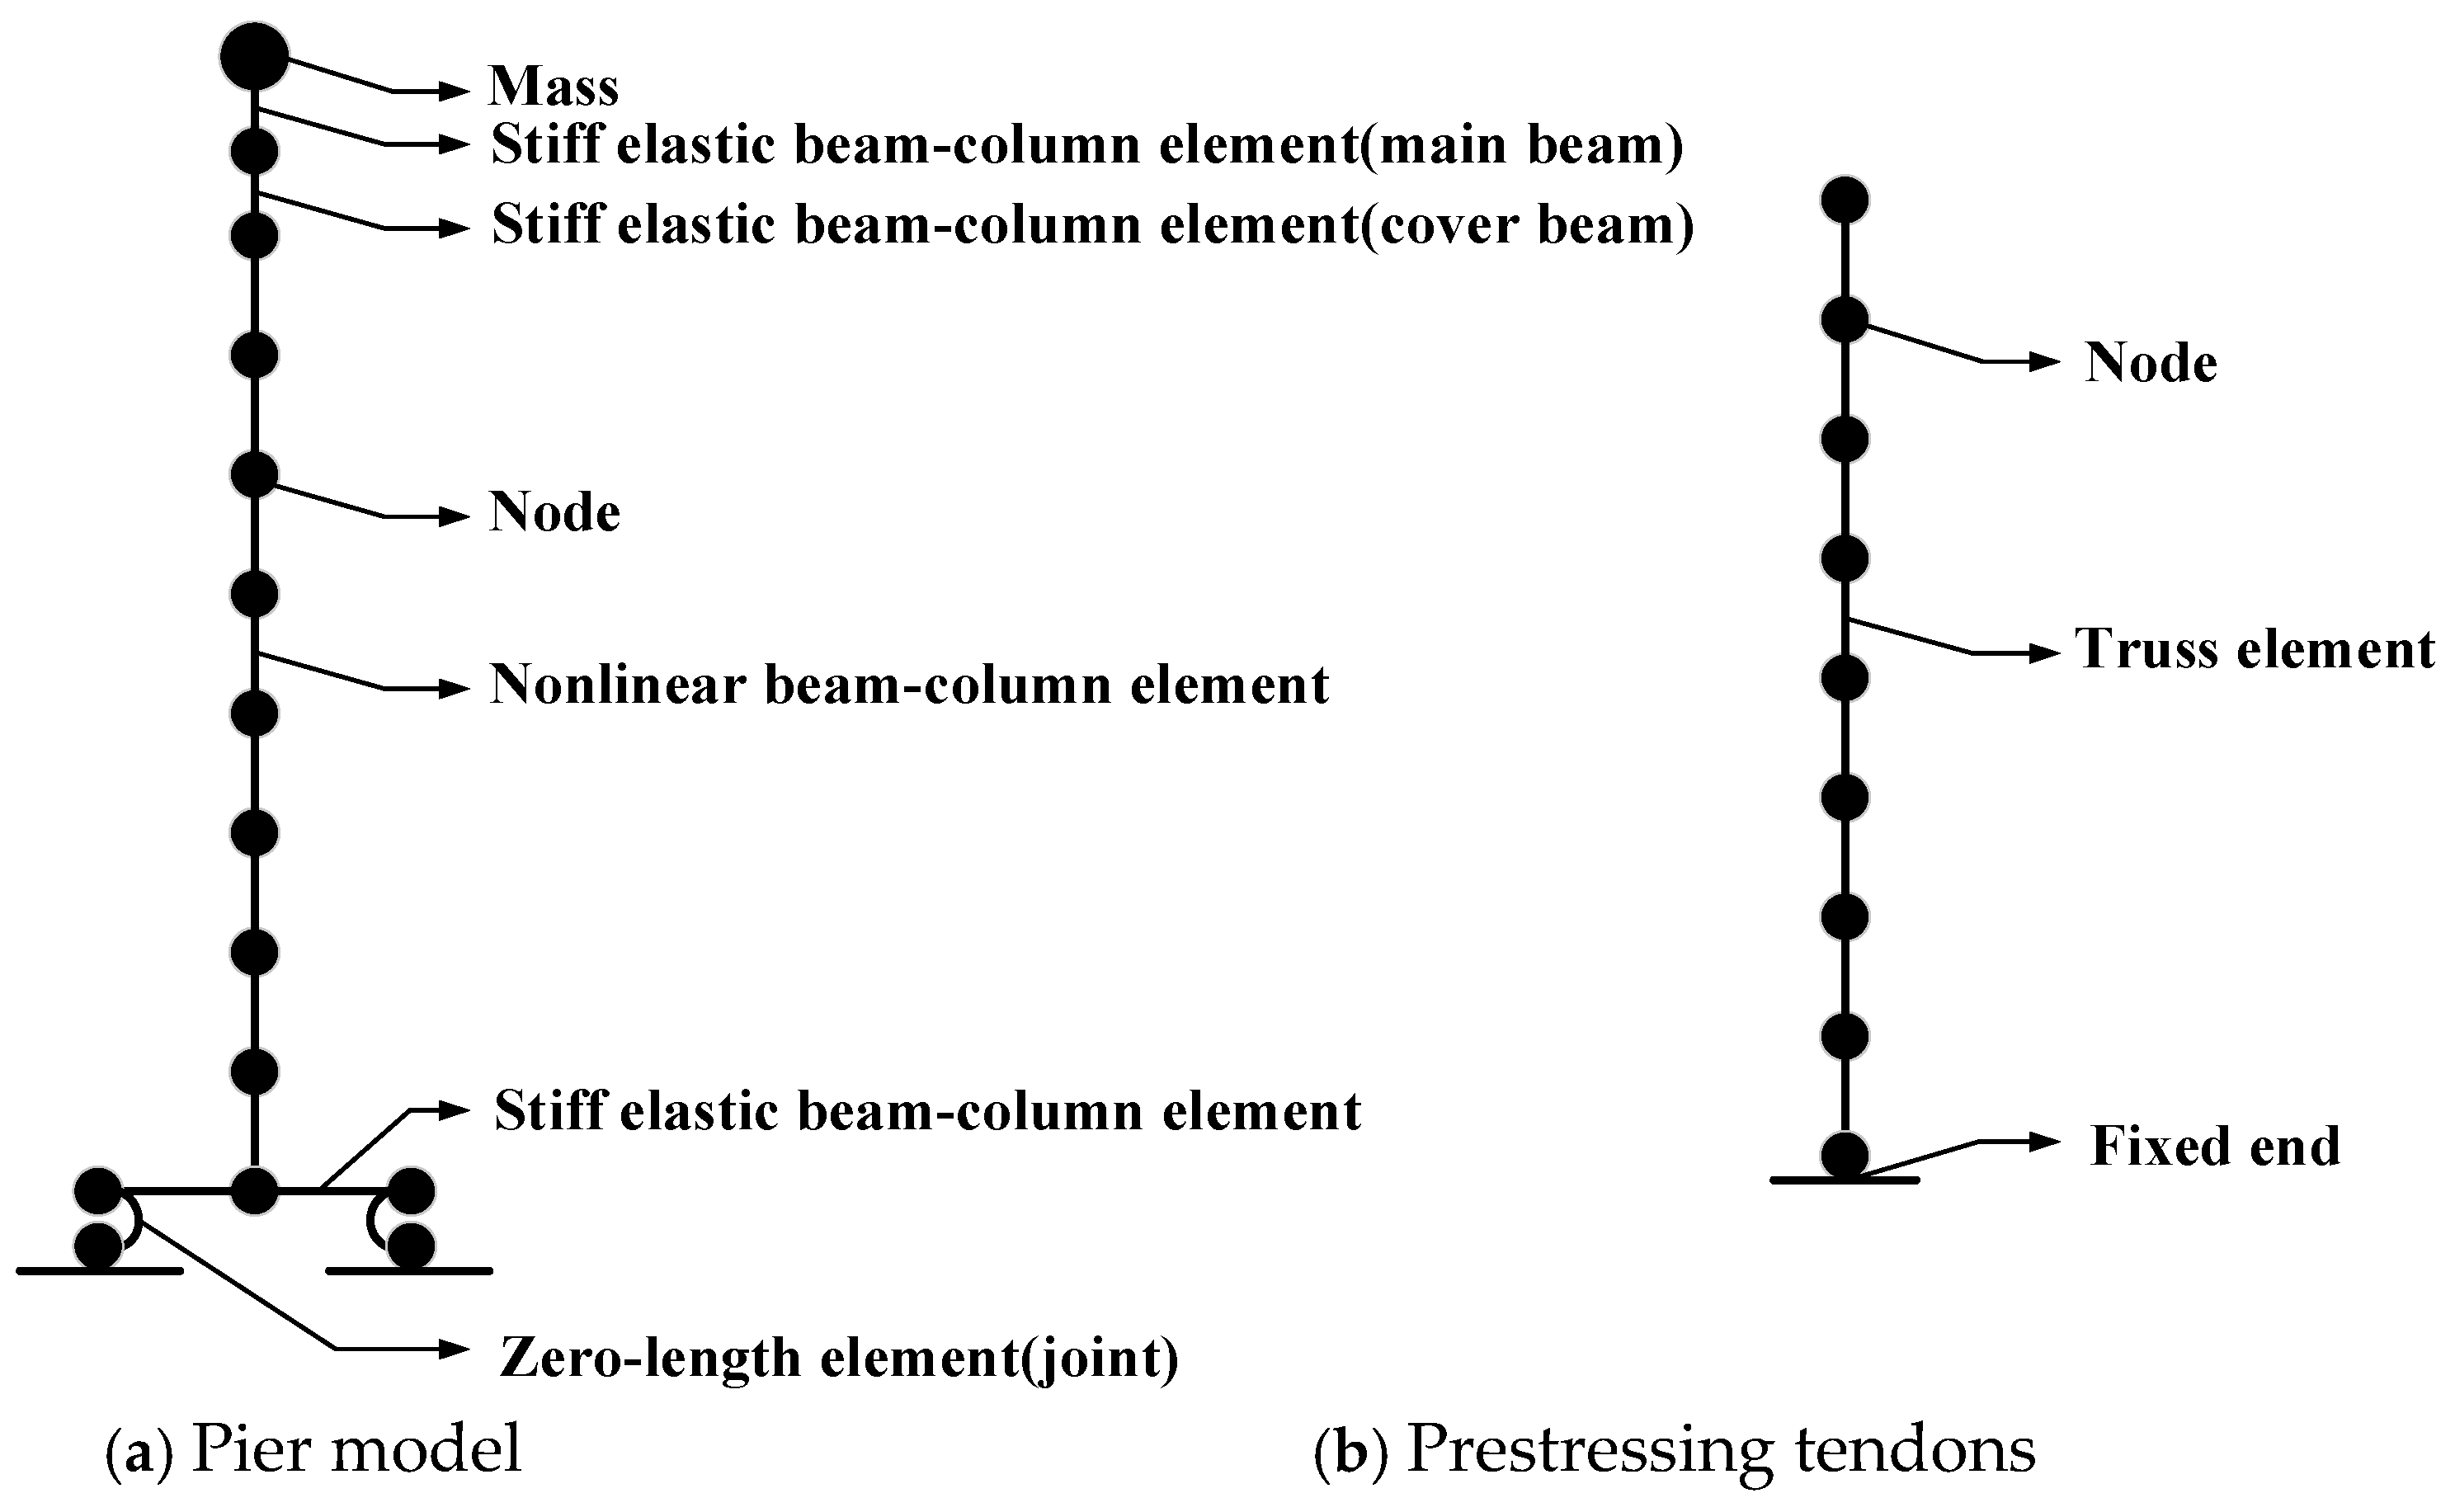
3.1. Finite Element Modelling

The finite element model of the SHR-SCSAB is shown in Figure 5. The pier segments are simulated using nonlinear beam–column elements, which serve as the main nodes. The unbonded prestressed tendons are simulated using truss elements, which act as the slave nodes. The equivalent degrees of freedom command is used to couple the degrees of freedom of master and slave nodes for each node of the unbonded prestressing tendons and its corresponding node of piers, and the master and slave nodes of the two ends are fully coupled with three degrees of freedom, while the nodes of the internal segments of the piers are partially coupled with the corresponding nodes of the unbonded prestressing tendons. The nodes at the internal segments of the abutment are partially coupled with the corresponding unbonded prestressing tendon nodes in the form of releasing the longitudinal degrees of freedom along the unbonded prestressing tendon to simulate the relative sliding between the unbonded prestressing tendon and concrete. The cross-sectional properties of the abutments were assigned to fiber sections, including concrete fibers, energy-consuming reinforcement fibers and FRP reinforcement fibers. Both unconfined and confined concrete constitutive models are simulated using the Concrete02 model, which is developed based on the Kent–Scott–Park model [30], which not only considers the tensile properties of the unloaded concrete but also analyses the mechanical properties of the concrete under compression with respect to the degradation of the stiffness during the process of unloading and reloading. Therefore, the Concrete02 model is used to simulate the concrete force characteristics of bridge piers more accurately. The energy-consuming and prestressing reinforcement constitutive models are simulated using the Steel02 model, which is developed based on the Giuffre–Menegotto–Pinto model [31], and it takes into account the isotropic strain effect of the reinforcement compared with the Steel01 model. Thus, the Steel02 model is used in this paper to simulate the reinforcement force characteristics more accurately. The FRP reinforcement is simulated by the elastic model, which can effectively simulate the linear constitutive relationship of the FRP reinforcement. In this paper, the zero-length unit is used to simulate the opening and closing of the pier joints and other deformation characteristics. As shown in Figure 5a, two rigid units are established at the bottom of the pier joints, and their lengths are half of the width of the pier, so as to simulate the width of the pier. The nodes at both ends of the rigid unit are connected to the nodes at the same coordinate position on the foundation using the zero-length unit, and the zero-length unit is endowed with a uniaxial material constitutive relationship that is only subject to pressure and not tension.

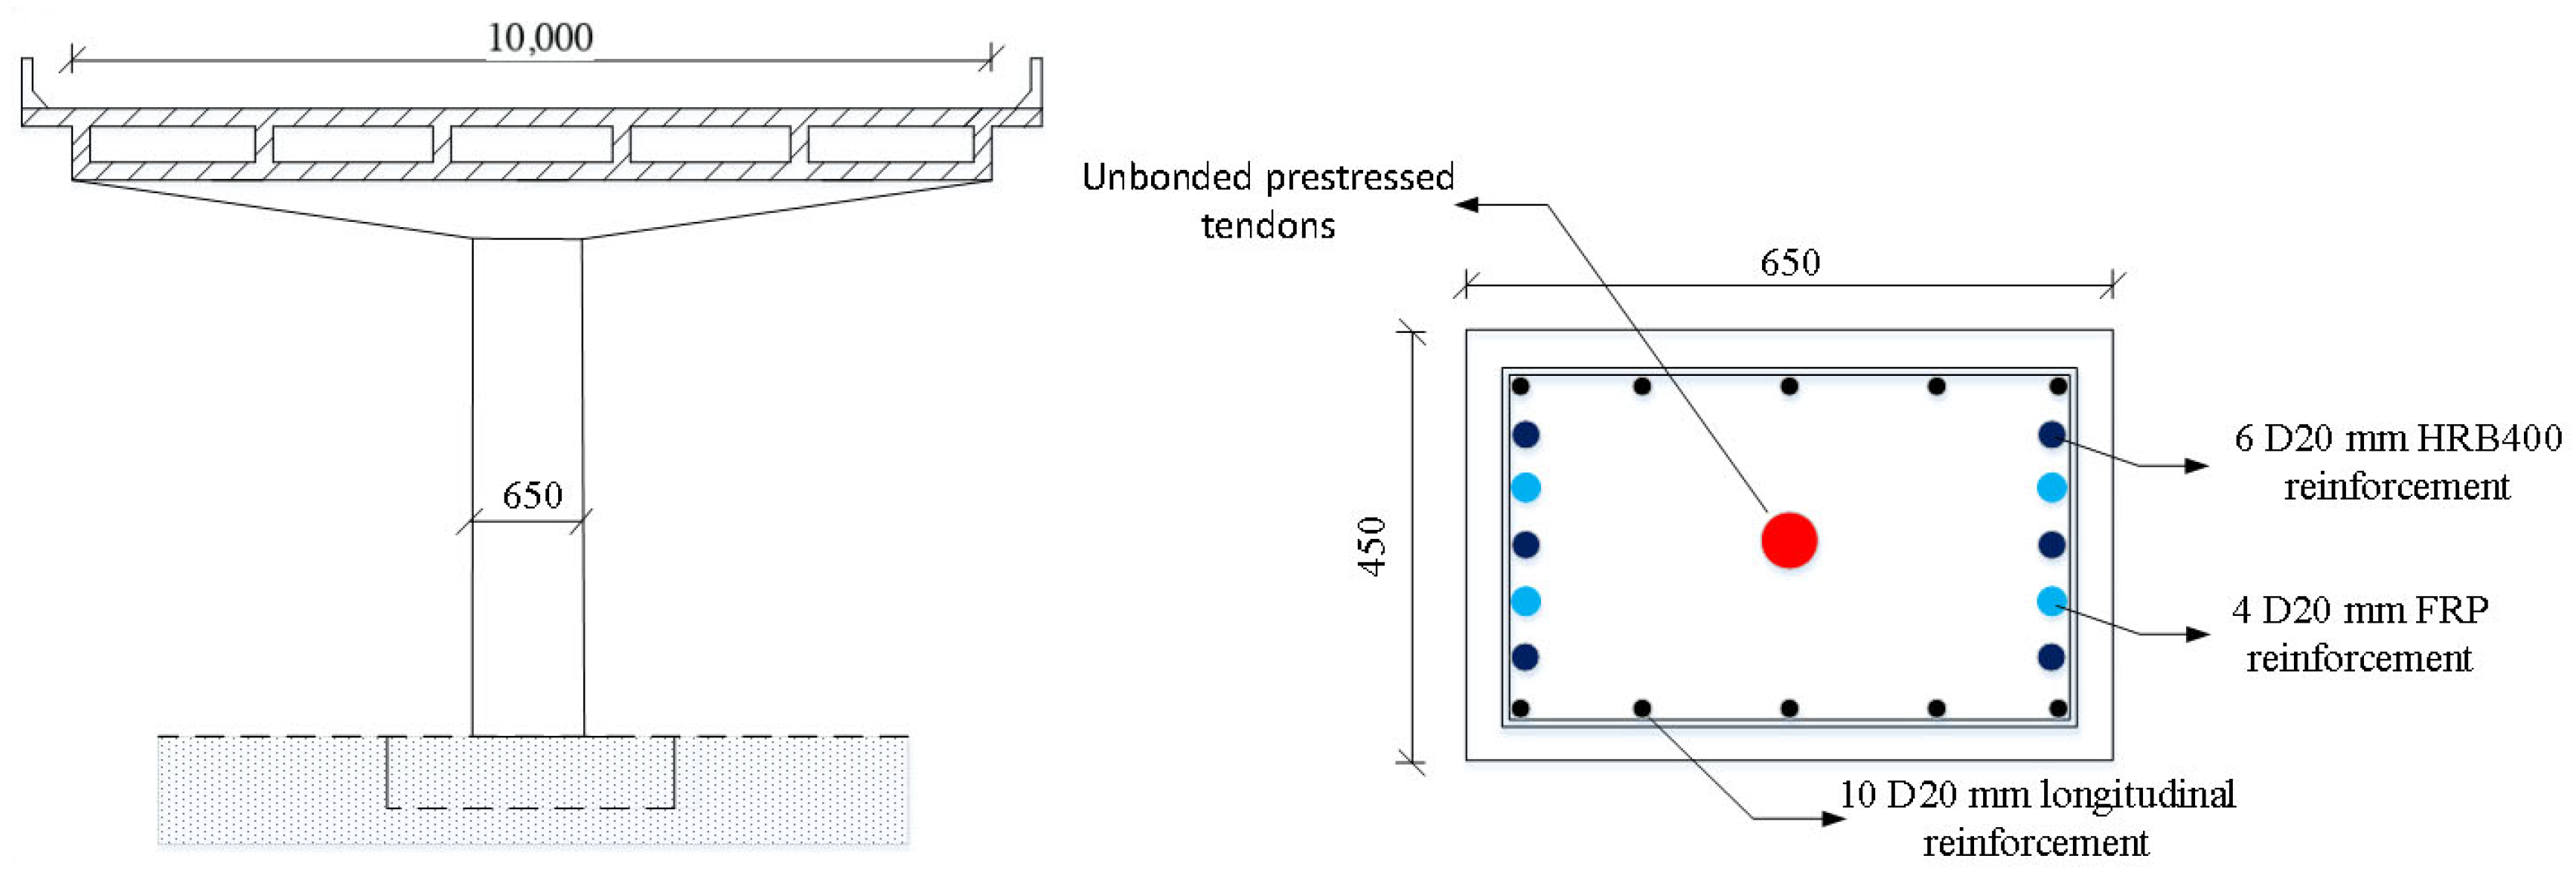
3.2. Description of Bridge

In this paper, two specific spans of a large-span viaduct are selected as numerical simulation objects. The SHR-SCSAB and reinforcement are shown in Figure 6. The axial compression ratio of the bridge superstructure under constant load is 0.1, the net height of the segmental assembled pier is 3200 mm, and the rectangular cross-section size is 450 mm × 650 mm. C40 concrete is selected as the concrete for the abutment; the total area of the prestressing strand is 558 mm2, and the initial prestress applied by the unbound prestressing tendons is 1000 MPa. Ten pieces of 10 mm-diameter rack bars and 16 mm-diameter bars with spacings of 16 mm are used for the segmental assembled piers. In the segmental assembled abutment, ten erecting bars with a diameter of 10 mm and rectangular hoops with a diameter of 16 mm and a spacing of 160 mm were used. Additionally, six HRB400 energy-consuming bars with a diameter of 20 mm and four FRP bars with a diameter of 20 mm were used for the longitudinal reinforcement running through the joints in the abutment. The material properties of the abutment are shown in Table 1.

4. Numerical Modelling

In this section, the finite element software Opensees 1.0.0.1 is used to establish the finite element model of the SHR-SCSAB under the horizontal seismic action of the transverse bridge and carry out the seismic performance analysis. The results of the seismic performance analysis are compared with the theoretical calculations under the horizontal seismic action of the transverse bridge, and the correctness and reliability of the theory of equivalent elasticity stiffness of the SHR-SCSAB are verified. Then, the above numerical simulation method is used to carry out the monotonic pushover analysis and hysteretic response analysis of SHR-SCSAB with different parameters under the horizontal earthquake action of the transverse bridge. Then, the above numerical simulation method is used to carry out monotonic pushover analysis and hysteretic SHR-SCSAB with different parameters under the horizontal seismic action in the transverse direction to explore the influence of different parameters on the seismic performance of SHR-SCSAB. The selected parameters mainly include the mixing ratio r H (the area ratio of FRP reinforcement to energy-consuming reinforcement), gravity axial pressure ratio n G and shear span ratio λ .

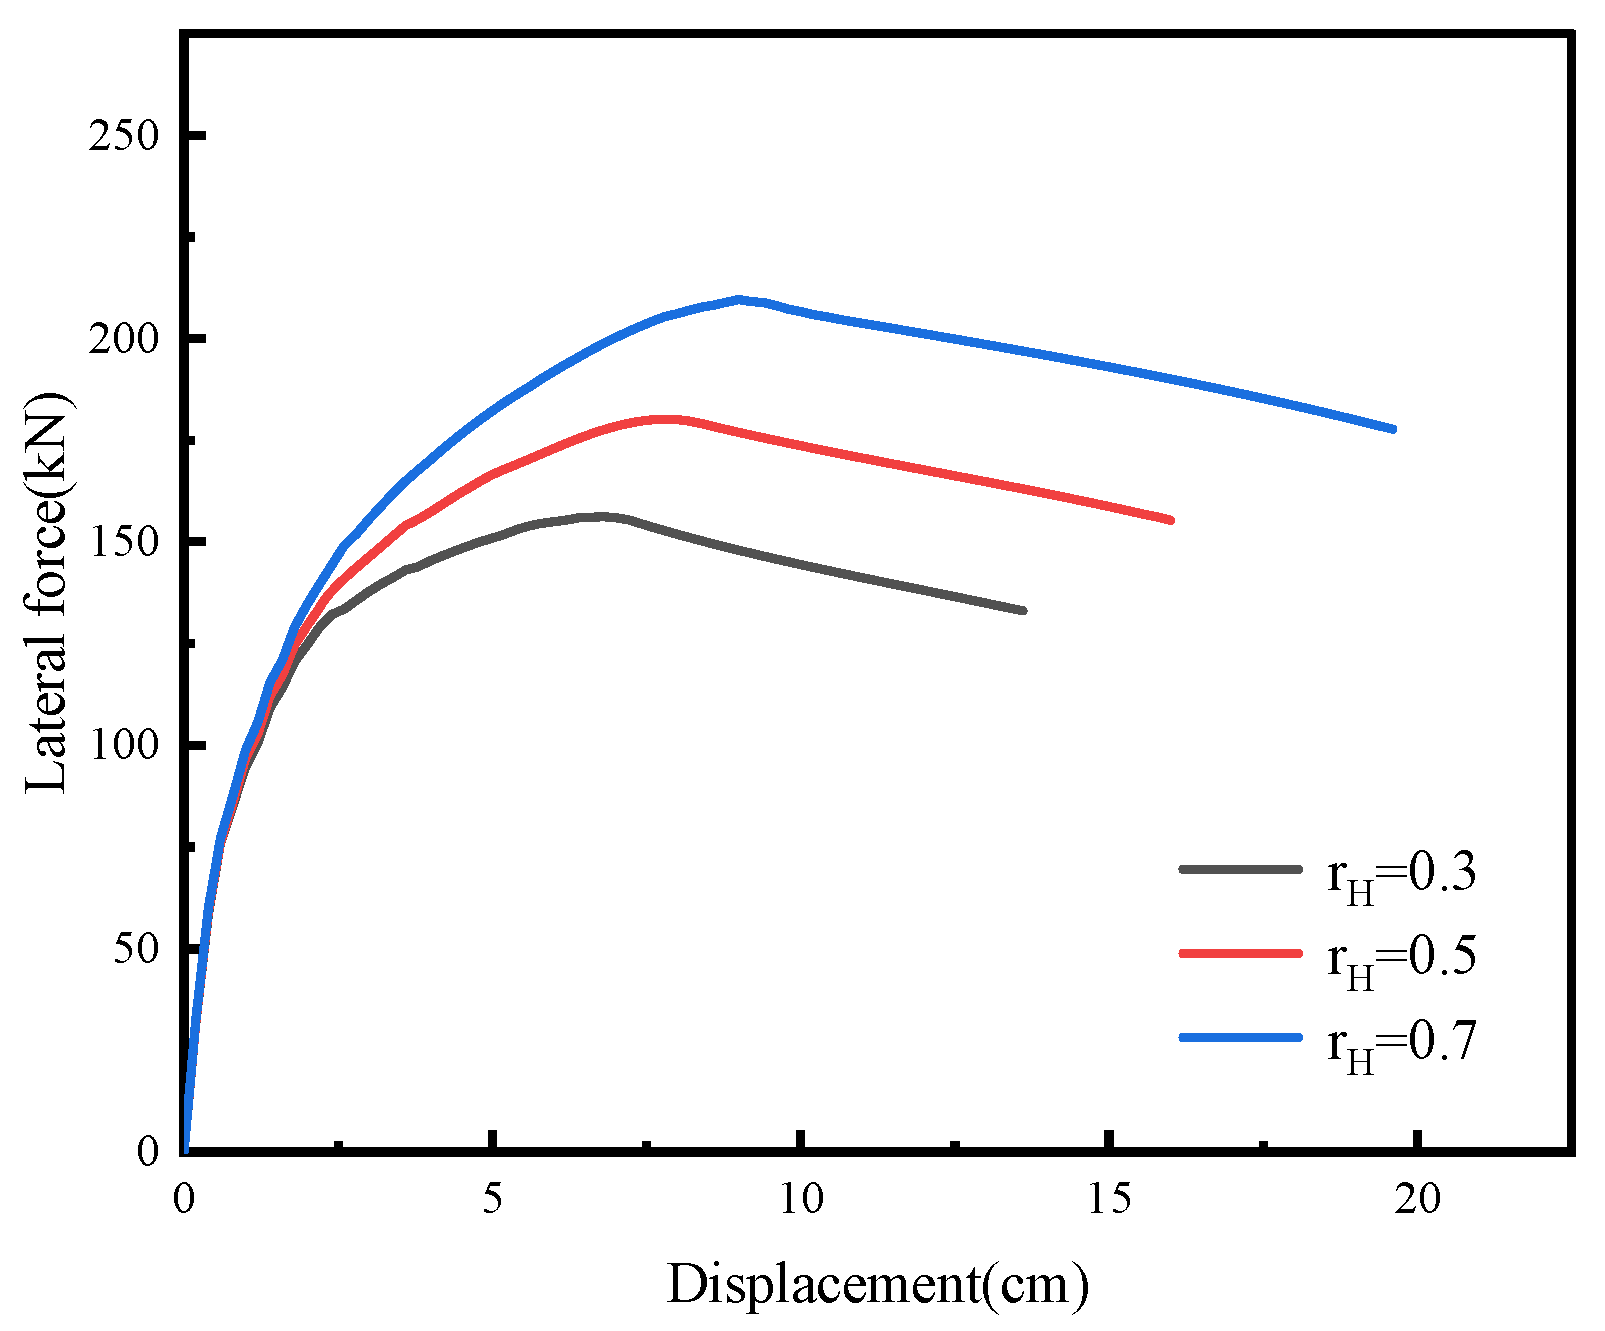
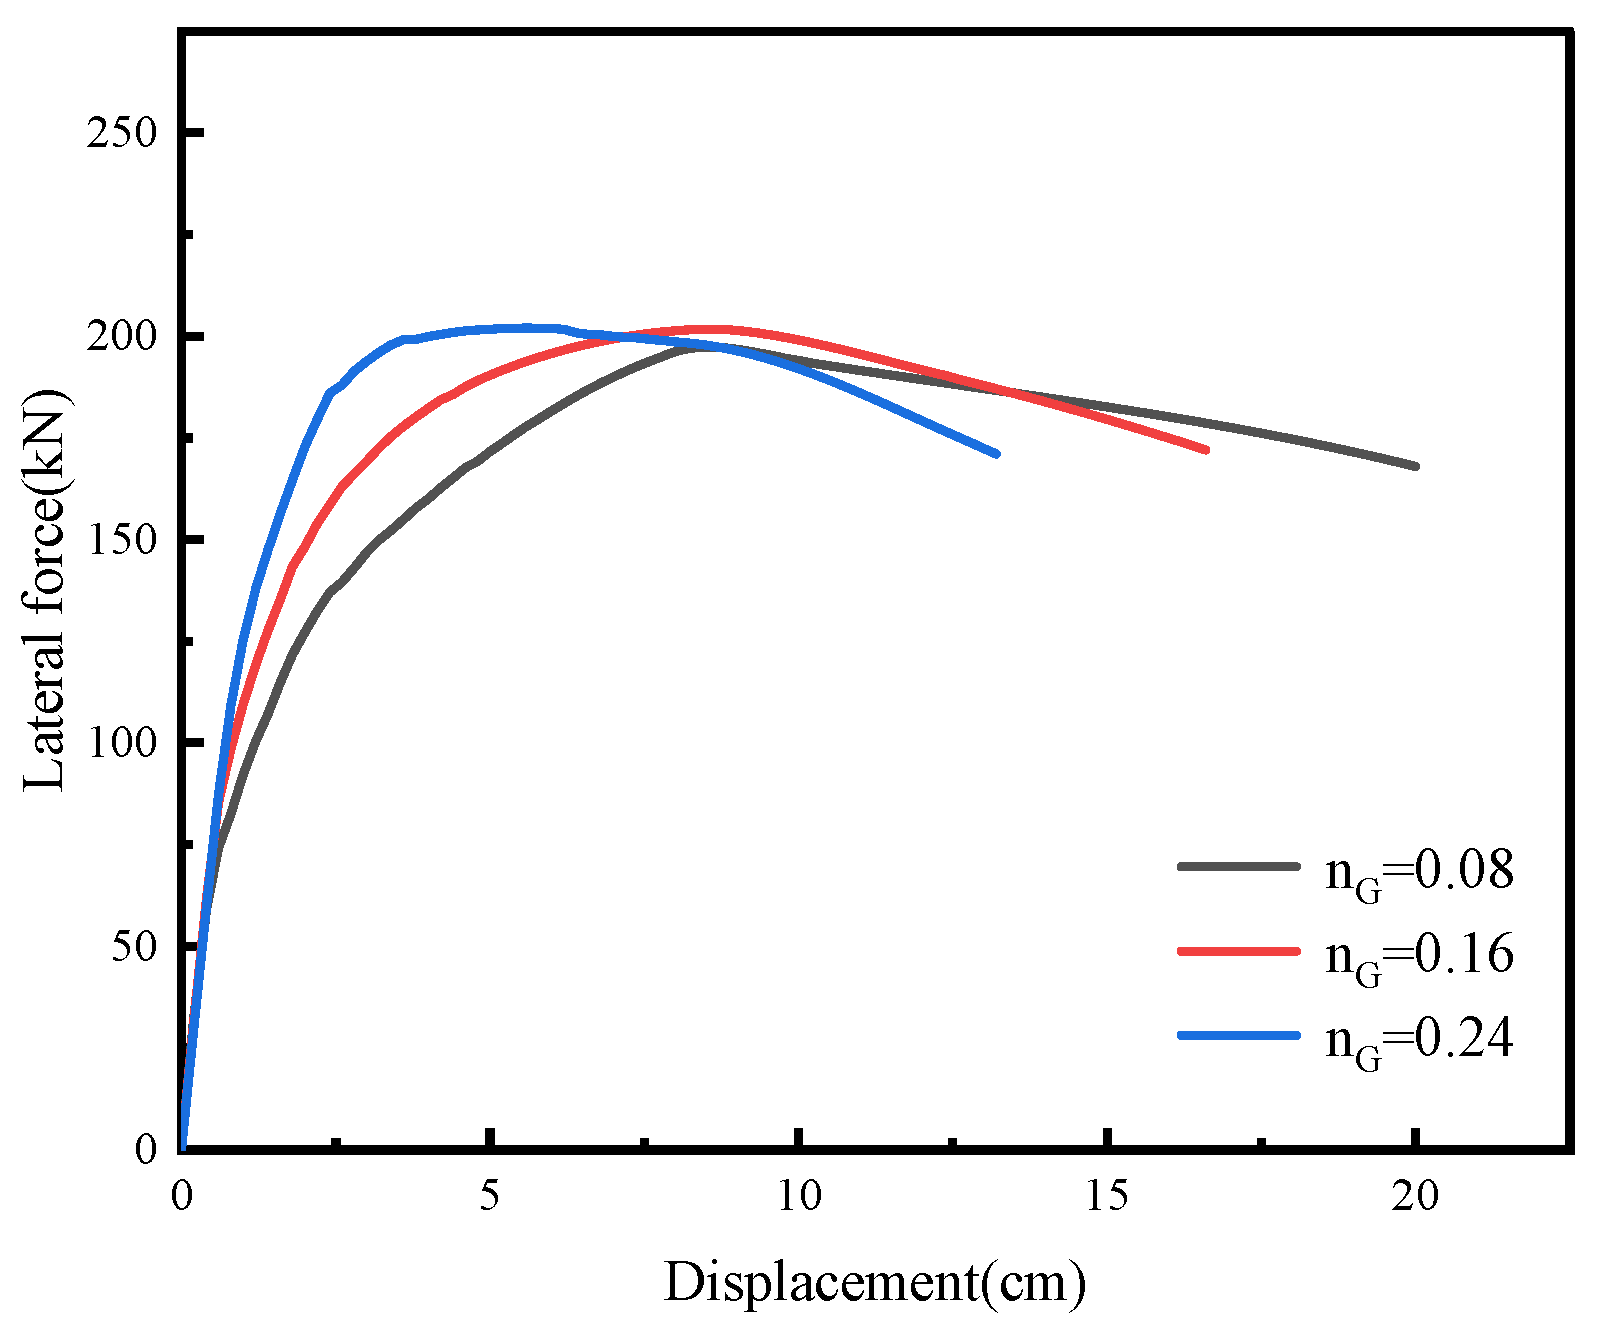
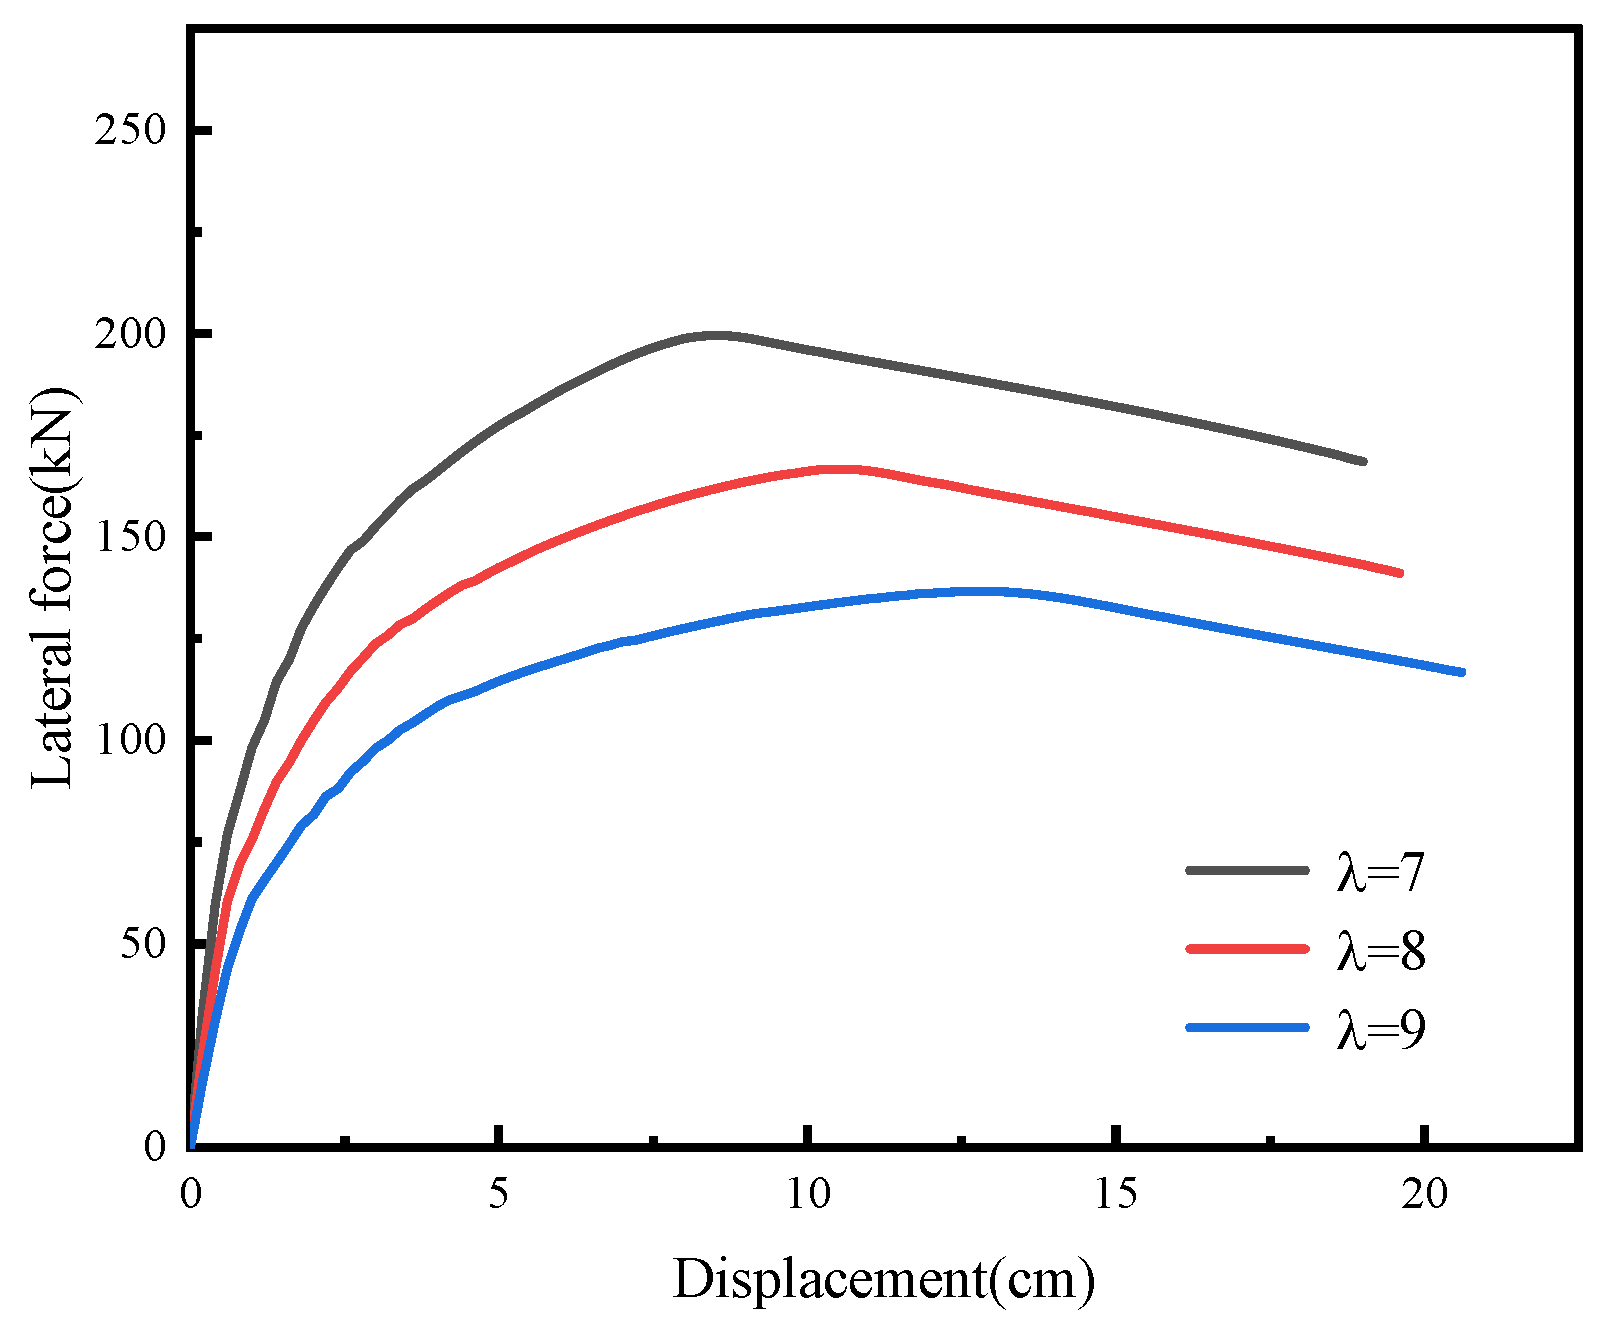
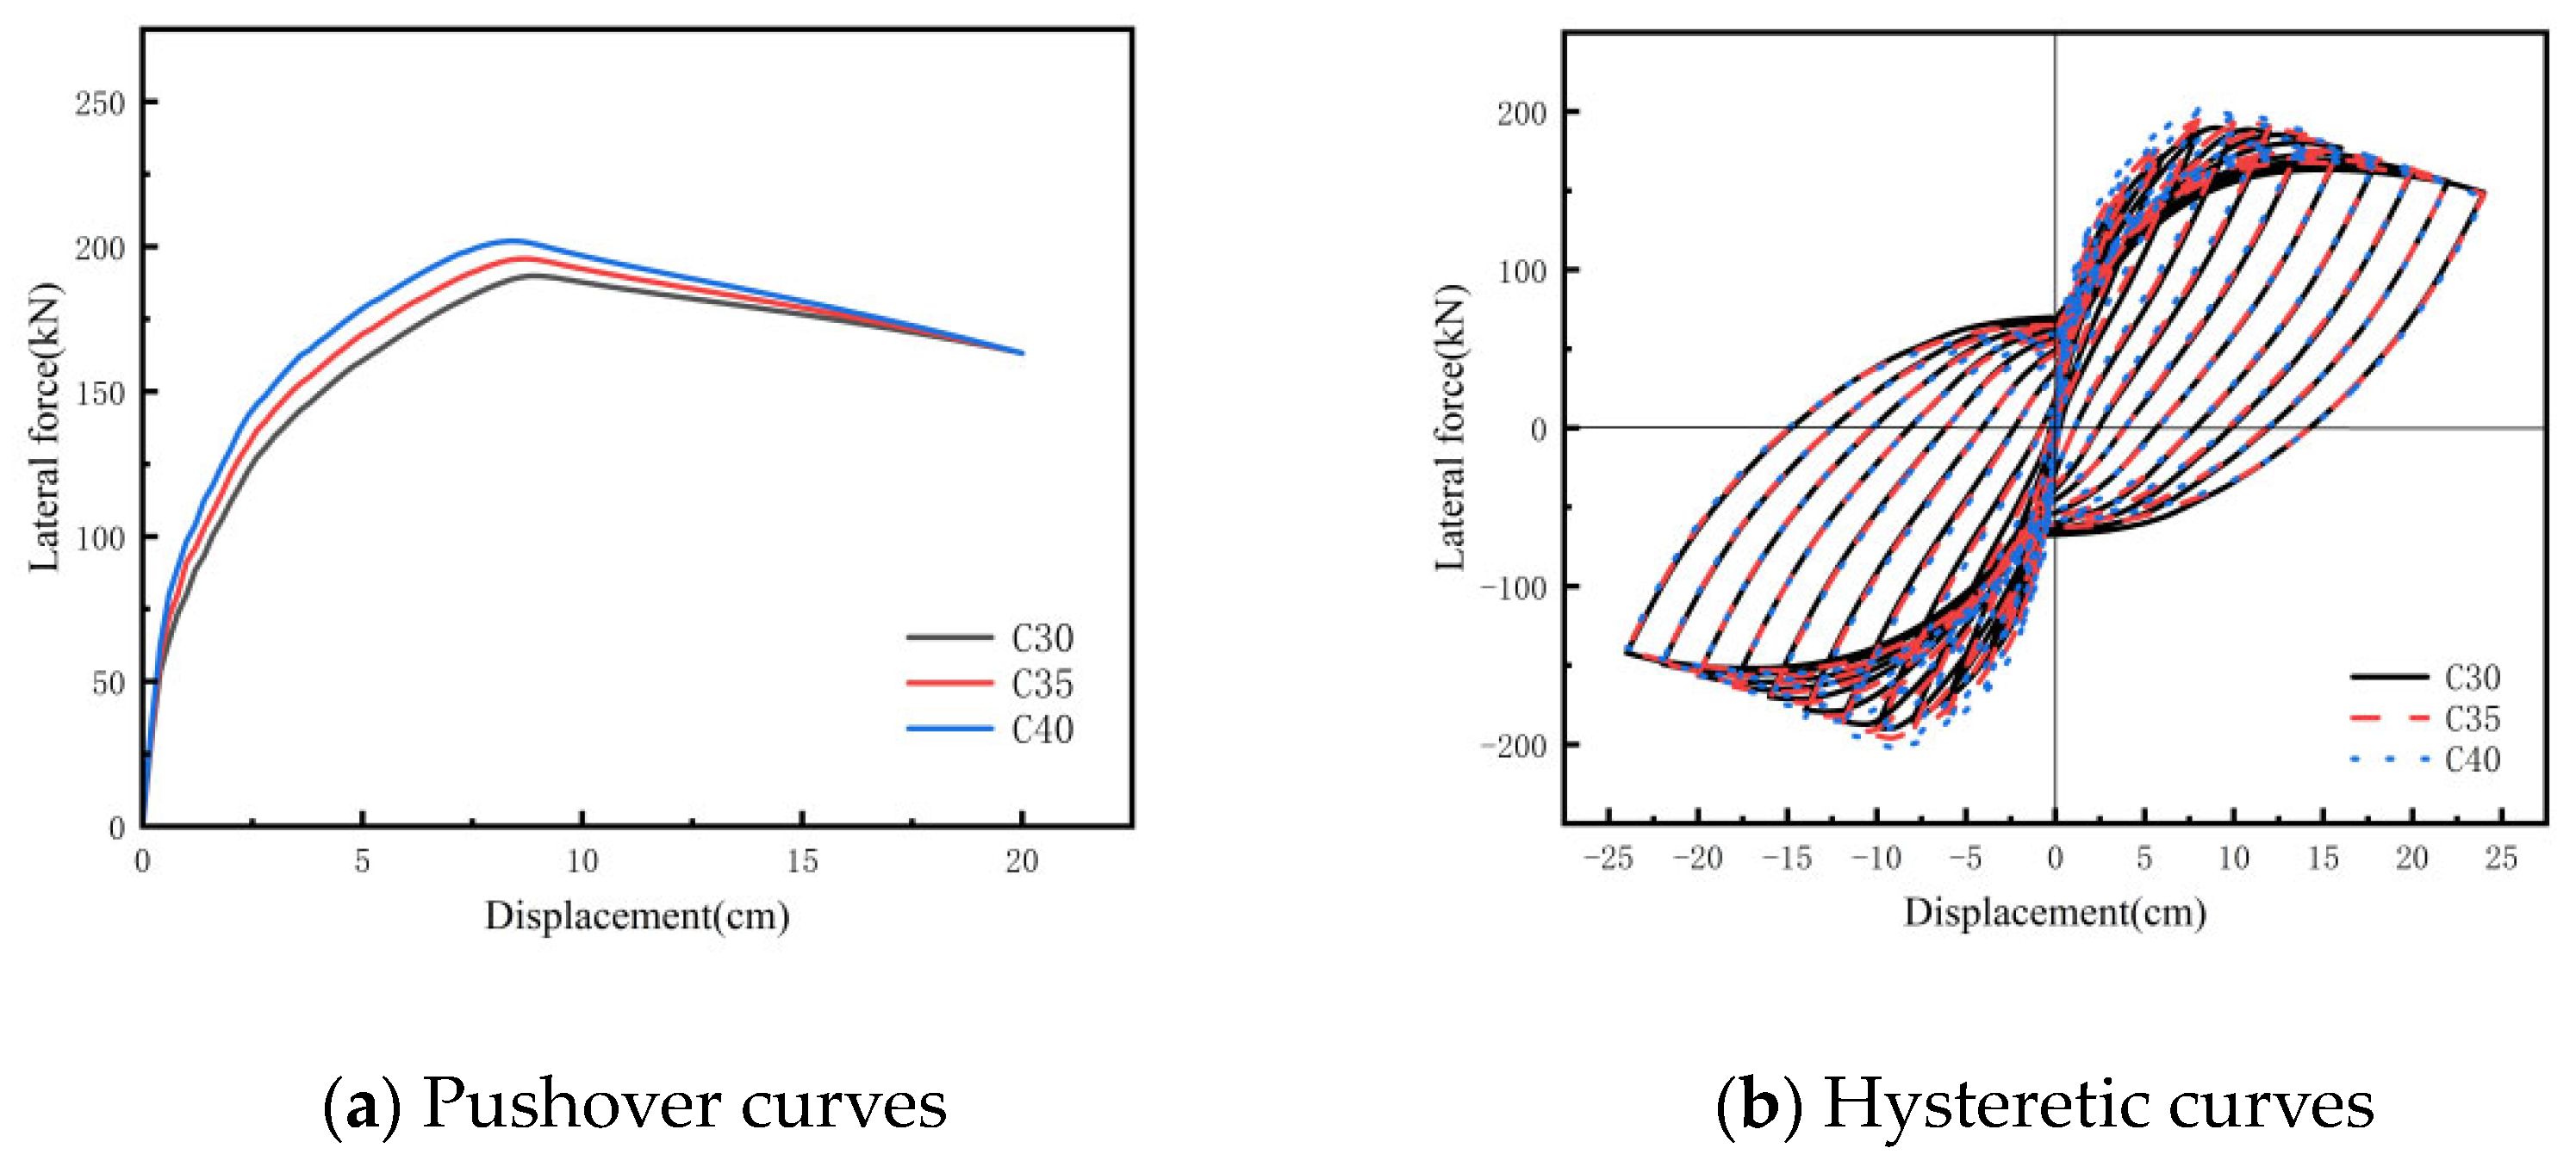
4.1. Pushover Analysis

Based on the aforementioned modeling approach and selected geometric and material parameters of SHR-SCSAB, a finite element model was built. Using OpenSees, the backbone curve analysis was conducted for the hybrid-reinforced segmental pier, with the resulting backbone curve presented in Figure 7. The characteristic points of the backbone curve are identified as follows: the peak point coordinates represent the maximum displacement D u and ultimate load capacity F u , while the yield point coordinates indicate the yield displacement and yield load capacity. By implementing the adopted geometric and material parameters of the segmental pier in Equations (18) and (21), the yield stiffness k 1 and equivalent elastic stiffness K e q were derived. Table 2 compares the numerical simulation results with analytical predictions for the SHR-SCSAB’s stiffness.
As can be seen from Table 2, the discrepancy between numerical simulation and analytical prediction for the yield stiffness of the SHR-SCSAB is merely 2.43%. This is because the analytical solution of the yield stiffness is obtained by statistically fitting a large amount of experimental data using the adopted regression formula, which reflects the group average. This computational model represents an idealized finite element formulation incorporating simplified material properties and constrained boundary conditions. It is reasonable that there are certain errors. A 4.09% discrepancy exists between the numerical simulation and analytical prediction for the equivalent elastic stiffness of the SHR-SCSAB. The analytical formula assumes that the cross-section strain conforms to the plane-section assumption, but there are discontinuous interfaces in the segmentally assembled pier, resulting in a non-linear actual strain distribution. The finite element model also simplifies the concrete damage constitutive relation. The specification states that a calculation model is considered valid when the allowable deviation for verification is less than 5% [32]. Therefore, the formula for calculating the equivalent elastic stiffness of the segmentally assembled bridge pier with hybrid reinforcement proposed in this paper is correct.
The r H backbone curve analysis of piers was conducted by changing the mixing ratio of SHR-SCSAB. Mixing ratios of 0.3, 0.5 and 0.7 were used to obtain the effect of different mixing ratios on the backbone curve of piers; the results are shown in Figure 8. From the data in Figure 8, the backbone curve of mixed reinforcement segmental assembled abutment is calculated, and the relevant indexes are shown in Table 3. As shown in Figure 8 and Table 3, with the increase in mixing ratio from 0.3 to 0.7, the peak load of segmental assembled abutment increased from 156 kN to 210 kN, which is 34.6%, and its peak displacement increased from 6.8 cm to 9.0 cm, which is 32.3%, which indicates that the equivalent elastic stiffness of SHR-SCSAB increased with the increase in mixing ratio; the yield stiffness of SHR-SCSAB decreased with the increase in mixing ratio, and the equivalent elastic stiffness of SHR-SCSAB decreased with the increase in mixing ratio. The yield stiffness of the SHR-SCSAB decreases with the increase in mixing ratio, which is because the increase in mixing ratio leads to a delay in the yield displacement of the abutment, and although the yield load increases, the increase is small, so the yield stiffness of the abutment decreases with the increase in mixing ratio; with the increase in mixing ratio from 0.3 to 0.7, the yield displacement and ultimate displacement of the abutment increase by 66.7% and 44.1%, which leads to an increase in the yield stiffness of the abutment. The ductility coefficient decreased with the increase in mixing ratio.
The backbone curves of segmental assembled piers with gravity axial compression ratios of 0.08, 0.16 and 0.24 are shown in Figure 9. Table 4 shows the relevant indexes of SHR-SCSAB calculated from the data in Figure 9. It can be seen when the gravity axial pressure ratio increased from 0.08 to 0.24 that the peak displacement of the SHR-SCSAB decreased from 8.6 cm to 5.6 cm, a reduction of 34.9%, and the peak load increased from 197 kN to 202 kN, an increase of 2.54%, such that the equivalent elastic stiffness of E increased from 2295 kN/m to 3606 kN/m, an increase of 57.1%. As the gravity axial pressure ratio increases, the yield displacement of the piers decreases by 28.6% and the yield load increases by 8.1%, together resulting in an increase in the yield stiffness of the SHR-SCSAB with an increase in the gravity axial pressure ratio, with the yield stiffness increasing from 4571 to 6920 kN/m, which is an increase of 51.4%. As the gravity axial pressure ratio increased from 0.08 to 0.24, the ultimate displacement of the abutment decreased from 20.0 cm to 13.2 cm, a reduction of 34.0%, while the yield displacement of the abutment decreased by only 28.6%, indicating that the ductility coefficient of the SHR-SCSAB decreased with the increase in the axial pressure ratio.
Figure 10 shows the results of backbone curve analysis of SHR-SCSAB with λ shear span ratios of 7, 8 and 9. The relevant indexes of SHR-SCSAB are calculated from the data in Figure 10, as shown in Table 5. From Figure 10 and Table 5, it can be seen that as the shear span ratio of segmental assembled piers increases from 7 to 9, the peak load decreases from 200 kN to 137 kN, which is a decrease of 31.5%, and the peak displacement increases from 8.6 cm to 12.8 cm, which is an increase of 48.8%, so it leads to a decrease in the equivalent elastic stiffness of the piers from 2320 kN/m to 1067 kN/m, which is a decrease of 54.0%. With the increase in shear span ratio, the yield displacement increased by 28.9% and the yield load decreased by 30.5%, such that the yield stiffness decreased from 4316 kN/m to 2327 kN/m, which is a decrease of 46.1%; with the increase in shear span ratio from 7 to 9, the ultimate displacement increased from 19.0 cm to 20.6 cm, which is only an increase of 8.4%, and the yield displacement was delayed by 28.9%, which in turn resulted in a decrease in the ductility coefficient with an increase in the gravity axial pressure ratio.

4.2. Hysteretic Response Analysis

Figure 11 presents the hysteresis curves of the traditional self-centering pier and SHR-SASAB, respectively. In Figure 11a, which depicts the traditional self-centering pier without energy-dissipating reinforcement, the hysteresis curve shows a pinched shape. Evidently, it has very small residual displacement; however, its energy dissipation capacity is poor. Figure 11b shows the hysteresis curve of SHR-SASAB. It is clear that the overall shape of the curve is plump. Although the residual displacement is relatively larger compared to that in Figure 11a, the energy dissipation capacity of SHR-SASAB is significantly improved.
Figure 12 shows the effect of different mixing ratios r H on the hysteretic performance of hybrid-reinforced segmental assembled piers with mixing ratios of 0.3, 0.5 and 0.7. From Figure 12a,b, it can be seen that increasing the mixing ratio can significantly reduce the residual displacement of the bridge pier. Especially when the horizontal displacement exceeds the critical value of 9 cm, the residual displacement shows an obvious decreasing trend as the reinforcement ratio increases. Figure 12c shows that the cumulative hysteretic energy dissipations are 21.7 kN·m, 21.0 kN·m, and 20.5 kN·m, respectively, with a decrease of less than 6%. This is because the energy dissipation rate is still mainly affected by the plastic deformation of the steel bars, and the elastic behavior of the FRP bars does not affect the plastic energy dissipation. From Figure 12d, it can be seen that the stress of prestressing reinforcement after applying gravity load decreased from the initial prestressing force of 1000 MPa to 970 MPa. This is because the increase in the proportion of FRP bars enhances the tensile stiffness of the cross-section, sharing higher additional axial tensile force caused by the earthquake, which results in a reduction in the actual stress on the prestressed tendons. Even though the elongation is the same, the change in the distribution of the cross-section stiffness leads to the redistribution of internal forces. When the horizontal displacement of the pier top was loaded to 14 cm, the stresses of prestressing reinforcement of the abutment with the mix ratios of 0.3, 0.5 and 0.7 were 1328 MPa, 1328 MPa and 1319 MPa, with the increase in the mixing ratio of prestressing tendon stress change being small. This is because the stress in the prestressing tendon is only related to its elongation, and the top of the pier with the same lateral displacement of the prestressing tendon elongation is the same. Therefore, increasing the reinforcement ratio of FRP bars mainly optimizes the self-centering performance of the bridge pier and has no substantial impact on the hysteretic energy dissipation and the stress mechanism of the prestressed tendons. Figure 12e shows the residual displacement ratio under different hybrid reinforcement ratios. Kawashima et al. [33] explicitly proposed a threshold value of 2% for the Self-Centering Efficiency Factor (SCEF). As can be seen from the figure, within this threshold, the horizontal residual displacement of the specimens exhibits only a slight increasing trend with an increase in the hybrid reinforcement ratio. This phenomenon indicates that, within this parameter range, the prestressed tendons play a dominant role in the self-centering capability of the structure, while the incorporation of FEP tendons has a relatively limited influence on the residual displacement. As the mixing ratio increases, the ductility coefficient decreases. In high-intensity earthquake areas, a design with a better ductility mixing ratio of 0.3 can be adopted; in ordinary and low-intensity earthquake areas, a design with a mixing ratio of 0.7 can be selected.
Figure 13 shows the influence of gravity axial compression ratios of 0.08, 0.16, and 0.24 on the hysteretic performance of the segmentally assembled bridge piers with hybrid reinforcement. It can be seen from Figure 13a,b that as the axial compression ratio increases, the residual displacement decreases significantly. This indicates that increasing the gravity axial compression ratio can effectively improve the self-centering ability and suppress the post-earthquake dislocation. From Figure 13c, it can be seen that when the gravity axial pressure ratio is 0.08, 0.16 and 0.24, respectively, the cumulative hysteretic energy dissipation of the SHR-SCSAB is 20.1 kN · m , 21.8 kN · m and 22.9 kN · m. The results show that the hysteretic energy dissipation capacity of the piers is increased with the increase in gravity axial pressure ratio, which is due to the increase in gravity loading to give the SHR-SCSAB horizontally lateral resistance. This is because the gravity load increases the horizontal lateral stiffness of the SHR-SCSAB, and with the increase in gravity axial pressure ratio, the top of the pier requires a larger horizontal load to reach the same displacement, which leads to an increase in cumulative hysteretic dissipation energy with the increase in the axial pressure ratio. The initial prestressing force in the pier tendons is 1000 MPa. As verified by Figure 13d, the stresses of the prestressing tendons of the pier prestressing tendons under different gravity axial compression ratios due to gravity loading are reduced to 952 MPa, 940 MPa and 908 MPa, which are 4.8%, 6.0% and 9.2%, respectively. When the pier top horizontal displacement reached 130 mm, the corresponding stresses in the prestressing tendons were measured as 1223 MPa, 1173 MPa and 1097 MPa, respectively, indicating that the prestressing tendon pre-stress decreases gradually with the increase in the gravity axial compression ratio, which is due to the axial compression deformation of the abutment produced by gravity loading. Therefore, as the gravity axial compression ratio increases, the initial stiffness increases, the ductility coefficient decreases, and the relative ductility performance declines. As observed in Figure 13e, when the residual displacement ratio exceeds 0.3%, the horizontal displacement increases with higher gravity axial compression ratios. Upon reaching the threshold value, structures with larger gravity axial compression ratios demonstrate smaller residual displacements and consequently exhibit enhanced self-centering performance.
From Figure 14a,b, it can be observed that the residual displacement shows no significant change when the horizontal displacement is less than 8 cm. However, when the horizontal displacement exceeds 8 cm, the residual displacement decreases significantly, which shows that the increase in the shear span ratios can effectively improve the self-reinstating capacity of the piers. From Figure 14c, it can be seen that when the shear span ratio is 7, 8 and 9, the cumulative hysteretic energy dissipation of the SHR-SCSAB piers is 47.0 kN · m, 33.5 kN · m and 21.3 kN · m, respectively, which indicates that the hysteretic energy dissipation of piers decreases with the increase in the shear span ratio, and the reason for this phenomenon is that the increase in the shear span ratio decreases the bending stiffness of the segmental assembled piers, which causes the horizontal load required to reach the same displacement on the top of the piers. The horizontal load required to achieve the same displacement at the top of the pier is reduced. From Figure 14d, the axial compression deformation of the pier due to gravity load causes the stress of the prestressing reinforcement to decrease to 976 MPa. When the horizontal displacement of the top of the pier is loaded to 19 cm, the stresses of the prestressing tendons of the piers with shear span ratios of 7, 8, and 9 are 1464 MPa, 1359 MPa, and 1276 MPa, respectively, and it can be seen that the stresses of the prestressing tendons are 1464 MPa, 1359 MPa, and 1276 MPa, respectively, and the prestressing tendon stress decreases with the increase in the shear span ratio. As the shear–span ratio increases, the initial stiffness decreases, the ductility coefficient increases, and the relative ductility performance improves. As evidenced in Figure 14e, when the residual displacement ratio exceeds 1%, the horizontal displacement exhibits a significant increase with higher shear span ratios. Notably, upon reaching the threshold value, structures with larger shear span ratios demonstrate greater horizontal displacements while simultaneously exhibiting superior self-centering performance.

4.3. Concrete Material Deterioration Effects

During the service life of a bridge, the concrete strength gradually degrades over time, which may affect the applicability of the equivalent stiffness model. To investigate the influence of concrete strength variation alone on SHR-SCSAB, three concrete grades—C30, C35, and C40—were considered.
Figure 15 presents the pushover curves and hysteretic curves for different concrete strengths. From Figure 15a, it can be observed that as the concrete strength increases, the peak loads are 190 kN·m, 196 kN·m, and 202 kN·m, respectively, indicating an improvement in bearing capacity. This is because concrete strength directly determines its compressive capacity. Higher strength leads to an increase in the ultimate compressive strain of the concrete in the compression zone and the peak of the stress–strain curve, resulting in higher flexural resistance. The equivalent stiffness values are 2111 kN/m, 2279 kN/m, and 2405 kN/m, respectively, showing a corresponding rise with strength. The elastic modulus of concrete is positively correlated with its strength—higher strength results in greater initial stiffness before cracking, leading to an overall increase in equivalent stiffness. From Figure 15b, it can be seen that the residual displacement does not change significantly with increasing concrete strength. This is due to the dominant role of prestressing tendons, which restrict the accumulation of plastic deformation. Variations in concrete strength have a minimal impact on the recovery capability of prestressing tendons. The hysteretic energy dissipation capacity slightly improves because higher-strength concrete exhibits marginally better energy absorption before crushing under cyclic loading. However, the enhancement is limited since energy dissipation primarily depends on the plastic deformation of the reinforcement.
In summary, increasing concrete strength mainly enhances the bearing capacity and stiffness through improved mechanical properties, while its influence on residual displacement and energy dissipation is relatively minor. For concrete strengths ranging from C30 to C40, the effect of material degradation on equivalent stiffness can be accounted for by appropriately increasing the design safety factor, and the existing theoretical formula for equivalent stiffness remains applicable.

5. Summary

This study proposes an SHR-SCSAB system. The mechanical behavior of the pier in the elastic stage is analyzed, and its equivalent elastic stiffness is derived through analytical formulation. The validity of the proposed method is verified via numerical simulation, and the seismic performance is thoroughly investigated. The main conclusions are summarized as follows:
First, this paper uses the finite strip method and basic mechanical principles to analyze the force-bearing process of SHR-SCSAB during each deformation stage as the horizontal load increases, and derives the theoretical formula for the equivalent elastic stiffness of SHR-SCSAB. The finite element software OpenSees is used to establish a finite element model of SHR-SCSAB to verify the correctness of the theoretical formula.
Second, a PushOver analysis was conducted on SHR-SCSAB. The analysis results show that as the mixing ratio increases, both the peak bearing capacity and the equivalent elastic stiffness increase. As the gravity axial compression ratio increases, the equivalent elastic stiffness increases, but there is no significant change in the peak bearing capacity. As the shear–span ratio increases, both the peak bearing capacity and the equivalent elastic stiffness decrease.
Finally, through hysteretic response analysis of the double-column SHR-SCSAB, the following conclusions are drawn: as the mixing ratio increases, the residual displacement decreases, and there is no significant change in the cumulative energy dissipation capacity; an increase in the axial compression ratio under gravity loads leads to reduced residual displacements while enhancing the cumulative energy dissipation capacity; as the shear–span ratio increases, the residual displacement decreases significantly, and the cumulative energy dissipation capacity clearly increases.

6. Future Work

This paper presents a theoretical investigation into the equivalent stiffness characteristics of SHR-SCSAB. However, there is still room for further in-depth research in the fields of numerical simulation methods and experimental verification. In future research, emphasis can be placed on optimizing the simulation algorithm to improve the computational efficiency while ensuring the accuracy of the simulation. Meanwhile, it is urgent to conduct comprehensive and systematic experimental research. The experiments will cover various conditions such as different working conditions and different material combinations, aiming to obtain rich and comprehensive experimental data. Through the above-mentioned improvement measures, it is expected to overcome many challenges currently faced in the design aspect, enabling the theoretical achievements of the equivalent stiffness of SHR-SCSAB to be effectively translated into practical applications and bringing new development opportunities to relevant engineering fields.

Author Contributions

Conceptualization, H.G., W.X. and H.L.; Methodology, H.G.; Software, W.X. and H.L.; Writing – original draft, W.X. and H.L.; Writing – review & editing, W.X. All authors have read and agreed to the published version of the manuscript.

Funding

This research was funded by Jilin Provincial Department of Education, grant number JJKH20210297KJ. And The APC was funded by Jilin Provincial Department of Education.

Data Availability Statement

The original contributions presented in the study are included in the article, further inquiries can be directed to the corresponding author.

Conflicts of Interest

Author Hongxu Lu was employed by the company Changchun Municipal Engineering Design and Research Institute Co. The remaining authors declare that the research was conducted in the absence of any commercial or financial relationships that could be construed as a potential conflict of interest.

References

  1. Zhu, Y.; Wu, J.; Zhang, J.; Xie, L.; Wei, Y.; Tong, C. Experimental and theoretical investigations of post-tensioned precast reinforced concrete bridge pier with external replaceable energy dissipaters. Eng. Struct. 2023, 294, 116719. [Google Scholar] [CrossRef]
  2. Yang, M.; Deng, S.; Dong, Z. Study on Anchoring Characteristics and Freeze–Thaw Degradation Law of the Cement-Based Early-Strength Anchor in Freeze–Thaw Regions. Sustainability 2023, 15, 7773. [Google Scholar] [CrossRef]
  3. Qi, Y.; Liu, G.; Qi, Z.; Li, P.; Ren, H. Stress analysis of segmental assembly structures for large-tonnage steel truss flexible arch bridges. J. Water Conserv. Archit. Eng. 2024, 22, 134–139. [Google Scholar]
  4. Bu, Z.-Y.; Ou, Y.-C.; Song, J.-W. Cyclic loading test of unbonded and bonded posttensioned precast segmental bridge columns with circular section. J. Bridge Eng. 2016, 21, 04015043. [Google Scholar] [CrossRef]
  5. Priestley, M.J.N. Myths and Fallacies in Earthquake Engineering—Conflicts Between Design and Reality. Bull. N. Z. Soc. Earthq. Eng. 1993, 26, 329–341. [Google Scholar]
  6. Priestley, M.J.N.; Seible, F.; Calvi, G.M. Seismic Design and Retrofit of Bridges; John Wiley & Sons: New York, NY, USA, 1996. [Google Scholar]
  7. Priestley, M.J.N.; Seible, F.; Calvi, G.M. Seismic Design Principles for Bridge Retrofitting. Struct. Eng. Int. 1996, 3, 12–20. [Google Scholar]
  8. Kowalsky, M.J.; Priestley, M.J.N.; MacRae, G.A. Displacement-Based Design of RC Bridge Columns in Seismic Regions. Earthq. Eng. Struct. Dyn. 2000, 29, 583–607. [Google Scholar] [CrossRef]
  9. Priestley, M.J.N.; Calvi, G.M.; Kowalsky, M.J. Displacement-Based Seismic Design of Structures; IUSS Press: Pavia, Italy, 2007. [Google Scholar]
  10. Hewes, J.T. Seismic Design and Performance of Precast Concrete Segmental Bridge Columns. Ph.D. Thesis, University of California, San Diego, CA, USA, 2002. [Google Scholar]
  11. Xiong, E.; Zhang, J.; Shang, D.; Feng, A.; Mei, Z. Seismic performance of precast segmental double-column bridge piers. J. Cent. South Univ. (Nat. Sci. Ed.) 2023, 54, 3609–3620. [Google Scholar]
  12. Xiong, E.; Gong, Z.; Yu, S.; Shi, Q. Seismic Performance and Deformation Analysis of Plastic Hinge Zones of a New Type of Precast Segmental Assembled Bridge Piers. China Civ. Eng. J. 2024, 57, 68–83. [Google Scholar] [CrossRef]
  13. Zhang, Y.; Jiang, H.; Wen, J.; Li, C.; Gao, X.; Zhao, X.; Teng, Q. Analysis of the prefabricated scheme and seismic performance of thin-walled wall pier structures. J. Southeast Univ. (Nat. Sci. Ed.) 2024, 54, 911–920. [Google Scholar]
  14. Liu, Z.; Tang, J.; Zhang, W.; Chen, X.; Ma, H. The Hysteresis Characteristics of Steel Tube-Embedded Replaceable Rubber Through-Rotors and Their Application in Self-Resetting Bridges. J. Jilin Univ. (Eng. Ed.) 2024, 1–10. [Google Scholar] [CrossRef]
  15. Sezgin, S.K.; Ahmadi, E.; Kashani, M.M. Seismic performance of resilient self-centring bridge piers equipped with SMA bars. Proc. Inst. Civ. Eng. Bridge Eng. 2025, 178, 248–261. [Google Scholar] [CrossRef]
  16. Chen, M.; Jia, J.; Cheng, S.; Zhou, S.; Pang, W. Seismic Performance of Precast Segmental Pier Columns with Stainless Steel and FRP Reinforcements. J. Build. Struct. 2023, 44, 368–379. [Google Scholar]
  17. Gao, H.; Lu, H. Seismic Performance Study of Hybrid Reinforced Precast Segmental Bridge Piers. Sichuan Cem. 2023, 3, 38–41. [Google Scholar]
  18. Cai, Z.K.; Yuan, W.; Wang, Z.; Smith, S.T. Seismic behavior of precast segmental bridge columns reinforced with hybrid FRP-steel bars. Eng. Struct. 2021, 228, 111484. [Google Scholar] [CrossRef]
  19. Tan, X.; Yin, C.; Wang, C.; Wang, X.; Chen, B.; Wu, X.; Liu, R. Experimental study on influence of external steel plate strength on seismic performance of segmental assembled CFST bridge piers. J. Earthq. Eng. 2025, 2, 300–308. [Google Scholar] [CrossRef]
  20. Motaref, S.; Saiidi, M.S. Multi-spring modeling for segmental columns. Earthq. Eng. Struct. Dyn. 2023, 52, 189–211. [Google Scholar] [CrossRef]
  21. Gao, H.; Song, Y.; Yuan, W.; Lu, H.; Cao, S. Seismic Design Method of Self-Centring-Segment Bridge Piers with Tensile-Type Viscoelastic Dampers; Hindawi Limited: London, UK, 2021. [Google Scholar] [CrossRef]
  22. Gao, H.; Xia, W.; Liu, G. Analysis of Seismic Performance for Segmentally Assembled Double-Column Bridge Structures Based on Equivalent Stiffness. Buildings 2025, 15, 1919. [Google Scholar] [CrossRef]
  23. JTG/T B02-1-2010; Industry Standard of the People’s Republic of China. Seismic Design Details for Highway Bridges. People’s Communications Press: Beijing, China, 2008.
  24. Xue, G.; Guo, X. Nonlinear full-process analysis of bending stiffness of reinforced concrete beams. J. Inn. Mong. Univ. Sci. Technol. 2007, 3, 250–252. [Google Scholar]
  25. Scott, B.D.; Park, R.; Priestley, M.J.N. Stress-Strain Behaviour of Concrete Confined by Overlapping Hoops at Low and High Strain Rates. Aci Struct. J. 1982, 79, 13–27. [Google Scholar]
  26. Tavassoli, A.; Liu, J.; Sheikh, S. Glass fiber-reinforced polymer-reinforced circular columns under simulated seismic loads. ACI Struct. J. 2015, 112, 103. [Google Scholar] [CrossRef]
  27. Deitz, D.H.; Harik, I.E.; Gesund, H. Physical properties of glass fiber reinforced polymer rebars in compression. J. Compos. Constr. 2003, 7, 363–366. [Google Scholar] [CrossRef]
  28. Gong, Y. Study on the Compressive and Seismic Performance of High-Performance CFRP-Strengthened Concrete Columns. Ph.D. Thesis, Southeast University: Nanjing, China, 2007. [Google Scholar]
  29. Cai, Z. Seismic Performance and Design Methods of Hybrid Reinforced Prefabricated Segmental Bridge Piers. Ph.D. Thesis, Harbin Institute of Technology, Harbin, China, 2018. [Google Scholar]
  30. Spacone, E.; Filippou, F.C.; Taucer, F.F. Fibre beam–column model for non-linear analysis of R/C frames: Part I. Formulation. Earthq. Eng. Struct. Dyn. 1996, 25, 711–725. [Google Scholar] [CrossRef]
  31. Saenz, L.P. discussion of “Equation for the Stress-Strain Curve of Concrete” by Desayi and Krishnan. J. Am. Concr. Inst. 1964, 61, 1229–1235. [Google Scholar]
  32. GB 50010-2010; Code for Design of Concrete Structures. China Architecture & Building Press: Beijing, China, 2010.
  33. Kawashima, K.; Nagaya, K.; Hoshikuma, J.-I.; MacRae, G.A. Residual Displacement Response Spectrum. J. Struct. Eng. 1998, 124, 523–530. [Google Scholar] [CrossRef]
Figure 1. Analytical diagram for finite strip method simulations.
Buildings 15 02000 g001
Figure 2. Stress–strain state of the cross-section.
Buildings 15 02000 g002aBuildings 15 02000 g002b
Figure 3. Abutment calculation sketch.
Buildings 15 02000 g003
Figure 4. Sketch of pier joint calculation.
Buildings 15 02000 g004
Figure 5. Finite element model.
Buildings 15 02000 g005
Figure 6. SHR-SCSAB and reinforcement diagram.
Buildings 15 02000 g006
Figure 7. Backbone curve.
Buildings 15 02000 g007
Figure 8. Effect of different hybrid ratios on the backbone curve of SHR-SCSAB.
Buildings 15 02000 g008
Figure 9. Effect of different gravity axial pressure ratios on the backbone curve of SHR-SCSAB.
Buildings 15 02000 g009
Figure 10. Effect of different shear–span ratios on the backbone curve of SHR-SCSAB.
Buildings 15 02000 g010
Figure 11. Comparison of hysteresis curves.
Buildings 15 02000 g011
Figure 12. Effect of different hybrid ratios on the SHR-SCSAB.
Buildings 15 02000 g012
Figure 13. Effect of different axial pressure ratios on the SHR-SCSAB.
Buildings 15 02000 g013
Figure 14. Effect of different shear–span ratios on the SHR-SCSAB.
Buildings 15 02000 g014
Figure 15. Different concrete strengths.
Buildings 15 02000 g015
Table 1. Material property of segmental assembled bridge pier with hybrid reinforcement.
ConcretePosttensioned TendonEnergy-Consuming ReinforcementFRP ReinforcementStirrup
Compressing strengthElastic modulusYield strengthUltimate strengthElastic modulusYield strengthElastic modulusUltimate strengthElastic modulusYield strength
( M p a ) ( G p a ) ( M p a ) ( M p a ) ( G p a ) ( M p a ) ( G p a ) ( M p a ) ( G p a ) ( M p a )
40.032.5167018601954002002100140286
Table 2. Comparative analysis of stiffness characteristics for SHR-SCSAB.
Bridge Pier StiffnessSimulated Value (kN/m)Analytical Solution
(kN/m)
Discrepancy (%)
Yield   stiffness   k 1 405441552.43
Equivalent   elastic   stiffness   K e q 242023214.09
Table 3. Relevant index of backbone curve at different hybrid ratios.
Hybrid Ratio r H Yield Displacement D y (cm)Yield Force F y (kN)Peak Displacement D u (cm)Peak Force F u (kN)Ultimate Displacement D m (cm)Yield Stiffness
k 1 (kN/m)
Equivalent Elastic Stiffness K e q (kN/m)Ductility Factor
μ
0.32.41326.815613.6550022945.67
0.53.21497.818016.0465623075.00
0.74.01709.021019.6425023334.90
Table 4. Relevant index of backbone curve under different gravity axial pressure ratio.
Axial Pressure Ratio n G Yield Displacement D y (cm)Yield Force F y (kN)Peak Displacement D u (cm)Peak Force F u (kN)Ultimate
Displacement D m (cm)
Yield Stiffness
k 1 (kN/m)
Equivalent Elastic Stiffness K e q (kN/m)Ductility Factor
μ
0.083.51608.619720.0457122955.70
0.163.01698.420116.6563324015.53
0.242.51735.620213.2692036065.28
Table 5. Relevant indexes of backbone curves under different shear span ratios.
Shear-to-Span Ratio λ Yield Displacement D y (cm)Yield Force F y (kN)Peak Displacement D u (cm)Peak Force F u (kN)Ultimate
Displacement D m (cm)
Yield Stiffness
k 1 (kN/m)
Equivalent Elastic Stiffness K e q (kN/m)Ductility Factor
μ
73.81648.620019.0431623205.00
84.413810.616719.6313615724.45
94.911412.813720.6232710674.20
Disclaimer/Publisher’s Note: The statements, opinions and data contained in all publications are solely those of the individual author(s) and contributor(s) and not of MDPI and/or the editor(s). MDPI and/or the editor(s) disclaim responsibility for any injury to people or property resulting from any ideas, methods, instructions or products referred to in the content.

