Article

Socio-Spatial Bridging Through Walkability: A GIS and Mixed-Methods Analysis in Amman, Jordan

1
Architecture Department, College of Architecture and Design, Prince Sultan University, Riyadh 11586, Saudi Arabia
2
Department of Architecture, School of Architecture and Built Environment, German Jordanian University, Amman 11180, Jordan
*
Author to whom correspondence should be addressed.
Buildings 2025, 15(12), 1999; https://doi.org/10.3390/buildings15121999
Submission received: 27 April 2025 / Revised: 1 June 2025 / Accepted: 5 June 2025 / Published: 10 June 2025
(This article belongs to the Section Architectural Design, Urban Science, and Real Estate)

Abstract

Decades of migration and refugee influxes have driven Amman’s rapid urban growth, yet newer neighborhoods increasingly grapple with fragmented social cohesion. This study examines whether walkable design can strengthen community bonds, focusing on Deir Ghbar, a car-centric district in West Amman. Using GIS and mixed-methods analysis, we assess how walkability metrics (residential density, street connectivity, land-use mix, and retail density) correlate with sense of community. The results reveal that street connectivity and residential density enhance social cohesion, while land-use mix exhibits no significant effect. High-density, compact neighborhoods foster neighborly interactions, but major roads disrupt these connections. A critical mismatch emerges between quantitative land-use metrics and resident experiences, highlighting the need to integrate spatial data with community insights. Amman’s zoning policies, particularly the stark contrast between affluent low-density Zones A/B and underserved high-density Zones C/D, perpetuate socio-spatial segregation—a central critique of this study. We urge the Greater Amman Municipality’s 2025 Master Plan to prioritize mixed-density zoning, pedestrian retrofits (e.g., traffic calming and sidewalk upgrades), and equitable access to amenities. This study provides a replicable GIS and survey-based framework to address urban socio-spatial divides, aligning with SDG 11 for inclusive cities. It advocates for mixed-density zoning and pedestrian-first interventions in Amman’s Master Plan. By integrating a GIS with social surveys, this study offers a replicable model for addressing socio-spatial divides in cities facing displacement and inequality.

1. Introduction

By the end of 2022, Amman’s population reached around 4,061,150, as reported by the Department of Statistics (DOS), representing approximately 36% of Jordan’s total population of about 11.3 million. This marks a significant growth in Amman’s population over the past decade. This demographic explosion is inextricably linked to waves of migration from neighboring countries, particularly the influx of Syrian refugees following the outbreak of the Syrian civil war in 2011. By 2022, Jordan hosted over 1.3 million Syrians, with approximately 80% residing in urban areas like Amman [1]. This rapid population growth, coupled with the cultural diversity of residents, has profoundly altered the social fabric of the city, particularly in its newer residential neighborhoods. Residents increasingly report diminished social capital, a weaker sense of belonging, and reduced familiarity with neighbors—a trend exacerbated by car-dependent urban planning. Census data from 2017 reveals an 8.3% annual growth rate in car ownership, with one vehicle for every five residents [2]. Consequently, traffic congestion, parking shortages, and streets transformed into sprawling car parks have become endemic. Residential areas now contend with disruptive drive-through traffic, further eroding the appeal of walkability infrastructure. Even short trips are dominated by car use, undermining opportunities for spontaneous social interactions and weakening community cohesion.
Amman’s urban challenges are emblematic of broader Middle Eastern cities grappling with rapid, unplanned urbanization, characterized by informal settlements, refugee-driven population growth, and spatial inequities [3]. However, its unique socio-spatial fragmentation, shaped by decades of zoning policies and refugee influxes, offers critical insights into how planning decisions exacerbate inequalities in walkability and social capital [3,4]. While cities like Beirut and Cairo face similar pressures [3,5,6], Amman’s bifurcation into high-income western neighborhoods and lower-income eastern districts, reinforced by municipal zoning codes, provides a stark case study of how land-use policies can entrench spatial inequities [7].
Amman’s rapid urban expansion has positioned it as one of the Arab world’s most significant modern cities. From the mid-20th century onward, the city experienced unprecedented population growth and physical sprawl, driven by successive waves of migration. Palestinian refugees in 1948 and 1967, Iraqi exiles after 2003, and Syrians post-2011 have all contributed to Amman’s cultural mosaic. This demographic fluidity has reshaped the city’s social dynamics, fostering a fragmented urban identity where traditional tribal affiliations compete with modern, transient community structures [7,8] The city’s social landscape is defined by polarization. A stark east–west divide reflects entrenched socio-economic disparities. West Amman, characterized by low-density (<50 households/hectare) development comprising villas and gated communities, houses the city’s wealthiest residents. In contrast, East Amman—home to older neighborhoods and informal settlements—is marked by high-density (>150 households/hectare) apartment clusters, lower housing costs, and inadequate infrastructure. These thresholds align with Amman’s zoning codes: Zones A/B (West Amman) restrict density to ≤45% built-up area on plots ≥750 m2, while Zones C/D (East Amman) permit up to 55% built-up area on plots as small as 200 m2 [2,4]. These divisions are not merely economic but spatial: West Amman’s wide setbacks (≥7 m) and sprawling plots (>900 m2) discourage pedestrian activity, while East Amman’s compact layouts (plot sizes ≤ 400 m2) and mixed-use streetscapes foster stronger social ties through frequent neighborly interactions [7,9,10].
This socio-spatial dichotomy is codified in Amman’s residential land zonation policies, which categorize neighborhoods into four tiers (A/B and C/D). Zones A and B, concentrated in West Amman, mandate large plot sizes (750–900 m2), limit built-up areas to ≤45% of the plot, and enforce generous setbacks (≥7 m). These regulations produce low-density development (≤50 households/hectare) characterized by isolated villas surrounded by ornamental greenery, creating physical barriers to neighborly interaction. Conversely, Zones C and D in East Amman permit smaller plots (200–400 m2), higher built-up areas (up to 55% of the plot), and minimal setbacks (≥4 m). These rules facilitate high-density residential development (>150 households/hectare) via multi-story apartment blocks, shared courtyards, and bustling street life [2,4,7].
The architectural outcomes of these policies are stark. West Amman’s spacious, car-centric layouts prioritize privacy over connectivity, while East Amman’s dense, pedestrian-friendly environments encourage casual encounters. This contrast underscores how zoning laws not only shape urban form but also mediate social capital. As [9] note, East Amman’s walkable alleys and corner shops serve as informal gathering spaces, fostering trust and reciprocity among residents—a stark contrast to the atomized lifestyles of West Amman’s car-dependent enclaves.
Despite its historical organic walkability, Amman’s contemporary neighborhoods increasingly prioritize vehicular mobility. The Greater Amman Municipality (GAM) has struggled to reconcile rapid urbanization with pedestrian needs. The 2008 Comprehensive Development Plan aimed to transform Amman into a pedestrian-friendly city, but implementation has been fragmented. Efforts such as the Wakalat Street pedestrian promenade (later reopened to cars) and urban stairway renovations in the city center highlight the tension between progressive planning ideals and car-centric realities [11].
GAM’s Transport and Mobility Master Plan (2010) [12] further emphasized reducing car dependency, enhancing public transit, and improving pedestrian infrastructure. While the municipality constructed 250,000 m2 of sidewalks between 2010 and 2015, these efforts often prioritized quantity over quality. Sidewalks remain obstructed by parked cars, utility poles, and uneven surfaces, rendering them unsafe or unusable [11,13]. Community awareness campaigns, such as forums on sidewalk rights, have also failed to curb encroachments, reflecting a lack of enforcement and public buy-in.
Critically, Amman lacks a holistic walkability framework that integrates land-use planning, transportation, and social equity. While cities like Barcelona and Melbourne have adopted 15 min city models, Amman’s zoning policies perpetuate car dependency by segregating residential, commercial, and recreational zones. Mixed-use development—a cornerstone of walkable cities—remains rare outside informal East Amman neighborhoods, exacerbating disparities in access to amenities [4].
Globally, studies link walkability to enhanced social capital, sense of community, and public health [14,15]. Walkable neighborhoods promote incidental interactions, strengthen local networks, and foster collective efficacy [16,17]. However, this body of research predominantly focuses on Western contexts, with limited attention to Middle Eastern cities. Unique factors—such as informal settlements, refugee populations, and cultural norms around public space—remain underexplored.
In Jordan, empirical studies on walkability have predominantly focused on physical accessibility metrics, such as transportation networks and service proximity [18]. However, no prior research has examined how walkability—defined through residential density, street connectivity, land-use mix, and pedestrian infrastructure—impacts the sense of community. Existing work on Amman’s urbanization emphasizes macro-level trends [7,8], while micro-scale analyses of pedestrian environments and their social outcomes remain scarce. This gap hinders evidence-based policymaking, as municipal planners lack localized data on how zoning policies shape community cohesion.
This study addresses these gaps by evaluating walkability and sense of community in Deir Ghbar, a contemporary residential district in West Amman. Developed within the past 15 years, Deir Ghbar exemplifies the challenges of newer neighborhoods: cultural diversity, weak social ties, and car-centric design. Using GIS-driven spatial analysis, this study maps walkability metrics (e.g., sidewalk quality, land-use mix, connectivity) and correlates them with survey data on residents’ sense of community.
This study seeks to (1) explore the relationship between objective walkability (residential density, connectivity) and community cohesion; (2) evaluate the disparities between quantitative walkability metrics and residents’ perceived social interactions; and (3) propose GIS-informed policy reforms to mitigate socio-spatial polarization in Amman.
This research shows significance in three areas:
  • Theoretical: It bridges urban planning and social sciences, demonstrating how zoning policies indirectly shape social outcomes through walkability.
  • Methodological: It pioneers GIS-based walkability assessments in Jordan, offering replicable tools for regional planners.
  • Practical: The findings inform GAM’s equitable urban development strategies, advocating for mixed-use zoning and pedestrian-first design in new neighborhoods.
By linking Amman’s socio-spatial fragmentation to systemic policy failures, this study urges a reimagining of urban planning paradigms in refugee-hosting cities. As Jordan confronts protracted displacement crises, fostering walkable, inclusive neighborhoods is not merely a planning goal—it is a necessity for social resilience.

2. Literature Review

2.1. Residential Urban Accessibility

The concept of accessibility is essential in urban planning, especially in understanding the impacts of land-use and transportation policies on societal functioning. Defined by [19] as the ability to reach desired land uses through specific transport modes, accessibility is vital for evaluating urban dynamics. Ref. [20] further developed this concept by identifying four dimensions: land use, transportation, temporal constraints, and individual factors. At the neighborhood level, urban form significantly affects accessibility. Research indicates that compact, mixed-use neighborhoods with high land-use mix and density enhance proximity to services, promoting walking and reducing car dependency [21,22]. Such environments foster social cohesion and community livability, contrasting with sprawling car-centric designs that fragment communities [23]. This underscores the importance of pedestrian-friendly planning characterized by density and interconnected streets.
In Amman, accessibility disparities between West and East Amman illustrate the socio-spatial fragmentation resulting from zoning policies. West Amman’s low-density areas (Categories A/B) cater to car owners, offering limited walkability, while East Amman’s dense, mixed-use zones (Categories C/D) provide pedestrian-friendly environments [7]. These areas serve as vital hubs for Syrian refugees who rely on accessible public transit and informal markets, highlighting the influence of socio-political contexts and cultural norms on accessibility [1]. The contrasting urban landscapes in Amman emphasize the need for context-sensitive accessibility metrics in Middle Eastern cities. These metrics should accommodate the unique challenges posed by informal settlements and refugee influxes, which differ from Western planning paradigms. Furthermore, understanding neighborhood-level accessibility through urban form elements like density, land-use mix, and street patterns can guide policies to enhance walkability, sense of community, and overall livability. Through such approaches, cities can better align with sustainable development goals, aiming for inclusive and resilient urban environments.

2.2. Global Access Paradigms: Contrasts and Contexts

Cities like Copenhagen enhance accessibility through integrated transit systems and mixed-use zoning, as seen in the Global North [24]. In contrast, Bogotá’s TransMilenio BRT system prioritizes street connectivity, crucial in its densely populated areas, but informal settlements pose unique challenges for uniform metrics [25]. Amman exemplifies the Global South’s complexities, where zoning policies (A/B vs. C/D) enforce socio-spatial divides. Category A zones, with large plots and wide setbacks, deter pedestrian interaction, whereas Category C zones, despite vibrant street life, lack infrastructure [4]. Refugee settlements rely on street vendors to navigate formal zoning exclusions, emphasizing the need for context-specific measures.
Bogotá’s experience underscores the importance of street connectivity for walkability, contrasting with Global North models that emphasize compactness [25,26]. However, both approaches fail to adequately address Amman’s unique challenges, where zoning policies restrict connectivity in affluent areas. In East Amman, organic street grids promote interaction but remain underserved [4,7,9]. This study highlights the need for tailored accessibility metrics to tackle Amman’s policy-driven fragmentation. While Bogotá benefits from a uniform land-use mix that prioritizes street density, Amman’s zoning enforces substantial divides. For instance, West Amman’s cul-de-sacs, with only 20 intersections per square kilometer, hinder walkability, while East Amman’s grids feature 80 intersections per square kilometer but lack adequate lighting and sidewalks [9].
Bogotá was selected for several reasons. First, it is an upper-middle-income city that is undergoing rapid urbanization, akin to the demographic and development challenges faced by Amman. This parallel in development status provides a relevant context for comparing urban planning policies and outcomes. Second, Bogotá has successfully implemented the TransMilenio Bus Rapid Transit (BRT) system, a policy precedent that has proven effective under conditions similar to those in Amman, where transport infrastructure is crucial for accommodating growing populations. Moreover, Bogotá has established documented solutions for integrating displaced populations into urban life, an issue that resonates with the challenges faced in Amman, as it hosts a significant number of refugees.
To enhance our comparative analysis, we have included references to other cities, specifically Cairo, Istanbul, and São Paulo, which have confronted similar urbanization challenges and refugee integration issues. Cairo’s strategies for managing informal settlements prioritize community engagement and participatory approaches, providing valuable insights into effective social policy frameworks [27]. Istanbul’s initiatives in housing and urban infrastructure development offer successful methods for integrating displaced populations into the urban fabric, highlighting lessons relevant to Amman [28]. Additionally, São Paulo’s experiences with social housing and urban policy illuminate strategies for addressing the complexities of rapid urban growth and social inequality [29]. By situating our analysis within this broader context, we aim to deepen the understanding of walkability and community cohesion in rapidly urbanizing environments.

2.3. Walkability: Definitions and Frameworks

Walkability broadly refers to environments that facilitate pedestrian activity, although it is not formally defined in many dictionaries. Various dimensions affect how space supports walking, evolving from early emphasis on safety and proximity [30] (to more complex frameworks. Ref. [31] provides a structured approach, identifying three primary components: (1) Traversability: Safe and continuous pathways accessible to a diverse range of users. (2) Compactness: Proximity to destinations within a walkable distance. (3) Safety and Attractiveness: Protection from crime and hazards combined with visually appealing streetscapes.
Forsyth’s model underscores walkability as both a sustainable transport strategy and a driver of social vibrancy, though there is still significant variability in operational definitions. Ref. [32] highlighted eleven variables that impact walkability but agreed that the four core metrics—land-use mix, residential density, street connectivity, and retail density—are critical [26,33]. Despite consensus on these metrics, subjective factors like perceived safety and aesthetics also influence walking behaviors, necessitating mixed-method approaches [34]. New Urbanists argue that walkability fosters social interaction and criticize car-centric designs for undermining community cohesion [35]. This viewpoint is echoed by [31], who advocates for environments that encourage safe and attractive pedestrian interactions. Walkable environments contribute to sustainability and enhance social well-being, as noted by [30], linking them to healthier, happier populations.
While objective attributes such as land-use mix and street connectivity define walkability [26,36], additional factors like sidewalk coverage and aesthetics influence human mobility [37,38]. The primary complexity lies in reconciling subjective perceptions with objective measures, as people’s walking behaviors are also shaped by how they perceive their environments [34,39]. Ref. [31] calls for a comprehensive theoretical framework that integrates diverse interpretations of walkability, assisting planners and designers in creating spaces that genuinely facilitate pedes and parameters Trian activity. This approach reduces confusion and enhances the effectiveness of urban planning strategies.
In conclusion, walkability is often reduced to generic metrics, but its operationalization demands contextual precision. Our framework synthesizes three robust methodologies to dissect Amman’s objective walkability: (1) Ref. [26] walkability index provides the backbone, prioritizing land-use mix, density, and connectivity. (2) Ref. [33] inform our entropy-based land-use calculations, adapting their mixed-use thresholds to Amman’s zoning categories. (3) Ref. [40] granular approach to street connectivity refines Frank’s original metric by excluding highways and emphasizing pedestrian-specific nodes.
This multi-sourced methodology ensures our measurements reflect Amman’s socio-spatial realities: low-density Zones A/B (<50 households/acre) [2] versus high-density Zones C/D (>150 households/acre), mapped through a GIS. Critically, this integration moves beyond isolated metrics (e.g., standard intersection counts) to expose systemic inequities—for example, East Amman’s objectively denser grids (80 pedestrian intersections/km2) coexisting with neglected sidewalks, a disconnect shaped by [4] zoning analyses. By bridging these frameworks, we demonstrate how Global South cities can adapt Northern-derived indices while retaining local relevance. Future studies could layer this foundation with subjective audits, but our results already challenge planners to reconcile statistical efficiency (street grids) with lived livability (broken pavements).

2.4. Objective Walkability: Metrics and GIS Applications

2.4.1. Measuring Objective Walkability

Objective walkability involves quantifying features of the built environment that support pedestrian activity. This can be achieved through two main approaches: GIS-based spatial analysis and systematic observations.
GIS-based spatial analysis: GISs (Geographic Information Systems) are utilized to analyze spatial data, facilitating the measurement of various walkability indicators: (1) Land-Use Mix: Evaluated using entropy indices to determine the diversity of land uses, such as residential, commercial, and civic areas [26,33]. (2) Street Connectivity: Assessed by the density of intersections per square kilometer, excluding highways, to reflect network interconnectivity [26,40]. (3) Retail Density: Measured by the ratio of commercial floor area to total land area, indicating the concentration of retail establishments [33]. (4) Residential Density: Calculated by the number of households per acre, showing the intensity of residential land use [26,36]. GIS technology compiles these variables into composite indices, providing a detailed spatial analysis of walkability gradients. These indices help identify areas where urban planning can enhance pedestrian activity.
Systematic Observations: This method involves site audits to directly assess the physical environment, capturing elements such as the following: (1) Sidewalk Quality and Coverage: Qualitative observations of the sidewalk conditions and extent. (2) Traffic Speed: Monitoring vehicular speed patterns that influence pedestrian safety. (3) Aesthetic Qualities and Human Experience: Evaluating design elements and subjective experiences that GISs may not fully capture. Systematic observations complement GIS data, providing insights into qualitative aspects critical for assessing walkability [37].

2.4.2. GIS-Based Walkability Indices and Their Applications

Walkability indices constructed using GISs offer a structured approach to evaluating neighborhood walkability. Composite indices balance multiple factors to avoid issues like multicollinearity among variables such as residential density and land-use mix [41]. Notably, [33] developed a walkability index by integrating metrics like dwelling density, street connectivity, and retail area coverage. Validated through extensive field observations, these indices guide urban planning by visualizing spatial patterns of walkability.
Challenges and Developments in Amman: In Amman, the application of GISs for walkability assessments is still evolving. Although initiatives, such as the GAM Transport Master Plan (2010) [12], have attempted to map walkability features, they often overlook socio-economic disparities and informal settlements’ dynamics [11]. Integrating refugee settlement data into walkability evaluations could address unique urban fragmentation issues. Linking Walkability to Community Cohesion: Walkability is closely tied to social capital and community engagement. Ref. [42] emphasize how walkable neighborhoods can enhance social interactions and community cohesion. Understanding the relationship between walkability and the sense of community helps planners create environments that not only improve accessibility but also strengthen social ties and well-being.
In summary, as our understanding of objective walkability evolves, incorporating context-aware metrics is paramount. GISs and field audits together provide a comprehensive toolkit for planners aiming to foster walkable and socially cohesive communities. Further research and methodology refinement are necessary to tailor these tools to diverse urban environments like Amman and beyond.

2.5. Walkability and GIS Applications

Geographic Information Systems (GISs) hold significant potential for advancing walkability studies in cities like Amman, yet their application in the Global South is often constrained by systemic data gaps. Informal settlements, which house approximately 30% of Amman’s population, typically lack digitized parcel data, necessitating participatory mapping methods to fill spatial voids [43]. Refugee camps, excluded from municipal databases, further compound this challenge, requiring hybrid methodologies that integrate satellite imagery with ground-truth surveys [44]. These approaches are critical in contexts like East Amman, where informal retail networks and adaptive pedestrian pathways, though vital to daily life, remain absent from formal planning frameworks [7].
Recent research underscores the importance of physical built environment attributes for walkability. In Bogotá, for example, street design—particularly street connectivity—has been shown to influence pedestrian activity more strongly than land-use diversity, highlighting the need for context-specific metrics [25]. Similarly, Amman’s rigid zoning policies exacerbate spatial inequities: low-density Zones A/B in West Amman enforce large plots (≥750 m2) and setbacks (≥7 m), producing car-centric layouts that weaken social cohesion, while high-density Zones C/D in East Amman foster vibrant street life despite inadequate infrastructure [4,7]. The Greater Amman Municipality’s (GAM) 2010 Transport Master Plan made initial strides in mapping pedestrian infrastructure, yet its focus on quantitative metrics (e.g., 250,000 m2 of sidewalks) overlooked qualitative barriers like parked cars and uneven surfaces, rendering datasets incomplete [11].

Case Studies and Contextual Challenges

Amman’s informal refugee settlements illustrate the dissonance between formal planning frameworks and lived urban realities. In East Amman’s Zones C/D, Syrian refugees leverage high retail density through street vendors to compensate for deficient infrastructure, fostering social cohesion in ways unmapped by conventional GIS tools [45]. This contrasts sharply with Zones A/B, where low residential density and cul-de-sac street patterns suppress pedestrian activity, reflecting rigid adherence to zoning codes that prioritize vehicular mobility [4]. Bridging this divide requires mixed-method GIS frameworks, such as combining spatial regression models with community audits, to contextualize walkability metrics within socio-political realities [34]
Bogotá’s experience offers comparative insights. The city’s TransMilenio BRT system elevated street connectivity as a walkability priority, with intersection density correlating to higher pedestrian activity [25]. However, its focus on formal infrastructure neglects informal settlements, mirroring Amman’s fragmented approach. For Amman, connectivity in high-density Zones C/D through traffic-calming measures, sidewalk upgrades, and the integration of smart green spaces—shown to enhance both environmental awareness and social cohesion [46]—could mitigate car-dependency while preserving informal vitality [11].

2.6. Sense of Community

2.6.1. Linking Built Form and Social Capital

Sense of community (SoC) encompasses four primary dimensions: membership, influence, needs fulfillment, and shared emotional connections as outlined by [47]. Walkable, compact, and mixed-use neighborhoods enhance SoC by encouraging incidental social interactions in public spaces, such as on benches or shaded sidewalks, forming third places where social bonds strengthen [42]. In contrast, car-dependent neighborhoods often isolate residents, thereby diminishing collective efficacy [16].
The significance of SoC spans diverse fields, acting as a pivotal component in assessing social capital, policy development, and community growth. Ref. [48] highlights that SoC signifies a shared sense of belonging, identity, and reinforcement among neighbors. It is crucial for neighborhood quality of life, driven by elements like safety, residential satisfaction, and civic participation. While SoC and social capital enhance health and community well-being, as noted by [49], strong cohesion may also lead to the marginalization of minority groups and newcomers. McMillan and Chavis’s (1986) [47] framework identifies SoC as being composed of the following: (1) Membership: Belonging and identity. (2) Influence: Collective efficacy. (3) Integration: Aligned values and fulfillment of needs. (4) Emotional Connection: Shared history, places, and experiences.
Features of the built environment, such as public spaces, pedestrian accessibility, human-scale development, mixed land use, and greenery, significantly influence SoC by fostering vibrant neighborhood social lives [42]. Recent research further underscores the role of smart green spaces in enhancing environmental awareness and social cohesion, particularly within high-density residential communities [46].

2.6.2. Theoretical Foundations—Synthesis of Walkability and Sense of Community

The conceptual foundation of SoC underscores its synergy with walkability. Pedestrian-friendly environments foster incidental interactions and strengthen social ties among residents [42]. For instance, East Amman’s vibrant streets, with their bustling shops and courtyards, promote social capital, in contrast to the restrictive nature of gated communities in West Amman [9]. However, excessive cohesion might exclude minorities, as seen in the segregated Syrian enclaves in Amman [10]. To address these challenges, integrating intersectionality frameworks could improve inclusivity [50].
Critics argue that [47]’s model fails to incorporate power dynamics and cultural diversity crucial for a comprehensive understanding of SoC across varied populations. In Amman, Syrian refugees often feel excluded from public social activities dominated by Jordanians, indicating a need for reassessing SoC metrics [45]. Intersectional frameworks could provide a more nuanced understanding of SoC in diverse urban settings. This study bridges Forsyth’s walkability framework with [47]’s SoC theory by linking components of walkability to dimensions of SoC; see Table 1.
Mechanisms that support walkability include the following: density fosters casual encounters, enhancing a sense of belonging; connectivity facilitates collective actions like neighborhood initiatives; mixed land use creates shared destinations, such as markets and parks; and retail density provides third spaces like cafés for emotional bonding. This integrated approach can guide the creation of urban environments that not only support walking but also enhance community cohesion and social capital.

2.7. Research Gaps and Contributions

The current literature on walkability predominantly focuses on Western contexts, leaving Middle Eastern settings—marked by informal settlements, refugee challenges, and distinctive cultural practices—relatively unexplored. Jordan specifically lacks empirical studies that connect GIS-derived walkability metrics with the sense of community (SoC), hindering the pursuit of equitable urban planning. This study aims to address these gaps by (1) Contextualizing Metrics: Adapting [31]’s walkability framework to tackle the socio-spatial fragmentation driven by zoning in Amman; (2) Integrating Theories: Combining [48]’s SoC dimensions with walkability indicators using GIS-mapped relationships; and (3) Policy Relevance: Identifying and mapping disparities to advocate for inclusive and reformative zoning policies.

Conceptual Framework: Integrating Walkability and Sense of Community

The conceptual framework forms the theoretical foundation of this study, connecting key constructs and variables to explore the relationship between SoC and built environment features, with walkability as a central construct. Amman’s unique socio-spatial challenges call for the development of built environment attributes that support walking and specifically address inequities created by zoning practices. Unlike Bogotá, which has successfully emphasized street connectivity, Amman must overcome the division between West and East regions through mixed-use zoning and pedestrian-friendly designs.
By integrating [31]‘s walkability framework with [48], this study provides a holistic approach to understanding how built environment interventions can restore and enhance social capital in fragmented urban settings. The framework posits that walkability components, such as residential density, street connectivity, land-use mix, and retail density, are crucial to influencing SoC dimensions: (1) Membership/Belonging: High connectivity and a mix of land uses promote casual interactions, increasing familiarity and a sense of belonging. (2) Influence: Safe and attractive streets empower residents to actively shape and engage with their communal spaces. (3) Shared Connections: Compact neighborhoods with shared amenities, like parks, help create collective memories and foster emotional connections.
This study underscores the importance of thorough evaluations of SoC in relation to the built environment, as demonstrated by the conceptual framework in Figure 1 below, which helps inform and guide effective urban planning and policy development in comparable contexts. Figure 1 integrates [31] walkability dimensions and [47] community cohesion theory into a novel framework. This model, developed by the authors, guides our analysis of how Amman’s zoning policies indirectly shape social capital through pedestrian infrastructure. Our conceptual framework (Figure 1) addresses these gaps by linking walkability metrics to community cohesion, a relationship unexplored in Jordanian urban scholarship.

3. Methodology

This study employs a correlational design to examine the impact of walkability (independent variable) on sense of community (dependent variable) through built environment attributes. A well-structured questionnaire was used to gather quantitative data, which was subsequently analyzed and visualized using Geographic Information Systems (GISs) based on census data block maps.
To evaluate the relationship between walkability and sense of community, cluster sampling stratified census district blocks (CDBs) into low-, medium-, and high-density strata, ensuring proportional representation of household density variations. Objective walkability metrics, including land-use mix, street connectivity, retail density, and residential density, were assessed using available digital data sources within the GIS framework.
This research integrates spatial analysis with survey data. The quantitative GIS component concentrates on objective walkability, while the survey gathers residents’ perceptions of community cohesion. This combined approach facilitates the triangulation of spatial patterns with human experiences, effectively capturing both the physical determinants of walkability and their social implications [51].

3.1. Research Questions and Hypotheses

This study aims to explore the following research questions:
  • How does objective walkability impact the sense of community in the Deir Ghbar neighborhood?
  • What is the spatial interrelationship between walkability and the sense of community in Deir Ghbar?

3.1.1. Hypothesis

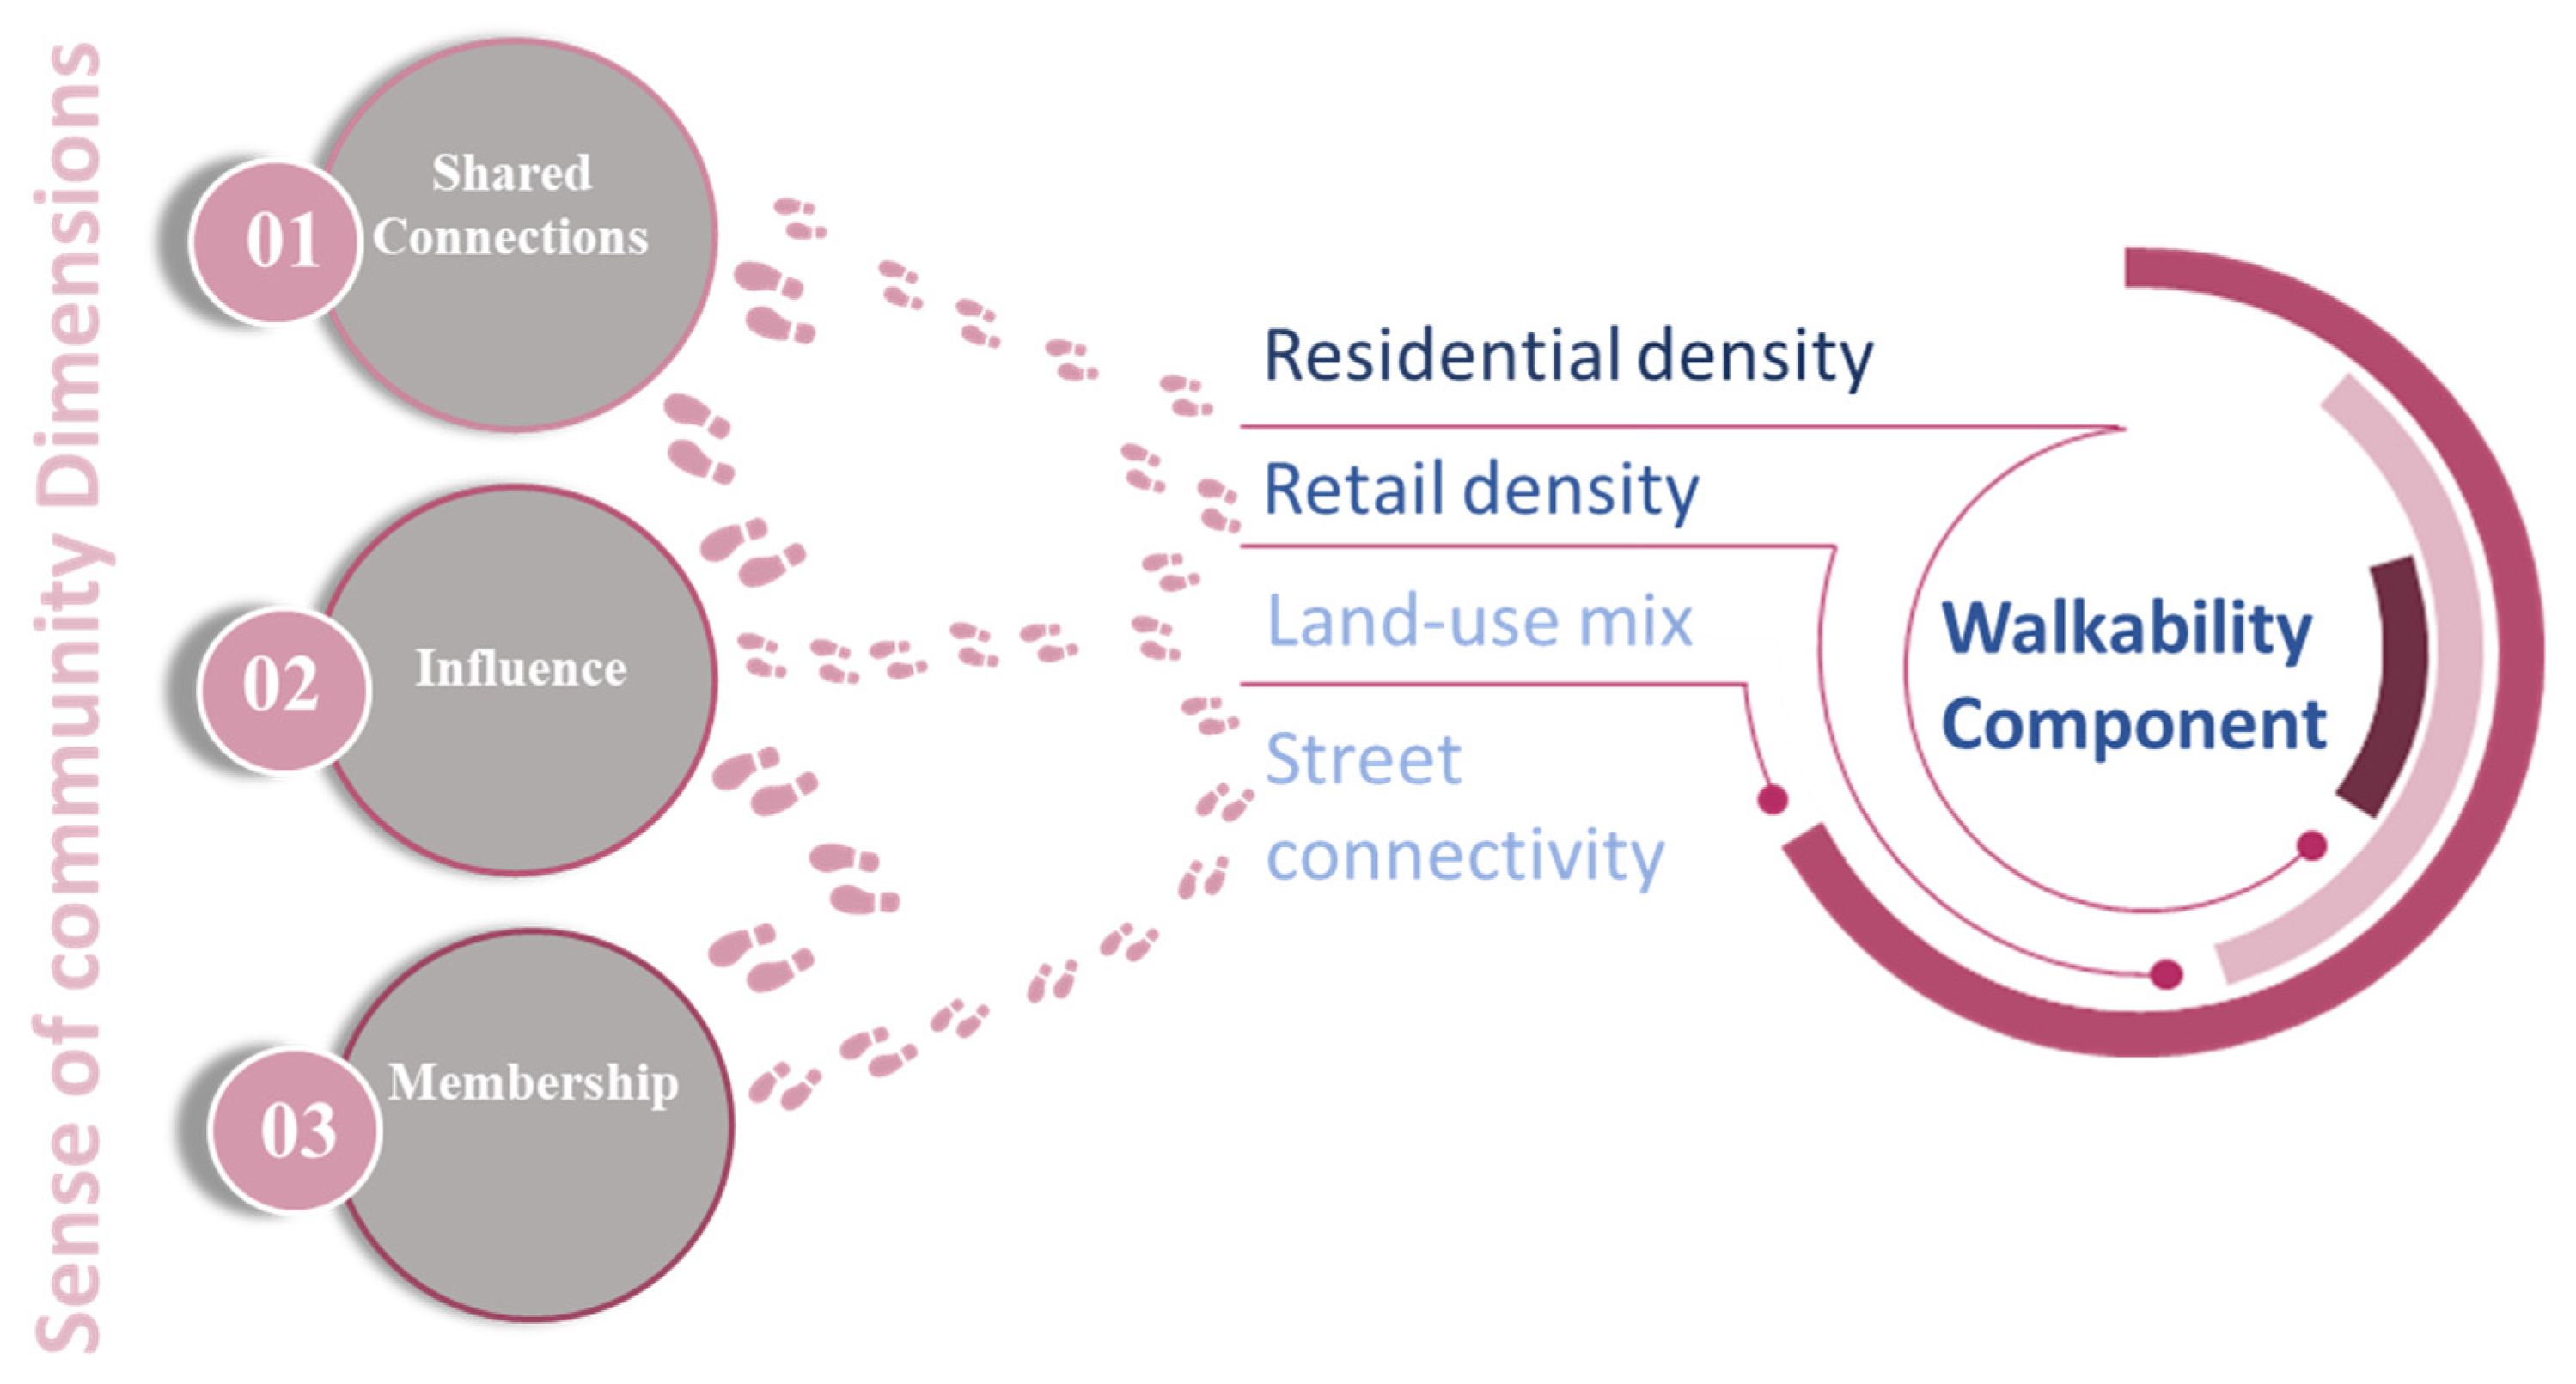
The core hypothesis of this study posits that objective walkability—characterized by land-use mix, street connectivity, retail density, and residential density—positively influences the sense of community. This influence is measured through dimensions such as feeling at home, neighborhood cohesion, and relationships with neighbors. This research will utilize GIS for spatial analysis and employ Ordinary Least Squares regression along with SPSS tools (SPSS version 26) to analyze the data.

3.1.2. Sub-Hypotheses

  • Land-use mix positively affects the sense of community.
  • Street connectivity positively affects the sense of community.
  • Retail density positively affects the sense of community.
  • Residential density positively affects the sense of community.

3.2. Variables and Constructs

3.2.1. Dependent Variable

Sense of Community: This variable is operationalized through three dimensions measured by a 5-point Likert scale:
  • Feeling at Home: Respondents indicate their agreement with statements about their comfort in the neighborhood (1 = Strongly Disagree, 5 = Strongly Agree).
  • Neighborhood Cohesion: Assessed by the frequency of collective activities (e.g., community events).
  • Relationships with Neighbors: Self-reported frequency of interactions with neighbors (1 = Rarely, 5 = Daily).

3.2.2. Independent Variable

Objective Walkability: This variable is defined by an index comprising various metrics, specifically measured using GIS and existing digital data sources. The objective walkability index includes the following components: land-use mix, street connectivity, retail density, and residential density (see Table 2).
The objective walkability metrics will be evaluated through GIS-based spatial analysis, utilizing Ordinary Least Squares regression and SPSS for data analysis.

3.2.3. Confounding Variables

These are the personal demographic and socio-economic factors that may influence the study results, which were controlled through hierarchical regression to isolate the effects of walkability on sense of community (see Table 3).

3.3. Research Setting

The Deir Ghbar neighborhood (Al-Diyar) is a modern residential area in western Amman, situated on the edge of the affluent Abdoun district. As one of the wealthiest neighborhoods in the city, it features upper-class residential buildings predominantly clad in stone. The area is characterized by wide streets; however, walkability is notably low due to a lack of adequate pedestrian facilities [11]. Sidewalks are narrow and often discontinuous, frequently obstructed by vegetation and trees [13]). Moreover, the neighborhood suffers from through traffic, which further diminishes pedestrian accessibility [9]).
Residents of Deir Ghbar rely on nearby districts such as Abdoun and Al-Sweifye for shopping and commercial activities due to the scarcity of local retail options. According to the [
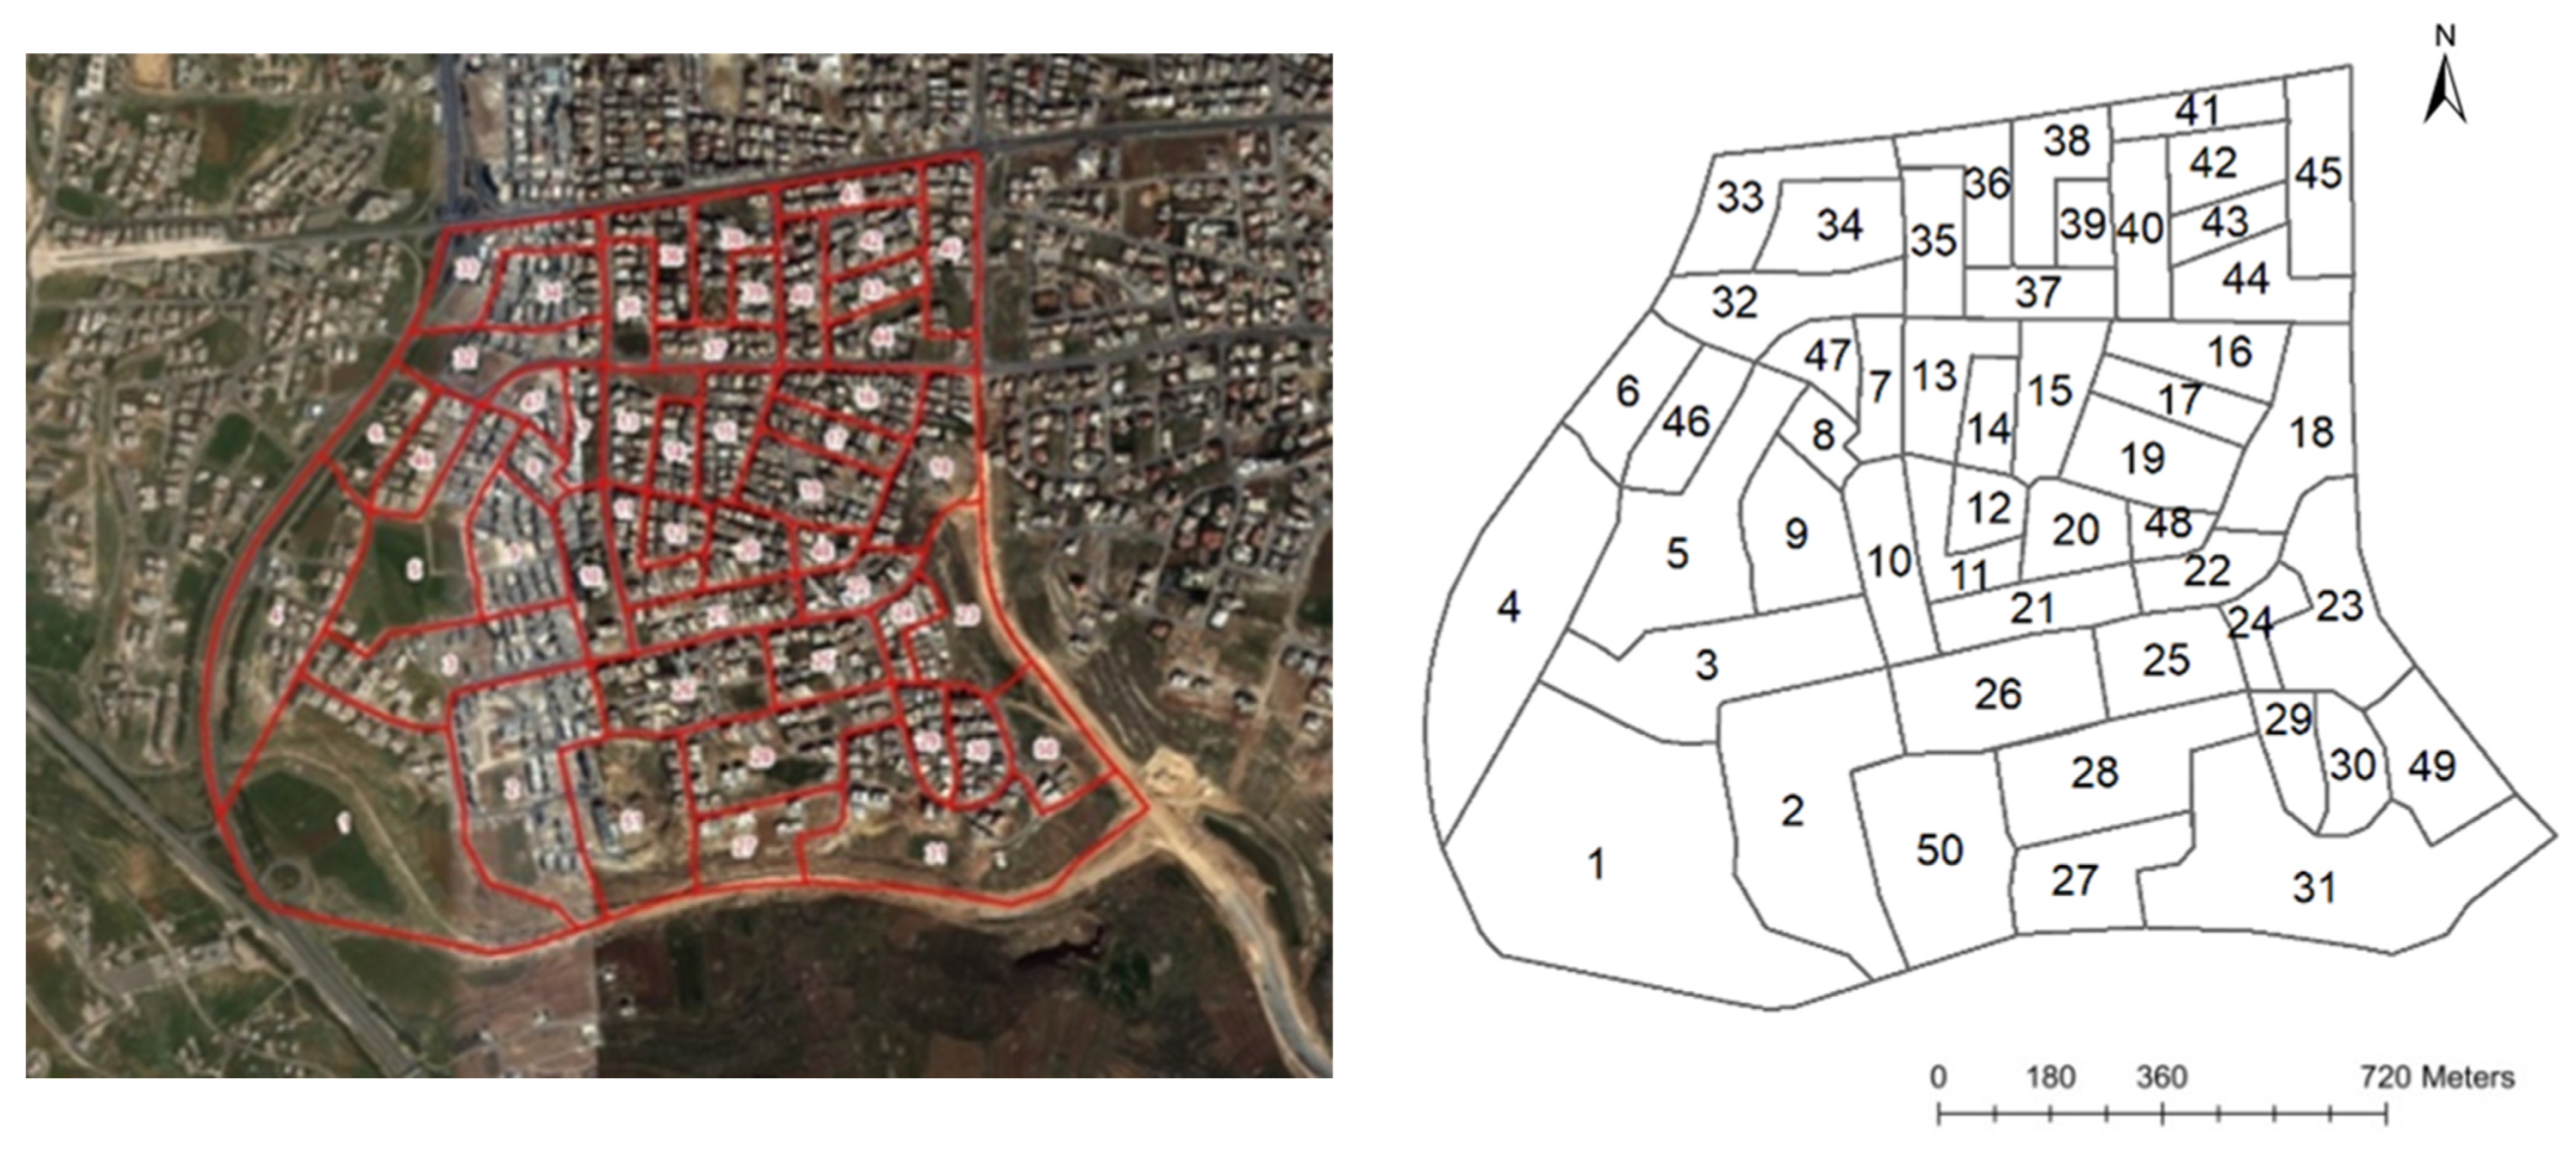
52], Deir Ghbar has a population of approximately 17,450 inhabitants, organized into 4679 households with an average family size of 3.7 members. The neighborhood is divided into 50 census district blocks (CDBs), as illustrated in Figure 2 and Figure 3, which depict an aerial image of Deir Ghbar and a map of the official census division.
Spanning an area of 1.9 square kilometers, Deir Ghbar comprises 0.6 m2 of streets and 1.3 m
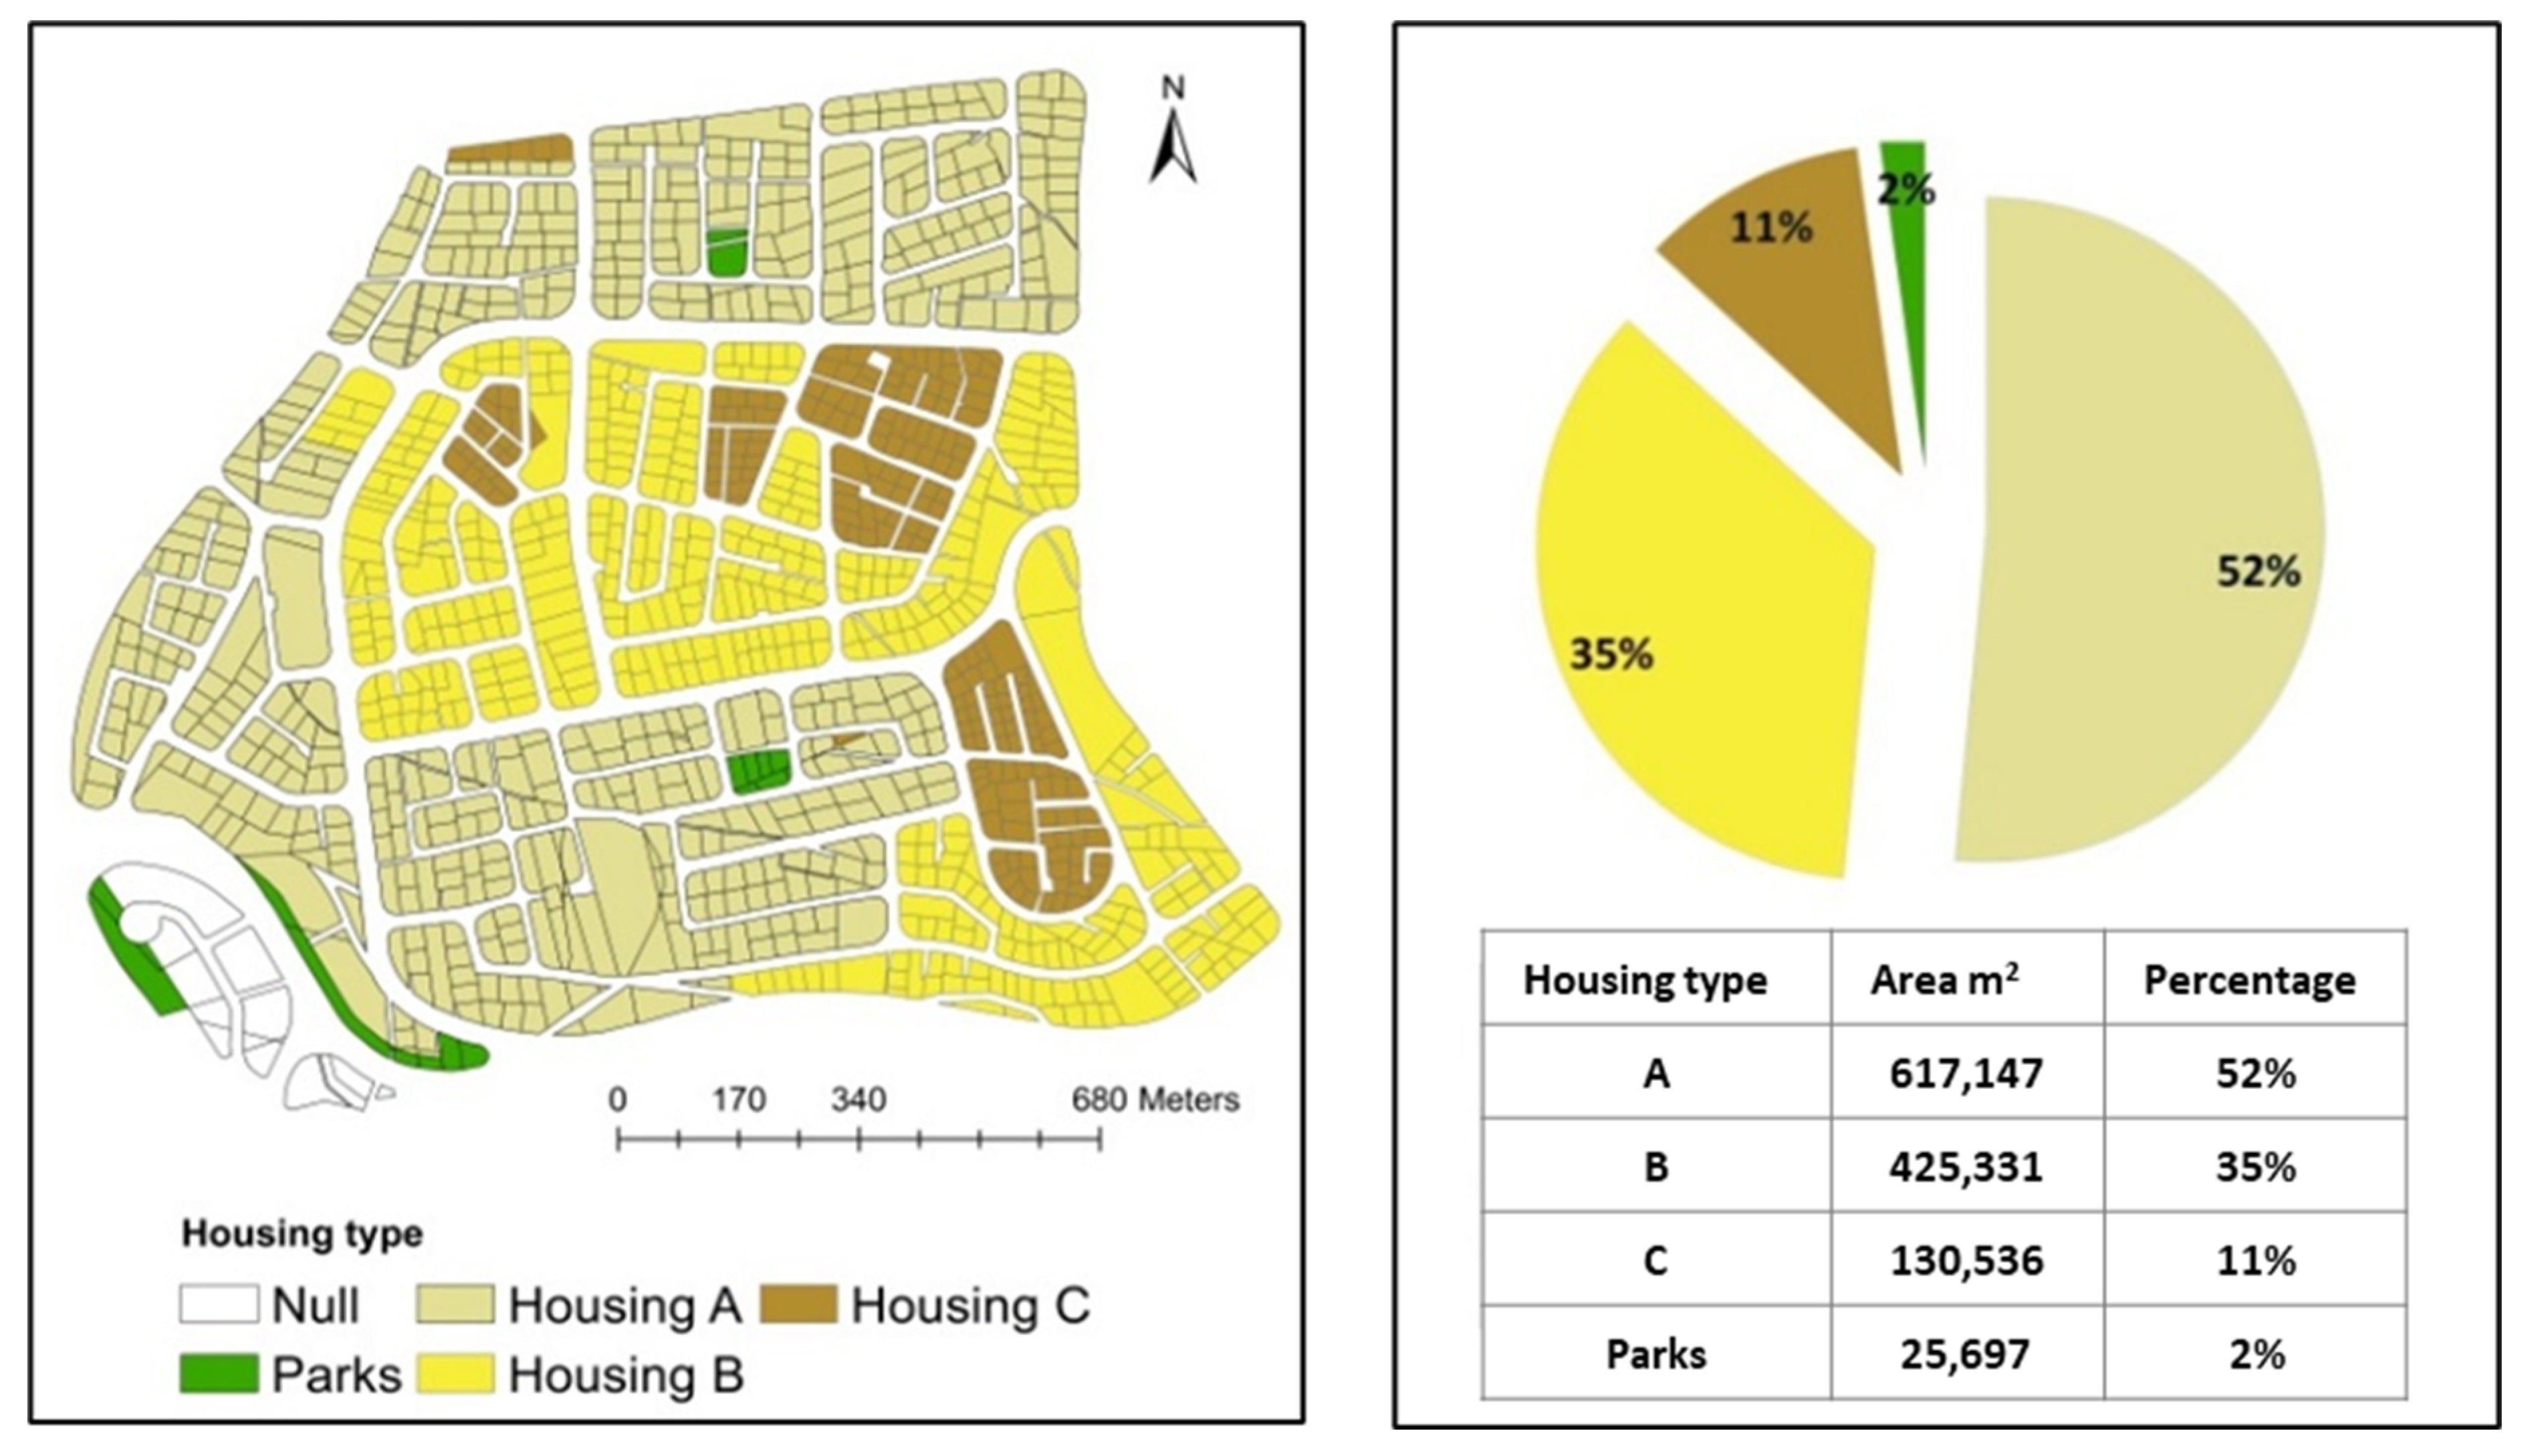
2 of land parcels. The neighborhood features a mix of housing types (A, B, and C), with the vast majority (87%) classified as types A and B, which represent upper-income housing in Amman due to high land prices; see Figure 4. Deir Ghbar is notable for having the largest land area and the lowest floor area ratio compared to other districts. Housing typologies were cross-referenced with GAM’s 2010 Transport Master Plan [11,12] to verify compliance with zoning norms for residential density and land use.
Figure 4 illustrates the housing/town planning requirements and distribution for Deir Ghbar. These distributions adhere to the Greater Amman Municipality norms, which establish zoning regulations and standards aimed at promoting integrated and sustainable development within urban areas. Figure 4 also shows the housing typology in Deir Ghbar, categorized under GAM’s zoning codes (Zones A/B for low-density villas [≤45% built-up area, plot sizes ≥ 750 m2] and Zone C for mid-rise apartments [55% built-up area, plots ≥ 400 m2]). The distribution reflects 2017 DOS census data [2,4].

Sidewalks Characteristics

The characteristics of sidewalks in Deir Ghbar were assessed based on several key factors:
  • Sidewalk Pavements: Most sidewalks in Deir Ghbar are paved, with only 9 out of the 50 census district blocks (CDBs) having unpaved sidewalks. Figure 5a illustrates the observed themes related to sidewalk pavement conditions.
  • Sidewalk Obstacles: An observation was conducted in the presence of obstacles along sidewalks across 3.3 CDBs. Most CDBs contained obstacles, with only 12 CDBs noted as having obstacle-free sidewalks. Figure 5b depicts typical sidewalk obstacles, including vegetation such as trees.
  • Sidewalk Width: Sidewalks with a width of less than two meters were deemed insufficient for comfortable pedestrian use. Most sidewalks in Deir Ghbar fell below this standard, with only eight CDBs exhibiting widths of two meters or more. Figure 6a shows the observed themes related to sidewalk widths.
  • Street Slopes: The researcher evaluated the steepness of the streets in each CDB. Most of the observed streets were nearly flat, making them generally comfortable for walking. However, a few streets presented uncomfortable slopes. Figure 6b highlights these streets with notable inclines.
  • Street Furniture: Three types of street furniture were observed: street lighting, garbage bins, and shading elements. Notably, no seating was found in the area. Figure 7 illustrates various themes of the observed street furniture.

3.4. Population of Study and Sampling Techniques

3.4.1. Study Population

The total population for this study is 17,450 inhabitants, comprising 9112 males and 8338 females, according to [52]. The unit of analysis is the household head, and the area contains a total of 4679 households. While this study utilizes data from 2015 due to the lack of more recent statistics, we acknowledge the need for updated information and emphasize the importance of continual data collection in understanding demographic trends.
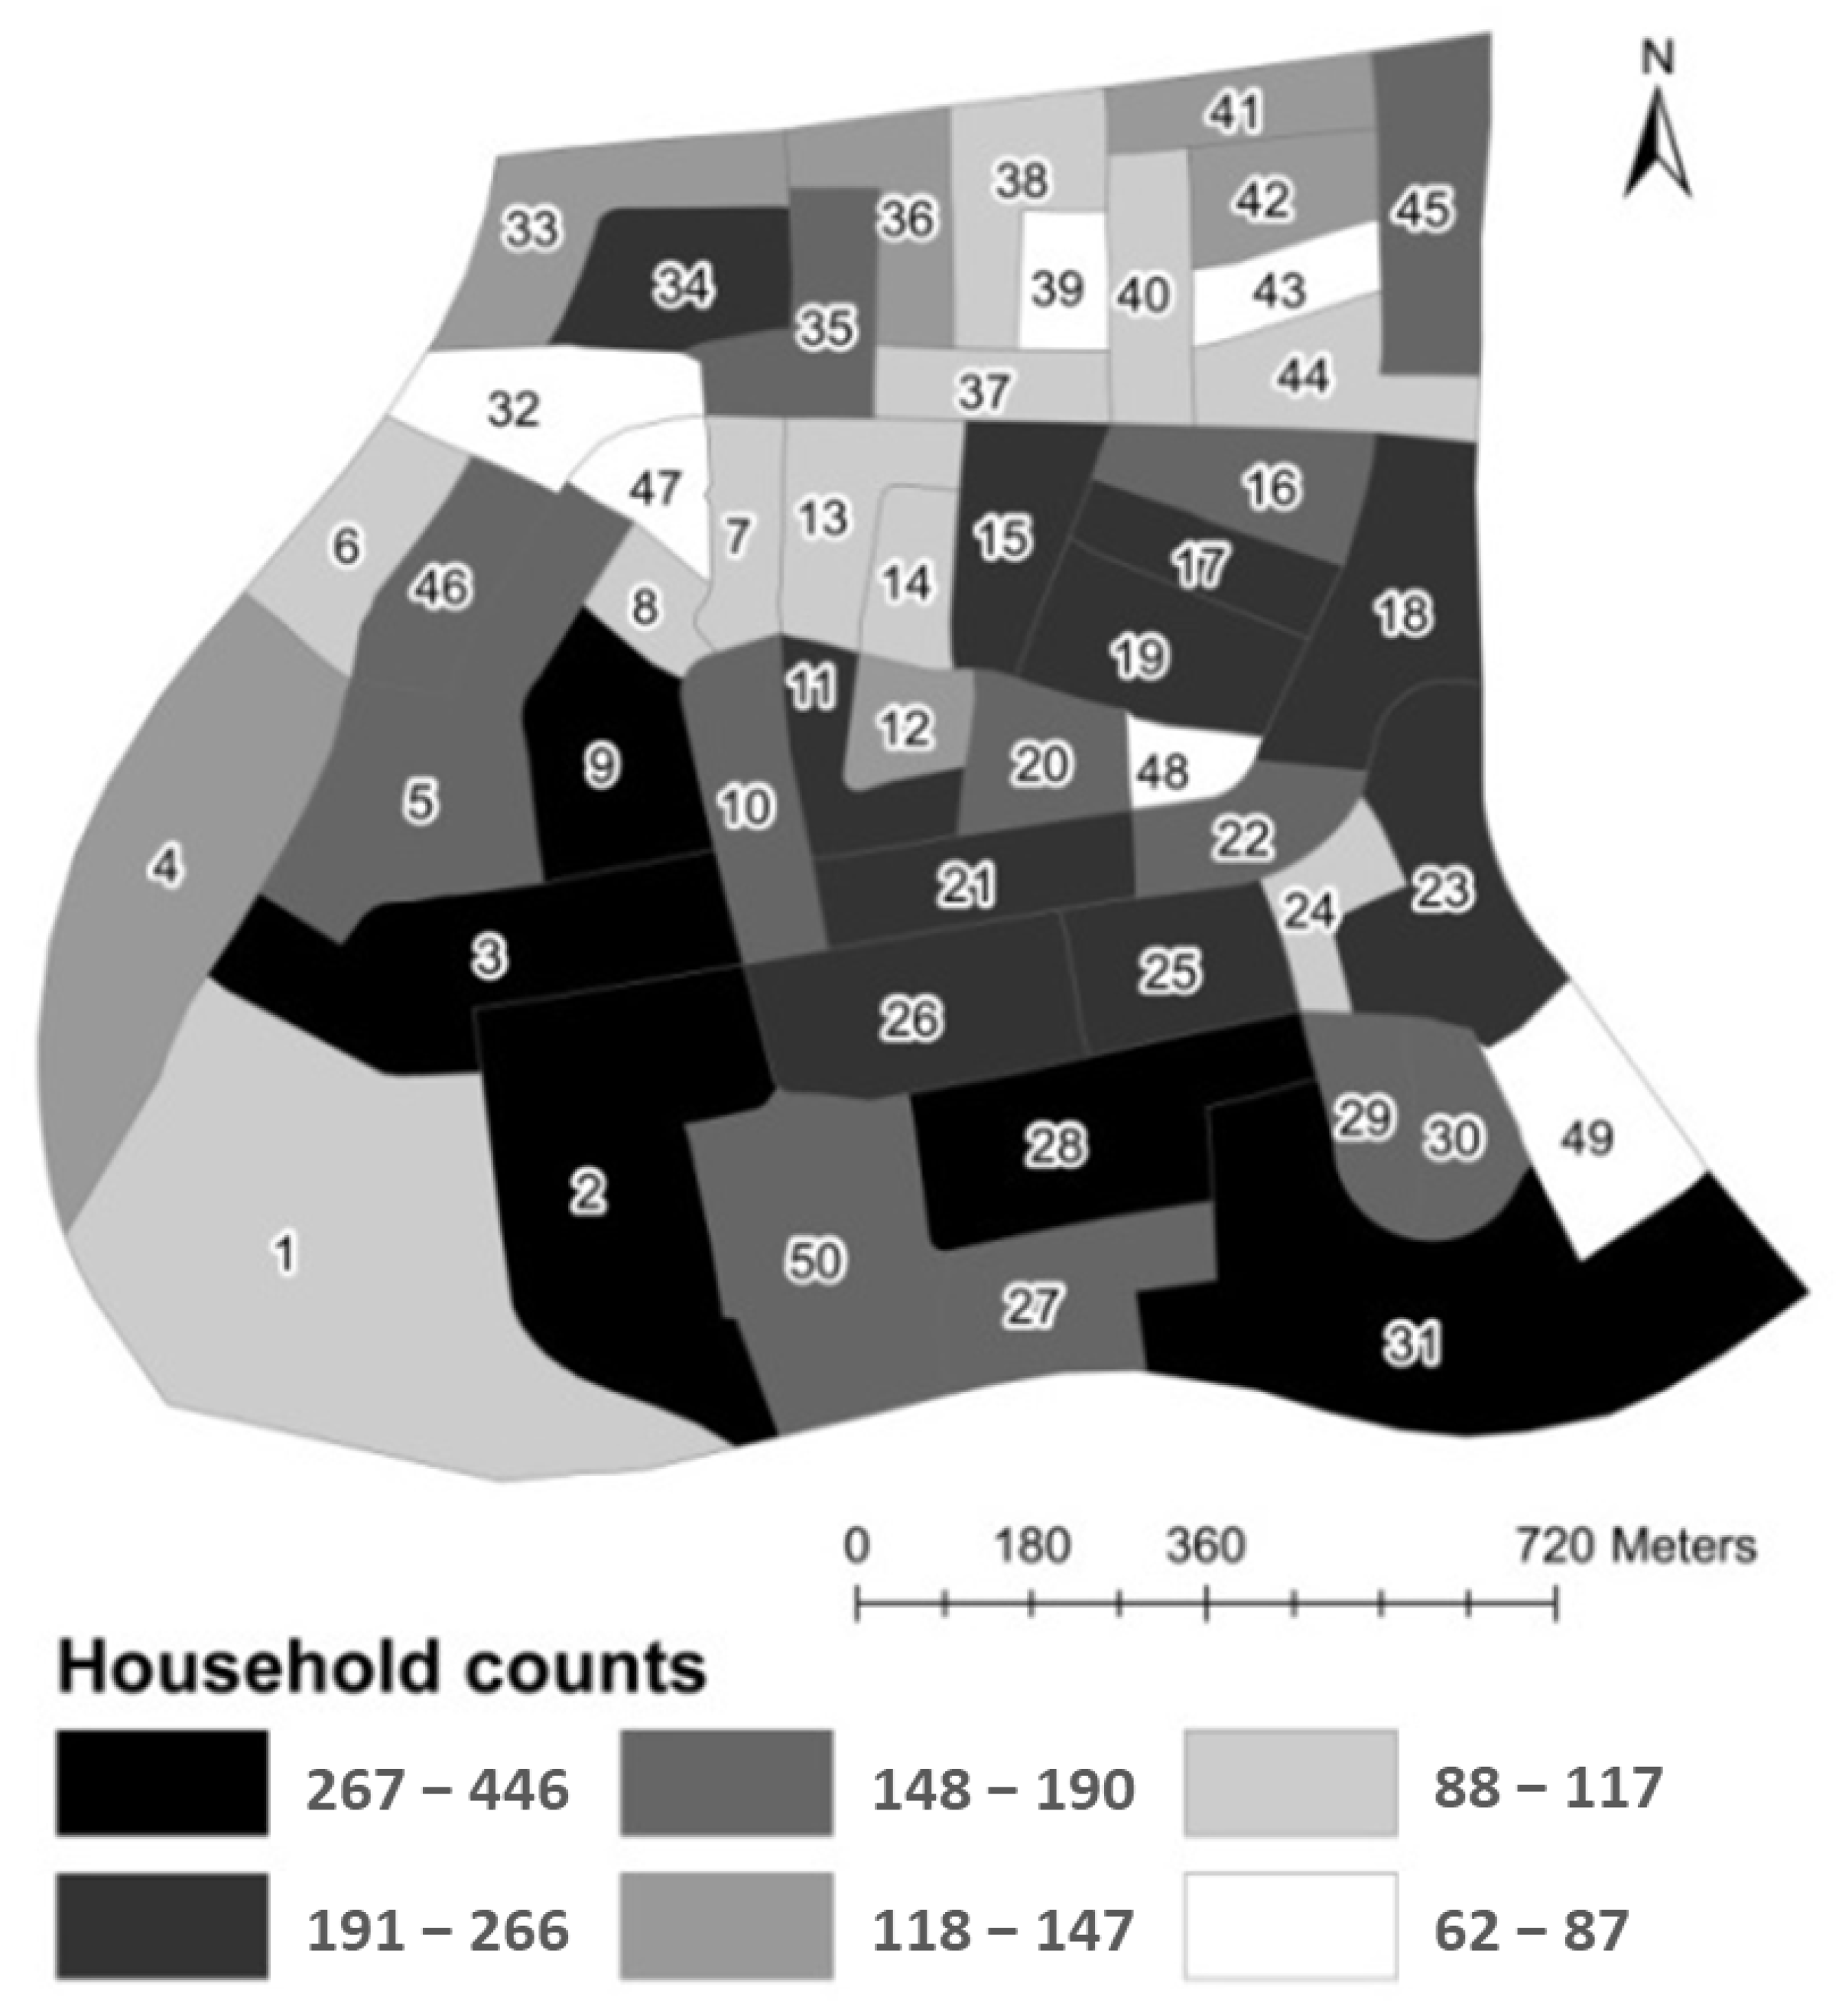
Rationale for Cluster Sampling: Given the significant heterogeneity in household density across Amman’s census data blocks (CDBs), which ranges from 62 to 446 households per block, cluster sampling was selected as the most appropriate methodology for ensuring proportional representation across all 50 CDBs. This approach minimizes selection bias and enhances the generalizability of the findings [54]. Figure 8 serves to illustrate this division and the associated household counts within the sampling frame.

3.4.2. Sampling Technique and Procedure

The sampling frame for this study encompassed households across 50 census district blocks (CDBs), with population counts sourced from the Jordanian Department of Statistics [52]. To ensure a representative sample, we aimed to include a total of 380 households, which translates to an average of 8 households selected from each CDB. This methodology provided proportional geographic coverage across the diverse urban landscape of Deir Ghbar.
The sampling execution employed a stratified randomization approach. To accurately reflect the varying residential contexts within Amman, we categorized the CDBs into three strata based on household density: low-density (<100 households), medium-density (100–300 households), and high-density (>300 households). This categorization allowed us to capture a broader range of living conditions and demographic characteristics.
For household selection, distinct protocols were tailored to the type of housing. In apartment buildings, we systematically chose every fifth unit, beginning from the ground floor and moving rightward. If a selected household was non-responsive, we replaced it with the next available unit. In the case of villa-style residences, we implemented a sequential sampling strategy along street blocks, alternating directions to minimize spatial bias and ensure a more representative sample.
By employing these methods, we sought to improve the reliability of our findings and adequately represent the diverse populations residing in Deir Ghbar.
The sample size was calculated using [55] formula for finite populations, a widely accepted method for determining statistically robust sample sizes in survey research. The formula is expressed as
n = χ2 × N × p × (1 − p)
(e2 × (N − 1)) + (χ2⋅× p × (1 − p))
where (N) represents the finite population size (4679 households), (χ2) is the chi-square value for a 95% confidence level (3.841 at 1 degree of freedom), (p) denotes the population proportion (assumed as 0.5 to maximize variability), and (e) is the margin of error (0.05 or 5%).
Parameter justifications aligned with social science standards: a 95% confidence level ensured statistical significance, a 5% margin of error balanced precision with practicality, and a population proportion of 0.5 provided a conservative estimate by assuming maximum heterogeneity. The calculated sample size of 380 households accounted for potential non-responses while maintaining analytical rigor.
This methodology minimized bias and ensured a representative sample, offering a robust framework for analyzing walkability and community dynamics in Deir Ghbar. By integrating stratification, systematic selection, and statistical rigor, the approach enhanced the reliability and generalizability of this study’s findings.

3.5. Data Collection

Quantitative data were collected to investigate objective walkability and sense of community through field surveys conducted via face-to-face interviews. The structured questionnaire, referred to as Instrument A, was administered to participants after providing them with a letter of introduction that outlined the nature and objectives of the survey. Participants were assured that their responses would remain confidential.
Upon obtaining permission from the household head, the researcher conducted the interview in the guest room to ensure a comfortable environment for the discussion. Additionally, to support the data collection process, the researcher utilized a map of the census district blocks (CDBs) and an aerial image of Deir Ghbar as references during the sampling process.
Survey Instrument: Data for this study were collected using a structured questionnaire comprising 31 closed-ended questions, administered through face-to-face interviews. The questionnaire began with an introductory section to familiarize participants with the researcher and study objectives, followed by three thematic parts. The first section (Q1–Q8) captured demographic information, including age, gender, and length of residency, to account for potential influences on variable relationships. The second section (Q9–Q11) assessed sense of community through questions addressing feeling at home, neighborhood cohesion, and relationships with neighbors. The final section (Q12–Q31) evaluated walkability perceptions, focusing on sidewalk quality, safety, and aesthetic features. While this study captures various dimensions of walkability through formalized metrics, it does not fully account for informal aspects such as unregistered retail and informal footpaths, which may play a vital role in community connectivity and cohesion. Future studies should aim to incorporate these elements to provide a holistic understanding of urban fabric.
Ethical compliance was ensured through approval by the German Jordanian University Research Review Board (IRB). Participants provided written consent, with all data anonymized and securely stored to protect confidentiality.
Fieldwork was conducted over a four-week period in March 2023 by a team of 10 trained enumerators. Interviews, conducted exclusively in Arabic to maintain consistency, averaged 15 min in duration. Non-Arabic speakers, representing less than 2% of the sample, were excluded to preserve data uniformity.
For replication purposes, mandatory data include parcel-level land-use maps (residential/commercial), street networks with intersection nodes, and settlement boundaries. Optional supplementary data encompass demographic surveys for community perceptions and pedestrian infrastructure audits, providing additional context for future studies.

3.6. Analysis

3.6.1. GIS Analysis

Geospatial analysis was conducted using ArcGIS Pro 3.0 for spatial regression and hotspot mapping, QGIS 3.28 for Moran’s I validation, and GeoDa 1.20 for spatial econometric modeling. Spatial regression models included Ordinary Least Squares (OLS) to test linear relationships and Spatial Lag Models (SLMs) adjusted for spatial autocorrelation. Hotspot analysis employed the Getis-Ord Gi statistic to detect spatial clustering of community cohesion values. Statistically significant clusters (p < 0.05) were classified as: Hotspots: Areas with higher-than-expected cohesion (z-score > +1.96); and Coldspots: Areas with lower-than-expected cohesion (z-score < −1.96). Significance thresholds assume a normal distribution under the null hypothesis of spatial randomness. While Deir Ghbar is small, the CDB unit of analysis (census blocks) is scalable. Larger cities can apply the same GIS methods by aggregating data at the neighborhood or district level.

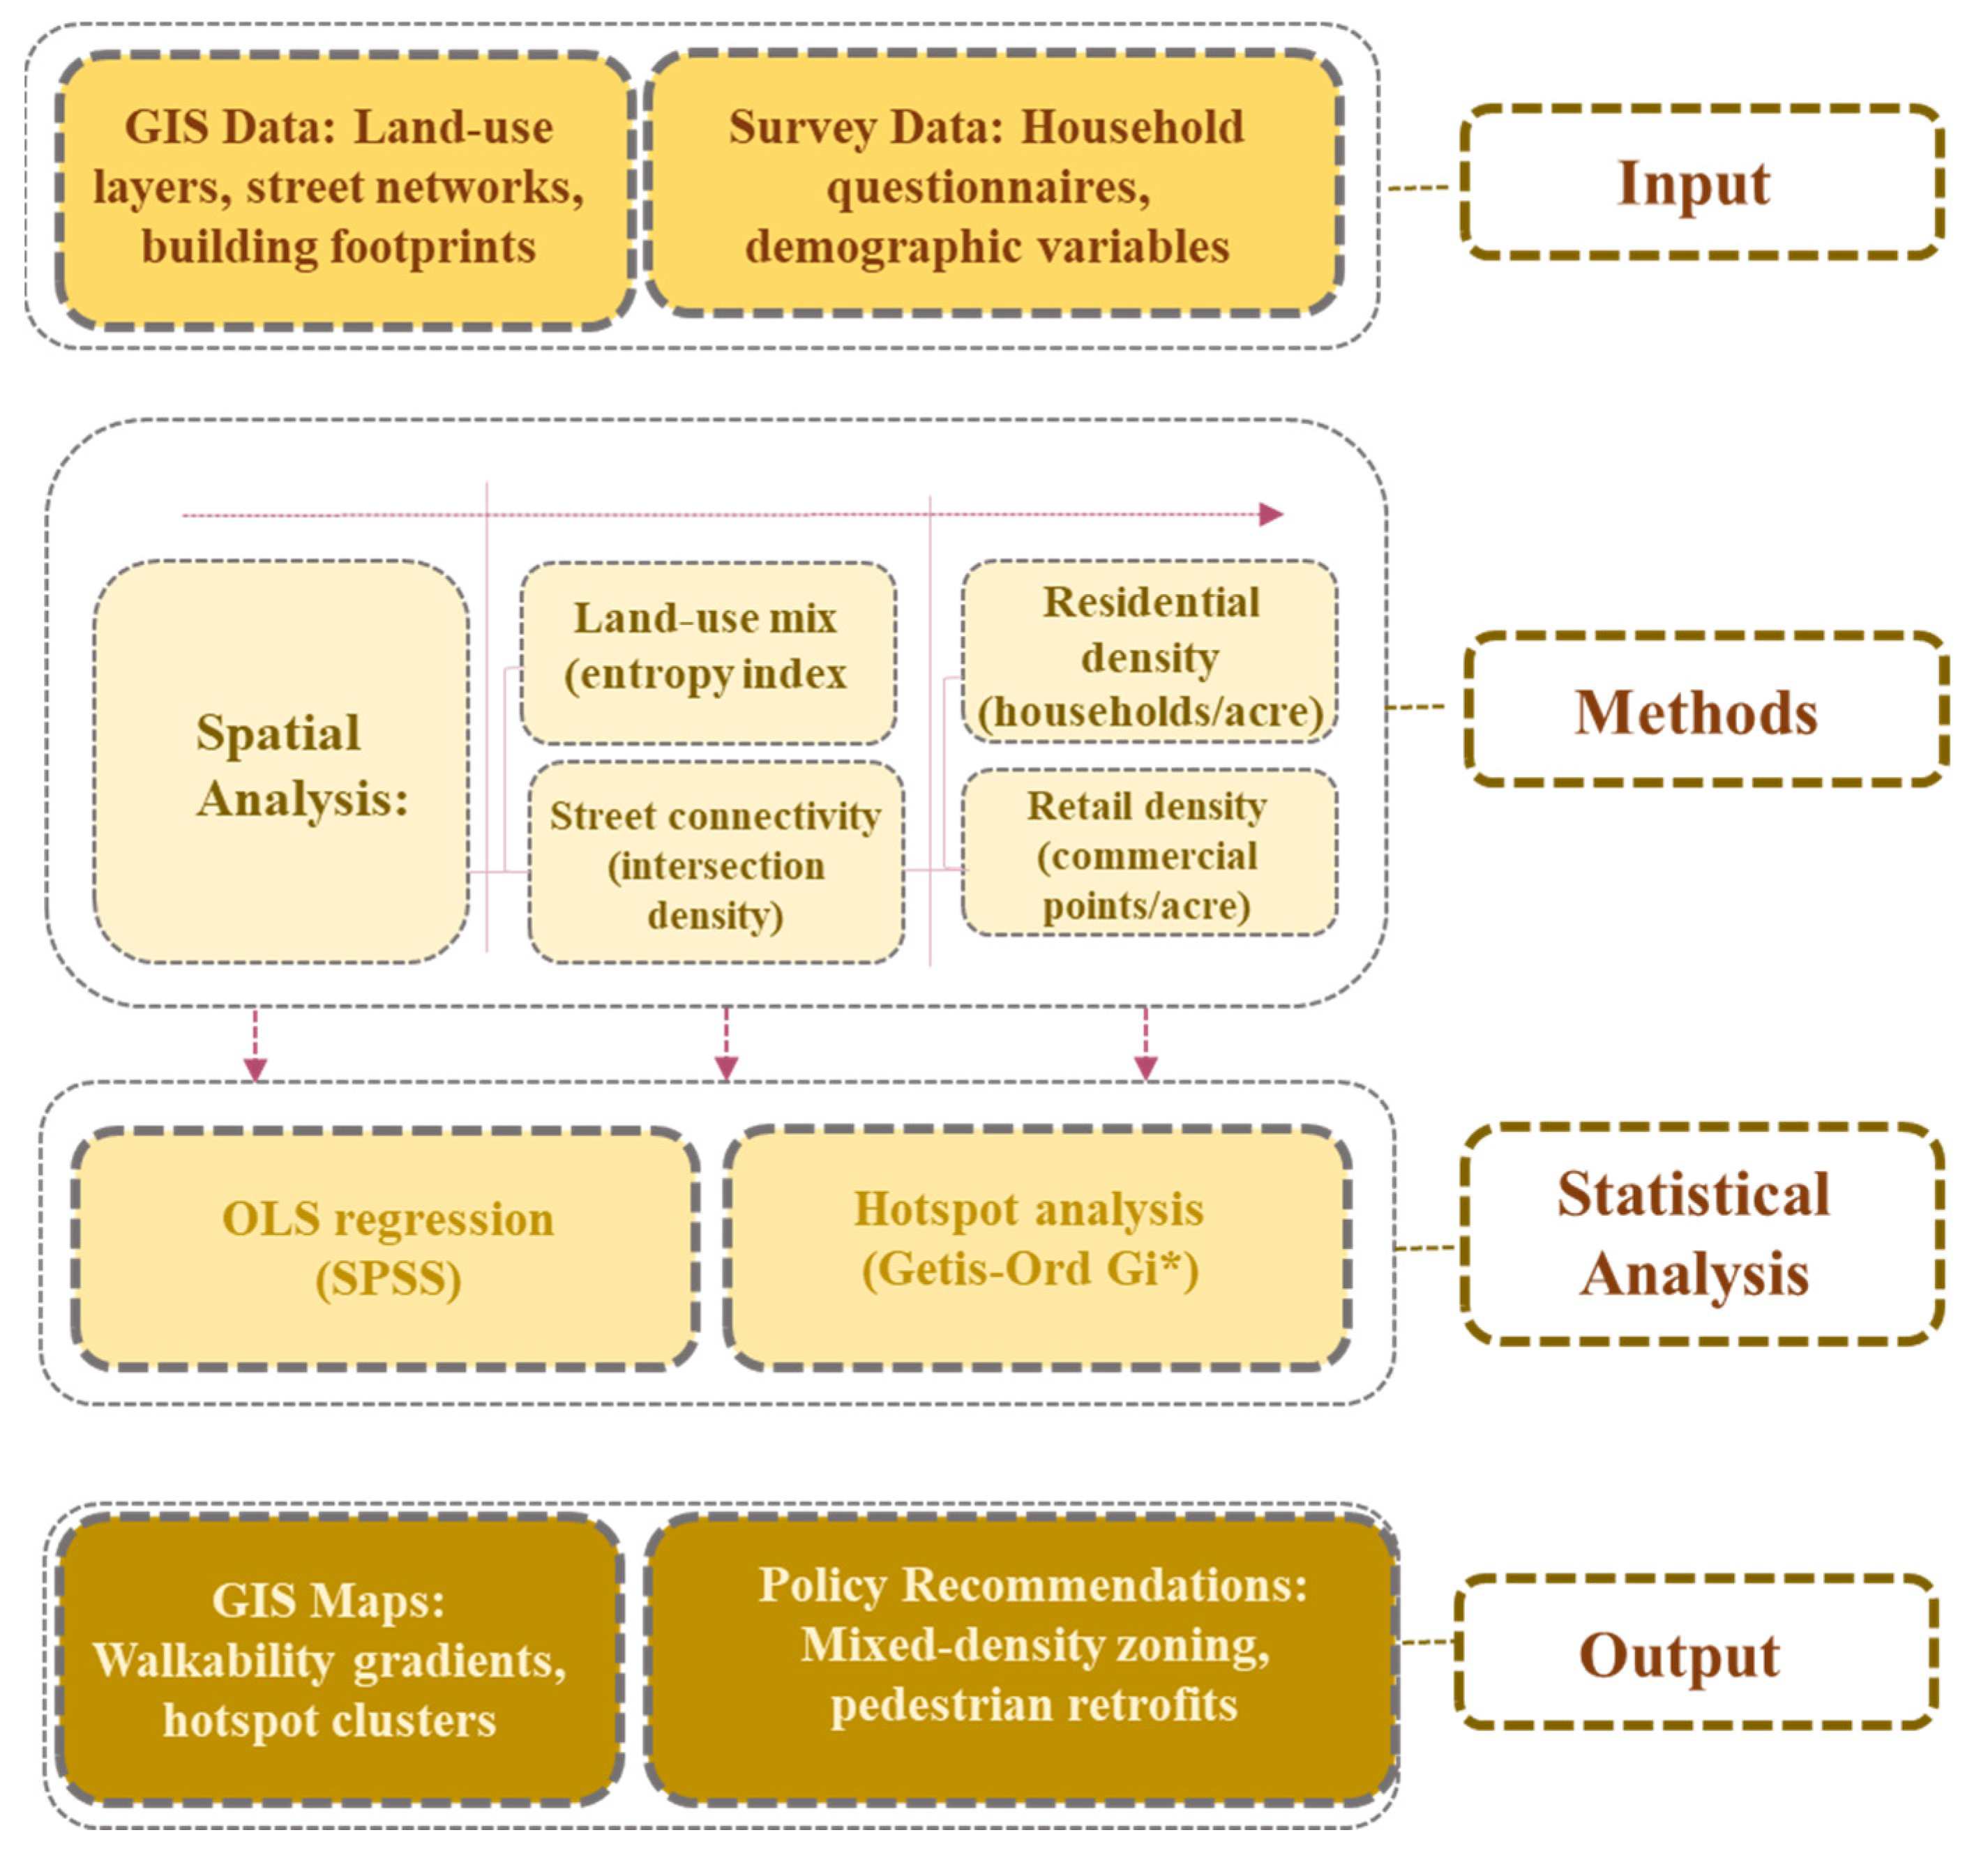
3.6.2. Workflow Visualization

To ensure methodological transparency and reproducibility, this study employed an integrated workflow combining GIS analytics and survey data (see Figure 9). The workflow began with input data acquisition, leveraging spatial layers from the Greater Amman Municipality (GAM), including parcel boundaries, street networks, and building footprints. Geospatial data were projected into Jordan’s Universal Transverse Mercator (UTM) zone 36N coordinate reference system (EPSG:32636, WGS 84 datum) [56] Concurrently, survey data capturing household-level perceptions of community cohesion were collected through structured interviews.
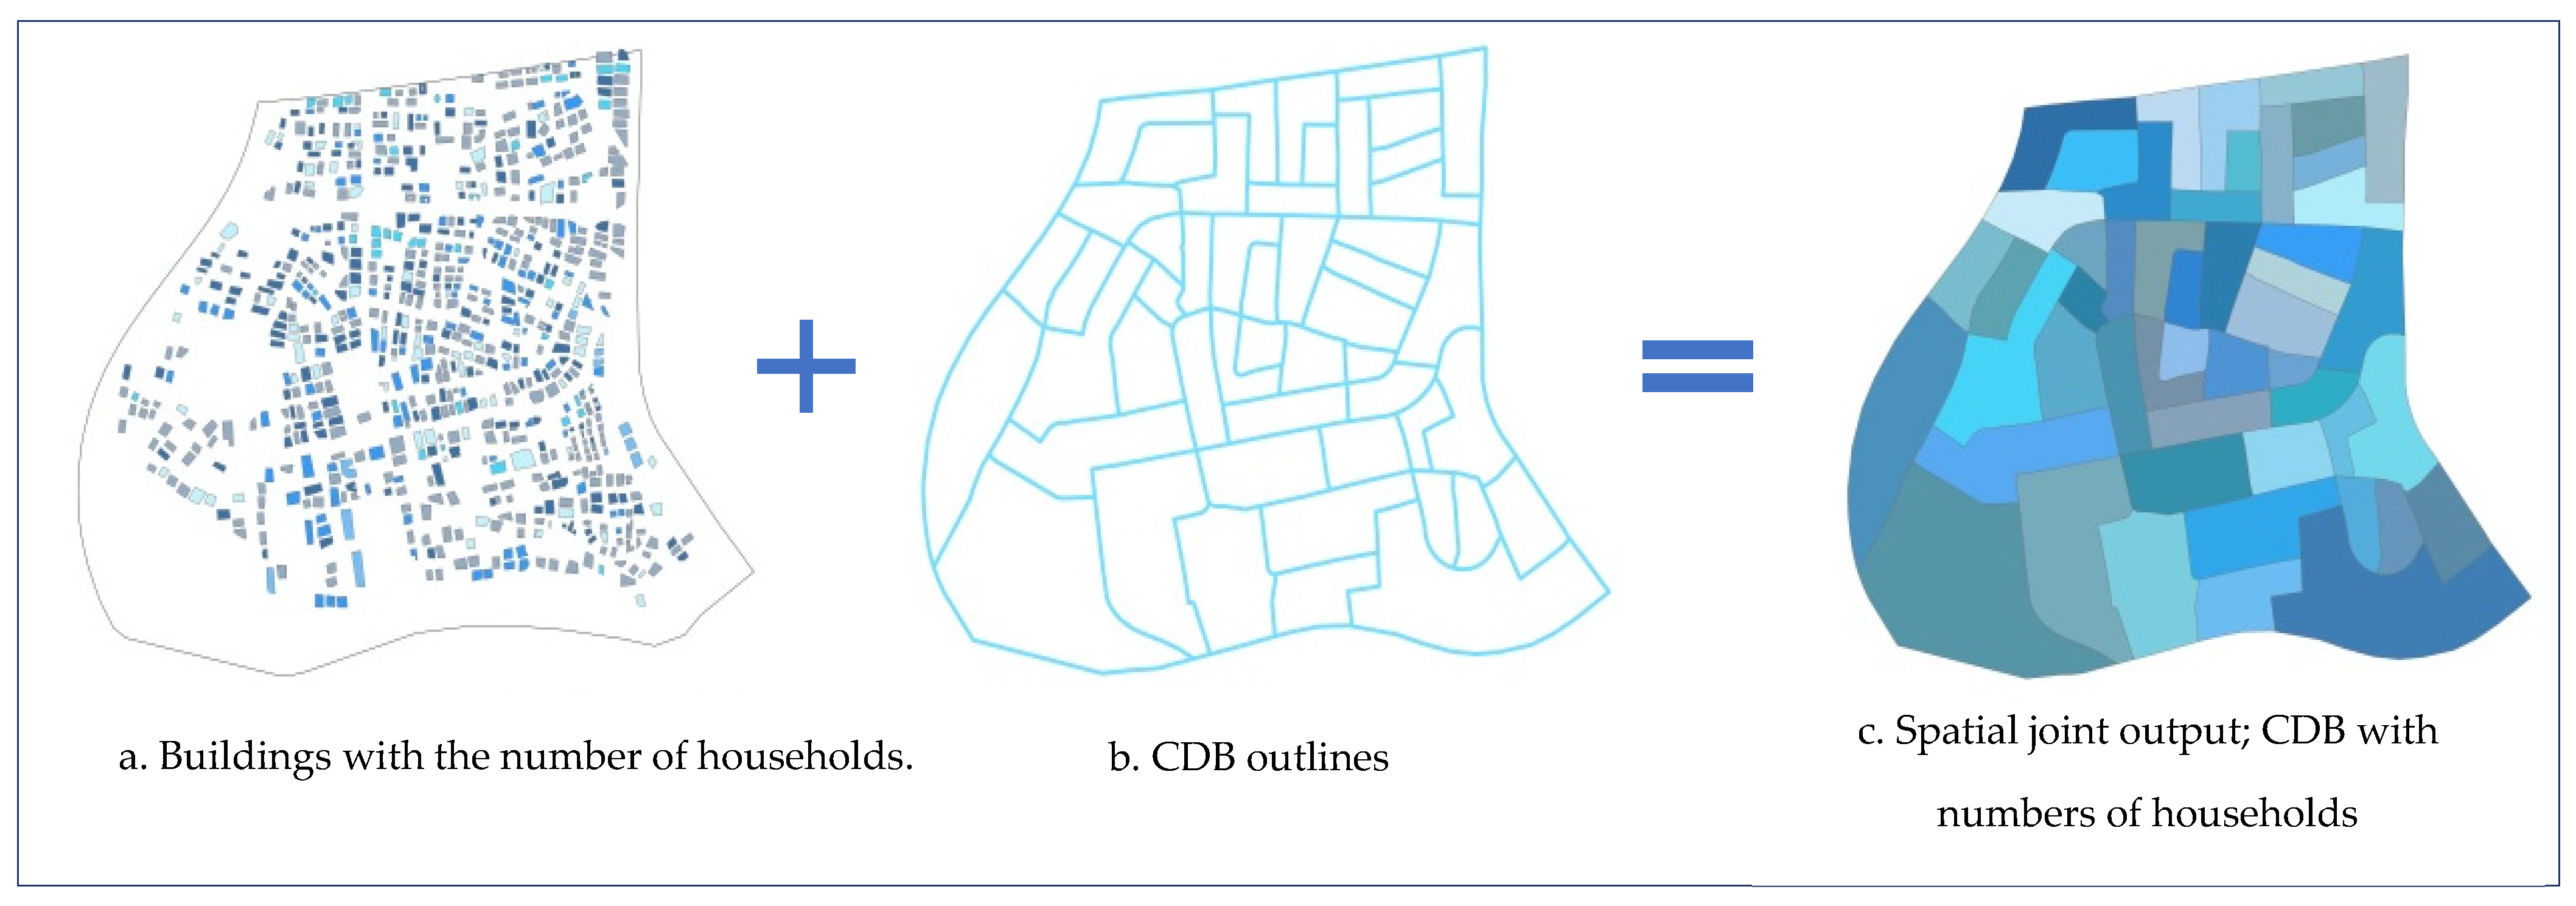
Data processing involved calculating four objective walkability metrics. Land-use mix was derived using an entropy index, computed by dividing non-residential areas (commercial, institutional) by the total area of each census district block (CDB) in ArcGIS Pro. Street connectivity was determined by extracting intersection nodes from the road network layer and aggregating their density per CDB. Residential density was estimated through spatial joins, where household counts were assigned based on building footprint areas and floor numbers (two households per floor for buildings ≥ 170 m2, one otherwise). Retail density was calculated using kernel density analysis, aggregating points of commercial landmarks (e.g., grocery stores and cafés) within each CDB.
Analysis utilized open-source and proprietary tools. Spatial regression models in GeoDa 1.20 quantified relationships between objective walkability metrics (e.g., street connectivity) and residents’ self-reported sense of community, while Getis-Ord Gi* hotspot analysis in ArcGIS Pro identified statistically significant clusters of high/low cohesion. These methods were chosen to account for spatial autocorrelation, a common limitation in urban studies. Outputs included thematic maps (e.g., Figure 10, Figure 11, Figure 12 and Figure 13 highlighting spatial mismatches between walkability gradients and community cohesion scores, and actionable policy recommendations for pedestrian retrofits.

3.6.3. Rigor and Transparency

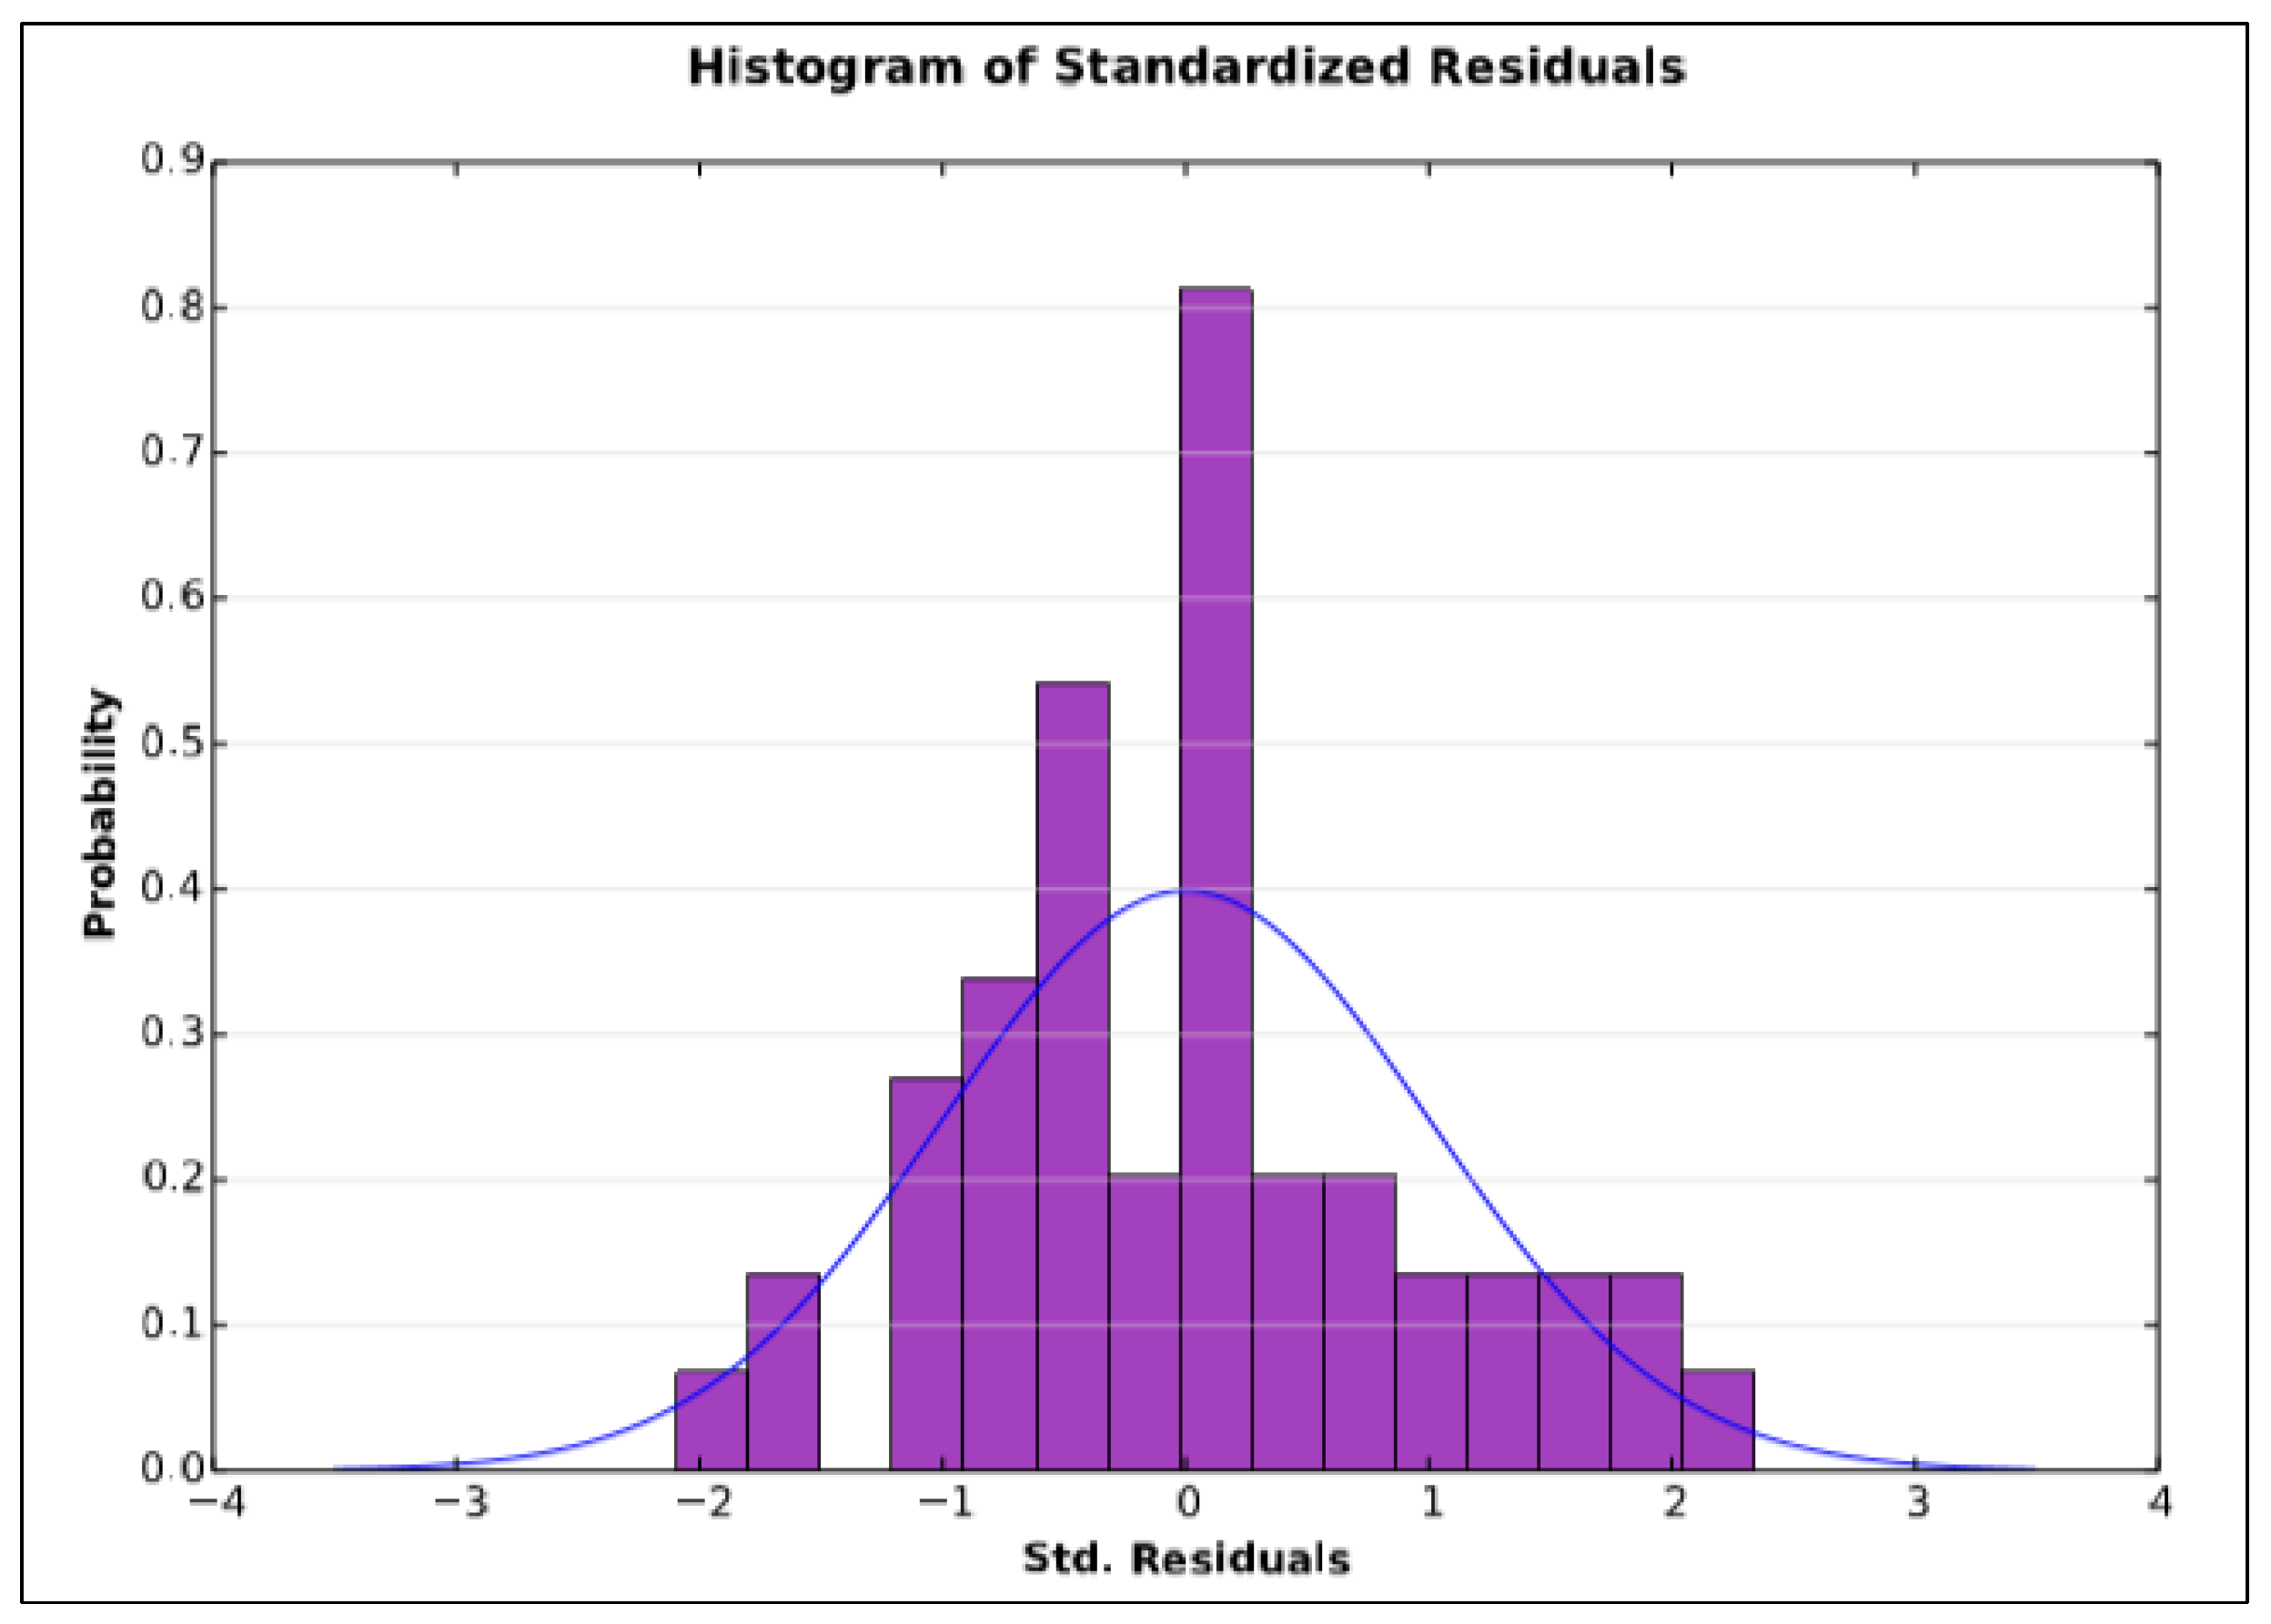
To isolate the influence of walkability on the sense of community, hierarchical regression analysis was employed. This process involved two blocks: Block 1 included demographic variables, while Block 2 incorporated walkability metrics. Sensitivity analyses, including tests for multicollinearity (Variance Inflation Factor [VIF] < 5) and heteroscedasticity (Breusch–Pagan test), were performed to ensure the robustness of findings. This study prioritizes household density over overall population density to minimize distortion from non-residential populations, such as those in workplaces. This aligns with the methodology established by [40].

3.7. GIS Data Preparation and Analysis

The analysis adhered to the workflow detailed in Figure 9, which synthesized GIS-derived built environment attributes supporting walking with survey responses to quantify community cohesion. Key procedural steps included residential density calculations that identified high-density clusters, such as CDB 15 with 68 households per acre, through spatial joins of building footprint data. Street connectivity analysis revealed 1234 intersections across the study area, with notable gaps in CDBs 5 and 8 due to cul-de-sac-dominated layouts. Hotspot mapping further validated the workflow’s spatial explicability by aligning high-density zones (CDBs 12, 15, and 22) with elevated community cohesion scores (β = 0.43, p < 0.01). This structured approach ensured methodological reproducibility while minimizing biases from subjective interpretations.
To quantify objective walkability, four GIS-derived variables—land-use mix, street connectivity, retail density, and residential density—were computed using data layers sourced from the Greater Amman Municipality (GAM) and Jordan’s Department of Statistics (DoS), spatially referenced to Jordan’s official coordinate system (EPSG: 32636) [56]. Land-use mix was calculated by extracting non-residential areas (commercial, institutional, and parks) from polygon shapefiles and dividing their total acreage by the area of each census district block (CDB). Street connectivity analysis involved converting road network polygons to centerlines using ArcGIS Pro’s Collapse Dual Line to Centerline tool, followed by counting intersections with three or more branches per CDB. Retail density was derived by aggregating commercial landmarks (e.g., grocery stores and cafes) from point shapefiles and normalizing counts by CDB area. Residential density estimations utilized building footprint data with floor counts, applying size-based household allocation: buildings ≥ 170 m2 were assigned two households per floor, while smaller buildings received one household per floor. These values were then divided by the CDB area to calculate density.
The spatial analysis workflow employed diverse GIS tools to accommodate varying data formats (points, lines, and polygons). Network Analysis identified 1234 intersections across Deir Ghbar, generating a connectivity shapefile that combined street centerlines with intersection nodes (Figure 10). This tool facilitated precise mapping of street branch connections, critical for assessing pedestrian accessibility. By systematically integrating these techniques, this study ensured robust quantification of objective walkability components, laying the foundation for subsequent socio-spatial correlations.
Second, Attribute Table Field Calculator: This tool was applied to estimate the number of households in each building based on the number of floors. In buildings ≥ 170 m2, the maximum number of households was set at two per floor, while buildings < 170 m2 were assigned one household per floor. Third, Spatial Join: This operation aggregated variables by summation (e.g., number of households) and counts (e.g., retail points) within each CDB. Each CDB polygon was assigned a summary of numeric attributes from joined features, which fell within or intersected the CDB (see Figure 11 and Figure 12).
Fourth, Non-Geometric Overlay: This GIS tool combined normalized variables (scaled 0–1) into a composite walkability index using algebraic operations. The variables included land-use mix, street connectivity, retail density, and residential density for calculating overall objective walkability [38]. This structured approach to data preparation and analysis ensures comprehensive insights into the dynamics of walkability in the Deir Ghbar neighborhood, allowing for effective assessment of its relationship with the sense of community.

4. Results

4.1. Descriptive Statistics

This section presents the descriptive analysis of data collected from field surveys and GIS, focusing on the constructs and variables relevant to this study. The Statistical Package for the Social Sciences (SPSS), version 26, was employed to analyze the data, summarizing patterns for better interpretation of the results.

4.1.1. Demographic Characteristics

The survey included a total of 309 respondents, with demographic characteristics summarized in Table 4. The age distribution among participants revealed that the largest group was aged 40–50 years, constituting 29.4% of the sample, followed closely by those aged 30–40, who made up 23.3%. The younger cohort of individuals under 20 years accounted for only 1.3%, while those aged 20–30 years represented 14.9%. Furthermore, 31% of responders were over 50 years old. In terms of gender distribution, females represented a significant majority at 71.5% (221 respondents), while males accounted for 28.5% (88 respondents). Regarding nationality, Jordanians comprised 74.4% of the sample (230 respondents), while non-Jordanians made up 25.6% (79 respondents).
Employment status indicated that most respondents, 55.7% (172 individuals), were currently employed. In contrast, 37.9% (117 respondents) reported not working, which includes individuals who may be unemployed or economically inactive, and 6.5% (20 respondents) identified as retired. The length of residency in Deir Ghbar showed that the largest group had lived in the neighborhood between 5 and 10 years (45.3%, or 140 respondents), while those residing for less than 5 years constituted 16.8% (52 respondents). A notable 30.1% (93 respondents) lived in the area for 10 to 20 years, and only 7.8% (24 respondents) had been residents for over 20 years.
Homeownership was prevalent among participants, with 72.8% (225 respondents) owning their residences, compared to 27.2% (84 respondents) who rented. In terms of income sources, 60.8% (188 respondents) reported being employed in the private sector, while 29.8% (92 respondents) indicated public sector employment, and 9.4% (29 respondents) reported having no income source. Regarding walking habits, 45.3% (140 respondents) cited recreation as their primary purpose for walking, while 29.8% (92 respondents) indicated walking for transportation. Additionally, 24.9% (77 respondents) reported engaging in walking for both purposes. These findings collectively outline a comprehensive demographic profile that is critical for contextualizing this study’s socio-spatial analyses.

4.1.2. Dependent Variable—Sense of Community

Sense of community is defined by three key dimensions: feeling at home, neighborhood cohesion, and relationships with neighbors. The overall mean score for sense of community was 2.49 (SD = 1.32). The results indicate that most respondents felt a lack of connection to their neighborhood, reporting minimal feelings of belonging and cohesion. Specifically, respondents indicated they do not feel at home, do not perceive their neighborhood as cohesive, and reported limited relationships with their neighbors. Sense of community scored low across all dimensions (Table 5). Specifically, respondents indicated they do not feel at home, do not perceive their neighborhood as cohesive, and reported limited relationships with their neighbors. This analysis highlights the generally weak sense of community felt by residents, suggesting areas for potential improvement.
This analysis provides a comprehensive overview of the demographic characteristics of the study population and the dimensions of sense of community, contributing to a better understanding of how walkability may influence social dynamics in Deir Ghbar.

4.2. Hypothesis Testing: Walkability and Sense of Community

Correlational and multivariate general linear regression analyses were employed to test the hypothesis that objective walkability affects sense of community. Objective walkability is defined by four components: land-use mix, street connectivity, retail density, and residential density.

4.2.1. Correlational Analysis

The analysis examined the relationship between sense of community and various components of objective walkability, utilizing several explanatory variables. Among these, street connectivity exhibited a strong positive correlation with the total sense of community (r = 0.484, p < 0.01), corroborating the findings of [14], which highlight the important association between street connectivity and community cohesion. Residential density demonstrated the strongest correlation (r = 0.539, p < 0.01), diverging from the results presented by [14,57], who reported that higher residential density negatively influences sense of community, attributing it to increased crime rates. In addition, land-use mix showed a weak negative correlation (r = −0.055, p = 0.337). Ref. [58] suggest that an increase in non-residential land uses tends to attract more outsiders, which can potentially weaken community bonds. Retail density also revealed a negative correlation (r = −0.085), aligned with observations from [58], who indicated that retail density does not inherently enhance the sense of community; rather, they pointed out that there is a threshold beyond which retail development might detract from community cohesion due to increased traffic and the presence of strangers.
The correlations between walkability components and all dimensions of sense of community are summarized in Table 6. Notably, residential density has strong associations with neighbor relationships (r = 0.518, p < 0.01), suggesting that compact living arrangements may facilitate interpersonal connections within the context of Amman. Additionally, the consistent positive correlations of street connectivity across all dimensions, ranging from 0.421 to 0.484, further reinforce its significance in fostering community building.
Interestingly, residential density in Amman presented a positive correlation with community cohesion (r = 0.539), which diverges from Western findings [57] (that typically associate residential density with anonymity. This discrepancy likely reflects the unique cultural context of Amman, where housing designs prioritize privacy even in dense settings. Additionally, tribal affiliations moderate the effects of anonymity, and the city’s mixed-use traditions contribute to sustaining street vitality. Thus, while Western studies highlight the challenges of high density regarding social interactions, Amman’s cultural norms around housing and the importance of tribal ties may help explain the observed positive correlation in our findings.

4.2.2. Regression Analysis

A multivariate general linear regression analysis was conducted to assess the influence of objective walkability components on sense of community, with the results summarized in Table 7.
The multivariate analysis presented in Table 7 revealed significant contrasts in the influence of objective walkability components on the sense of community. Among the variables, street connectivity emerged as the most influential factor, demonstrating robust statistical evidence with a mean square of 19.628 (F = 8.473, p < 0.001) and a total sum of squares of 255.163. This indicates that each additional intersection per square kilometer is associated with an increase in community cohesion scores by 0.38 standard deviations, as illustrated by the leftward skew in Figure 13.
Residential density displayed even greater absolute effects, with a sum of squares of 8785.109, an F-value of 11.463, and significance at p < 0.001, further supported by the histogram in Figure 13, which confirms a non-normal distribution favoring high-density clusters. Conversely, land-use mix did not achieve significance, registering an F-value of 1.493 (p = 0.119), and its minimal sum of squares of 0.036 aligns with Figure 13’s near-zero centrality. Retail density approached marginal significance with an F-value of 1.857 (p = 0.035); however, its practical effect remains negligible, as indicated by the sum of squares of 0.090 and a standardized coefficient (β) of 0.02. The overall model accounted for 31% of the variance in the sense of community (R2 = 0.31), with Figure 13’s boxplots visually confirming the predominant influence of density and connectivity over mixed-use or retail factors.
When ranked by significance, residential density exhibited the strongest effect (F (1, 792) = 11.463, p < 0.001), consistent with [40] observation that higher residential densities correlate with reduced automobile dependency, which in turn enhances walkability and strengthens communal bonds. Street connectivity followed closely with a significant impact (F (1, 792) = 8.473, p < 0.001), supporting [40] findings that well-connected street networks promote pedestrian activity and social interaction. In contrast, retail density made a minimal contribution to the overall model (F (1, 792) = 1.857, p = 0.035), which can be attributed to Deir Ghbar’s reliance on small-scale markets rather than high-end retail options, thereby limiting their capacity to foster community values. Similarly, land-use mix showed no significant effect (F (1, 792) = 1.493, p = 0.119), likely due to the neighborhood’s lack of non-residential land uses. Collectively, these findings underscore the varying roles of walkability components, with residential density and street connectivity identified as critical factors in shaping community ties, while retail and land-use diversity were found to have limited relevance within this specific context.
This structured analysis illustrates the significant relationships between the components of objective walkability and sense of community, revealing the crucial factors contributing to community dynamics in Deir Ghbar.

4.2.3. Hierarchical Regression—Socio-Economic Variables

The hierarchical regression analysis, controlling for all socio-economic variables, as indicated in Table 4, identified three key patterns related to the sense of community. The model demonstrated a good fit, Model Fit: R2 = 0.34, Adj. R2 = 0.29, F(11,297) = 9.87, p < 0.001, confirming the substantive role of socio-economic factors alongside built environment features. The hierarchical regression controlling for all socio-economic variables (Table 8) revealed three key patterns:
Among the predictors, longer residency exhibited a strong positive association with sense of community (β = 0.29, p = 0.002), suggesting that individuals who have lived in the neighborhood for an extended period develop deeper connections and stronger neighborhood ties. Similarly, home ownership was also a significant positive predictor (β = 0.21, p = 0.011), highlighting that stable, rooted populations are more likely to feel a sense of belonging (Table 8).
Cultural factors also played a crucial role in community cohesion. Non-Jordanian residents reported a significantly lower sense of community (β = −0.15, p = 0.032), indicating challenges in integration among migrant populations (Table 8). Furthermore, the analysis revealed that individuals who walked for recreational purposes exhibited stronger community bonds (β = 0.13, p = 0.023) compared to those walking primarily for utilitarian reasons. Conversely, economically inactive individuals displayed a significant negative association with community cohesion (β = −0.18, p = 0.026), suggesting that lack of engagement in paid work may hinder social connections (Table 8).
Interestingly, age and gender demonstrated non-significant effects on community cohesion (p > 0.05) (Table 8). This finding contrasts with some Western literature that emphasizes the importance of lifecycle factors; however, it aligns with studies in the Middle East that underline the stability provided by long-term residency [10]. Overall, the model accounted for 34% of the variance in community cohesion, affirming the influential nature of socio-economic factors in shaping social dynamics within urban settings.

4.3. Spatial Mapping and Hotspot Analysis

The hotspot analysis utilized GIS tools to identify statistically significant spatial clusters based on the features of the Deir Ghbar CDBs. This analysis generated a feature class layer that included p-values, z-scores, and confidence level bins (Gi_Bin) for each CDB. The p-values and z-scores indicate the statistical significance of the clusters, while the Gi_Bin field categorizes features into hot and cold spots. CDB features within the ±3 bins demonstrate statistical significance at a 99% confidence level; those within the ±2 bins indicate 95% significance, and the ±1 bins reflect 90% significance. In contrast, features in bin 0 are not statistically significant.

4.3.1. Sense of Community by Objective Walkability Hotspot Analysis

The hotspot analysis uncovered critical spatial relationships between objective walkability components and sense of community. High residential density clusters, particularly in census district blocks (CDBs) 12, 15, and 22, demonstrated a strong positive correlation with sense of community hotspots, as illustrated in Figure 14. These zones, characterized by densities of ≥50 households per acre, showed statistically significant associations (p < 0.01), suggesting that concentrated residential populations foster communal bonds. Conversely, CDBs 5, 8, and 30 emerged as low-connectivity cold spots, where cul-de-sac-dominated street networks correlated with diminished social cohesion.
To validate the second hypothesis, which examined the interplay between objective walkability metrics—land-use mix, street connectivity, retail density, and residential density—and their collective impact on sense of community. Ordinary Least Squares (OLS) regression residuals were analyzed spatially, with the results mapped in Figure 14. The figure distinguishes areas by the significance of walkability’s influence: red hotspots denote a statistically significant impact (99% confidence level), blue cold spots reflect weaker associations, and yellow areas indicate no measurable effect.
Notably, this research represents the first application of GIS spatial statistics and mapping to assess the objective walkability’s spatial influence on community cohesion. By integrating quantitative spatial analysis with socio-environmental metrics, this study advances methodological approaches for understanding urban social dynamics, filling a critical gap in the existing literature.

4.3.2. Spatial Regression Residuals

The spatial regression analysis yielded a model explaining 31% of the variance in sense of community (adjusted R2 = 0.25), with [59] testing (p = 0.495) confirming stable spatial relationships across the study area. As demonstrated in Table 9 and visualized through Figure 14’s bar chart, residential density emerged as the sole statistically significant predictor (β = 0.43, p < 0.01), underscoring its pivotal role in fostering community bonds within Amman’s high-density neighborhoods. This finding aligns with Jane Jacobs’ seminal work on the social benefits of compact urban forms, where increased residential concentrations promote casual encounters and neighborhood familiarity. Street connectivity, while showing a moderate positive association (β = 0.26), failed to reach statistical significance (p = 0.25)—a result that reflects West Amman’s fragmented street networks dominated by cul-de-sacs and arterial roads designed primarily for vehicular movement rather than pedestrian interaction.
Notably, neither retail density (β = 0.002, p = 0.99) nor land-use mix (β = 0.001, p = 0.119) demonstrated meaningful relationships with community cohesion, contrasting sharply with the walkability literature from European and North American contexts. This divergence likely stems from Amman’s zoning policies that physically separate commercial and residential uses in Zones A/B, coupled with the automobile-oriented design of retail centers like Abdoun Mall that discourage spontaneous social encounters. The histogram of standard residuals in Figure 15 confirms appropriate model specification, with normally distributed errors suggesting that our analysis reliably captured the spatial dynamics at play. These collective findings highlight how Amman’s current planning paradigm—particularly its emphasis on low-density, single-use zoning in western districts—systematically undermines the very conditions necessary for walkability to translate into stronger social connections.
The final regression model predicting sense of community (SoC) was Ŷ = 1.24 + 0.43(X1) + 0.26(X2), where Ŷ = predicted sense of community score; X1 = residential density (households/acre), B = 0.43, β = 0.39, p < 0.001, 95% CI [0.20, 0.66]; X2 = street connectivity (intersections/km2), B = 0.26, β = 0.22, p = 0.025, 95% CI [0.03, 0.49].
Model Fit: Adj. R2 = 0.25, F (4,304) = 11.46, p < 0.001, RMSE = 0.82.
As illustrated in Table 10, residential density emerged as the most significant predictor (β = 0.43, p < 0.01), explaining 25% of the variance in sense of community. This aligns with [40] findings, which associate higher residential densities with reduced car dependency and stronger communal ties. Street connectivity showed a marginal positive effect (β = 0.26, p = 0.025), reinforcing [40]’s argument that walkable street networks encourage pedestrian activity and social interaction. In contrast, retail density demonstrated a negligible impact (β = 0.002, p = 0.99), likely due to Deir Ghbar’s predominance of small-scale retail establishments, which lack the diversity needed to enhance community cohesion. Similarly, land-use mix exhibited no significant relationship (β = 0.001, p = 0.119), attributable to the neighborhood’s limited non-residential land uses.
These results underscore the differential impacts of walkability components, with residential density and street connectivity playing more pivotal roles than retail presence or land-use diversity in shaping communal bonds. The analysis highlights the need for context-sensitive urban policies that prioritize density and connectivity while addressing local retail and land-use constraints.

4.3.3. Summary of Key Relationships

In summary, the analysis indicates significant spatial relationships between residential density and sense of community, while street connectivity also plays a role, albeit to a lesser extent. In contrast, retail density and land-use mix did not significantly contribute to the model’s explanatory power. The results emphasize the importance of residential density and connectivity in fostering a sense of community in Deir Ghbar. The analysis revealed distinct patterns in how objective walkability metrics influence community cohesion in Amman’s urban fabric. High residential density exhibited the strongest association with social cohesion (β = +0.540, p < 0.01), suggesting that compact neighborhoods foster communal bonds despite Amman’s car-centric urban form. High-density zones (e.g., CDB 15 with 68 households/acre) fostered frequent neighborly interactions, validating Jane Jacobs’s theory of “eyes on the street” as a catalyst for community trust. Street connectivity also contributed positively (r = +0.484), though its regression impact was marginal (β = +0.26, p = 0.25), reflecting Amman’s car-centric street design, where cul-de-sacs and wide setbacks still dominate.
Conversely, land-use mix and retail density showed negligible effects (β = −0.055) and (β = −0.085), respectively), contrasting with Western urban studies where mixed-use zoning drives cohesion. This divergence stems from Amman’s policy-driven homogeneity: Category A/B zoning laws restrict non-residential uses (e.g., commercial plots account for only 12% of Deir Ghbar’s area), while car-centric retail clusters (e.g., Abdoun Mall) prioritize vehicular access over pedestrian interaction. These findings align with [57] observation that land-use diversity enhances cohesion only when complemented by walkable design. This synthesis underscores how Amman’s zoning legacy—not density itself—mediates walkability’s social impacts, urging planners to reconcile spatial policies with community-building goals.

5. Discussion

5.1. Key Findings

This study identified residential density as the strongest predictor of sense of community in Deir Ghbar, with a coefficient of β = 0.43) (p < 0.01). This finding contrasts with the global literature, which often links high density with reduced social capital [58]. In Amman, zoning policies (Categories A/B vs. C/D) play a significant role in shaping this relationship. In Bogotá, the interaction of land-use mix and connectivity positively influences walkability, facilitated by zoning policies that support heterogeneous neighborhoods [25]. In contrast, Amman’s rigid A/B zoning, which mandates large plots and single-use villas, hinders mixed-use development. For example, CDB 15 contains only 0.2 non-residential uses per acre compared to 1.5 in East Amman’s CDB 34. Such policy-driven homogeneity limits opportunities for social interaction, supporting [60] theory that diversity in land use contributes to active community engagement.
Jordan’s Syrian refugee population (1.3 million, with 80% residing in urban areas) introduces unique social dynamics. In East Amman, high-density, informal refugee enclaves leverage retail (e.g., street vendors) to build community despite infrastructure deficits [46]. These areas demonstrate how cultural diversity can enhance social capital through the adaptive use of public space. In contrast, Deir Ghbar’s predominantly Jordanian makeup (74.4%) reflects cultural insularity, exacerbated by zoning policies. This observation aligns with [10] assertion that Amman’s west–east divide fosters socio-economic exclusion, which moderates the impact of walkability on community cohesion. For example, in Jabal Al-Nuzha (East Amman), refugee-led micro-retail, such as bakeries and barbershops, creates third spaces for interaction, enhancing social bonds [1]. Conversely, Deir Ghbar features gated communities and car-oriented malls, such as Abdoun Mall, which deter casual encounters and reduce social capital.

5.2. Contradictions and Global Comparisons

Contrasting with Bogotá’s land-use mix focus, Amman has a density-only paradigm. The city’s mixed-use zoning and grid-like street networks prioritize connectivity and land-use diversity, fostering pedestrian interactions [25]. Meanwhile, Amman’s rigid zoning suppresses mixed-use development, leading to a reliance on residential density for social exchange. For example, Deir Ghbar’s Category A zones have only 0.2 non-residential uses per acre compared to 1.5 in East Amman’s Category C zones [52].
Street Connectivity’s Marginal Impact: Street connectivity showed a moderate correlation with sense of community (r = 0.484) but had an insignificant regression impact (β = 0.26, p = 0.25). This reflects West Amman’s car-centric urban form, where cul-de-sacs and wide setbacks (≥7 m) disrupt pedestrian networks, unlike Bogotá’s interconnected barrios [25]. Notably, CDB 22, a high-density cluster in Deir Ghbar, reported stronger community ties despite poor connectivity, highlighting the importance of residential density in fostering social interactions. Non-Significance of Land-Use Mix and Retail Density: Both land-use mix (r = −0.055) and retail density (r = −0.085) exhibited no significant correlation with sense of community, diverging from studies in cities like Portland [61]. This lack of significance stems from Deir Ghbar’s exclusionary zoning, where only 12% of the area is designated for non-residential use, primarily concentrated in car-dependent malls (e.g., Abdoun Mall). The design of these retail spaces lacks pedestrian-scale features, further detracting from walkability and limiting community interaction.
While the literature commonly associates high density with crime and anonymity [57], Amman’s context presents a reversal of this trend. In neighborhoods like Jabal Al-Nuzha, density fosters collective coping mechanisms, such as shared childcare and informal markets, that build trust [1]. This supports [50], who argue that density’s impact is contingent on urban design and social equity. Retail Density’s Threshold Effect: Ref. [58] discuss a threshold for retail density beyond which social capital may decline. This is evident in Deir Ghbar’s car-dependent malls, like Taj Mall, which features large parking lots and arterial roads that deter pedestrian visits and foster an environment dominated by outsiders. In contrast, East Amman’s corner shops (baqala), which cater to residents, enhance social cohesion through frequent local use.

5.3. Policy Implications

The analysis presented in this study offers several key policy implications aimed at enhancing urban planning in Amman. The GIS heatmaps (Figure 10, Figure 11, Figure 12 and Figure 13) identify priority areas for pedestrian retrofits, specifically highlighting community district blocks (CDBs) 12 and 22 as focal points for intervention. To promote social equity, it is essential to transition from rigid A/B zoning classifications to mixed-use corridors that encourage diverse land use. For instance, implementing zoning reforms that mandate a minimum of 20% non-residential use in Zones A and B would facilitate the development of vibrant neighborhoods that support both residential and commercial activities.
Additionally, pedestrian-centric design standards play a critical role in enhancing walkability. We advocate for establishing sidewalk width standards of at least 2 m, accompanied by annual audits to ensure compliance and maintenance. This approach aligns with successful models from cities such as Bogotá, where initiatives like the TransMilenio BRT and Ciclovía prioritize street connectivity and support active transportation modes, fostering social interaction [25]. Furthermore, the inclusivity of refugee populations must be a priority in urban planning processes. Establishing co-design committees that engage refugees in the planning and upgrading of informal settlements can help ensure that their unique needs are addressed. This approach not only promotes social integration but also enhances the resilience of urban environments facing demographic shifts.
In contrast, Amman’s current car-centric zoning practices, such as those observed in Category A setbacks, disrupt pedestrian networks and force a reliance on population density for social cohesion. The absence of mixed-use zoning has resulted in retail clusters that cater primarily to vehicular traffic, and this is reflected in the observed non-significance of retail density in our analysis (r = −0.085, p = 0.135). By adopting these policy innovations, Amman can draw upon the lessons learned from other cities, including Sydney’s inclusionary zoning practices that promote accessibility and diversity [62]. Moreover, our GIS–audit hybrid approach can serve as a valuable tool for policymakers to address urban fragmentation, integrating qualitative methods such as participatory mapping with quantitative data to inform effective urban planning strategies.
Zoning laws in Amman reflect complex socio-political dynamics that shape urban life and perpetuate segregation between affluent and underserved areas [4,9]. These regulations are not merely technical frameworks; they embody socio-political negotiations that influence urban planning and resource allocation, often favoring low-density, high-income developments while restricting density in poorer neighborhoods. This disparity exacerbates socio-economic divides and limits access to essential services and public amenities [3,6], thereby impacting community cohesion. Moreover, this regulatory segmentation restricts social interactions among individuals from different socio-economic backgrounds, further entrenching inequalities [7,8]. Deeper engagement with the socio-political dimensions of zoning is crucial for enhancing our understanding of urban planning in contexts marked by rapid demographic changes and displacement, ultimately aiding the development of equitable and inclusive urban interventions that can better integrate diverse communities.

5.4. Limitations

In acknowledging the limitations inherent in our current study, we note the absence of age group segmentation and temporal analysis regarding the purposes of walking. These dimensions are crucial for understanding the nuanced ways different population segments interact with their environment. By not incorporating age categories, we miss out on revealing potential variations in walking behaviors, preferences, and needs, which could significantly affect community cohesion. Likewise, without assessing the timing of walking activities, our analysis lacks critical context that could inform how different demographics utilize pedestrian spaces throughout the day or week. Addressing these gaps in future research is essential, as it will enable a more thorough exploration of the relationships between urban walkability, social connection, and demographic factors, ultimately guiding more effective urban planning and policy recommendations.
This study acknowledges the limitation of not fully integrating informal pathways and unregistered services within the quantitative analysis of walkability. Such factors are critical in many urban contexts and should be explored in further research to provide a comprehensive framework for understanding socio-spatial dynamics.

6. Conclusions

This study has explored the intricate relationship between the sense of community and components of objective walkability, revealing insightful nuances that inform urban planning and social cohesion in Amman. By objectively analyzing features such as land-use mix, street connectivity, retail density, and residential density, this research provides a detailed understanding of how these factors influence community ties within urban spaces.
This study’s emphasis on equitable walkability aligns with SDG 11.7’s call for inclusive public spaces. This research underscores the urgent need for context-specific urban planning that incorporates sustainability and inclusivity to address socio-economic polarization, aligning closely with the intentions of SDG 10 (Reduced Inequalities). The findings highlight the urgency of reorienting Amman’s urban planning toward context-specific strategies that prioritize equitable access to pedestrian infrastructure and mixed-use zoning. By advocating for mixed-use, pedestrian-friendly urban planning, this study provides a framework for reducing inequalities among neighborhoods, particularly those affected by refugee influxes and socio-economic divides.

6.1. Sense of Community in Relation to Objective Walkability

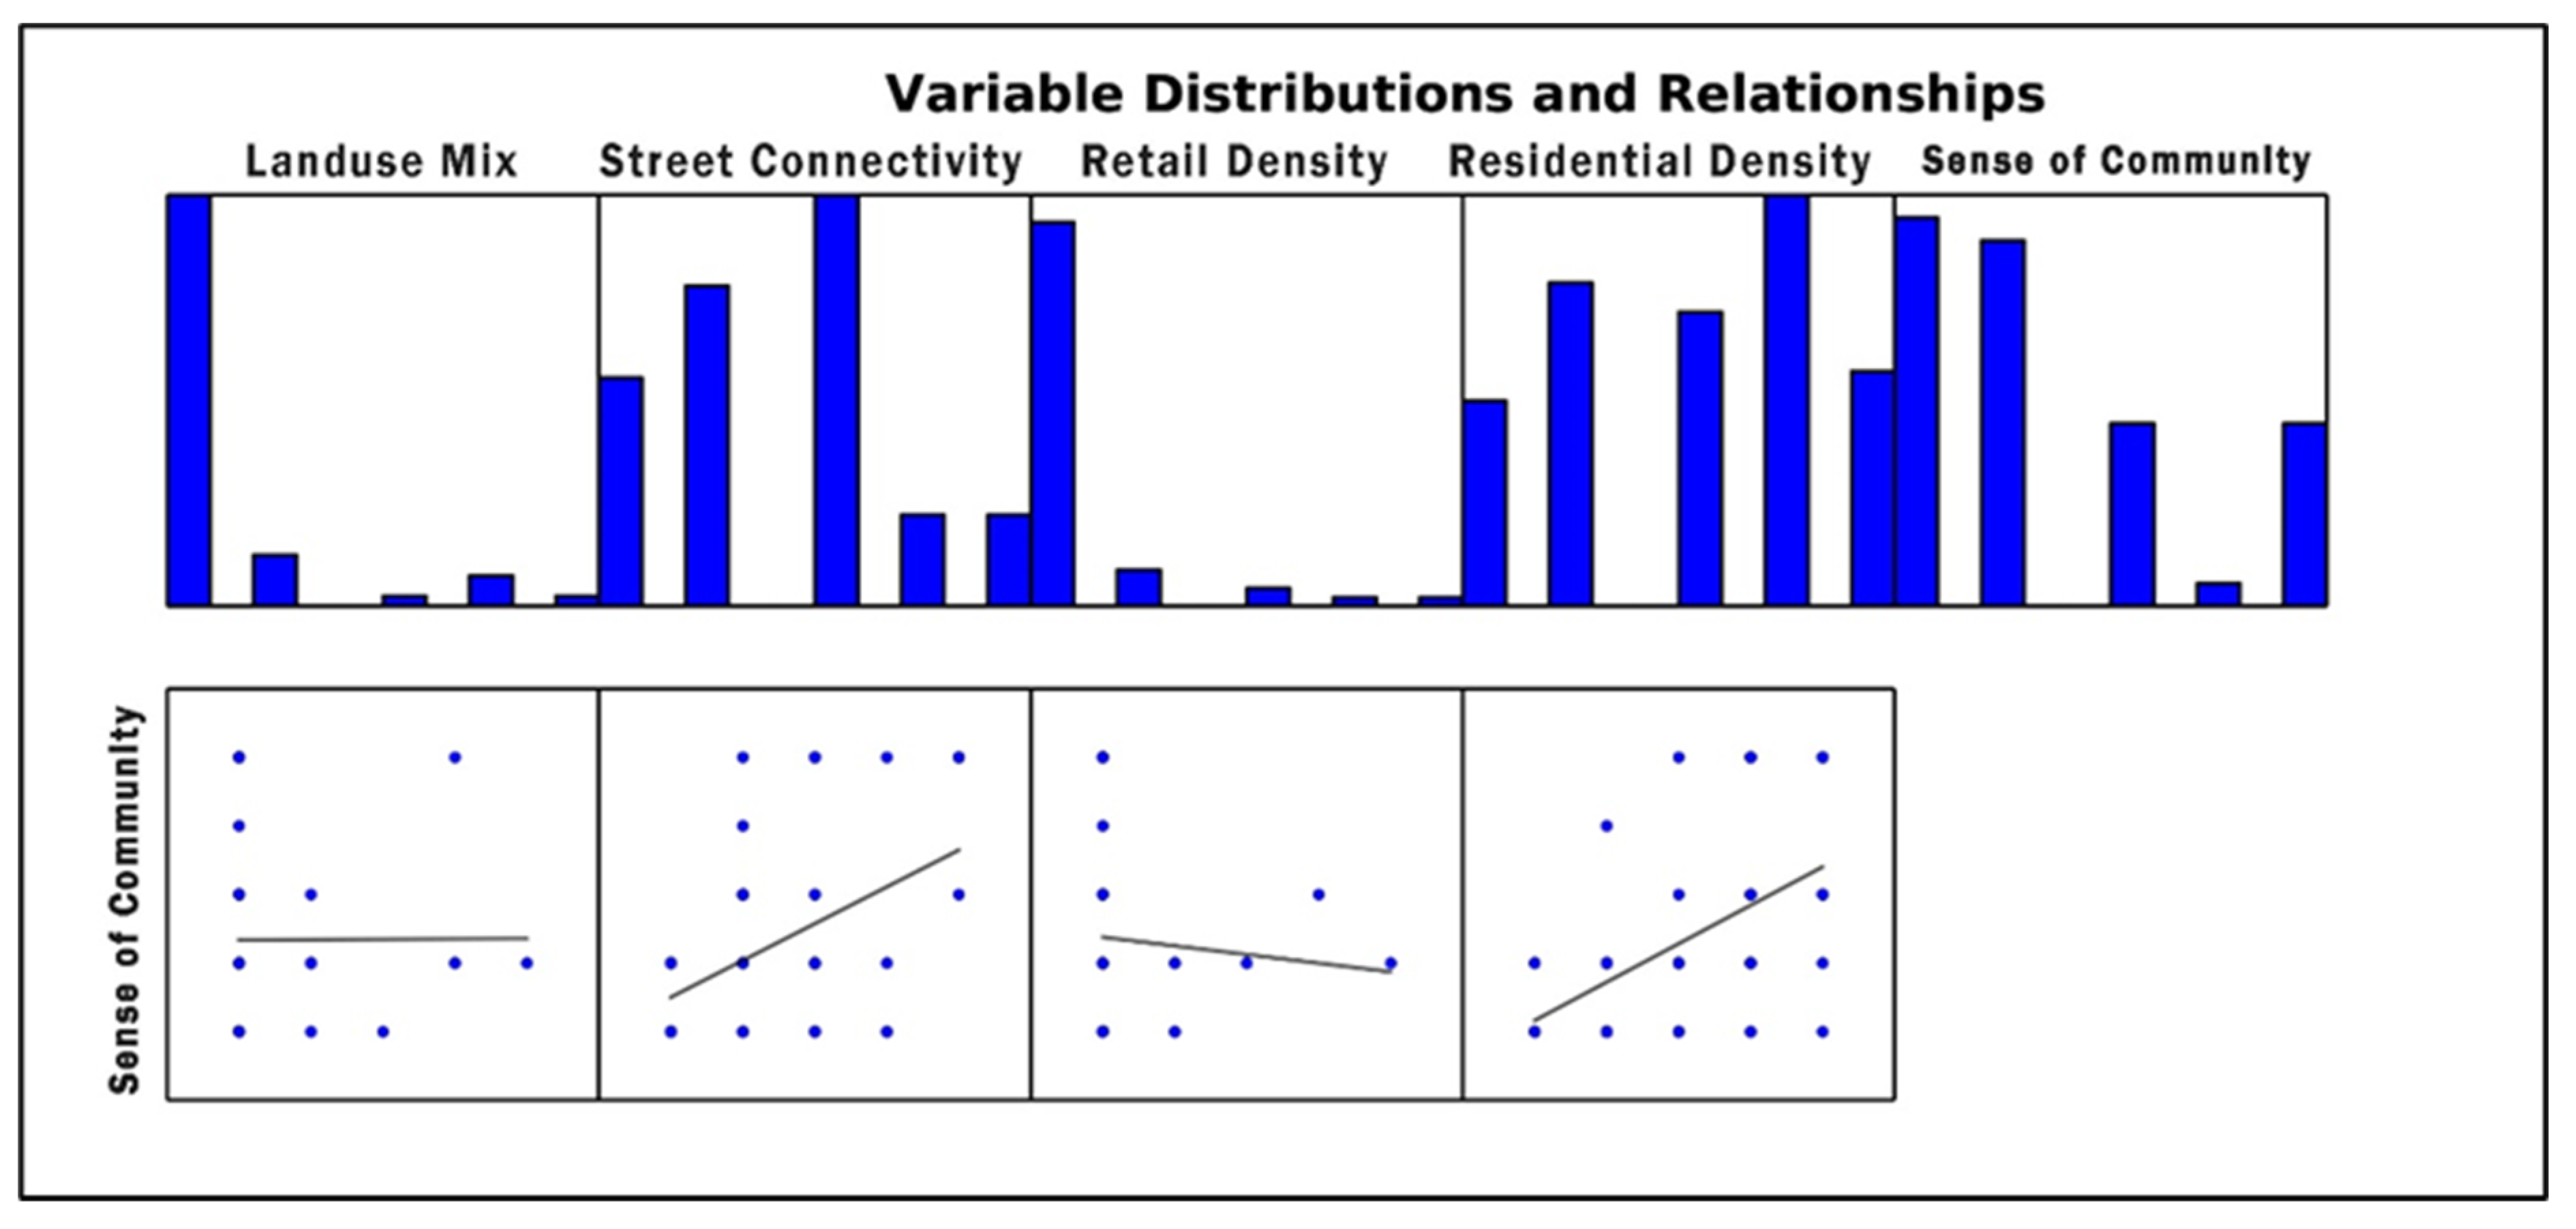
The investigation into the components of walkability revealed significant insights into how these features influence urban communal ties. While urban theories, such as those proposed by [60], have long emphasized the importance of land-use mix in fostering vibrant communities, the findings of this study suggest that objective land-use mix alone does not significantly enhance community cohesion. This indicates that mere proximity to services is insufficient for nurturing social bonds; instead, pedestrian accessibility—how easily residents can navigate and utilize these services—emerges as a critical factor in community building.
In contrast, street connectivity demonstrated strong correlations with social cohesion, aligning with [63] observations that grid-like street patterns facilitate spontaneous social interactions, which are essential for cultivating trust. This study underscores this relationship through the example of Deir Ghbar’s cul-de-sac-dominated areas, where limited connectivity corresponds to lower community cohesion. These findings reinforce the necessity of permeable street networks to promote interaction and accessibility. Notably, the strong link between street connectivity and social engagement aligns with Sustainable Development Goal (SDG) 11, advocating for urban designs that prioritize connectivity to build resilient, inclusive, and sustainable communities.
Retail density, however, exhibited a weaker correlation with community cohesion. While the presence of retail spaces is often assumed to enhance social outcomes, this study suggests that their mere availability is insufficient. Instead, qualitative factors such as the diversity of business ownership and the character of retail environments are likely to mediate their impact on communal ties. Despite its limited direct influence, retail density remains relevant to SDG 8, as diverse local businesses contribute to economic growth while indirectly fostering opportunities for community interaction.
Finally, residential density emerged as a significant positive predictor of community cohesion. Higher residential densities align with [60] concept of eyes on the street, where increased pedestrian activity and informal surveillance strengthen social bonds. This relationship supports SDG 11.3, emphasizing the role of inclusive urban planning in enhancing social sustainability. Together, these findings highlight the nuanced interplay between objective walkability features and their capacity to shape communal life, underscoring the need for integrated urban strategies that prioritize both physical design and social dynamics.

6.2. Theoretical and Practical Contributions

This research advances both theoretical and practical understandings of urban walkability through several key contributions. Contextually, this study innovates by situating walkability research within the socio-spatial dynamics of Amman, a city shaped by refugee inflows and socio-economic polarization. While Western-centric studies often overlook such complexities, this work demonstrates how urban stressors, including displacement, segregation, and economic disparities, directly influence walkability and community cohesion. By foregrounding Amman’s unique challenges, such as the interplay between refugee populations and urban infrastructure, this research enriches global discourse on SDG 10 (Reduced Inequalities), offering insights into how equitable urban planning can mitigate spatial inequalities in similar contexts.
Methodologically, this study bridges GIS spatial analysis with sociological surveys, establishing a robust interdisciplinary framework for examining socio-spatial phenomena. This integration not only validates existing theories but also reveals nuanced spatial patterns, such as discrepancies between perceived land-use diversity and objective measurements, which conventional methodologies often fail to capture. The mixed-method approach aligns with SDG 9 (Industry, Innovation, and Infrastructure) by advocating for innovative, data-driven planning practices that enhance urban sustainability and inclusivity.
This study further advances urban scholarship through three primary contributions. First, it integrates dual-method approaches to holistically explore how walkability interacts with socio-spatial dynamics, responding to calls for interdisciplinary research [64]. Second, it introduces GIS heatmaps as spatial policy tools, enabling targeted micro-level interventions—such as sidewalk improvements or public space upgrades—to enhance walkability and social equity. Third, it establishes a model for contextual relevance, particularly for cities grappling with conflict or socio-political instability, by demonstrating how Amman’s distinct challenges can inform adaptable urban strategies. Collectively, these contributions underscore the value of context-sensitive, interdisciplinary approaches in fostering resilient and inclusive urban environments.

6.3. Recommendations

This study provides actionable insights for urban planners in Amman to foster sustainable and inclusive development. A central recommendation is the enhancement of residential density through mixed-density zoning strategies, which can strengthen community ties while promoting socio-economic diversity. By integrating varied housing types and income groups, such approaches not only cultivate a stronger sense of community but also mitigate socio-economic divides, aligning with SDG 11 (Sustainable Cities and Communities).
Complementing this, this study underscores the need for pedestrian-friendly urban design. Prioritizing street connectivity within neighborhoods and reconfiguring streetscapes to favor social interaction over vehicular traffic can reduce car dependency and enhance communal engagement. These measures directly support SDG 11’s objectives by creating environments conducive to walkability and social cohesion. Furthermore, the application of GIS-enabled evaluations is advocated to develop spatially targeted interventions. By leveraging GIS tools, planners can gain data-driven insights into urban dynamics, enabling strategies that align with broader SDG targets. To operationalize these ideas, this study proposes pilot projects in neighborhoods such as Deir Ghbar, where innovative solutions for walkability and livability can be tested. These initiatives would serve as models for scalable, inclusive urban practices across Amman.
Addressing the declining sense of community requires explicit attention to the spatial drivers of social fragmentation. This study calls for a shift from rigid land zoning categories to flexible, integrated zonation that supports mixed-density development. Such policies foster inclusion and diversity, advancing SDG 10 (Reduced Inequalities). Concurrently, retrofitting streets to calm traffic and implementing pedestrian-first policies can redefine connectivity, enhancing opportunities for community interaction while advancing SDG 11.
Finally, community collaboration is critical. Engaging residents through participatory GIS ensures that planning strategies reflect diverse needs and priorities, including the development of smart green spaces, which have been demonstrated to improve life satisfaction and social cohesion in high-rise communities [46]. This approach democratizes urban decision-making, ensuring interventions are both contextually grounded and equitable. Collectively, these recommendations advocate a holistic, data-informed, and community-centered vision of urban planning in Amman.

6.4. Future Directions

The findings of this study highlight urgent policy reforms to address socio-economic polarization exacerbated by rigid zoning practices. As the Greater Amman Municipality (GAM) prepares its 2025 Master Plan, prioritizing mixed-density zoning and pedestrian-oriented urban designs will be critical to fostering equitable development. Key policy recommendations include implementing mixed-use development in West Amman, drawing inspiration from Bogotá’s connectivity-driven model to enhance spatial equity and accessibility. Additionally, adopting pedestrian-friendly retail design guidelines, such as mandating setbacks, narrow storefronts, and interactive façades, could significantly improve walkability and street-level engagement. For refugee-hosting cities like Amman, this study proposes a replicable framework that adapts Bogotá’s TransMilenio-inspired transit networks while emphasizing context-specific strategies, such as mixed-density retrofits to accommodate displaced populations without compromising urban cohesion.
The findings from this study have significant implications for urban planners working in contexts with high numbers of displaced populations, particularly refugees. Addressing issues of walkability and community cohesion is essential for promoting social integration and equitable access to urban resources. As indicated in the literature on spatial justice, urban planning must consider the specific needs of refugees, especially in ensuring their access to walkable environments that foster community ties, well-being, and resilience in the face of systemic inequities.
Looking ahead, future research should expand on these insights by examining the long-term impacts of urban policies on community cohesion and walkability. Three priority areas emerge: first, an intersectional analysis of how gender dynamics mediate relationships between walkability and sense of community; second, policy simulations to model the potential outcomes of mixed-use zoning reforms in West Amman; and third, comparative studies with Global South cities like Cairo and Beirut to explore divergent patterns of refugee urbanization and their implications for inclusive planning. Such research would strengthen the evidence base for transformative urban policies that enhance social capital and community well-being.
Additionally, in light of the findings and the insights derived from our study, we recognize the necessity of incorporating both age group distinctions and temporal contexts regarding walking behaviors in future research endeavors. While our current dataset provides a comprehensive overview of community cohesion and walking patterns, it lacks the granularity required to understand how different age demographics engage with pedestrian environments. Future studies will explicitly categorize walking purposes by age groups, allowing for an in-depth analysis of social connectivity across various segments of the population. Additionally, we aim to integrate temporal analyses to explore the specific times at which individuals engage in walking activities. This dual approach will enhance our understanding of community dynamics and interactions, providing valuable insights into how urban design can better cater to the needs of diverse age groups.
By bridging empirical findings with actionable strategies, this study serves as a pivotal reference for creating inclusive, resilient urban environments in Amman and other cities facing similar socio-economic and spatial challenges. Its recommendations underscore the need for adaptive, context-sensitive policies that align urban development with the realities of displacement, inequality, and evolving community needs.

Author Contributions

Conceptualization, M.A.-H. and S.A.-Z.; methodology, M.A.-H. and S.A.-Z.; data curation, M.A.-H. and S.A.-Z.; writing—original draft preparation, M.A.-H.; writing—review and editing, M.A.-H.; literature review, M.A.-H. and S.A.-Z.; visualization, S.A.-Z. All authors have read and agreed to the published version of the manuscript.

Funding

This research received no external funding.

Institutional Review Board Statement

This study was conducted in accordance with the Declaration of Helsinki and approved by the Institutional Review Board of German Jordanian University. Decision No. GS-F-26/2020, date 21 October 2020.

Informed Consent Statement

The studies involving humans were approved by the German Jordanian University Research Committee. The studies were conducted in accordance with the local legislation and institutional requirements. The participants provided their written informed consent to participate in this study. Informed consent was obtained from all participants involved in this study.

Data Availability Statement

The original contributions presented in this study are included in this article. Further inquiries can be directed to the corresponding author.

Acknowledgments

The authors would like to acknowledge the support of Prince Sultan University for paying the Article Processing Charges (APCs) of this publication. The authors would like to thank Prince Sultan University for their support.

Conflicts of Interest

No potential conflict of interest was reported by the authors.

References

  1. UNHCR. Syrian Refugee Population in Jordan. 2022. Available online: https://data.unhcr.org (accessed on 15 May 2023).
  2. Department of Statistics (DOS). Jordan Statistical Yearbook 2017; Department of Statistics (DOS): Amman, Jordan, 2017.
  3. United Nations Human Settlements Programme (UN-Habitat). National Urban Policy: Arab States Regional Report; United Nations Human Settlements Programme (UN-Habitat): Nairobi, Kenya, 2020. [Google Scholar]
  4. Alnsour, J.A. Managing Urban Growth in the City of Amman, Jordan. Cities 2016, 50, 93–99. [Google Scholar] [CrossRef]
  5. Bou Akar, H. Contesting Beirut’s Frontiers. City Soc. 2012, 24, 150–172. [Google Scholar] [CrossRef]
  6. Sims, D. Understanding Cairo: The Logic of a City out of Control; American University in Cairo Press: Cairo, Egypt, 2012. [Google Scholar]
  7. Potter, R.; Darmame, K.; Barham, N.; Nortcliff, S. Ever-Growing Amman, Jordan: Urban Expansion, Social Polarization and Contemporary Urban Planning Issues. Habitat Int. 2009, 33, 81–92. [Google Scholar] [CrossRef]
  8. Abu-Dayyeh, N. Persisting vision: Plans for a modern Arab capital, Amman, 1955–2002. Plan. Perspect. 2004, 19, 79–110. [Google Scholar] [CrossRef]
  9. Farhan, Y.; Al-Shawamreh, S. Impact of Rapid Urbanization and Changing Housing Patterns on Urban Open Public Spaces of Amman, Jordan: A GIS and RS Perspective. J. Environ. Prot. 2019, 10, 57–79. [Google Scholar] [CrossRef]
  10. Schwedler, J. Amman Cosmopolitan: Spaces and Practices of Aspiration and Consumption. Comp. Stud. South Asia Afr. Middle East 2010, 30, 547–562. [Google Scholar] [CrossRef]
  11. Khashman, M. Urban Mobility in Amman; Greater Amman Municipality: Amman, Jordan, 2015. [Google Scholar]
  12. World Bank Group. Jordan Public Transport Diagnostic and Recommendations, World Bank, February 2022. 2022. Available online: https://documents1.worldbank.org/curated/en/099825106052213281/pdf/P17389502814af03b0a85e0a27bbbbaa260.pdf (accessed on 15 February 2025).
  13. Majali, S.; Iman, R. Analysis of Pedestrian Accidents in Amman. Int. J. Civ. Eng. Technol. 2019, 10, 240–251. [Google Scholar]
  14. French, S.; Wood, L.; Foster, S.A.; Giles-Corti, B.; Frank, L.; Learnihan, V. Sense of Community and Its Association with the Neighborhood Built Environment. Environ. Behav. 2012, 46, 677–697. [Google Scholar] [CrossRef]
  15. Wilkerson, A.; Carlson, N.E.; Yen, I.H.; Michael, Y.L. Neighborhood Physical Features and Relationships with Neighbors: Does Positive Physical Environment Increase Neighborliness? Environ. Behav. 2012, 44, 595–615. [Google Scholar] [CrossRef]
  16. Chavis, D.M.; Wandersman, A. Sense of community in the urban environment: A catalyst for participation and community development. Am. J. Community Psychol. 1990, 18, 55–81. [Google Scholar] [CrossRef]
  17. Leyden, K.M. Social Capital and the Built Environment: The Importance of Walkable Neighborhoods. Am. J. Public Health 2003, 93, 1546–1551. [Google Scholar] [CrossRef] [PubMed]
  18. Alamoush, S.J.; Kertész, A. Accessibility as a factor for a livable cities: The case of Salt City in Jordan. Pollack Period. 2022, 17, 147–151. [Google Scholar] [CrossRef]
  19. Dalvi, M.Q. Behavioural modelling, accessibility, mobility and need: Concepts and measurement. In Behavioural Travel Modelling; Hensher, D.A., Stopher, P.R., Eds.; Routledge: London, UK, 1978; Volume 12, pp. 639–653. [Google Scholar]
  20. Geurs, K.T.; Van Wee, B. Accessibility Evaluation of Land-Use and Transport Strategies: Review and Research Directions. J. Transp. Geogr. 2004, 12, 127–140. [Google Scholar] [CrossRef]
  21. Tsai, E.I.A. Neighborhood Accessibility as a Measure for Defining Sustainable Urban Form and Assessment Tools. J. Habitat Eng. Des. 2014, 6, 119–136. [Google Scholar]
  22. Handy, S.; Clifton, K. Evaluating Neighborhood Accessibility: Possibilities and Practicalities. J. Transp. Stat. 2001, 4, 67. [Google Scholar]
  23. Krizek, K.J. Operationalizing Neighborhood Accessibility for Land Use-Travel Behavior Research and Regional Modeling. J. Plan. Educ. Res. 2003, 22, 270–287. [Google Scholar] [CrossRef]
  24. Gehl, J. Cities for People; Island Press: Washington, DC, USA, 2010. [Google Scholar]
  25. Cervero, R.; Sarmiento, O.L.; Jacoby, E.; Gomez, L.F.; Neiman, A. Influences of Built Environments on Walking and Cycling: Lessons from Bogotá. Int. J. Sustain. Transp. 2009, 3, 203–226. [Google Scholar] [CrossRef]
  26. Frank, L.D.; Devlin, A.; Johnstone, S.H.; Loon, J.V. Neighbourhood Design, Travel, and Health in Metro Vancouver: Executive Summary; UBC Active Transportation Collaboratory: Vancouver, BC, Canada, 2010. [Google Scholar]
  27. Hu, R.; Follini, C.; Pan, W.; Linner, T.; Bock, T. A Case Study on Regenerating Informal Settlements in Cairo using Affordable and Adaptable Building System. Procedia Eng. 2017, 196, 113–120. [Google Scholar] [CrossRef]
  28. Içduygu, A.; Osseiran, S. Syrian Refugees in Istanbul and Gaziantep: Comparative Findings on Settlement, Livelihood and Support; CMI Insight 2022:01; Chr. Michelsen Institute: Bergen, Norway, 2022. [Google Scholar]
  29. Medrano, L.; Spinelli, J. Urban policies and projects for social housing in central areas. The case of the Habitasampa competition (São Paulo, Brazil). Habitat Int. 2014, 42, 39–47. [Google Scholar] [CrossRef]
  30. Zhu, X.; Lu, Z.; Yu, C.Y.; Lee, C.; Mann, G. Walkable communities: Impacts on residents’ physical and social health: Researchers from Texas A&M University studied residents in a newly developed ‘walkable community’ in Austin, Texas to see how it changed their habits for physical activity and whether it increased social interaction and cohesion in the community. World Health Des. 2013, 6, 68–75. [Google Scholar] [PubMed] [PubMed Central]
  31. Forsyth, A. What Is a Walkable Place? The Walkability Debate in Urban Design. Urban Des. Int. 2015, 20, 274–292. [Google Scholar] [CrossRef]
  32. Spoon, S.A. What Defines Walkability: Walking Behavior Correlates. Master’s Thesis, University of North Carolina, Chapel Hill, NC, USA, 2005. [Google Scholar]
  33. Leslie, E.; Coffee, N.; Frank, L.; Owen, N.; Bauman, A.; Hugo, G. Walkability of local communities: Using geographic information systems to objectively assess relevant environmental attributes. Health Place 2007, 13, 111–122. [Google Scholar] [CrossRef]
  34. Gebel, K.; Bauman, A.; Owen, N. Correlates of non-concordance between perceived and objective measures of walkability. Ann. Behav. Med. 2009, 37, 228–238. [Google Scholar] [CrossRef] [PubMed]
  35. Davies, W.; Townshend, I. New Urbanisms: From Neo-Traditional Neighbourhoods to New Regionalism. In Theme Cities: Solutions for Urban Problems; Davies, W., Ed.; GeoJournal Library; Springer: Dordrecht, The Netherlands, 2015; p. 112. [Google Scholar] [CrossRef]
  36. Dygryn, M.; Mitáš, J.; Stelzer, J. The influence of built environment on walkability using geographic information system. J. Hum. Kinet. 2010, 24, 93–99. [Google Scholar] [CrossRef]
  37. Brownson, R.C.; Hoehner, C.M.; Day, K.; Forsyth, A.; Sallis, J.F. Measuring the built environment for physical activity: State of the science. Am. J. Prev. Med. 2009, 36 (Suppl. S4), S99–S123.e12. [Google Scholar] [CrossRef] [PubMed]
  38. Vich, G.; Marquet, O.; Miralles-Guasch, C. Green streetscape and walking: Exploring active mobility patterns in dense and compact cities. J. Transp. Health 2019, 12, 50–59. [Google Scholar] [CrossRef]
  39. Lo, R.H. Walkability: What is it? J. Urban. Int. Res. Placemaking Urban Sustain. 2009, 2, 145–166. [Google Scholar] [CrossRef]
  40. Dalmat, R.R.; Mooney, S.J.; Hurvitz, P.M.; Zhou, C.; Moudon, A.V.; Saelens, B.E. Walkability measures to predict the likelihood of walking in a place: A classification and regression tree analysis. Health Place 2021, 72, 102700. [Google Scholar] [CrossRef] [PubMed] [PubMed Central]
  41. Manaugh, K.; El-Geneidy, A.M. Validating Walkability Indices? How Do Different Households Respond to the Walkability of Their Neighbourhood? Transp. Res. Part D Transp. Environ. 2011, 16, 309–315. [Google Scholar] [CrossRef]
  42. Farahani, L.M.; Lozanovska, M. A Framework for Exploring the Sense of Community and Social Life in Residential Environments. Archnet-IJAR Int. J. Archit. Res. 2014, 8, 223–237. [Google Scholar] [CrossRef]
  43. Ngwenya, N. Permanency: Situating Formalization of Informal Settlements in the City of Tshwane, South Africa. Geography. Ph.D. Thesis, Université Grenoble Alpes, Grenoble, France, University of Pretoria, Pretoria, South Africa, 2021. Available online: https://theses.hal.science/tel-03593891/file/NGWENYA_2021_archivage.pdf (accessed on 15 May 2022).
  44. United Nations Human Settlements Programme (UN-Habitat). Amman Spatial Profile: Urban Planning & Infrastructure in Migration Contexts. 2020. Available online: https://unhabitat.org/sites/default/files/2022/04/220411-final_amman_profile.pdf (accessed on 15 February 2021).
  45. Promsopha, G.; Tucci, I. Evidence as a Specific Knowledge to Inform Humanitarian Decision-Making in Migration Crisis Contexts: The Case of Syrian Refugees in Jordan. Int. Migr. Rev. 2024, 58, 442–471. [Google Scholar] [CrossRef]
  46. Li, Y.; Wu, Y.; Luo, Y.; Fu, Z.; Zhang, S. The Influence of Smart Green Spaces on Environmental Awareness, Social Cohesion, and Life Satisfaction in High-Rise Residential Communities. Buildings 2024, 14, 2917. [Google Scholar] [CrossRef]
  47. McMillan, D.; Chavis, D. Sense of Community: A Definition and Theory. J. Community Psychol. 1986, 14, 6–23. [Google Scholar] [CrossRef]
  48. Farahani, L.M. The Value of the Sense of Community and Neighbouring. Hous. Theory Soc. 2016, 33, 357–376. [Google Scholar] [CrossRef]
  49. Pretty, G.; Bishop, B.; Fisher, A.; Sonn, C. Psychological sense of community and its relevance to well-being and everyday life in Australia. Aust. Community Psychol. 2007, 19, 6–25. [Google Scholar]
  50. Talò, C.; Mannarini, T.; Rochira, A. Sense of Community and Community Participation: A Meta-Analytic Review. Soc. Indic. Res. 2014, 117, 1–28. [Google Scholar] [CrossRef]
  51. Creswell, J.W.; Clark, V.L.P. Designing and Conducting Mixed Methods Research; Sage Publications: Thousand Oaks, CA, USA, 2017. [Google Scholar]
  52. Department of Statistics (DOS). Jordan Statistical Yearbook 2015; Department of Statistics (DOS): Amman, Jordan, 2015.
  53. Department of Statistics (DOS). Jordan Statistical Yearbook 2019; Department of Statistics (DOS): Amman, Jordan, 2019.
  54. Lohr, S.L. Sampling: Design and Analysis; Chapman & Hall: London, UK, 2021. [Google Scholar]
  55. Krejcie, R.V.; Morgan, D.W. Determining Sample Size for Research Activities. Educ. Psychol. Meas. 1970, 30, 607–610. [Google Scholar] [CrossRef]
  56. IOGP Geomatics Committee. EPSG Geodetic Parameter Registry–EPSG:32636, WGS 84/UTM zone 36N. 2020. Available online: https://epsg.io/32636 (accessed on 15 May 2021).
  57. Jun, H.J.; Hur, M. The relationship between walkability and neighborhood social environment: The importance of physical and perceived walkability. Appl. Geogr. 2015, 62, 115–124. [Google Scholar] [CrossRef]
  58. Wood, L.; Frank, L.D.; Giles-Corti, B. Sense of Community and Its Relationship with Walking and Neighborhood Design. Soc. Sci. Med. 2010, 70, 1381–1390. [Google Scholar] [CrossRef]
  59. Koenker, R.; Bassett, G.J. Regressions Quantiles. Econom. J. Econom. Soc. 1978, 46, 33–50. [Google Scholar] [CrossRef]
  60. Jacobs, J. The Death and Life of Great American Cities; Random House: New York, NY, USA, 1961. [Google Scholar]
  61. Frank, L.D.; Schmid, T.L.; Sallis, J.F.; Chapman, J.; Saelens, B.E. Linking objectively measured physical activity with walkability. Am. J. Prev. Med. 2005, 28, 117–125. [Google Scholar] [CrossRef] [PubMed]
  62. Randolph, B.; Tice, A. Suburbanizing disadvantage in Australian cities: Sociospatial change in an era of neoliberalism. J. Urban Aff. 2014, 36, 384–399. [Google Scholar] [CrossRef]
  63. Mehta, V. The Street: A Quintessential Social Public Space, 1st ed.; Routledge: London, UK, 2013. [Google Scholar] [CrossRef]
  64. Southworth, M. Designing the Walkable City. J. Urban Plan. Dev. 2005, 131, 246–257. [Google Scholar] [CrossRef]
Figure 1. The conceptual framework of this study. Source: Researchers.
Buildings 15 01999 g001
Figure 2. Official division of Deir Ghbar blocks. Source: Modified by researchers using [53].
Buildings 15 01999 g002
Figure 3. Deir Ghbar buildings and blocks. Source: Researchers.
Buildings 15 01999 g003
Figure 4. Housing typology in Deir Ghbar. Source: Researchers.
Buildings 15 01999 g004
Figure 5. Sidewalk characteristics: (a) observed sidewalk themes; (b) observed sidewalk obstacles (note: sidewalk width: 1.5 m). Source: Researchers.
Buildings 15 01999 g005
Figure 6. Sidewalk attributes: (a) observed sidewalk width; (b) location of sloped streets (note: sidewalk width: 1.5 m). Source: Researchers.
Buildings 15 01999 g006
Figure 7. Sidewalk furniture (note: sidewalk width: 1.5 m). Source: Researchers.
Buildings 15 01999 g007
Figure 8. Deir Ghbar CDBs and household counts. Source: Researchers.
Buildings 15 01999 g008
Figure 9. Integrated workflow for GIS-survey analysis, showing inputs (land-use layers and surveys), methods (spatial regression), and outputs (hotspot maps). Source: Researchers.
Buildings 15 01999 g009
Figure 10. Street centerline with the intersection points. Source: Researchers.
Buildings 15 01999 g010
Figure 11. The spatial location of the building’s polygons layer with the CDB. Source: Researchers.
Buildings 15 01999 g011
Figure 12. Spatial location of buildings and CDB. Source: Researchers.
Buildings 15 01999 g012
Figure 13. Objective walkability component distribution (note: dots represent neighborhood values; the trend line shows the linear regression fit (R2 = X). Source: Researchers.
Buildings 15 01999 g013
Figure 14. Residential density hotspot map. Source: Researchers.
Buildings 15 01999 g014
Figure 15. Histogram of standard residuals from objective walkability component analysis. The blue line represents the expected normal distribution curve for reference. Source: Researchers.
Buildings 15 01999 g015
Table 1. Walkability framework and sense of community theory.
Walkability ComponentsSense of Community Dimensions
Residential Density; Feeling at Home: Membership (Belonging);
Street Connectivity; Neighborhood Cohesion: Influence (Collective Efficacy);
Land-Use Mix; Retail DensityRelationships with Neighbors: Shared Connection (Integration (Shared Needs) + Emotional Connection (Shared Spaces))
Table 2. Operational definition for objective walkability.
VariableOperational DefinitionMeasurement Scale
Land-Use MixThe heterogeneity of land uses, calculated as non-residential area/CDB area (acres)Proportion (0–1, GIS-derived)
Street ConnectivityThe density of street intersections per CDB area (acres). Measured by the number of street intersections per CDB area (acres)Count (GIS)
Retail DensityThe ratio of retail parcels to CDB area (acres) (Retail parcels/CDB area (acres))Proportion (0–1, GIS-derived)
Residential DensityThe number of households in each CDB divided by the area of the CDB (acres)Count (GIS)
Table 3. Definition of demographic/socio-economic variables.
VariableDefinitionMeasurement Scale
AgeAge groupsOrdinal (1–5)
GenderGender identificationNominal (1 = Male, 2 = Female)
NationalityJordanian vs. non-JordanianNominal (1 = Jordanian, 2 = Other)
Length of ResidencyYears residing in the neighborhoodOrdinal (1–4)
Home OwnershipOwnership statusNominal (1 = Owned, 2 = Rented)
Employment StatusWork statusNominal (1 = Working, 2 = Retired, 3 = Not working)
Income SourceSource of incomeOrdinal (1–3)
Purpose of WalkingReason for walking (transport or recreation)Nominal (1 = Transport, 2 = Recreation, 3 = Both)
Table 4. Demographic characteristics of respondents.
Demographic FactorAge GroupFrequencyPercentage
Age<20 Years41.3%
20–<30 Years4614.9%
30–<40 Years7223.3%
40–<50 Years9129.4%
>50 Years9631.0%
Total309100.0%
GenderMale8828.5%
Female22171.5%
Total309100.0%
NationalityJordanian23074.4%
Non-Jordanian7925.6%
Total309100.0%
Employment StatusWorking17255.7%
Retired206.5%
Not Working11737.9%
Total309100.0%
Length of Residency<5 Years5216.8%
5–<10 Years14045.3%
10–<20 Years9330.1%
>20 Years247.8%
Total309100.0%
Home OwnershipOwned22572.8%
Rented8427.2%
Total309100.0%
Income SourcePublic Sector9229.8%
Private Sector18860.8%
None299.4%
Total309100.0%
Purpose of WalkingTransport9229.8%
Recreation14045.3%
Both7724.9%
Total309100.0%
Table 5. Statistical distribution of sense of community components.
Sense of CommunityMeanSDRangeSkewnessVariance
Feeling at home 2.521.4440.582.08
Neighborhood cohesion 2.681.4740.412.16
Relationship with neighbors2.291.4140.791.99
Total sense of community2.491.3240.651.75
Table 6. Correlation of sense of community with objective walkability.
VariableFeeling at HomeNeighborhood CohesionRelationship with NeighborsTotal Sense of Community
Land-Use Mix−0.055−0.060−0.052−0.055
Street Connectivity0.458 **0.443 **0.421 **0.484 **
Retail Density−0.071−0.097−0.083−0.085
Residential Density0.480 **0.549 **0.518 **0.540 **
Note. ** p < 0.01. Correlations witht asterisks are non-significant (p > 0.05).
Table 7. Multivariate test—sense of community by objective walkability.
ComponentSum of SquaresdfMean SquareFSig.
Land-Use Mix0.036130.0031.4930.119
Street Connectivity255.1631319.6288.4730.000
Retail Density0.090130.0071.8570.035
Residential Density8785.10913675.77811.4630.000
Table 8. Hierarchical regression of socio-economic controls on sense of community.
Control VariableβSEp-Value95% CIInterpretation
Age0.110.050.078[−0.01, 0.23]Non-significant trend
Gender (Female)0.080.120.241[−0.15, 0.31]No significant effect
Nationality (Non-Jordanian)−0.150.100.032 *[−0.29, −0.01]Significant negative effect
Length of Residency0.290.070.002 **[0.15, 0.43]Strong positive effect
Home Ownership0.210.090.011 *[0.03, 0.39]Significant positive effect
Employment Status:
Retired0.120.140.198[−0.15, 0.39]Non-significant
Economically Inactive−0.180.080.026 *[−0.34, −0.02]Significant negative effect
Income Source:
Public Sector0.070.110.265[−0.14, 0.28]Non-significant
No Income−0.220.160.087[−0.53, 0.09]Marginal negative trend
Purpose of Walking:
Recreation0.130.060.023 *[0.02, 0.24]Significant positive effect
Both Purposes0.090.100.182[−0.11, 0.29]Non-significant
Notes: * p < 0.05, ** p < 0.01. Reference categories: male, Jordanian, working, private sector, transport. Economically inactive includes students/homemakers.
Table 9. Spatial regression results showing relationships between walkability components and sense of community.
Variableβ Coefficientp-ValueInterpretation
Residential Density0.43<0.01Strong positive
Street Connectivity0.260.25Moderate positive
Retail Density0.0020.99No significant link
Land-Use Mix0.0010.119No significant link
Table 10. Final regression estimates for walkability components.
PredictorB (SE)βp95% CIVIF
Intercept1.24 (0.31)-0.001[0.63, 1.85]-
Residential Density0.43 (0.12)0.39<0.001[0.20, 0.66]1.8
Street Connectivity0.26 (0.11)0.220.025[0.03, 0.49]2.1
Retail Density0.002 (0.08)0.0020.980[−0.15, 0.15]1.4
Land-Use Mix0.001 (0.05)0.0010.119[−0.08, 0.09]1.6
Disclaimer/Publisher’s Note: The statements, opinions and data contained in all publications are solely those of the individual author(s) and contributor(s) and not of MDPI and/or the editor(s). MDPI and/or the editor(s) disclaim responsibility for any injury to people or property resulting from any ideas, methods, instructions or products referred to in the content.

