Article

Lateral Deformation Mechanisms of Piles in Coastal Regions Under Seawall Surcharge Loading and Mitigation Using Deep Cement Mixing (DCM) Piles

1
CCCC Highway Consultants Co., Ltd., Beijing 100010, China
2
School of Civil Engineering, Southeast University, Nanjing 211189, China
3
Advanced Ocean Institute of Southeast University, Southeast University, Nantong 226010, China
*
Authors to whom correspondence should be addressed.
Buildings 2025, 15(11), 1936; https://doi.org/10.3390/buildings15111936
Submission received: 11 May 2025 / Revised: 29 May 2025 / Accepted: 2 June 2025 / Published: 3 June 2025
(This article belongs to the Section Building Structures)

Abstract

:
In coastal regions with thick, soft soil deposits, bridge pile foundations are susceptible to lateral displacements induced by the construction of adjacent seawalls. This study employs a three-dimensional nonlinear finite element framework to investigate the lateral deformation mechanisms of rock-socketed bridge piles under seawall surcharge loading in soft soils, considering the effects of both immediate construction and long-term consolidation. A parametric analysis is performed to evaluate the effectiveness of deep cement mixing (DCM) piles in mitigating pile displacements, focusing on key design parameters, including DCM pile length, area replacement ratio, and elastic modulus. The results reveal that horizontal pile displacements peak at the pile head post-construction (25 days: 25 mm) and progressively decrease during consolidation, shifting the critical displacement zone to mid-pile depths (20 years: 12 mm). Bending moment analysis identifies persistent positive moments at the rock-socketed interface. Increasing pile stiffness marginally reduces displacements (a < 1 mm reduction for a 22% diameter increase), while expanding the seawall–pile distance to 110 m decreases displacements by 72–84%. DCM pile implementation significantly mitigates short-term (48% reduction) and long-term (54% reduction) displacements, with optimal thresholds at a 30% area replacement ratio and a 40.5 MPa elastic modulus. This study provides critical insights into time-dependent soil–pile interaction mechanisms and practical guidelines for optimizing coastal infrastructure design to minimize surcharge-induced impacts on adjacent pile foundations.

1. Introduction

In coastal regions, the prevalence of thick, soft soil layers necessitates the adoption of pile foundations for transportation infrastructure—such as cross-sea bridges—in order to penetrate these weak strata. However, the construction of embankments or seawalls near bridges in coastal areas inevitably induces horizontal and vertical soil movements, which propagate to adjacent bridge pile foundations [1]. In particular, lateral soil displacements may cause significant horizontal deformations or even structural failures in piles [2,3]. Piles subjected to passive loading induced by soil movements are termed passive piles [4].
The impact of surcharge-induced additional loads on pile foundations has progressively drawn the attention of researchers [5], especially regarding seawall construction and soil surcharging near pile foundations in soft soil regions [1,6,7]. Coastal soft soils are characterized by high rheological behavior, substantial compressibility, low strength, and weak permeability, and exhibit time-dependent consolidation behavior under surcharge loading [8,9]. This results in amplified lateral deformations in passive piles in such geotechnical environments [10]. Existing research methodologies encompass field tests, model experiments, centrifuge testing, and finite element analysis. Chen et al. [1] conducted field tests on bored, cast-in situ piles in Zhejiang coastal soft soils, revealing the significant influence of soil parameters on pile deformation. Li et al. [7] performed field investigations on deep soft soil foundations, demonstrating the critical role of surcharge distance in governing adjacent pile deformations. Pan et al. [11] conducted laboratory model tests on passive piles in soft clay and identified substantial ultimate earth pressure acting on piles. Bian et al. [12] carried out the centrifuge modeling of saturated muddy soil, the results of which highlighted pronounced soil–pile interactions under surcharge loading. Given the limitations of physical testing in replicating complex field conditions and the prohibitive costs/time associated with long-term experiments [13], finite element analysis has emerged as a prevalent and reliable research tool [1,8,14,15,16]. Collectively, these studies confirm that passive piles in soft soils endure considerable lateral loading, leading to critical horizontal deformations. These findings underscore that without ground improvement measures, substantial settlements and deformations in coastal embankments/seawalls will induce detrimental lateral displacements in adjacent pile foundations.
The methods currently used to reduce horizontal displacement in pile foundations mainly include increasing pile stiffness, installing isolation piles, and enhancing soft soil strength through ground improvement techniques [1,17,18]. Consequently, ground improvement techniques are essential to mitigate the high compressibility and low bearing capacity of coastal soft soils, thereby reducing surcharge-induced lateral pile deformations [1]. Deep cement mixing (DCM) piles have been extensively employed for soft soil stabilization beneath embankments and seawalls [19,20]. As an in situ soil stabilization technique, DCM enhances soil mechanical properties through cement–soil mixing [21,22]. Existing research has predominantly focused on DCM pile’s load transfer mechanisms, differential settlement between piles and soil, and settlement reduction performance [23,24,25,26]. Parametric studies have investigated the influences of area replacement ratio, pile spacing, and strength characteristics on consolidation behavior [19,27,28,29]. Nevertheless, limited attention has been paid to how DCM piles support embankments and how seawalls affect adjacent pile foundations under surcharge loading.
This study employs a three-dimensional nonlinear finite element framework to systematically investigate temporal effects in lateral pile deformation mechanisms induced by seawall construction within coastal soft soil environments, encompassing both immediate response and time-dependent consolidation phases. Furthermore, a parametric analysis is performed to evaluate the effectiveness of DCM piles in mitigating adjacent pile displacements, considering critical design parameters including pile length, area replacement ratio, and elastic modulus. The findings aim to provide practical guidance for optimizing coastal infrastructure construction near pile-supported structures. This is expected to enable the implementation of more economical and environmentally friendly approaches for seawall construction while satisfying protection requirements for cross-sea bridges. Furthermore, the proposed methodology effectively minimizes construction-affected zones, thereby contributing to achieving the sustainable development goals.

2. Site and Structural Details

The bridge under investigation is a sea-crossing structure located in the coastal region of Zhejiang Province, China, situated within a marine sedimentary plain environment. The bridge system comprises two parallel spans (with the left span illustrated in the upper section of Figure 1), where the pier numbering follows a right-to-left sequence from Pier ① to Pier ⑤. A new seawall is planned to be constructed on the landward side (right side of Pier ①), with the toe of the seawall slope positioned 50 m from the axial alignment of Pier ①. Figure 1 presents a schematic plan view illustrating the spatial relationship between the bridge structure and the proposed seawall. For precise spatial identification, the piles are systematically numbered from P1 to P6 in a counterclockwise sequence, commencing at the upper-right quadrant of the pile group, as illustrated in Figure 1.

2.1. Geological Conditions

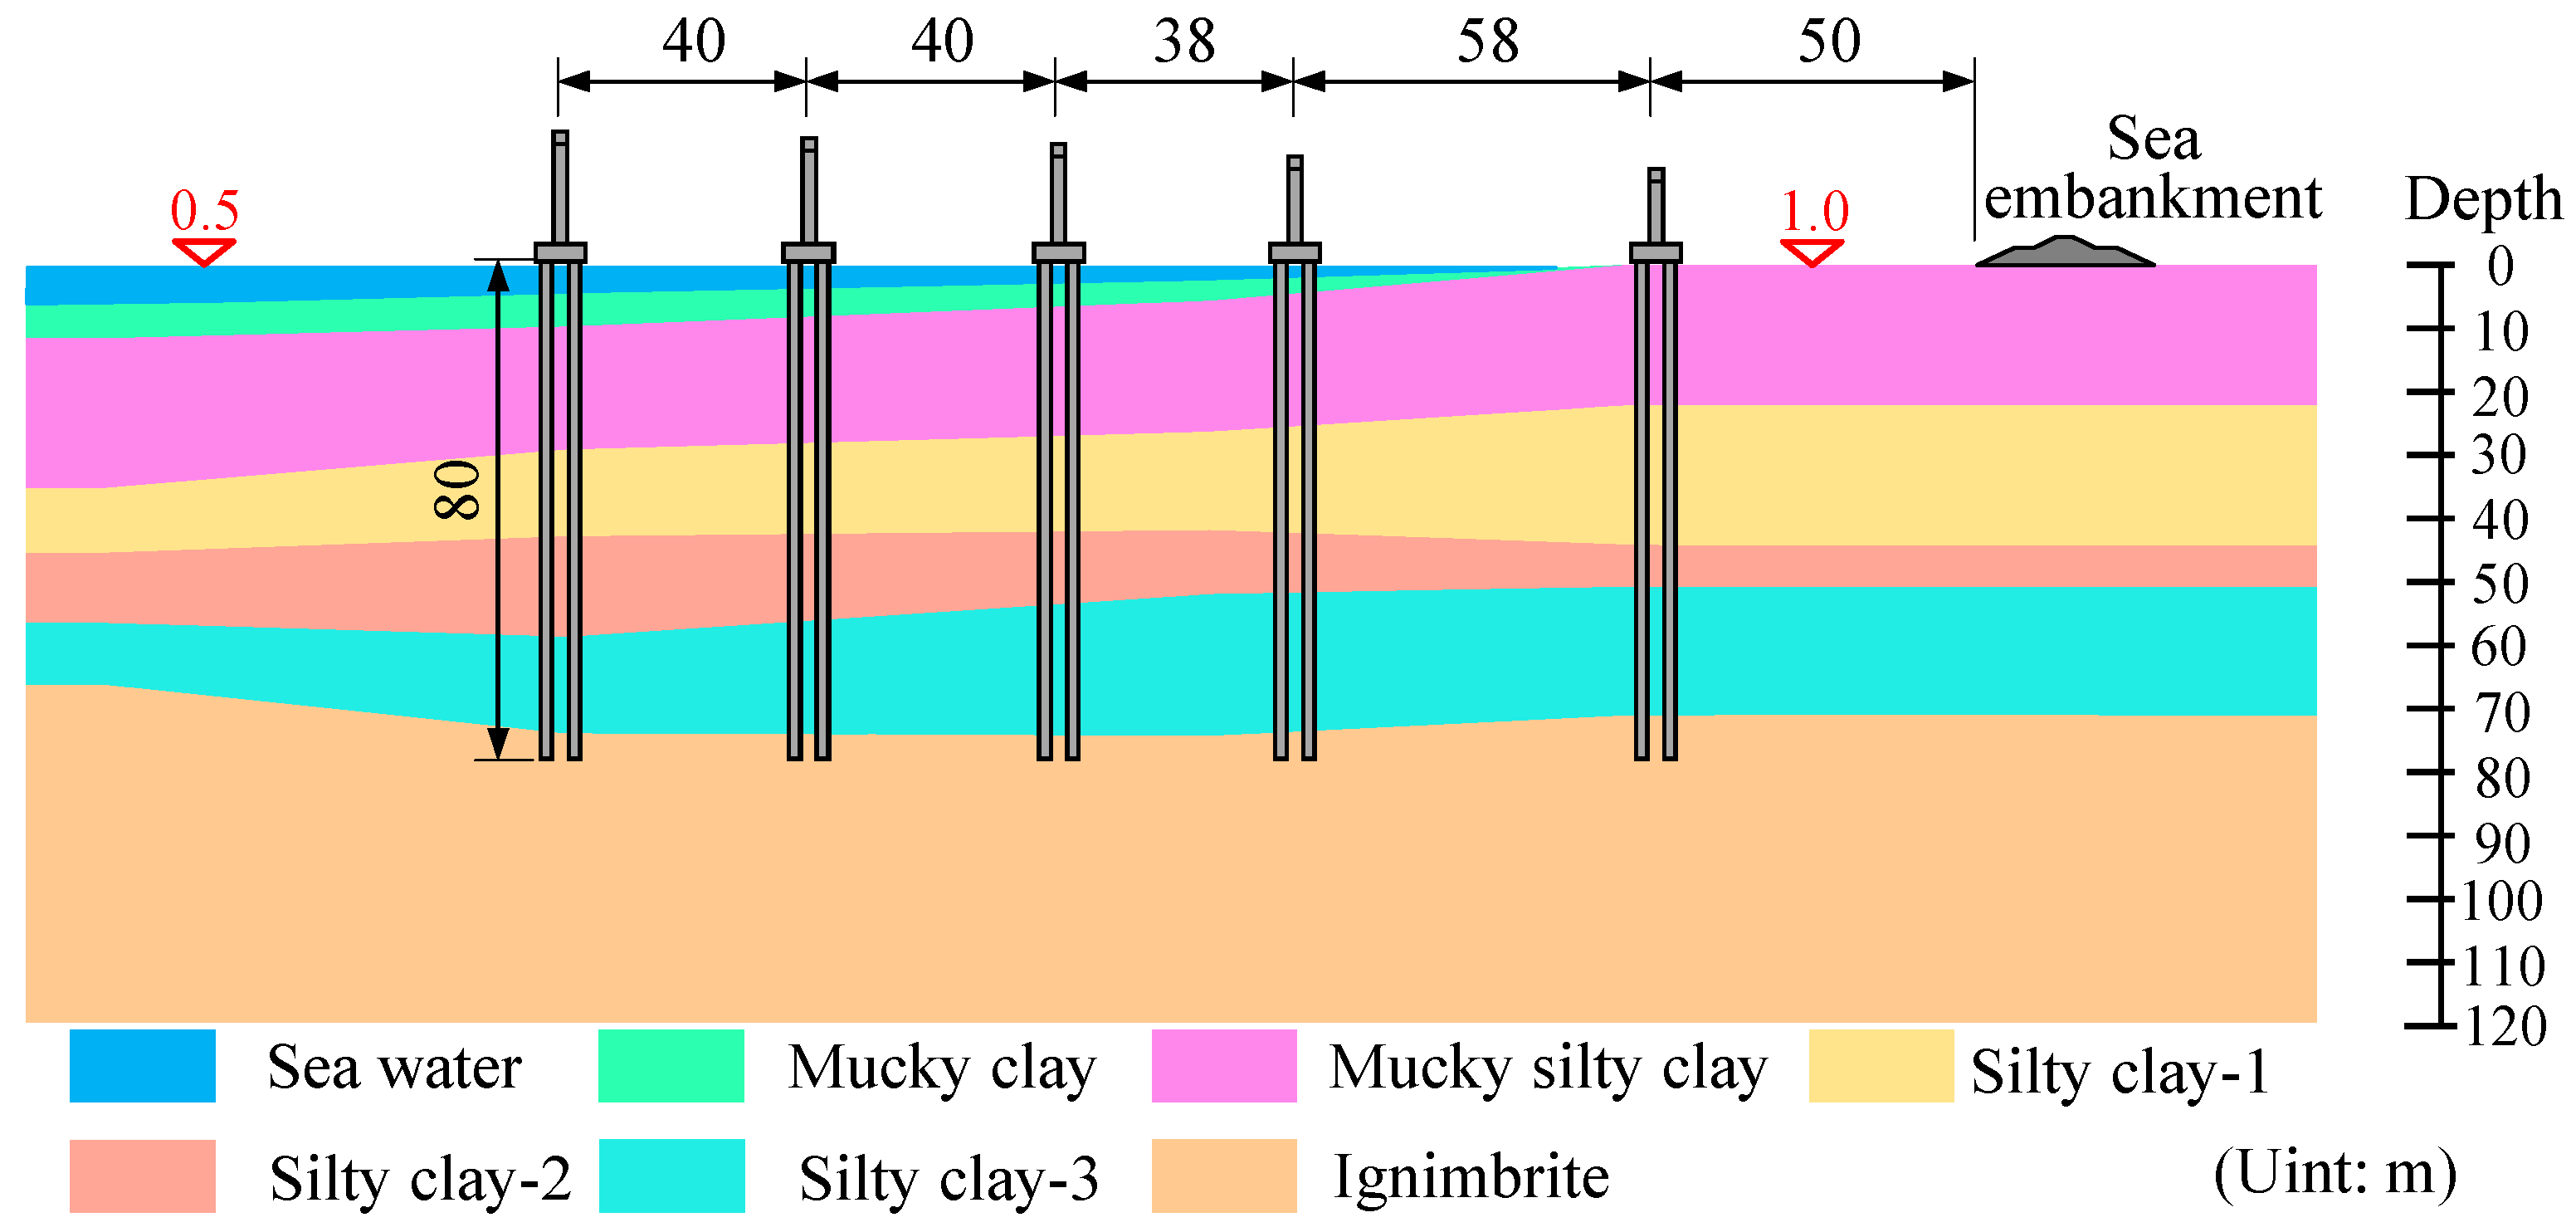
A geological cross-section of the bridge is presented in Figure 2. The stratigraphic profile reveals superficial strata consisting of mucky clay and mucky silty clay, classified as soft soils, underlain by three distinct layers of silty clay and ignimbrite. The geotechnical parameters characterizing each soil stratum are systematically documented in Table 1. The mean sea level elevation is recorded at approximately 0.5 m, with the groundwater table exhibiting concordance with the sea level elevation.

2.2. Bridge and Seawall Configuration

The bridge foundation system employs a pile group configuration with a cap thickness of 2.8 m. Each pile group consists of six bored cast-in situ piles, each measuring 80 m in length and 1.8 m in diameter, designed as rock-socketed piles terminating within the ignimbrite stratum. All piles utilize C35-grade concrete with characteristic compressive strength compliance. For precise spatial identification, the piles are systematically numbered from P1 to P6 in a counterclockwise sequence, commencing at the upper-right quadrant of the pile group, as illustrated in Figure 3.
The seawall cross-section comprises two composite trapezoidal structures with a total vertical elevation of 5 m. The lower trapezoidal section features a base width of 28 m, a crest width of 16 m, and a vertical dimension of 3 m. The superimposed upper trapezoidal section presents a base width of 16 m (corresponding to the crest of the lower section), a crest width of 4 m, and a vertical dimension of 2 m.

3. Numerical Modeling Framework

3.1. Soil Parameters

Selecting appropriate constitutive models and soil parameters constitutes a critical aspect of numerical analysis. The Hardening Soil (HS) constitutive model is an advanced elastoplastic formulation that effectively captures plastic volumetric deformation under compressive loading, accurately simulating the hardening behavior of soft clays [30]. This model demonstrates suitability for simulating the deformation characteristics of soft soils under embankment loading conditions, with prior studies in soft clay regions validating its predictive accuracy through comparative analyses [15,31,32,33]. In the present investigation, the HS model is employed to characterize the deformation and strength properties of mucky clay, mucky silty clay, and silty clay during both embankment construction and consolidation phases.
The HS model incorporates nine principal parameters, where the unloading/reloading Poisson’s ratio (ν) and reference stress ( p ref ) are conventionally assigned default values of 0.2 and 100 kPa, respectively. The power exponent (m), governing stress-dependent stiffness, requires calibration based on soil consistency; in particular, softer soils typically exhibit higher m values, reflecting their greater stress sensitivity. The reference stiffness modulus ( E 50 ref ) can be derived from the compression modulus (Es) through Equation (1), while systematic relationships exist between E 50 ref , E oed ref , and E ur ref , as defined in Equation (2) [34,35].
E 50 ref = E s
E 50 ref : E oed ref : E ur ref = 1 : 1 : 5
Ignimbrite strata exhibit elastoplastic behavior, conforming to the Mohr–Coulomb failure criterion, so the Mohr–Coulomb model is implemented for simulation purposes, implemented in strict accordance with the numerical modeling guidelines outlined in the Plaxis manual [34]. The constitutive parameters employed in finite element analysis are comprehensively detailed in Table 2, incorporating material properties derived from triaxial testing and geological characterization.
The welded tuff formation exhibiting elastoplastic behavior consistent with the Mohr–Coulomb failure criterion was simulated using the Mohr–Coulomb constitutive model.

3.2. Structural Modeling Methodology

Leveraging the geometric symmetry of the bridge–seawall system in the transverse plane, a half-model configuration was implemented (encompassing the right span of the bridge) to optimize computational efficiency in finite element analysis [36]. All structural components—including piles, pile caps, columns, and crossbeams—were explicitly modeled through volume elements, with a linear elastic constitutive model. The pile cap has dimensions of 19.5 m (length) × 4.5 m (width) × 2.8 m (thickness). The crossbeam measures 24.5 m in length, 2.2 m in width, and 2.2 m in thickness. The columns, which are cylindrical with a diameter of 2.2 m, have varying heights across Piers ① to ⑤: 12 m, 12 m, 14 m, 15 m, and 16 m, respectively. While the superstructure was excluded from direct modeling, its gravitational effects were represented through an equivalent surface load of 186 kPa, calculated based on dead load distribution patterns [37].
Pile foundations were simulated using Embedded Beam, a numerical technique that maintains computational accuracy while reducing element count, as validated by comparative studies in deep foundation modeling [35,38]. An interface reduction factor (Rinter) of 0.67 was applied to account for soil–structure interaction mechanisms at pile–soil interfaces [31,39]. The seawall was analyzed employing the Mohr–Coulomb constitutive model [33,40]. The structural parameters incorporated in the finite element model are systematically presented in Table 3.

3.3. Boundary Conditions and Mesh Discretization

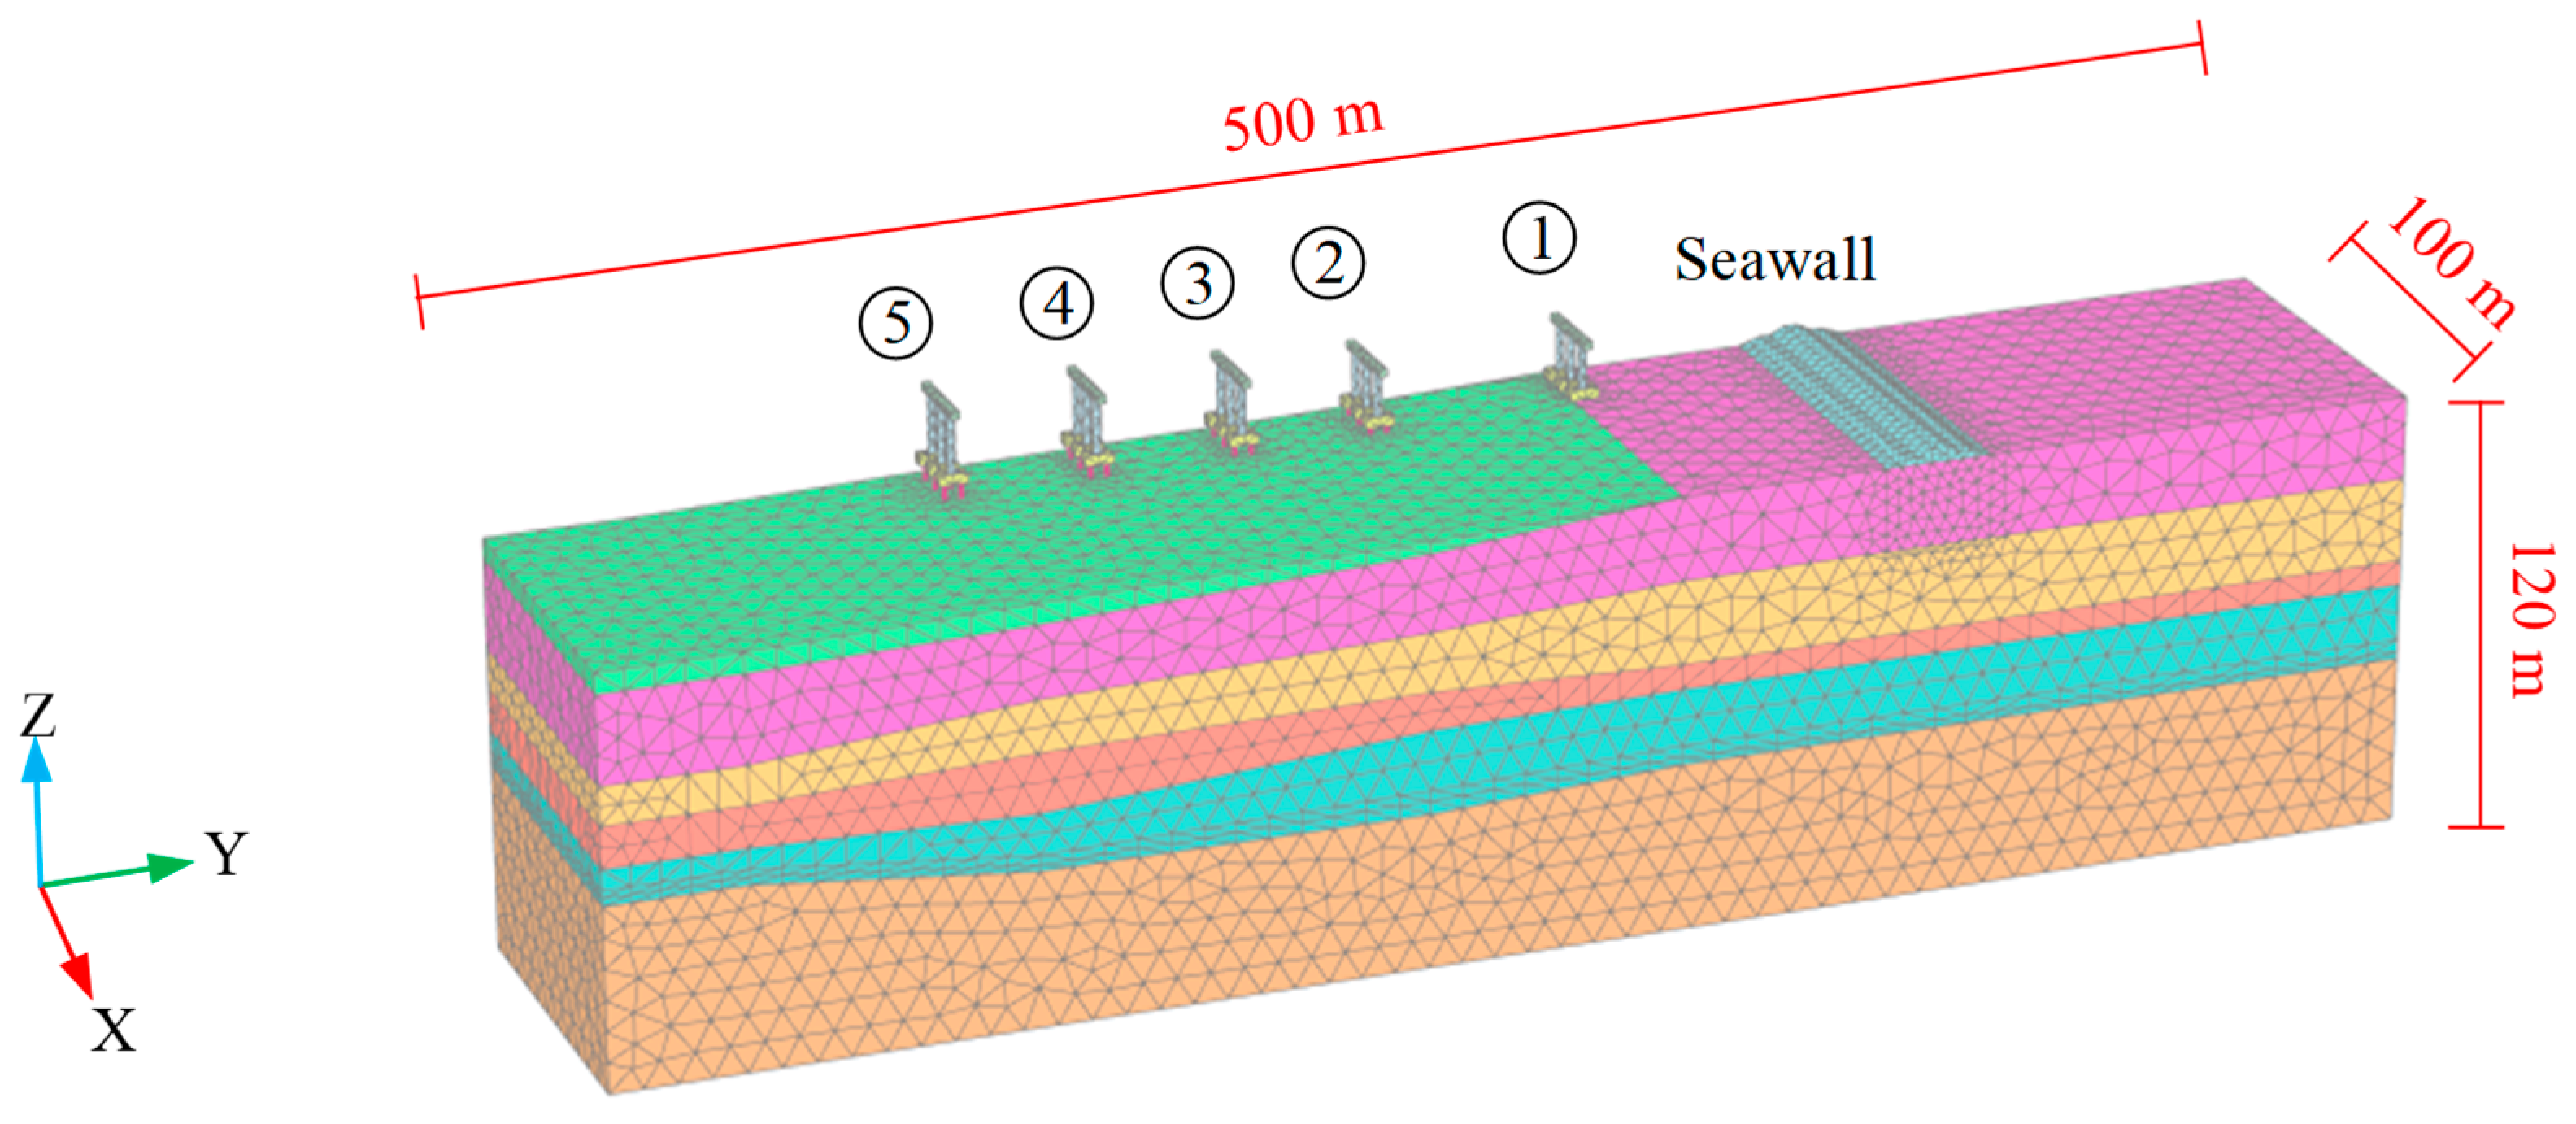
A three-dimensional finite element model was established using Plaxis 3D (Version 23), with model dimensions of 500 m (length) × 100 m (width) × 120 m (height). The boundary conditions were determined based on computational results to optimize the balance between computational efficiency and numerical accuracy. This dimensional configuration effectively mitigates boundary effects that could otherwise compromise computational accuracy. During mesh generation, localized refinement was implemented for the piles, seawall structures, and adjacent soil domains. The discretized mesh consists of 10-node tetrahedral elements, yielding a total of 89,220 elements and 134,689 nodes. A schematic representation of the finite element model is presented in Figure 4.

3.4. Analysis Step

The principal analysis steps within the finite element modeling framework are structured as follows:
(1)
Geostatic stress equilibrium: As indicated by the geological cross-section showing a non-horizontal ground surface, the gravity loading approach in Plaxis was employed to achieve initial stress equilibrium. As illustrated in Figure 2, the groundwater table elevation was set at 1.0 m.
(2)
Activation of bridge pile foundations with pile caps, columns, and crossbeams. A uniform equivalent surface load of 186 kPa was applied to the crossbeams, and the construction stages of the bridge were not accounted for.
(3)
Construction of the first-stage seawall (3 m height) using consolidation analysis, with a construction duration of 10 days followed by a 10-day rest period.
(4)
Construction of the second-stage seawall (2 m height) using consolidation analysis, with a construction duration of 5 days.
(5)
Long-term consolidation phase post-seawall construction to investigate sustained effects on bridge pile foundations. A consolidation analysis was conducted over a total duration of 20 years with annual intervals, where each yearly increment was defined as 365 days.

3.5. Numerical Simulation Validation

Chen et al. [1] reported a field investigation on the effects of asymmetric surcharge loading on bridge pile foundations in a coastal soft soil area in Zhejiang Province, China.
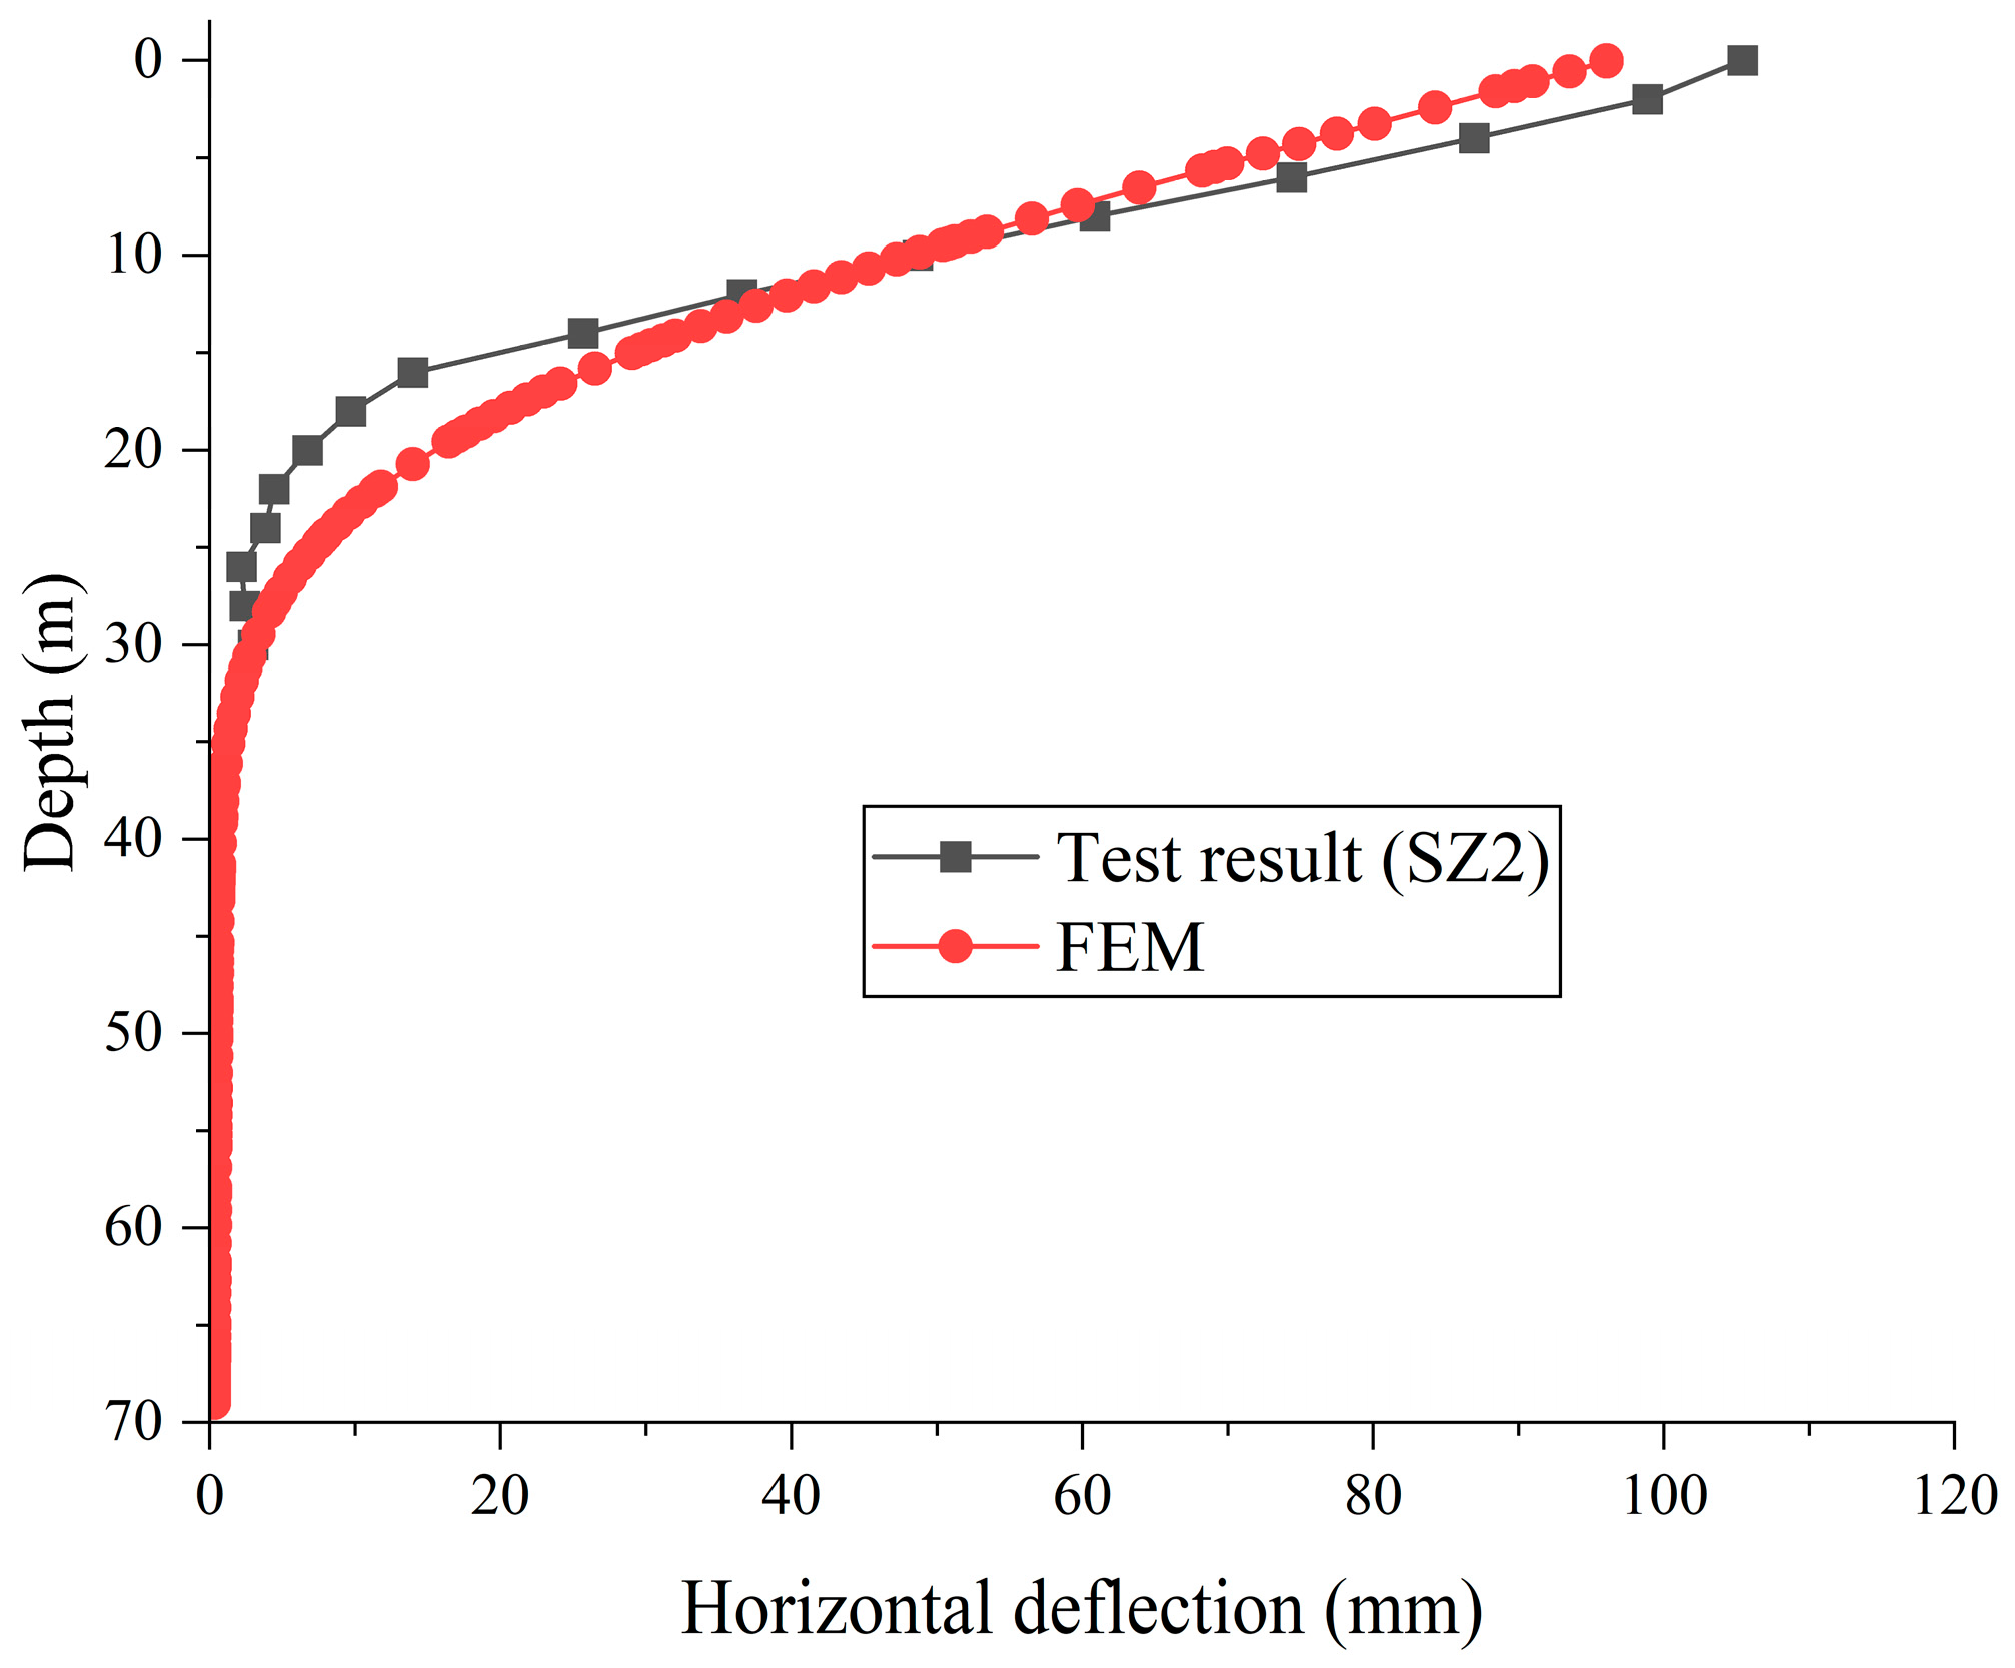
The test site is characterized by a soft soil layer exceeding 25 m in thickness. To validate the rationality of the numerical modeling methodology and parameter selection proposed in this study, a finite element model was established based on the field test conducted by Chen et al. [1]. Detailed experimental parameters can be found in their study [1] and are not reiterated here. A comparison between the finite element analysis results and the measured horizontal displacements of test pile SZ2 from the field experiment is presented in Figure 5. With a length of 71.5 m and diameter of 1.5 m, test pile SZ2 is embedded in a gravel stratum serving as the bearing layer at the pile tip. As shown in Figure 5, the values computed from the FEM exhibit a high degree of consistency with the experimental measurements. This confirms that the finite element modeling approach employed in this study is reasonable and can effectively capture the lateral deformation characteristics of pile groups under surcharge loading.

4. Results and Analysis

4.1. Influence Zone of Seawall

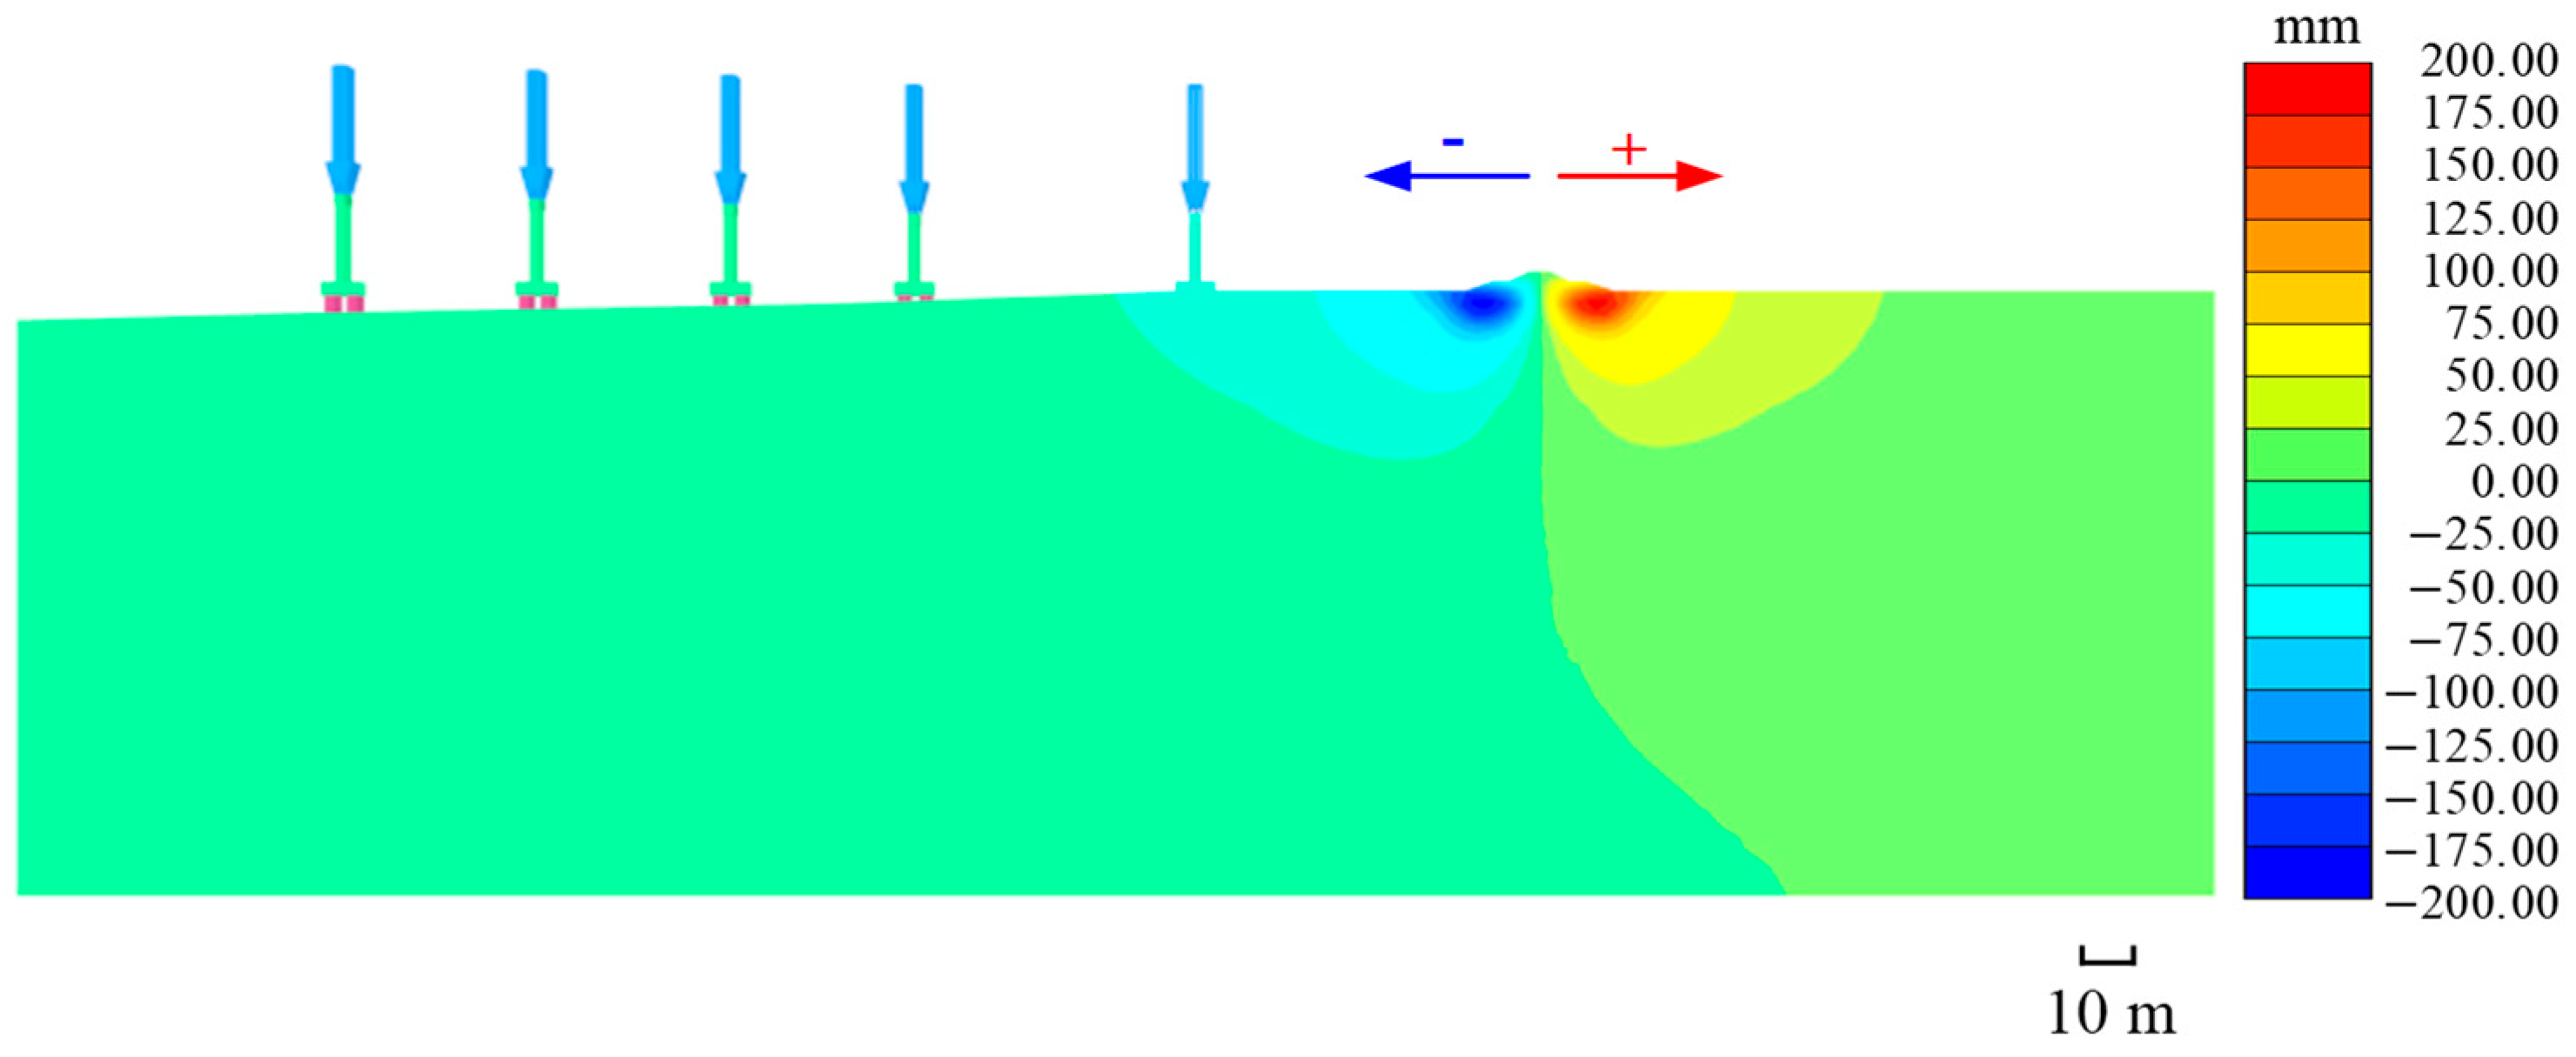
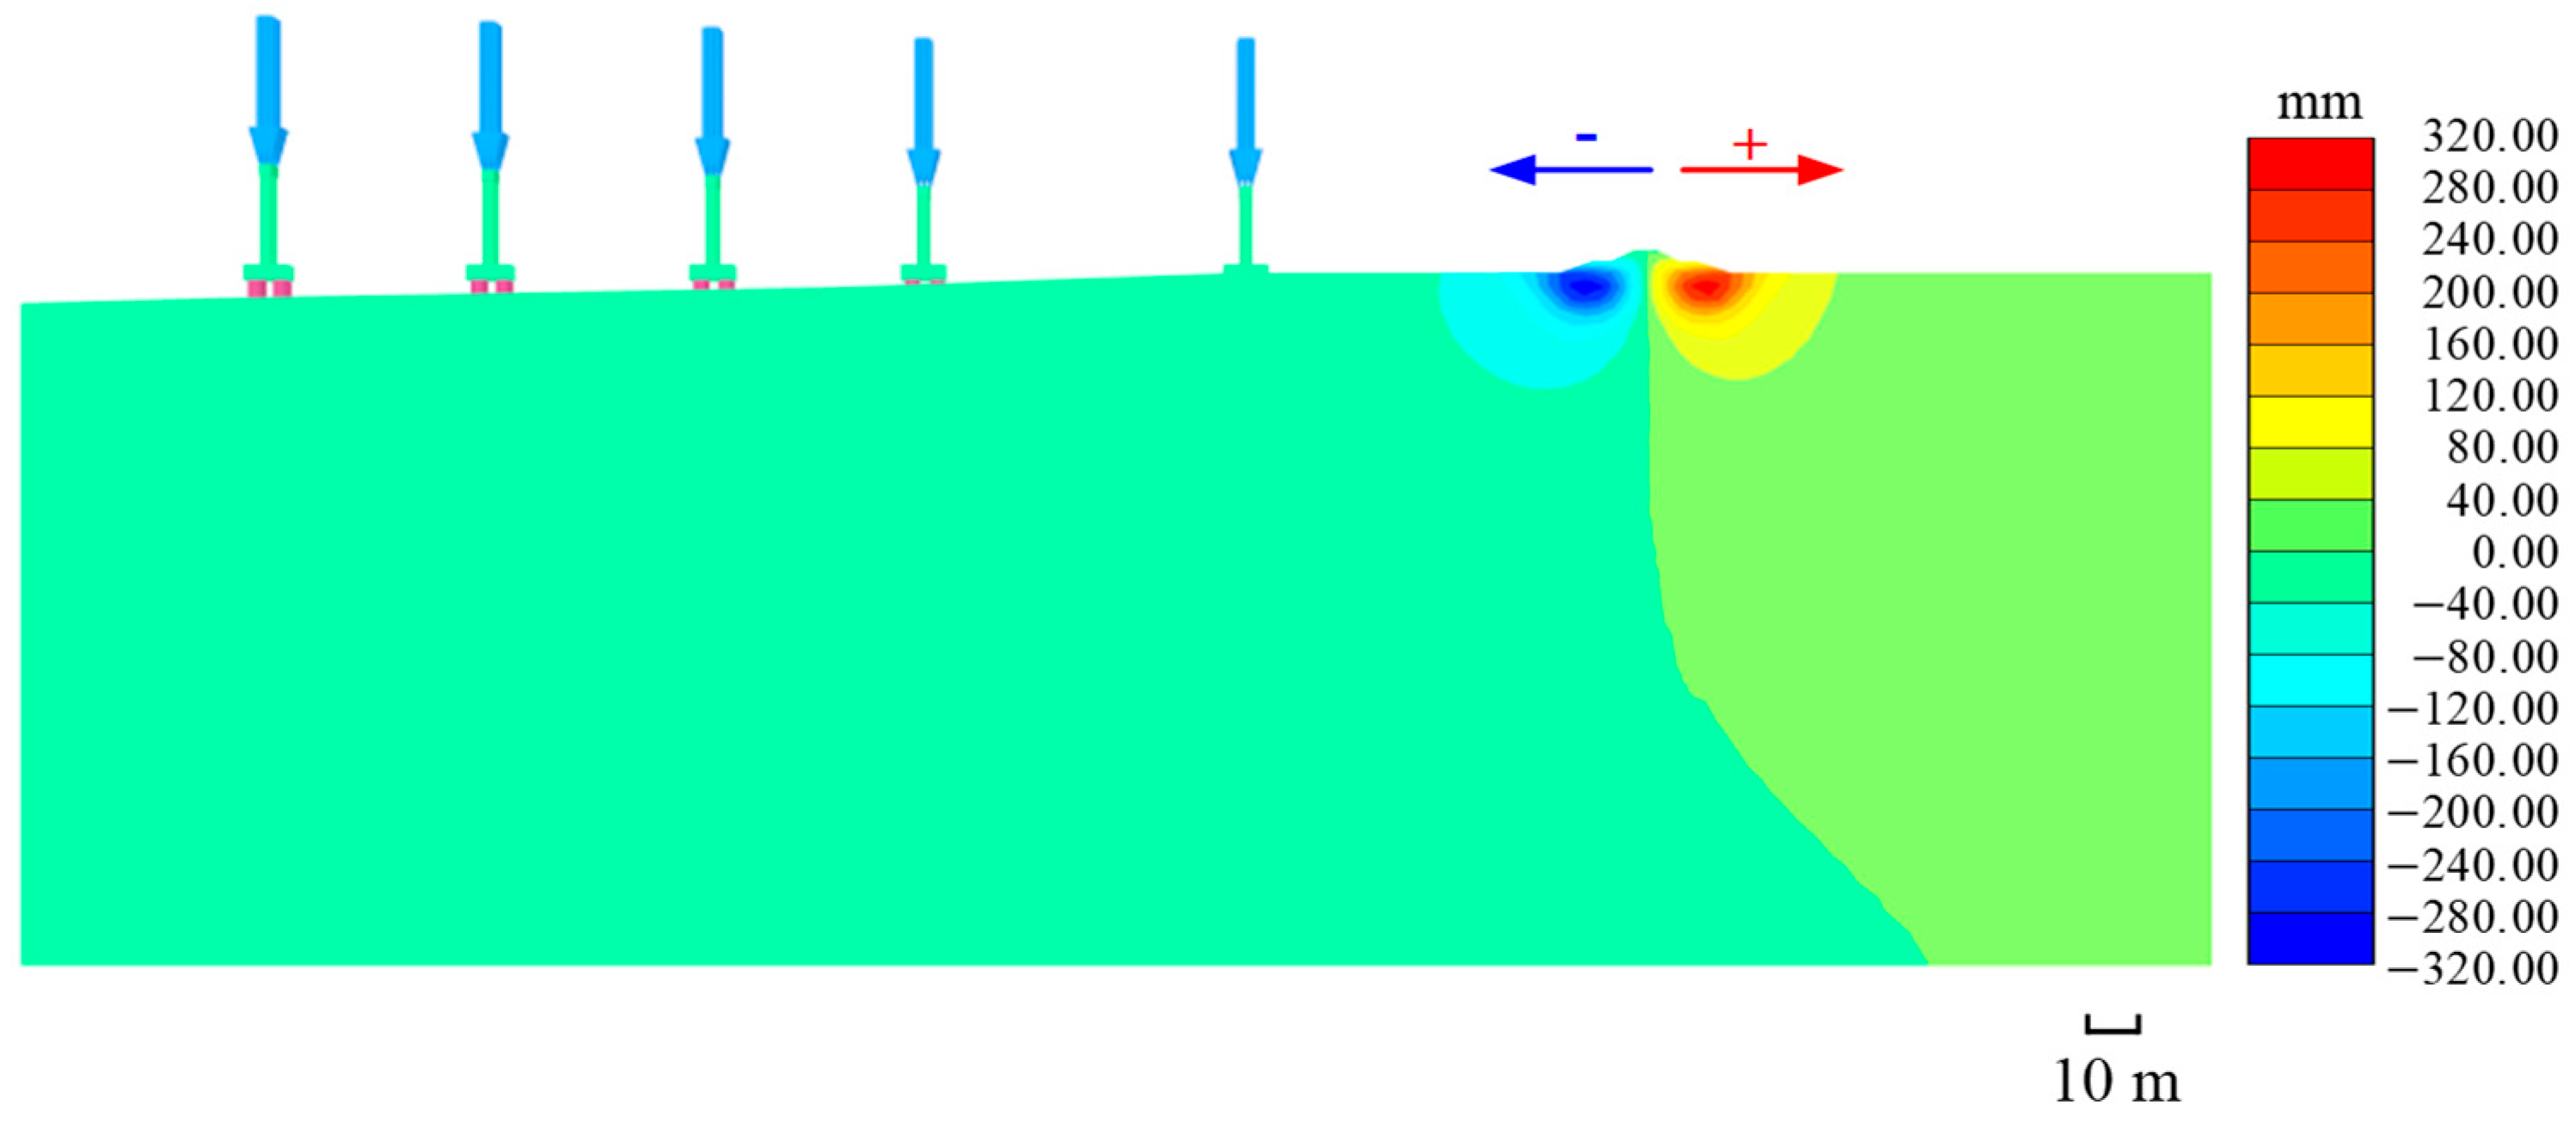
Figure 6 presents a contour map of horizontal displacements after seawall construction on day 25. The maximum horizontal displacement during the seawall construction process reached 192 mm; Pier ① exhibited a horizontal displacement of 25.52 mm, while displacements at the other piers progressively decreased. These results demonstrate that surcharge loading significantly influences Pier ①. Consequently, subsequent analyses will focus exclusively on investigating the effects of the seawall on Pier ①.
Figure 7 presents a contour plot depicting horizontal displacement at day 755 (2 years post-construction of the seawall during the consolidation phase). The results demonstrate a notable reduction in the affected zone of horizontal displacement induced by embankment consolidation. This phenomenon can be attributed to the predominant vertical-settlement-dominated deformation pattern of the seawall during this phase. Furthermore, with the progressive accumulation of vertical settlement, the soil mass at the toe of the seawall exhibits gradual inward movement toward the seawall structure.

4.2. Horizontal Displacement of Piles

Figure 8 illustrates the horizontal displacement evolution at the pile head of Pier ① over 20 years following seawall construction. The displacement–time relationship exhibits three distinct phases: (1) the embankment loading phase (0–25 days), (2) the consolidation phase (26–5420 days), and (3) the steady-state phase (5421–7375 days). During the loading phase, the horizontal displacement progressively increases due to short-term embankment surcharge-induced excess pore water pressure, which triggers instantaneous soil displacement and drives the pile away from the embankment. In the consolidation phase, gradual dissipation of excess pore water pressure occurs concurrently with enhanced embankment vertical settlement. This dual mechanism induces gradual inward soil movement toward the embankment structure, consequently reducing pile displacement. Ultimately, the system transitions to the steady-state phase as pore pressure equilibrates, with horizontal displacement stabilizing asymptotically toward a constant value.
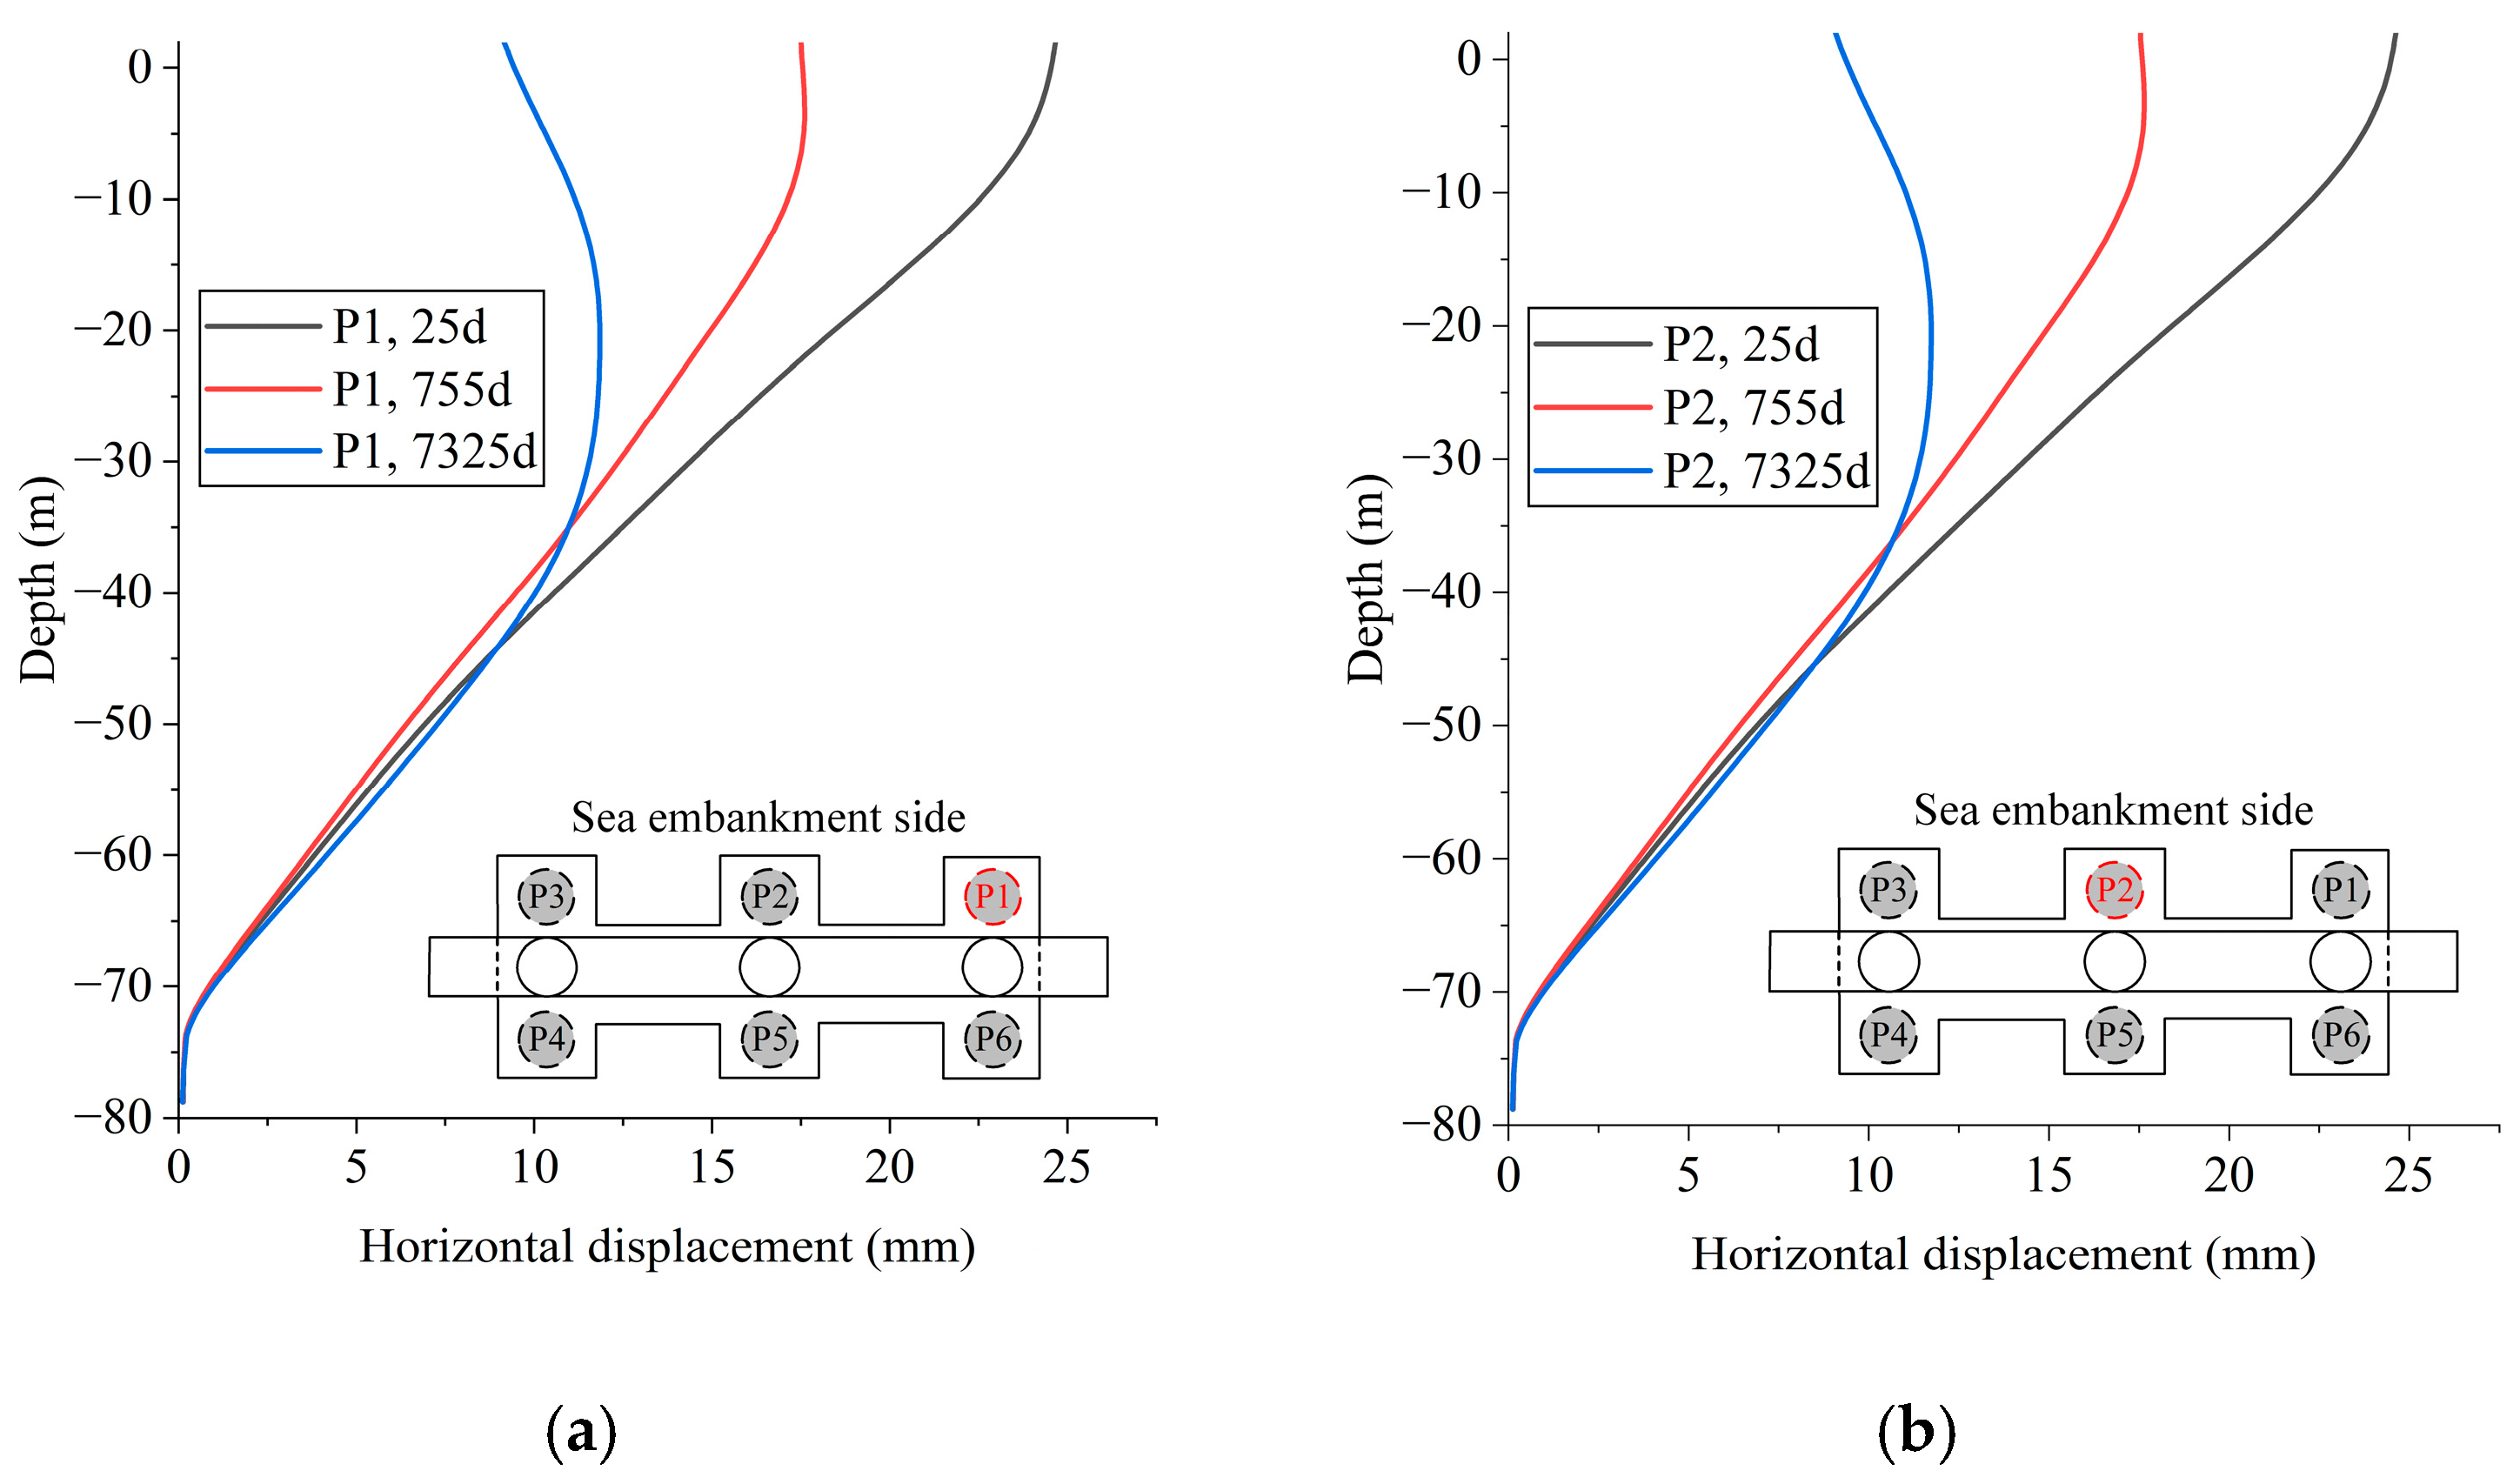
Figure 9 presents the evolution curves of horizontal displacement versus depth for corner pile P1 and side pile P2 in Pier No. 1 across different construction phases. Positive displacement values indicate movement away from the seawall direction. Both P1 and P2 exhibit analogous horizontal displacement–depth patterns, attributable to the similar deformation characteristics induced by the restraining effect of the pile cap. Following seawall completion (25 d), a maximum horizontal displacement of approximately 25 mm was recorded at the pile head. During the consolidation phase (755 d), the peak displacement decreased to 17 mm, occurring at an 8 m depth. In the stabilization stage, the maximum displacement was further reduced to 12 mm at a 25 m depth. Collectively, these observations demonstrate a temporal reduction in maximum horizontal displacement accompanied by the progressive downward migration of its occurrence depth. This evolution pattern principally results from stress redistribution toward deeper soil strata over time. Concurrently, vertical compression settlement in the soft soil layer beneath the seawall induces the inward horizontal displacement of adjacent soils toward the seawall structure, thereby progressively diminishing pile displacements through counteractive soil–pile interaction mechanisms.

4.3. Bending Moments in Piles

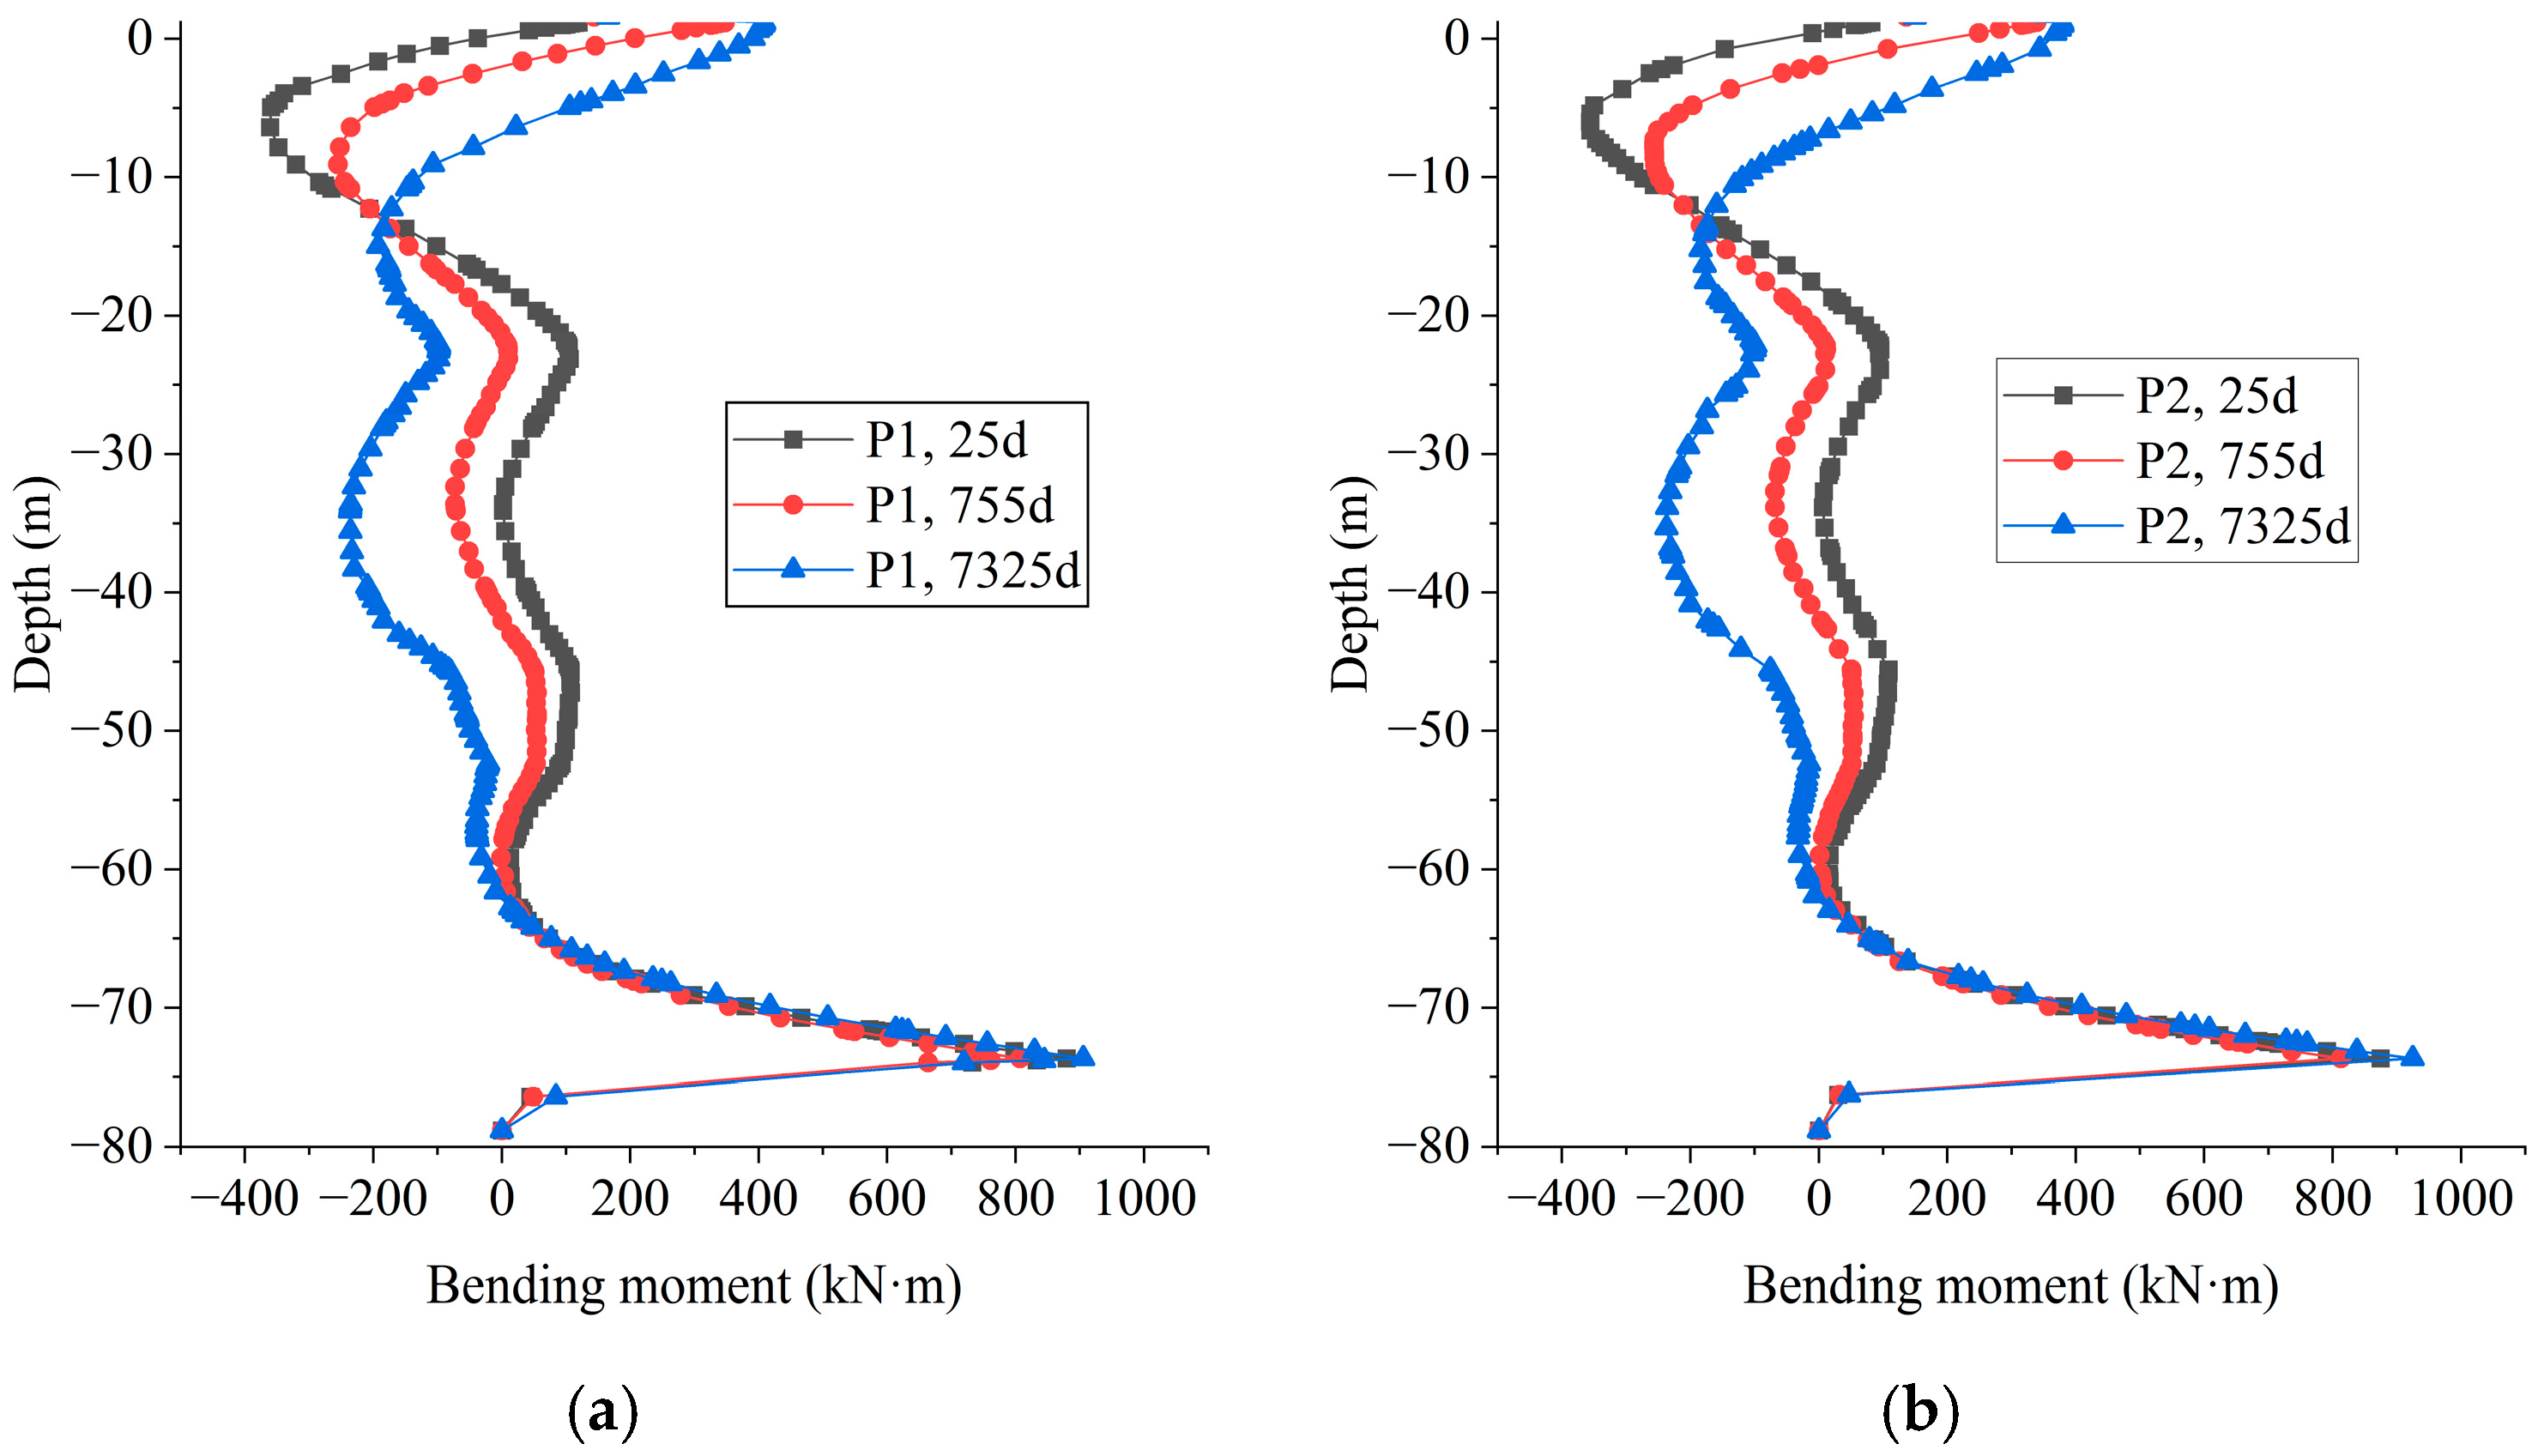
Figure 10 shows the bending moment–depth curves of corner pile P1 and side pile P2 in Pier No. 1 at different time stages. Negative bending moments indicate curvature away from the seawall direction, while positive values represent curvature toward the seawall. The positive moment at the pile head (−0 m) is due to the fixed-end constraint of the pile cap. The persistent positive moment of 900 kN·m at −73 m depth across all stages results from the socketed pile’s embedment into the welded tuff stratum. Negative moments are primarily induced by seawall construction and soft soil consolidation.
After seawall completion (25 days), the maximum negative bending moment reached 380 kN·m at a −6 m depth. During the consolidation phase (755 days), this peak negative moment decreased to 230 kN·m at a −9 m depth, with a secondary negative moment extremum of 90 kN·m emerging at a −35 m depth. In the stabilization stage (7325 days), the primary negative moment further reduced to 220 kN·m at a −35 m depth, while another negative moment extremum of 190 kN·m appeared at a −15 m depth.
With increasing time, the maximum negative moment in the upper pile segment (1.2 m to −22 m) decreased from 380 kN·m to 190 kN·m (50% reduction), though its critical position progressively migrated downward. In the middle segment (−22 m to −60 m), the maximum negative moment increased from negligible values to 220 kN·m, with its position remaining stable. The positive moment distribution in the lower segment (−60 m to −80 m) maintained consistent characteristics, peaking at 900 kN·m at a −73 m depth.
Overall, the maximum negative bending moment gradually diminished over time, while the maximum positive moment remained constant at 900 kN·m, consistently localized at the welded tuff interface (−73 m). The absolute value of the maximum positive moment (900 kN·m) significantly exceeded that of the negative moments (190–380 kN·m). These results emphasize that for socketed piles in coastal soft soils, bending moment assessments under seawall-induced loads should prioritize rock-socketed sections (−73 m) due to their dominant mechanical influence.

4.4. Analysis of Influencing Factors

An analysis was conducted to investigate three primary factors influencing the horizontal deformation of piles: the permeability coefficient of soft soils, pile stiffness, and the distance between the seawall and piles. All remaining parameters were consistent with the specifications provided in Table 2 and Table 3 to ensure methodological continuity across analyses.

4.4.1. Permeability Coefficient

The permeability coefficients of soft soils (mucky clay and mucky silty clay) significantly influence the vertical settlement of the seawall, thereby inducing variations in pile horizontal displacement. Consequently, a parametric analysis of soil permeability was conducted, evaluating scenarios with permeability coefficients set at 0.1×, 0.5×, 10×, and 20× the baseline value.
Figure 11 presents the horizontal displacements of pile P1 under varying permeability coefficients of soft soil at two critical stages: 25 days and 7325 days. The results demonstrate that during the post-construction phase (25 days), the maximum horizontal displacement occurs at the pile head. The permeability coefficient variations predominantly influence the upper portion of the pile (above −15 m elevation), with displacement magnitudes decreasing as permeability increases. Notably, the displacements below −15 m remain essentially unaffected by permeability changes. In the steady-state phase (7325 days), the displacement profiles exhibit consistent distribution patterns across all permeability cases, except for the 0.1× permeability scenario. Under the 0.1× permeability condition, the maximum displacement stabilizes at approximately 12 mm at a −25 m depth. However, the 0.1× permeability case shows a distinct behavior, with maximum displacement reaching 14 mm at a shallower depth of −6.5 m. These findings indicate that soil permeability exerts a more pronounced influence on long-term deformation characteristics.
Figure 12 displays the variations in bending moment with depth for pile P1 under different soft soil permeability coefficients at two distinct phases: 25 days and 7325 days. During the 25-day post-construction phase, the bending moment distribution patterns remain consistent across all permeability cases, indicating that changes in the permeability coefficient of the soft soil do not influence the bending moment behavior in the short term. Specifically, a maximum negative bending moment of approximately −362 kN·m occurs in the upper segment of the pile at a −6 m depth, while a peak positive bending moment of about −900 kN·m can be observed at the pile base (−74 m depth), irrespective of permeability variations.

4.4.2. Stiffness of the Pile

The stiffness of piles governs their response to horizontal loading. Therefore, to mitigate the influence of sea dikes on pile horizontal displacement, increasing pile stiffness should be considered. Pile stiffness can be calculated using Equation (3):
K p = E p I = E p π D 4 64
where EP represents the elastic modulus of the pile, and D denotes the pile diameter.
As indicated by the equation, pile stiffness depends on both elastic modulus and diameter. Given that the elastic modulus of piles generally exhibits minimal variation in practical engineering applications, this study focuses on modifying pile stiffness through diameter adjustments. Five diameter configurations were investigated: 1.8 m, 1.9 m, 2.0 m, 2.1 m, and 2.2 m.
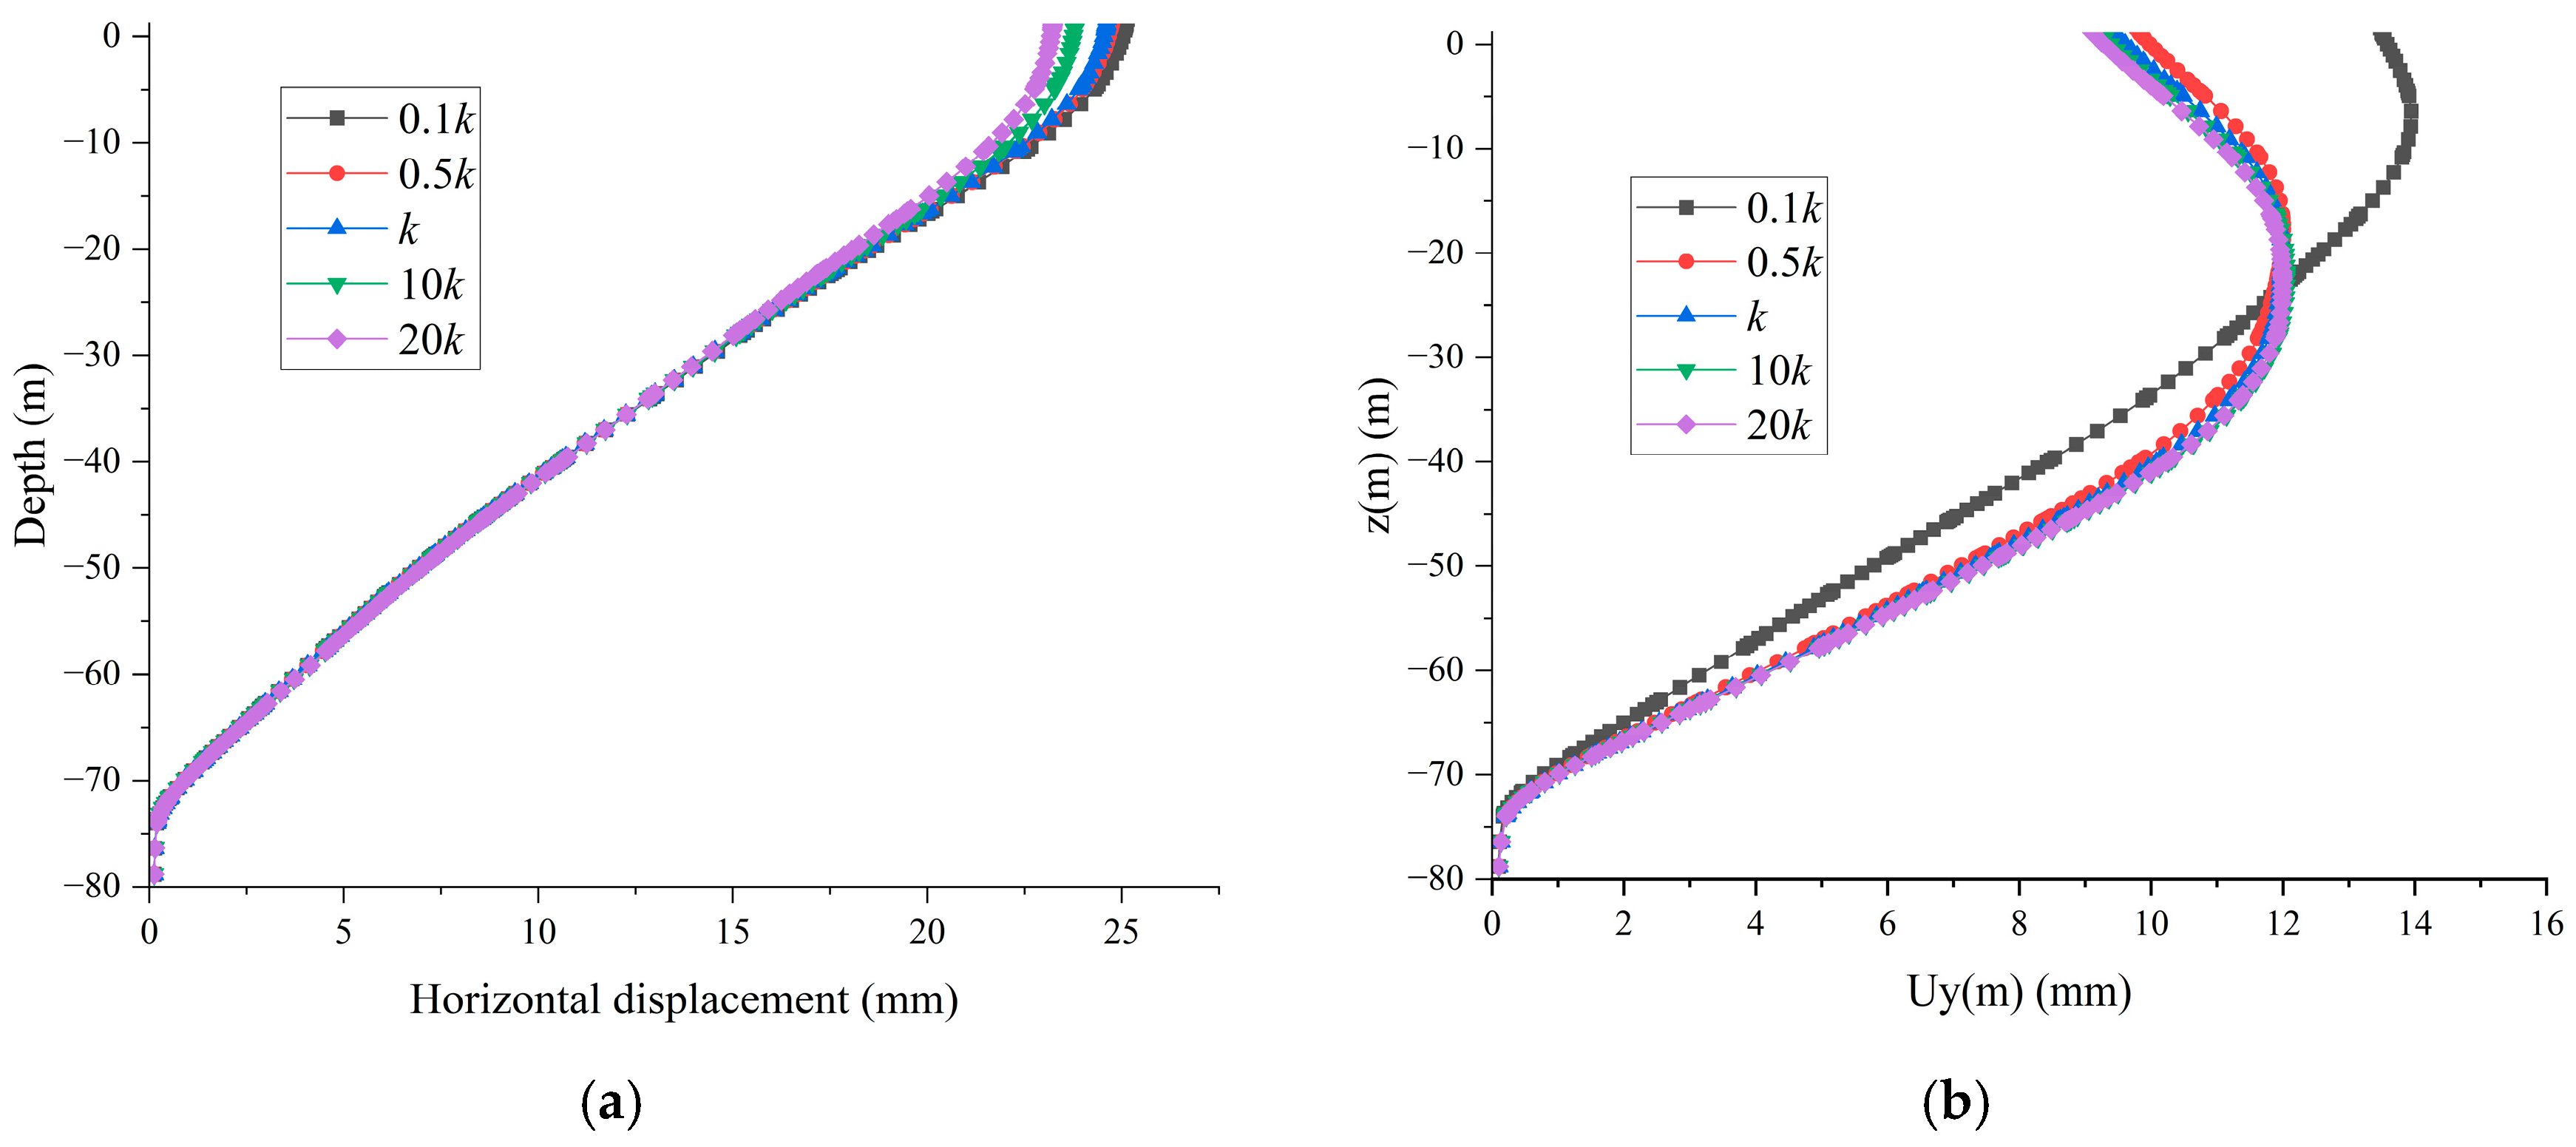
Figure 13 presents the horizontal displacement profiles of piles with different diameters under two operational conditions: 25 days (post-embankment construction) and 7325 days (steady-state phase). As illustrated in Figure 13a, the horizontal displacement–depth curves for various pile diameters essentially coincide during the post-construction phase (25 days), with maximum displacements of approximately 25 mm occurring near the pile head. Figure 13b demonstrates that during the stabilization phase (7325 days), the maximum horizontal displacement for all piles occurs at a depth of −25 m. Notably, the maximum displacement measures 12 mm for the 1.8 m diameter pile, with only a 1 mm reduction being observed as the diameter increases to 2.2 m. This marginal improvement suggests that enhancing pile stiffness through diameter enlargement provides limited effectiveness in reducing horizontal displacements. While further diameter increases beyond the tested range might yield more significant displacement reduction, such modifications would prove neither technically rational nor economically viable. Consequently, larger diameter configurations were excluded from this investigation.
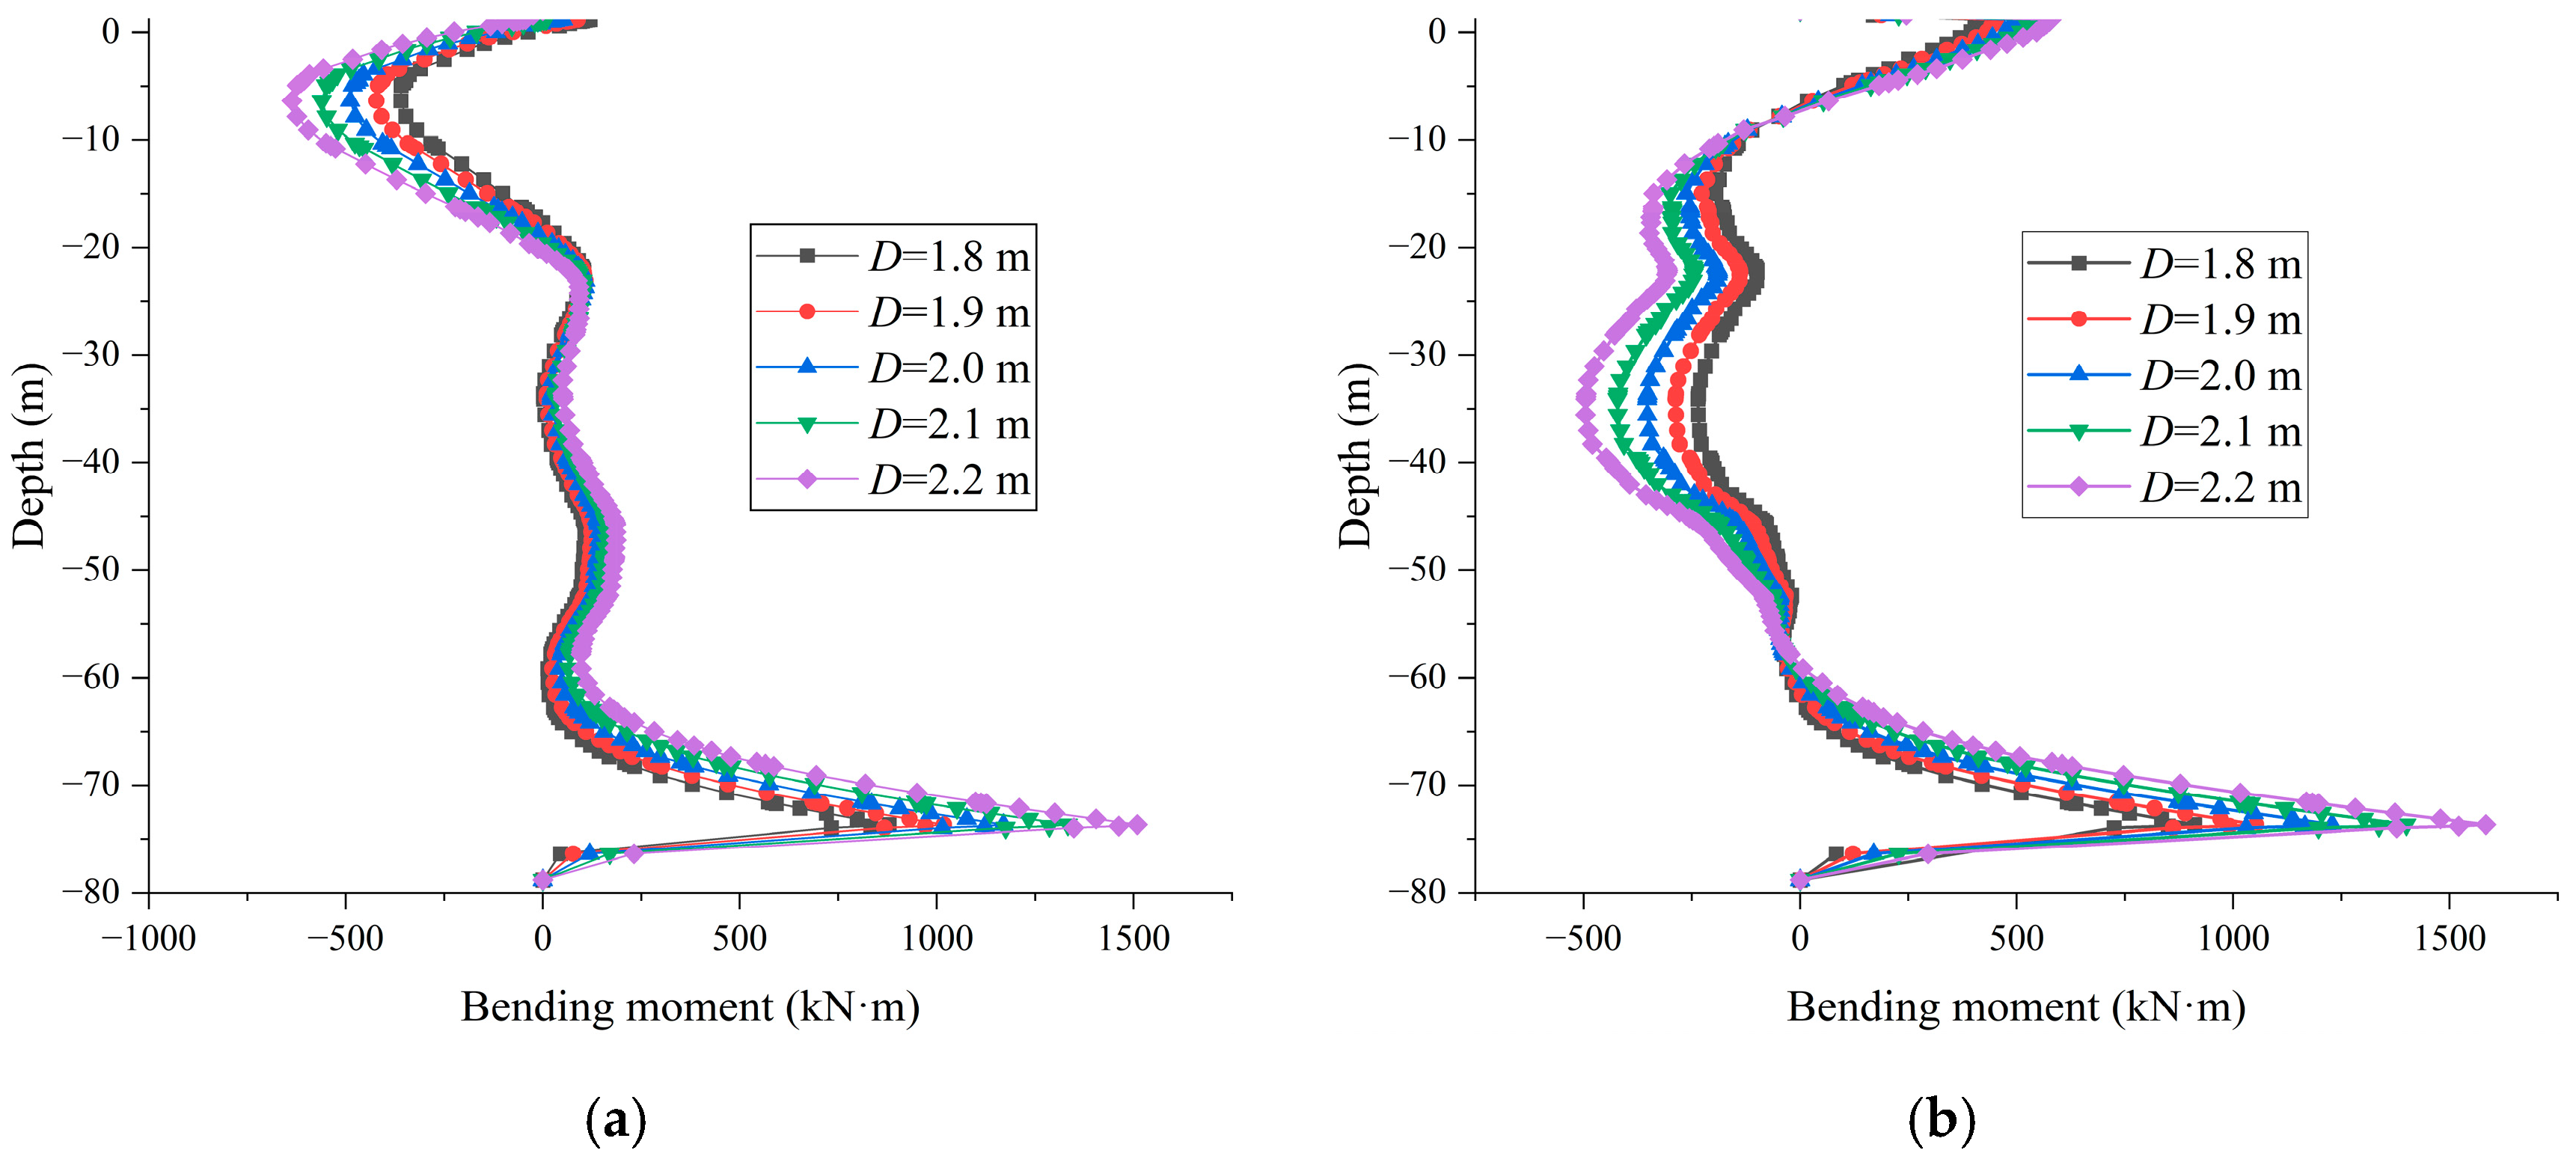
Figure 14 presents bending moment–depth profiles for piles with varying diameters under 25-day (post-construction) and 7325-day (stabilized) conditions. At 25 days, the maximum negative bending moment occurred in the upper pile segment (approximately −8 m depth within the soft clay layer), with its magnitude increasing proportionally to the pile diameter. This correlation arises from larger pile–soil contact areas in greater-diameter piles, which mobilize higher horizontal soil pressures. During the stabilized stage (7325 days), the maximum negative moment shifted to the mid-pile segment (approximately −35 m depth in the silty clay layer), maintaining its diameter-dependent growth pattern. This phenomenon reflects the redistribution of stress toward deeper strata due to the consolidation of soft soils beneath the seawall.
For positive bending moments, both the 25-day and 7325-day conditions exhibited peak values at a −73 m depth, corresponding to the silty clay–ignimbrite interface. Across all tested diameters, the absolute maximum positive bending moment consistently and significantly exceeded peak negative moments. These observations confirm the critical role of rock-socketed sections (−73 m) in governing bending behavior, regardless of pile diameter variations or construction phase transitions.

4.4.3. Seawall–Pile Separation Distance

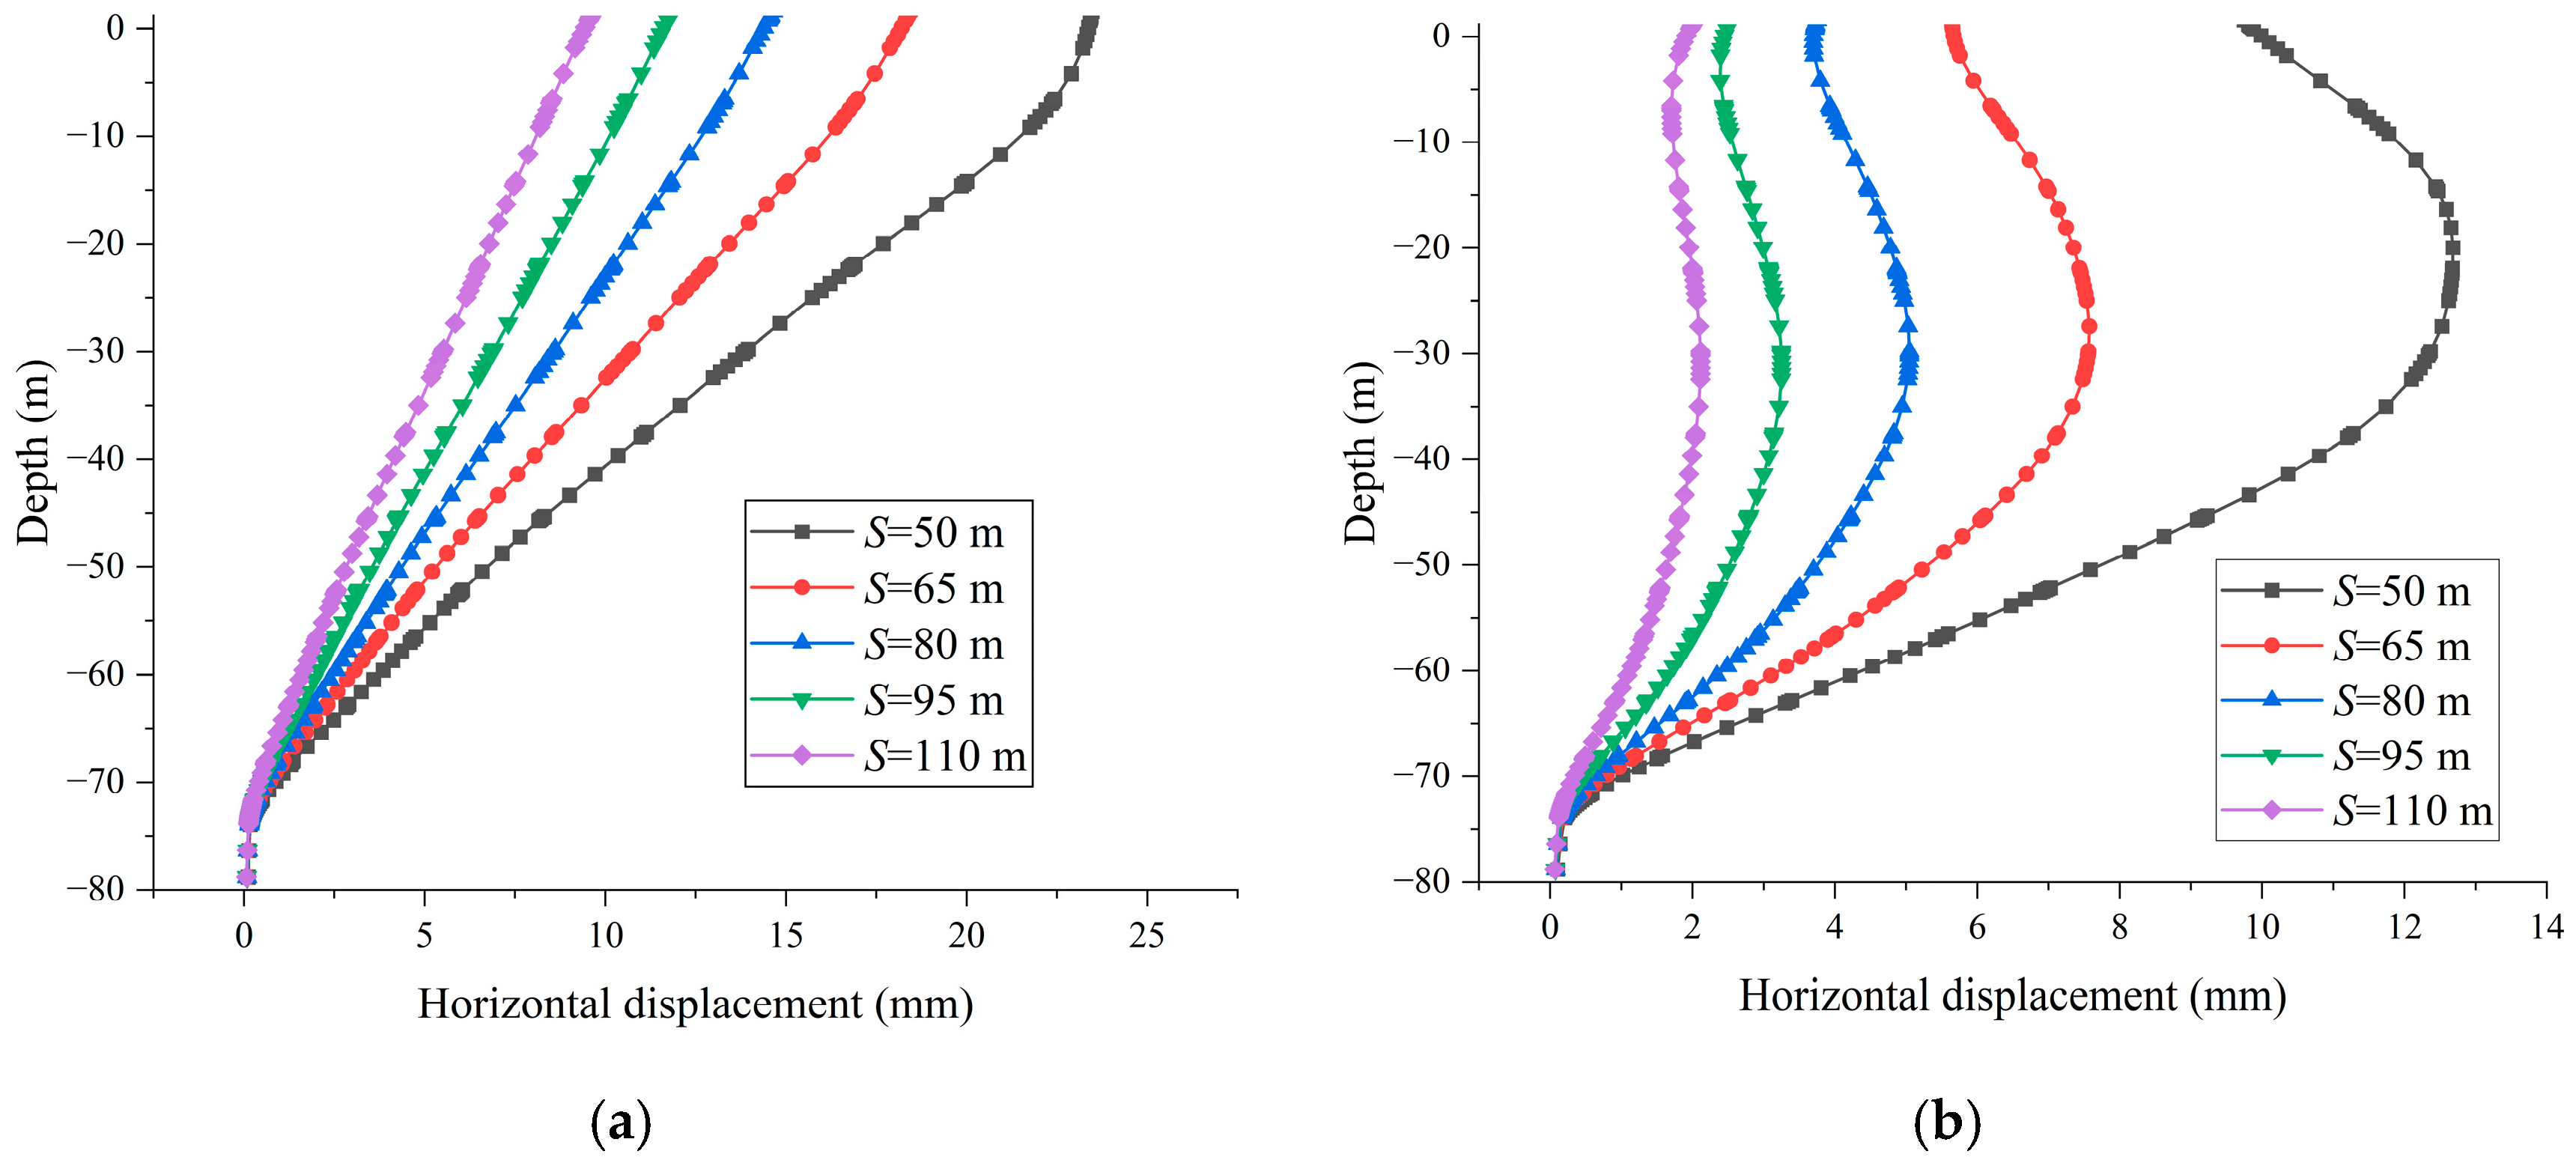
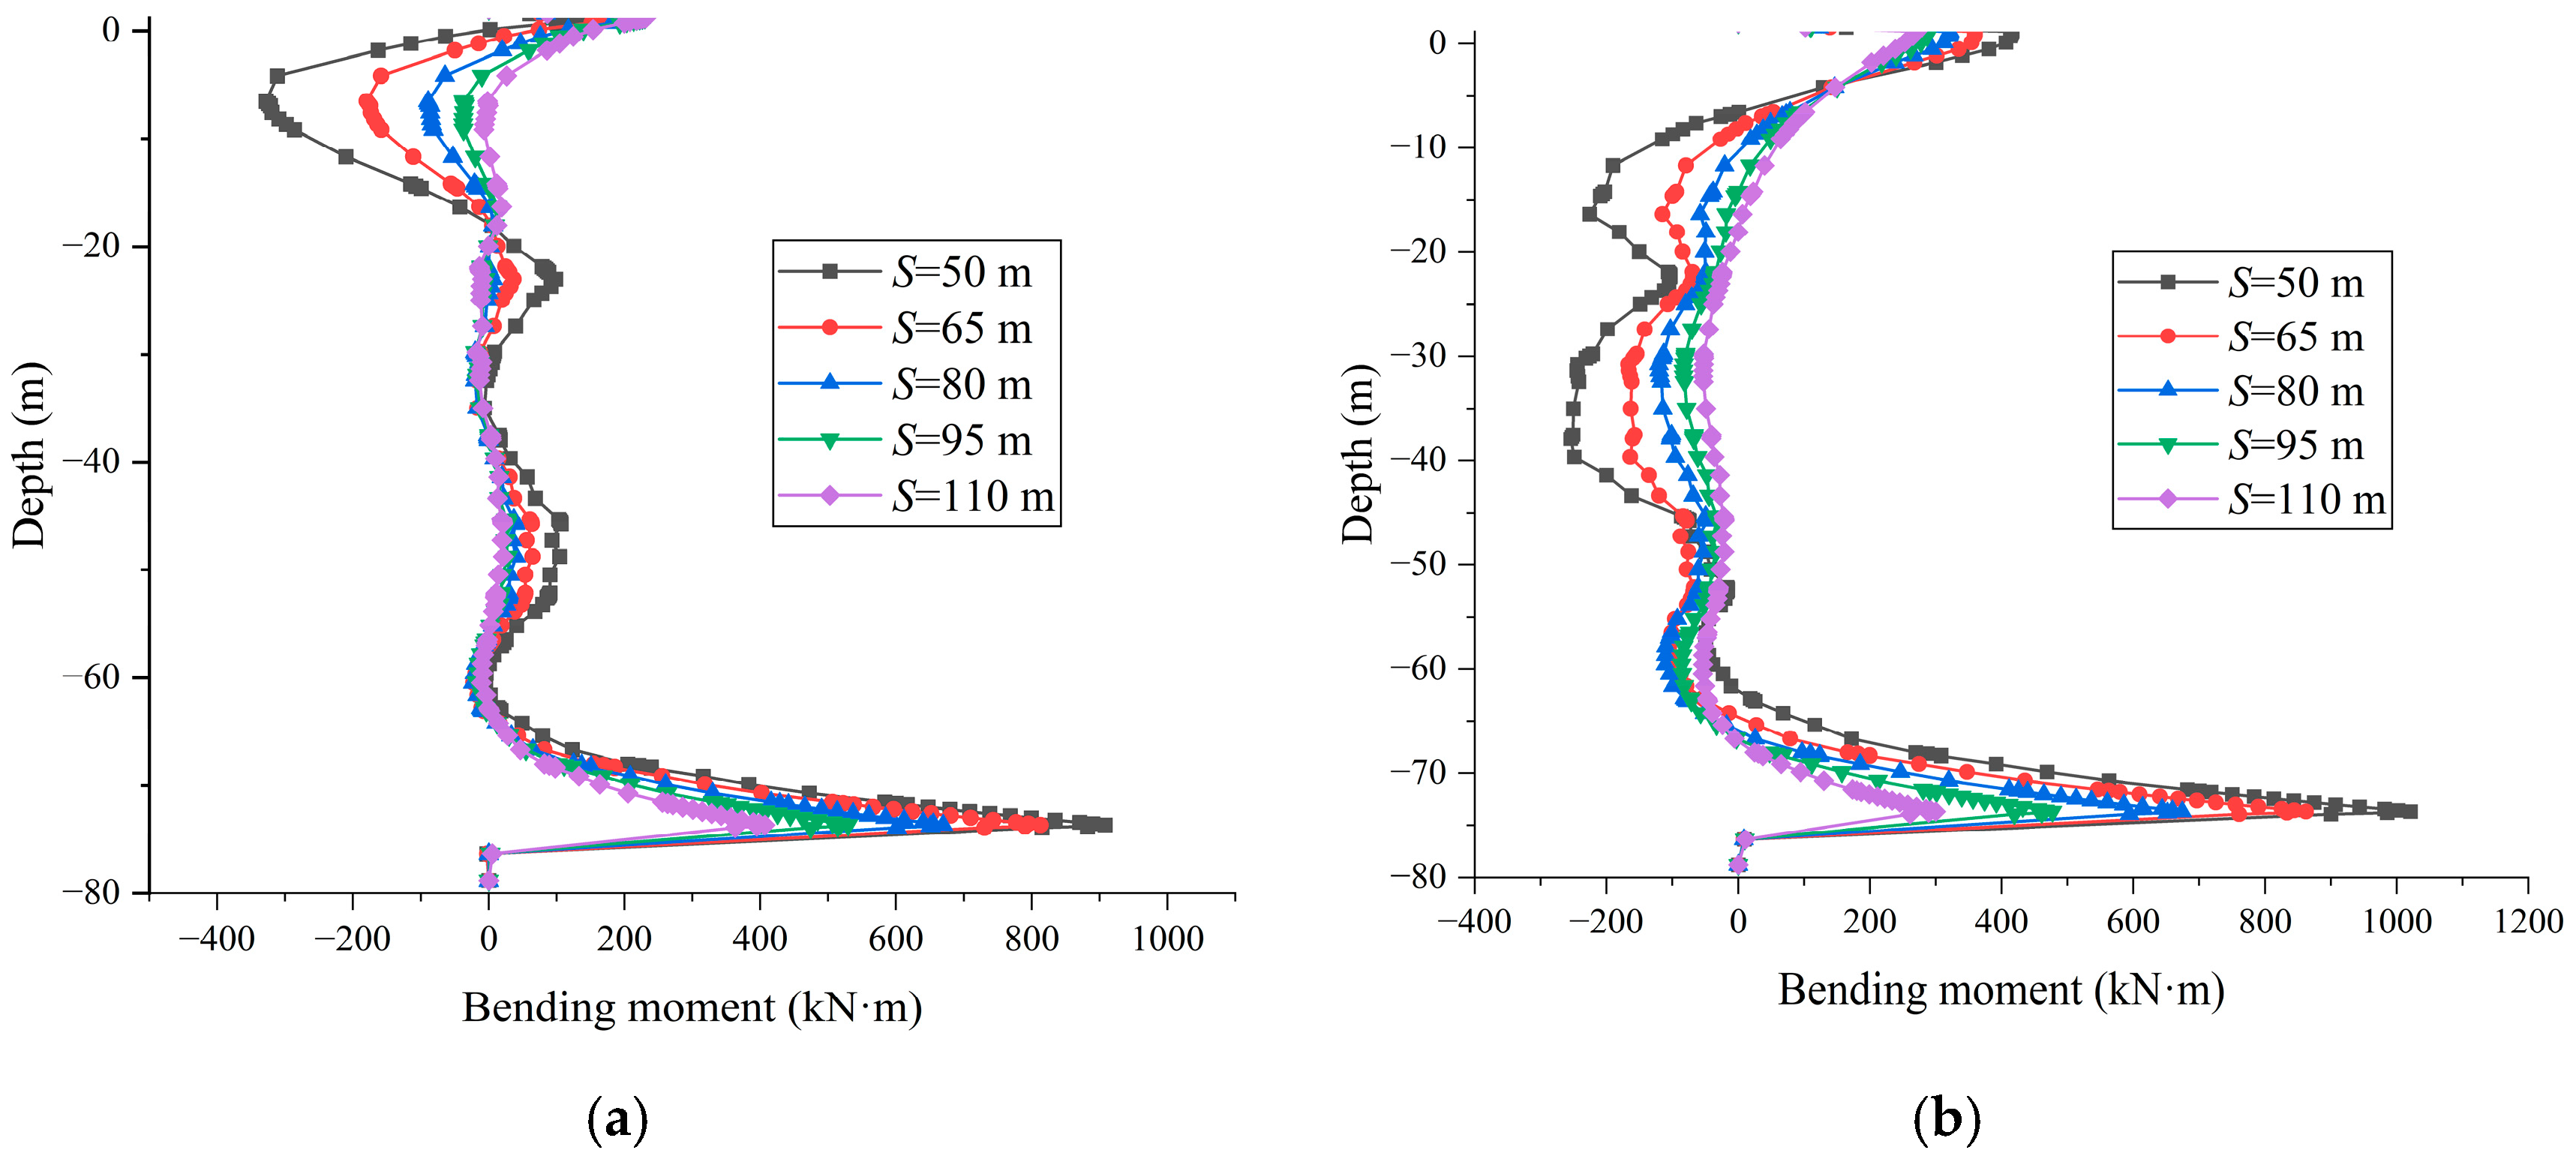
To investigate the influence of the distance between the seawall and bridge on the lateral load characteristics of pile foundations, a parametric analysis was conducted for five spacing configurations: 50 m, 65 m, 80 m, 95 m, and 110 m. It should be noted that this distance specifically refers to the horizontal separation between the seawall toe and the axis line of Pier ①.
Figure 15 presents the horizontal pile displacements under different spacing conditions at 25 days and 7325 days. At 25 days, the maximum horizontal displacement consistently occurred at the pile head elevation across all spacing scenarios, exhibiting a progressive reduction with increased separation distance. The measured maximum displacement decreased from approximately 25 mm at 50 m spacing to 9 mm at 110 m spacing, representing a 72% reduction. During the stabilized phase (7325 days), the critical displacement location shifted downward to mid-pile elevation. The maximum horizontal displacement reduced from 12.5 mm to 2 mm (84% decrease) as spacing increased from 50 m to 110 m, accompanied by a corresponding depth migration from −22 m to −33 m. These results demonstrate that increasing the seawall–bridge separation distance effectively mitigates horizontal pile displacements during both construction completion and long-term stabilization phases, with maximum displacements remaining below 10 mm when the separation reaches 110 m.
Figure 16 illustrates the bending moment distributions along pile shafts under varying separation distances at 25 days and 7325 days. At 25 days, the maximum negative bending moment consistently occurred in the upper soft soil stratum across all spacing configurations, demonstrating progressive attenuation with increasing separation distance. The peak negative bending moment decreased from approximately −270 kN·m at 50 m spacing to near-zero magnitude at 110 m spacing. During the stabilized phase (7325 days), the bending moment profile exhibited dual inflection points, with the critical negative bending moment located at mid-pile elevation. The maximum negative bending moment reduced from −230 kN·m to −50 kN·m (78% reduction) as spacing increased from 50 m to 110 m, accompanied by a downward shift in its position. Notably, the maximum positive bending moment, consistently located at the −73 m interface between silty clay and welded tuff formations, also displayed a progressive reduction with increased separation. These observations confirm that enlarging the seawall–bridge separation distance effectively diminishes both maximum negative and positive bending moments during the construction completion and long-term operational phases.

5. Application of DCM Piles for Seawall Support

5.1. Parameters and Modeling of DCM Piles

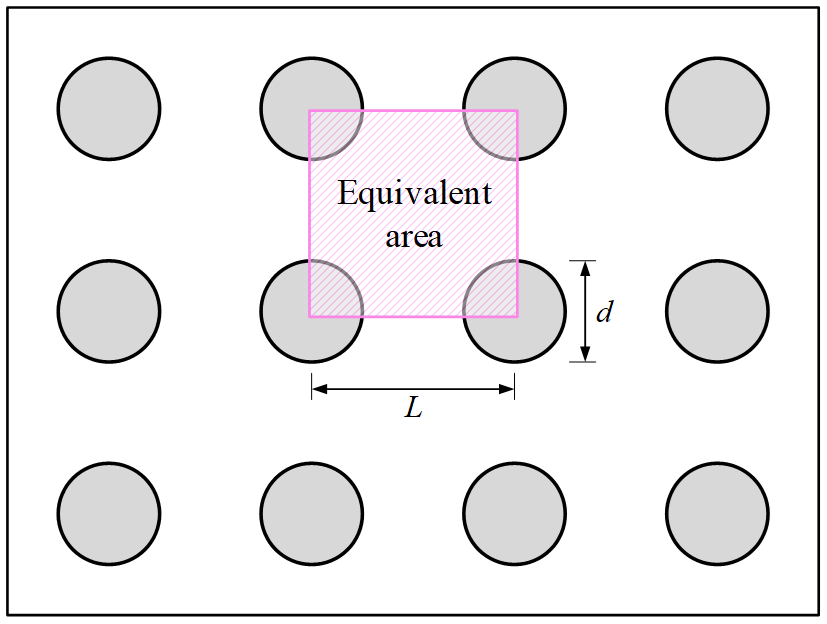
In finite element modeling, the composite foundation of cement–soil mixing piles can be equivalently calculated using the Mohr–Coulomb constitutive model [41]. The DCM piles are arranged in a square configuration with pile diameter d and center-to-center spacing L. Figure 17 presents a schematic diagram illustrating the area replacement ratio m and equivalent parameter calculation methodology for the DCM piles.
The area replacement ratio (m) can be calculated using Equation (4).
m = π d 2 / 4 L 2 = π d 2 4 L 2
where d and L denote the diameter and pile spacing of the DCM piles, respectively.
The equivalent unit weight γ e , equivalent elastic modulus E e , equivalent cohesion ce, and equivalent internal friction angle φe can be calculated using Equations (5)–(8), respectively [42,43,44]:
γ e = γ DCM π d 2 / 4 + L 2 π d 2 / 4 γ s L 2 = m γ DCM + 1 m γ s
E e = m E DCM + 1 m E s
c e = m c DCM + 1 m c s
φ e = tan 1 n m tan φ DCM + 1 m tan φ s n m + 1 m
where γ DCM and γ s represent the unit weights of the DCM pile and surrounding soil, respectively; E DCM and E s denote the elastic moduli of the DCM pile and inter-pile soil, respectively; c DCM and c s correspond to the cohesion values of the DCM pile and inter-pile soil, respectively; φ DCM and φ s represent the internal friction angles of the DCM pile and inter-pile soil, respectively; and n denotes the stress concentration ratio, defined as the ratio of stress acting on the DCM pile to that on the inter-pile soil at the same depth, with n = 6.5 [24,44].
In this study, DCM piles were installed beneath the seawall structure, covering a width of 28 m. The DCM piles were designed with a diameter of 0.8 m and center-to-center spacing of 1.3 m [43], achieving an area replacement ratio of 30%. The unit weight, elastic modulus, cohesion, and internal friction angle of the DCM piles were specified as 20 kN/m3, 87 MPa, 46°, and 40.50 MPa, respectively. The permeability coefficient of the DCM piles was assumed to be identical to that of the surrounding soil [19,43]. The equivalent parameters employed in finite element analysis, calculated through Equations (4)–(8), are systematically summarized in the table below.

5.2. Parametric Studies

The primary function of DCM piles is to form a composite foundation with soft soils, thereby mitigating soil consolidation settlements and reducing vertical displacements in the seawall. Consequently, the pile length, replacement ratio, and elastic modulus of DCM piles emerge as critical design parameters. This section investigates the influence of these three parameters on the lateral deformation of bridge pile foundations. The finite element modeling procedure aligns with that described in Section 3. The parametric analysis focuses on the horizontal displacement responses of pile P1 under 25-day and 7325-day working conditions.

5.2.1. DCM Pile Length (H)

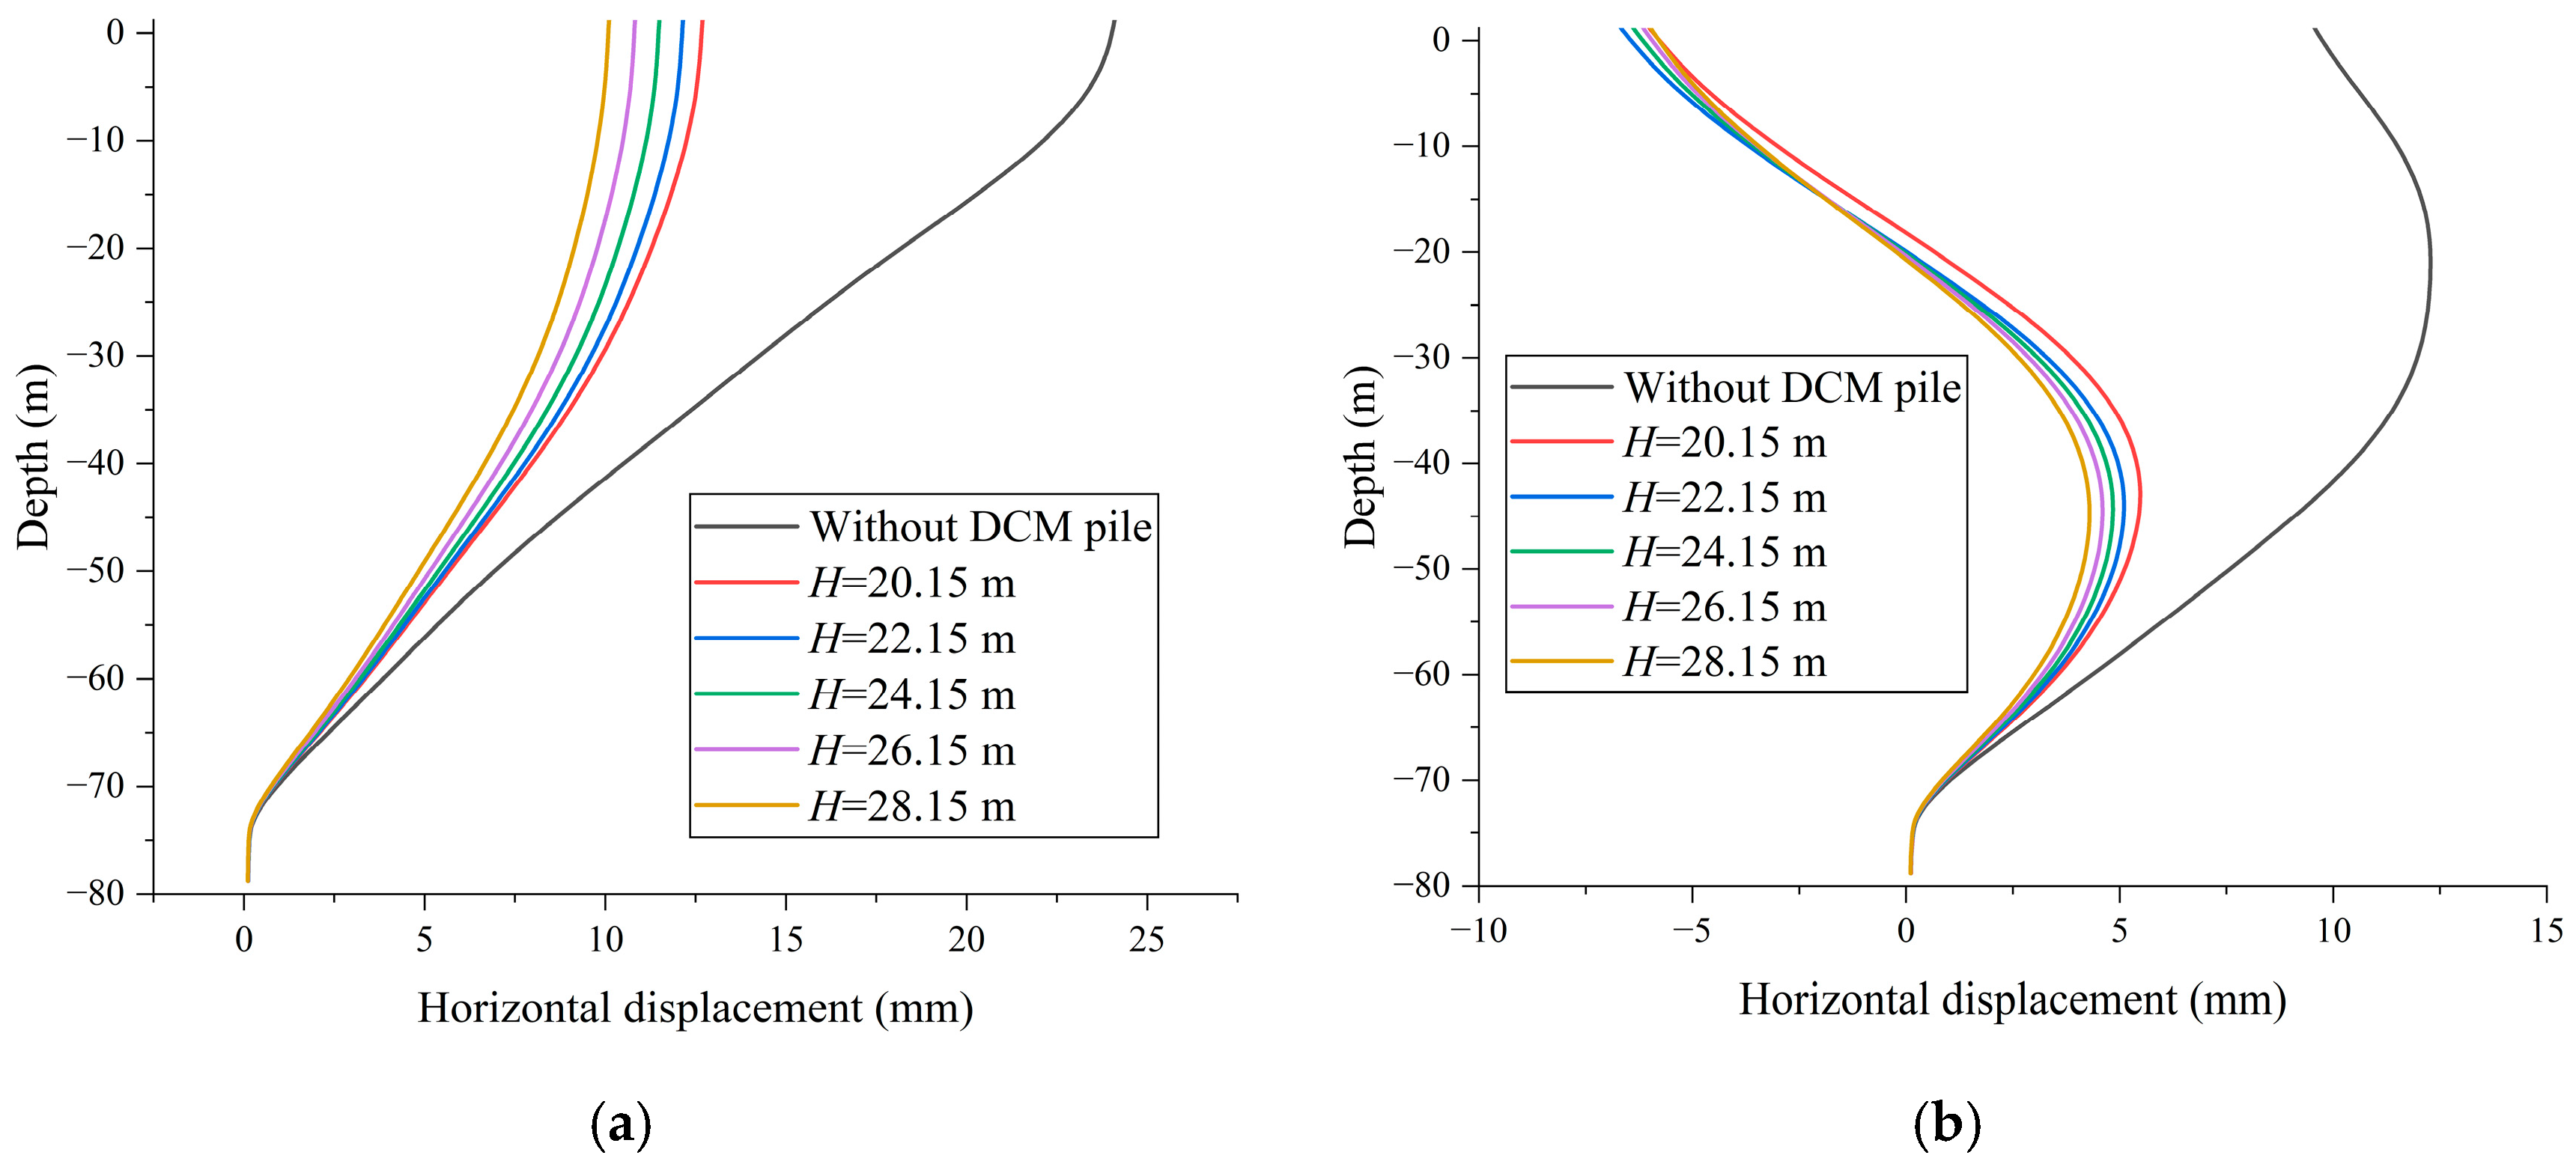
In the parametric analysis of DCM pile length, H, selected lengths of 20.15 m, 22.15 m, 24.15 m, 26.15 m, and 28.15 m were investigated. Other parameters remained consistent with those listed in Table 4.
Figure 18 illustrates the horizontal displacement profiles of pile P1 at 25 d and 7325 d under varying DCM pile lengths. At 25 days, the maximum horizontal displacement of pile P1 still occurred at the pile head, even with DCM piles. Compared with the scenario without DCM piles, the maximum horizontal displacement of pile P1 decreased from 25 mm to 13 mm (a 48% reduction) when the DCM pile length was 20.15 m. As the DCM pile length increased, the maximum horizontal displacement of pile P1 progressively decreased. At a DCM pile length of 28.15 m, the maximum horizontal displacement of pile P1 was reduced to less than 10 mm. These results demonstrate that installing DCM piles in soft soils significantly mitigated the horizontal displacement of pile P1 during the seawall construction phase.
During the stabilization phase (7325 d), the maximum horizontal displacement of pile P1 decreased from 12 mm to 5.5 mm (a 54% reduction) with varying DCM pile lengths. Notably, the maximum displacement shifted to the mid-section of the pile (−45 m), attributable to load transfer through the DCM piles during the consolidation phase. While the maximum horizontal displacement of pile P1 continued to decrease as the DCM pile length increased from 20.15 m to 28.15 m, the reduction magnitude was limited to 20%. This indicates that implementing DCM piles in soft soils also effectively reduced the horizontal displacement of pile P1 during the long-term stabilization phase.

5.2.2. Area Replacement Ratio (m)

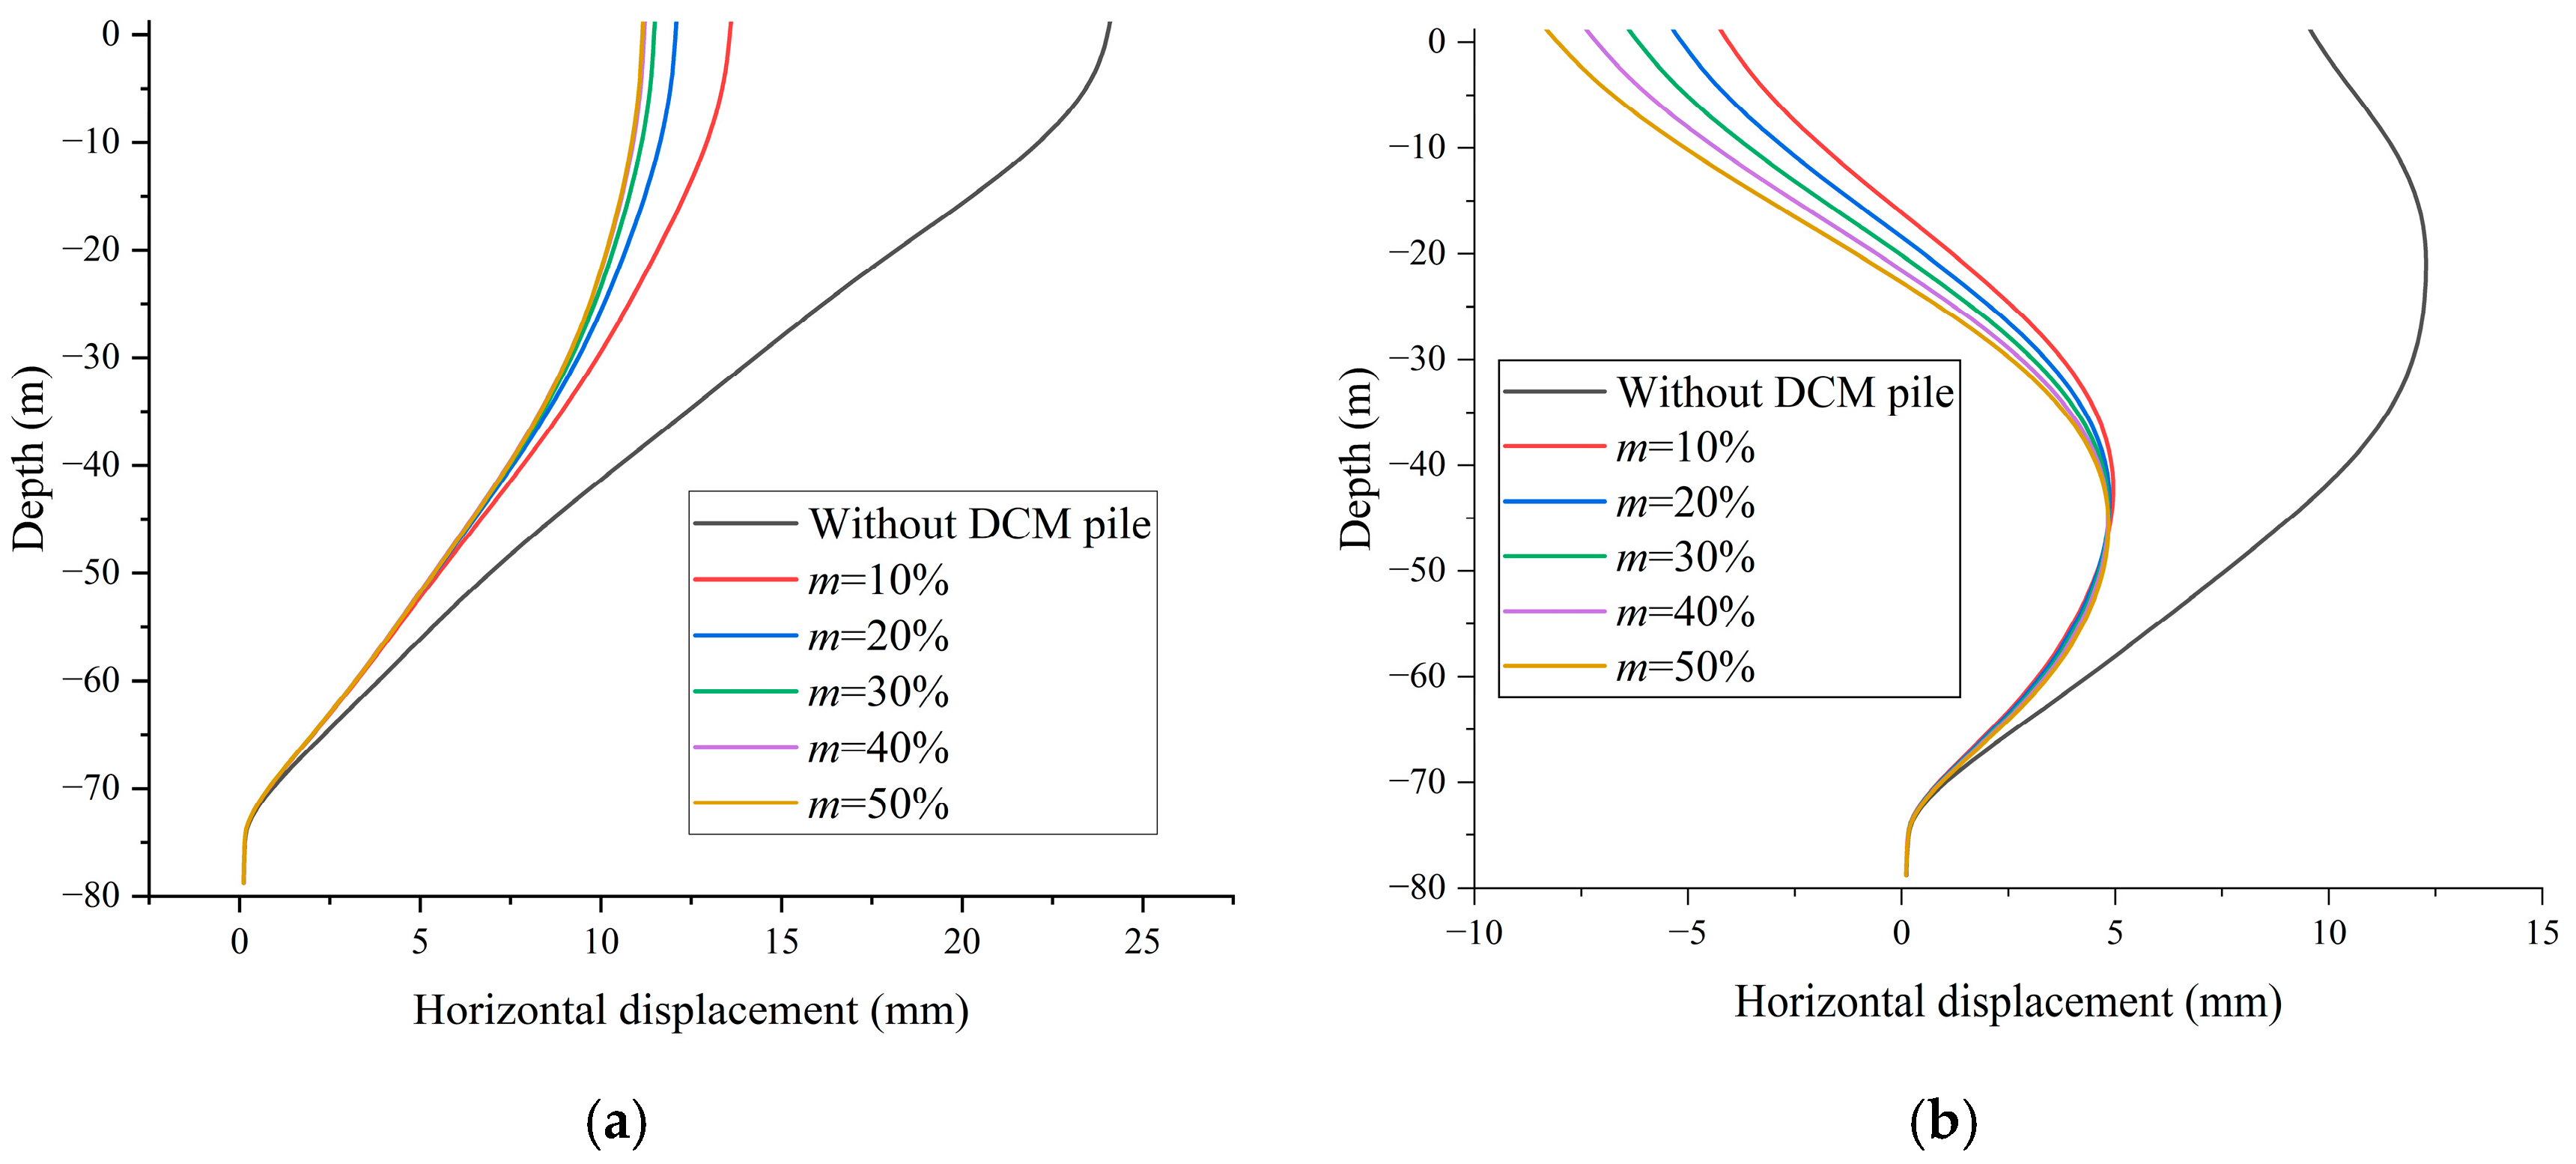
Rogbeck et al. [45] suggested that the area replacement ratio of DCM piles should not be less than 10%. Therefore, in the parametric analysis of m, five replacement ratios (10%, 20%, 30%, 40%, and 50%) were selected while maintaining a constant DCM pile length of 22.15 m in all cases.
Figure 19 demonstrates the influence of varying area replacement ratios (m) on the horizontal displacement of pile P1. Negative horizontal displacement values indicate movement toward the seawall. As shown in the figure, the implementation of DCM piles, even with a minimal replacement ratio of 10%, significantly reduced the horizontal displacement of pile P1 under both 25-day and 7325-day conditions. At 25 days, the maximum horizontal displacement of pile P1 consistently occurred at the pile head and gradually decreased with an increasing m. However, when m exceeded 30%, further increases in the replacement ratio yielded diminishing returns in reducing the maximum horizontal displacement.
At 7325 days, the maximum horizontal displacement of pile P1 under all replacement ratios consistently appeared at approximately −45 m depth, measuring 5 mm, which is markedly smaller than the 12 mm displacement observed in scenarios without DCM piles. Meanwhile, the horizontal displacement at the pile head remained negative (indicating movement toward the seawall), with its magnitude increasing proportionally to the area replacement ratio.

5.2.3. Elastic Modulus of DCM Pile (EDCM)

Yin [46] conducted triaxial tests on marine soft soils mixed with varying cement contents, revealing that the elastic modulus of cement-treated soil ranges from 2.05 MPa to 84.55 MPa. Consequently, in this study, elastic modulus values were selected within this range as follows: 5 MPa, 10 MPa, 20 MPa, 40.5 MPa, 60 MPa, and 80 MPa. The area replacement ratio (m) and pile length (H) of the DCM piles were fixed at 30% and 22.15 m, respectively.
Figure 20 demonstrates the influence of varying elastic moduli of DCM piles on the horizontal displacement of pile P1 at 25 days and 7325 days. At 25 days, the maximum horizontal displacement of pile P1 occurred at the pile head and gradually decreased with the increasing elastic modulus of the DCM piles. However, when the elastic modulus exceeded 40.5 MPa, further increases from 40.5 MPa to 80 MPa resulted in only a marginal reduction of 1.2 mm in the maximum horizontal displacement. This indicates that the elastic modulus had a negligible influence on the horizontal displacement of pile P1 when EDCM exceeded 40.5 MPa.
Figure 20b shows that during the stabilization phase (7325 days), the horizontal displacement–load curves of pile P1 for different DCM pile elastic moduli nearly coincide, with a consistent maximum horizontal displacement of approximately 5 mm. This suggests that the elastic modulus of DCM piles had no discernible effect on the displacement of pile P1 during the long-term stabilization phase. However, compared with the scenario without DCM piles, the maximum horizontal displacement of pile P1 during stabilization decreased significantly by 7 mm.
In summary, increasing the elastic modulus of DCM piles effectively reduced the horizontal displacement of pile P1 during the seawall construction phase. Beyond 40.5 MPa, however, the sensitivity of horizontal displacement to elastic moduli diminished substantially. Notably, variations in the elastic modulus of the DCM piles exhibited no measurable impact on displacement behavior during the stabilization phase.

6. Conclusions

This study systematically revealed the effects of seawall construction on the horizontal deformations of adjacent rock-socketed bridge piles in coastal soft soil areas and the improvement effects of using DCM piles to support embankments through three-dimensional finite element analysis. In contrast to previous studies, which have predominantly focused on the effects of surcharge loading on pile foundation deformation and soft soil improvement on seawall displacement, this study not only analyzes the lateral deformation mechanisms of coastal piles under seawall overloading but also specifically investigates the efficacy of deep cement mixing (DCM)-reinforced soft soils in mitigating the adverse effects of seawall overloading on adjacent pile foundations. This study provides critical insights into time-dependent soil–pile interaction mechanisms and practical guidelines for optimizing coastal infrastructure design to minimize surcharge-induced impacts on adjacent pile foundations. The main conclusions are as follows:
(1)
After seawall completion (25 days), the short-term maximum horizontal displacement of adjacent piles (25 mm) was observed at the pile head. Concurrently, the maximum negative bending moment (380 kN·m) occurred within shallow soft soil layers, while the peak positive bending moment (900 kN·m) developed at the rock–soil interface.
(2)
Following 20 years of soft soil consolidation, the long-term maximum horizontal displacement of adjacent piles diminished to 12 mm, with the displacement peak shifting to the mid-pile region. During this prolonged consolidation phase, the critical negative bending moment migrated to mid-depth silty clay layers, reducing to 190 kN·m. Notably, the rock–soil interface maintained a consistent positive bending moment of approximately 900 kN·m throughout the monitoring period.
(3)
Parametric analysis revealed the limited sensitivity of pile lateral deformation to variations in soft soil permeability coefficients. However, increasing the pile’s stiffness and expanding the seawall–pile clearance distance demonstrated significant efficacy in mitigating both short-term (25-day) and long-term (20-year) horizontal displacements. Notably, displacement reduction through increased spacing exhibited superior performance, achieving over 72% attenuation in maximum lateral displacement.
(4)
Using DCM piles to support the seawall effectively reduces its impact on the horizontal deformations of adjacent piles. Parametric analysis of DCM piles shows that longer DCM pile lengths yield better mitigation effects on short- and long-term deformations of adjacent horizontal piles. Threshold values exist for the area replacement ratio (30%) and elastic modulus (40.5 MPa) in reducing the horizontal displacements of adjacent piles.
A limitation of this study lies in the exclusive consideration of seawall effects on individual piles within pile group foundations, whereas the pile group interaction mechanism was notably omitted. Furthermore, the investigation primarily focused on static load effects on cross-sea bridges, without addressing dynamic loading conditions induced by wind, wave, or seismic actions. Future investigations should incorporate analyses of pile group effects and evaluations of coupled dynamic responses under multi-hazard excitations to enhance the methodological framework.

Author Contributions

Conceptualization, F.H., Z.C., H.D. and W.Z.; methodology, F.H., Z.C., H.D. and W.Z.; software, Z.C. and H.D.; vali-dation, F.H., Z.C. and H.D.; formal analysis, F.H. and Z.C.; investigation, F.H. and Z.C.; resources, H.D. and W.Z.; data curation, F.H. and Z.C.; writing—original draft preparation, F.H., Z.C. and H.D.; writing—review and editing, F.H., Z.C., H.D. and W.Z.; visualization, F.H. and Z.C.; supervision, H.D. and W.Z.; project administration, Z.C., H.D. and W.Z.; funding acquisition, H.D. and W.Z. All authors have read and agreed to the published version of the manuscript.

Funding

This research was funded by the National Natural Science Foundation of China (52208333), the Research Fund for Advanced Ocean Institute of Southeast University (General Program GP202403), and the Major Scientific and Technological R&D Projects of CCCC (Grant Numbers: 2021-ZJKJ-07 and 2023-ZJKJ-01).

Data Availability Statement

The original contributions presented in this study are included in the article. Further inquiries can be directed to the corresponding authors.

Acknowledgments

The authors sincerely appreciate the valuable contributions of the editors and reviewers to this work. We extend our gratitude to the editorial team for their professional guidance and efficient coordination throughout the publication process. Our special thanks go to the anonymous reviewers for their meticulous evaluation, constructive feedback, and insightful suggestions, which significantly strengthened the rigor and clarity of this manuscript. Their expertise and dedication have been instrumental in refining both the technical content and the presentation of this research.

Conflicts of Interest

Authors Fei Huang and Huiyuan Deng were employed by CCCC Highway Consultants Co., Ltd. The remaining authors declare that the research was conducted in the absence of any commercial or financial relationships that could be construed as a potential conflict of interest.

References

  1. Chen, Z.; Deng, H.; Dai, G.; Zhu, M.; Gong, W.; Azadi, M.R. Study on the influence of unsymmetrical surcharge on adjacent pile foundations in a coastal soft soil area. Soil Dyn. Earthq. Eng. 2025, 194, 109365. [Google Scholar] [CrossRef]
  2. Berrill, J.; Christensen, S.; Keenan, R.; Okada, W.; Pettinga, J. Case study of lateral spreading forces on a piled foundation. Geotechnique 2001, 51, 501–517. [Google Scholar] [CrossRef]
  3. Jones, C.A.; Stewart, D.I.; Danilewicz, C.J. Bridge distress caused by approach embankment settlement. Proc. Inst. Civ. Eng.-Geotech. Eng. 2008, 161, 63–74. [Google Scholar] [CrossRef]
  4. De Beer, E. The effects of horizontal loads on piles, due to surcharge or seismic effects. In Proceedings of the 9th ICSMFE, Tokyo, Japan, 10–15 July 1977; pp. 547–558. [Google Scholar]
  5. Asgari, A.; Ahmadtabar Sorkhi, S.F. Wind turbine performance under multi-hazard loads: Wave, wind, and earthquake effects on liquefiable soil. Results Eng. 2025, 26, 104647. [Google Scholar] [CrossRef]
  6. Li, S.; Wei, L.; Niu, J.; Deng, Z.; Wu, B.; Qian, W.; He, F. Time-dependent deviation of bridge pile foundations caused by adjacent large-area surcharge loads in soft soils and its preventive measures. Front. Struct. Civ. Eng. 2024, 18, 184–201. [Google Scholar] [CrossRef]
  7. Li, H.-q.; Wei, L.-m.; Feng, S.-y.; Chen, Z. Behavior of Piles Subjected to Surcharge Loading in Deep Soft Soils: Field Tests. Geotech. Geol. Eng. 2019, 37, 4019–4029. [Google Scholar] [CrossRef]
  8. Yang, M.; Shangguan, S.; Li, W.; Zhu, B. Numerical Study of Consolidation Effect on the Response of Passive Piles Adjacent to Surcharge Load. Int. J. Geomech. 2017, 17, 04017093. [Google Scholar] [CrossRef]
  9. Ye, X.; Wu, J.; Li, G. Time-dependent field performance of PHC pile-cap-beam-supported embankment over soft marine clay. Transp. Geotech. 2021, 26, 100435. [Google Scholar] [CrossRef]
  10. Leoni, M.; Karstunen, M.; Vermeer, P. Anisotropic creep model for soft soils. Géotechnique 2008, 58, 215–226. [Google Scholar] [CrossRef]
  11. Pan, J.L.; Goh, A.T.; Wong, K.S.; Teh, C.I. Model tests on single piles in soft clay. Can. Geotech. J. 2000, 37, 890–897. [Google Scholar] [CrossRef]
  12. Bian, X.; Liang, Y.; Zhao, C.; Dong, L.; Cai, D. Centrifuge testing and numerical modeling of single pile and long-pile groups adjacent to surcharge loads in silt soil. Transp. Geotech. 2020, 25, 100399. [Google Scholar] [CrossRef]
  13. Wang, L.Z.; Chen, K.X.; Hong, Y.; Ng, C.W.W. Effect of consolidation on responses of a single pile subjected to lateral soil movement. Can. Geotech. J. 2015, 52, 769–782. [Google Scholar] [CrossRef]
  14. Ellis, E.; Springman, S. Modelling of soil–structure interaction for a piled bridge abutment in plane strain FEM analyses. Comput. Geotech. 2001, 28, 79–98. [Google Scholar] [CrossRef]
  15. Kelesoglu, M.K.; Springman, S.M. Analytical and 3D numerical modelling of full-height bridge abutments constructed on pile foundations through soft soils. Comput. Geotech. 2011, 38, 934–948. [Google Scholar] [CrossRef]
  16. Koronides, M.; Michailides, C.; Stylianidis, P.; Onoufriou, T. Numerical Study of the Nonlinear Soil–Pile–Structure Interaction Effects on the Lateral Response of Marine Jetties. J. Mar. Sci. Eng. 2024, 12, 2075. [Google Scholar] [CrossRef]
  17. Asgari, A.; Ranjbar, F.; Bagheri, M. Seismic resilience of pile groups to lateral spreading in liquefiable soils: 3D parallel finite element modeling. Structures 2025, 74, 108578. [Google Scholar] [CrossRef]
  18. Wei, G.; Qi, Y.; Chen, C.; Zhang, S.; Qian, C.; Zhou, J. Analysis of the protective effect of setting isolation piles outside the foundation pit on the underpass tunnel side. Transp. Geotech. 2022, 35, 100791. [Google Scholar] [CrossRef]
  19. Wu, P.-C.; Feng, W.-Q.; Yin, J.-H. Numerical study of creep effects on settlements and load transfer mechanisms of soft soil improved by deep cement mixed soil columns under embankment load. Geotext. Geomembr. 2020, 48, 331–348. [Google Scholar] [CrossRef]
  20. Lin, K.Q.; Wong, I.H. Use of Deep Cement Mixing to Reduce Settlements at Bridge Approaches. J. Geotech. Geoenviron. Eng. 1999, 125, 309–320. [Google Scholar] [CrossRef]
  21. Yin, J.-H.; Fang, Z. Physical Modeling of a Footing on Soft Soil Ground with Deep Cement Mixed Soil Columns under Vertical Loading. Mar. Georesour. Geotechnol. 2010, 28, 173–188. [Google Scholar] [CrossRef]
  22. Shen, H.; Li, X.; Duan, R.; Zhao, Y.; Zhao, J.; Che, H.; Liu, G.; Xue, Z.; Yan, C.; Liu, J.; et al. Quality evaluation of ground improvement by deep cement mixing piles via ground-penetrating radar. Nat. Commun. 2023, 14, 3448. [Google Scholar] [CrossRef] [PubMed]
  23. Le Hello, B.; Villard, P. Embankments reinforced by piles and geosynthetics—Numerical and experimental studies dealing with the transfer of load on the soil embankment. Eng. Geol. 2009, 106, 78–91. [Google Scholar] [CrossRef]
  24. Liu, S.-Y.; Du, Y.-J.; Yi, Y.-L.; Puppala, A.J. Field investigations on performance of T-shaped deep mixed soil cement column–supported embankments over soft ground. J. Geotech. Geoenviron. Eng. 2012, 138, 718–727. [Google Scholar] [CrossRef]
  25. Nunez, M.; Briançon, L.; Dias, D. Analyses of a pile-supported embankment over soft clay: Full-scale experiment, analytical and numerical approaches. Eng. Geol. 2013, 153, 53–67. [Google Scholar] [CrossRef]
  26. Liu, S.; Zhang, C.; Liu, Y.; Zhang, D.; Sun, Y.; Zhou, P. Load Transfer and Performance Evaluation of the Composite Foundation Reinforced by Penetrated PCCSs and Partially Penetrated DCM Columns under Embankment Loads. Int. J. Geomech. 2025, 25, 05024014. [Google Scholar] [CrossRef]
  27. Wu, P.-C.; Yin, J.-H.; Feng, W.-Q.; Chen, W.-B. Experimental study on geosynthetic-reinforced sand fill over marine clay with or without deep cement mixed soil columns under different loadings. Undergr. Space 2019, 4, 340–347. [Google Scholar] [CrossRef]
  28. Phutthananon, C.; Jongpradist, P.; Jongpradist, P.; Dias, D.; Jamsawang, P.; Bergado, D.T. Performance-based design optimization of embankments resting on soft soil improved with T-shaped and conventional DCM columns. Acta Geotech. 2021, 16, 3301–3326. [Google Scholar] [CrossRef]
  29. Yapage, N.; Liyanapathirana, D. A parametric study of geosynthetic-reinforced column-supported embankments. Geosynth. Int. 2014, 21, 213–232. [Google Scholar] [CrossRef]
  30. Li, W.; Zhang, J.; Chen, H.; Ni, J.; Zhang, D. Quantitative Study on the Impact of Surcharge on Nearby Foundations. Buildings 2024, 14, 1596. [Google Scholar] [CrossRef]
  31. Ghiasi, V.; Eskandari, S. Comparing a single pile’s axial bearing capacity using numerical modeling and analytical techniques. Results Eng. 2023, 17, 100893. [Google Scholar] [CrossRef]
  32. Jala, Y.; Sawant, V.A.; Mishra, A. Development of p-y curves from numerical study of long piles in sandy slope. Ocean Eng. 2025, 319, 120275. [Google Scholar] [CrossRef]
  33. Jamsawang, P.; Yoobanpot, N.; Thanasisathit, N.; Voottipruex, P.; Jongpradist, P. Three-dimensional numerical analysis of a DCM column-supported highway embankment. Comput. Geotech. 2016, 72, 42–56. [Google Scholar] [CrossRef]
  34. Brinkgreve, R.; Kumarswamy, S.; Swolfs, W.; Waterman, D.; Chesaru, A.; Bonnier, P. PLAXIS 2016; PLAXIS Bv: Delft, The Netherlands, 2016; pp. 1–16. [Google Scholar]
  35. Ren, Y.; Chen, Z.; Zhu, W. A Numerical Study of the Lateral Load-Sharing Mechanism of the Pile Cap in a 3 × 3 Pile Group. Buildings 2025, 15, 1431. [Google Scholar] [CrossRef]
  36. Abu-Farsakh, M.; Souri, A.; Voyiadjis, G.; Rosti, F. Comparison of static lateral behavior of three pile group configurations using three-dimensional finite element modeling. Can. Geotech. J. 2018, 55, 107–118. [Google Scholar] [CrossRef]
  37. Yoo, C. Interaction between tunneling and bridge foundation—A 3D numerical investigation. Comput. Geotech. 2013, 49, 70–78. [Google Scholar] [CrossRef]
  38. Tschuchnigg, F.; Schweiger, H. The embedded pile concept–Verification of an efficient tool for modelling complex deep foundations. Comput. Geotech. 2015, 63, 244–254. [Google Scholar] [CrossRef]
  39. Shen, B.; Mao, D.; Ding, Y.; Wang, L.; Li, Z. A numerical analysis of inclination and rectification of ramp-bridge piers adjacent to surcharge load in soft clay area. Sci. Rep. 2023, 13, 9614. [Google Scholar] [CrossRef]
  40. Jamsawang, P.; Bergado, D.T.; Voottipruex, P. Chapter 2—Full-Scale Tests on Stiffened Deep Cement Mixing Piles Including Three-Dimensional Finite Element Simulation. In Ground Improvement Case Histories; Indraratna, B., Chu, J., Rujikiatkamjorn, C., Eds.; Butterworth-Heinemann: Oxford, UK, 2015; pp. 31–77. [Google Scholar]
  41. Tyagi, A.; Zulkefli, M.F.B.; Pan, Y.; Goh, S.-H.; Lee, F.-H. Failure Modes of Tunnels with Improved Soil Surrounds. J. Geotech. Geoenviron. Eng. 2017, 143, 04017088. [Google Scholar] [CrossRef]
  42. Rashid, A.S.; Faizi, K.; Armaghani, D.J.; Nazir, R. Deformation Model of Deep Soil Mixing Using Finite Element Method. J. Teknol. (Sci. Eng.) 2015, 74, 165–170. [Google Scholar] [CrossRef]
  43. Wijerathna, M.; Liyanapathirana, D.S. Numerical Simulation of DCM Column-Supported Embankments Using Simplified Plane-Strain Models; Springer: Singapore, 2018; pp. 434–441. [Google Scholar]
  44. Yapage, N.N.S.; Liyanapathirana, D.S.; Kelly, R.B.; Poulos, H.G.; Leo, C.J. Numerical Modeling of an Embankment over Soft Ground Improved with Deep Cement Mixed Columns: Case History. J. Geotech. Geoenviron. Eng. 2014, 140, 04014062. [Google Scholar] [CrossRef]
  45. Rogbeck, Y. Reinforced piled embankments in Sweden-design aspects. In Proceedings of the 6th International Conference on Geosynthetics, Atlanta, GA, USA, 25–29 March 1998. [Google Scholar]
  46. Yin, J.-H. Stress-strain-strength characteristics of soft Hong Kong marine deposits without or with cement treatment. Lowl. Technol. Int. 2001, 3, 1–13. [Google Scholar]
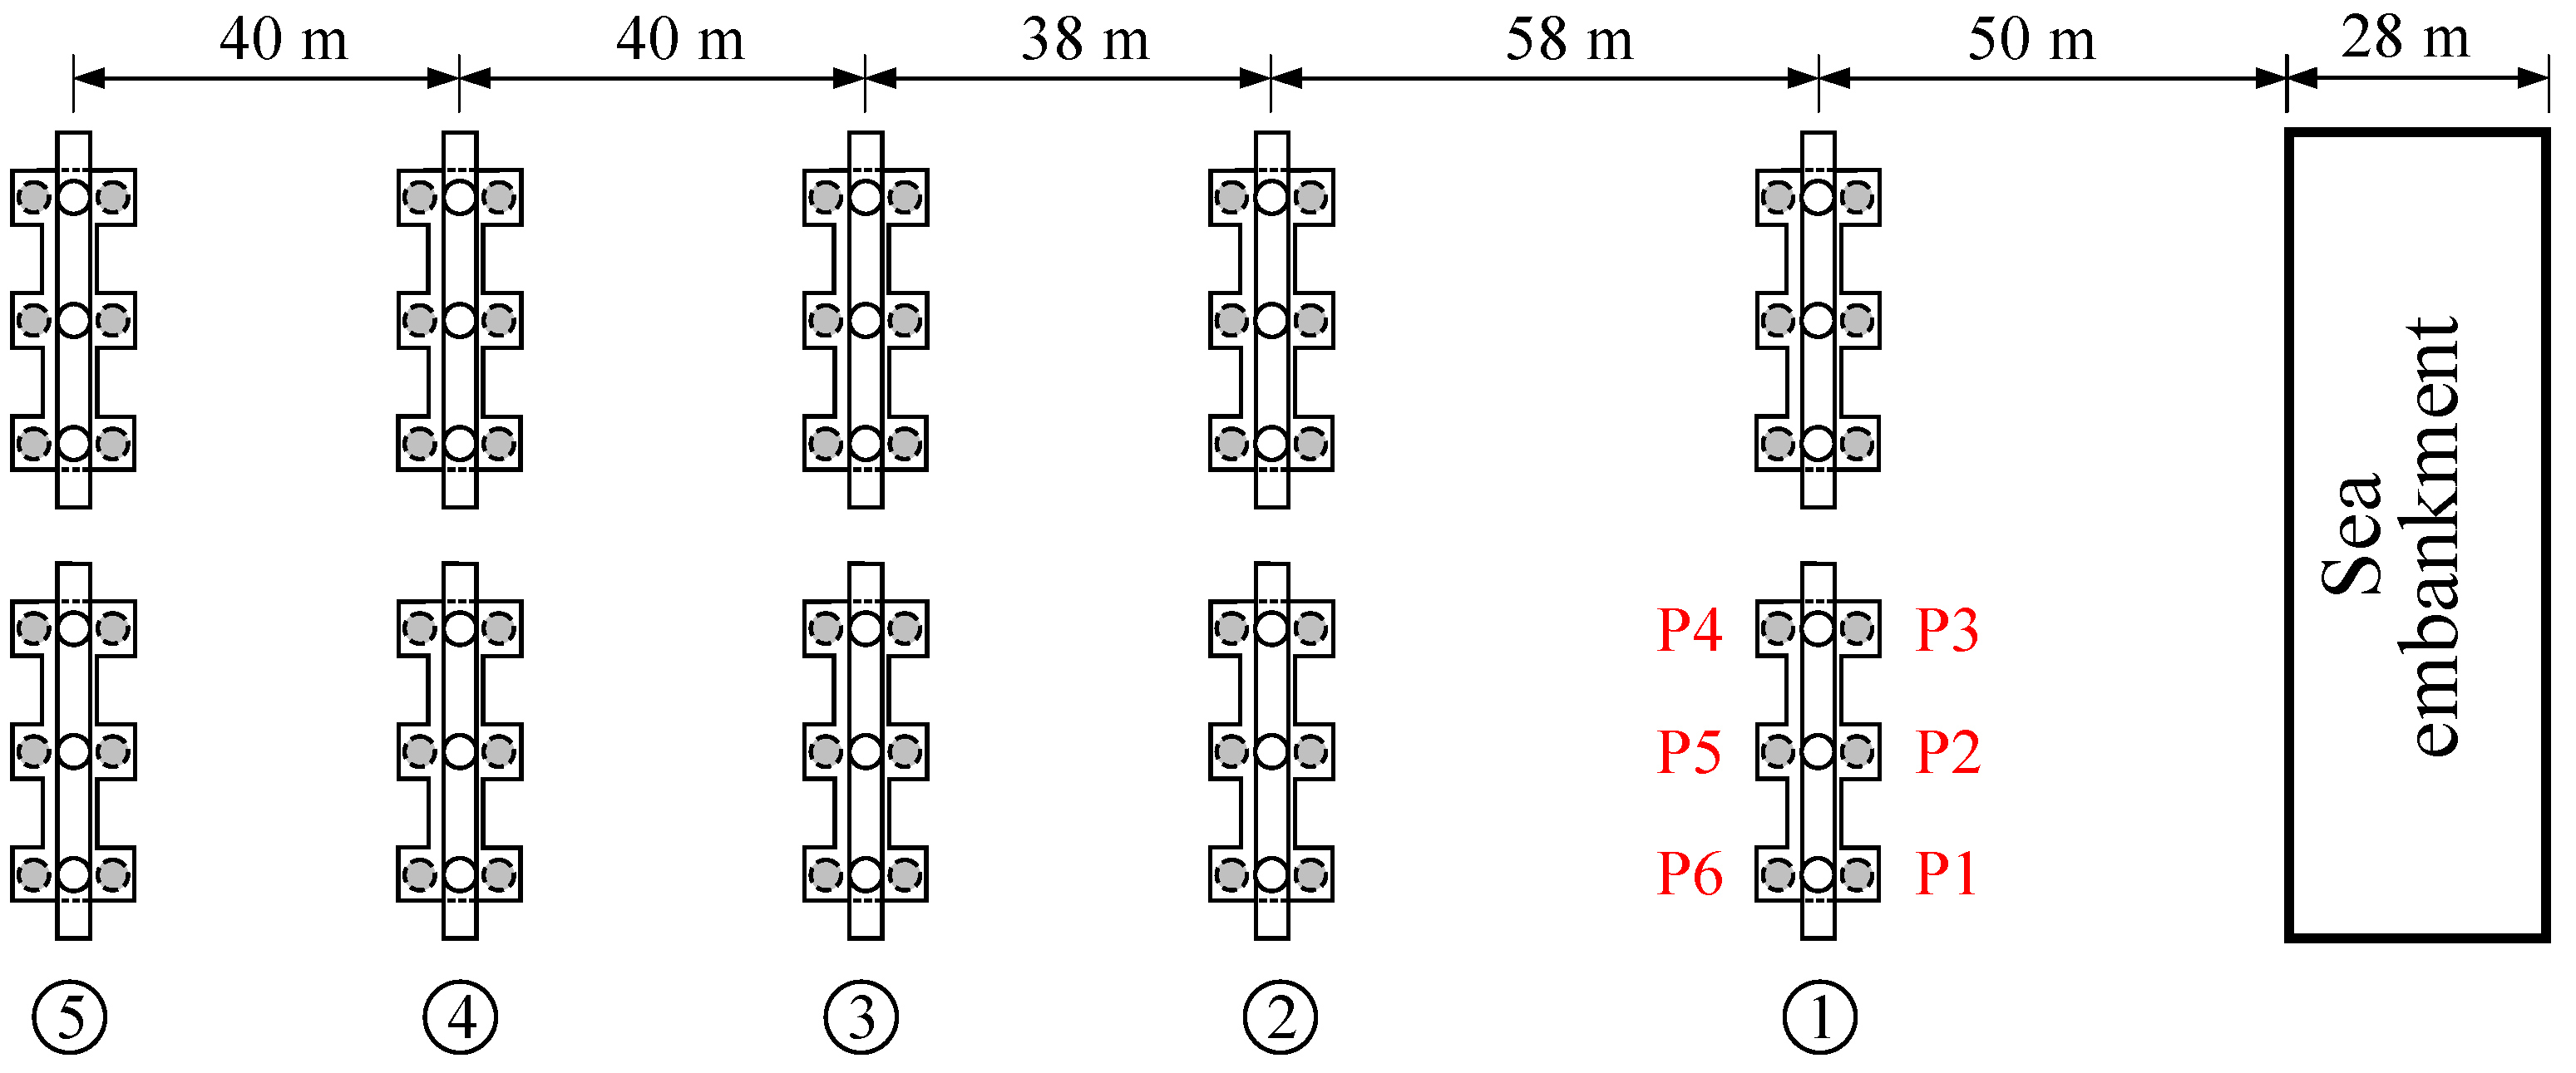
Figure 1. Schematic plan view of bridge and seawall.
Buildings 15 01936 g001
Figure 2. Geological cross-section diagram.
Buildings 15 01936 g002
Figure 3. Schematic diagram of bridge pier and seawall. (a) Bridge pier; (b) seawall.
Buildings 15 01936 g003
Figure 4. Schematic representation of finite element model.
Buildings 15 01936 g004
Figure 5. Comparison of measured horizontal displacements and finite element simulation results.
Buildings 15 01936 g005
Figure 6. Contour map of horizontal displacement at day 25.
Buildings 15 01936 g006
Figure 7. Contour map of horizontal displacement at day 755.
Buildings 15 01936 g007
Figure 8. Time-history horizontal displacement curve at pile head of Pier ①.
Buildings 15 01936 g008
Figure 9. Horizontal displacement of piles at different stages. (a) Corner pile P1; (b) side pile P2.
Buildings 15 01936 g009
Figure 10. Bending moment of piles at different stages. (a) Corner pile P1; (b) side pile P2.
Buildings 15 01936 g010
Figure 11. Horizontal displacement of P1 with permeability coefficients. (a) Day 25; (b) day 7325.
Buildings 15 01936 g011
Figure 12. Bending moment of P1 with different permeability coefficients. (a) Day 25; (b) day 7325.
Buildings 15 01936 g012
Figure 13. Horizontal displacement of P1 with different stiffnesses. (a) Day 25; (b) day 7325.
Buildings 15 01936 g013
Figure 14. Bending moment of P1 with different stiffnesses. (a) Day 25; (b) day 7325.
Buildings 15 01936 g014
Figure 15. Horizontal displacement of P1 under varying seawall–pile distances. (a) Day 25; (b) day 7325.
Buildings 15 01936 g015
Figure 16. Bending moment of P1 under varying seawall–pile distances. (a) Day 25; (b) day 7325.
Buildings 15 01936 g016
Figure 17. Calculation schematic of area replacement ratio and equivalent diameter parameters of (DCM) pile.
Buildings 15 01936 g017
Figure 18. Horizontal displacement of P1 with varying DCM pile lengths. (a) Day 25; (b) day 7325.
Buildings 15 01936 g018
Figure 19. Horizontal displacement of P1 under varying DCM pile area replacement ratios. (a) Day 25; (b) day 7325.
Buildings 15 01936 g019
Figure 20. Horizontal displacement of P1 under varying DCM pile elastic moduli. (a) Day 25; (b) day 7325.
Buildings 15 01936 g020
Table 1. Geotechnical parameters.
Soil γ (kN/m3)Es
(kPa)
Cohesion
c (kPa)
Friction Angle
φ (°)
Permeability Coefficient
k (m/d)
Mucky clay17.9272012.39.00.423 × 10−3
Mucky silty clay18.3266013.710.30.588 × 10−3
Silty clay-119.0472034.311.58.640 × 10−3
Silty clay-219.7605055.615.88.640 × 10−3
Silty clay-320.1712051.415.88.640 × 10−3
Ignimbrite22.2300.040.0
Table 2. Soil parameters utilized in finite element analysis.
SoilMucky ClayMucky Silty ClaySilty ClaySilty ClaySilty ClayIgnimbrite
Constitutive ModelHSHSHSHSHSMohr–Coulomb
γ (kN/m3)17.918.319.019.720.122
E (kPa)1 × 10⁶
ν0.20.20.20.20.20.3
E 50 ref (kPa)27202660472060507120
E oed ref (kPa)27202660472060507120
E ur ref (kPa)13,60013,30023,60030,25035,600
m0.800.800.750.750.75
p ref (kPa)100100100100100
c (kPa)12.313.734.355.651.4300
φ (°)9.010.311.515.815.840
Table 3. Structural parameters employed in finite element analysis.
Structures γ (kN/m3)E (MPa)νc (kPa)φ (°)
Pile2531.5 × 1030.15--
Pile cap, column, and crossbeam33.5 × 103
Seawall20200.253020
Table 4. Equivalent parameters used in finite element analysis.
γ e
(kN/m3)
Ee
(MPa)
νce
(kPa)
φe
(°)
k
(m/d)
DCM pile in mucky silty clay2014.050.1535.6939.00.588 × 10−3
DCM pile in silty clay2015.450.1550.1139.28.640 × 10−3
Disclaimer/Publisher’s Note: The statements, opinions and data contained in all publications are solely those of the individual author(s) and contributor(s) and not of MDPI and/or the editor(s). MDPI and/or the editor(s) disclaim responsibility for any injury to people or property resulting from any ideas, methods, instructions or products referred to in the content.