
Study on the Influence and Optimization of Skylight Daylighting Spatial Form on Light and Thermal Performance in Shallow Buried Subway Stations: A Case Study of Shanghai


Abstract
1. Introduction
2. Methodology
2.1. Field Investigation
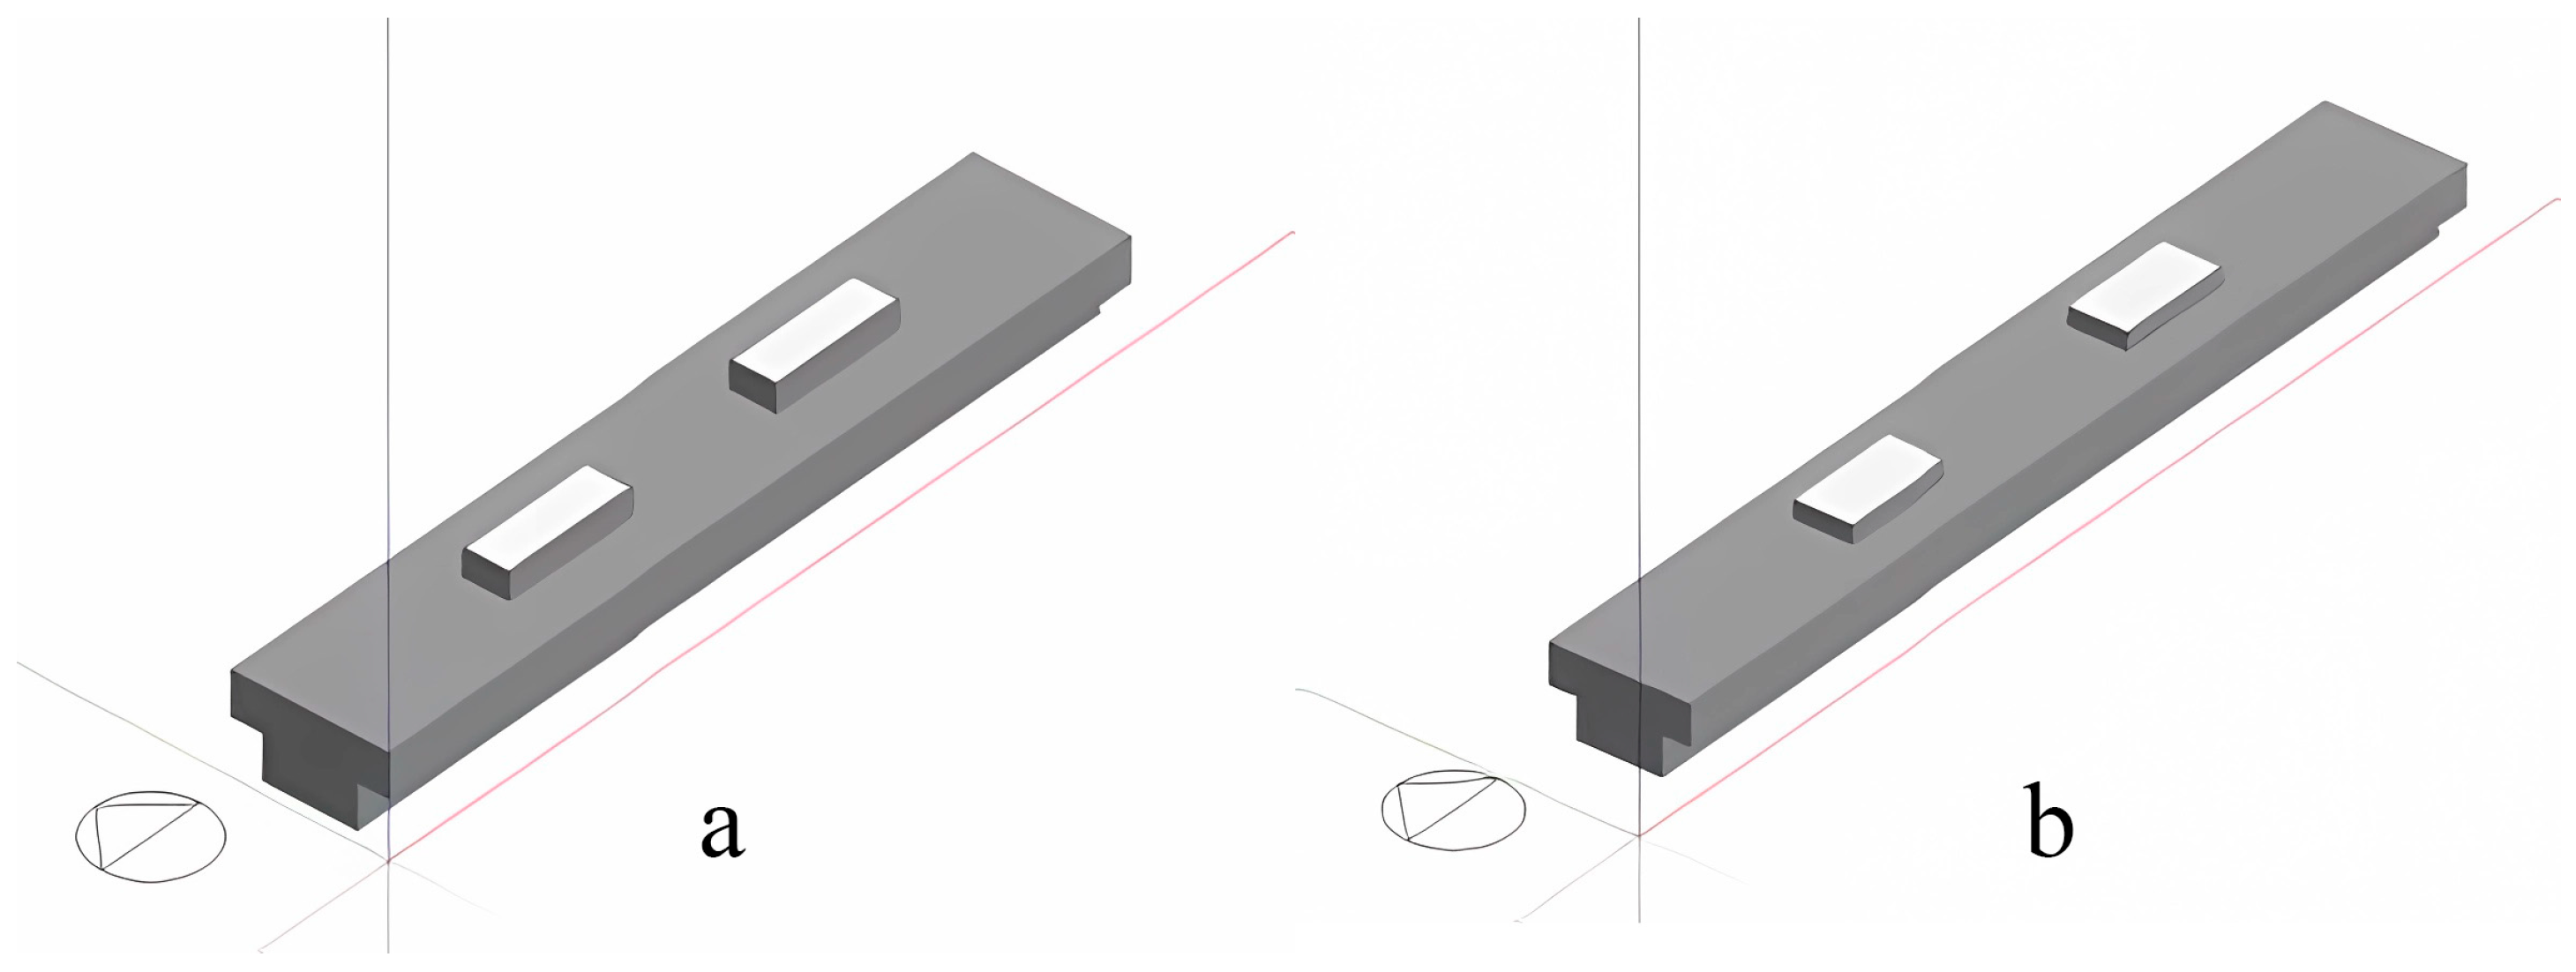
2.1.1. Investigation of Spatial Features and Form Parameterization
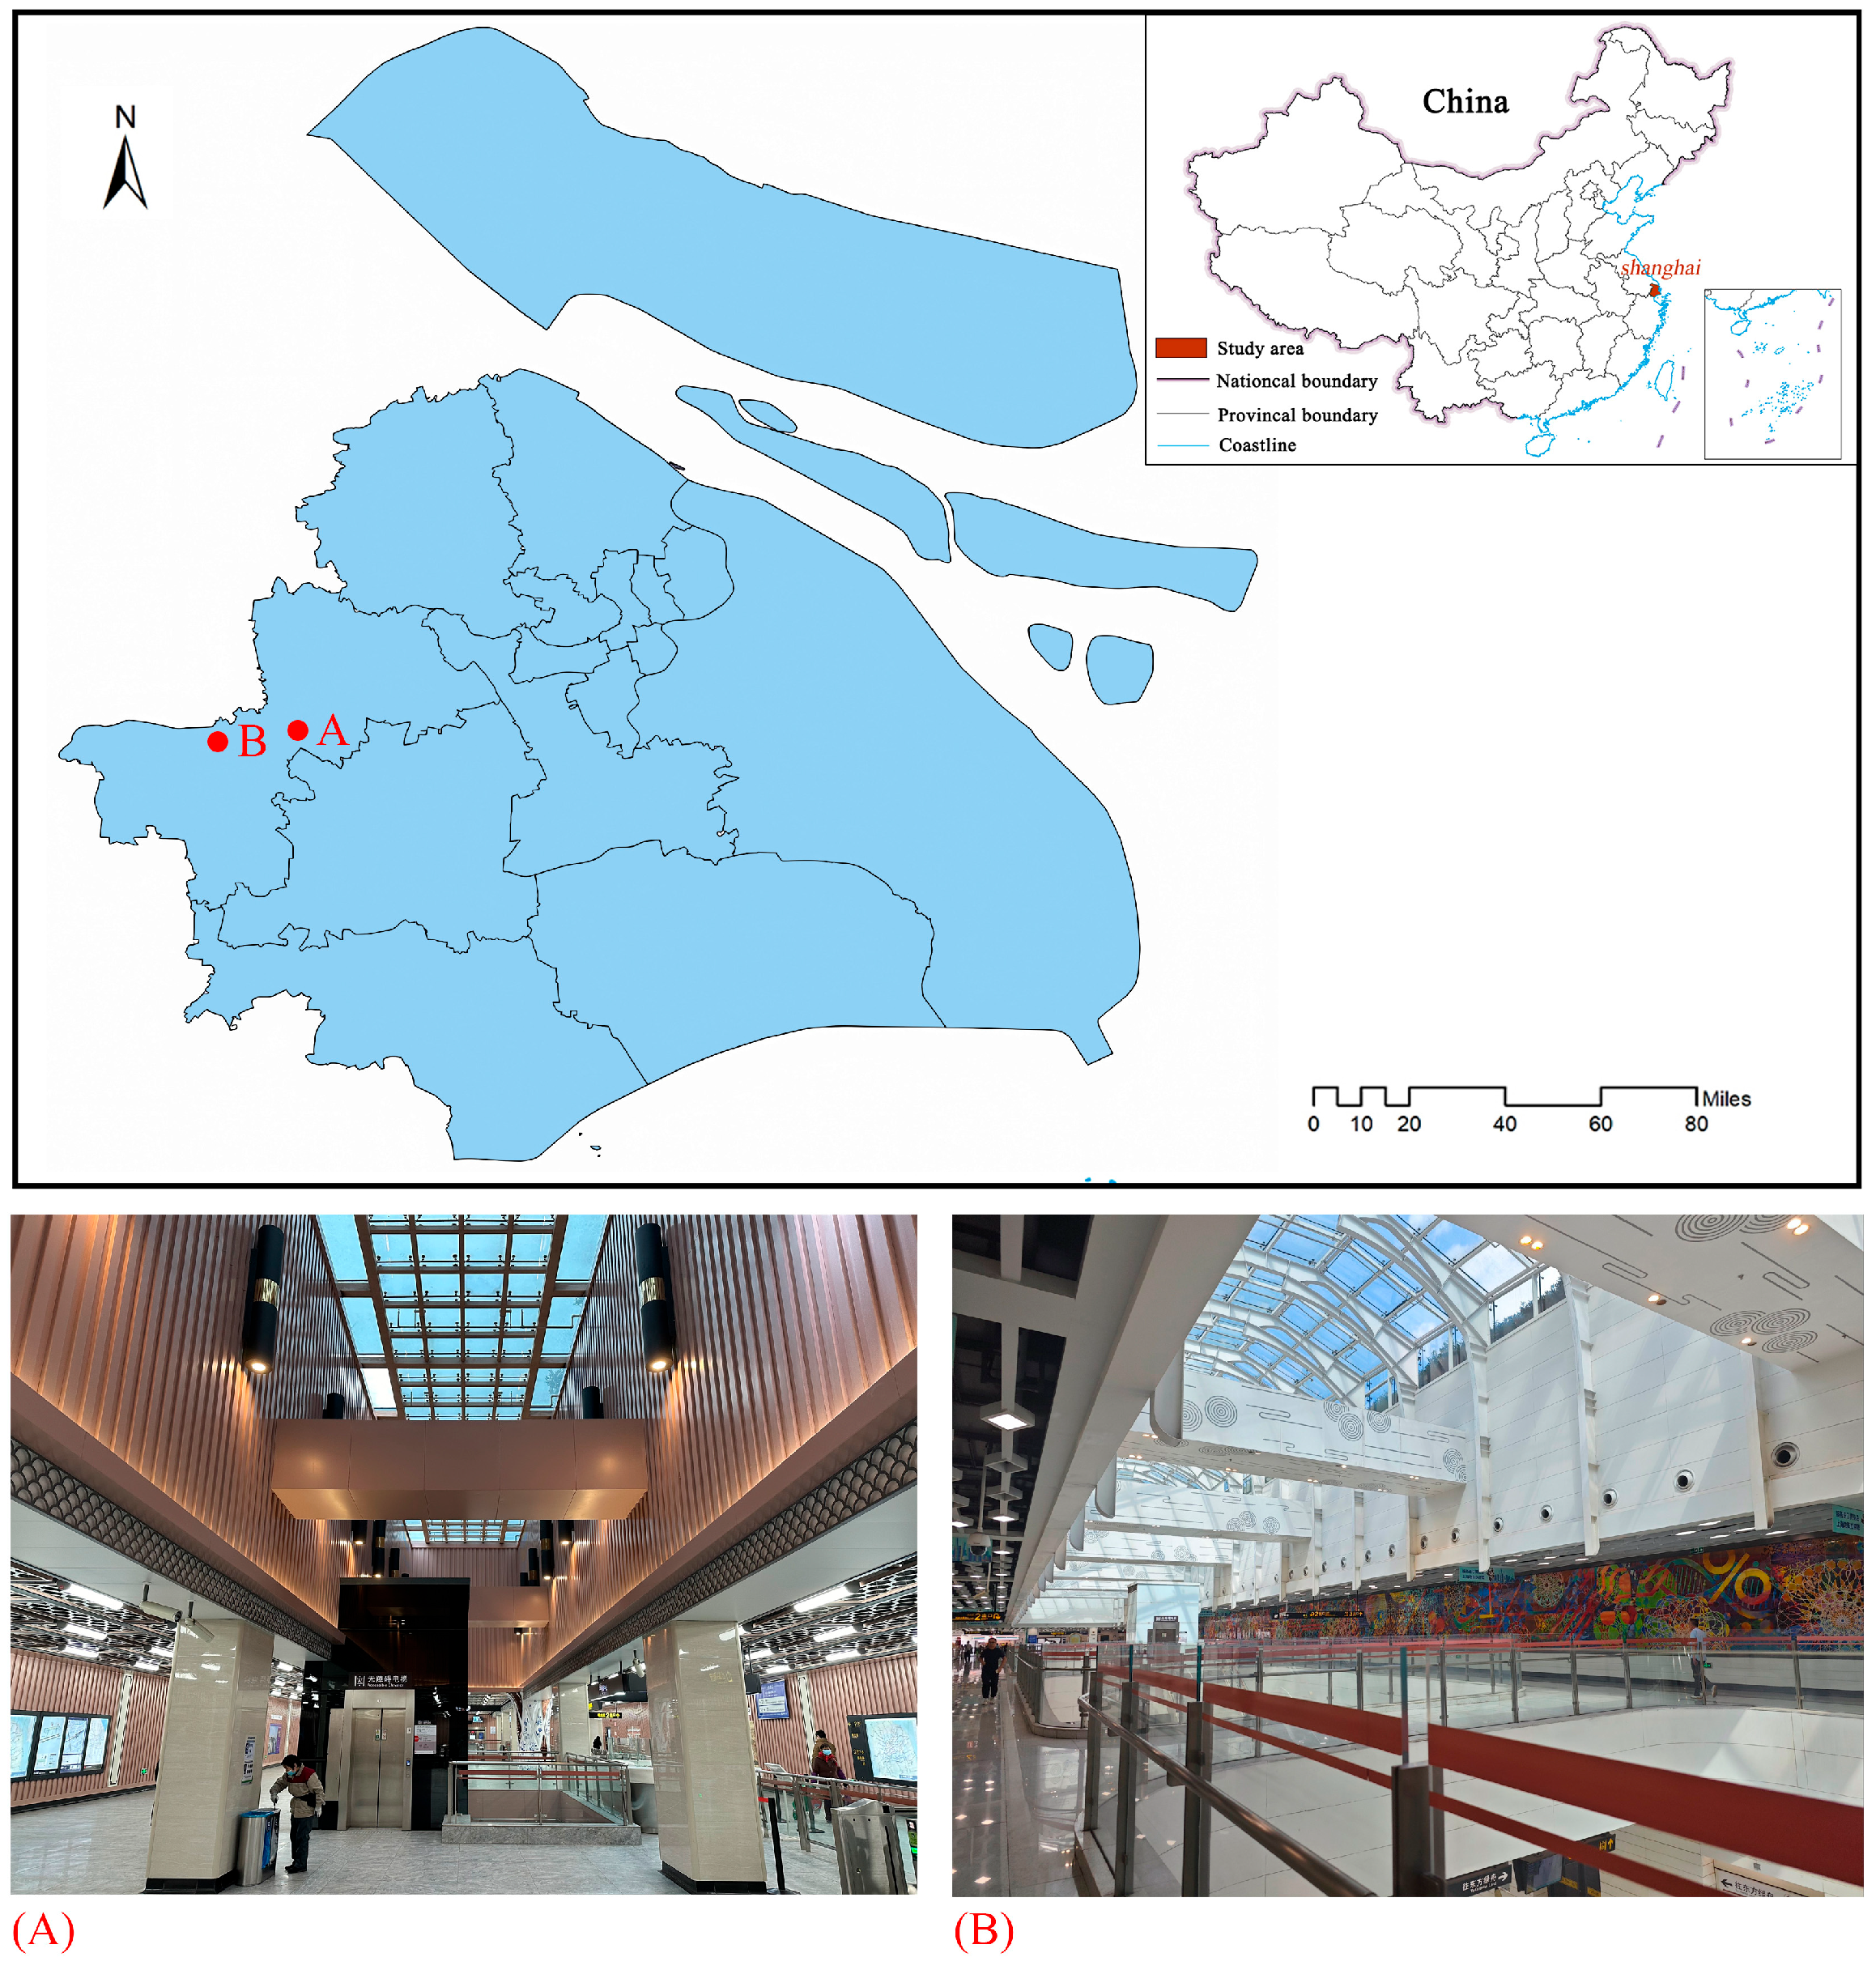
2.1.2. Site for Field Measurement
2.1.3. Time and Content of the Field Test
2.1.4. Test Instruments and Position of Test Points
2.2. Simulation of Light and Thermal Environment
2.2.1. Simulation of Light Environment
2.2.2. Simulation of Energy Consumption and Thermal Environment
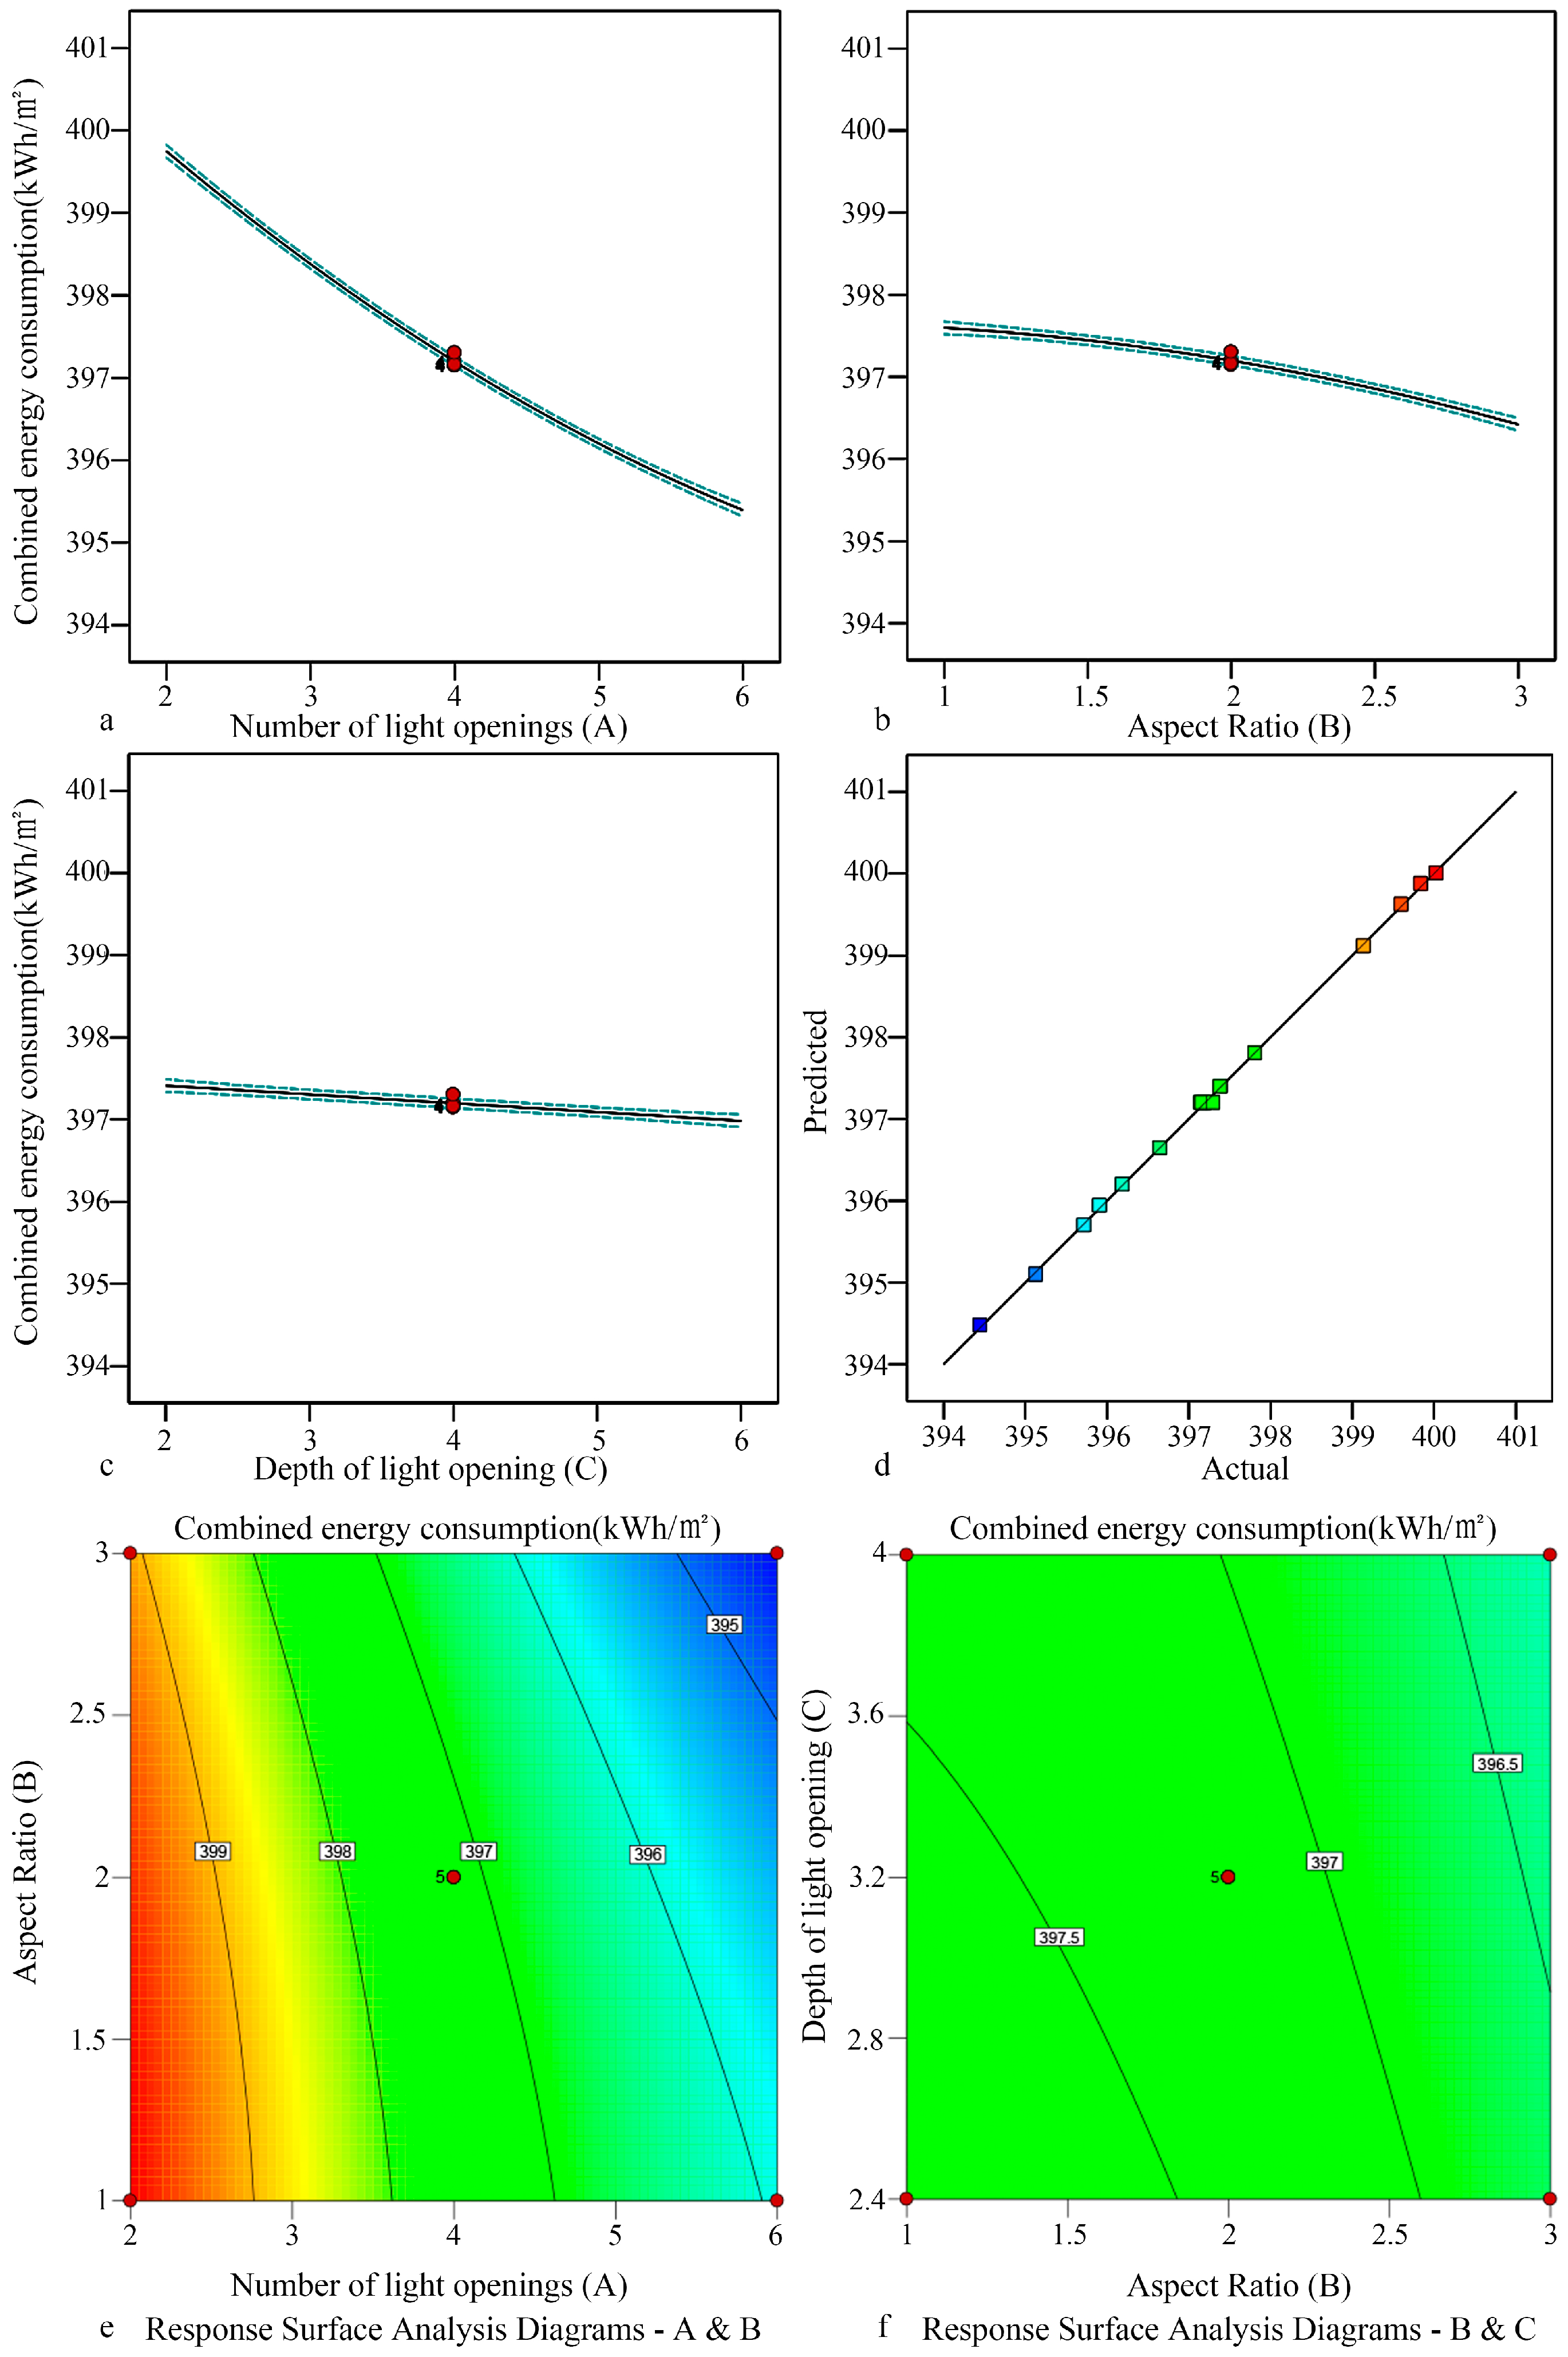
2.3. Response Surface Methodology
2.4. Comparison Between Simulated and Field Test Data
3. Results and Discussion
3.1. Field Test Results
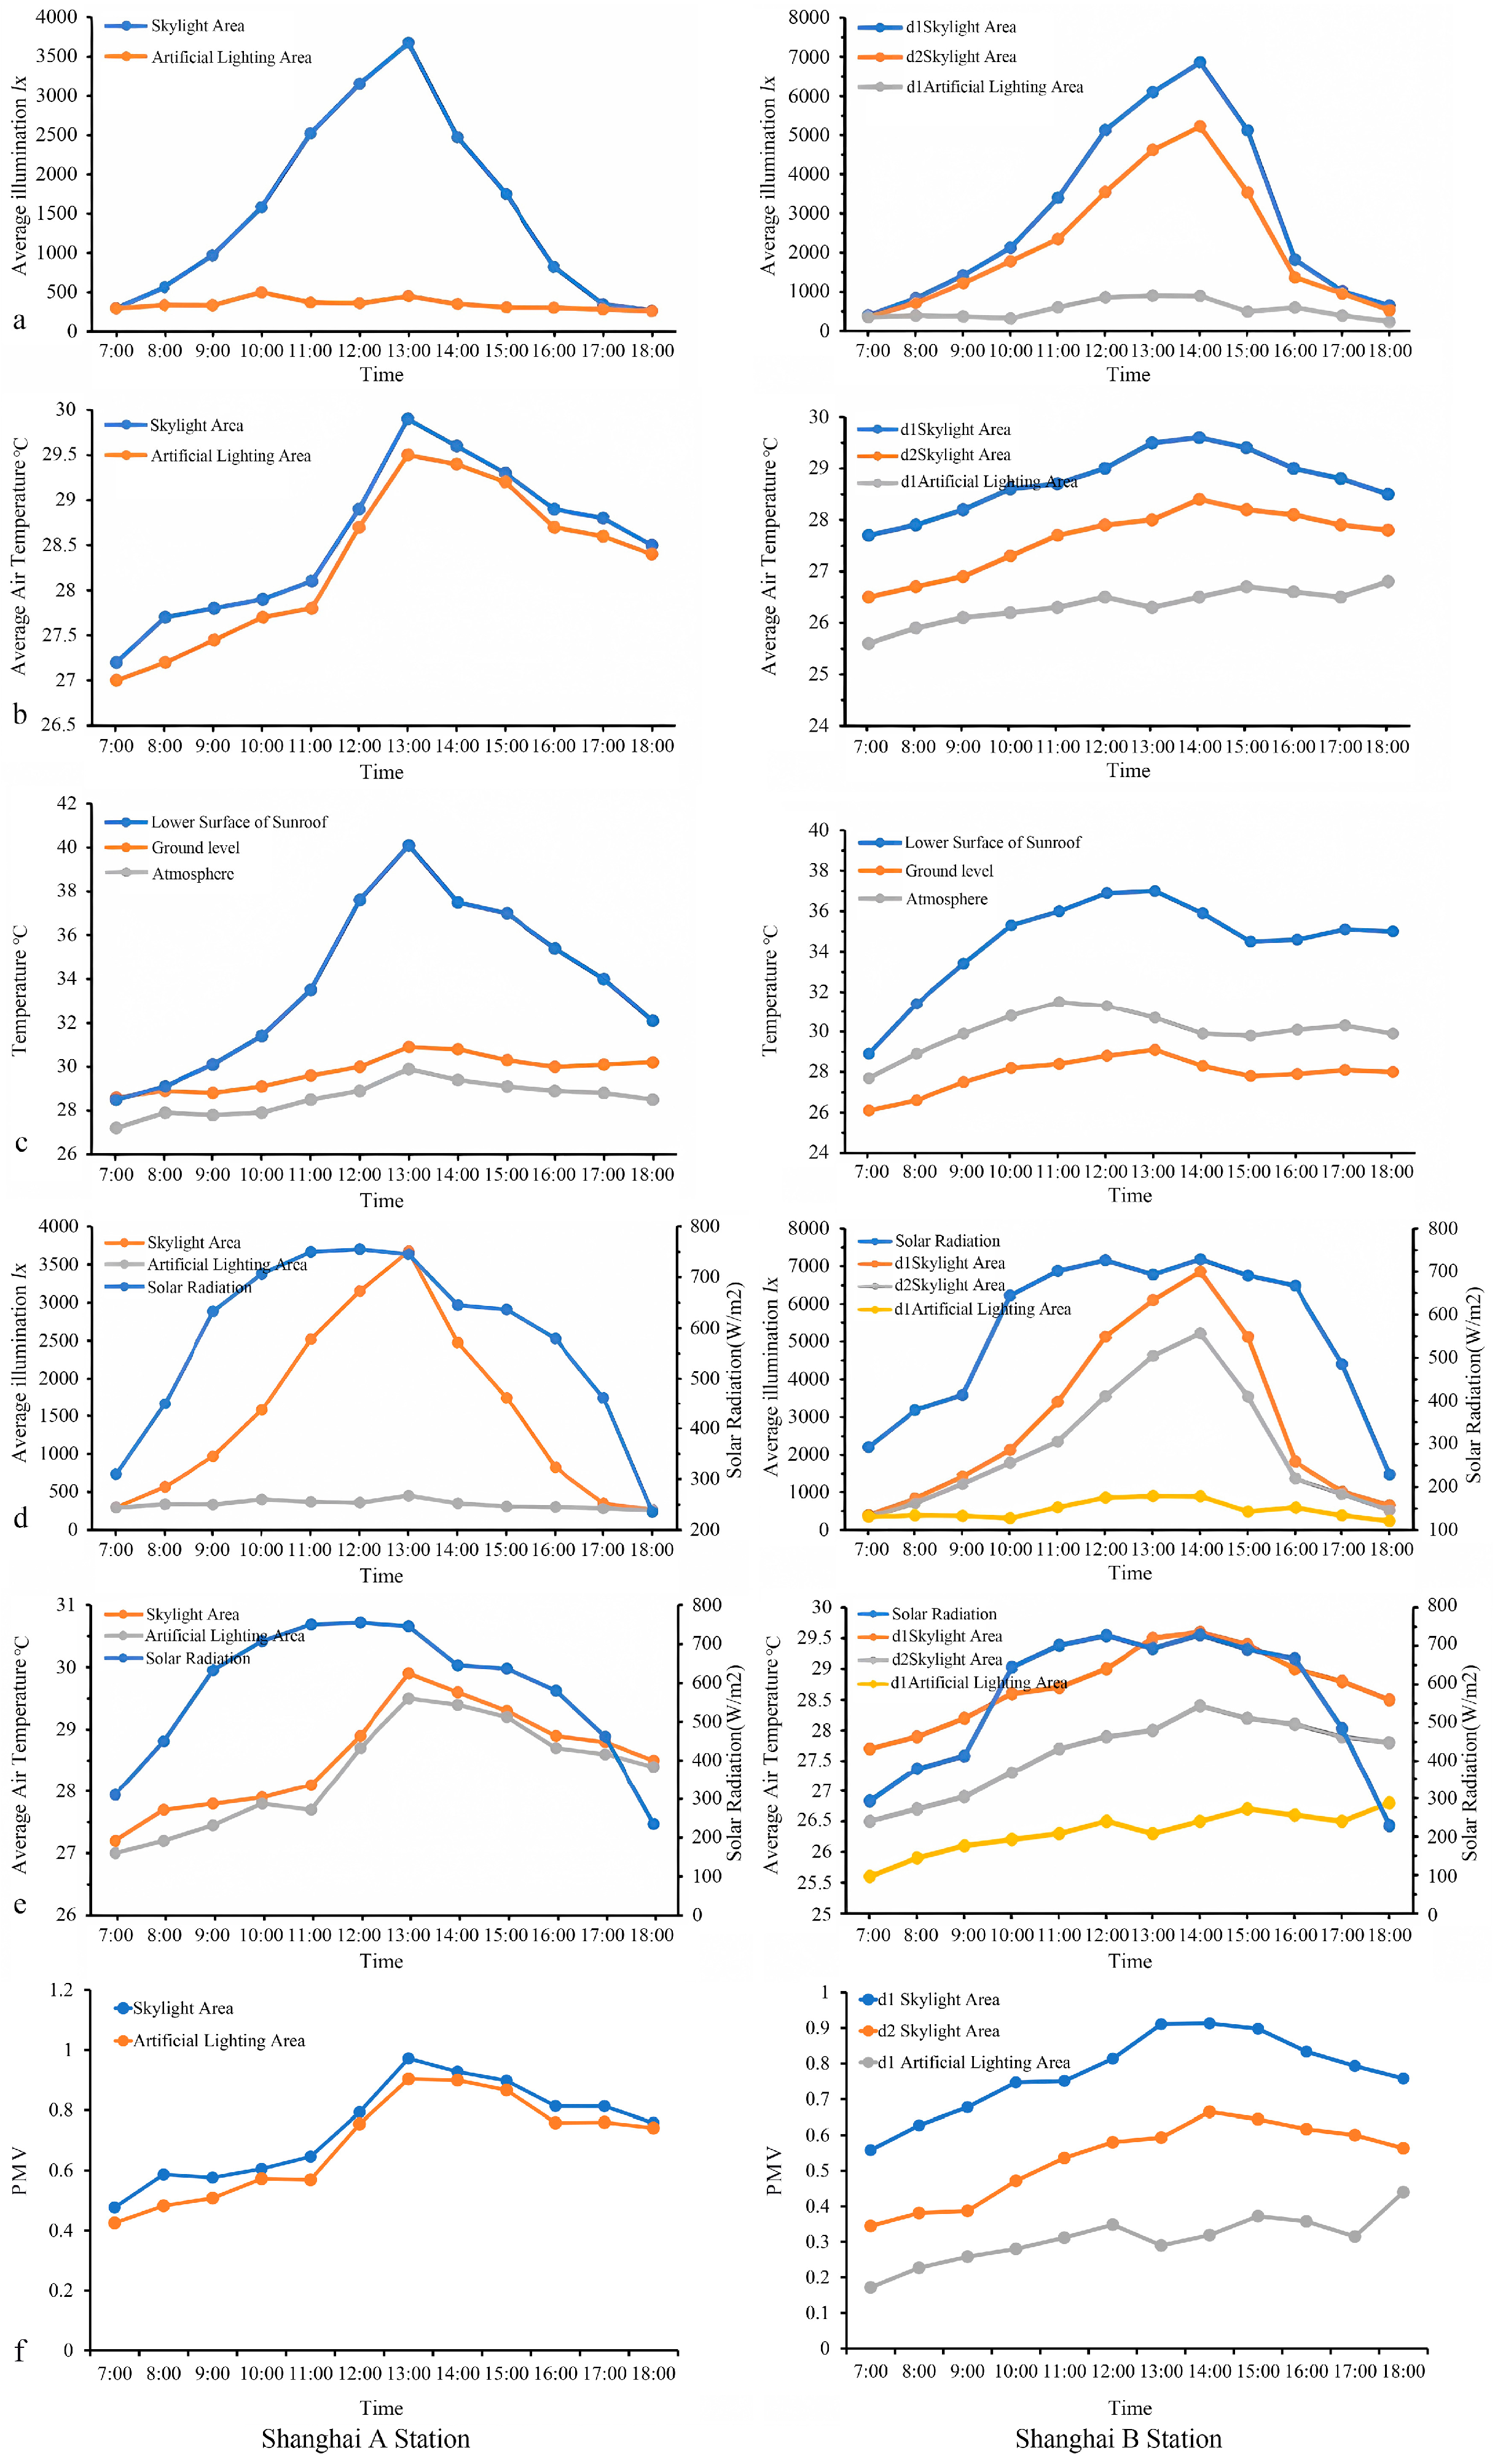
3.1.1. Summer Experimental Results
- 1.
- Analysis of illumination
- 2.
- Analysis of air temperature
- 3.
- Analysis of surface and air temperature
- 4.
- Relation between outdoor solar radiation and indoor illumination
- 5.
- Relationship between outdoor solar radiation and indoor air temperature
- 6.
- Indoor PMV Analysis
3.1.2. Winter Experimental Results
- 1.
- Analysis of indoor illumination
- 2.
- Analysis of indoor air temperature
- 3.
- Analysis of surface and air temperature
- 4.
- Relation between outdoor solar radiation and indoor illumination
- 5.
- Relationship between outdoor solar radiation and indoor air temperature
- 6.
- Indoor PMV Analysis
3.1.3. Comparison of Test Results Between the Two Stations
3.2. Simulation Results
3.2.1. Influence of Daylighting Spatial Form on Light and Thermal Performance in the Partitioned Public Area
- 1.
- Decentralized flat roof skylight
- 2.
- Decentralized double slope roof skylight
- 3.
- Centralized flat roof skylight
- 4.
- Centralized double slope roof skylight
- 5.
- Centralized arched roof skylight
3.2.2. Influence of Daylighting Spatial Form on Light and Thermal Performance in the Open Atrium-Type Public Area
- 1.
- Decentralized flat roof skylight
- 2.
- Decentralized double slope roof skylight
- 3.
- Centralized flat roof skylight
- 4.
- Centralized double slope roof skylight
- 5.
- Centralized arched roof skylight
3.2.3. Comparison of Simulation Results Between the Two Stations
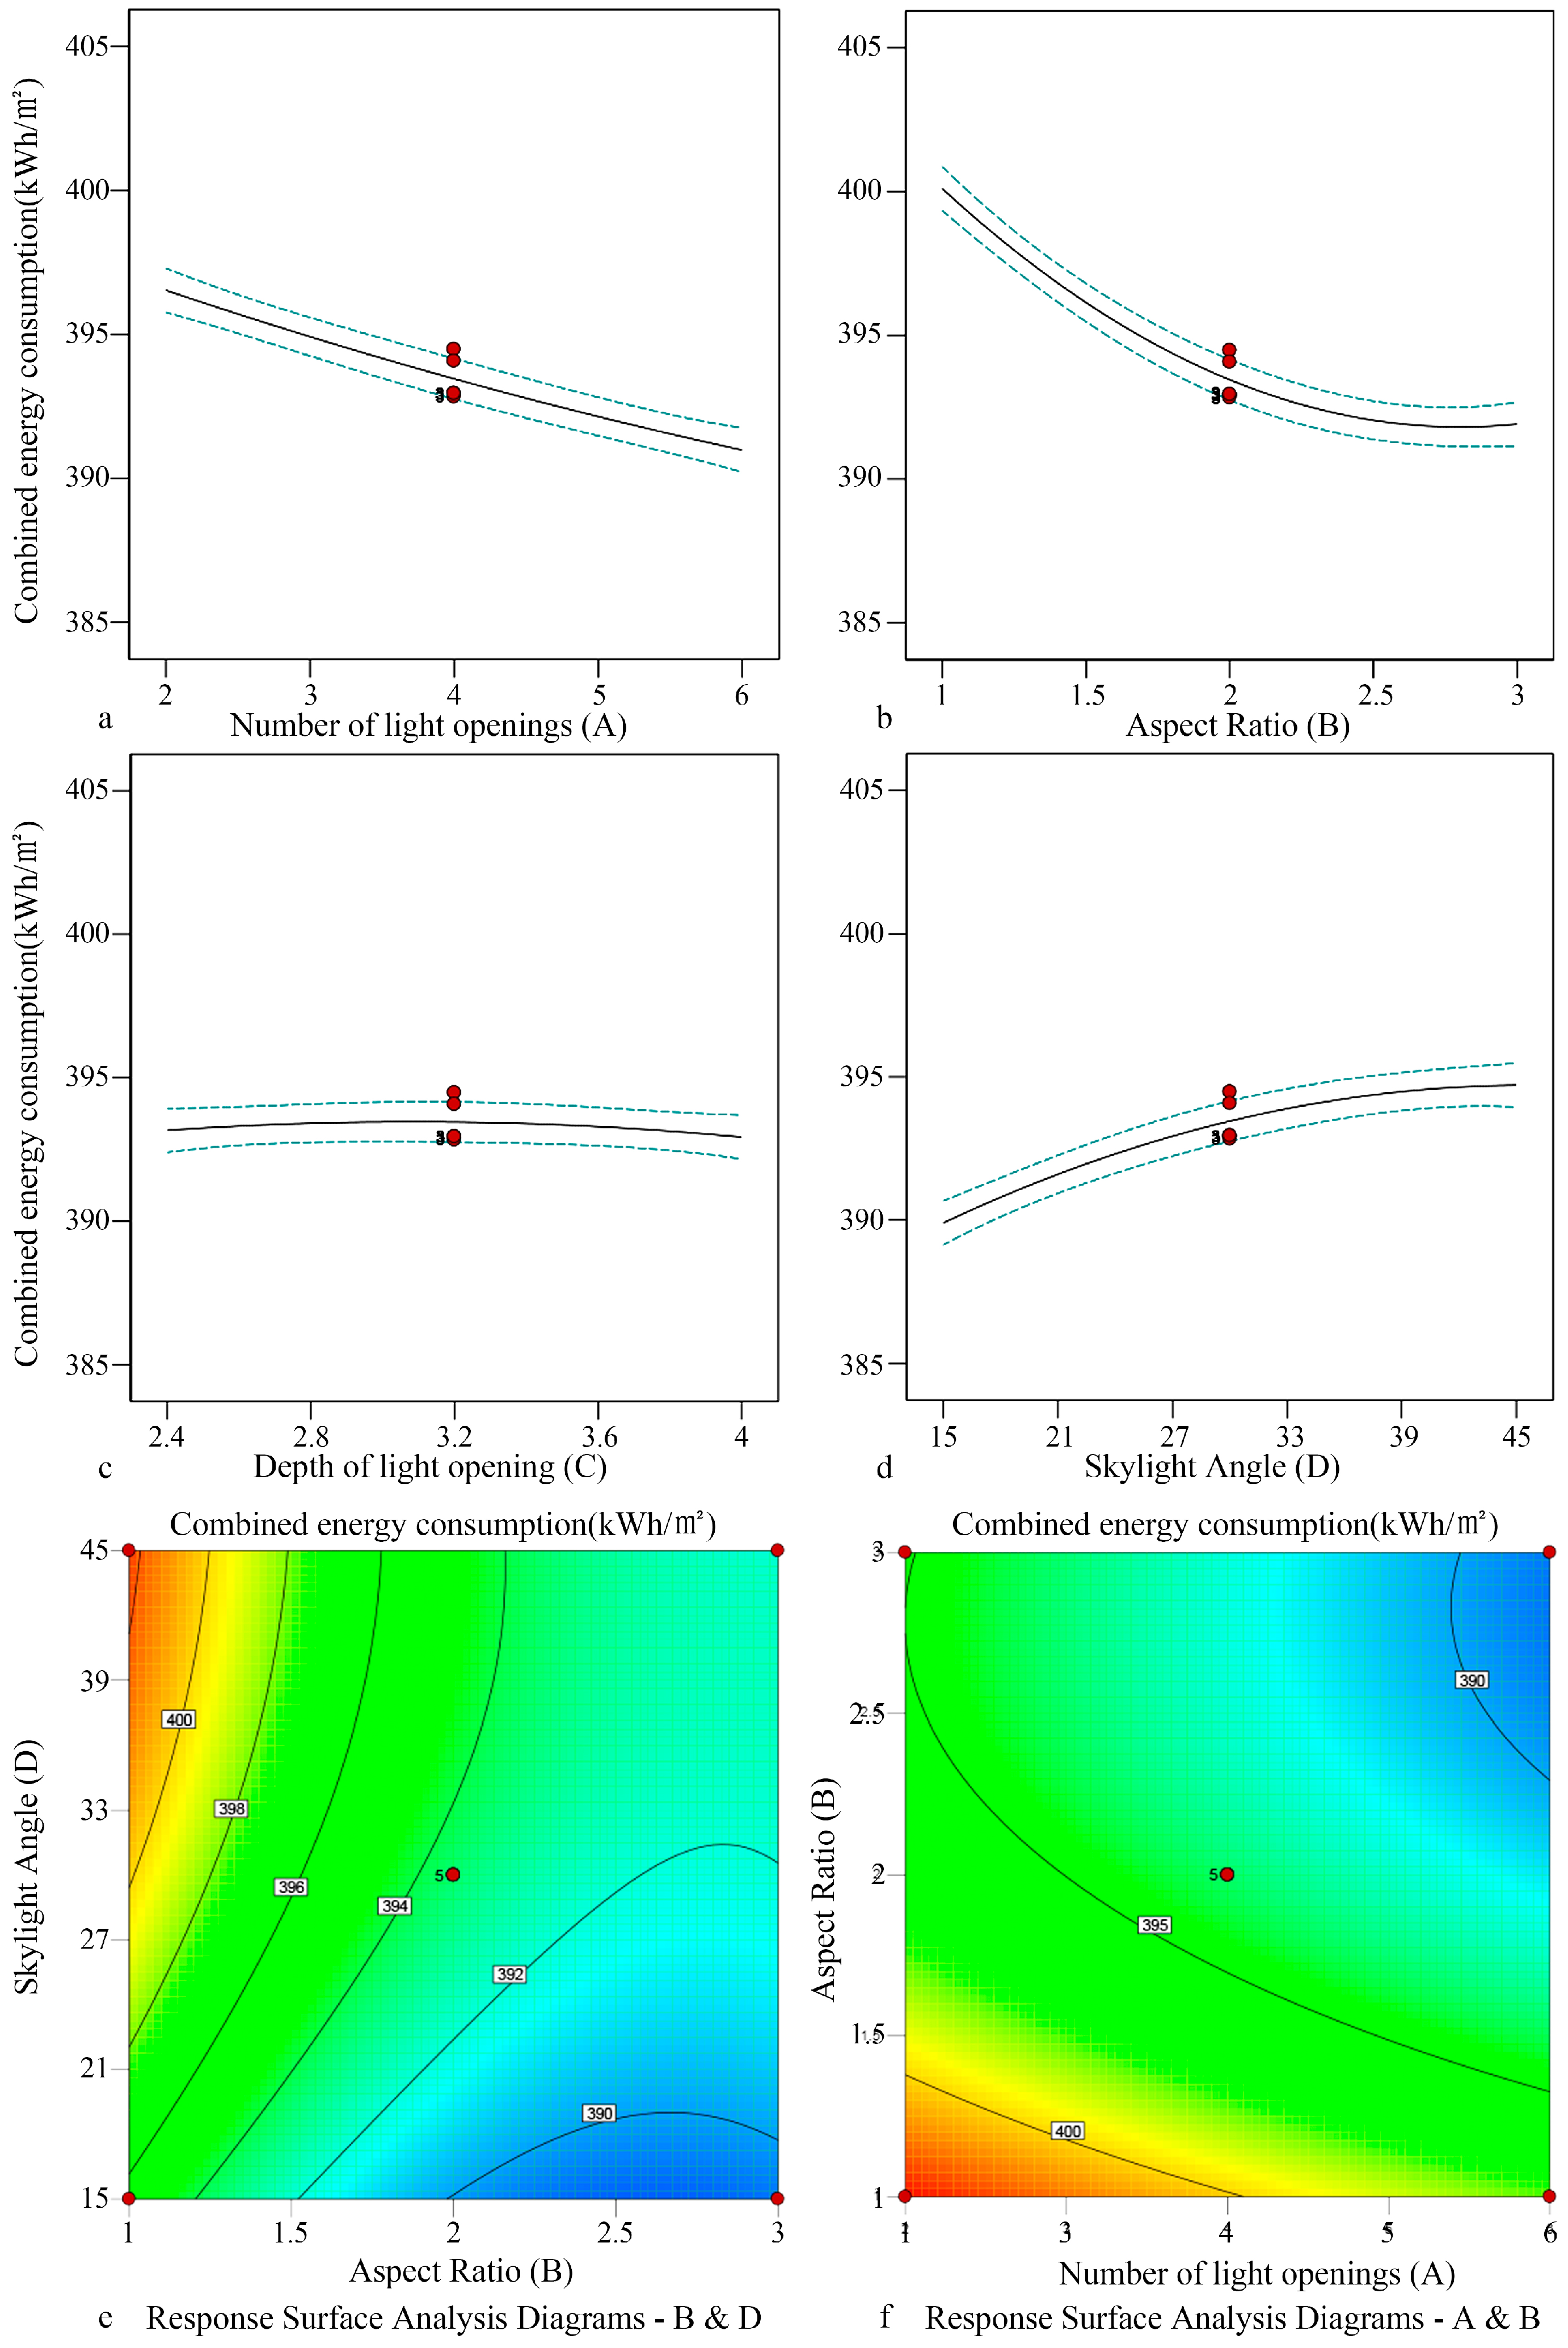
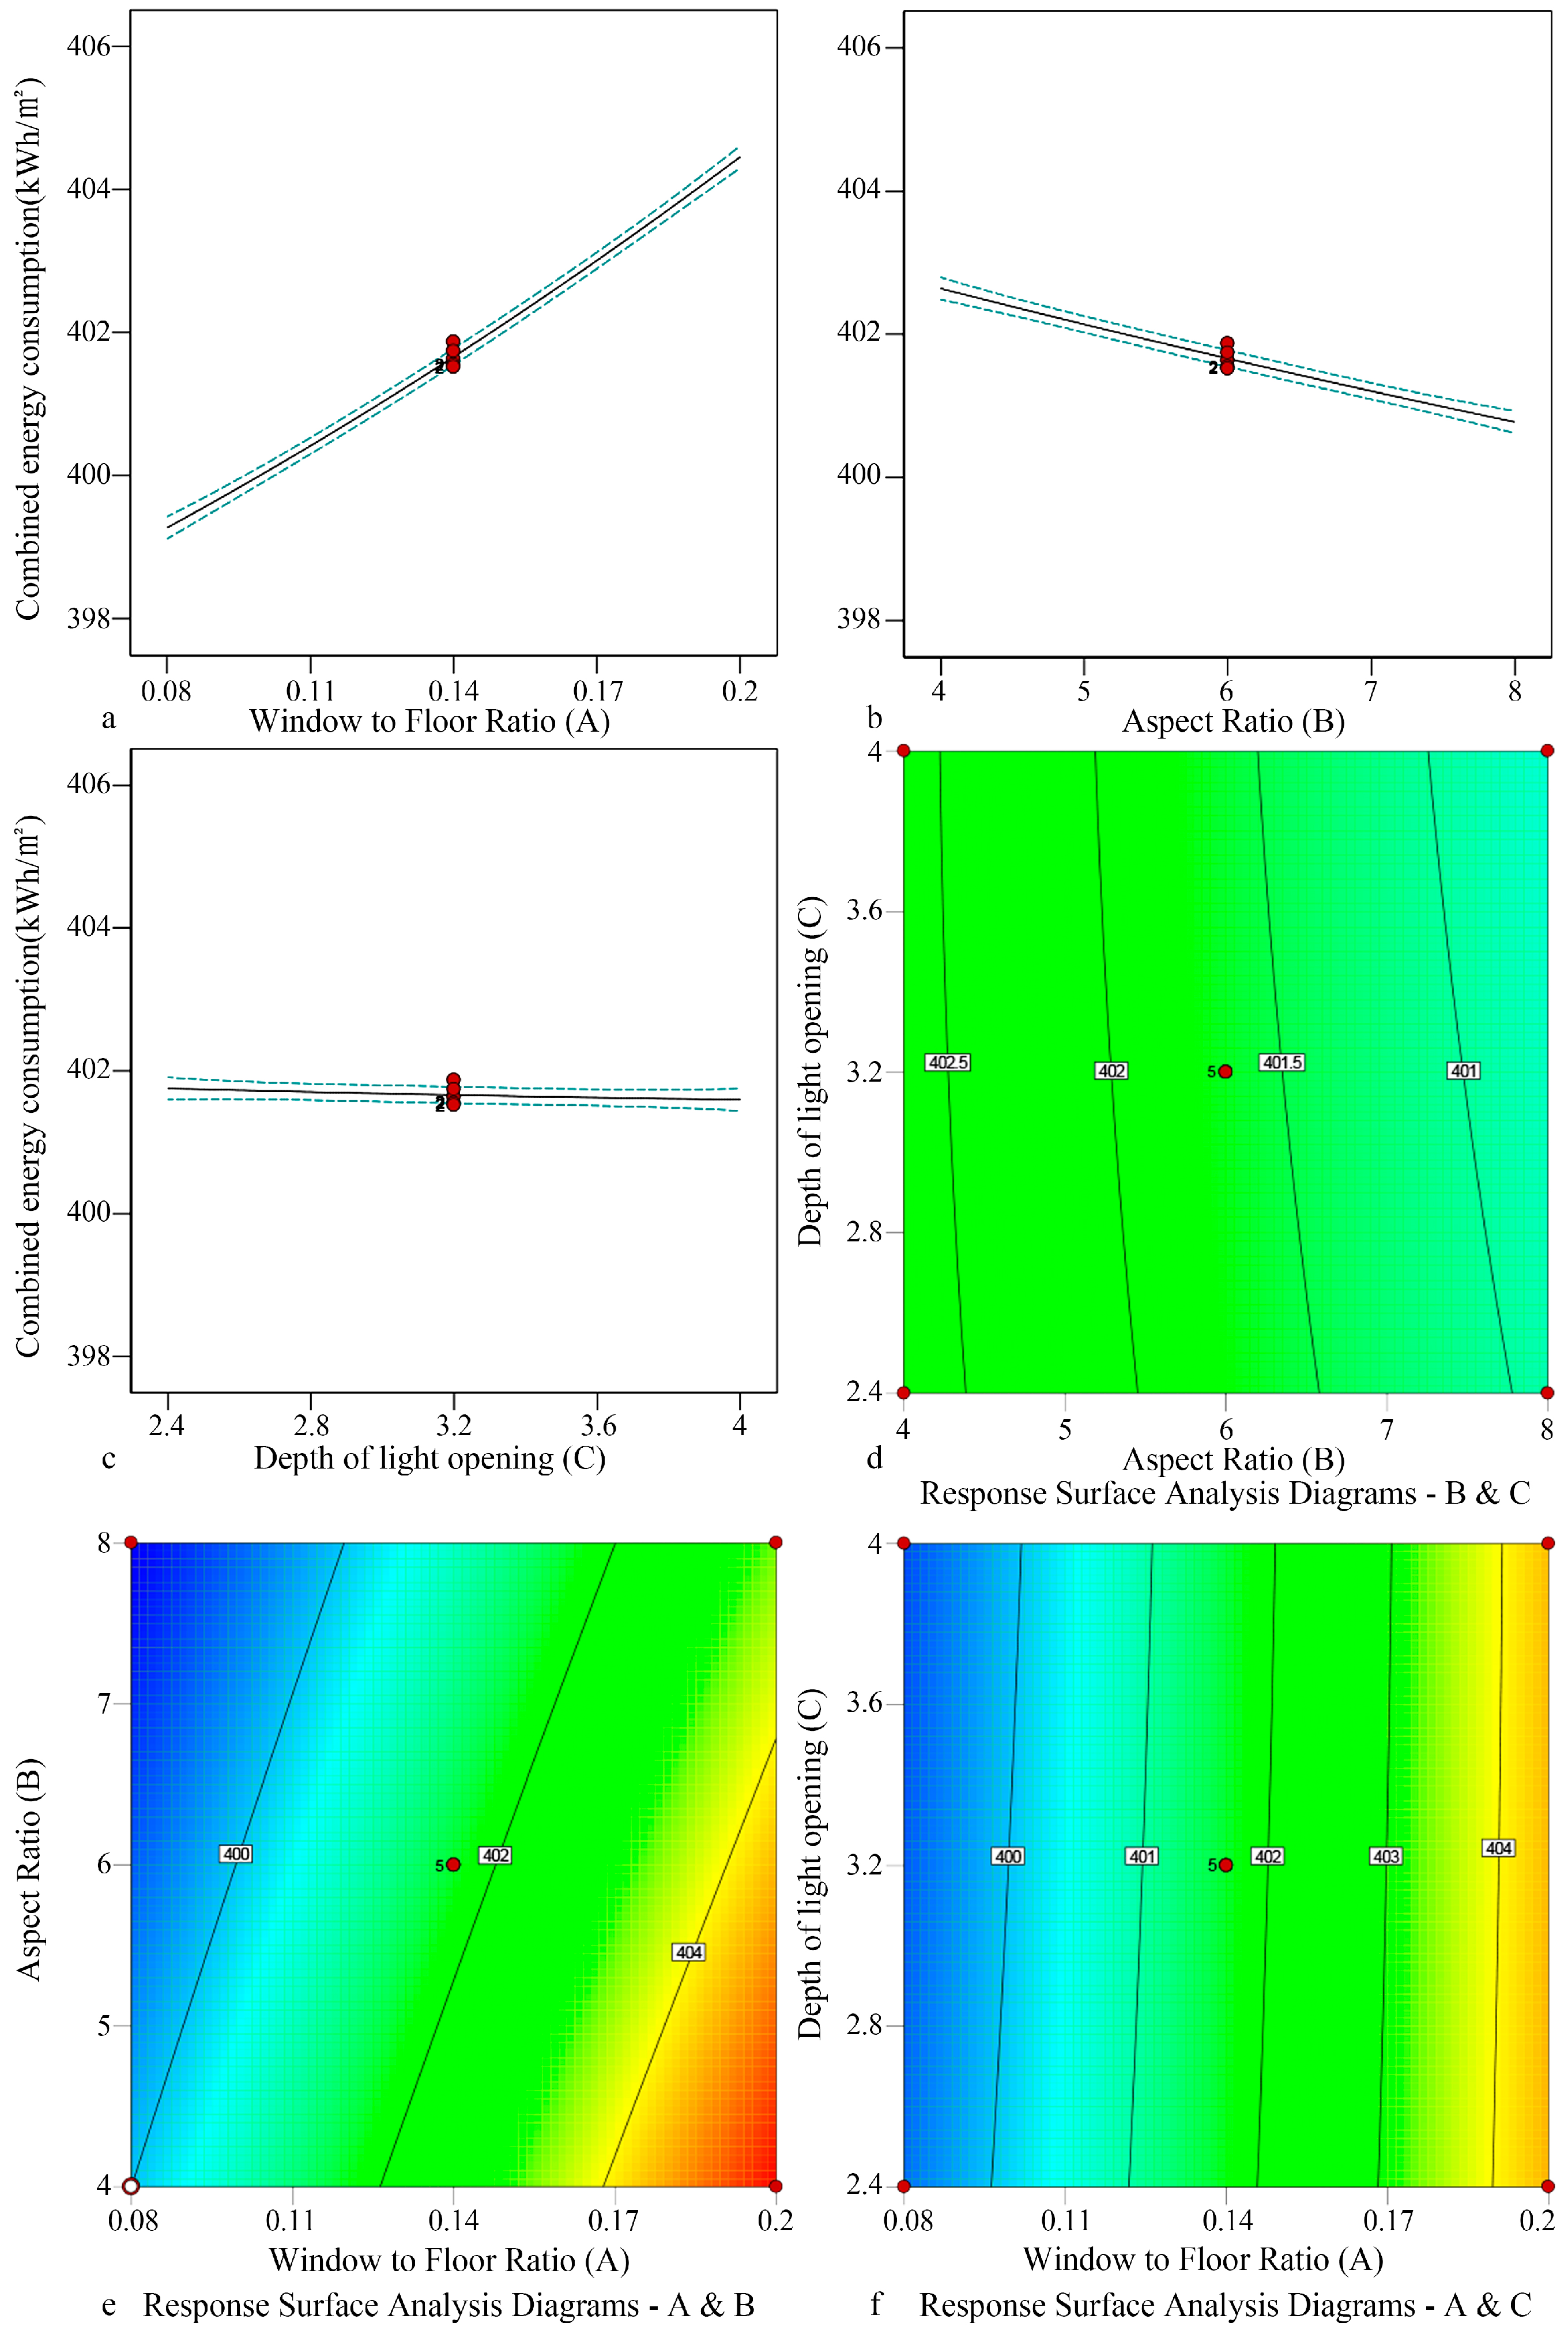
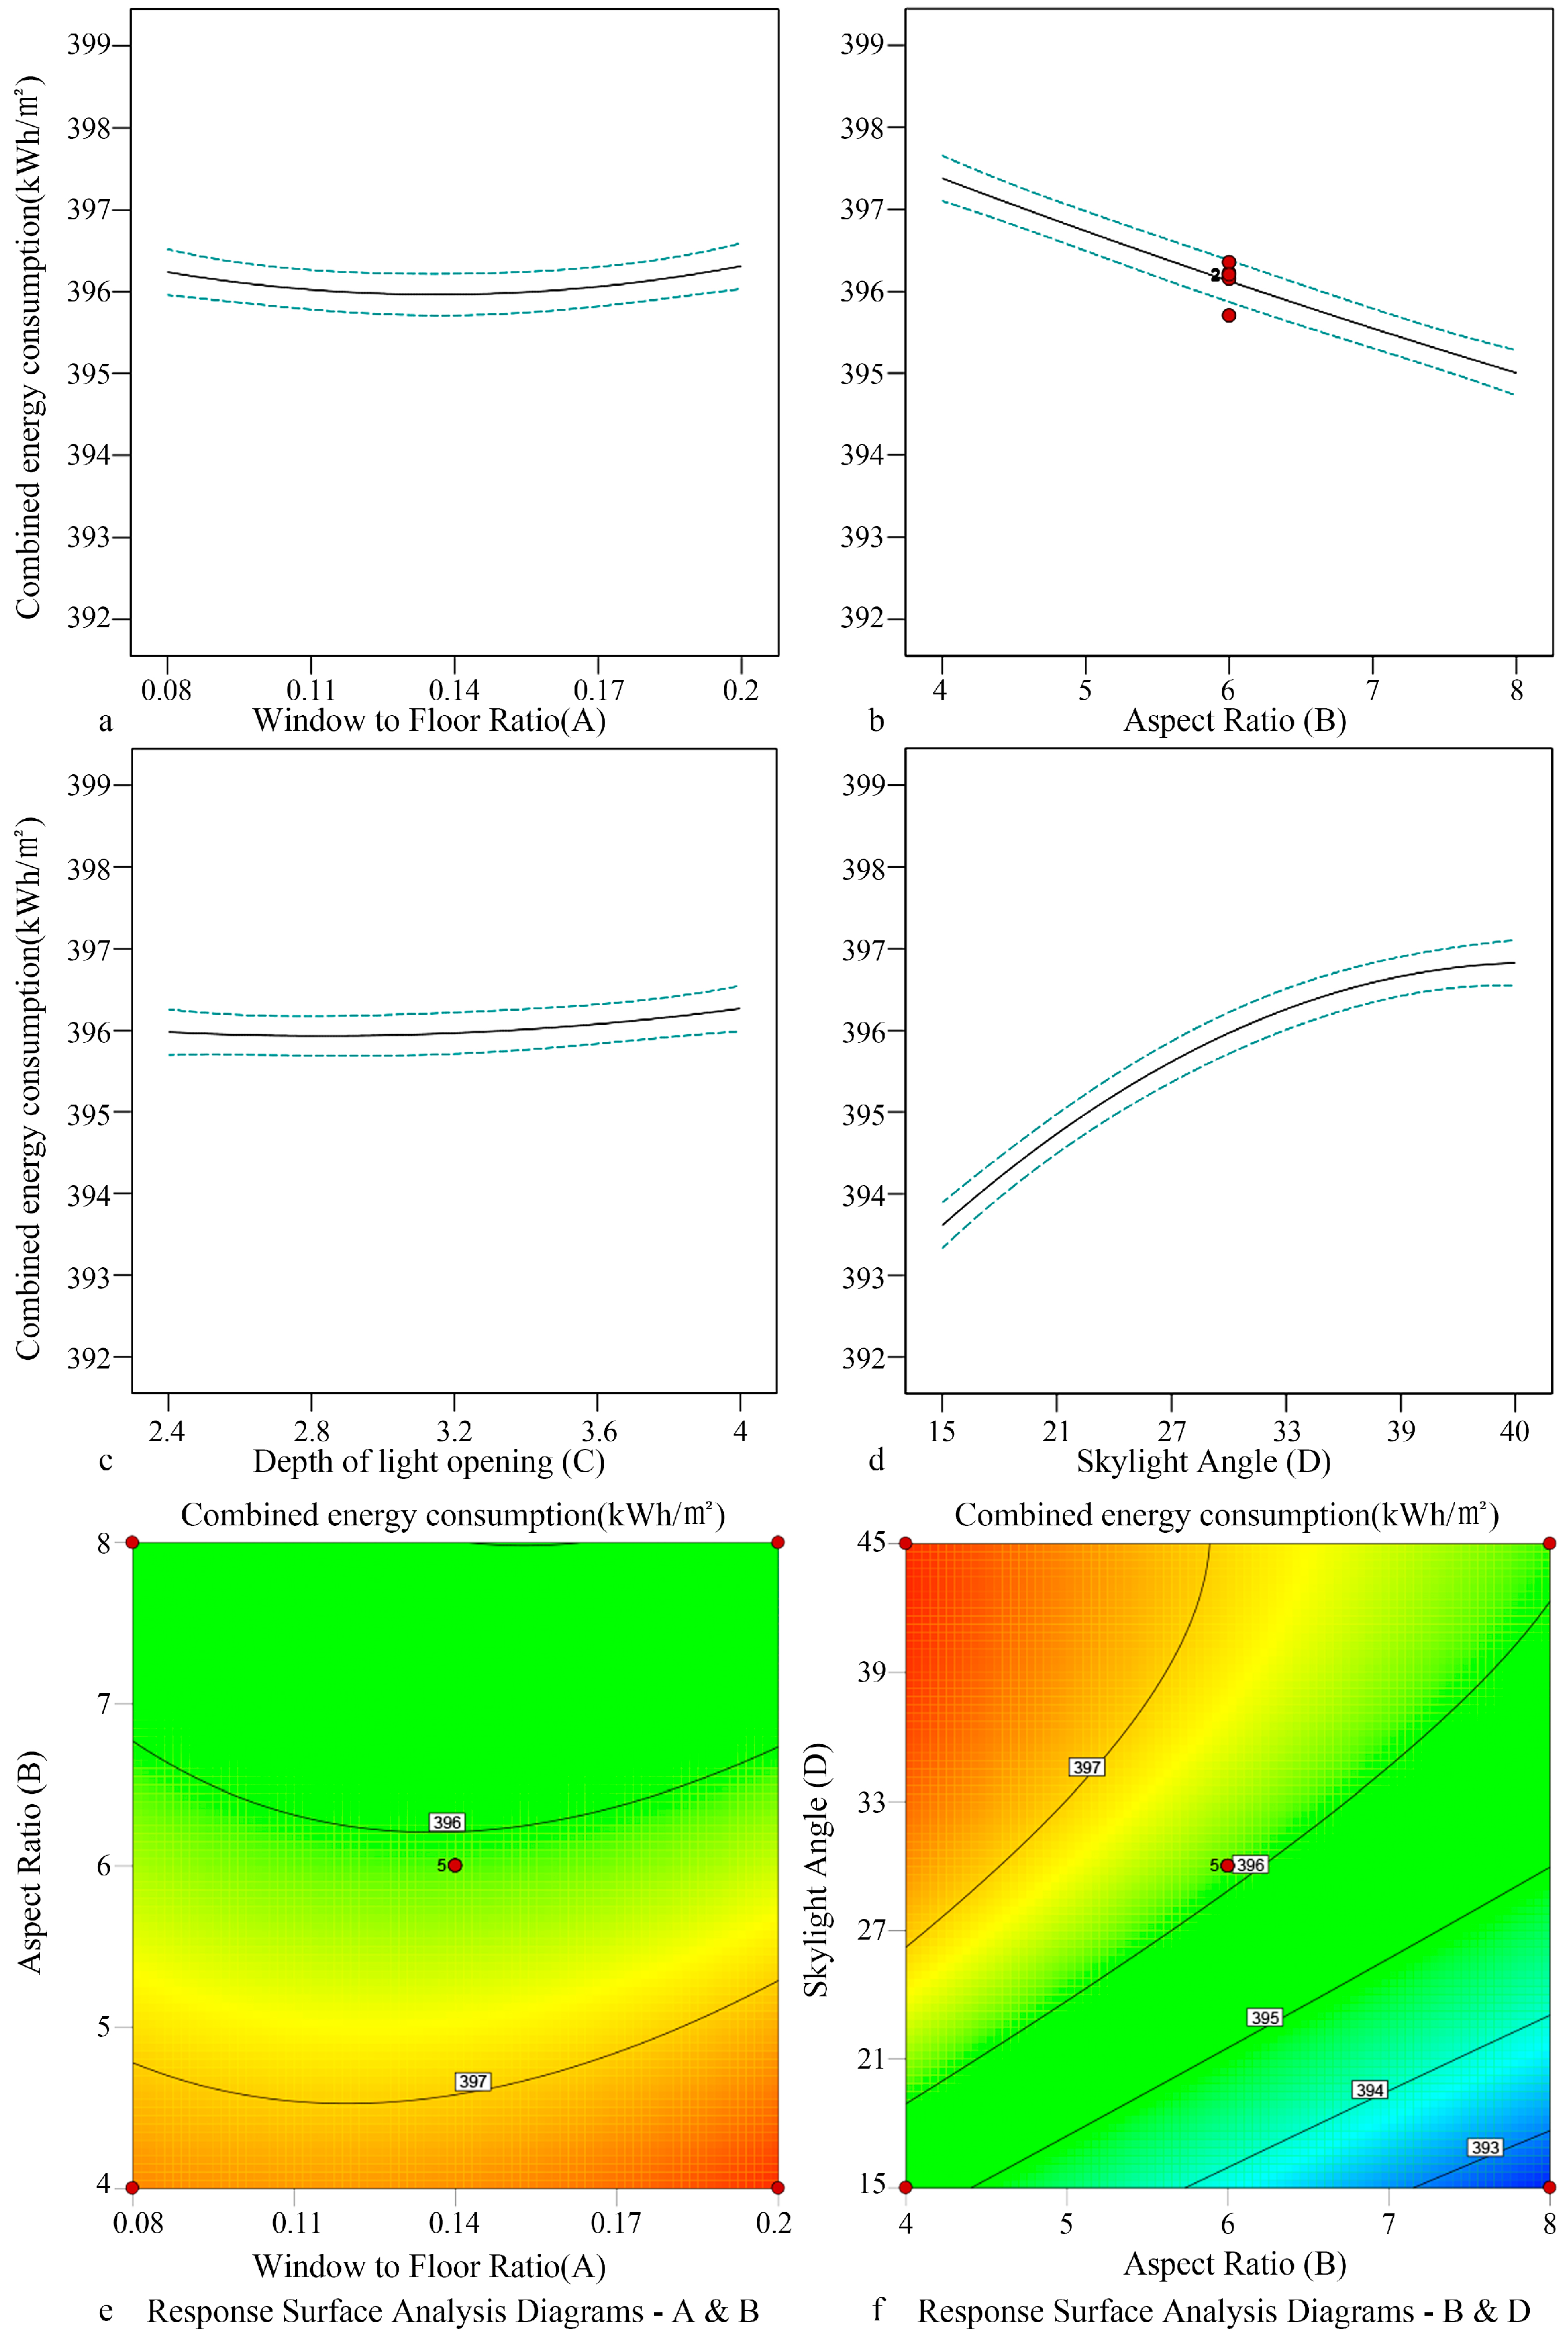
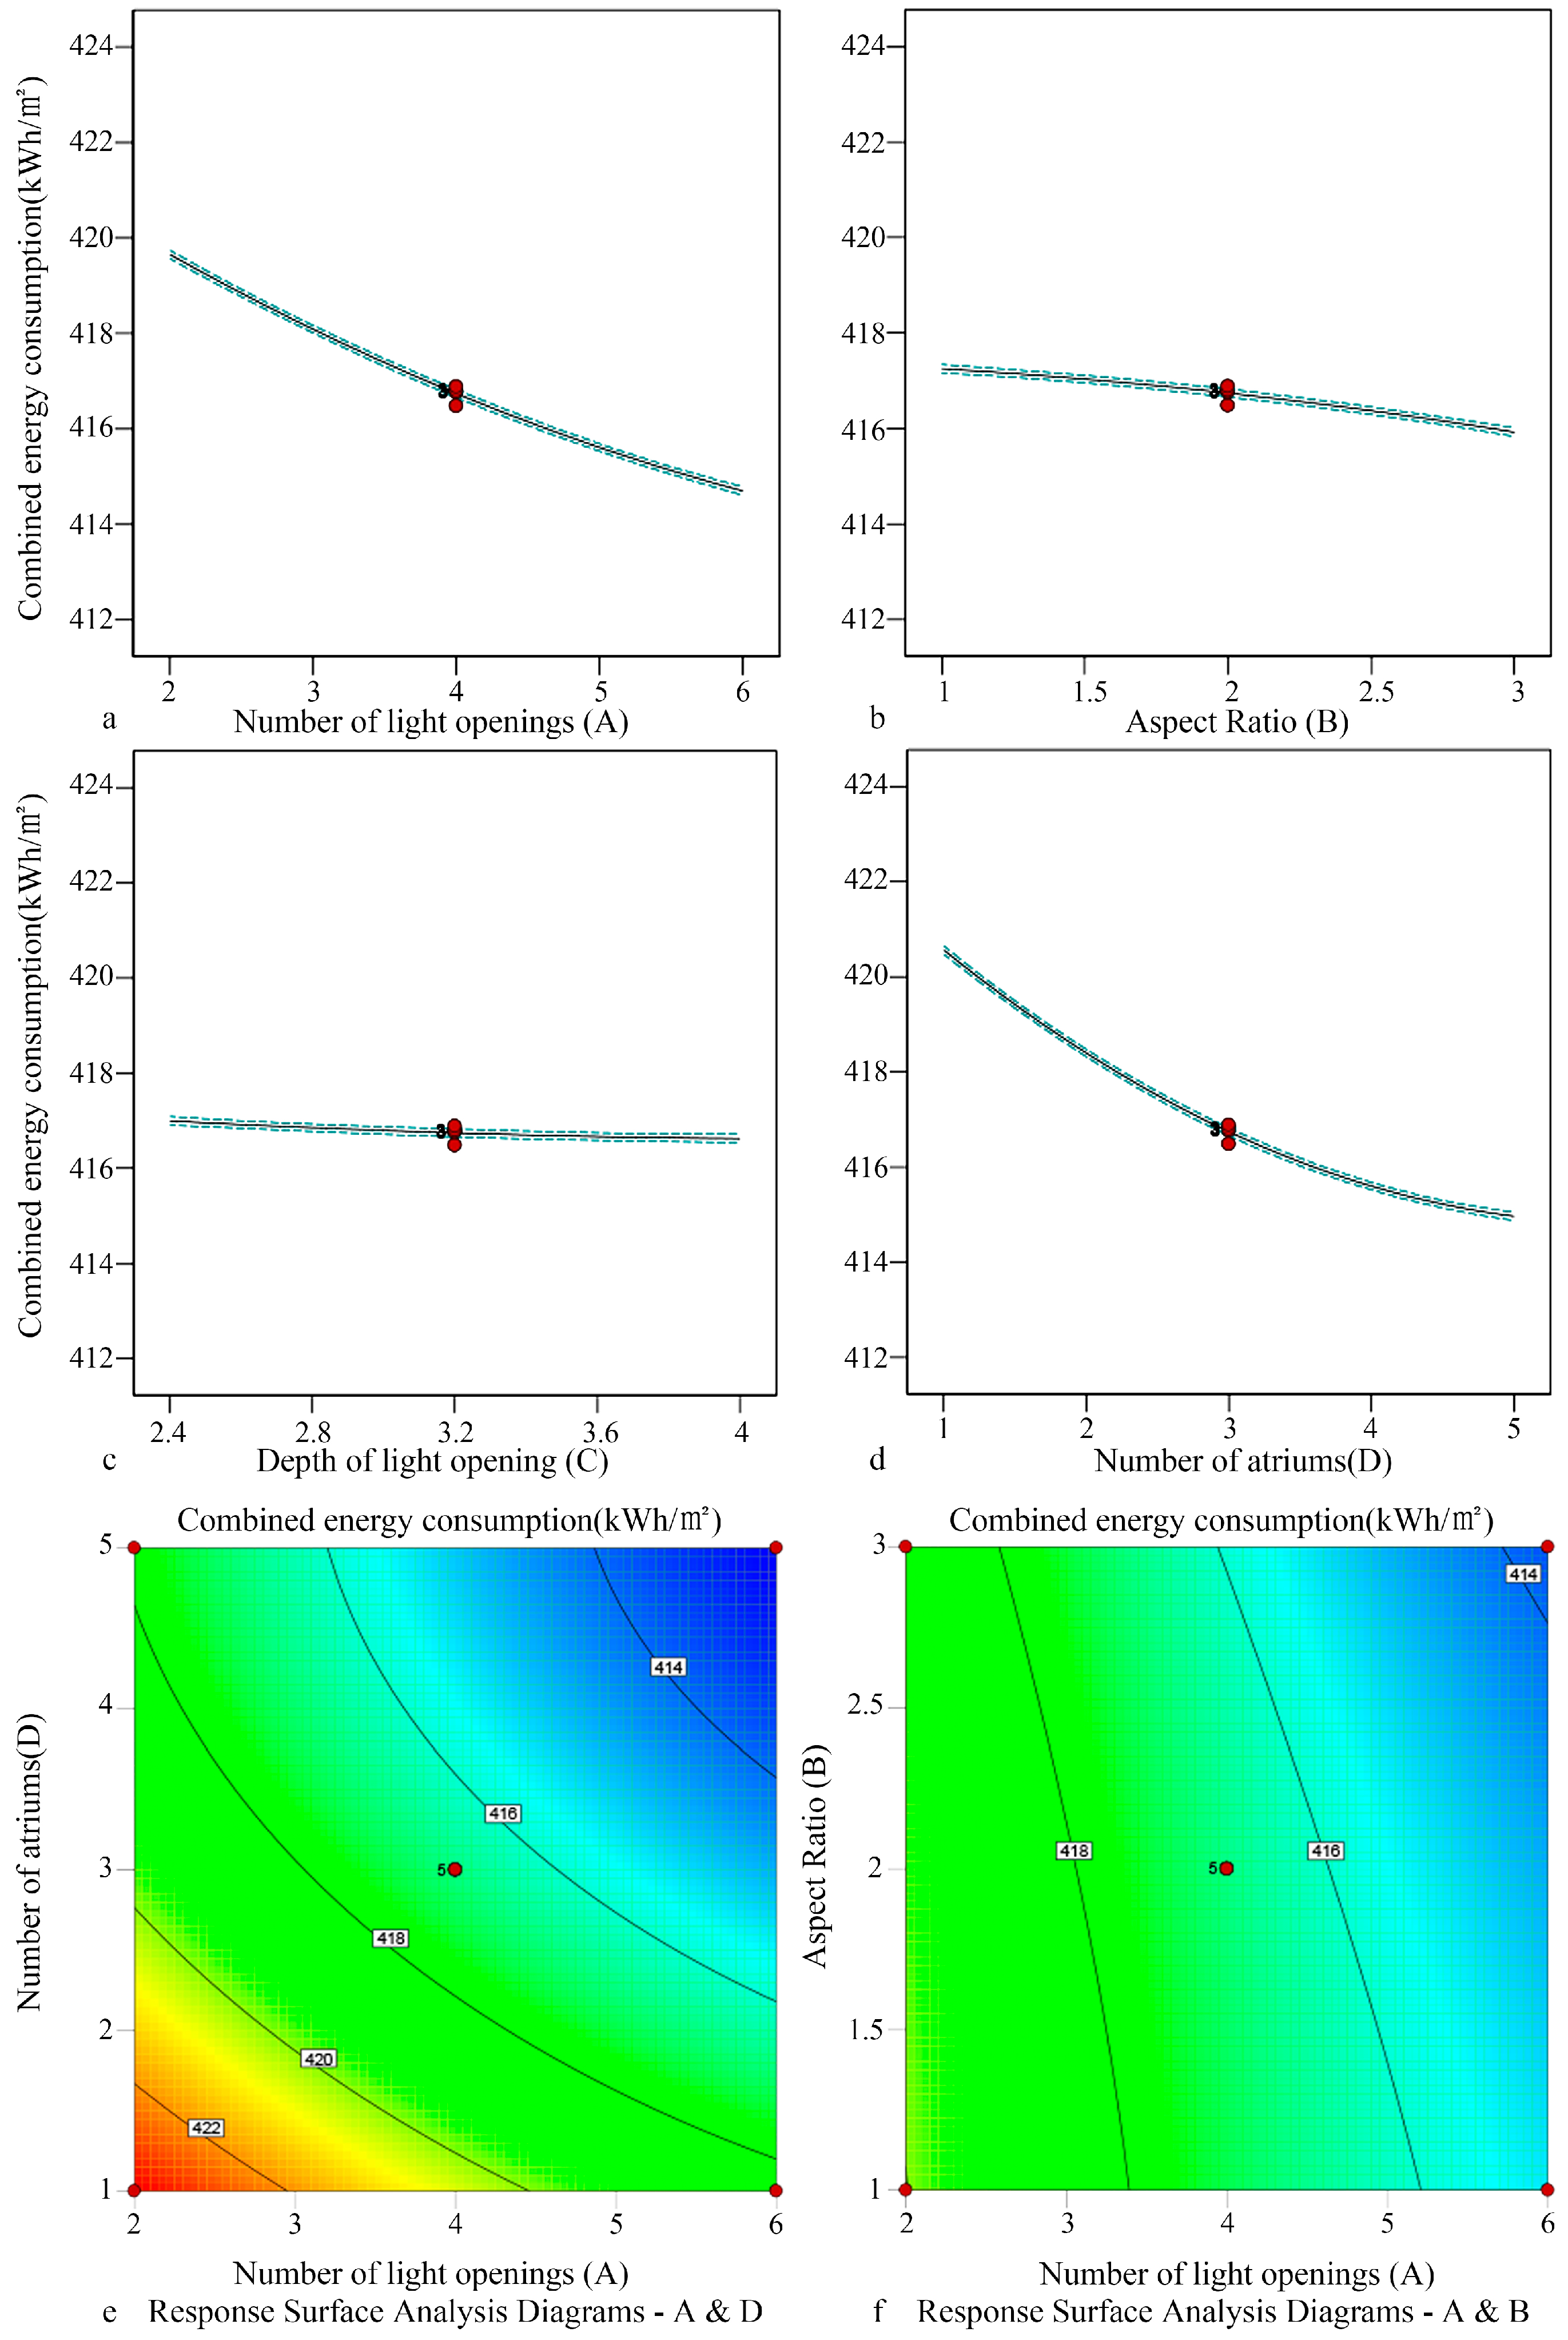
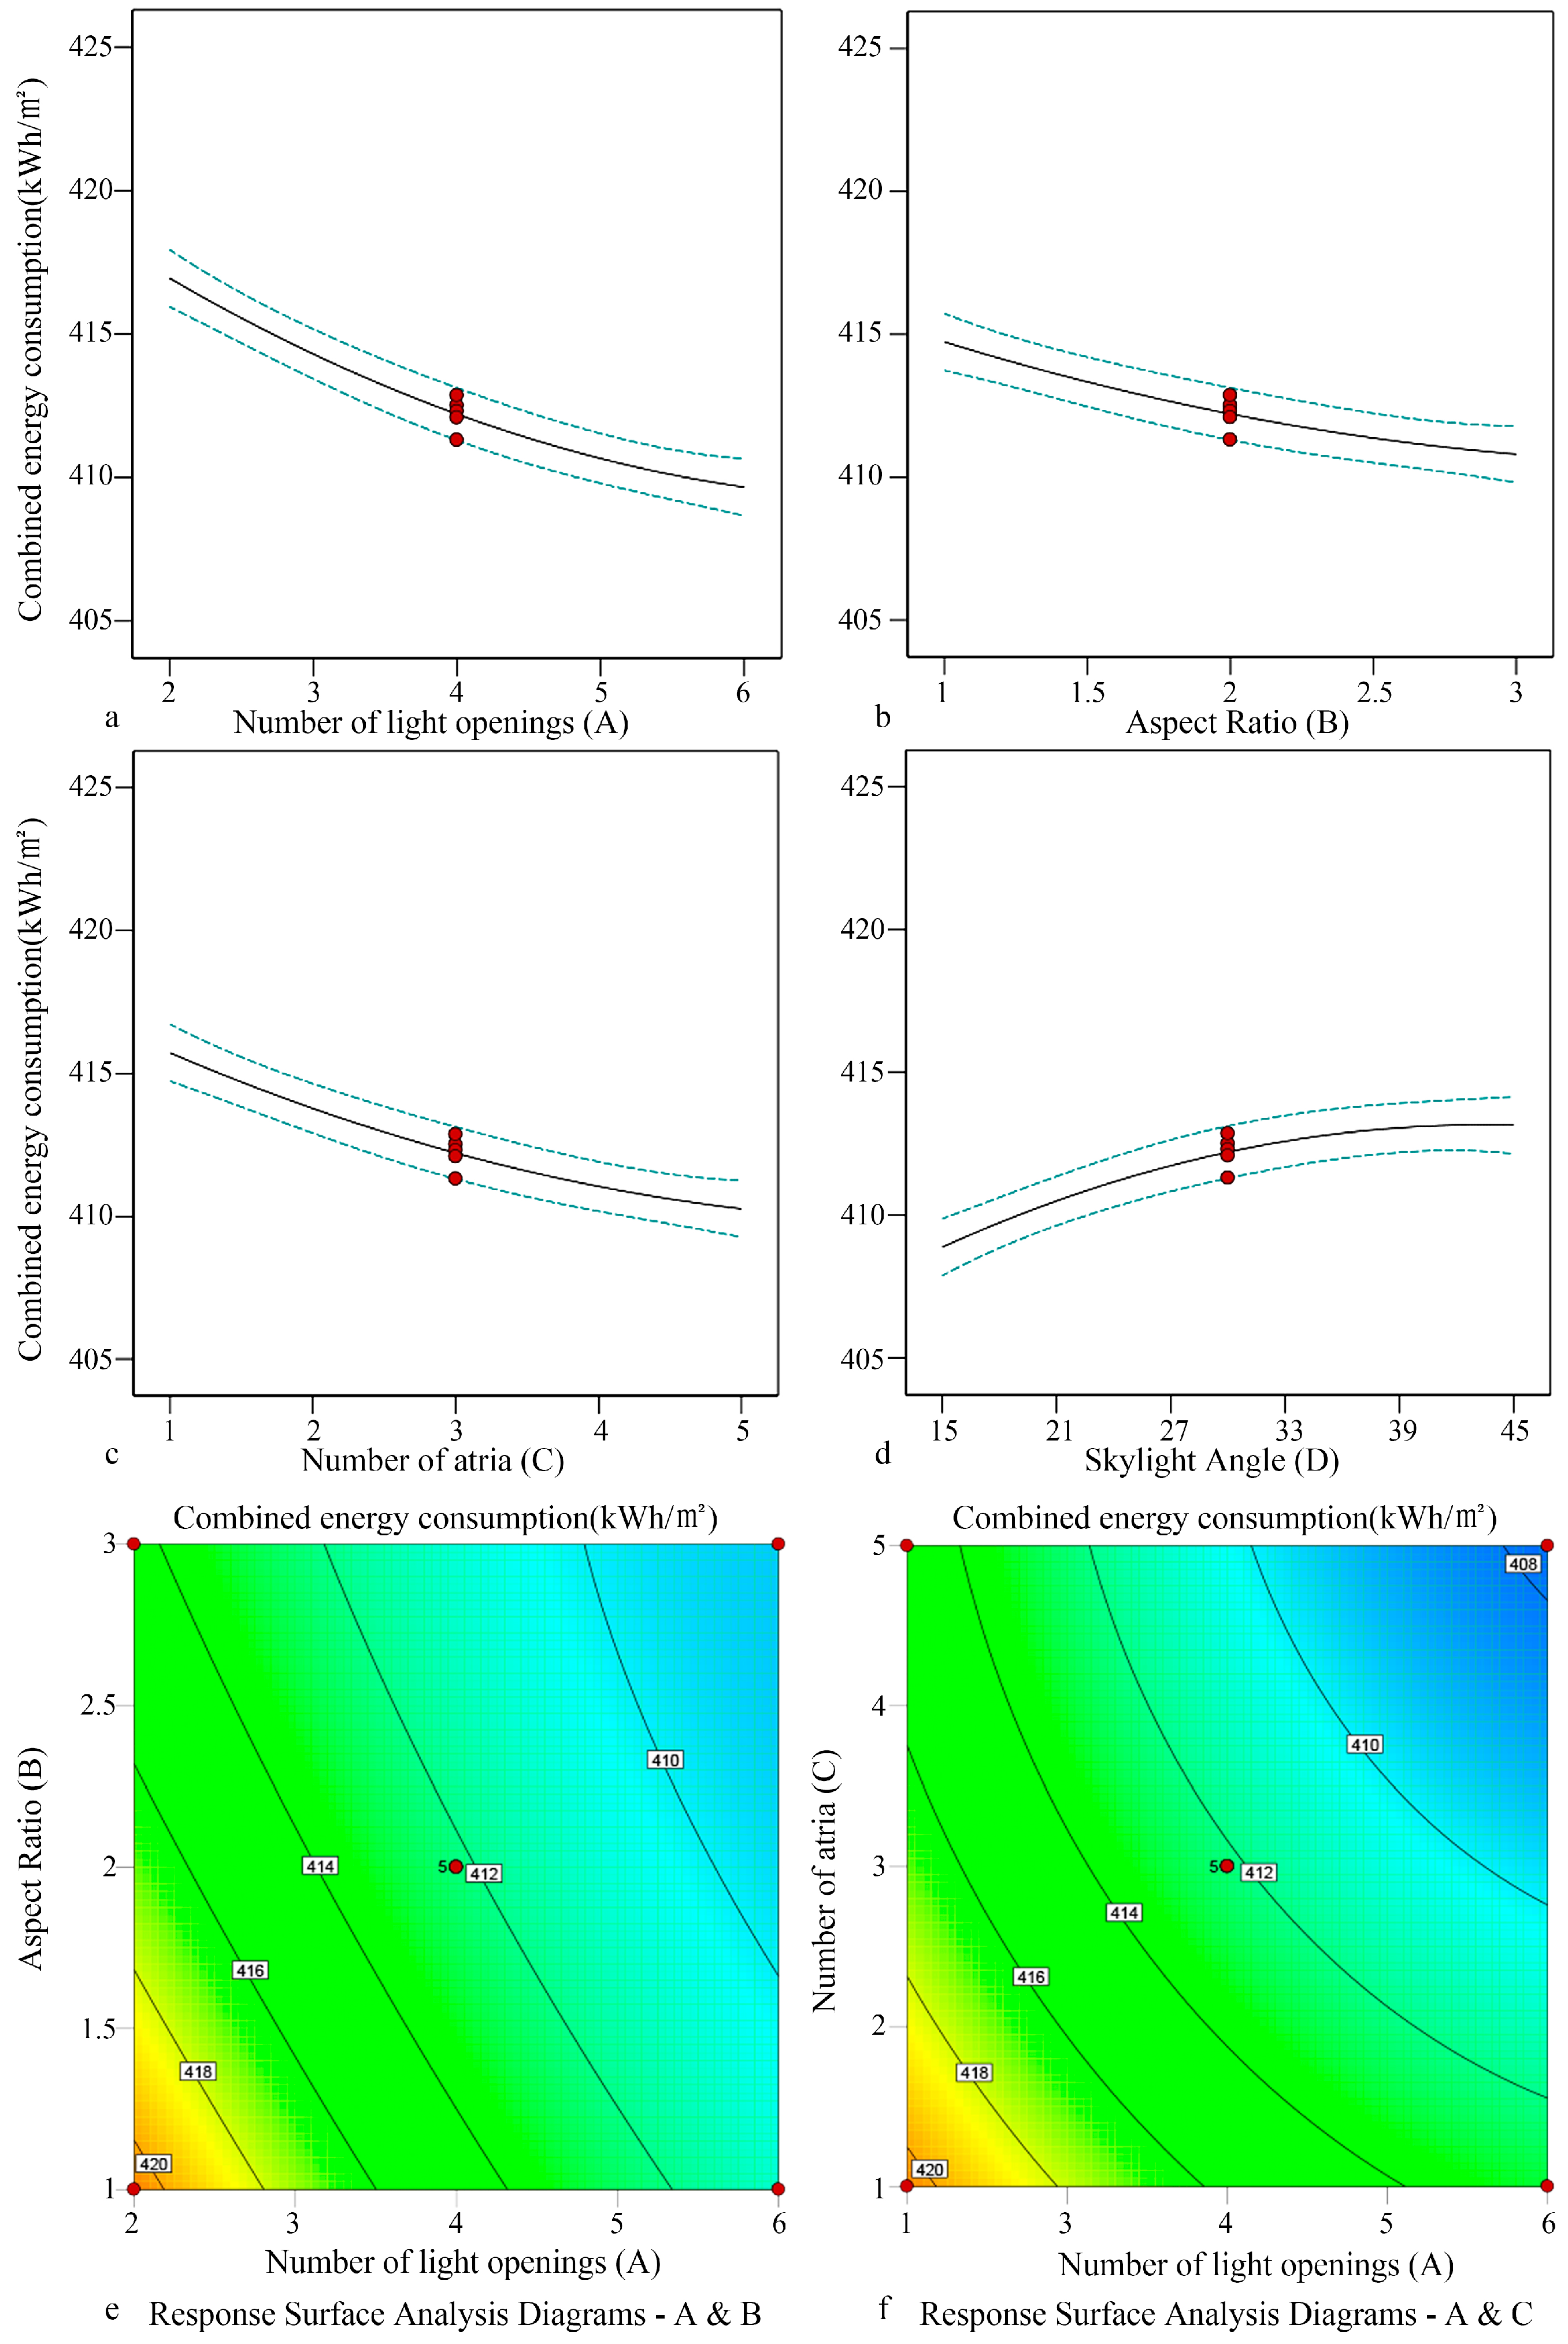
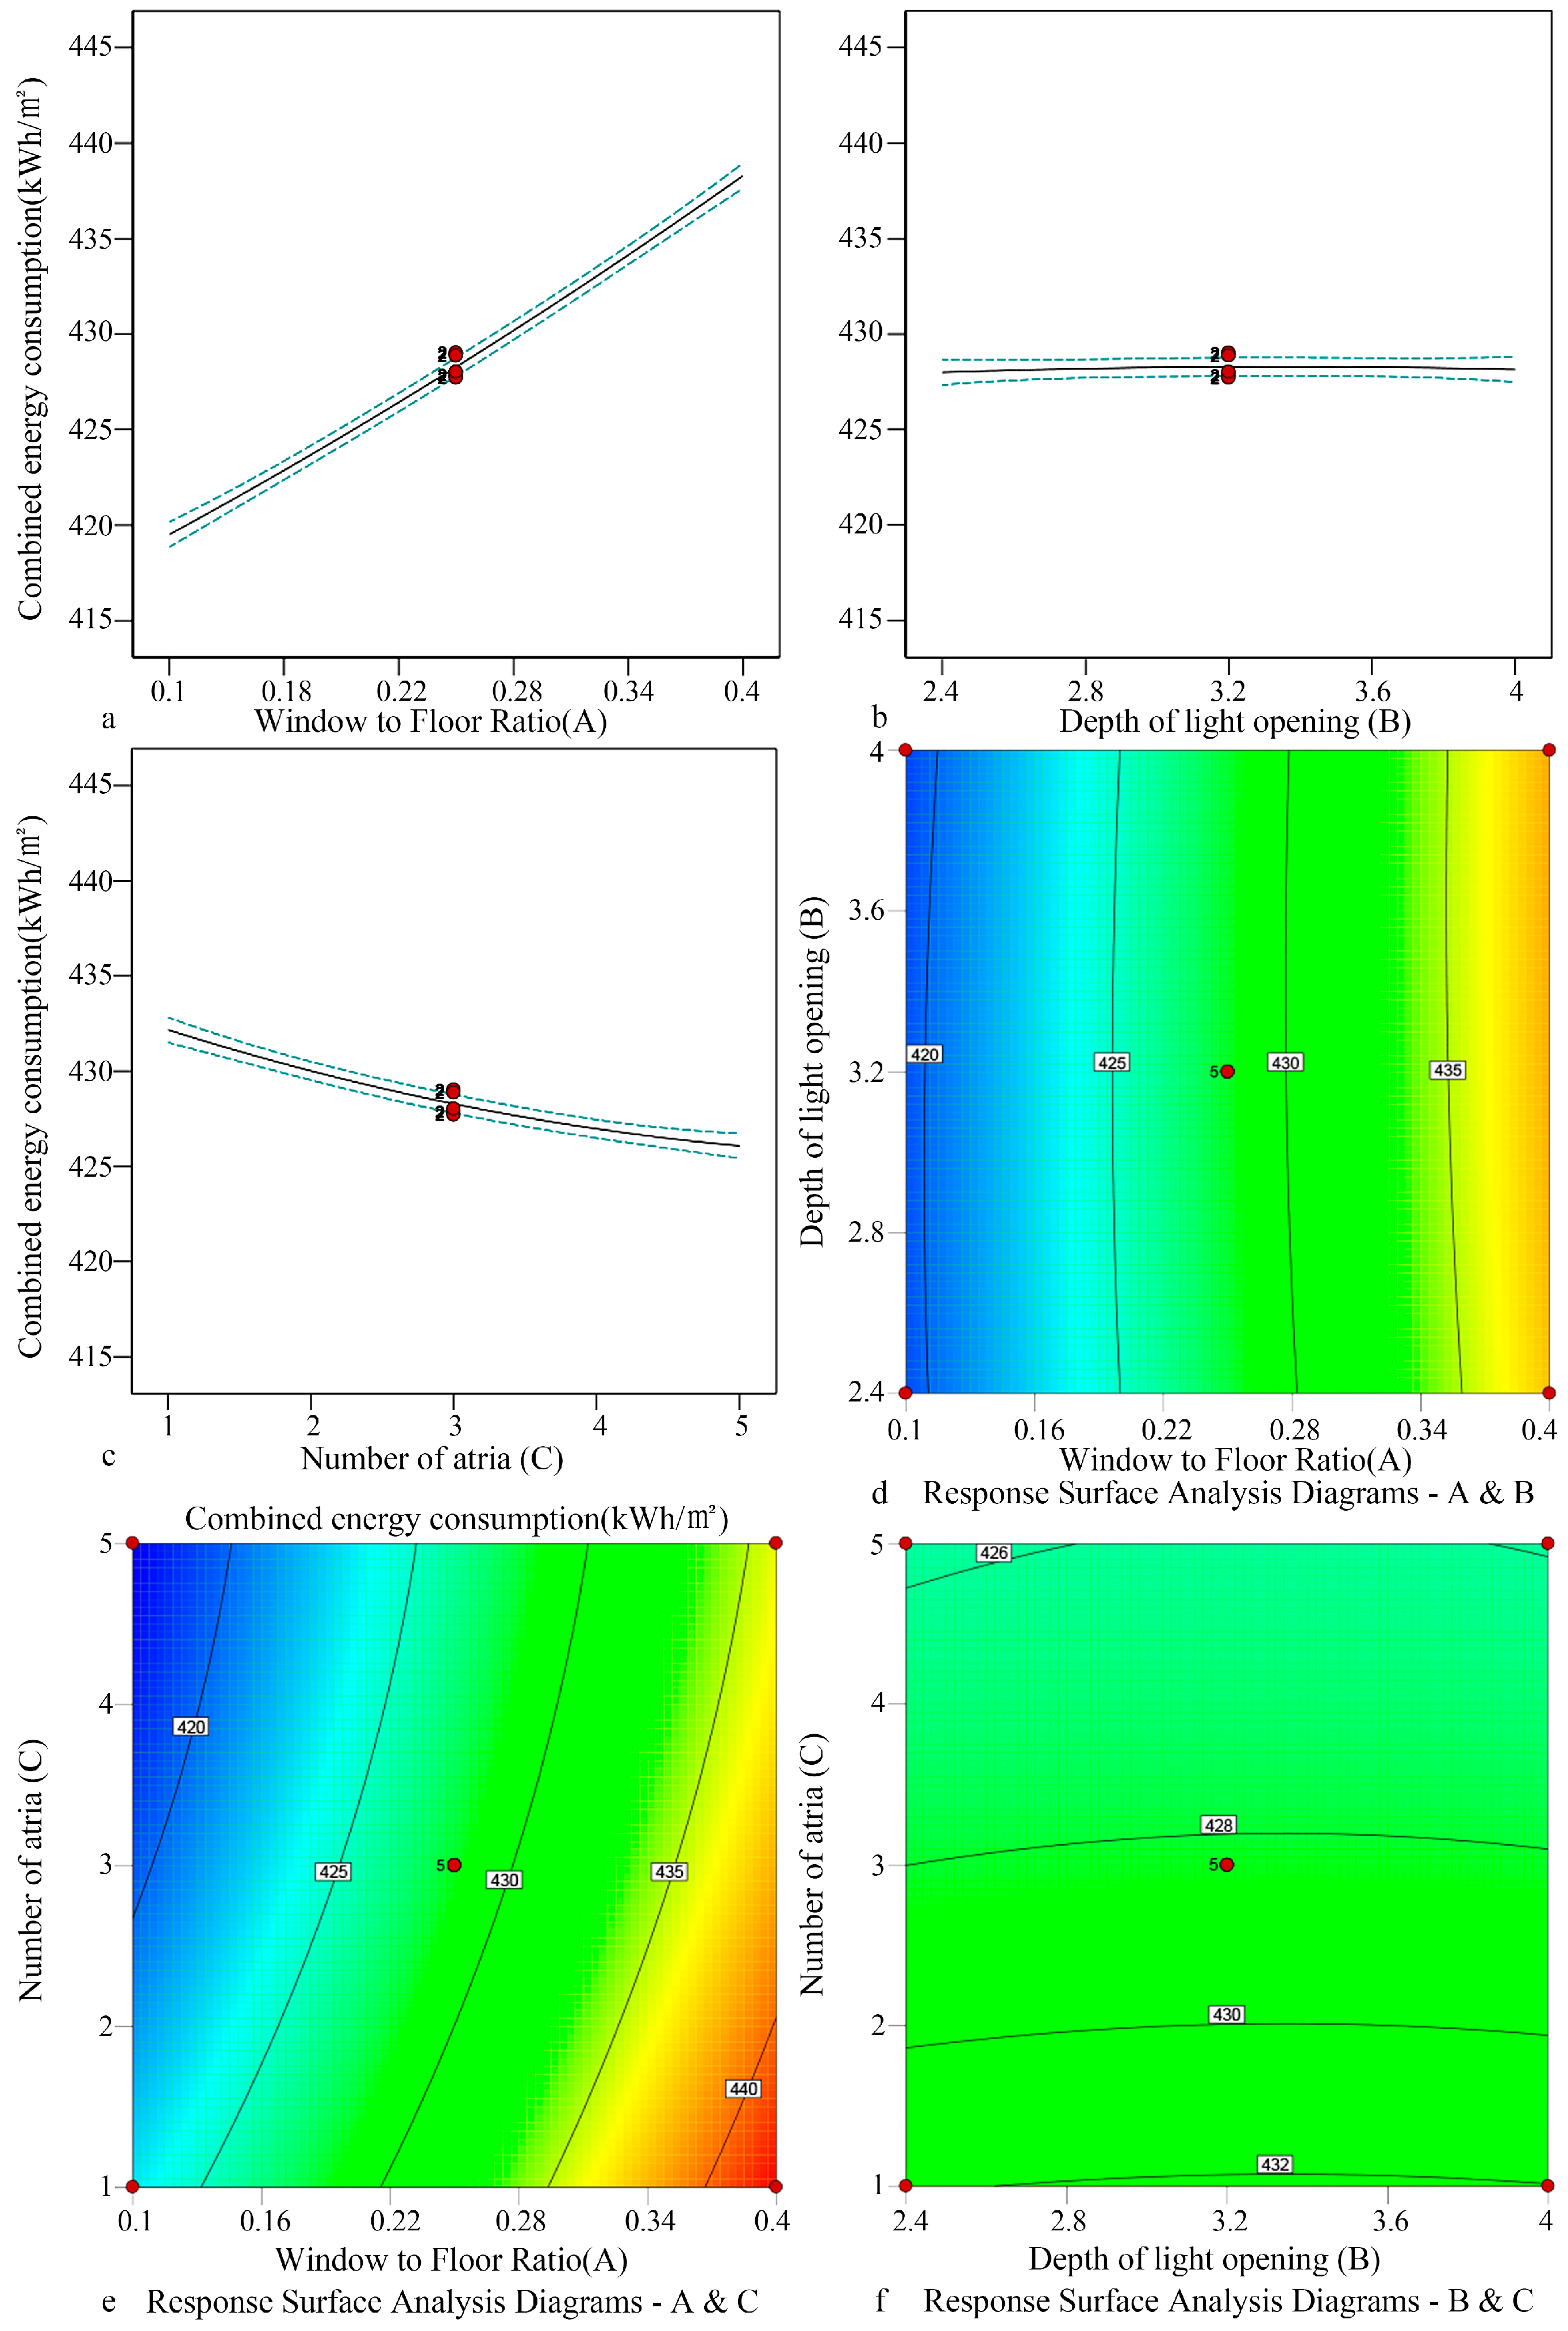
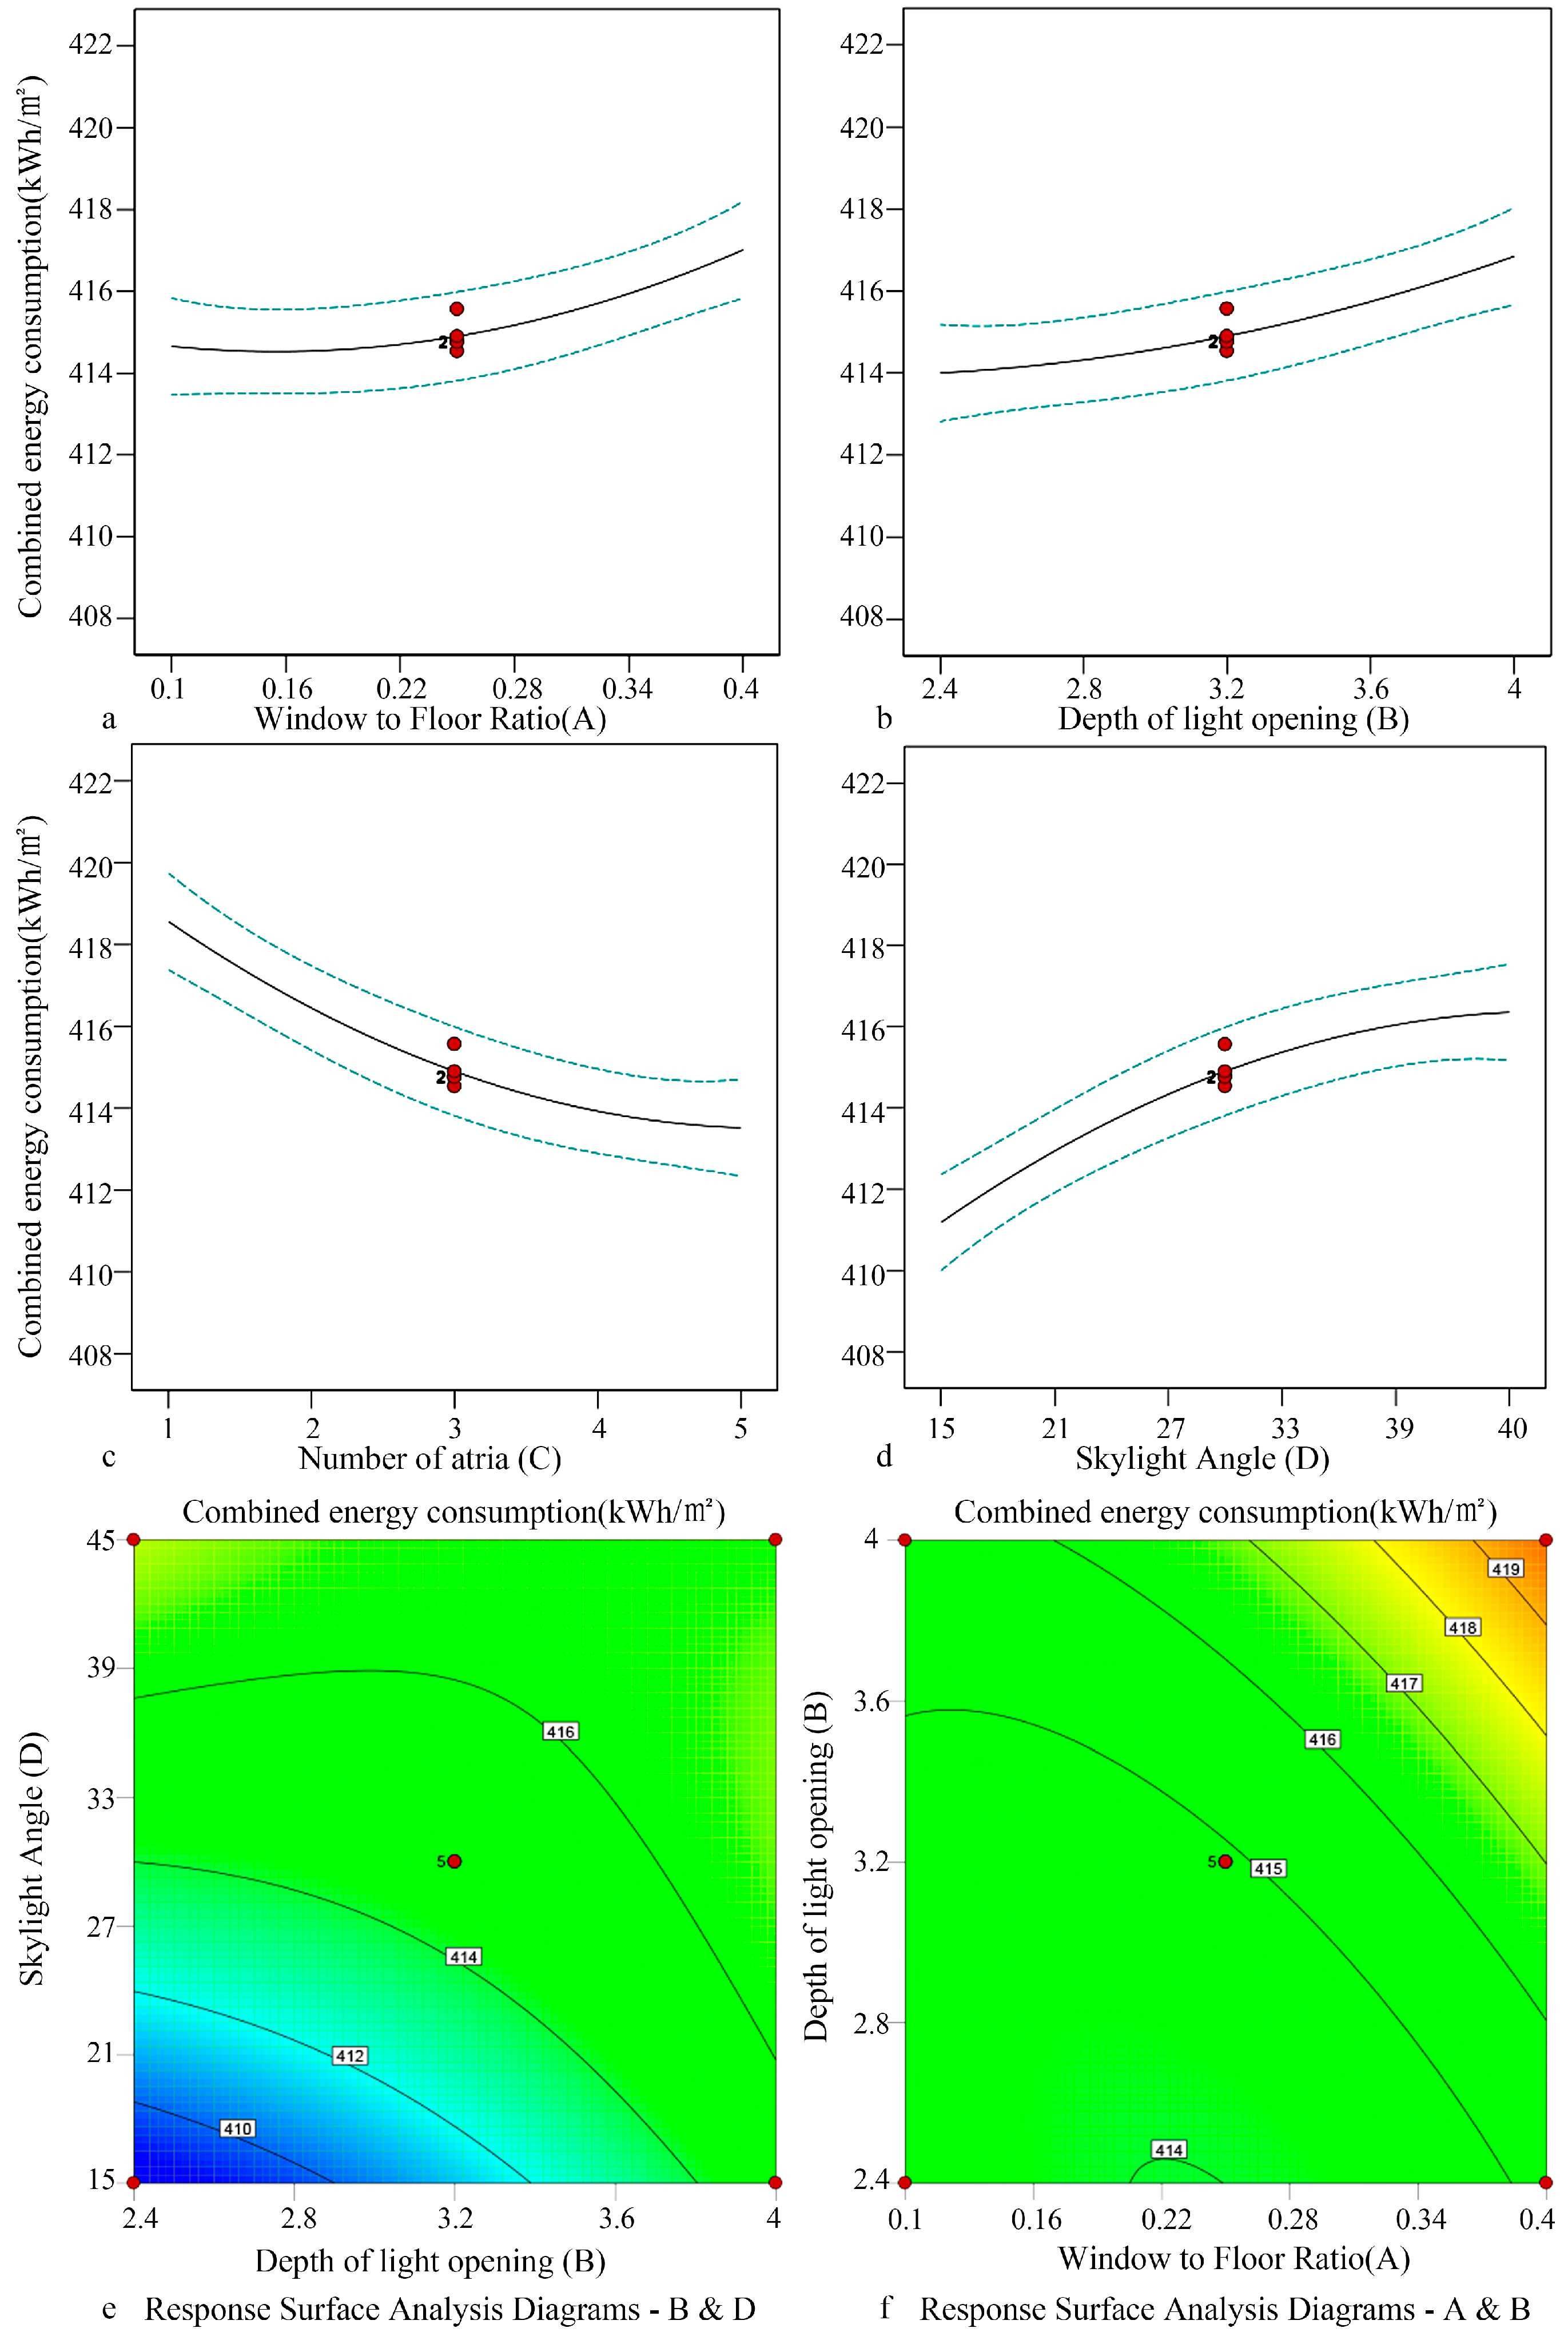
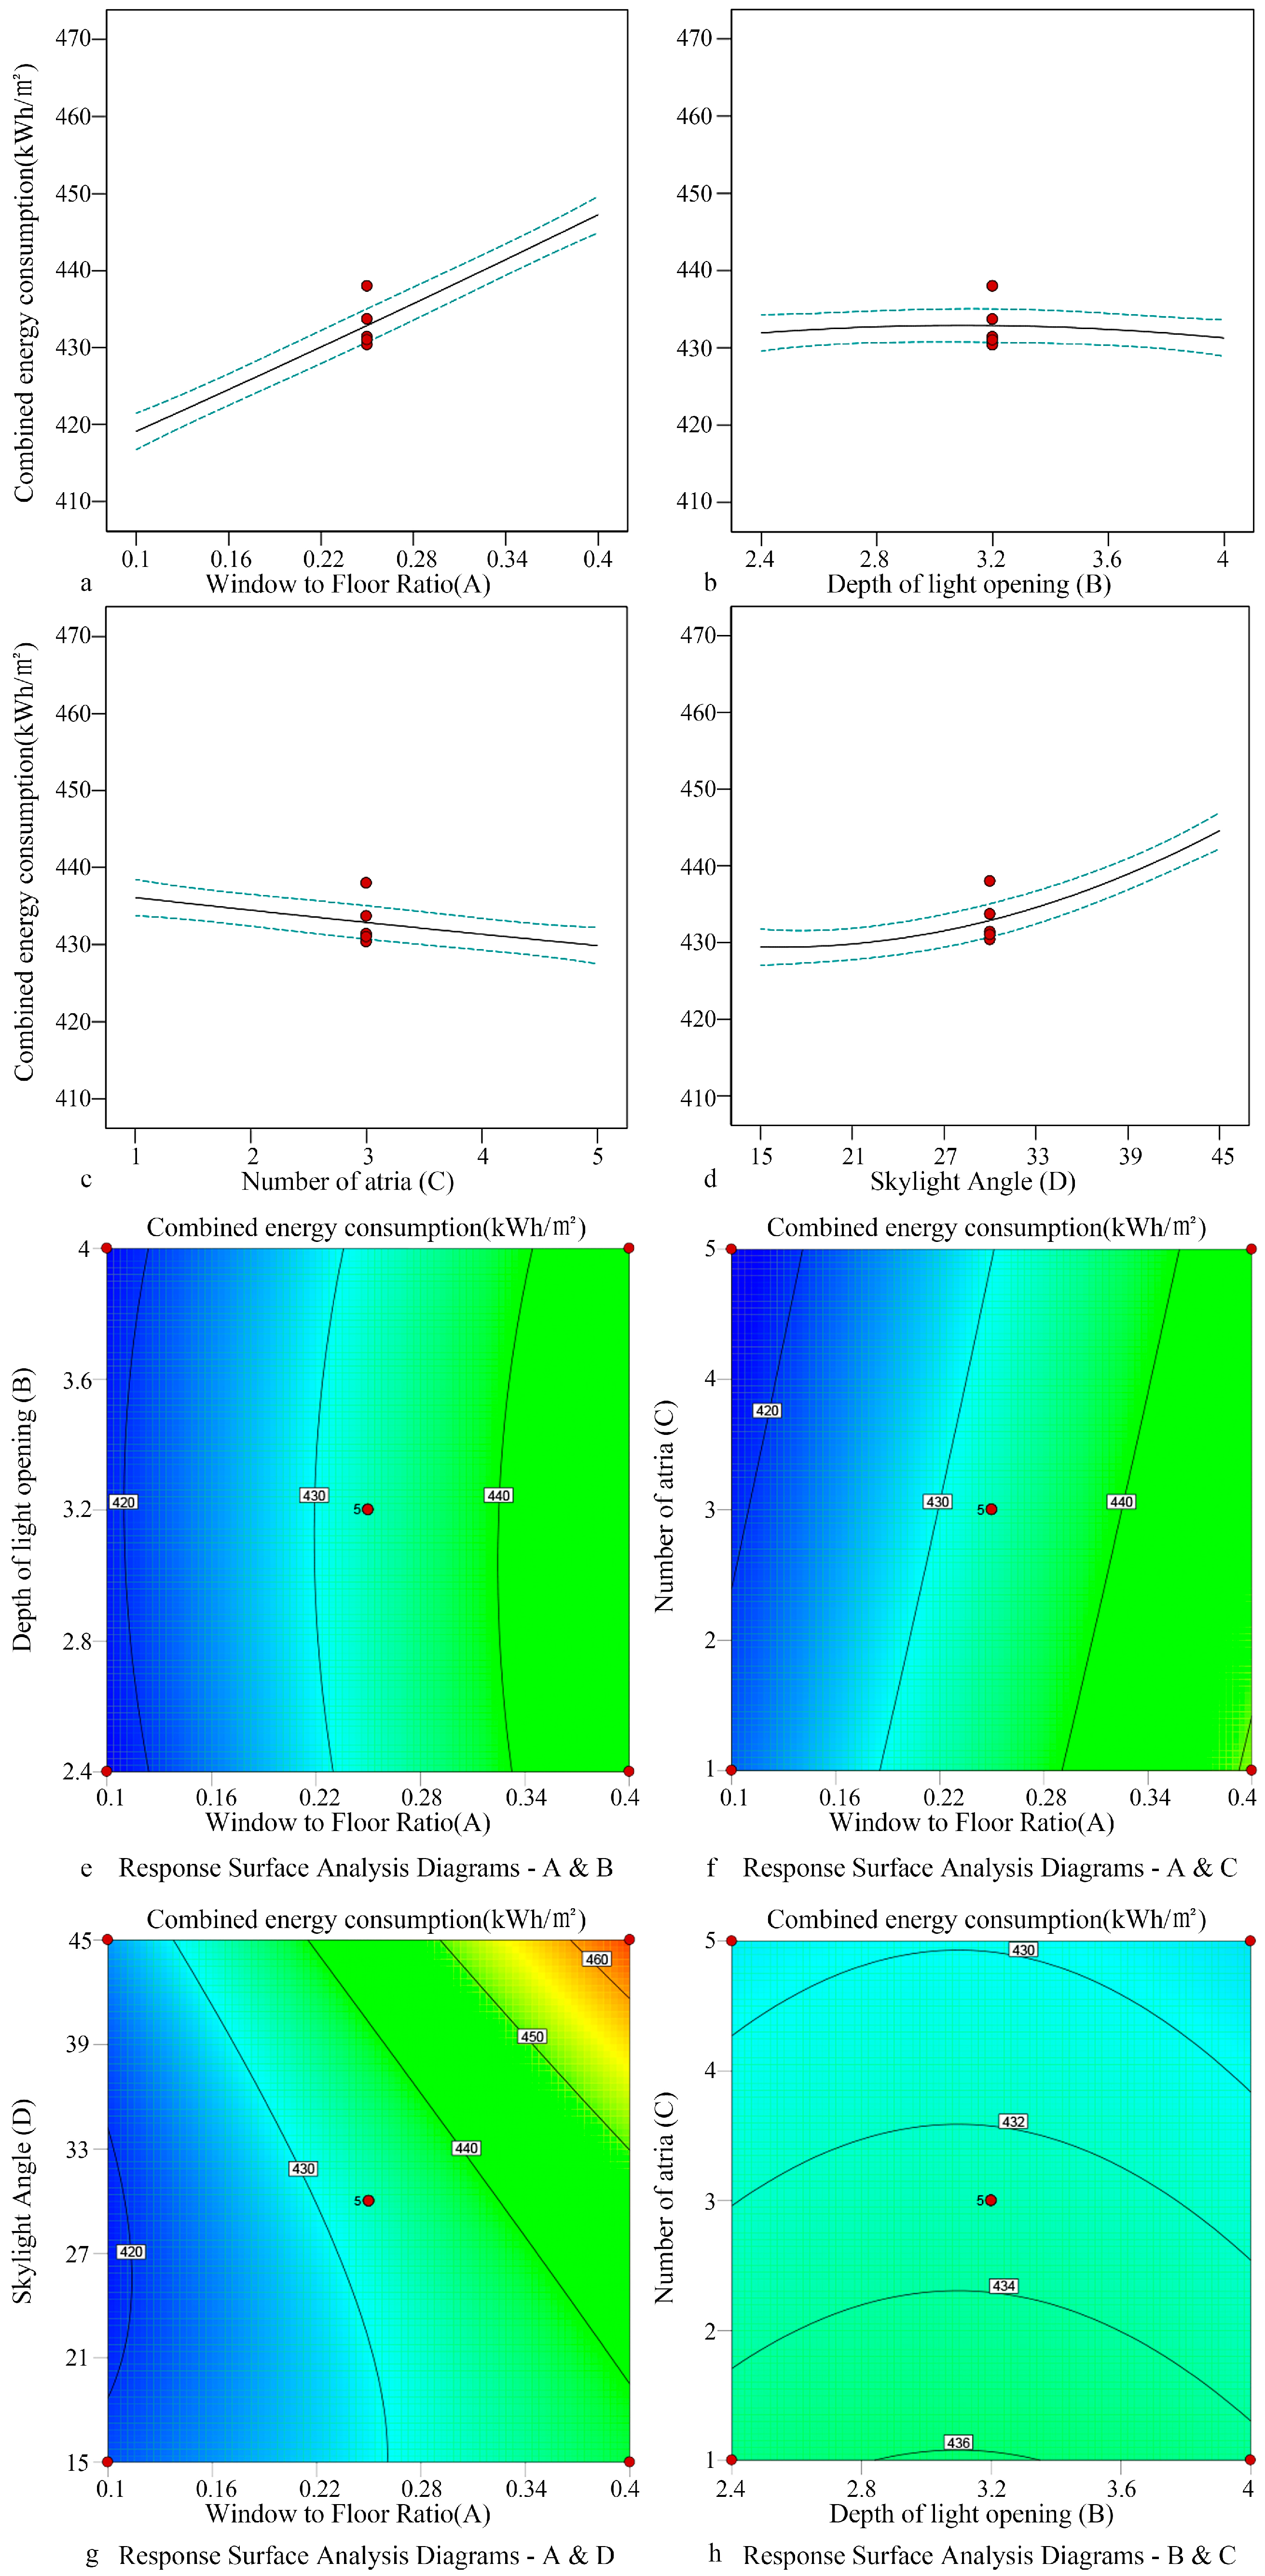
3.3. Optimization Strategies
3.3.1. Partitioned Daylighting Space
3.3.2. Open Atrium-Style Daylighting Space
3.3.3. Practical Feasibility and Cost Considerations
4. Conclusions
- 1.
- In terms of skylight daylighting and thermal environmental characteristics, the illumination of skylight areas was significantly affected by external solar radiation and climate conditions, fluctuating with time, while the illumination of artificially lit areas was more stable. The daily fluctuation range of the surface temperature under the skylights was significantly larger than that of ground and air temperature. However, due to the effective adjustment of air conditioning system, the difference in air temperature between the skylight and artificial lighting areas was small, and the overall temperature was kept within a comfortable range. The daylighting effect of station B in Shanghai was better than that of station A. At station B, with a large skylight daylighting area, the quality of light environment improved, but the demand for the adjustment of thermal environment also increased.
- 2.
- Ten sample models of common skylight daylighting in the public areas of subway stations were summarized. They can be divided into centralized and decentralized types according to the number of light openings, and the roofs can be partitioned into flat, double slope, and arched roofs according to skylight angle. Among them, decentralized daylighting space usually does not use arched roofs. According to the spatial classification of partitioned and open atrium-style public areas, 10 sample models of common skylight daylighting space were formed. This study revealed that under the premise of ensuring indoor light and thermal environmental comfort, the decentralized double slope roof structure is preferable, followed by the centralized double slope roof structure.
- 3.
- Aiming to optimize combined energy consumption through design, the optimized parameters of skylight daylighting space were determined as follows. In the decentralized daylighting space, the number of light openings was 6, and the aspect ratio of light openings was 2.5–3; depth was 4 m, and the skylight angle of a double slope roof skylight was 15°. In the centralized daylighting space in the partitioned public area, the window-to-floor ratio of flat and arched roofs was 0.08, and that of a double slope roof was 0.18; the aspect ratio of light openings was 7–8, and depth was 3–4 m; skylight angle was 15–25°. In the open atrium-style public area, the window-to-floor ratio of flat and arched roofs was 0.1, and that of a double slope roof was 0.4; the depth of light openings was 2.4–4 m, and the number of atriums was 5. The skylight angle was 15–30°.
Supplementary Materials
Author Contributions
Funding
Data Availability Statement
Conflicts of Interest
References
- Ma, C.; Peng, F.; Qiao, Y.; Li, H. Evaluation of spatial performance of metro-led urban underground public space: A case study in Shanghai. Tunn. Undergr. Space Technol. 2022, 124, 104484. [Google Scholar] [CrossRef]
- Zhang, Z.; Qin, Y.; Jia, L. Discrete modeling approach for emergency guidance signage system design in underground spaces: A case study in transportation hubs. Tunn. Undergr. Space Technol. 2022, 120, 104275. [Google Scholar] [CrossRef]
- Passi, A.; Nagendra, S.M.S.; Maiya, M.P. Characteristics of indoor air quality in underground metro stations: A critical review. Build. Environ. 2021, 198, 107907. [Google Scholar] [CrossRef]
- Wu, Z.; Ji, X.; Zhou, X.; Tong, S. Research on Environmental Suitability Evaluation of the Transfer Spaces in Urban Subway Stations. Buildings 2022, 12, 2209. [Google Scholar] [CrossRef]
- Dussault, J.; Gosselin, L.; Galstian, T. Integration of smart windows into building design for reduction of yearly overall energy consumption and peak loads. Sol. Energy 2012, 86, 3405–3416. [Google Scholar] [CrossRef]
- Tsikaloudaki, K.; Laskos, K.; Theodosiou, T.; Bikas, D. The energy performance of windows in Mediterranean regions. Energy Build. 2015, 92, 180–187. [Google Scholar] [CrossRef]
- Kim, J.T.; Todorovic, M.S. Tuning control of building glazing’s transmittance dependence on the solar radiation wavelength to optimize daylighting and building’s energy efficiency. Energy Build. 2013, 63, 108–118. [Google Scholar] [CrossRef]
- Pu, J.; Shen, C.; Wang, J.; Zhang, Y.; Zhang, C.; Kalogirou, S.A. Near-infrared absorbing glazing for energy-efficient windows: A critical review and performance assessments from the building requirements. Nano Energy 2023, 110, 108334. [Google Scholar] [CrossRef]
- Liu, X.; Shen, C.; Yang, H.; Wang, J. Comprehensive investigation on lighting and energy-saving performance of lighting/heating coupled tubular daylighting devices integrated with nanofluids. Appl. Therm. Eng. 2024, 239, 122094. [Google Scholar] [CrossRef]
- Zhao, J.; Dong, J.; Zhang, X.; Na, Y.; Jiang, C.; He, F.; Cui, Q.; Liu, J. Field measurement of microclimate of sunken square and its effect on indoor environment of underground metro station in subtropical region. Build. Environ. 2023, 228, 109873. [Google Scholar] [CrossRef]
- Huang, S.; Hao, S.; Li, J.; Dong, J.; Liu, J. Effects of large skylights on lighting and thermal environments in underground public transport hubs: A case study in Shenzhen. Build. Environ. 2024, 250, 111182. [Google Scholar] [CrossRef]
- Yuan, J.; Yu, Q.; Yao, S.; Ma, X.; Sun, Z. Multi-objective optimization for the daylighting and thermal comfort performance of elevated subway station buildings in cold climate zone of China. J. Build. Eng. 2023, 78, 107771. [Google Scholar] [CrossRef]
- Wang, C.; Li, C.; Xie, L.; Wang, X.; Chang, L.; Wang, X.; Li, H.; Liu, Y. Thermal environment and thermal comfort in metro systems: A case study in severe cold region of China. Build. Environ. 2023, 227, 109758. [Google Scholar] [CrossRef]
- Katavoutas, G.; Assimakopoulos, M.N.; Asimakopoulos, D.N. On the determination of the thermal comfort conditions of a metropolitan city underground railway. Sci. Total Environ. 2016, 566–567, 877–887. [Google Scholar] [CrossRef]
- Pan, S.; Liu, Y.; Xie, L.; Wang, X.; Yuan, Y.; Jia, X. A thermal comfort field study on subway passengers during air-conditioning season in Beijing. Sustain. Cities Soc. 2020, 61, 102218. [Google Scholar] [CrossRef]
- Passi, A.; Nagendra, S.M.; Maiya, M.P. Evaluation of comfort perception of passengers in urban underground metro stations. Energy Sustain. Dev. 2022, 68, 273–288. [Google Scholar] [CrossRef]
- Li, Y.; Geng, S.; Zhang, X.; Zhang, H. Study of thermal comfort in underground construction based on field measurements and questionnaires in China. Build. Environ. 2017, 116, 45–54. [Google Scholar] [CrossRef]
- Li, X.; Shi, W.; Liu, Y.; Zhang, N. Optimization Strategy for Thermal Comfort in Railway Stations above Ground Level in Beijing. Buildings 2024, 14, 2843. [Google Scholar] [CrossRef]
- Futrell, B.J.; Ozelkan, E.C.; Brentrup, D. Bi-Objective optimization of building enclosure design for thermal and lighting performance. Build. Environ. 2015, 92, 591–602. [Google Scholar] [CrossRef]
- Wang, H.; Lu, Z.; Wojtasiak, A.; Owyong, S.; Sun, B.; Fang, Y.; Vassigh, S.; Lin, A. Biomimetic self-shading walls via 3D-printing for reduced heat gain: Multiscale learning using graph neural networks to predict solar radiation absorption. Build. Environ. 2025, 279, 113048. [Google Scholar] [CrossRef]
- Motamedi, S.; Liedl, P. Integrative algorithm to optimize skylights considering fully impacts of daylight on energy. Energy Build. 2017, 138, 655–665. [Google Scholar] [CrossRef]
- Fang, Y.; Cho, S. Design Optimization of building geometry and fenestration for daylighting and energy performance. Sol. Energy 2019, 191, 7–18. [Google Scholar] [CrossRef]
- Shi, L.; Li, Y.; Tao, L.; Zhang, Y.; Jiang, X.; Yang, Z.; Qi, X.; Qiu, J. Sporters’ visual comfort assessment in gymnasium based on subjective evaluation & objective physiological response. Build. Environ. 2022, 225, 109678. [Google Scholar]
- Bian, Y.; Luo, Y.; Hu, L.; Liu, L.; Pang, Y. Visual discomfort assessment in an open-plan space with skylights: A case study with POE survey and retrofit design. Energy Build. 2021, 248, 111215. [Google Scholar] [CrossRef]
- Loy-Benitez, J.; Li, Q.; AIfaei, P.; Nam, K.; Heo, S.; Yoo, C. A dynamic gain-scheduled ventilation control system for a subway station based on outdoor air quality conditions. Build. Environ. 2018, 144, 159–170. [Google Scholar] [CrossRef]
- Albatayneh, A.; Juaidi, A.; Abdallah, R.; Manzano-Agugliaro, F. Influence of the advancement in the LED lighting technologies on the optimum windows-to-wall ratio of Jordanians residential buildings. Energies 2021, 14, 5446. [Google Scholar] [CrossRef]
- Al-Janabi, A.; Kavgic, M.; Mohammadzadeh, A.; Azzouz, A. Comparison of EnergyPlus and IES to model a complex university building using three scenarios: Free-floating, ideal air load system, and detailed. J. Build. Eng. 2019, 22, 262–280. [Google Scholar] [CrossRef]
- Pan, Y.; Zhu, M.; Lv, Y.; Yang, Y.; Liang, Y.; Yin, R.; Yang, Y.; Jia, X.; Wang, X.; Zeng, F.; et al. Building energy simulation and its application for building performance optimization: A review of methods, tools, and case studies. Adv. Appl. Energy 2023, 10, 100135. [Google Scholar] [CrossRef]
- Sun, W.; Feng, L.; Abed, A.M.; Sharma, A.; Arsalanloo, A. Thermoeconomic assessment of a renewable hybrid RO/PEM electrolyzer integrated with Kalina cycle and solar dryer unit using response surface methodology (RSM). Energy 2022, 260, 124947. [Google Scholar] [CrossRef]
- Wang, Y.; Yang, W.; Wang, Q. Multi-objective parametric optimization of the composite external shading for the classroom based on lighting, energy consumption, and visual comfort. Energy Build. 2022, 275, 112441. [Google Scholar] [CrossRef]
- Yin, Y.; Zhang, D.; Zhen, M.; Jing, W.; Luo, W.; Feng, W. Combined effects of the thermal-acoustic environment on subjective evaluations in outdoor public spaces. Sustain. Cities Soc. 2022, 77, 103522. [Google Scholar] [CrossRef]
- Wang, H.; Owyong, S.; Shi, A.; Shin, S.; Nguyen, T.H.; Lin, A. Investigating on thermal insulation in concrete partition wall with insulation-material-infilled Voronoi sections. J. Build. Eng. 2024, 96, 110437. [Google Scholar] [CrossRef]
- Bi, Y.; Lin, Y.; Qin, L.; Wang, H.; Sun, R. Performance optimization of a solar air conditioning with a three-phase accumulator based on the energy-economic analysis. J. Build. Eng. 2022, 59, 105065. [Google Scholar] [CrossRef]
- Yu, Z.; Zhu, X.; Liu, X. Characterizing metro stations via urban function: Thematic evidence from transit-oriented development (TOD) in Hong Kong. J. Transp. Geogr. 2022, 99, 103299. [Google Scholar] [CrossRef]
- Su, S.; Zhang, H.; Wang, M.; Weng, M.; Kang, M. Transit-oriented development (TOD) typologies around metro station areas in urban China: A comparative analysis of five typical megacities for planning implications. J. Transp. Geogr. 2021, 90, 102939. [Google Scholar] [CrossRef]
- Kumar, P.; Sekhar, P.C.H.; Ravi, C.H.; Parida, M. Identification of neighborhood typology for potential transit-oriented development. Transp. Res. D 2020, 78, 102218. [Google Scholar]
- Hu, M.; Liu, M.; You, D.; Zhang, Y. Influence of train arrival characteristics on unorganized ventilation in underground subway station with platform screen doors. J. Wind Eng. Ind. Aerod. 2020, 198, 104089. [Google Scholar] [CrossRef]
- Antoniou, F.; Aretoulis, G.; Giannoulakis, D.; Konstantinidis, D. Cost and material quantities prediction models for the construction of underground metro stations. Buildings 2023, 13, 382. [Google Scholar] [CrossRef]


| Classification | Indicator | Value Range | Unit | Data Source | Schematic Diagram |
|---|---|---|---|---|---|
| Planar form | Length-to-width ratio of light openings (decentralized) | 1–3 | Actual measurement |  | |
| Length-to-width ratio of light openings (centralized) | 4–6 | Actual measurement | 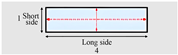 | ||
| Window-to-floor ratio (decentralized) | 0.08–0.2 | Actual measurement | 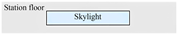 | ||
| Window-to-floor ratio (centralized) | 0.1–0.4 | Actual measurement |  | ||
| Profile form | Depth of light openings | 2.4–4 | m | Actual measurement |  |
| Number of atriums | 1–5 | ° | Actual measurement | 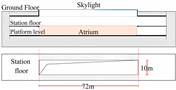 | |
| Skylight angle (flat roof) | 0 | ° | Actual measurement | / | |
| Skylight angle (double slope and arched roofs) | 15–45 | ° | Actual measurement |  | |
| Interface form | Number of light openings (decentralized) | 2–6 | Actual measurement |  | |
| Number of light openings (centralized) | 1 | Actual measurement |  |
| Station | Skylight Type | Skylight Size (m) | Test Dates | Air Conditioner On Status | Skylight Open Status | Measurement Layout |
|---|---|---|---|---|---|---|
| A | Partitioned Rectangular | 28*5.2 | Jul 25–26 (Summer), Jan 7–8 (Winter) | YES (uniform setting) | NO | Skylight Area 2 m |
| Artificial Lighting Area 6–8 m | ||||||
| B | Open Atrium-style Rectangular | 82*10 | Jul 28–29 (Summer), Jan 9 (Winter) | YES (uniform setting) | NO | All Areas 4 m |
| Instrument Name | Model Number | Test Objects | Test Range | Resolution | Test Accuracy |
|---|---|---|---|---|---|
| Handheld illuminance meter | TES-1332A | Illumination | 0–20,000 lx | 0.1 lx | ±3% |
| Handheld WBGT tester | AZ8778 | Air Temperature | 0–50 °C | 0.1 °C | ±0.6 °C |
| Handheld WBGT tester | AZ8778 | Black sphere temperature | 0–80 °C | 0.1 °C | (15–40 °C) ±1 °C |
| Infrared thermometer | DM-5005 | Wall temperature | −50–900 °C | 0.1 °C | ±1 °C |
| Wireless mini hot-wire anemometer | TESTO 405i | Wind speed | 0.01–20 m/s | 0.01 m/s | 0.03 m/s + 4% |
| Total solar radiation sensor | YGC-TBQ | Solar radiation intensity | 0–2000 W/m2 | 1 W/m2 | ±5% |
| Name of Envelope | Characteristic | Surface Type |
|---|---|---|
| Skylight | Transparent envelopes | Skylight |
| Ceiling | Non-transparent envelopes | Underground ceiling |
| Wall | Non-transparent envelopes | Underground wall |
| Ground | Non-transparent envelopes | Underground slab |
| Style | Sample Type | Number of Daylighting Openings | Daylighting Opening Aspect Ratio | Daylighting Opening Depth (m) | Skylight Angle (°) | WFR | Number of Atriums | Combined Energy Consumption (kW·h/m2) |
|---|---|---|---|---|---|---|---|---|
| Partitioned | Decentralized flat roof | 6 | 3 | 4 | / | / | / | 394.17 |
| Decentralized double slope roof | 6 | 2.6 | 4 | 15 | / | / | 385.14 | |
| Centralized flat roof | / | 8 | 4 | / | 0.08 | / | 398.48 | |
| Centralized double slope roof | / | 8 | 3 | 15 | 0.18 | / | 392.28 | |
| Centralized arched roof | / | 7.2 | 4 | 22 | 0.08 | / | 397.58 | |
| Open atrium | Decentralized flat roof | 6 | 3 | 4 | / | / | / | 411.82 |
| Decentralized double slope roof | 6 | 3 | 3 | 15 | / | 5 | 403.48 | |
| Centralized flat roof | / | / | 4 | / | 0.1 | 5 | 417.15 | |
| Centralized double slope roof | / | / | 2.4 | 15 | 0.4 | 5 | 404.86 | |
| Centralized arched roof | / | / | 2.4 | 27 | 0.1 | 5 | 414.81 |
Disclaimer/Publisher’s Note: The statements, opinions and data contained in all publications are solely those of the individual author(s) and contributor(s) and not of MDPI and/or the editor(s). MDPI and/or the editor(s) disclaim responsibility for any injury to people or property resulting from any ideas, methods, instructions or products referred to in the content. |
© 2025 by the authors. Licensee MDPI, Basel, Switzerland. This article is an open access article distributed under the terms and conditions of the Creative Commons Attribution (CC BY) license (https://creativecommons.org/licenses/by/4.0/).
Share and Cite
Liu, X.; Sun, B.; Ji, X.; Hua, C.; Chen, Y.; Zhang, H. Study on the Influence and Optimization of Skylight Daylighting Spatial Form on Light and Thermal Performance in Shallow Buried Subway Stations: A Case Study of Shanghai. Buildings 2025, 15, 1926. https://doi.org/10.3390/buildings15111926
Liu X, Sun B, Ji X, Hua C, Chen Y, Zhang H. Study on the Influence and Optimization of Skylight Daylighting Spatial Form on Light and Thermal Performance in Shallow Buried Subway Stations: A Case Study of Shanghai. Buildings. 2025; 15(11):1926. https://doi.org/10.3390/buildings15111926
Chicago/Turabian StyleLiu, Xinyu, Bo Sun, Xiang Ji, Chen Hua, Yidong Chen, and Hong Zhang. 2025. "Study on the Influence and Optimization of Skylight Daylighting Spatial Form on Light and Thermal Performance in Shallow Buried Subway Stations: A Case Study of Shanghai" Buildings 15, no. 11: 1926. https://doi.org/10.3390/buildings15111926
APA StyleLiu, X., Sun, B., Ji, X., Hua, C., Chen, Y., & Zhang, H. (2025). Study on the Influence and Optimization of Skylight Daylighting Spatial Form on Light and Thermal Performance in Shallow Buried Subway Stations: A Case Study of Shanghai. Buildings, 15(11), 1926. https://doi.org/10.3390/buildings15111926