Article

Analysis of Seismic Performance for Segmentally Assembled Double-Column Bridge Structures Based on Equivalent Stiffness

School of Transportation Science and Engineering, Jilin Jianzhu University, Changchun 130118, China
*
Author to whom correspondence should be addressed.
Buildings 2025, 15(11), 1919; https://doi.org/10.3390/buildings15111919
Submission received: 23 April 2025 / Revised: 23 May 2025 / Accepted: 27 May 2025 / Published: 2 June 2025
(This article belongs to the Section Building Structures)

Abstract

Double-column self-centering segmentally assembled bridges (SC-SABs) present greater design complexity compared to single-column systems, primarily due to vertical stiffness discontinuities at segmental spandrel abutments, which critically affect the refinement of their seismic design methods. To address these challenges, this study conducts a systematic investigation into the mechanical behavior and seismic performance of double-column SC-SAB. First, leveraging fundamental mechanical principles and stress-strain relationships, the coupling mechanism between the two columns is analytically established. An analytical expression for the elastic stiffness of a double-column SC-SAB, when simplified to an equivalent single-column system, is derived. This establishes the equivalent stiffness conditions for reducing a double-column system to a single-column model, and the overall equivalent stiffness of the double-column system is formulated. To validate the theoretical framework, a finite element model of the double-column SC-SAB is developed using OpenSees (1.0.0.1 version). An equivalent single-column model is constructed based on the derived stiffness equivalence conditions. By comparing the peak displacement and bearing capacity between the double-column and equivalent single-column models, the accuracy and feasibility of the simplification approach are confirmed. The numerical results further validate the derived overall equivalent stiffness, providing a robust theoretical foundation for simplified engineering applications. Additionally, pushover analysis and hysteretic response analysis are performed to systematically evaluate the influence of key design parameters on the seismic performance of double-column SC-SAB. The results demonstrate that the prestressed twin-column system exhibits excellent self-centering capability, effectively controlling residual displacements, aligning with seismic resilience goals. This research advances the seismic design methodology for SC-SAB by resolving critical challenges in stiffness equivalence and joint behavior quantification. The findings of this study can be utilized to derive equivalent damping ratios and equivalent periods. Based on the displacement response spectrum, the pier-top displacement and maximum force can be determined, thereby enabling a displacement-based seismic design approach. This research holds significant theoretical and practical value for advancing seismic design methodologies for self-centering segmental bridge piers and enhancing the seismic safety of bridge structures.

1. Introduction

In recent years, double-column self-centering segmental assembled bridges (SC-SABs) have received widespread attention in modern bridge engineering due to their excellent seismic performance and construction efficiency [1]. Compared with traditional cast-in-place bridges, SC-SABs achieve a self-centering function after an earthquake by pre-tensioning high-strength steel strands, which effectively avoids the residual deformation problem of traditional abutments [2,3,4] and significantly improves the recoverability of the structure [5,6]. Studies have shown that these bridges can reduce the cost of post-earthquake rehabilitation by 40–60% and shorten the construction period by more than 50%, which is especially suitable for rapid reconstruction in high-intensity seismic zones [5,6]. However, the shear capacity of their assembled joints is not as good as that of monolithic cast-in-place structures, reducing energy consumption capacity by about 30–50% [7,8,9]. Experimental studies have shown that the equivalent damping ratio of SC-SAB meeting the self-centering requirements is usually only 40–60% of that of cast-in-place piers [10,11], and this “high resetting-low energy consumption” characteristic limits its application in high-intensity seismic zones. To further improve the energy-consuming capacity of self-centering segmental assembled bridges, researchers have optimized the steel-yielding device, external dampers, friction energy-consuming joints, and new energy-consuming materials, etc., so that the hysteretic energy dissipation of SC-SAB is similar to that of monolithic cast-in-place abutments, and its energy-consuming capacity has been improved.
Important progress has been made in experimental studies and numerical simulations of SC-SAB. Zhu Zhao et al. [12,13] investigated the seismic performance of assembled piers (partially prefabricated piers and prefabricated segmental piers) and compared them to traditional cast-in-place piers by conducting a proposed static cyclic test to investigate the seismic performance of the assembled piers, focusing on the balance between the self-centering capacity and the energy-consuming capacity, optimizing the joints design and material application, and improved design to enhance the suitability of assembled piers in seismic zones. In addition, researchers have explored a variety of novel materials and structural forms to improve the overall performance of SC-SAB. Recent studies have shown that, through the synergistic optimization of innovative materials and structural design, the seismic performance of SC-SAB piers has made a significant breakthrough. Qian et al. [14,15,16,17,18,19,20] systematically investigated the effect of the combination of ECC plastic hinge zone and SMA reinforcement, and the experiments have shown that the combination of ECC with the SMA reinforcement can simultaneously achieve a residual displacement ratio of <0.5% (self-centering capacity) and an equivalent damping ratio up to 7.2% (energy dissipation capacity) when the strain of SMA reinforcement is controlled to be less than 6%. The crack width in the plastic hinge zone of ECC is reduced by 82% compared with that of ordinary concrete, and the SMA reinforcement remains superelastic after 10 cycles. By adding energy-consuming devices and using high-performance materials, the SC-SAB can effectively make up for the shortcomings of their energy-consuming capacity and significantly enhance the overall seismic performance. Sideris et al. [21] conducted shaking table tests and proposed static analyses for SC-SAB with specific configurations. It was found that the joint at the bottom of the abutment consumed the most energy due to the largest opening and closing amplitude, and significant concrete crushing damage was observed. In addition, the second joint at the bottom of the abutment also resulted in significant energy dissipation in the reinforcement due to slip action. Wu, Jing et al. [22] conducted a study on post-tensioned precast reinforced concrete abutments, where an external replaceable energy dissipator (ERED) was introduced to improve the seismic performance of the abutments. The results show that PRCB-EREDs achieve good deformability and energy dissipation characteristics under cyclic loading, and the hysteresis curves are full and stable, which verifies the feasibility of rehabilitation. With the increase in the initial post-tensioning force, the stiffness and bearing capacity of the piers were improved, and the self-recovery effect was also improved.
The research on the seismic performance of SC-SAB has formed a relatively perfect theoretical system, and especially concerning single-column piers, it has made significant progress. Existing studies have shown that the design method based on displacement ductility can effectively control the residual displacement of single-column piers (usually <1% of the pier height), and the error between the theoretical model and the test results is generally controlled within 15% [21,22]. However, there are still obvious deficiencies in the research on double-column self-centering piers: the coupling effect between the two piers leads to an overestimation of the stiffness of the traditional single-column theory by 20–30% [23]; the quantitative relationship between the rotational stiffness of the joints and the overall seismic performance has not yet been established [24]. In this paper, the seismic performance and design method of double-column self-centering bridges are investigated, and the mechanical behavior of joints is investigated based on the equivalent stiffness theory. The joint is an important boundary region of the structure, and its force behavior directly affects the stiffness, stability, and seismic performance of the whole structure. The equivalent stiffness can be used to derive the equivalent damping ratio and equivalent period. Based on the displacement response spectrum, the pier-top displacement and maximum force can be determined, thereby enabling a displacement-based seismic design approach [25]. Therefore, the joints of double-column SC-SAB are investigated to enrich the theoretical basis for the existing seismic design.
Based on the connection between the two piers of the double-column SC-SAB and its asynchronous characteristics during force and deformation, combined with the displacement and deformation theory, the equivalent single-column stiffness theory considering the coupling effect between the piers is established, and an analytical formula for the equivalent stiffness of the whole double-column is deduced; furthermore, a “three-spring” single-column equivalent double-column is put forward. Further, a simplified model of a “three-spring” single-column equivalent double-column is proposed. Through numerical simulation analysis, the correctness of the theoretical equations of equivalent single-column stiffness, the theoretical equations of equivalent double-column overall stiffness, and the simplified model are verified. In addition, this paper also investigates the influence of different parameters on the seismic performance of double-column SC-SAB. If the theoretical formula of equivalent stiffness can be derived to solve the problems of the complex design of double-column SC-SAB and the imperfect seismic design method of key nodes at joints, it will help promote the further development of the seismic design method of this type of bridge.

2. Equivalent Stiffness Theoretical Model and Derivation Formula

This section employs the finite strip method to analyze the damage mode of an SC-SAB under combined axial and bending loads, dividing the process into three stages. Additionally, based on the mechanical connection between the two columns of double-column SC-SAB and the peak displacement at peak capacity, we derive the equivalent single-column bridge stiffness and its overall equivalent stiffness for this type of bridge.

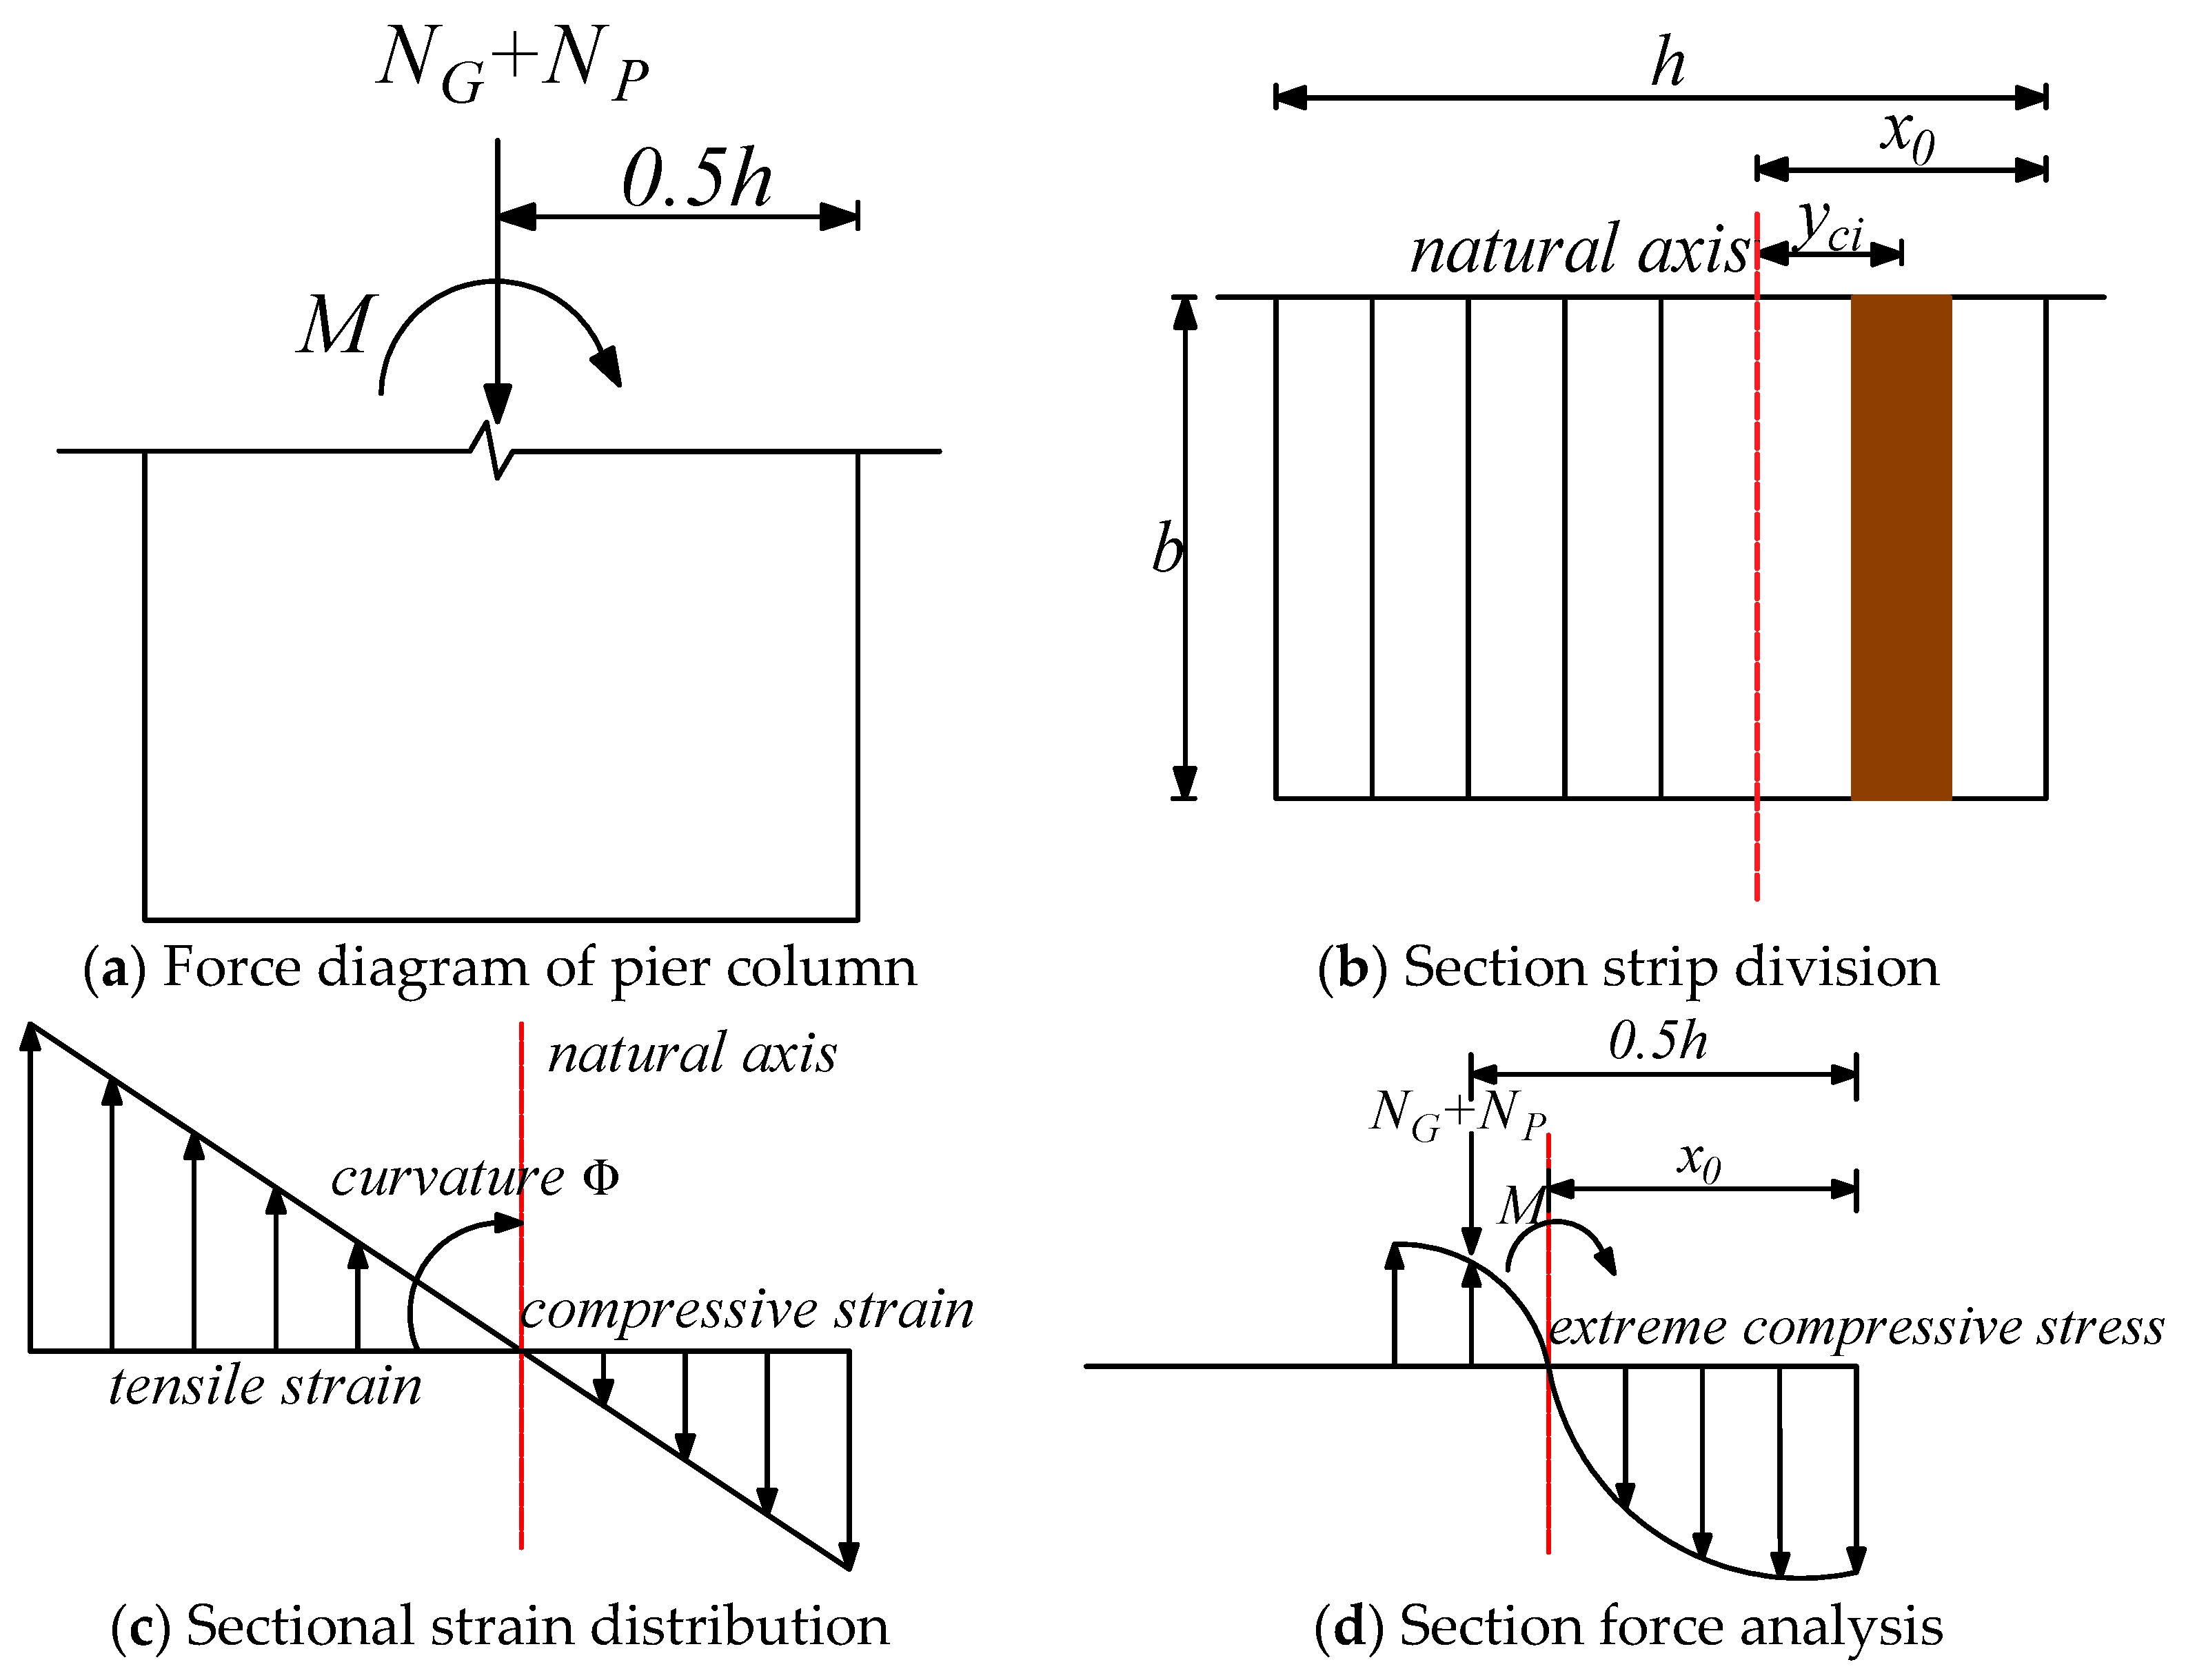
2.1. Finite Strip Method

The bearing capacity and deformation mode of double-column SC-SAB are determined by the cross-section properties, so the influence of key parameters on the mechanical properties of double-column SC-SAB can be more accurately understood through the sectional moment-curvature analysis. According to the Rules for Seismic Design of Highway Bridges of the People’s Republic of China [26], it is shown that double-column SC-SAB can be calculated through the finite strip method of sectional moment-curvature. The basic assumptions of the finite strip method [27] are as follows: (1) the cross-section deformation obeys the flat cross-section assumption; (2) the strains at each point within the same strip are equal; (3) the effect of shear strain is not considered. Figure 1 shows a sketch of the principle of analysis of a two-column SC-SAB using the finite strip method.
As shown in Figure 1, the bridge pier section is divided into “j” strips along the height direction, and the area of each strip “Aci” is “(b × h)/j”, of which “b” and “h” are, respectively, the width and height of the pier section. Since the two sides of the double-column bridge piers have the characteristic of unsynchronized force deformation, the most unfavorable pier force deformation is considered. According to the flat section assumption, given the curvature of the abutment section “ ”, we can use the axial force balance to determine the height of the cross-section pressure zone “ x ” and then determine the stress–strain distribution. The axial force equilibrium equation for the cross-section of one side of the double-column SC-SAB is
N G + N p + i = 1 j σ c i A c i = 0
Double-column SC-SABs are in an elastic working stage; under the action of seismic force, the stress–strain distribution of the pier cross-section can be determined according to the intrinsic relationship of the material through the method of finite strips using the corresponding cross-section bending bearing capacity, M u , and the pier-top peak bearing capacity can be expressed as follows: F m a x = M u / H . The bending capacity of the cross-section of a double-column SC-SAB is
M u = ( N G + N p ) h 2 + i = 1 j ( σ c i A c i ) y c i

2.2. Cross-Section Damage-State Analysis

Based on the flat cross-section assumption, the force mechanism and deformation state of double-column SC-SABs are the same as those of single-column SC-SABs, which can be classified into three destructive states of decompression, yielding, and design limits, as shown in Figure 2.

2.2.1. Decompression State

In the decompression state, the bridge pier components are in the elastic phase, the pier concrete cross-section is in the state of compression, concrete compressive stress can be offset by the external load generated via the bending moment, and the minimum compressive stress is zero. At this time, the abutment is in the state of decompression, and the cross-section moment becomes the decompression moment. The equilibrium equations of the axial force and bending moment in the decompression state are as follows:
N G + N p 1 2 f c b h = 0 M d e c = 1 3 f c b h 2 ( N G + N p ) h 2

2.2.2. Yield State

The yield state is between the decompression state and the limit state, the bending moment reaches the yield moment, M y, and the height of the pressure zone is xy. The pier enters into the yield state. At this time, the axial force and bending moment equations for the pier are as follows.
N G + N p 1 2 f c b x y = 0 M y = 1 2 f c b x y h x y 3 ( N G + N p ) h 2

2.2.3. Design-Limit States

The bridge-pier section bending moment increases to the edge of the compression zone where the concrete reaches the ultimate compressive strain, ε c u , and then the bending moment, M , reaches the ultimate bending moment, M u , the height of the compression zone is, x u , and it reaches the peak bearing capacity, F u . The equilibrium equations of the axial force and the bending moment of the abutment section in this state are
N G + N p 1 2 f c b x u = 0 M u = 1 2 f c b x u h x u 3 N G + N p h 2

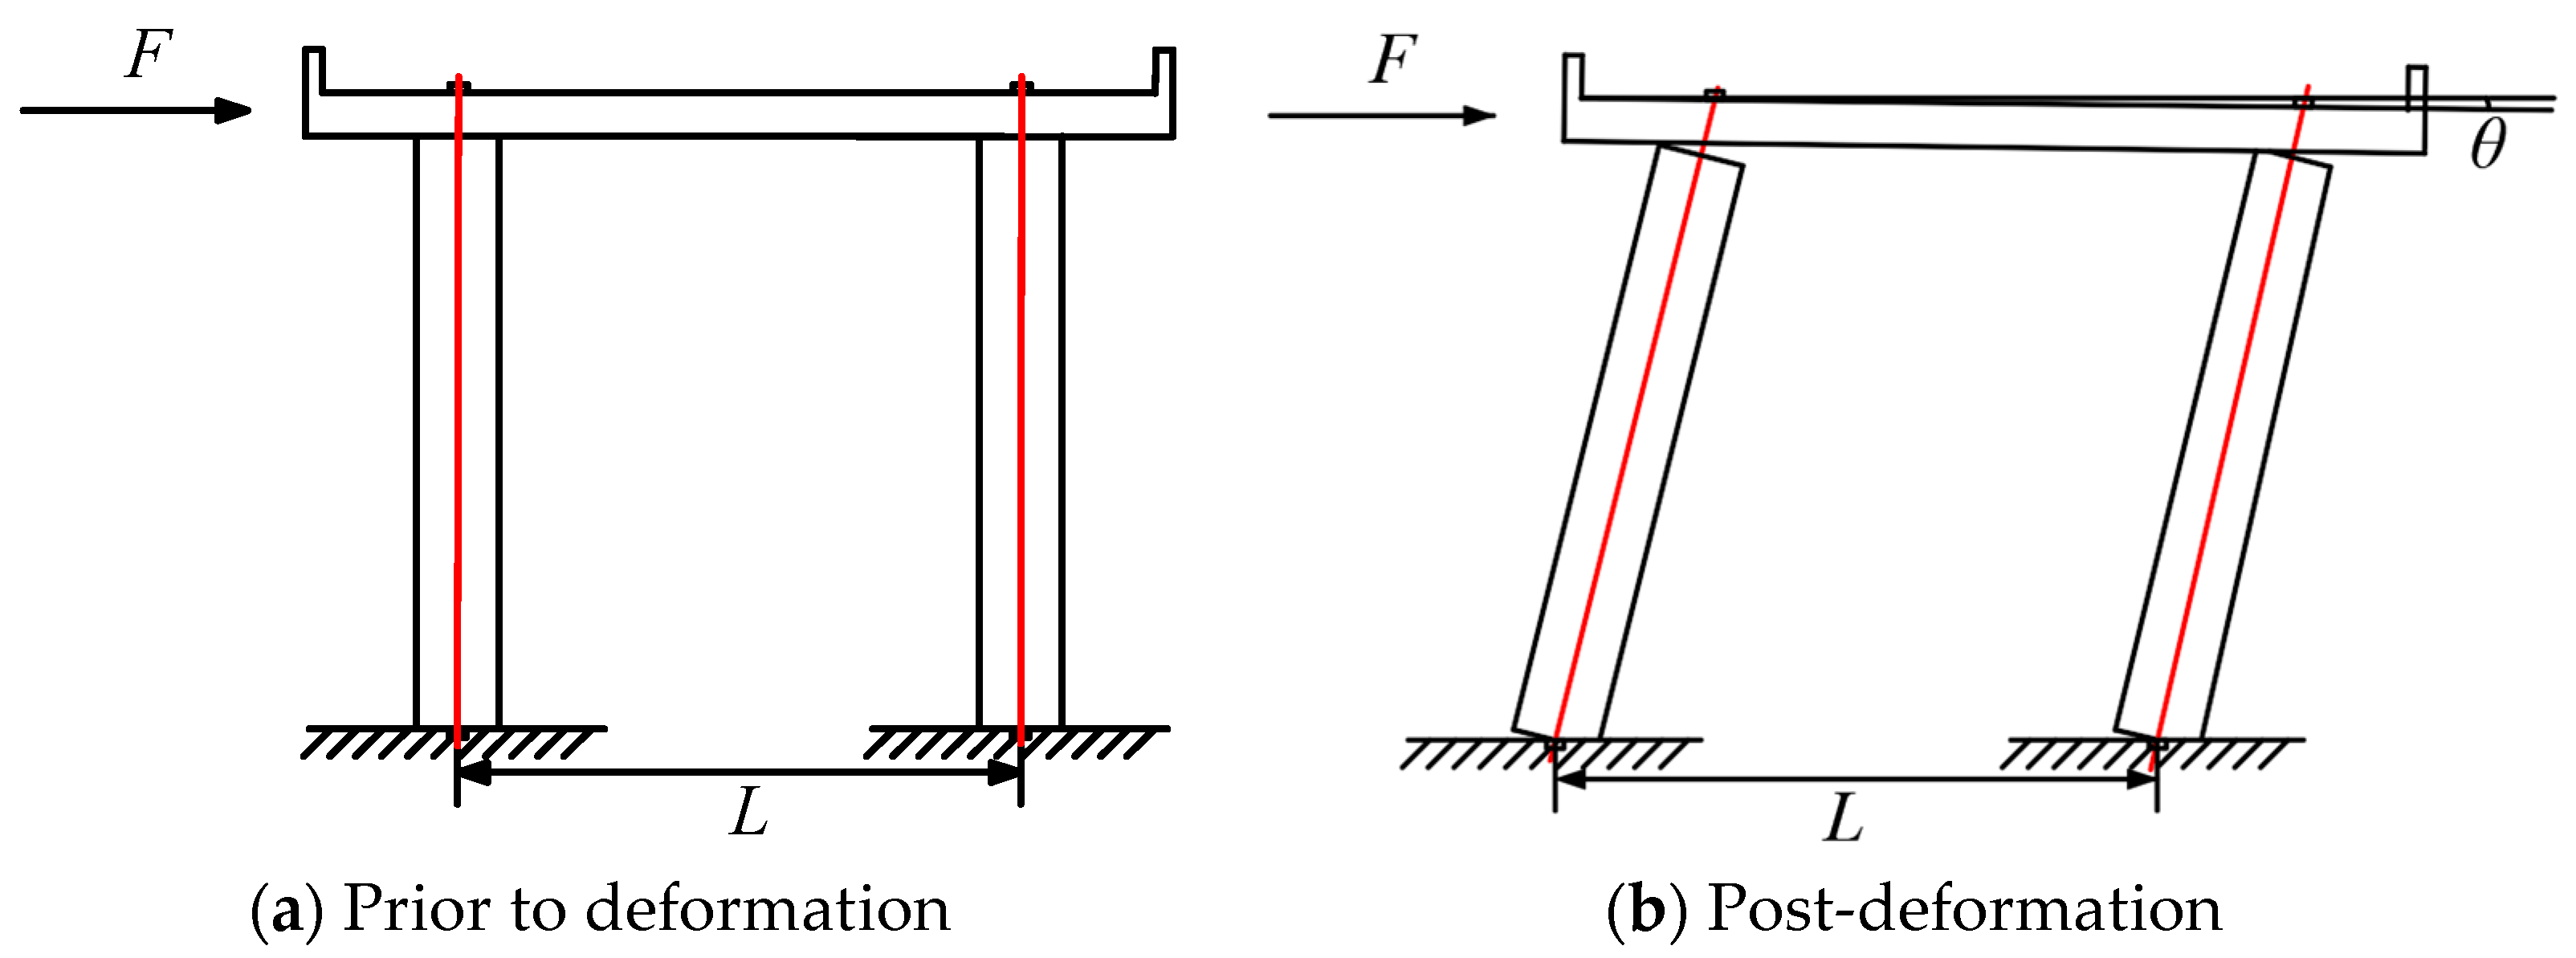
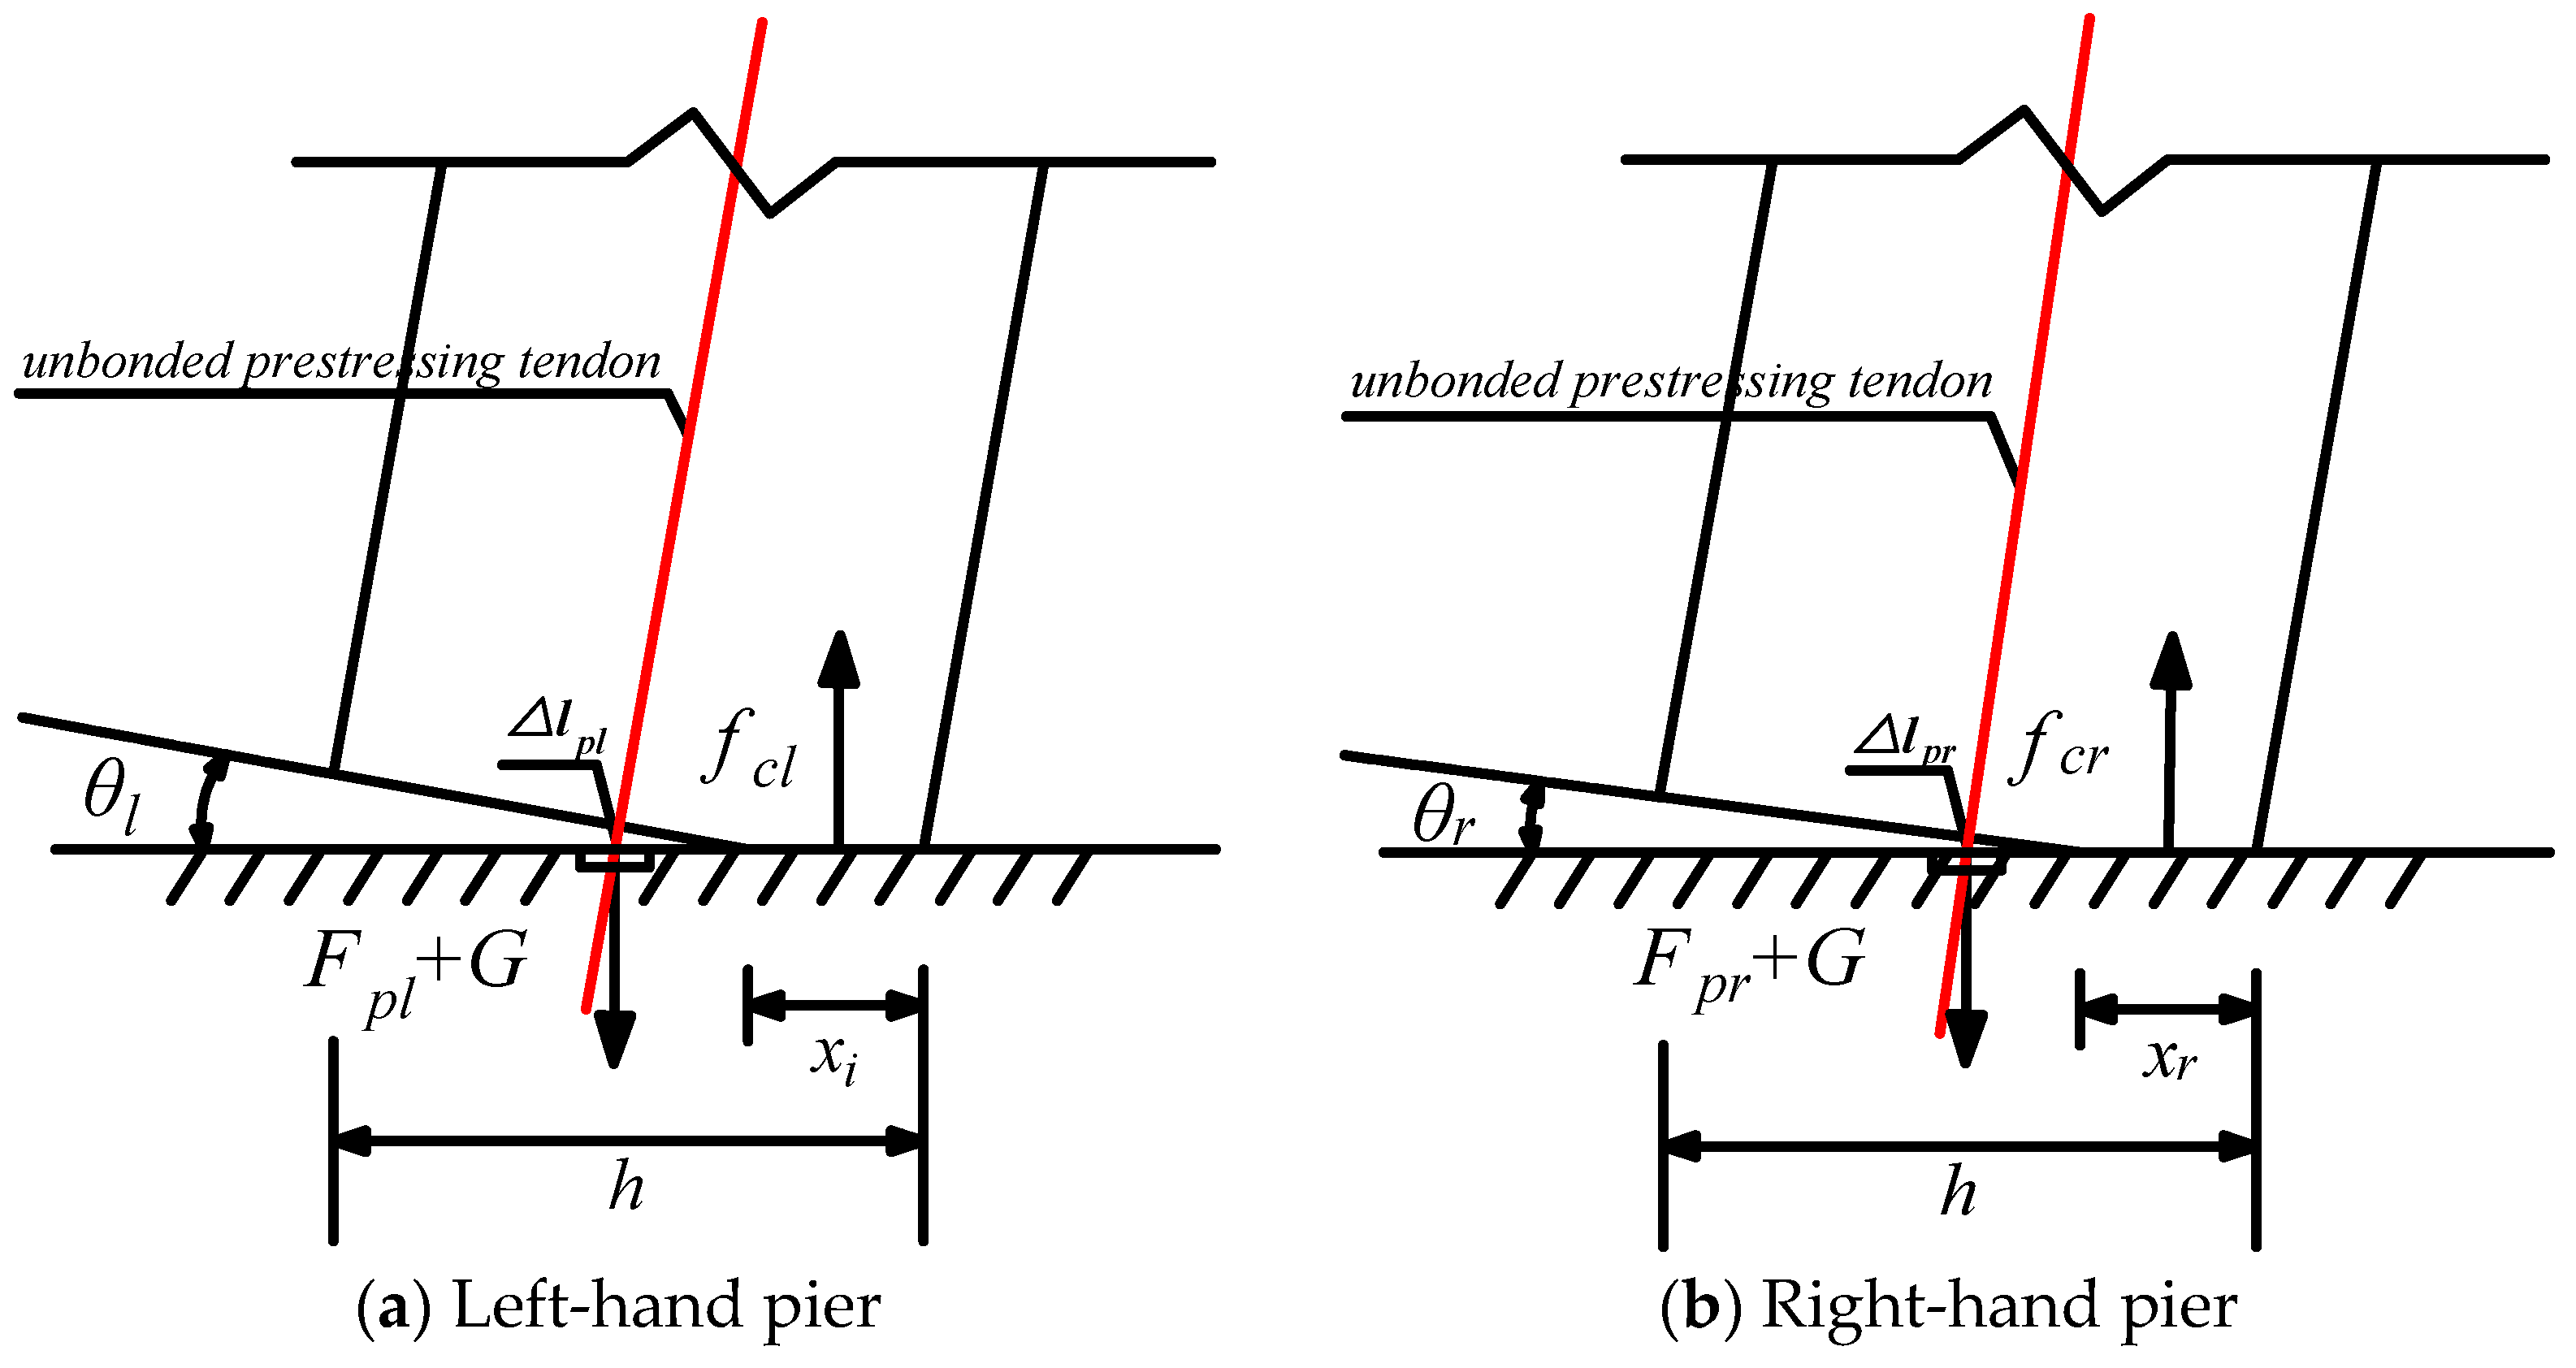
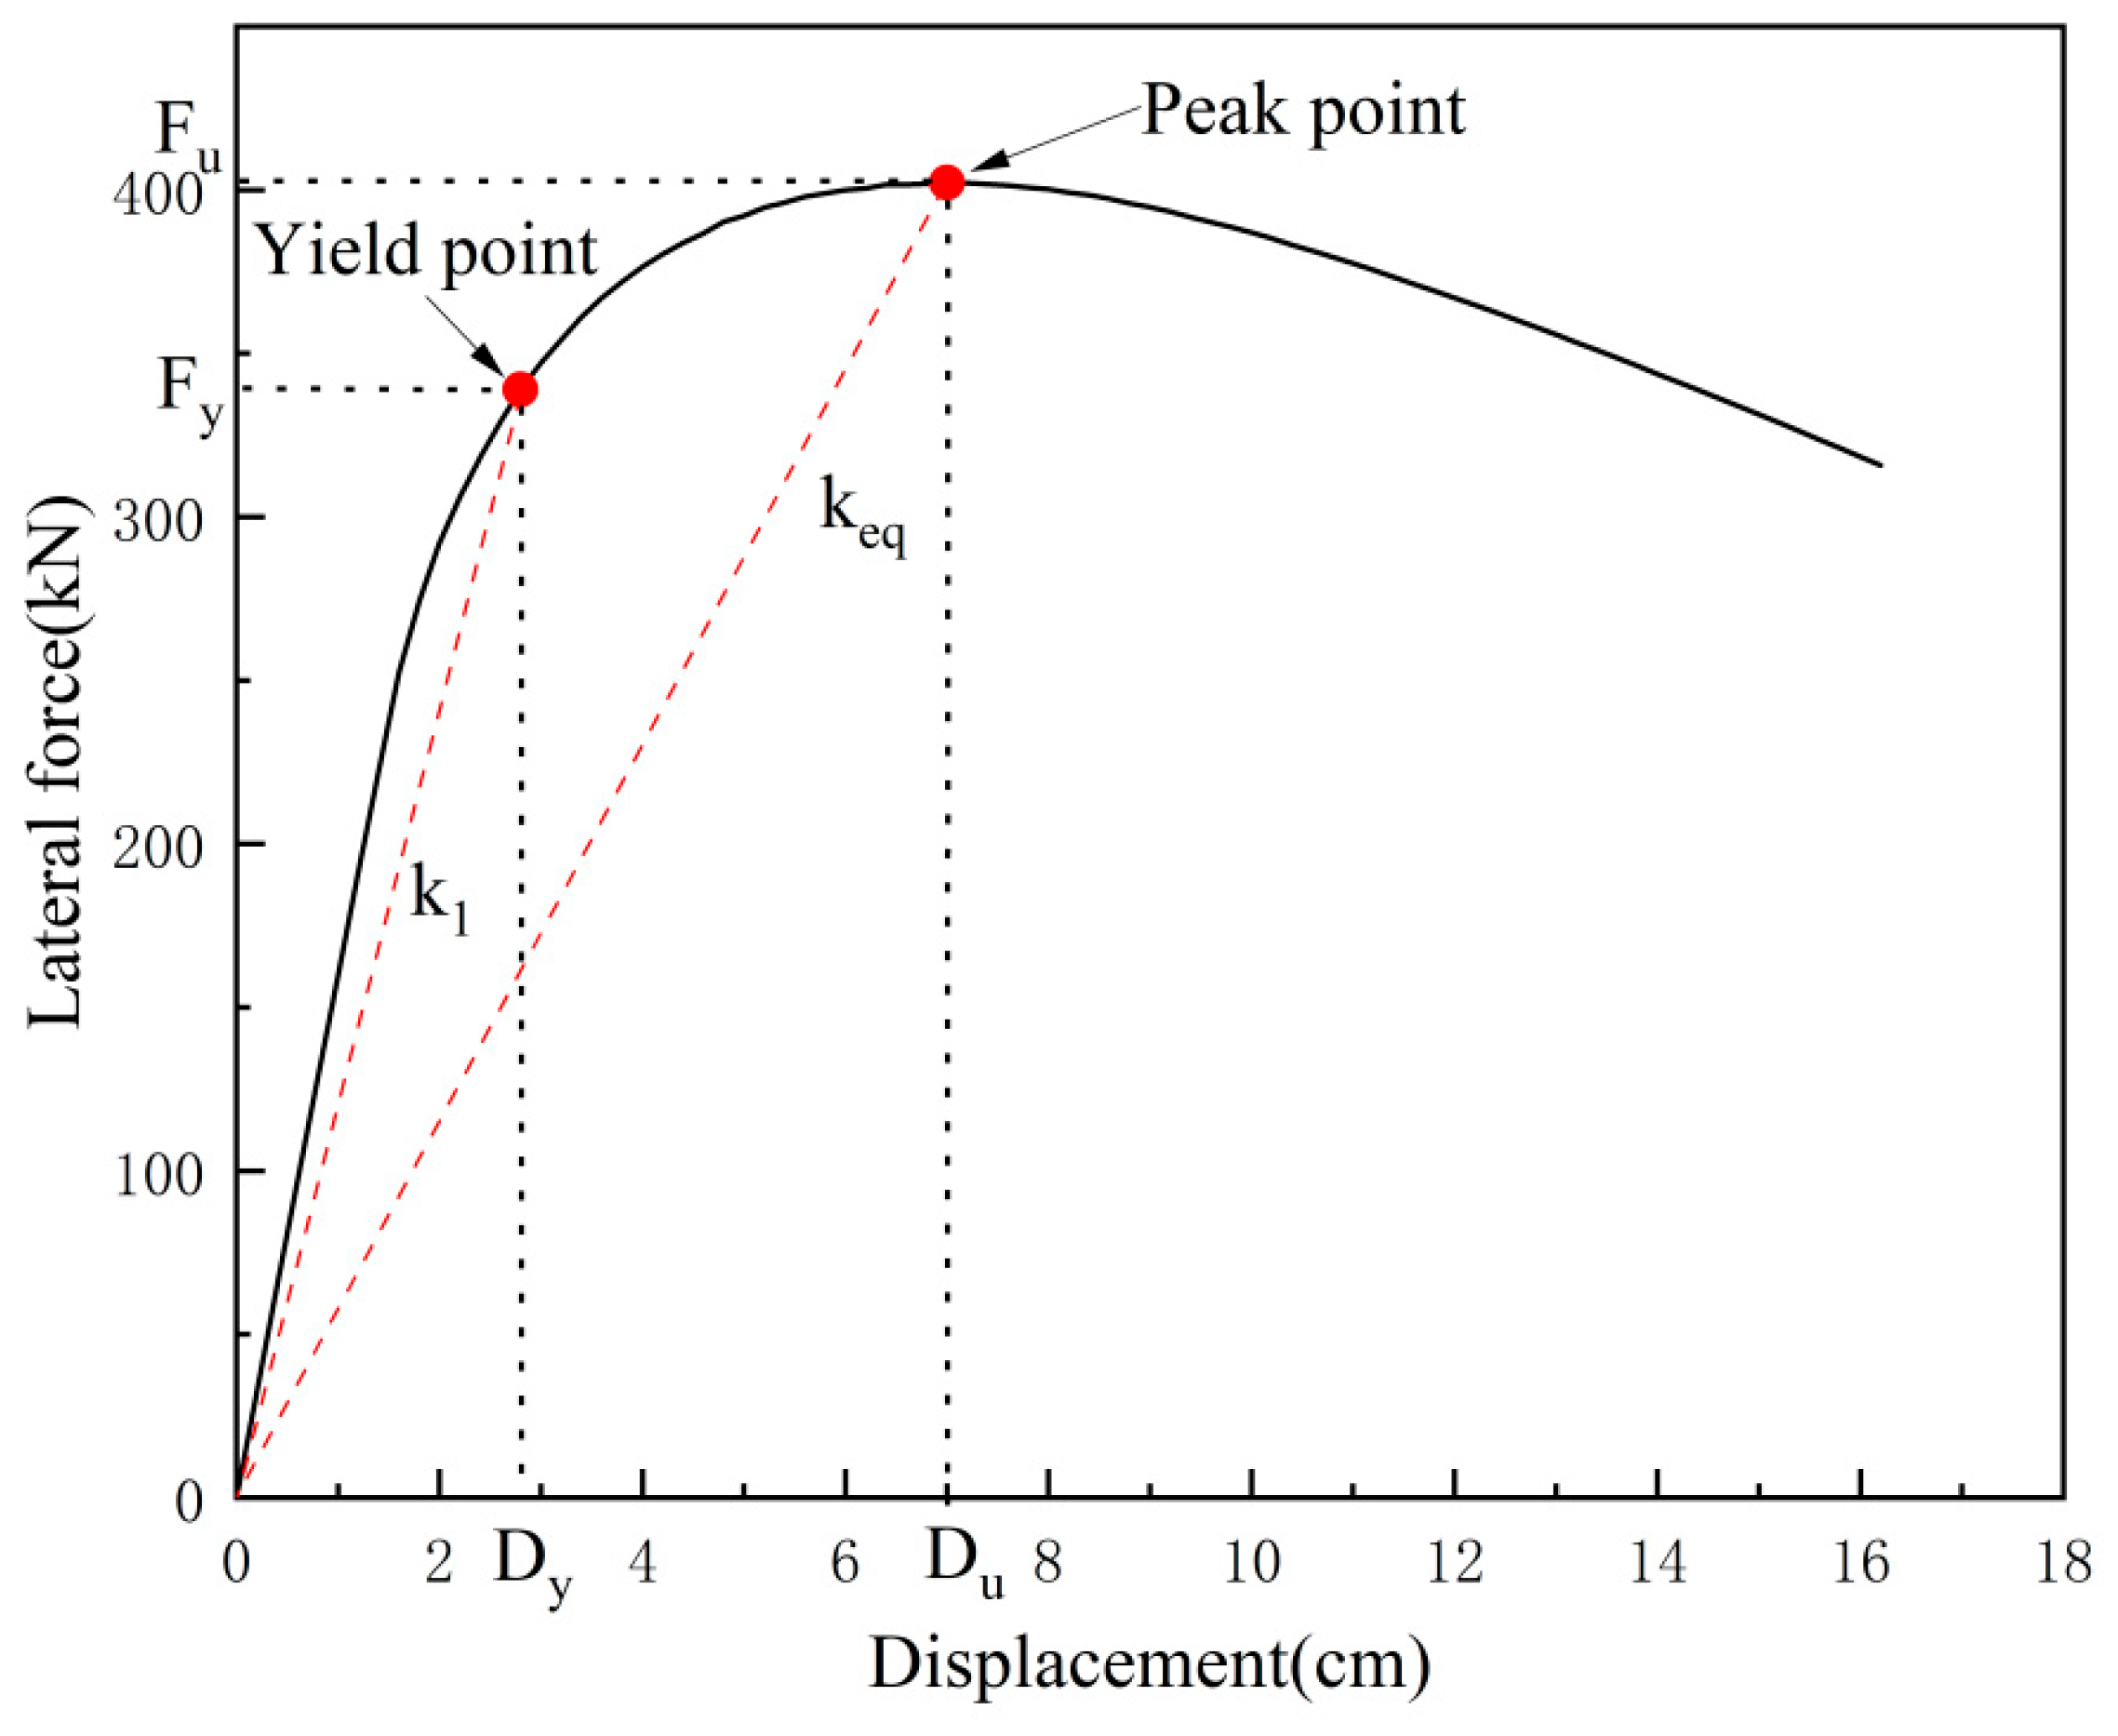
2.3. Equivalent Stiffness Theory Derivation

For a double-column SC-SAB under seismic force, the bottom joint of the pier will continue to be “open” or “closed”. But due to the two sides of the abutment bottom joints at the corner, as well as the pressure zone support reaction force and other force, deformation is not the same, so the two sides of the abutment will not reach the limit state at the same time. In this paper, it is assumed that one side of the abutment reaches the limit state when the double-column SC-SAB reaches the target displacement, and based on the peak displacement of the bridge and the peak load-carrying capacity of the double-column SC-SAB, equivalent stiffness is deduced.
Under the action of the horizontal force, F , and the self-weight of the superstructure G , as shown in Figure 3a, the bending moments at the base of the pier on both sides of the two-column abutment are induced via the bending moments due to the horizontal load and via the self-weight of the superstructure, which is usually assumed to be a symmetrical structure through the design of the abutment, and the stiffness of each column is the same. The horizontal force F and the weight of the superstructure G are uniformly distributed to both piers, and each pier carries the same load. When the bearing capacity F d e c < F < F u , the double-column SC-SAB will deform, as shown in Figure 3b: the bottom joint of the pier opens, and the cap beam rotates. The total bending moment at the bottom of the piers on the left and right sides is due to the fact that the horizontal force, F , produces a clockwise moment on the left side of the piers, and the weight of the superstructure G produces a counterclockwise moment.
M L = F H 2 G L 4 M R = F H 2 G L 4
where F is horizontal force exerted at the top of the abutment, H is double-column SC-SAB high degree, G is cover beam gravity at top of abutment, L is spacing of piers on both sides, and M L ,     M R are the bending moment in the bottom section of the bridge abutment.
Under the action of the horizontal force, F , and the weight of the superstructure, G , the bending moments at the bottom of both piers are of the same magnitude but in opposite directions.
The prestressing force can be calculated through the following formula:
N p l = N p 0 + N p l N p r = N p 0 + N p r
Among them, N p l and N p r are forces generated via prestressing steel bars, N p 0 is initial force applied by prestressing steel, and N p l and N p r are prestressing increments from prestressing reinforcement.
N p l = σ p l A p N p r = σ p r A p
where A p is the cross-sectional area of prestressing reinforcement. The additional stress of the prestressed reinforcement ( σ p l , σ p r ) caused by the opening of the joint at the bottom of the pier can be calculated according to the following formula. The calculation diagram of the pier joint is shown in Figure 4.
σ p l = M L ( h 2 x l ) A p ( h 2 x l ) 2 + A c l ( 2 3 x l ) 2 σ p r = M R ( h 2 x r ) A p ( h 2 x r ) 2 + A c r ( 2 3 x r ) 2
where the length of the abutment bottom section is x l , x r is the height of concrete pressure zones of left and right abutments, and A c l ,     A c r is the area of concrete compression zone on left and right sides.
Figure 4a,b are the schematic diagrams of the force deformation after tensioning at the joints at the bottom of the abutment, the left and right pier bottom joints undergo rotation, with rotation angles of θ l and θ r , respectively. The fixed-end prestressing steel tendons are elongated, with elongation values of l p l and l p r . Equation (10) is the bending moment equation obtained by taking the distance from the boundary of the compression zone of the abutment on both sides, respectively.
f c l 2 3 x l + f c r L + x l x r 3 + N p l + G 2 h 2 x l N p r + G 2 L h 2 + x l = M L f c l L x r + x l 3 + f c r 2 3 x r + N p l + G 2 L + h 2 x r + N p r + G 2 h 2 x r = M R
Assuming that the stress in the concrete compression zone of the pier section is distributed along the height of the section x u within the range of triangular distribution, and the point of action of the combined force is at 1/3 from the outer edge of the concrete compression zone, the equivalent stress in the concrete compression zone of the left and right sides, σ c l , σ c r , can be calculated through the following formula:
σ c l = M L 2 3 x l A p ( h 2 x l ) 2 + A c l ( 2 3 x l ) 2 σ c r = M R 2 3 x r A p ( h 2 x r ) 2 + A c r ( 2 3 x r ) 2
It is assumed that the elongation of prestressing reinforcement is mainly caused by the opening of pier bottom joints, and the elongation of prestressing reinforcement caused by the bending deformation of the pier body of the bridge abutment is ignored. Then, Figure 4 shows the elongation of prestressing reinforcement.
l p l = σ p l E p H l p r = σ p r E p H
where l p l ,     l p r is the elongation of left and right abutment prestressing tendons due to joint openings at the base of the abutment, ε p l ,     ε p r is strain in prestressing tendons of left and right abutments, and E p is the modulus of elasticity of prestressing steel bars. From the geometric relationship at the section (see Figure 4), the rotation angle at the pier bottom joint is calculated based on the ratio of the elongation of the prestressing tendon to the distance from its fixed end to the edge of the compression zone.
θ l = l p l h 2 x l = M L H E p A p ( h 2 x l ) 2 + A c l ( 2 3 x l ) 2 θ r = l p r h 2 x r = M R H E p A p ( h 2 x r ) 2 + A c r ( 2 3 x r ) 2
The rotational stiffness of the two piers ( K θ l , K θ r ) is determined by the ratio of the bending moment to the joint rotation angle.
K θ l = E p A p ( h 2 x l ) 2 + A c l ( 2 3 x l ) 2 H K θ r = E p A p ( h 2 x r ) 2 + A c r ( 2 3 x r ) 2 H
Based on geometric relationships (see Figure 3), the cap beam rotation angle ( θ ) is calculated as the ratio of the prestressing tendon elongation to pier spacing ( L ), expressed as follows:
θ = Δ l p l + Δ l p r L = ( F H + G L 4 ) ( h 2 x l ) H L E p A p ( h 2 x l ) 2 + A c l ( 2 3 x l ) 2 + ( F H G L 4 ) ( h 2 x r ) H L E p A p ( h 2 x r ) 2 + A c r ( 2 3 x r ) 2
The rotational stiffness ( K θ ) of the equivalent single pier equals the ratio of the total bending moment to the cap beam rotation angle.
K θ = F L E p ( F H + G L 4 ) ( h 2 x l ) A p ( h 2 x l ) 2 + A c l ( 2 3 x l ) 2 + ( F H G L 4 ) ( h 2 x r ) A p ( h 2 x r ) 2 + A c r ( 2 3 x r ) 2
The kinematic relationship between the pier base rotation and top displacement was established through geometric analysis, and the displacement at the top of the pier is as follows.
Δ θ = θ H = ( F H + G L 4 ) ( h 2 x l ) H 2 L E p A p ( h 2 x l ) 2 + A c l ( 2 3 x l ) 2 + ( F H G L 4 ) ( h 2 x r ) H 2 L E p A p ( h 2 x r ) 2 + A c r ( 2 3 x r ) 2
The yield stiffness of the pier of an SC-SAB, k 1 [28], can be expressed as follows:
K 1 = a 1 f c A 100 ( a 2 ρ x + a 3 r H + a 4 n G + a 5 E S C f c + 1 a 6 λ + a 7 + a 8 )
where the regression coefficients a 1 ~ a 8 are as follows: a 1 = 7.03 ;   a 2 = 151.14 ;   a 3 = 0.87 ;   a 4 = 6.15 ;   a 5 = 0.33 ;   a 6 = 0.038 ; a 7 = 0.14 ;   a 8 = 6.71 .
Here, E S C is the unit for G P a , f c is the unit for M P a , A stands for the cross-section area of the bridge pier, the unit is m 2 , and the unit for the calculation results is k N / m m . Then, Equations (17) and (18) are applied. The pier-top displacement corresponding to the maximum horizontal bearing capacity of the pier consists of two parts: the elongation caused by the yielding of the steel bars and the displacement resulting from the deformation at the pier base.
Δ = F 2 K 1 + ( F H + G L 4 ) ( h 2 x l ) H 2 L E p A p ( h 2 x l ) 2 + A c l ( 2 3 x l ) 2 + ( F H G L 4 ) ( h 2 x r ) H 2 L E p A p ( h 2 x r ) 2 + A c r ( 2 3 x r ) 2
Then, the equivalent shear stiffness of a single pier is calculated as the ratio of the applied force to the cap beam displacement.
K v h = F ( F H + G L 4 ) ( h 2 x l ) H 2 L E p A p ( h 2 x l ) 2 + A c l ( 2 3 x l ) 2 + ( F H G L 4 ) ( h 2 x r ) H 2 L E p A p ( h 2 x r ) 2 + A c r ( 2 3 x r ) 2
The elastic stiffness of the equivalent double-column SC-SAB is calculated as the ratio of the applied force to the sum of the elongation due to steel reinforcement yielding and the pier-top displacement.
K e q = F F 2 K 1 + ( F H + G L 4 ) ( h 2 x l ) H 2 L E p A p ( h 2 x l ) 2 + A c l ( 2 3 x l ) 2 + ( F H G L 4 ) ( h 2 x r ) H 2 L E p A p ( h 2 x r ) 2 + A c r ( 2 3 x r ) 2
We obtain the rotational and shear stiffness of the equivalent single SC-SAB of the double-column SC-SAB.
K θ = F L E p ( F H + G L 4 ) ( h 2 x l ) A p ( h 2 x l ) 2 + A c l ( 2 3 x l ) 2 + ( F H G L 4 ) ( h 2 x r ) A p ( h 2 x r ) 2 + A c r ( 2 3 x r ) 2 K v h = F ( F H + G L 4 ) ( h 2 x l ) H 2 L E p A p ( h 2 x l ) 2 + A c l ( 2 3 x l ) 2 + ( F H G L 4 ) ( h 2 x r ) H 2 L E p A p ( h 2 x r ) 2 + A c r ( 2 3 x r ) 2

3. Software Modeling

This section describes the finite element modeling approach for a double-column SC-SAB, which mainly includes the simulation of prestressing tendons and joints and describes in detail the geometric parameters and material properties of the self-centering segmental spandrel pier selected for the establishment of the numerical model.

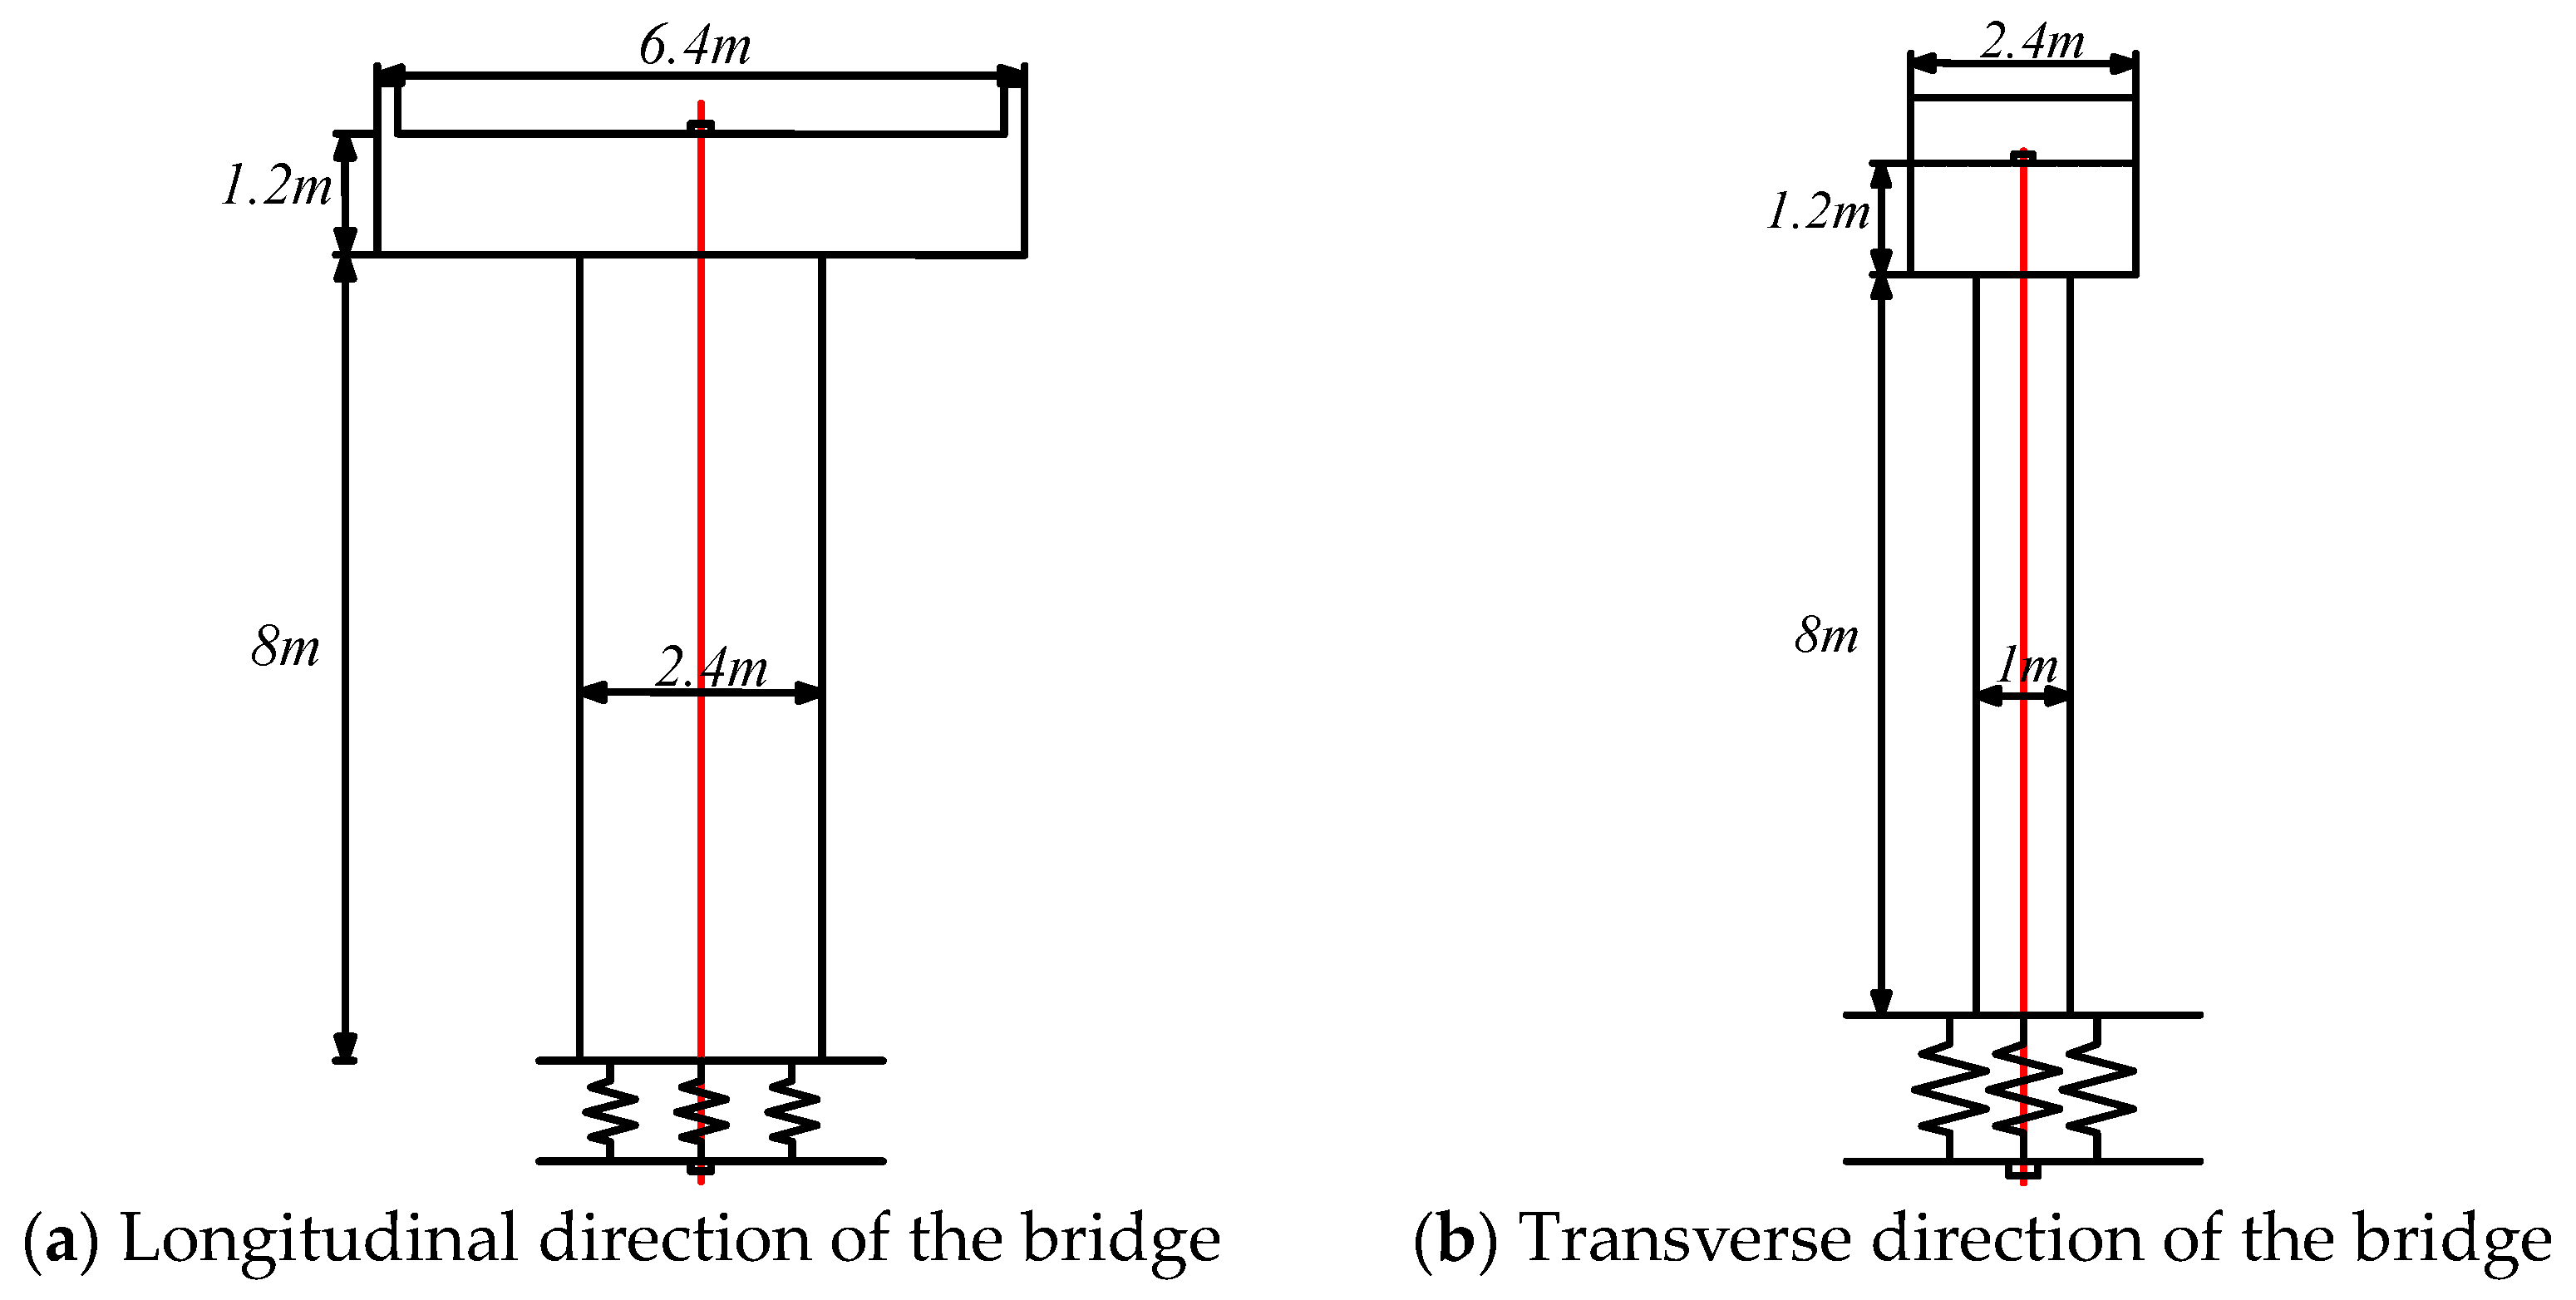
3.1. Establish Finite Element Model

In this paper, the finite element model of double-column SC-SAB is established based on OpenSees software. Figure 5a,b show the finite element model of a double-column SC-SAB. The concrete pier body adopts a nonlinear beam-column element, the unbonded prestressing reinforcement adopts a truss unit, and the truss unit is administered initial prestressing, and the cover beam is mainly subject to the concentrated load transferred from the upper beam through the support. Because the cover beam is a deeply curved member, the rigid beam-column unit with larger stiffness is used to simulate the cover beam. To conduct a numerical analysis, based on the equivalent stiffness derived from the theoretical derivation above, three zero-length elements are set at the pier bottom joints to simulate springs, and then a finite element model of a single-pier SC-SAB with an equivalent double-column SC-SAB structure is constructed.

3.2. Key Issues

The establishment of an effective and accurate finite element model is an important means of predicting and evaluating the seismicity of bridge structures, and this paper addresses the key issues in the establishment of finite element models.

3.2.1. Prestressed Tendons

The unbonded prestressing reinforcement is selected from the Steel02 intrinsic model, the truss unit is used for simulation, and the initial stress is applied to the truss unit to simulate the initial prestressing of the unbonded prestressing reinforcement. The bottom node of the unbonded prestressing bar is restricted to three degrees of freedom, and the top node is fully coupled with the top node of the pier to simulate the anchorage of the post-tensioned prestressing tendons to the concrete column. The remaining nodes were used to achieve relative slip between the unbonded prestressing reinforcement and the concrete pier body by releasing the y-directional degrees of freedom.

3.2.2. Joints

Due to the presence of joints and critical sections between the bottom of the self-centering segmentally assembled bridge and the foundation, the deformation at the opening interface at the bottom exhibits non-continuity and incompatibility. Therefore, there are two different approaches to modeling the section joints of self-centering segmental spandrel structures, as follows [25].
The method proposed by Kurama [29] was used to simulate the distribution of the overall tensile deformation along the abutment and, consequently, the local deformation of the open interfaces at the joints. In order to achieve this assumption, the effects of its reinforcement and concrete tensile strength are neglected during the numerical simulation. However, in practice, this method leads to the inaccurate prediction of local strains and stresses at the joints. The results of Kurama’s analyses show that the method is effective in capturing the overall force–displacement relationship and structural response of the self-replacing structure.
However, the opening and closing angles of the joints at the bottom of double-column self-replacing segmental piers are closely related to the mechanical behavior of the piers under earthquakes, so the above method is not applicable to the simulation of the joints of double-column self-replacing piers in this paper.
Zero-length units are used in the finite element model to simulate the joint openings and local deformation. Two stiffeners are set at the bottom of the pier with a length of half of the pier width. Zero-length units are set at the end of the stiffeners, and the elastic material, which is only subject to compression but not tension, is applied to the zero-length units. In addition, a length unit is placed on the foundation at the base of the pier to prevent penetration of the pier column into the foundation.

3.3. Double-Column SC-SAB Structure

As shown in Figure 6a,b, the pier height of a double-column self-centering bridge abutment is 8 m, the spacing between two abutments is 4.0 m, the cross-sectional dimensions are 1.0 m, 1.4 m, with C30-strength concrete, and the thickness of the protective layer is 80 mm. The prestressing reinforcement was selected to be prestressing steel bundles with a cross-sectional area of 1400 mm2 applied with an initial prestressing force of 1000 Mpa. The piers are equipped with rectangular hoop reinforcement of 16 mm in diameter and 150 mm spacing, and the cover girders are 6.4 m, 2.4 m, and 1.2 m. The gravity axial compression ratio provided via the main girder and other superstructures is 0.12. The reinforcing bar diagram is shown in Figure 7:
In order to more accurately simulate the damage and mechanical behavior of concrete and its prestressing reinforcement in double-column self-replacing bridge piers, this paper selects the Concrete02 concrete intrinsic model and Steel02 prestressing reinforcement intrinsic model in the OpenSees material library. The parameters, such as the compressive strength, modulus of elasticity, and yield strength, are inputted in the simulation process, as shown in Table 1.

3.4. Single-Column SC-SAB Structure

As shown in Figure 8a,b, a single-column SC-SAB height of 8 m, cross-sectional dimensions of 1.0 m and 2.4 m, the use of C30-strength concrete, a thickness of the protective layer of 80 mm, a prestressing steel selection of the cross-section area of 1400 mm2, prestressing the steel beam, and initial prestressing force applied to the 1000 Mpa were applied. The internal configuration of the abutment and the dimensions of the cover girders are the same as those of a two-column self-centering abutment. OpenSees was used to establish a single-column self-centering bridge model, and three zero-length units were set up at the joints at the bottom of the piers to provide horizontal, shear, and rotational stiffnesses, respectively. The material properties and other conditions required in the simulation process are shown in the two-column self-centering bridge.

4. Numerical Study

In this section, based on OpenSees finite element modeling software, the transverse seismic force is loaded on double-column and single-column SC-SAB respectively, and their seismic performance is analyzed under seismic force. Based on the above established finite element numerical model of double-column and single-column SC-SAB, PushOver analysis and hysteretic response analysis are carried out with different parameters to compare the mechanical behavior of double-column SC-SAB with different parameters. The selected parameters are as follows: the gravity axial compression ratio, initial prestress, height-to-width ratios, and abutment spacing.

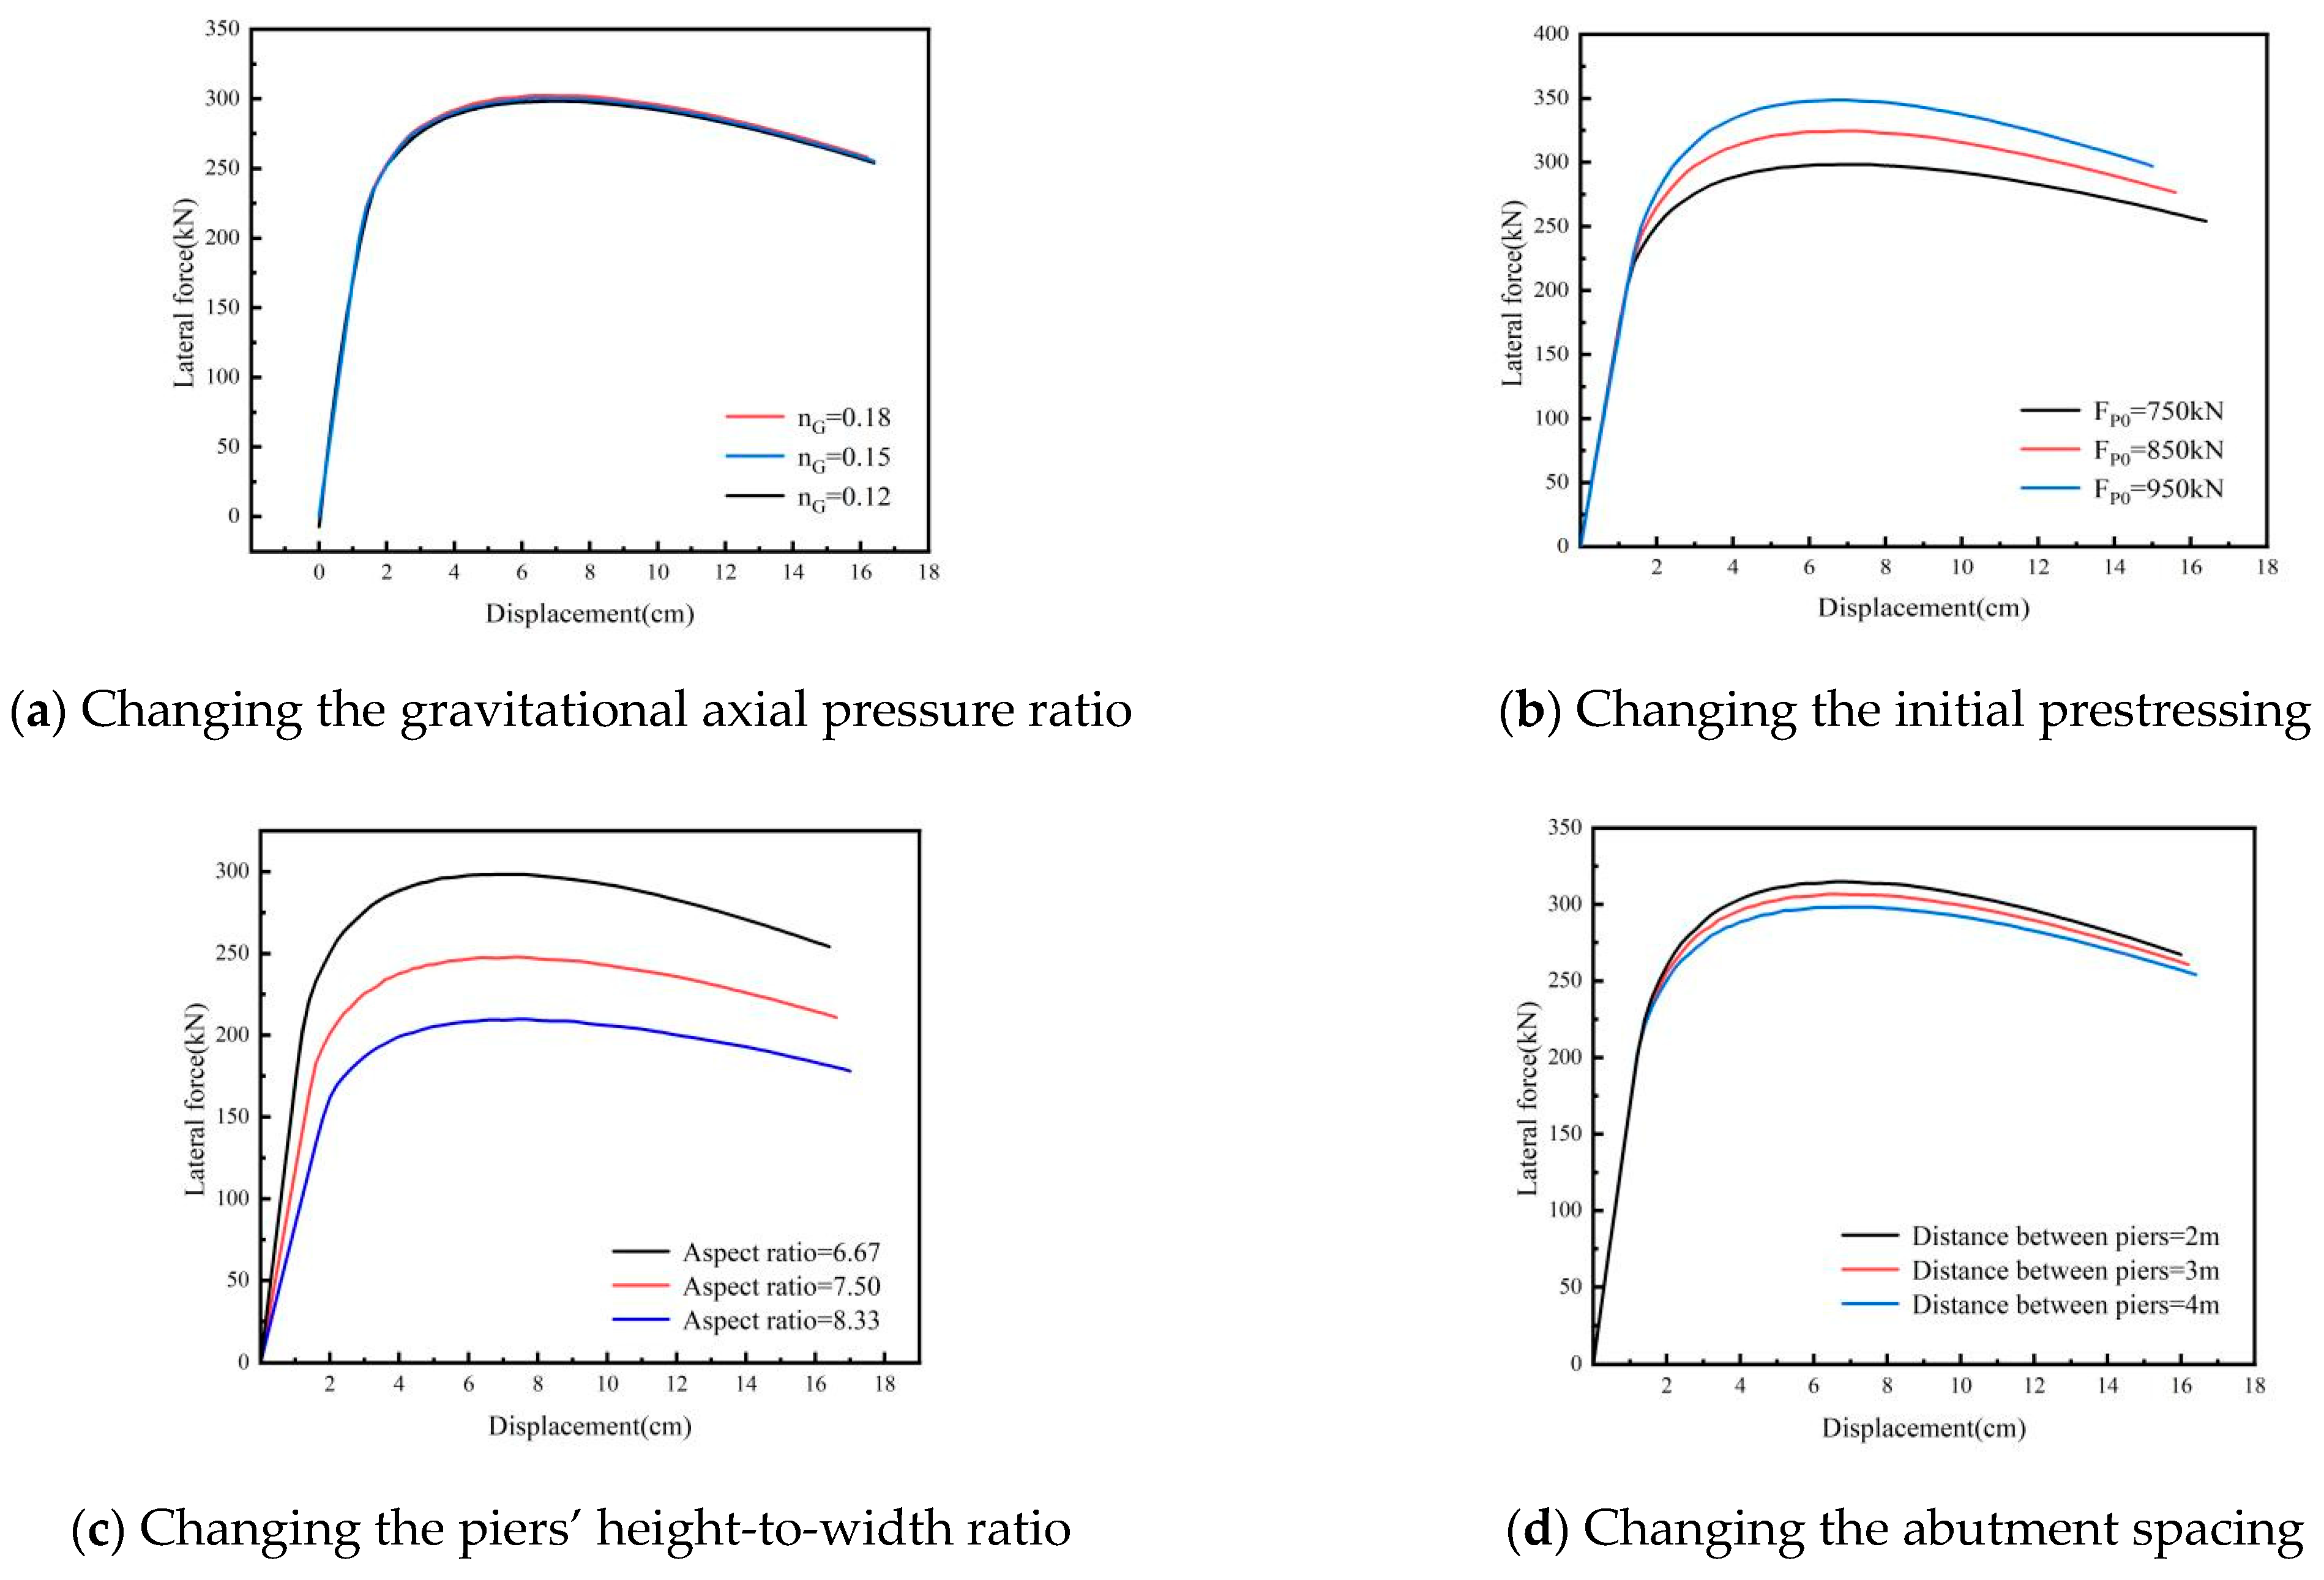
4.1. Pushover Analysis

Pushover analysis is conducted through the formulation of a section of horizontal displacement to increase the horizontal load loading mode in this paper, respectively, on the top of the double-column, single-column SC-SAB monotonically incremental horizontal load, continuing to push the structure to the target displacement to study and analyze the mechanical properties of the abutment and then analyze the deformation of the self-centering SC-SAB compared to the mechanical properties of the deformation, force, and so on.
According to the above double-column and single-column SC-SAB structure information to establish a finite element model, Figure 9 shows the skeleton curve of double-column and single-column SC-SAB. From Figure 9, it can be seen that the skeleton curve of double-column SC-SAB includes a linear rising section, a nonlinear inflection point, and a strength-decreasing section.
According to the above modeling method, the selected geometrical parameters, and the material properties of the hybrid reinforced segmental assembled piers to establish their finite element model, with OpenSees finite element software used to analyze the skeleton curve of the hybrid reinforced segmental assembled piers, the skeleton curve of the double-column SC-SAB is shown in Figure 9. The coordinates of the peak points of the skeleton curve are the peak displacement, D u , and the peak bearing capacity, F u , and the coordinates of the yield points are the yield displacement, D y, and the yield-bearing capacity, F y, respectively. The geometrical parameters and material properties of the segmental piers selected from the numerical simulation are brought into Equations (18) and (21) to calculate the yield stiffness, K 1 , and the equivalent elastic stiffness, K eq. The results of the comparison between the simulated values and the analytical solution for the stiffness of the double-column SC-SAB abutment are shown in Table 2.
The theoretical predictions of the equivalent stiffness model were validated against finite element analysis results, demonstrating good agreement between the analytical solution and numerical simulation for the SC-SAB. As can be seen from Table 2, the error between the simulated value of yield stiffness K 1 and the analytical solution of double-column SC-SAB is only 1.08%, which is due to the fact that the analytical solution of yield stiffness K 1 is obtained via the regression formula, which is derived from the regression analysis of a large amount of data, and the numerical computation model is an ideal finite element model under the basic assumption, so the existence of a certain amount of error is reasonable. The error between the simulated value and the analytical solution of the equivalent elastic stiffness of the double-column segmental assembled bridge pier, K eq, is 4.11% (see Table 2), which proves the correctness of the equivalent elastic stiffness calculation formula of the double-column segmental assembled bridge pier proposed in this paper.
In Chapter 2, we derived the double-column equivalent elastic stiffness theory in detail and defined the conditions for a single-column equivalent double-column abutment. Using OpenSees software, we established a single-column SC-SAB model and assigned the calculated horizontal and rotational stiffnesses to the bottom of the pier, as well as a larger value for the shear stiffness to avoid shear damage to the structure. The simulation results of the double-column SC-SAB were compared with those of the established equivalent single-column segmental pier model. Figure 10 demonstrates the skeleton curve diagrams of the single-column and double-column SC-SAB, the simulation results show (Table 3) that the error between the peak displacement of the double-column SC-SAB and the simulated value of the simplified model of the single-column SC-SAB piers is 2.86%, and the simulation error for the peak load-carrying capacity is 0.25%. These results verify the feasibility of the simplified model proposed in this paper.

4.1.1. Gravitational Axial Pressure Ratio Under Pushover Analysis

As shown in Table 4, for the double-column SC-SAB, the spandrel abutment gravity axial compression ratio is 0.12, 0.15, and 0.18; with the increase in the gravity axial compression ratio, the peak loads of the bridges is 298 kN, 301 kN, and 303 kN. At this time, the loading displacements of the three types of bridges are 7.0 cm, 6.4 cm, and 6.2 cm, respectively. From Figure 11a, it can be seen that the bridges’ pushover curves are very similar. It is concluded that changing the gravity axial pressure ratio has little effect on the mechanical behavior of the double-column self-centering bridges. This is because the model is a two-column segmental pier, and the gravity axial pressure ratios shared with each pier are 0.06, 0.075, and 0.09. The pier columns have relatively small gravity axial pressure ratios under small bias conditions, and the pier columns are mainly under the bending condition with the same lateral displacement. Therefore, the effect on the bottom shear force of the pier column is small.

4.1.2. Initial Prestressing Under Pushover Analysis

When the axial compression ratio is 0.12, only the initial prestressing force of the prestressing steel bars of the double-column SC-SAB was changed, and the initial prestressing force of 750 kN, 850 kN, and 950 kN was applied to the abutments, respectively. From Figure 11b, it can be seen that the ultimate bearing capacity and ultimate displacement are significantly improved with the increase in the initial prestress. As shown in Table 5, the bridge reaches peak loads of 298 kN, 324 kN, and 349 kN increased by 8.72% and 7.71% for horizontal displacements of 7.0 cm, 7.0 cm, and 6.8 cm, respectively. The yield displacement was 2.8 cm, 2.6 cm, and 2.4 cm, and the yield stiffness increased by 27.42% from 9679 kN/m to 12,333 kN/m. From the above, it can be seen that increasing the initial prestressing force of the prestressing steel reinforcement can improve the yield stiffness, ultimate bearing capacity, and peak bearing capacity of the double-column SC-SAB. This is because increasing the initial prestressing force of the prestressing reinforcement directly improves the rebound restoring force and the constant load axial compression ratio of the piers and columns. When the axial compression ratio is 0.15 and 0.18, the analysis method is the same as above.

4.1.3. Piers’ Height-to-Width Ratios Under Pushover Analysis

As shown in Figure 11c, this paper defines the pier height and width ratio as the ratio of the pier height of the double-column SC-SAB to the transverse width of the pier cross-section, and the pier height and width ratio of the pier is 6.67, 7.50, and 8.33, respectively (Table 6); the corresponding peak bearing capacity of the bridge is 298 kN, 248 kN, and 210 kN, and with the increase in the height and width ratio of the pier, its peak bearing capacity decreased by 16.77% and 15.32%, and the yield stiffness of the bridge decreased from 9679 kN/m to 5938 kN/m by 38.65%. 16.77%, and 15.32%, while the yield stiffness of the bridge from 9679 kN/m to 5938 kN/m decreased by 38.65%, which is due to the increase in the height-to-width ratio of the bending stiffness of the bridge becoming smaller. From the above, it can be seen that increasing the height-to-width ratio of the double-column SC-SAB decreases the yield strength and peak load-carrying capacity of the bridge but increases the ultimate displacement of the bridge. This is because increasing the height-to-width ratio of the piers directly reduces the flexural stiffness of the single pier, resulting in the pier entering the yield state and peak state prematurely.

4.1.4. Abutment Spacing Under Pushover Analysis

As shown in Figure 11d, only the abutment spacing of the double-column SC-SAB is changed. As can be seen from Table 7, the peak bearing capacity of the bridge is reduced by 5.4%, from 315 kN to 298 kN, by increasing the abutment spacing from 2 m to 4 m. The yield stiffness increased by 5.71% from 9156 kN/m to 9679 kN/m, and the ultimate displacement increased by 2.5% from 16 cm to 16.4 cm. From the above, it can be seen that changing the abutment spacing of the double-column SC-SAB has a small effect on its yield stiffness, ultimate displacement, and peak load-carrying capacity. The reason for this phenomenon is that changing the abutment spacing did not change the gravity axial compression ratio and prestressing tendon elongation of a single abutment under the same lateral displacement produced via the piers.

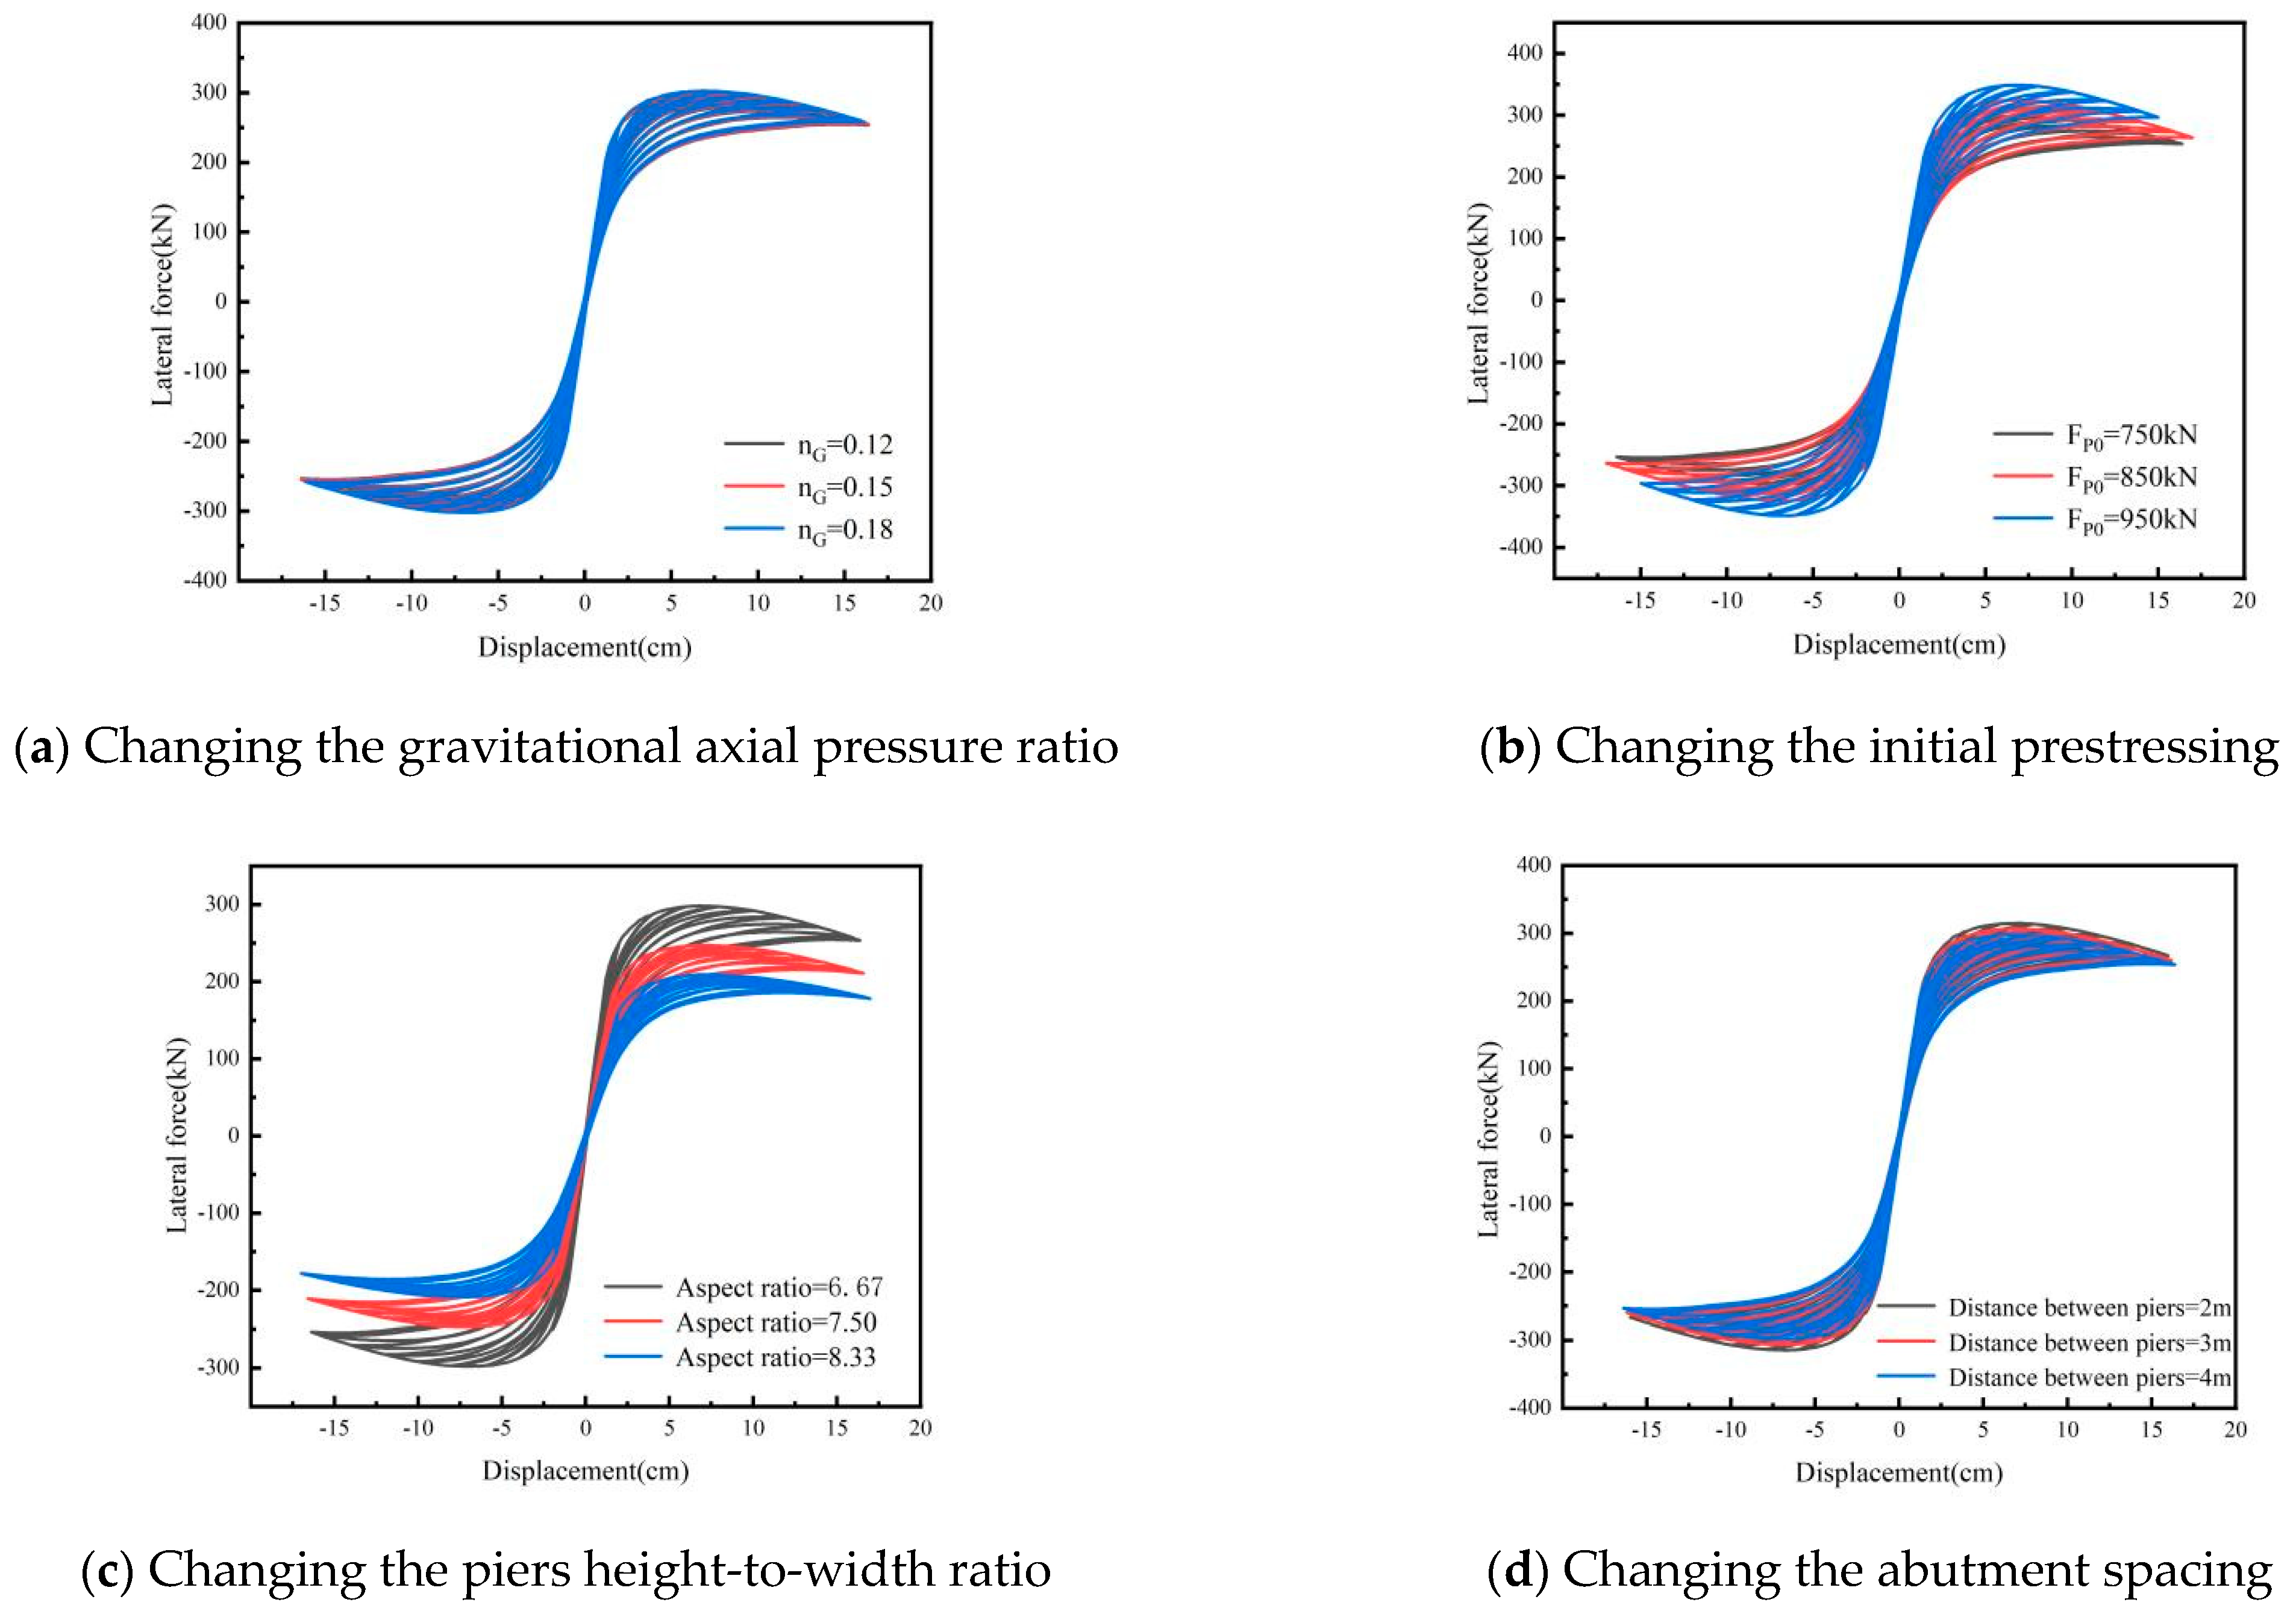
4.2. Hysteretic Response Analysis

The hysteresis curve is the deformation curve under the action of reciprocating step-by-step load increase. It can reflect the change of stress–strain, energy consumption, and stiffness degradation of the structure in the reciprocating loading process, and it is an important basis for the nonlinear seismic response analysis of self-centering structures.

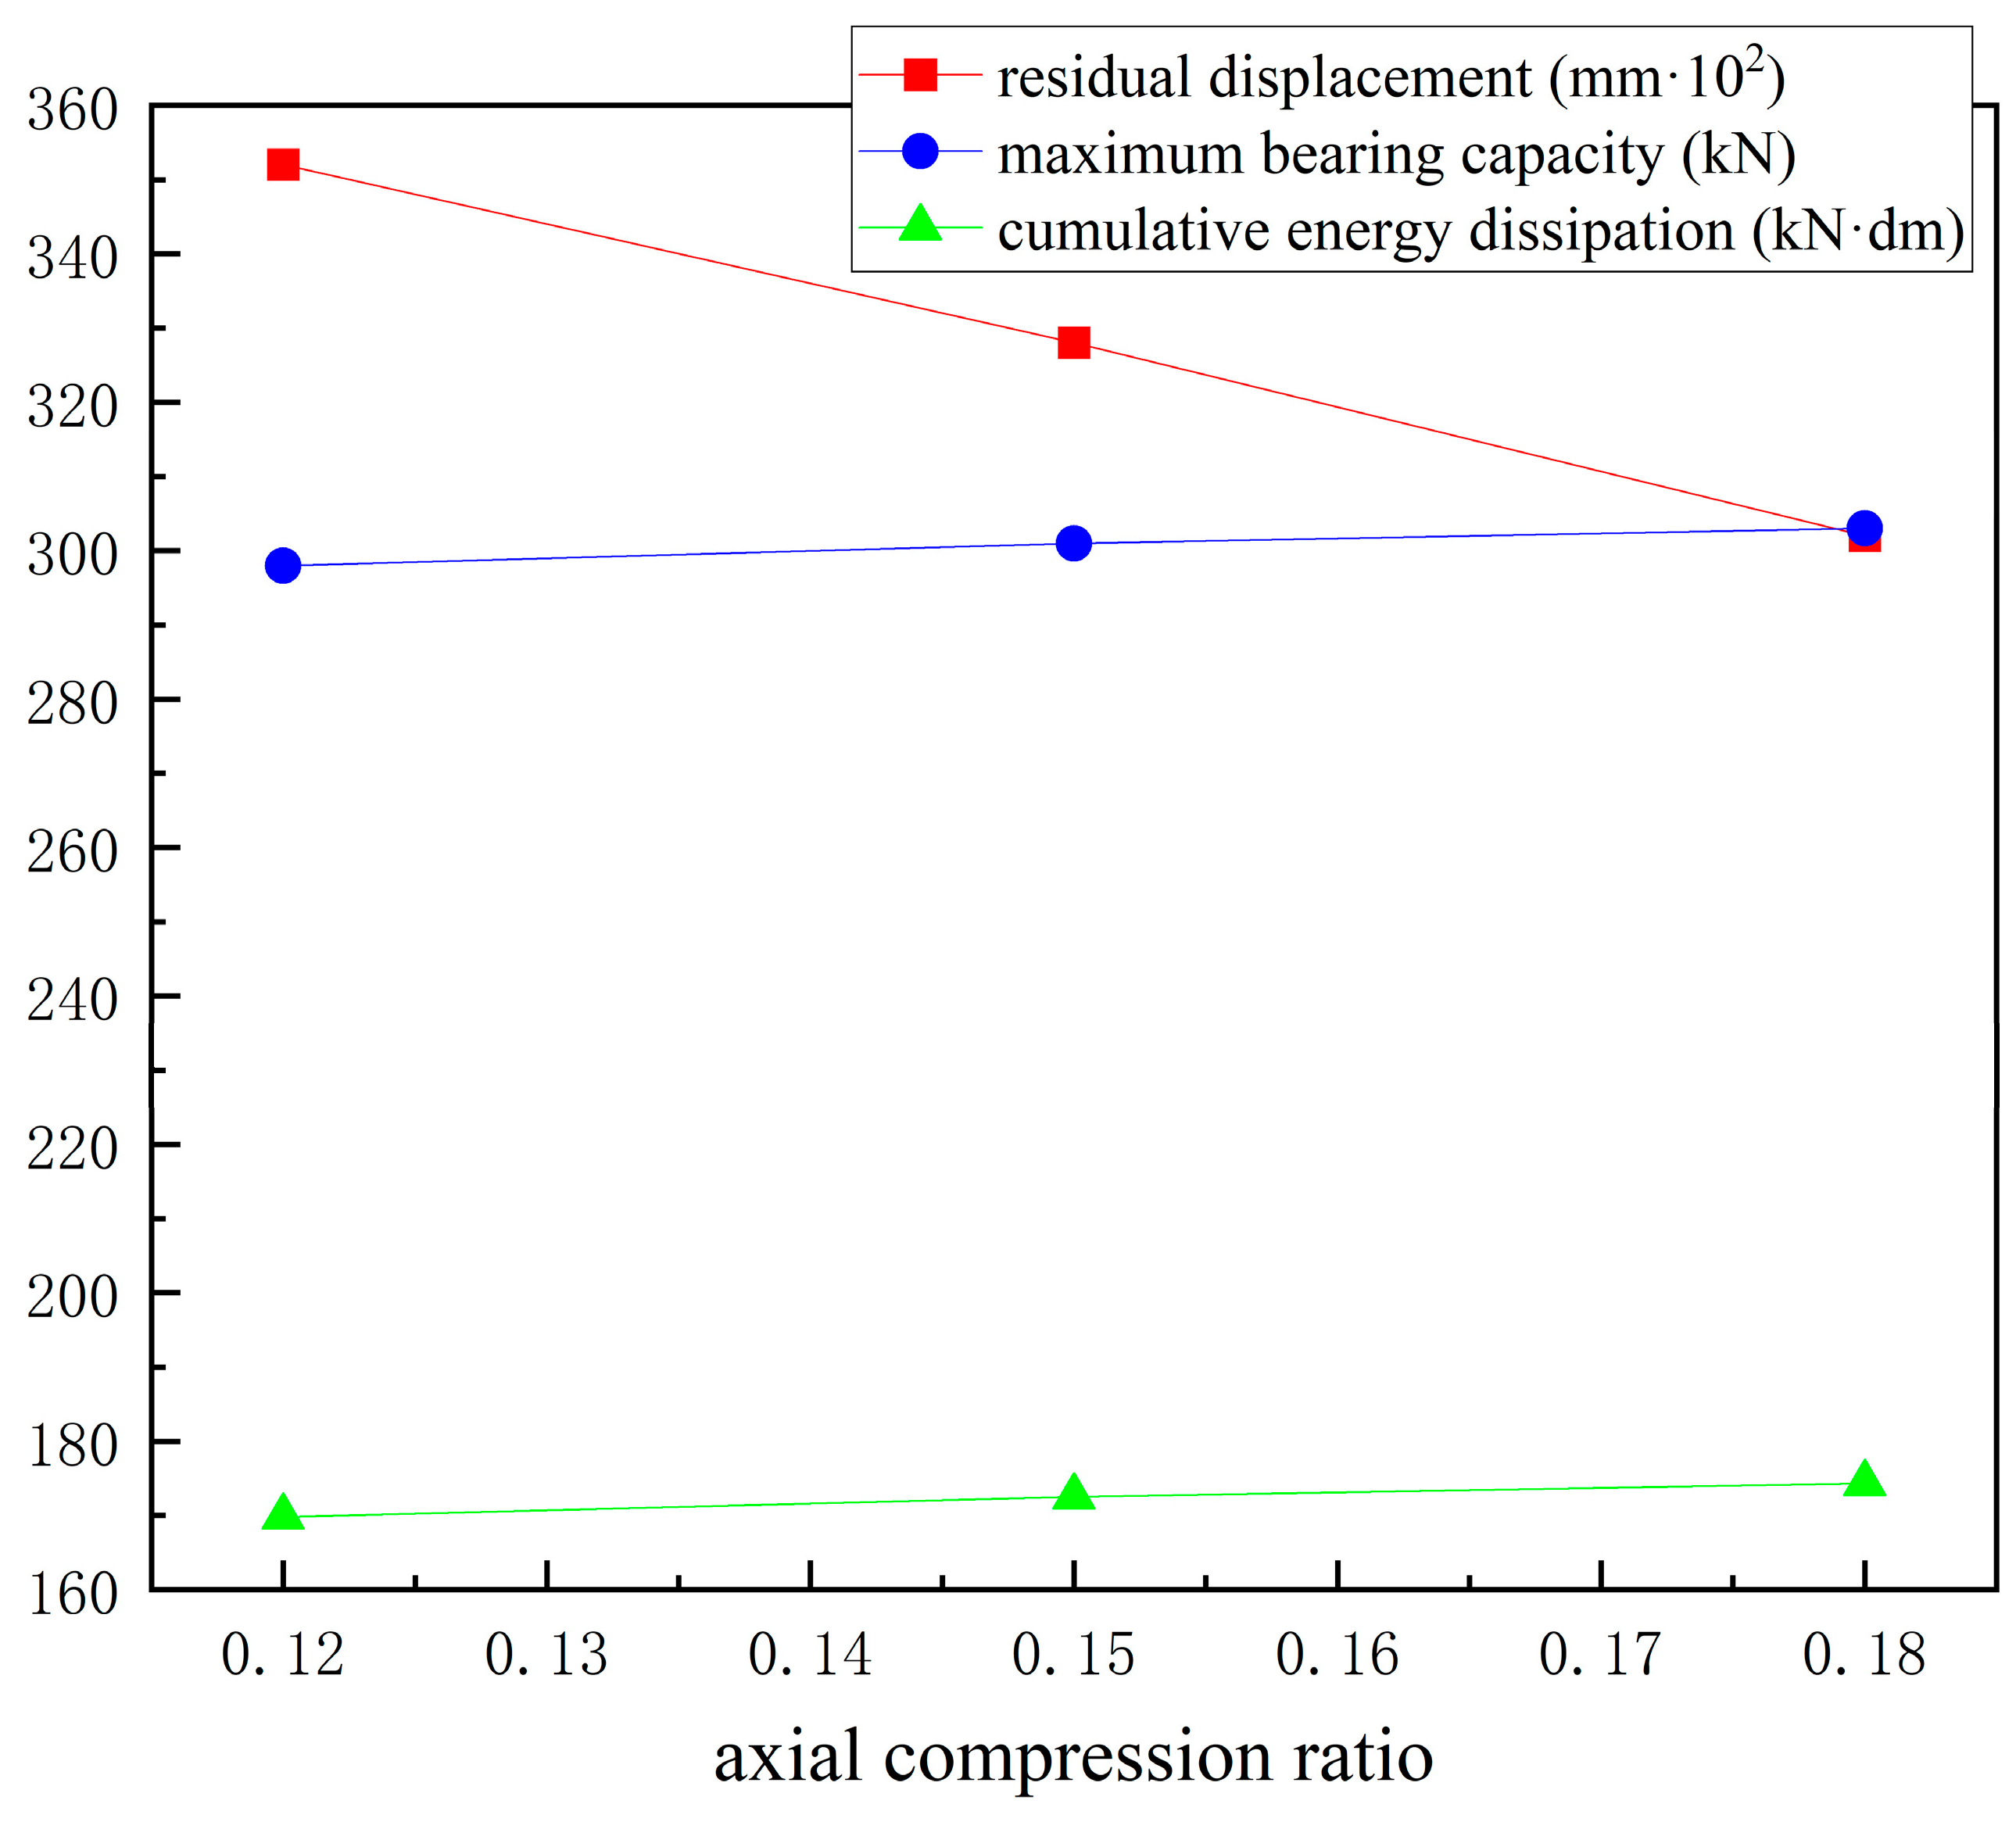
4.2.1. Gravitational Axial Pressure Ratio Under Hysteretic Analysis

As shown in Figure 12a, only the gravity axial pressure ratio of the double-column SC-SAB was changed. As can be seen from Table 8, gravity axial pressure ratios of 0.12, 0.15, and 0.18 were applied to the double-column SC-SAB, respectively. With increasing gravity axial compression ratio, the residual displacement decreases, while both cumulative hysteretic energy dissipation and maximum load capacity remain essentially unchanged (see Figure 13). It is concluded that changing the gravity axial compression ratio of the double-column SC-SAB has little effect on its mechanical properties. This is due to the fact that the gravity axial pressure ratio is allocated to the two piers, each pier gravity axial pressure ratio is halved, the pier columns are mainly in the state of bending under the same lateral displacement, and the effect on the bottom shear force of the pier columns is small.

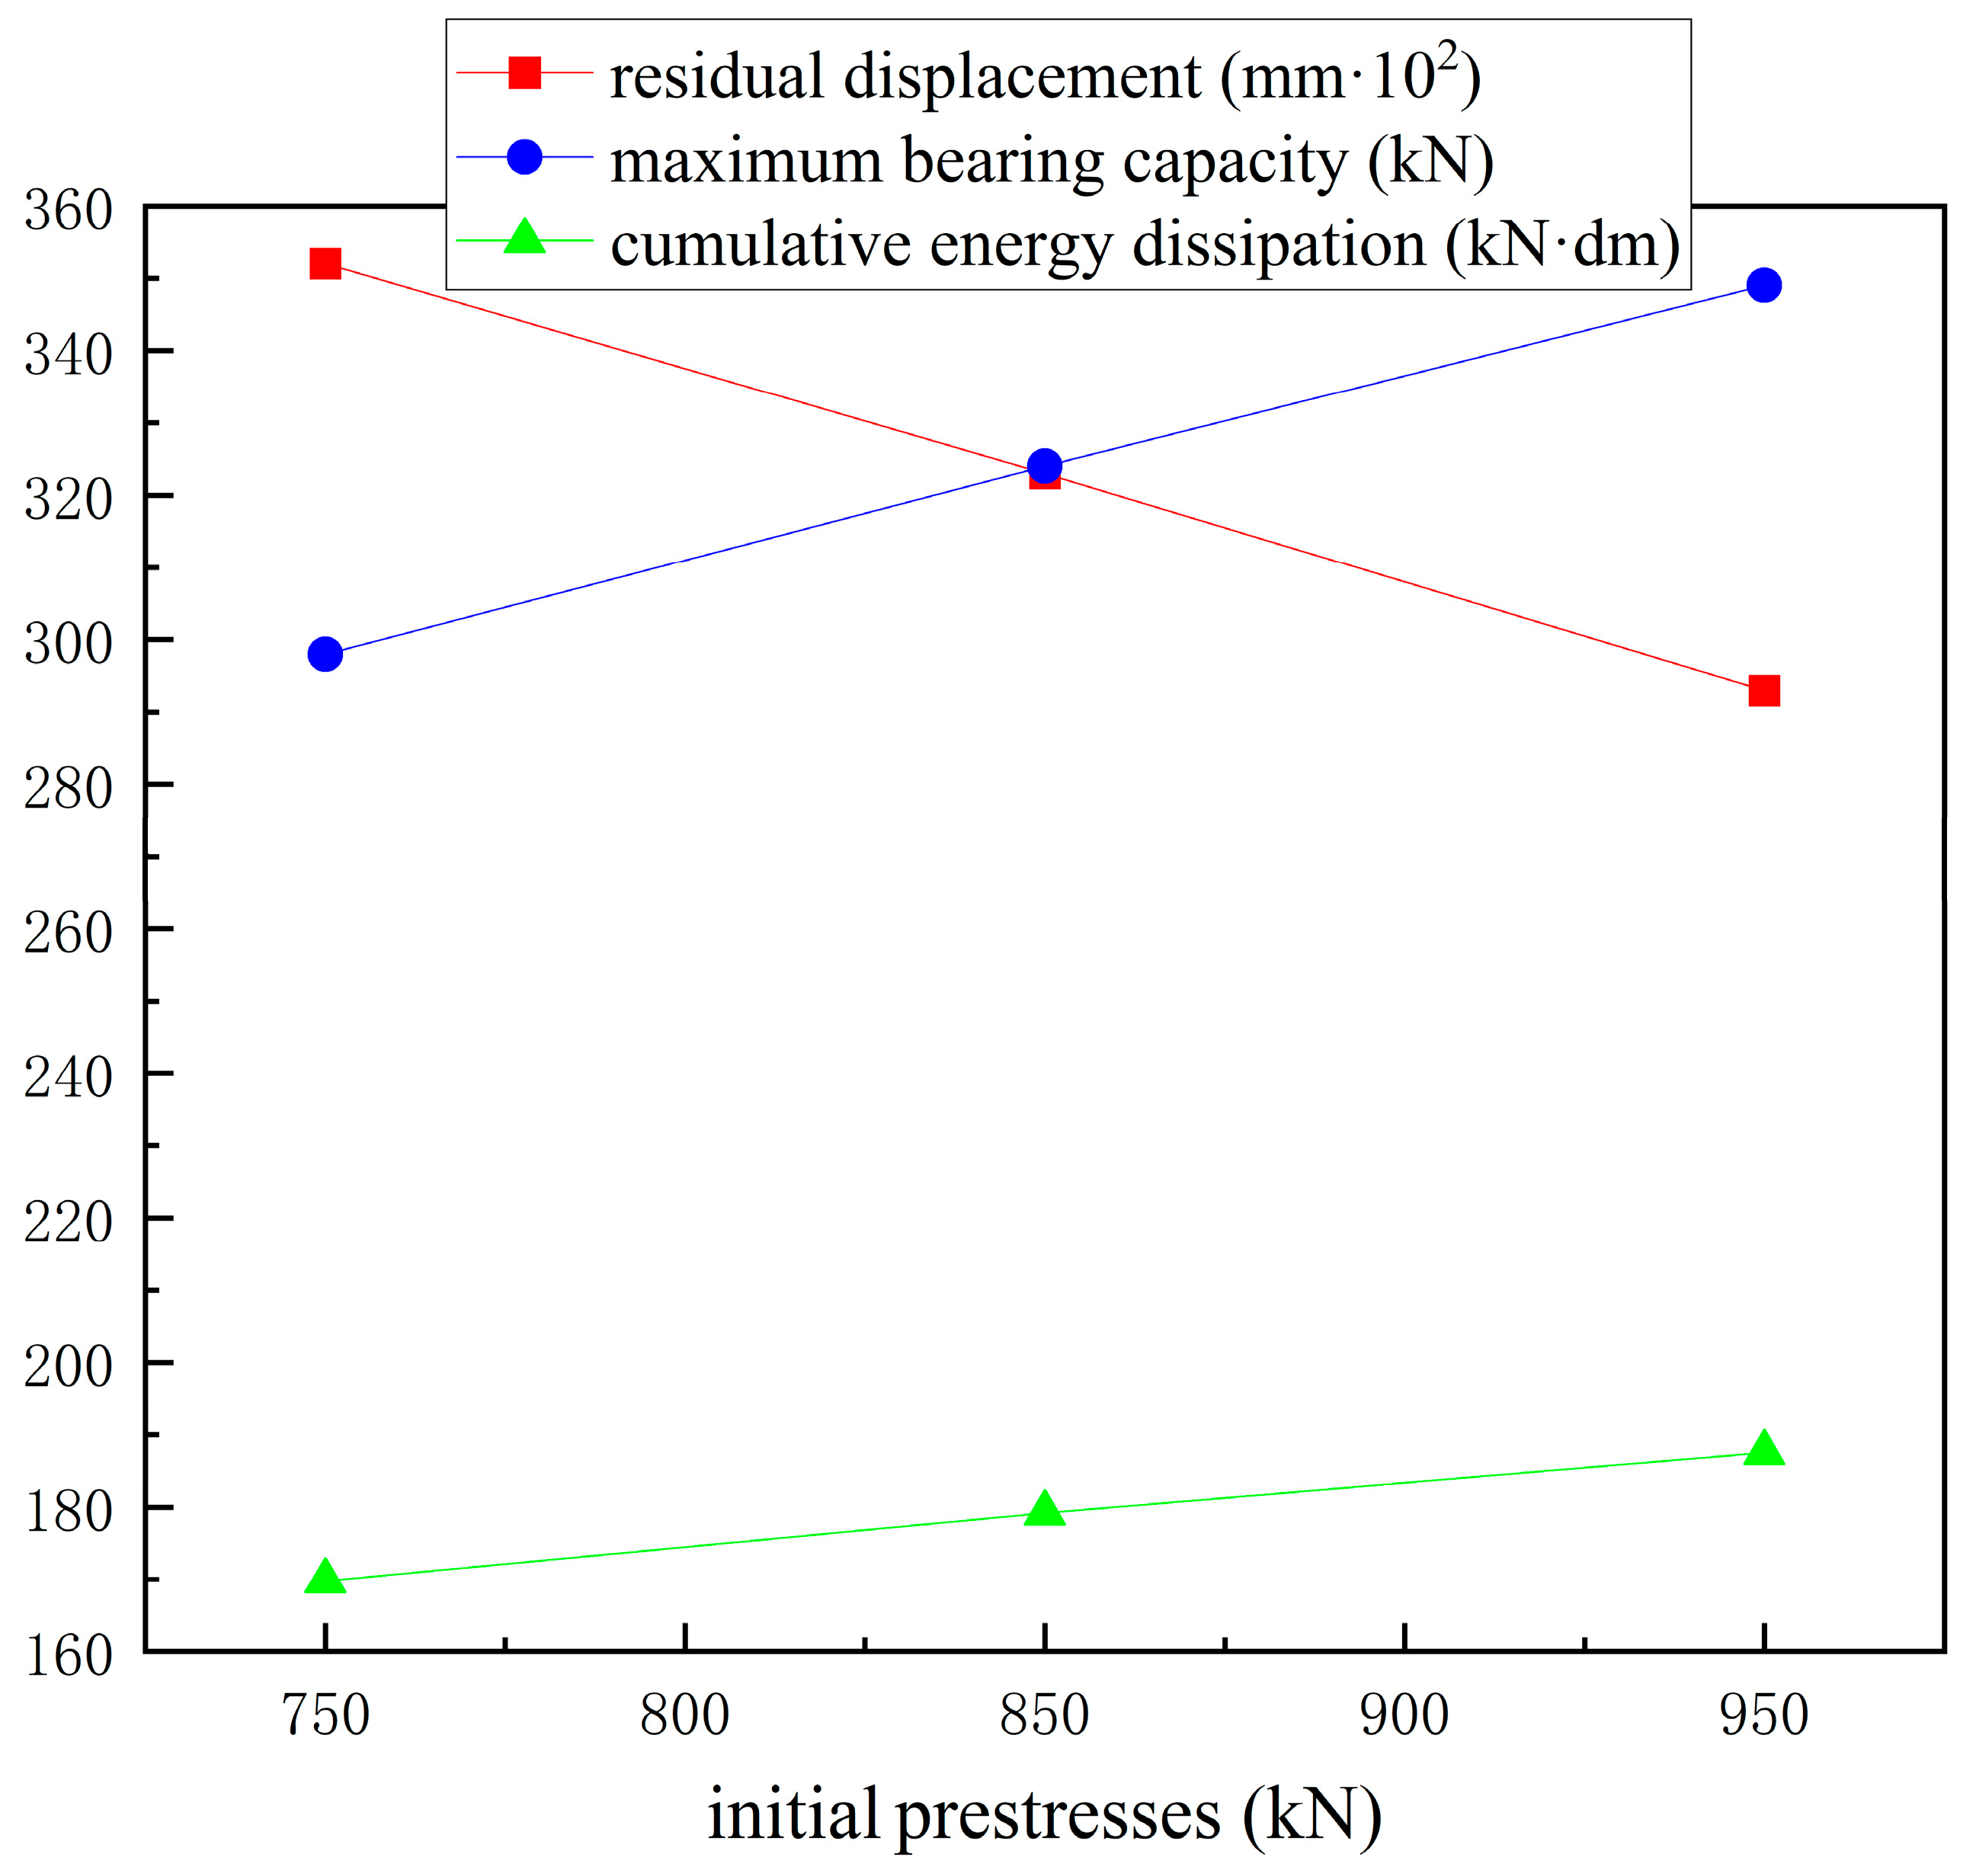
4.2.2. Initial Prestressing Under Hysteretic Analysis

As shown in Figure 12b, different initial prestresses were applied only to the double-column self-centering segmental spandrel bridges. From Table 9, when the initial prestressing forces are 750 kN, 850 kN, and 950 kN, respectively, the residual displacements measure 3.52 mm, 3.23 mm, and 2.93 mm, showing reduction rates of 8.2% and 9.3% consecutively. The cumulative energy dissipation values are 16.98 kN·m, 17.92 kN·m, and 18.75 kN·m, demonstrating increases of 5.5% and 4.6% respectively. The maximum bearing capacity is 298 kN, 324 kN, and 349 kN. This indicates that increasing the initial prestressing force effectively elevates the axial compression ratio in the prestressing tendons, thereby enhancing the initial stiffness of the double-column SC-SAB. Consequently, this stiffness improvement reduces residual displacements while compromising energy dissipation capacity (see Figure 14).

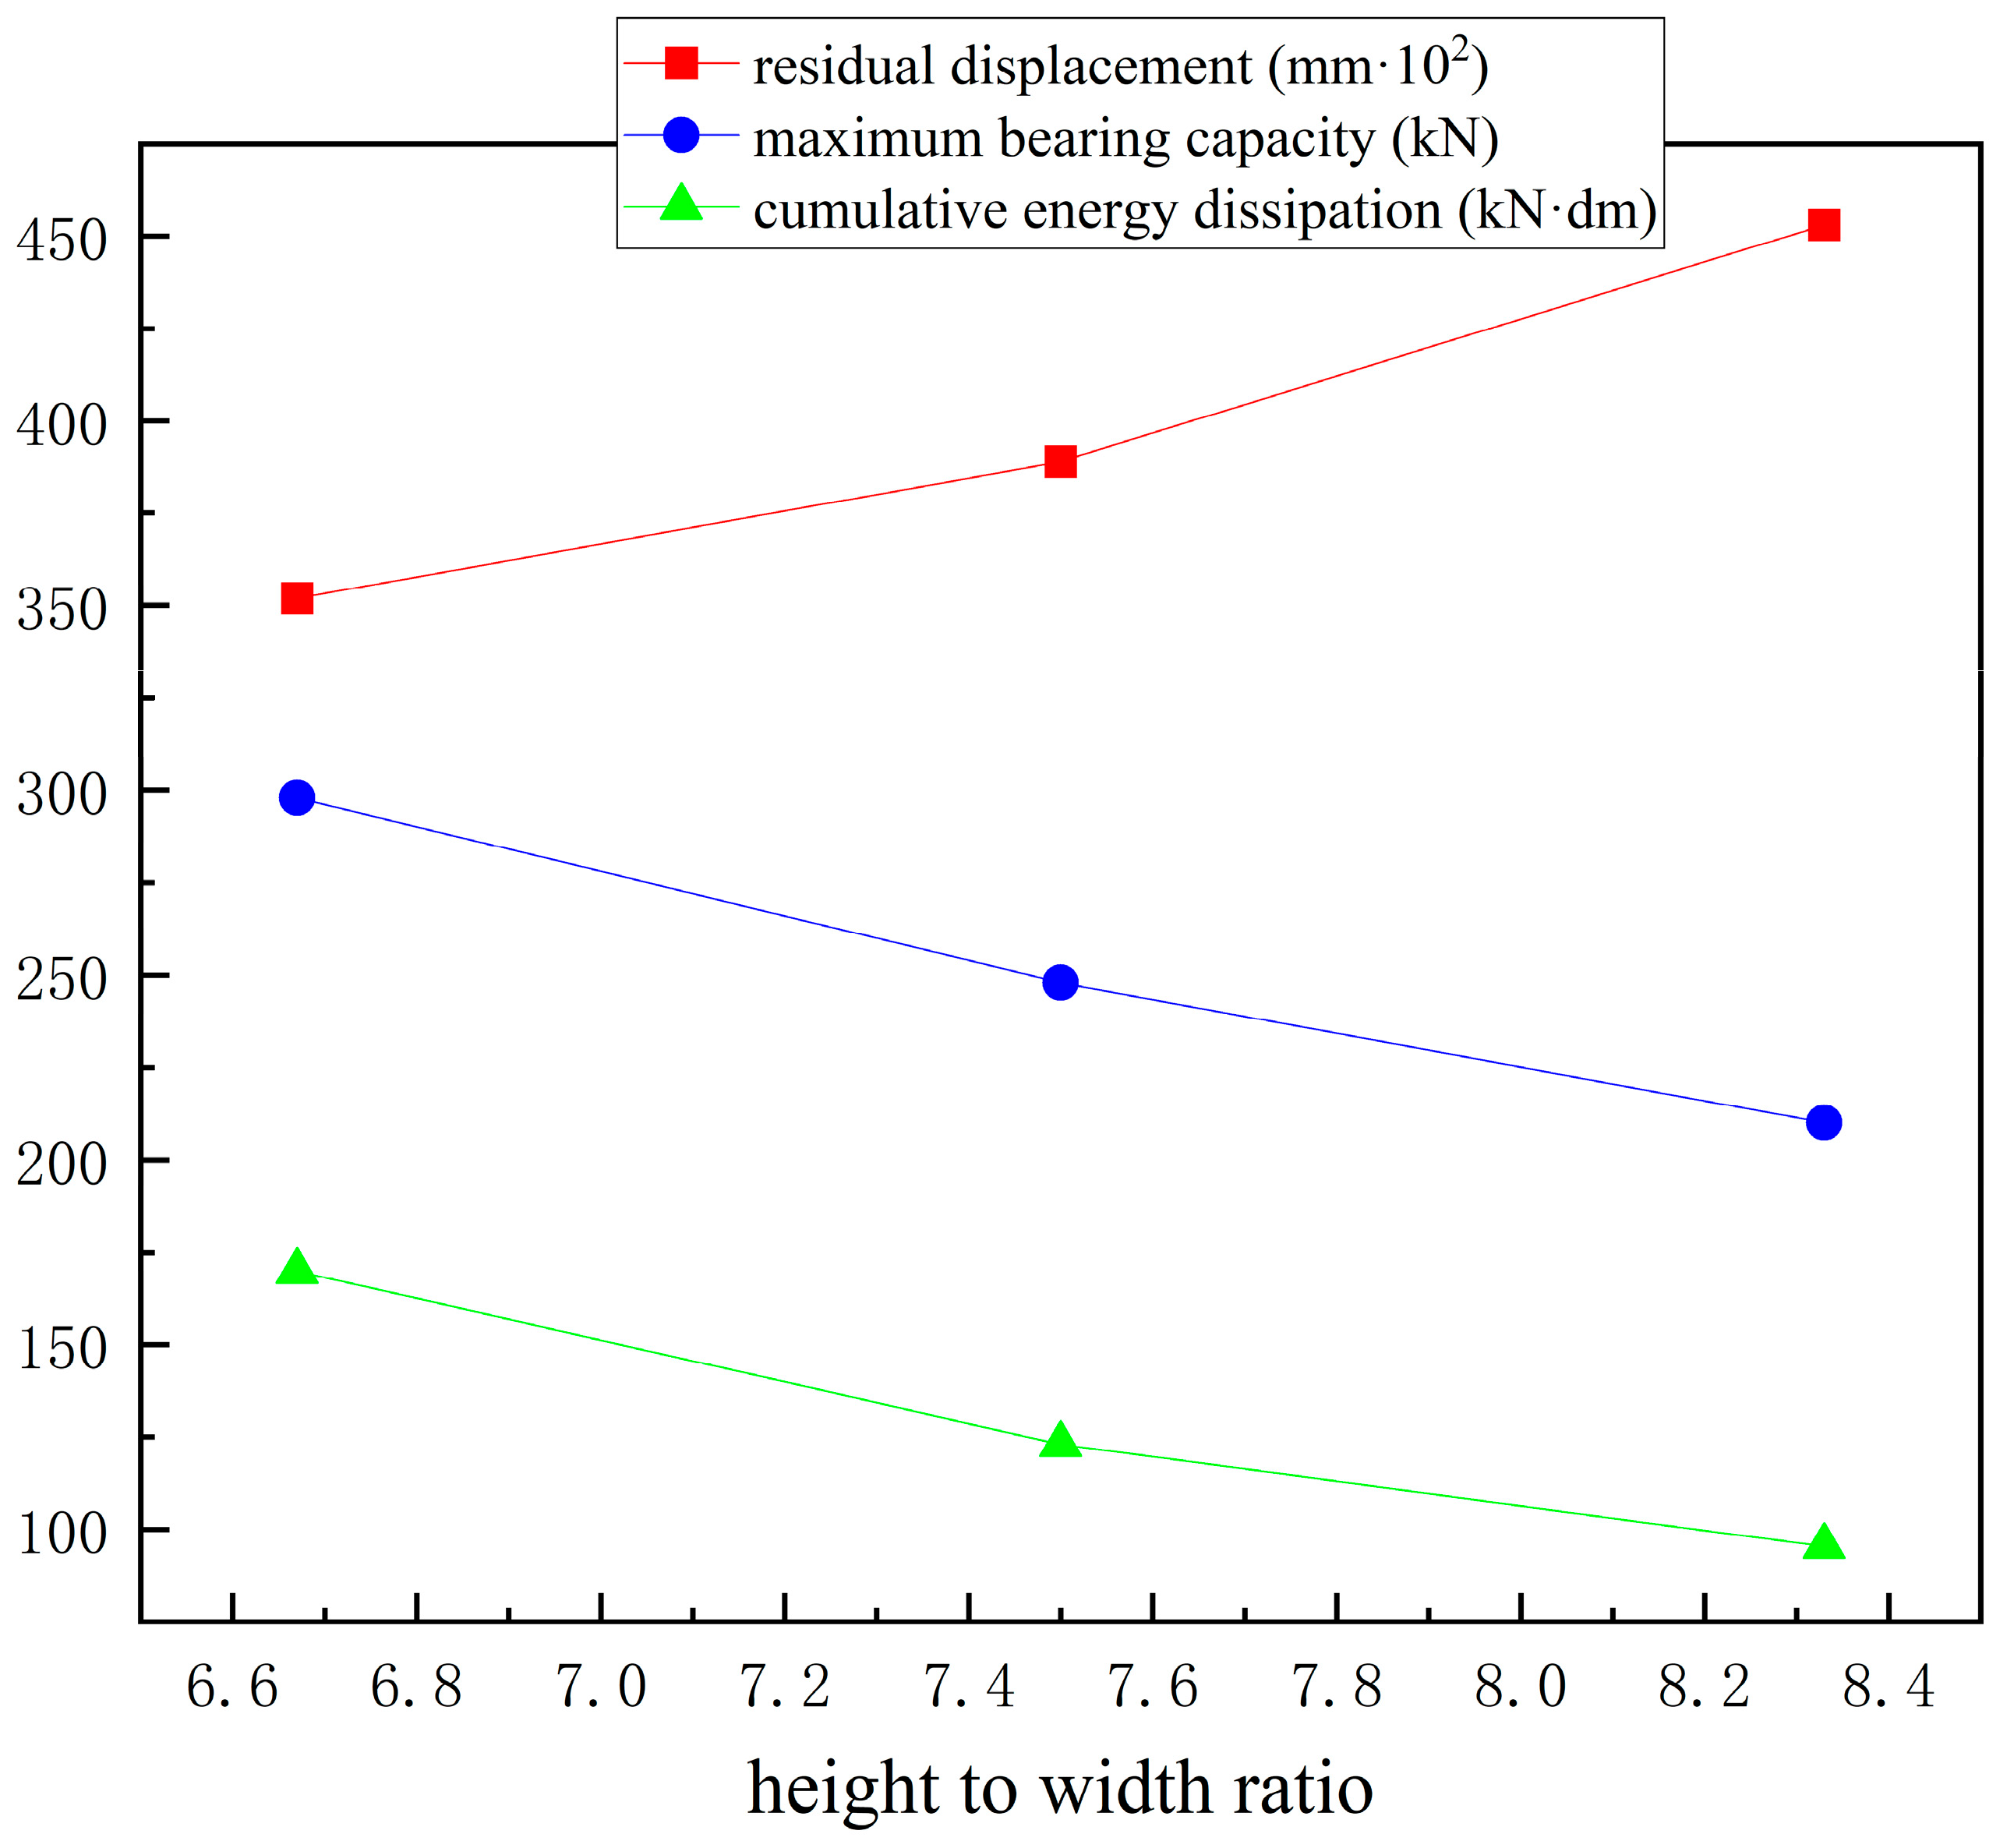
4.2.3. Piers’ Height-to-Width Ratio Under Hysteretic Analysis

As shown in Figure 12c, only the ratio of the pier height to the transverse width of the pier section is changed for the double-column SC-SAB. From Table 10, it can be seen that, with the reduction in the height-to-width ratio from 8.33 to 6.67, the equivalent stiffness of the pier increases accordingly, the maximum load-carrying capacity of the bridge was significantly increased from 210 kN to 298 kN by 41.9%, the cumulative energy consumption of the bridge was increased from 9.54 kN·m to 16.98 kN·m by 77.99%, and the residual displacement was reduced from 4.53 mm to 3.52 mm by 22.3%. The above analysis demonstrates that the aspect ratio of double-column (SC-SAB) significantly affects the system’s lateral load-carrying capacity, energy dissipation capability, and residual displacement. Reducing the aspect ratio (i.e., making the piers stockier) decreases the initial stiffness, leading to increased residual displacements, enhanced energy dissipation, and a higher peak load capacity. This behavior occurs because higher aspect ratios reduce flexural stiffness and accelerate yielding (see Figure 15).

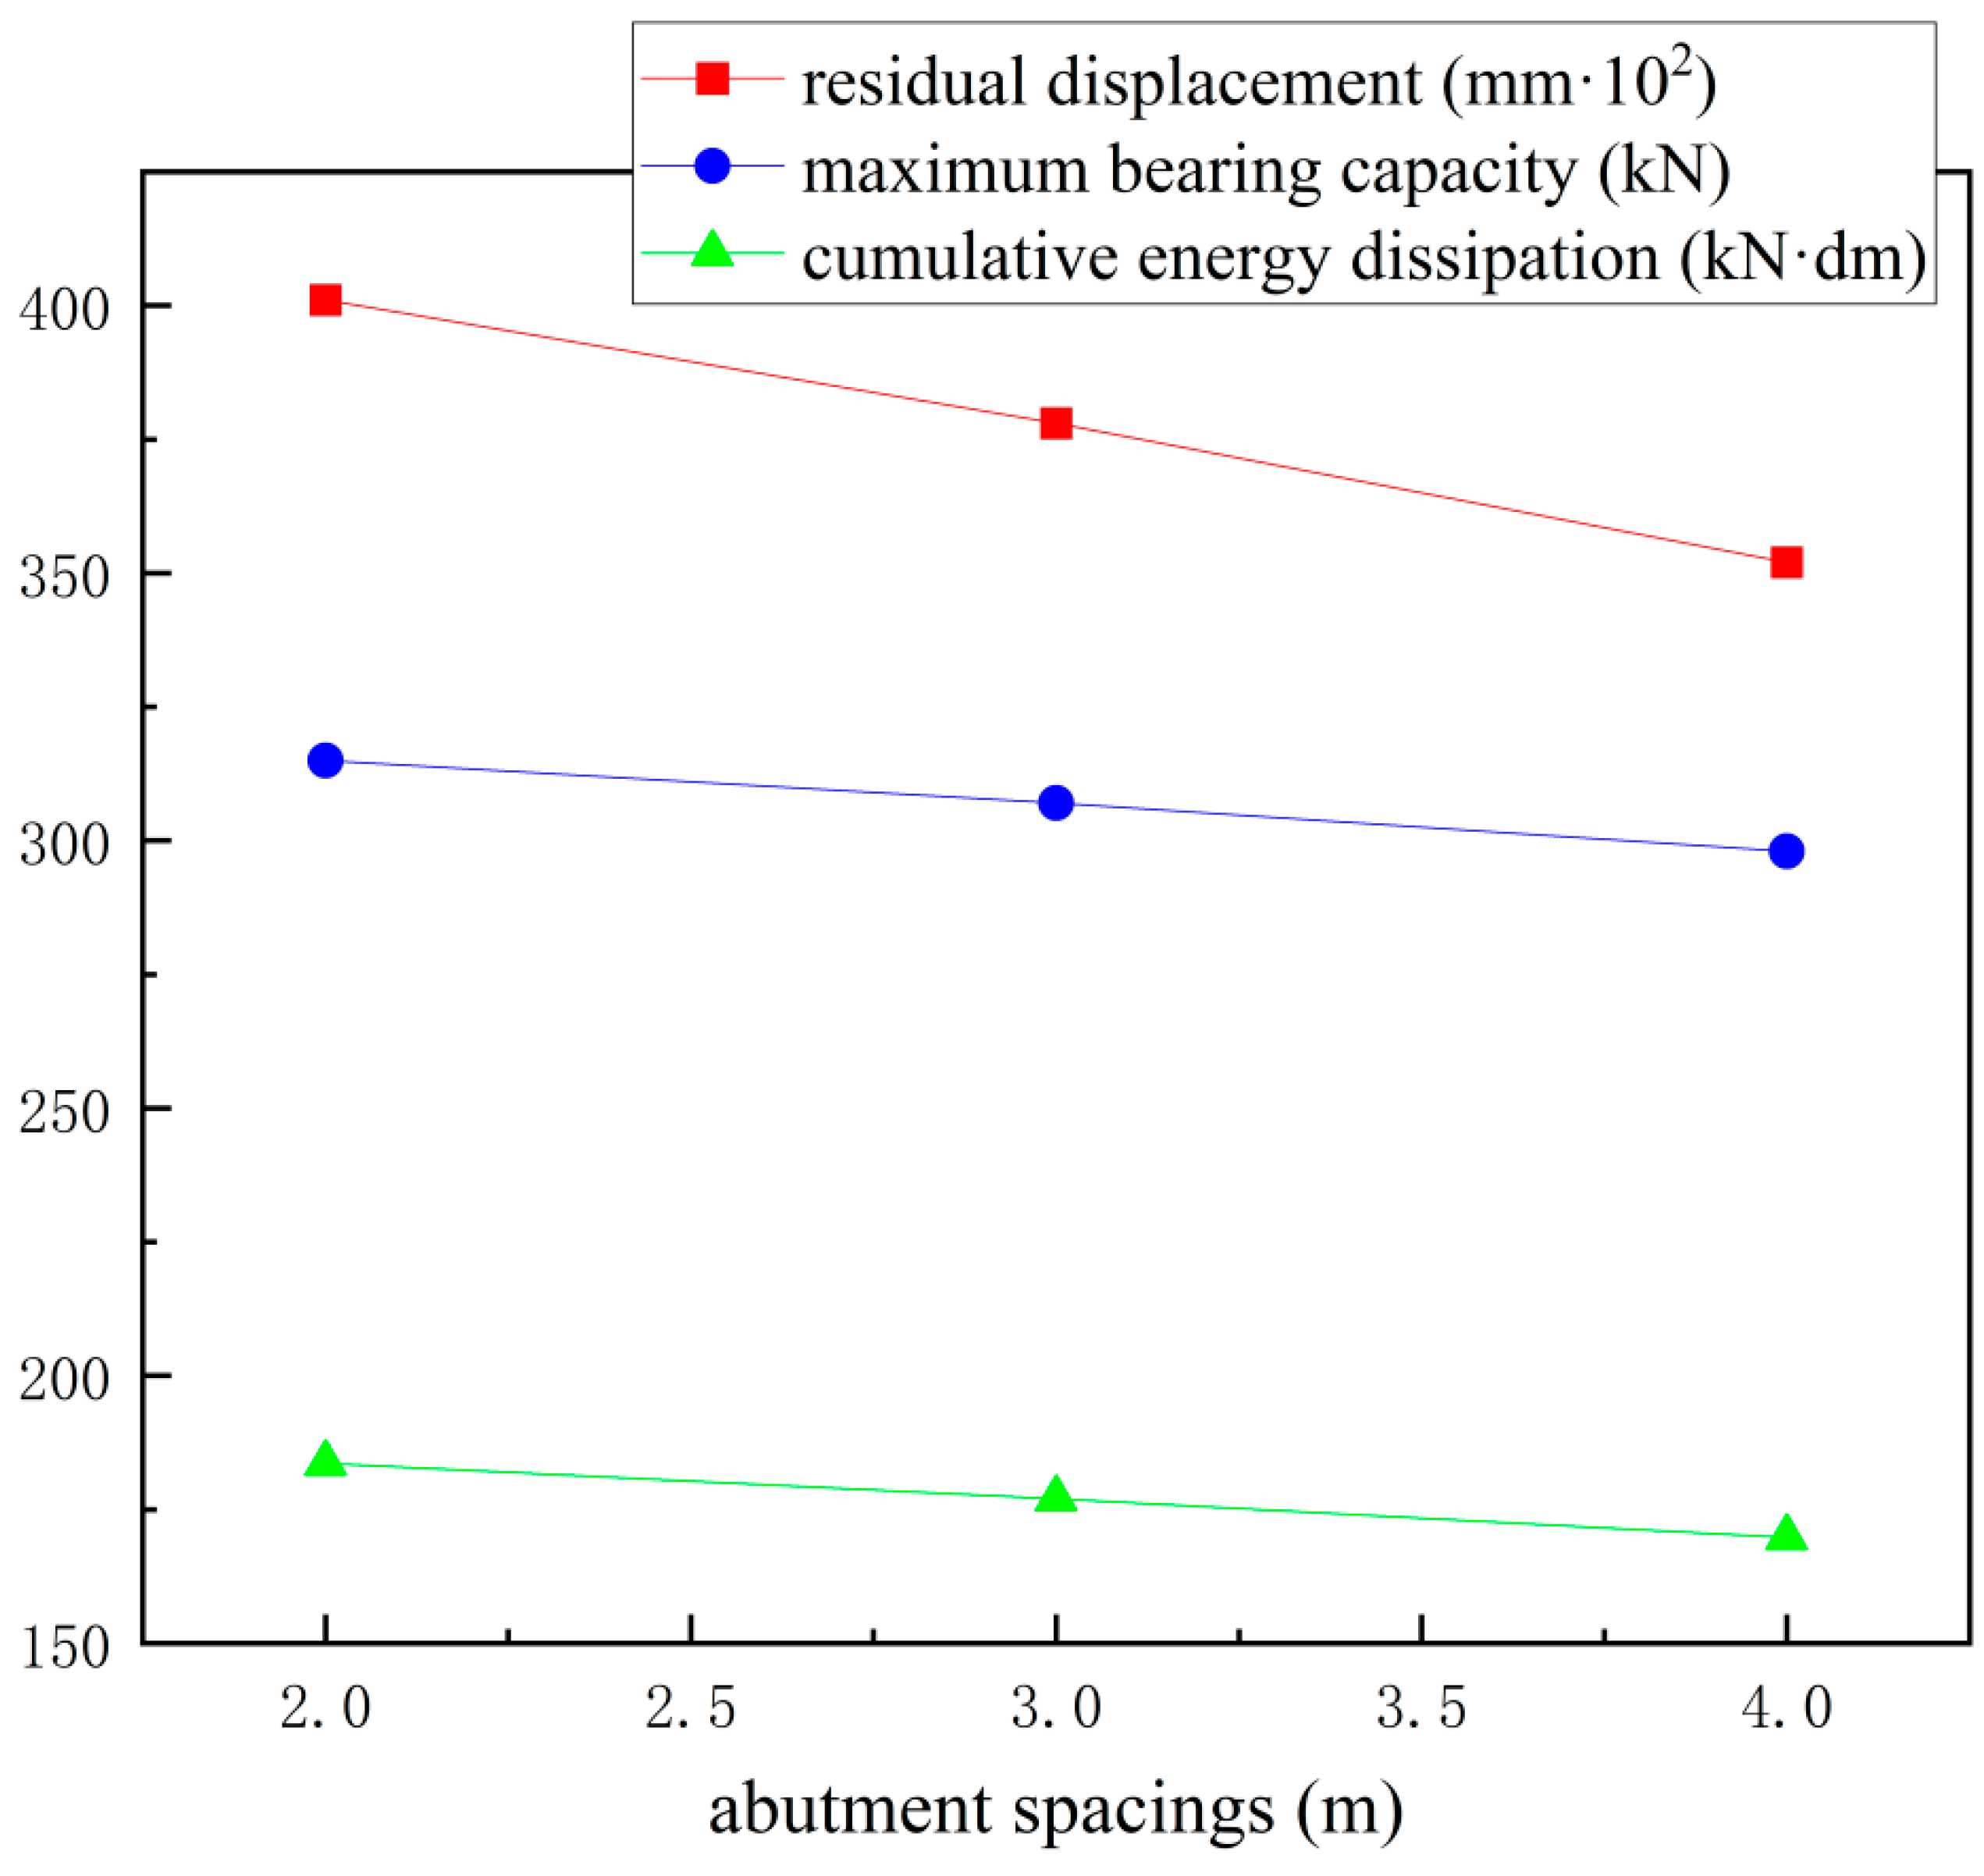
4.2.4. Abutment Spacing Under Hysteretic Analysis

As shown in Figure 12d, only the abutment spacing of the double-column SC-SAB is changed. From Table 11, it can be seen that the abutment spacing is increased from 2.0 m to 4.0 m, the maximum bearing capacity of the bridge is reduced by 5.7% from 315 kN to 298 kN, and the cumulative energy consumption is reduced by 7.52% from 18.36 kN·m to 16.98 kN·m. The residual displacement was reduced from 4.01 mm to 3.52 mm. The above analyses show that changing the abutment spacing of a double-column SC-SAB decreases the maximum load-carrying capacity of the bridge and reduces the energy dissipation capacity and residual displacement, but the effect is small (see Figure 16). This is due to the fact that changing the abutment spacing does not change the gravity axial compression ratio of a single abutment and the amount of prestressing tendon elongation under the same lateral displacement, which has a small effect on the lateral bearing capacity of a single abutment.

5. Conclusions

In this paper, a double-column SC-SAB structural form has been proposed, the mechanical properties of the abutment have been analyzed in the elastic working stage, and the analytical expression of its equivalent elastic stiffness has been derived. The accuracy of the proposed analytical method was verified through numerical simulation, and the seismic performance of this structural form was further discussed. In addition, this paper established the simplification of the double-column pier model into the equivalent model of single-column pier and verified the validity and correctness of the simplified model through numerical simulation. The main conclusions are as follows.
First, through the finite strip method to analyze the double-column SC-SAB with the increase in the horizontal load through the deformation stage of the force process, according to the double-column SC-SAB deformation force, the asynchronous characteristics of the double-column SC-SAB equivalent elastic stiffness of the analytical expression is deduced.
Second, this paper proposed a simplified model. Based on the stiffness equivalence condition, this model assigns the correspondingly calculated stiffness to the bottom of the single-column SC-SAB model. The correctness of the simplified model is successfully verified.
Third, based on the finite element model established through the zero-length unit modeling method, a pushover analysis was carried out on the double-column self-centering segmental bridge. The results show that changing the initial prestressing force and aspect ratio of the double-column SC-SAB has a significant effect on seismic performance. The stiffness increases with higher initial prestressing force but decreases with larger aspect ratios. And the gravity axial compression ratio and abutment spacing have a smaller effect on it.
Finally, through the hysteretic response analysis of double-column SC-SAB, it is concluded that the initial prestressing force and aspect ratio of prestressing reinforcement have a significant effect on the energy dissipation capacity, lateral load capacity, and residual displacement of bridges. With increasing initial prestressing force, cumulative energy dissipation and residual displacements decrease; conversely, with decreasing aspect ratios, both cumulative energy dissipation and residual displacements reduce. Meanwhile, the gravity axial compression ratio and abutment spacing have little effect on them.

Future Work

This study conducted a systematic investigation on double-column SC-SAB. However, several critical issues remain to be further explored: the numerical simulation methods, design criteria, and experimental verification all warrant further research. Additionally, experimental validation is relatively scarce, particularly for large-scale specimen quasi-static testing, which urgently requires reinforcement. Current research on double-column bridge piers remains limited worldwide, hindering their engineering application. Future work should focus on the following: developing accurate numerical models, creating specialized design methods, and performing experimental validation. These improvements will help overcome design challenges and enable practical implementation.

Author Contributions

Conceptualization, H.G.; methodology, H.G., W.X. and G.L.; software, W.X. and G.L.; validation, W.X.; writing—original draft preparation, W.X. and G.L.; writing—review and editing, W.X.; supervision, H.G. All authors have read and agreed to the published version of the manuscript.

Funding

This research was funded by Jilin Provincial Department of Education, grant number JJKH20210297KJ. And The APC was funded by Jilin Provincial Department of Education.

Data Availability Statement

The original contributions presented in the study are included in the article, further inquiries can be directed to the corresponding author.

Conflicts of Interest

The authors declare no conflict of interest.

References

  1. Dong, H.; Han, Q.; Du, X. Seismic resilience evaluation of self-centering bridge systems: A state-of-the-art review. Eng. Struct. 2021, 242, 112532. [Google Scholar] [CrossRef]
  2. Wang, J.; Guo, A.; Li, C. Residual drift control in self-centering bridge piers: A meta-analysis of 62 experimental studies. Eng. Struct. 2020, 213, 110602. [Google Scholar] [CrossRef]
  3. Palermo, A.; Mashal, M.; Tani, M. Flag-shaped hysteresis in post-tensioned concrete structures: Theoretical modeling and experimental validation. J. Struct. Eng. 2021, 147, 04020354. [Google Scholar] [CrossRef]
  4. Marriott, D.; Pampanin, S.; Bull, D. Minimum prestress requirements for self-centering capability in segmental bridge columns. Earthq. Spectra 2022, 38, 456–478. [Google Scholar]
  5. Kavianipour, F.; Saiidi, M.S. Accelerated construction of self-centering bridges: Case studies. J. Bridge Eng. 2021, 26, 04021012. [Google Scholar] [CrossRef]
  6. Bu, Z.; Ou, Y.; Song, J. Energy dissipation in unbonded post-tensioned bridge piers: Experimental quantification and modeling. Eng. Struct. 2020, 223, 111156. [Google Scholar] [CrossRef]
  7. JTG/T 3360-2-2018; Specifications for Design of Highway Reinforced Concrete and Prestressed Concrete Bridges and Culverts. China Communications Press: Beijing, China, 2018.
  8. Nikoukalam, M.; Sideris, P. Damping characteristics of hybrid self-centering bridge columns with replaceable dissipaters. J. Earthq. Eng. 2021, 25, 1531–1552. [Google Scholar] [CrossRef]
  9. Dong, H.; Du, X.; Han, Q.; Bi, K.; Hao, H. Hysteretic performance of RC double-column bridge piers with self-centering buckling-restrained braces. Bull. Earthq. Eng. 2019, 17, 3255–3281. [Google Scholar] [CrossRef]
  10. Dong, H.; Han, Q.; Du, X. Replaceable energy-dissipating devices for self-centering bridge piers: Experimental and numerical study. J. Struct. Eng. 2020, 146, 04020177. [Google Scholar] [CrossRef]
  11. Qian, H.; Yan, C.; Jin, G. Superelastic SMA bars as supplemental dampers in self-centering bridge piers: Full-scale validation. Constr. Build. Mater. 2022, 319, 126065. [Google Scholar] [CrossRef]
  12. Zhao, Z.; He, H.S.; Yuan, L.; Li, J. Review of experimental investigations on seismic performance of precast segmental bridge columns in seismic regions. Adv. Struct. Eng. 2023, 26, 1161–1186. [Google Scholar] [CrossRef]
  13. Zhu, Z.; Li, Y.; He, S.; Chen, X. Study on the seismic performance of unbonded prestressed combination. Bridge Constr. 2022, 52, 58–65. [Google Scholar]
  14. Qian, H.; Yang, Y.; Yang, C. Experimental study on the seismic performance of self-centering bridge piers incorporating ECC and superelastic SMA bars. Structures 2022, 46, 1955–1967. [Google Scholar] [CrossRef]
  15. Qian, H.; Qiu, P.; Jin, G. Study on seismic performance of SMA/ECC pier column. Eng. Mech. 2023, 40, 172–183. [Google Scholar]
  16. Zhao, Z.; Yuan, L.; Chao, M. Quasi-static cyclic tests on seismic performance of partial precast bridge columns. KSCE J. Civ. Eng. 2023, 27, 4288–4299. [Google Scholar] [CrossRef]
  17. Jia, J.; Tan, Y.; Bai, B. Seismic performance analysis of self-resetting prefabricated RC piers. J. Appl. Basic Eng. Sci. 2022, 30. [Google Scholar]
  18. Jia, J.; Bian, J.; Li, Y. Numerical simulation of self-centering double-column piers. J. Vib. Shock 2023, 42, 89–96. [Google Scholar]
  19. He, S.; Zhu, L.; Zhu, Z. Analysis of seismic design parameters for prefabricated bridge piers. J. Chongqing Jiaotong Univ. 2023, 42, 89–98. [Google Scholar]
  20. Liu, Z.; He, S.; Zhu, Z. Seismic performance analysis of partial precast piers. Highway. Transp. Tech. 2023, 40, 82–90. [Google Scholar]
  21. Sideris, P. Seismic Analysis and Design of Precast Concrete Segmental Bridges. Ph.D. Thesis, State University of New York, Buffalo, NY, USA, 2012. [Google Scholar]
  22. Wu, J.; Zhang, J.; Xie, L.; Wei, Y.; Tong, C. Experimental and theoretical investigations of post-tensioned precast reinforced concrete bridge pier with external replaceable energy dissipaters. Eng. Struct. 2023, 294, 116719. [Google Scholar] [CrossRef]
  23. Motaref, S.; Saiidi, M.S. Influence of column coupling on seismic response of self-centering bridge bents. Eng. Struct. 2023, 278, 115466. [Google Scholar] [CrossRef]
  24. Motaref, S.; Saiidi, M.S. Multi-spring modeling for segmental columns. Earthq. Eng. Struct. Dyn. 2023, 52, 189–211. [Google Scholar] [CrossRef]
  25. Gao, H.; Song, Y.; Yuan, W.; Lu, H.; Cao, S. Seismic Design Method of Self-Centring-Segment Bridge Piers with Tensile-Type Viscoelastic Dampers. Adv. Civ. Eng. 2021, 2021, 6688006. [Google Scholar] [CrossRef]
  26. JTG/T B02-1-2010; Seismic Design Specifications for Highway Bridges. China Communications Press: Beijing, China, 2008.
  27. Xue, G.; Guo, X. Nonlinear full process analysis of flexural stiffness of reinforced concrete beams. J. Inn. Mong. Univ. Sci. Technol. 2007, 3, 250–252. [Google Scholar]
  28. Cai, Z. Seismic Performance and Design Method of Hybrid Reinforced Precast Segmental Bridge Columns. Ph.D. Thesis, Harbin Institute of Technology, Harbin, China, 2018. [Google Scholar]
  29. Kurama, Y.C. Hybrid post-tensioned precast concrete walls for use in seismic regions. PCI J. 2002, 47, 36–59. [Google Scholar] [CrossRef]
Figure 1. Schematic diagram of the analysis principle of the finite strip method.
Buildings 15 01919 g001
Figure 2. Stress diagrams of three failure states.
Buildings 15 01919 g002
Figure 3. Schematic diagram of the bridge under force.
Buildings 15 01919 g003
Figure 4. Schematic calculation diagram of the bridge.
Buildings 15 01919 g004
Figure 5. Schematic diagram of the finite element model of the double-column pier.
Buildings 15 01919 g005
Figure 6. Schematic diagram of the double-column self-centering bridge structure.
Buildings 15 01919 g006
Figure 7. Reinforcement detailing drawing.
Buildings 15 01919 g007
Figure 8. Schematic diagram of the single-column self-centering bridge structure.
Buildings 15 01919 g008
Figure 9. Skeleton curves of the double-column self-centering bridge.
Buildings 15 01919 g009
Figure 10. Skeleton curves of single-column and double-column self-centering bridges.
Buildings 15 01919 g010
Figure 11. Schematic diagram of pushover.
Buildings 15 01919 g011
Figure 12. Schematic diagram of cycle.
Buildings 15 01919 g012
Figure 13. The variation trends of simulation indicators under different axial compression ratios.
Buildings 15 01919 g013
Figure 14. The variation trends of simulation indicators under different initial prestresses.
Buildings 15 01919 g014
Figure 15. The variation trends of simulation indicators under different height-to-width ratios.
Buildings 15 01919 g015
Figure 16. The variation trends of simulation indicators under different abutment spacings.
Buildings 15 01919 g016
Table 1. Material properties of concrete and prestressed reinforcement.
ConcretePrestressed Reinforcement
Compressive Strength
(MPa)
Elastic Modulus
(GPa)
Poisson’s RatioYield Strength
(MPa)
Ultimate Strength
(MPa)
Elastic Modulus
(GPa)
30300.216701860195
Table 2. Comparison table of stiffness of double-column piers.
Pier StiffnessSimulated Value
(kN/m)
Theoretical Value
(kN/m)
Error
(%)
yield stiffness12,10811,9771.08
equivalent stiffness574555094.11
Table 3. Comparison table of simulated values of peak points.
Double-ColumnSingle-ColumnError (%)
peak displacement (cm)7.07.22.86
peak bearing capacity (kN)4024030.25
Table 4. Simulation indicators of different axial compression ratios under pushover analysis.
Axial Compression RatioYield Displacement
(cm)
Yield Stiffness
(kN/m)
Peak Displacement
(cm)
Peak Bearing Capacity
(kN)
Ultimate Displacement
(cm)
Ultimate Bearing Capacity
(kN)
0.122.896797.029816.4254
0.152.898326.430116.4255
0.183.098756.230316.2258
Table 5. Simulation indicators of different initial prestresses under pushover analysis.
Initial Prestress
(kN)
Yield Displacement
(cm)
Yield Stiffness
(kN/m)
Peak Displacement
(cm)
Peak Bearing Capacity
(kN)
Ultimate Displacement
(cm)
Ultimate Bearing Capacity
(kN)
7502.896797.029816.4254
8502.611,0387.032415.6276
9502.412,3336.834915.0297
Table 6. Simulation indicators of different height-to-width ratios under pushover analysis.
Height-to-Width RatioYield Displacement
(cm)
Yield Stiffness
(kN/m)
Peak Displacement
(cm)
Peak Bearing Capacity
(kN)
Ultimate Displacement
(cm)
Ultimate Bearing Capacity
(kN)
6.672.896797.029816.4254
7.503.075007.424816.6211
8.333.259387.621017.0178
Table 7. Simulation indicators of different abutment spacings under pushover analysis.
Abutment Spacing
(m)
Yield Displacement
(cm)
Yield Stiffness
(kN/m)
Peak Displacement
(cm)
Peak Bearing Capacity
(kN)
Ultimate Displacement
(cm)
Ultimate Bearing Capacity
(kN)
2.03.291566.631516.0267
3.03.094336.630716.2261
4.02.896797.029816.4254
Table 8. Simulation indicators of different axial compression ratios under hysteretic analysis.
Axial Compression RatioResidual Displacement (mm)Cumulative Energy Dissipation (kN·m)Maximum Bearing Capacity (kN)
0.123.5216.98298
0.153.2817.25301
0.183.0217.43303
Table 9. Simulation indicators of different initial prestresses under hysteretic analysis.
Initial Prestresses
(kN)
Residual Displacement (mm)Cumulative Energy Dissipation (kN·m)Maximum Bearing Capacity (kN)
7503.5216.98298
8503.2317.92324
9502.9318.75349
Table 10. Simulation indicators of different height-to-width ratios under hysteretic analysis.
Height-to-Width RatiosResidual Displacement (mm)Cumulative Energy Dissipation (kN·m)Maximum Bearing Capacity (kN)
6.673.5216.98298
7.503.8912.30248
8.334.539.54210
Table 11. Simulation indicators of different abutment spacings under hysteretic analysis.
Abutment Spacings
(m)
Residual Displacement (mm)Cumulative Energy Dissipation (kN·m)Maximum Bearing Capacity (kN)
2.04.0118.36315
3.03.7817.70307
4.03.5216.98298
Disclaimer/Publisher’s Note: The statements, opinions and data contained in all publications are solely those of the individual author(s) and contributor(s) and not of MDPI and/or the editor(s). MDPI and/or the editor(s) disclaim responsibility for any injury to people or property resulting from any ideas, methods, instructions or products referred to in the content.

