1. Introduction
Urban underground spaces initially received attention to overcome population concentrations and the limited available land due to urbanization [
1]. Recently, the development of underground space has become a trend in urban development [
2]. Underground space has become a public space to cope with traffic congestion and abnormal weather, and subway stations, underground shopping malls, and underground public spaces are becoming an important part of urban environmental planning [
3].
People in underground spaces, unlike above-ground spaces, often experience difficulties in navigating due to the lack of features from the terrain [
3]. With modern underground spaces having been developed in a relatively short period of time, people from different regions have common difficulties in navigating them.
Wayfinding is a self-awareness process, and several design elements play an important role in cognitive schemas [
4]. Using virtual reality and a simulation interface, this study applies them to design elements to investigate and compare different user perceptions of vast and complex underground spaces while minimizing any waste of resources and investments in time and effort. The VR scenario allows users to enhance their perceptions of an underground space and enhances their sense of experience in it.
This study identifies the visual elements that influence wayfinding in underground spaces in order to compare and analyze responses of people from different cultures. The results can contribute to planning guidelines that help people experience underground public spaces and can help them find escape routes in emergency situations.
2. Literature Review
2.1. Underground Public Space
Underground public space refers to any open place for underground public activities, including cultural, entertainment, and educational facilities [
5], but mainly refers to subway stations and commercial pathways. It is an important alternative to above-ground space [
6]. Underground cities are a new solution to urbanization problems and rapid industrial development. Through urban planning of underground space and type analysis, typing of underground spaces from an urban perspective, and results analysis, it is believed that in the construction of underground cities, the planning of pedestrian and public facilities is important [
7].
2.2. Wayfinding
Pasini’s wayfinding process is divided into three stages: decision making, decision execution, and information processing [
8]. Spatial cognition is established in this process. There are differences in wayfinding due to gender, which constitutes a predictor for effective wayfinding skills and for feeling wayfinding-related fear [
9]. In spatial navigation, surveys of navigation experiments and self-report questionnaires found that gender and age can have biased effects on wayfinding [
10]. Without considering the influence of other factors, the wayfinding process is based on the sign system. When reaching a decision point, correct information is needed for guidance [
11].
2.2.1. Width of Passages
In previous studies, experimental methods employed VR to simulate imaginary underground spaces in order to analyze pedestrian wayfinding behavior [
12]. During one underground pathfinding experiment, there was an obvious difference in the widths of the passages, and there was more selectivity in wide passages [
13]. In another study of pathfinding and path-choice tendencies in underground spaces, a
t-test proved that people prefer wide passages [
14]. During the transfer wayfinding process, the complexity of the building space and the width of the transfer pathway can significantly influence passenger behavior. These factors also have a substantial impact on passengers’ visual perception and spatial cognition, which ultimately feed back into their external navigation behavior [
15].
2.2.2. Brightness of the Passage
Visual information, brightness, signage systems, and placement of exhibits can affect wayfinding [
16]. Through simulation of a Shanghai subway station and experimental investigation into different bright and dark passages, it was concluded that brighter environments in subway stations are conducive to identifying wayfinding information [
17]. Brightness, color, and the perceived temperature of light have significant effects on long-term memory, cognitive tasks, problem-solving tasks, short-term memory tasks, performance evaluations, emotions, spatial perception, memory, etc. Any significant change will affect someone’s memory or judgment when that person makes decisions and judgments in complex and stressful environments [
18]. Experiments on wayfinding in light and dark environments by using VR, eye-tracking, and EEG readings found that the brightness in an environment has an important impact on wayfinding and that more people prefer bright environments [
19].
2.2.3. Cold and Warm Colors in a Passage
During wayfinding, a variety of environmental information contributes to decision-making, and color plays a role in environmental information. In a complex spatial structure, if someone wants to find a destination, they must first perceive the surrounding environmental information. The application of wayfinding colors in underground public spaces can provide a spatial sign to commuters, making their judgments and selections more accurate and easier to remember. Making full use of the communication function of color can make up for limitations in signposting and can play a helpful role as useful information [
20]. Uniqueness, openness, color differences, and the orientation of the interior influence perceptions during wayfinding [
21]. In wayfinding design, cold and warm colors represent different functions. Cold colors are generally used as guides for traffic routes, and warm colors are placed for good long-distance recognition [
22].
2.2.4. Presence or Absence of Obstacles
In underground spaces, obstacles are part of building structures and layouts, so their presence or absence in China and Korea can be one of the factors that affect wayfinding [
23]. From different viewing angles, there are different obstacles, different views of sign systems, or incomplete information, all of which affect wayfinding [
17].
2.2.5. Sign Systems
In one wayfinding experiment, researchers believed the location of the sign system and indicator plates would have an impact on wayfinding [
24]. Wayfinding is influenced by rationality of movement inside a building, the clarity of signs, and the atmosphere inside the building [
25]. Sign systems in wayfinding have been recognized by many cities around the world as an effective mechanism to encourage walkability. Clear visual information can improve subway transfers that people experience and their spatial knowledge. Establishing a good mental image helps generate a more effective cognitive map, ensuring accuracy in wayfinding owing to increased familiarity with the environment [
26].
In summary, the key visual environmental factors—passage width, brightness, color temperature, obstacles, and signage systems—interact to shape users’ wayfinding behaviors in underground spaces. These elements do not function in isolation; rather, they collectively influence spatial cognition, emotional responses, and navigation efficiency. For instance, while wider and brighter passages may enhance perceived accessibility and reduce stress, the presence of obstacles or unclear signage may undermine these benefits, particularly under time pressure or in unfamiliar settings. The integration of warm versus cool colors adds an additional layer of affective and directional influence, potentially moderating users’ spatial decisions depending on cultural expectations. However, although individual studies have examined these variables separately [
5,
6,
7,
8,
9,
10,
11,
12,
14,
15,
16,
17,
18,
19,
20,
21,
22,
24,
25,
26], there remains a lack of comprehensive synthesis on how these elements co-function and vary across cultural contexts. This study addresses this gap by examining their combined effects in a controlled VR simulation, with empirical comparisons between Korean and Chinese users to highlight culturally nuanced navigation preferences.
3. Experimental Design
This study conducted a survey of Korean and Chinese college students to identify visual environmental factors that affect wayfinding in underground spaces and to verify whether cultural differences affect these factors. Participants were asked about five visual environmental factors: passageway width (wide vs. narrow), brightness (light vs. dark), color (cool or warm), obstacles (presence or absence), and the type of sign system. Evaluations of the VR experiment and an emotion vocabulary were conducted.
Based on the review of existing literature and the theoretical framework discussed above, the following research questions were developed to guide the experimental design and data analysis.
RQ1: How do people in Korea and China respond to visual environment factors that affect navigation in underground spaces?
RQ1-1: Are there differences in responses to the width of the passageway?
RQ1-2: Are there differences in responses to the brightness of the space?
RQ1-3: Are there different choices depending on the color of the space?
RQ1-4: Are there different choices depending on whether there are obstacles in the passageway or not?
RQ1-5: Are there different selections depending on the placement characteristics of the sign system?
RQ2: Do Koreans and Chinese differ in emotional evaluations of visual environmental factors that affect wayfinding?
4. Methods
The literature review was conducted to extract visual environmental factors affecting wayfinding in underground spaces. We searched academic databases including Google Scholar, ScienceDirect, and KISS using combinations of keywords such as “underground wayfinding”, “visual environment”, “passage width”, “illumination and navigation”, and “signage system”. Studies from 2009 to 2025 were reviewed, and those focusing on underground spaces and spatial cognition in VR or simulation environments were prioritized.
A total of 29 papers were selected based on relevance and methodological rigor. These were categorized according to five themes: passage width, brightness, color temperature, obstacles, and sign systems. This thematic organization guided both the selection of variables for the VR experiment and the structure of our simulation environment.
The review revealed recurring findings such as preferences for brighter environments [
26], clarity-enhancing sign combinations [
27], and cross-cultural color associations [
28], which were subsequently embedded into the virtual model and emotional evaluation framework.
This study included both a literature review and experiments. In the literature review, wayfinding, visual perception theory, and underground space planning guidelines were discussed to extract the main factors that affect wayfinding in underground spaces, focusing on research results. The functions and theoretical basis of VR were discussed to create the research methods and tools.
The study was divided into a VR experiment and a simple survey of experimental factors. The VR model was created based on previous research and field surveys of subway transfer stations. We created a virtual model using 3D Studio Max (3ds Max) and Unity 3D and input the virtual scene using C++ for human–computer interaction using a head-mounted display (HMD). After conducting an emotion vocabulary evaluation, the data collected were analyzed using IBM SPSS 26.
4.1. Participants
The survey participants were male and female Chinese college students aged 20–29 years (Group C) and Korean college students (Group K). Since the experiment required wearing an immersive VR HMD, people in their 20s were considered the most suitable group because if they were older or younger, wearing a VR display could cause discomfort or dizziness [
29].
The number of survey participants was based on previous G*Power 3.1 analysis results. When calculating the G*Power value of 0.8, the number of participants required for the t-test analysis was 60, so we recruited about 30 each from Korea and China.
4.2. Tools
Participants in the VR experiment wore a VR helmet and manipulated a controller. The machine for the VR experiment was a PICO NEO3, and the preferred directions were selected via spatial positioning through 6DOF (6DOF is the term in VR that refers to the ability to monitor changes in spatial position—up and down, left and right, and front and back—from body movement, in addition to changes in field of view from head rotation). The experiment itself was conducted via wireless streaming through the SteamVR API.
4.3. VR Model
Before producing the VR experimental model, the plan was first confirmed and established according to the planning order. The decision points and routes were based on the literature review and field survey results obtained at Seoyeon Station and Deokcheon Station in Pusan. Through the investigation of decision points, T-shaped paths were selected for testing.
First, when using T-shaped paths in an experimental model, it is necessary to consider whether each left or right choice is influenced by people’s daily habits. Previous research listed in
Table 1 showed that people have little influence over their own behavioral habits when making choices.
Although the previous studies listed in
Table 1 show no statistically significant preference between left and right directional choices, this factor was initially considered during experimental planning. However, due to the consistently low significance levels observed and the minimal likelihood of left–right bias affecting the outcomes, this variable was ultimately not included in the final analysis.
The experimental model used a ratio of 2:1 (e.g., a width of 8 m with a height of 4 m). When the ratio of the width and height of the passage is less than 1:1, people feel closed in, anxious, and oppressed, whereas a ratio of 1:1 gives a feeling of stability. If the width-to-height ratio is greater than 1:1 and less than 2:1, the feeling is of being spatially balanced and comfortable; a width-to-height ratio of exactly 2:1 gives a feeling of openness. If the width-to-height ratio is greater than 2:1, it is easy for someone to feel unstable [
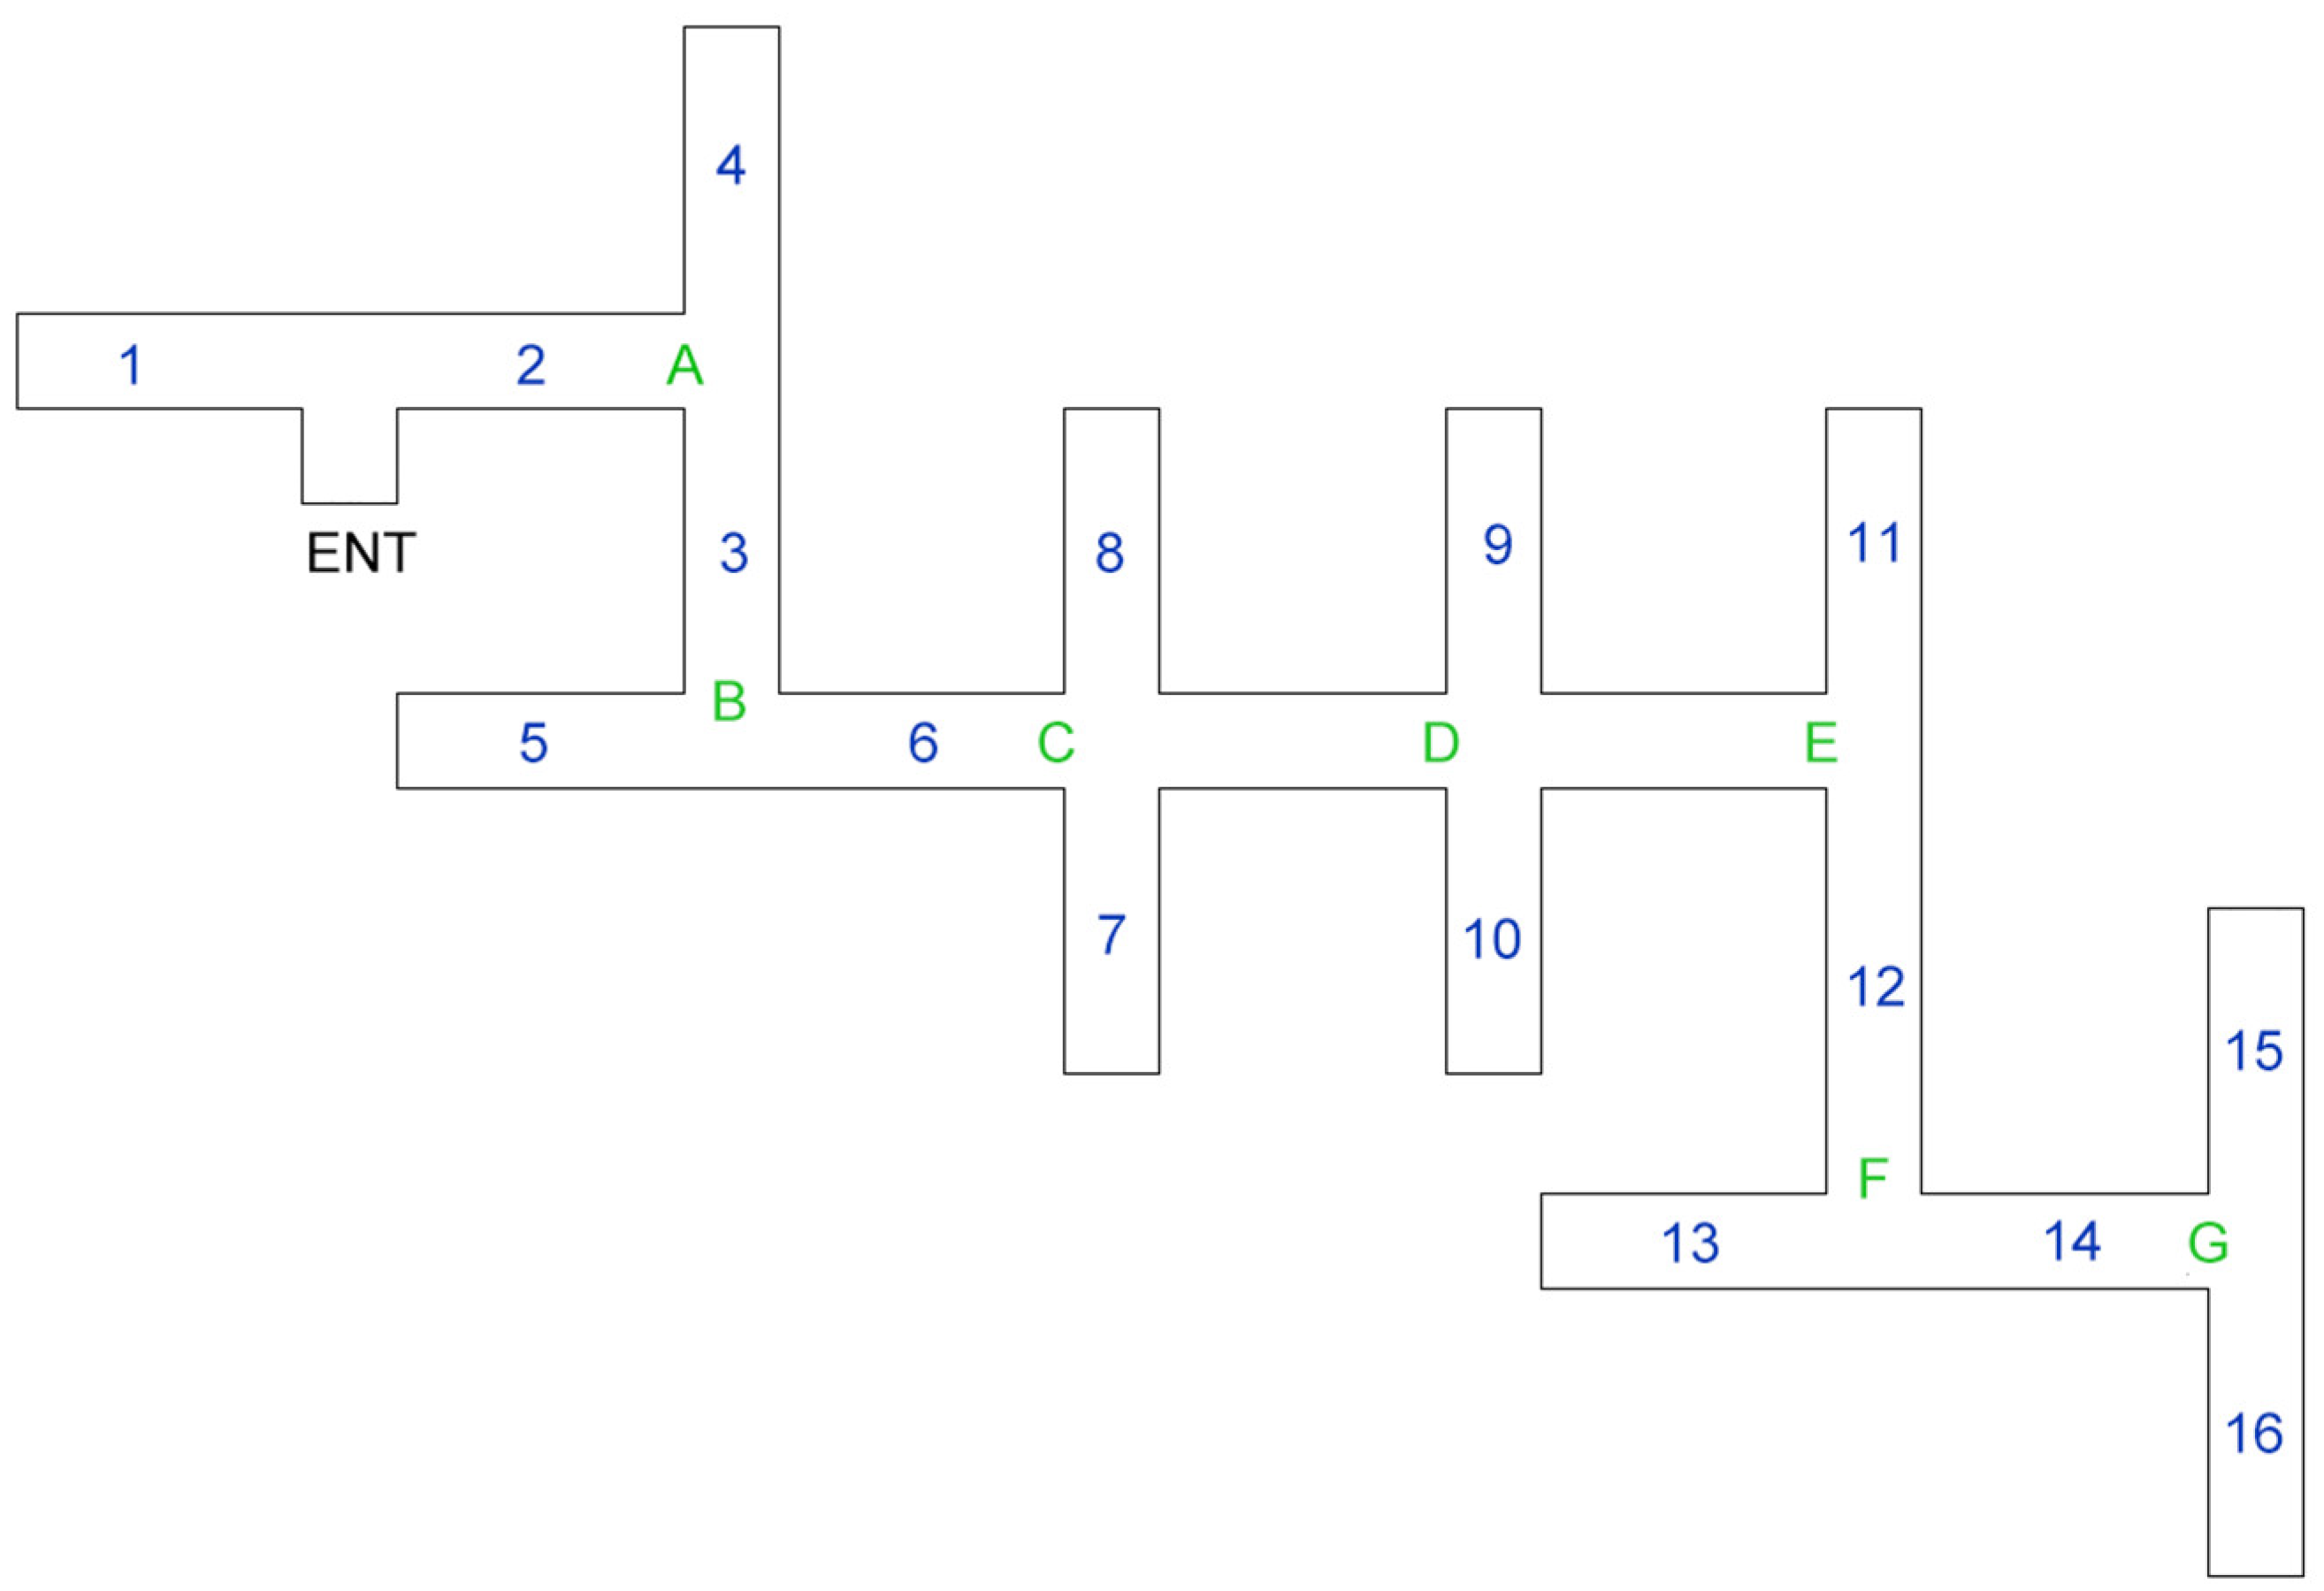
12]. Accordingly, the viewing height in the 3ds Max model was 1.56 m, and the subway station decision points reflected T-shaped elements for the floor plan shown in
Figure 1.
In
Figure 1, the coding indicates the following characteristics: 1—Cold color; 2—Warm color; 3—Bright lighting; 4—Dark lighting; 5—No hanging signs; 6—Hanging sign; 7—Floor sign; 8—No floor sign; 9—Hanging sign + floor sign; 10—No signs; 11—Floor sign; 12—Hanging sign; 13—Presence of an obstacle; 14—No obstacles; 15—Narrow passage; and 16—Wide passage.
A, B, C, D, E, F, and G indicate decision points.
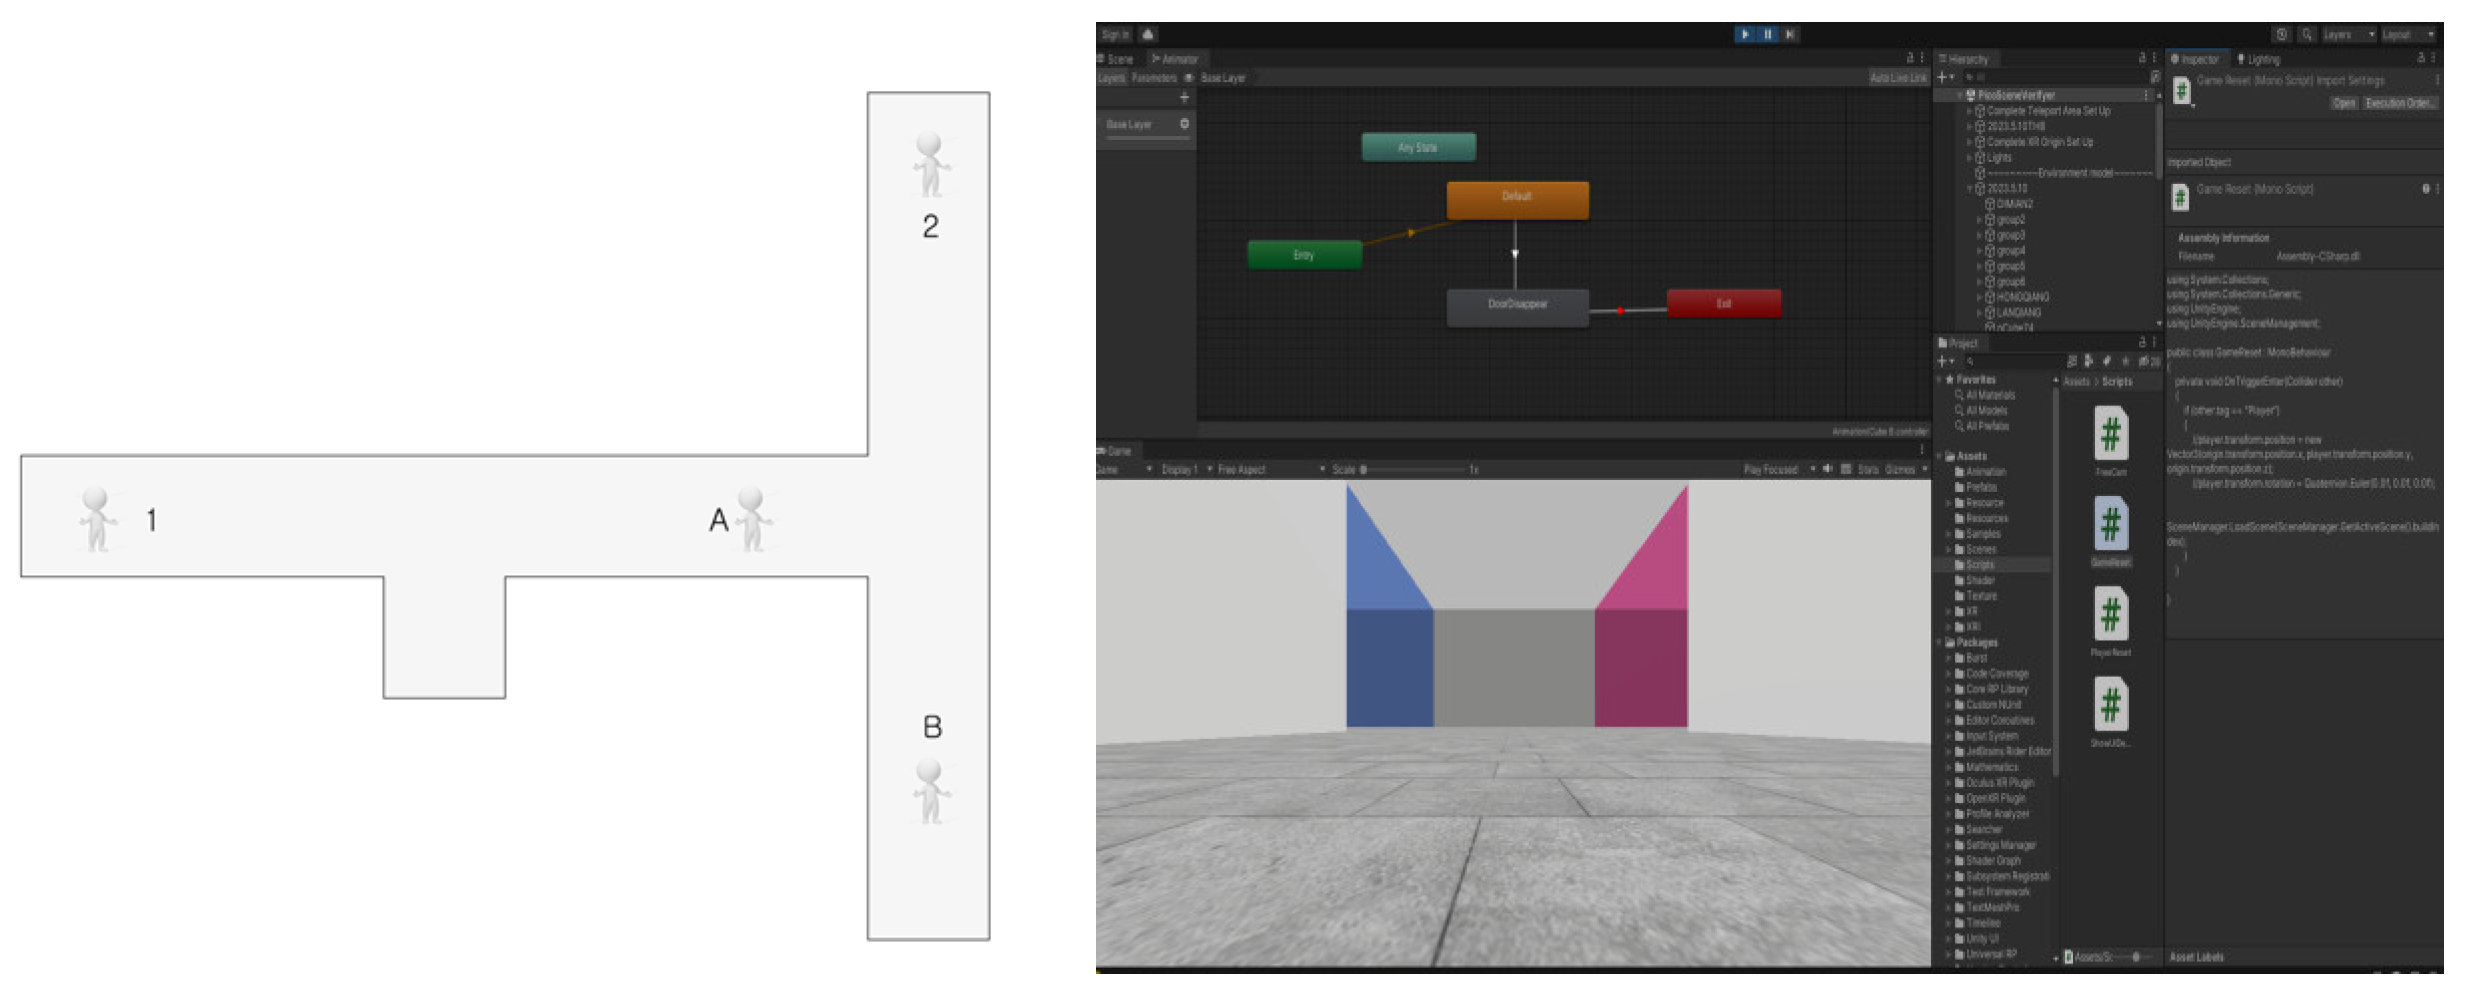
Decision points were located where participants could save time, make better choices, reduce the risk of getting lost, and perform tests more easily. A decision point, as seen in
Figure 2, was programmed to transmit to the VR device using C++.
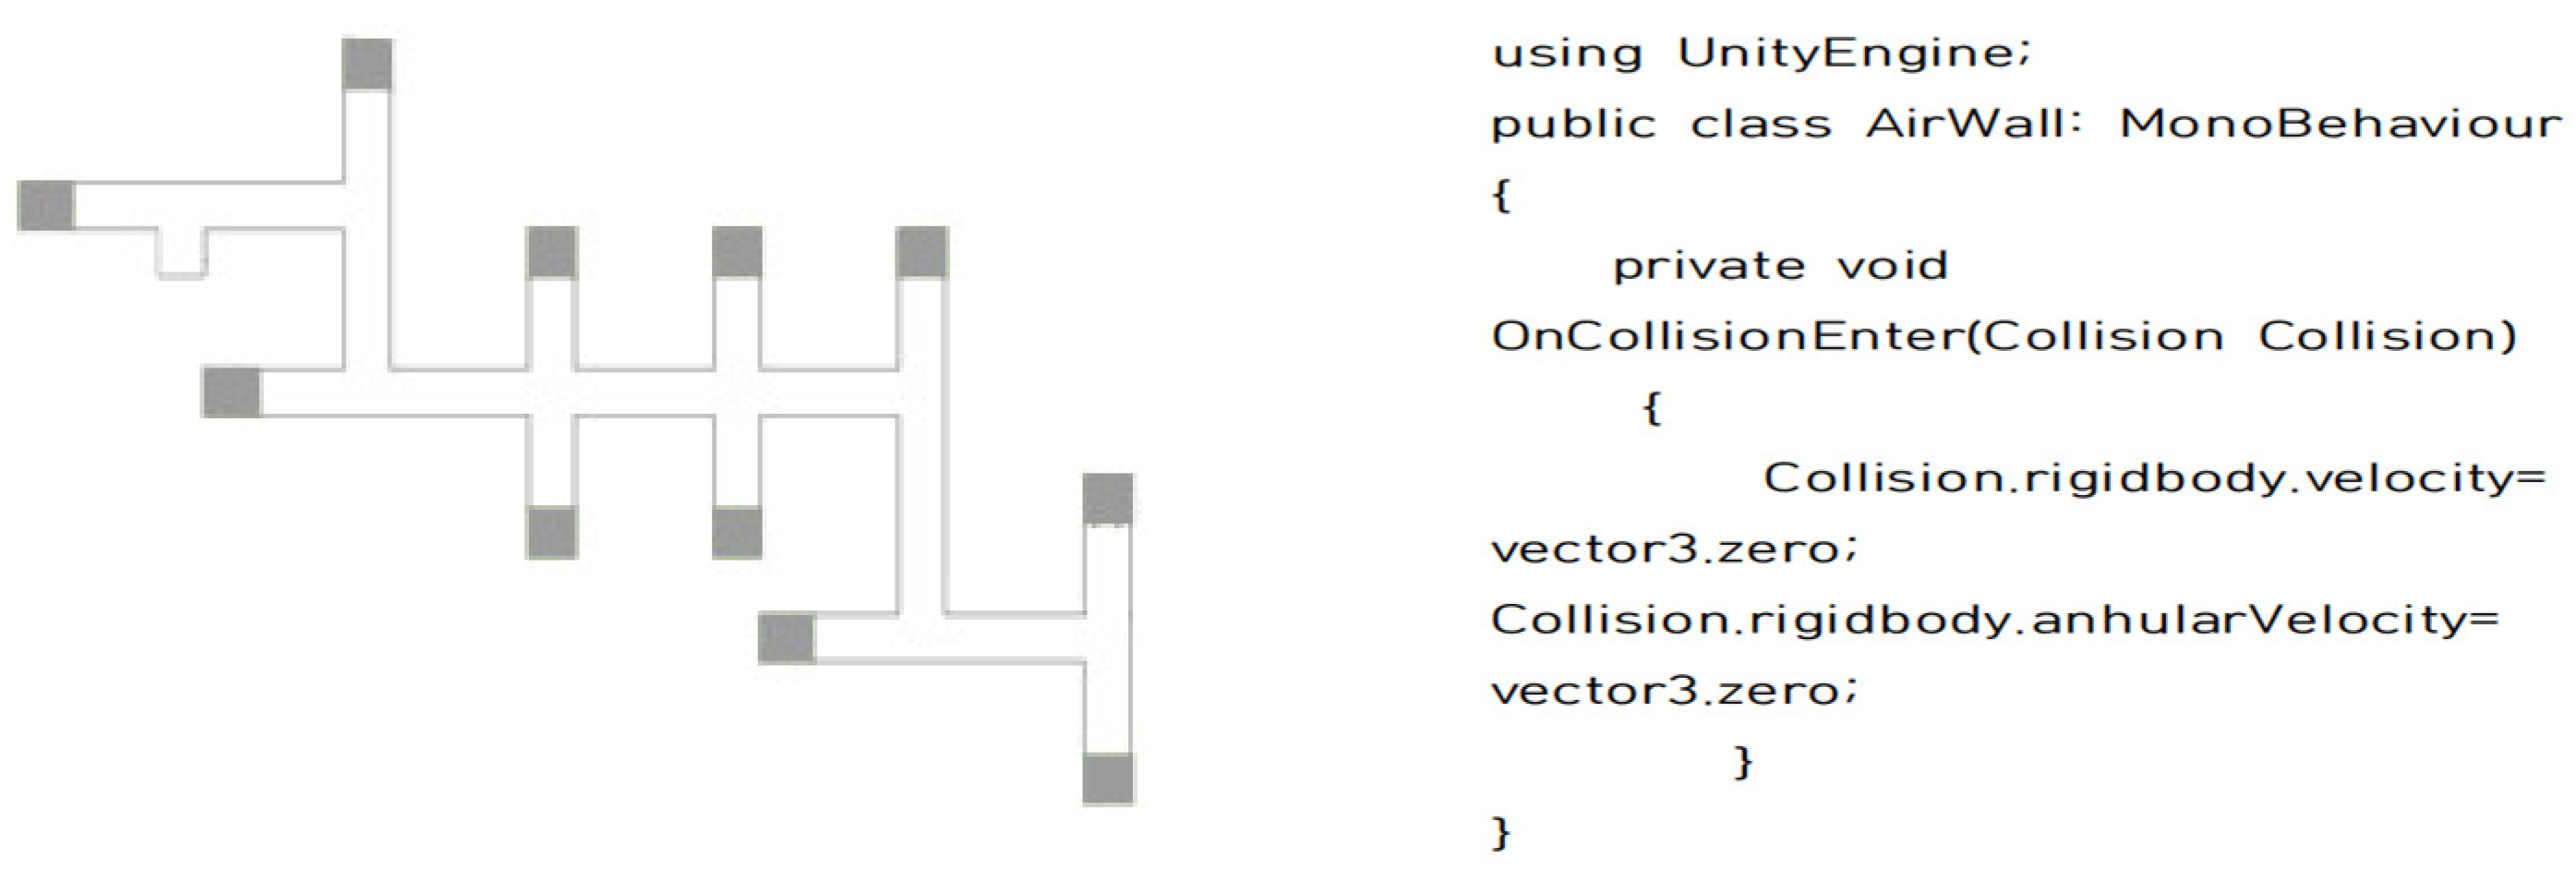
The simulation space was expressed as infinitely expanded. Air walls (similar to air, i.e., transparent, but participants could not pass through them) allowed participants to see this effect (see
Figure 3).
The height of the hanging sign system was determined based on average heights of the male and female participants. According to the results of Korea’s eighth average height survey, Korean men are 172.5 cm tall and women are 159.6 cm tall; the distance from the eyes to the top of the head is 10 cm, so gaze height for Korean men is 162.5 cm and gaze height for Korean women is 149.6 cm. The average eye level for the simulation was 156 cm.
4.4. SD Scale Emotional Vocabulary
The emotion vocabulary evaluation tool consisted of vocabulary extracted from previous studies to measure people’s emotional responses to factors that affect wayfinding. The terms selected were continuity, distance, accessibility, stress, sense of direction, stability, attention, clarity, identification, and connectivity. They are intended to determine understanding and can be used to analyze the psychological state from choices or pathfinding and suggest specific improvements.
Based on a review of existing literature on wayfinding and emotional response, the study selected 11 key evaluative terms, as summarized in
Table 2.
4.5. Experimental Process
In preparation, we started by explaining the specific process and experimental situation to the participants, including the purpose of the study and the order and floor plan of the experimental scene. After participants signed a consent form, they went through the experiment sequentially. If they felt uncomfortable, they were asked to stop immediately and rest. After the experiment, an emotion vocabulary evaluation of the scene was conducted.
Among the 64 volunteers, 31 Koreans and 33 Chinese participated in the experiment. Participants wore a PICO Neo3 HMD while using the controller. The VR environment was maintained through a PC connected to the VR devices.
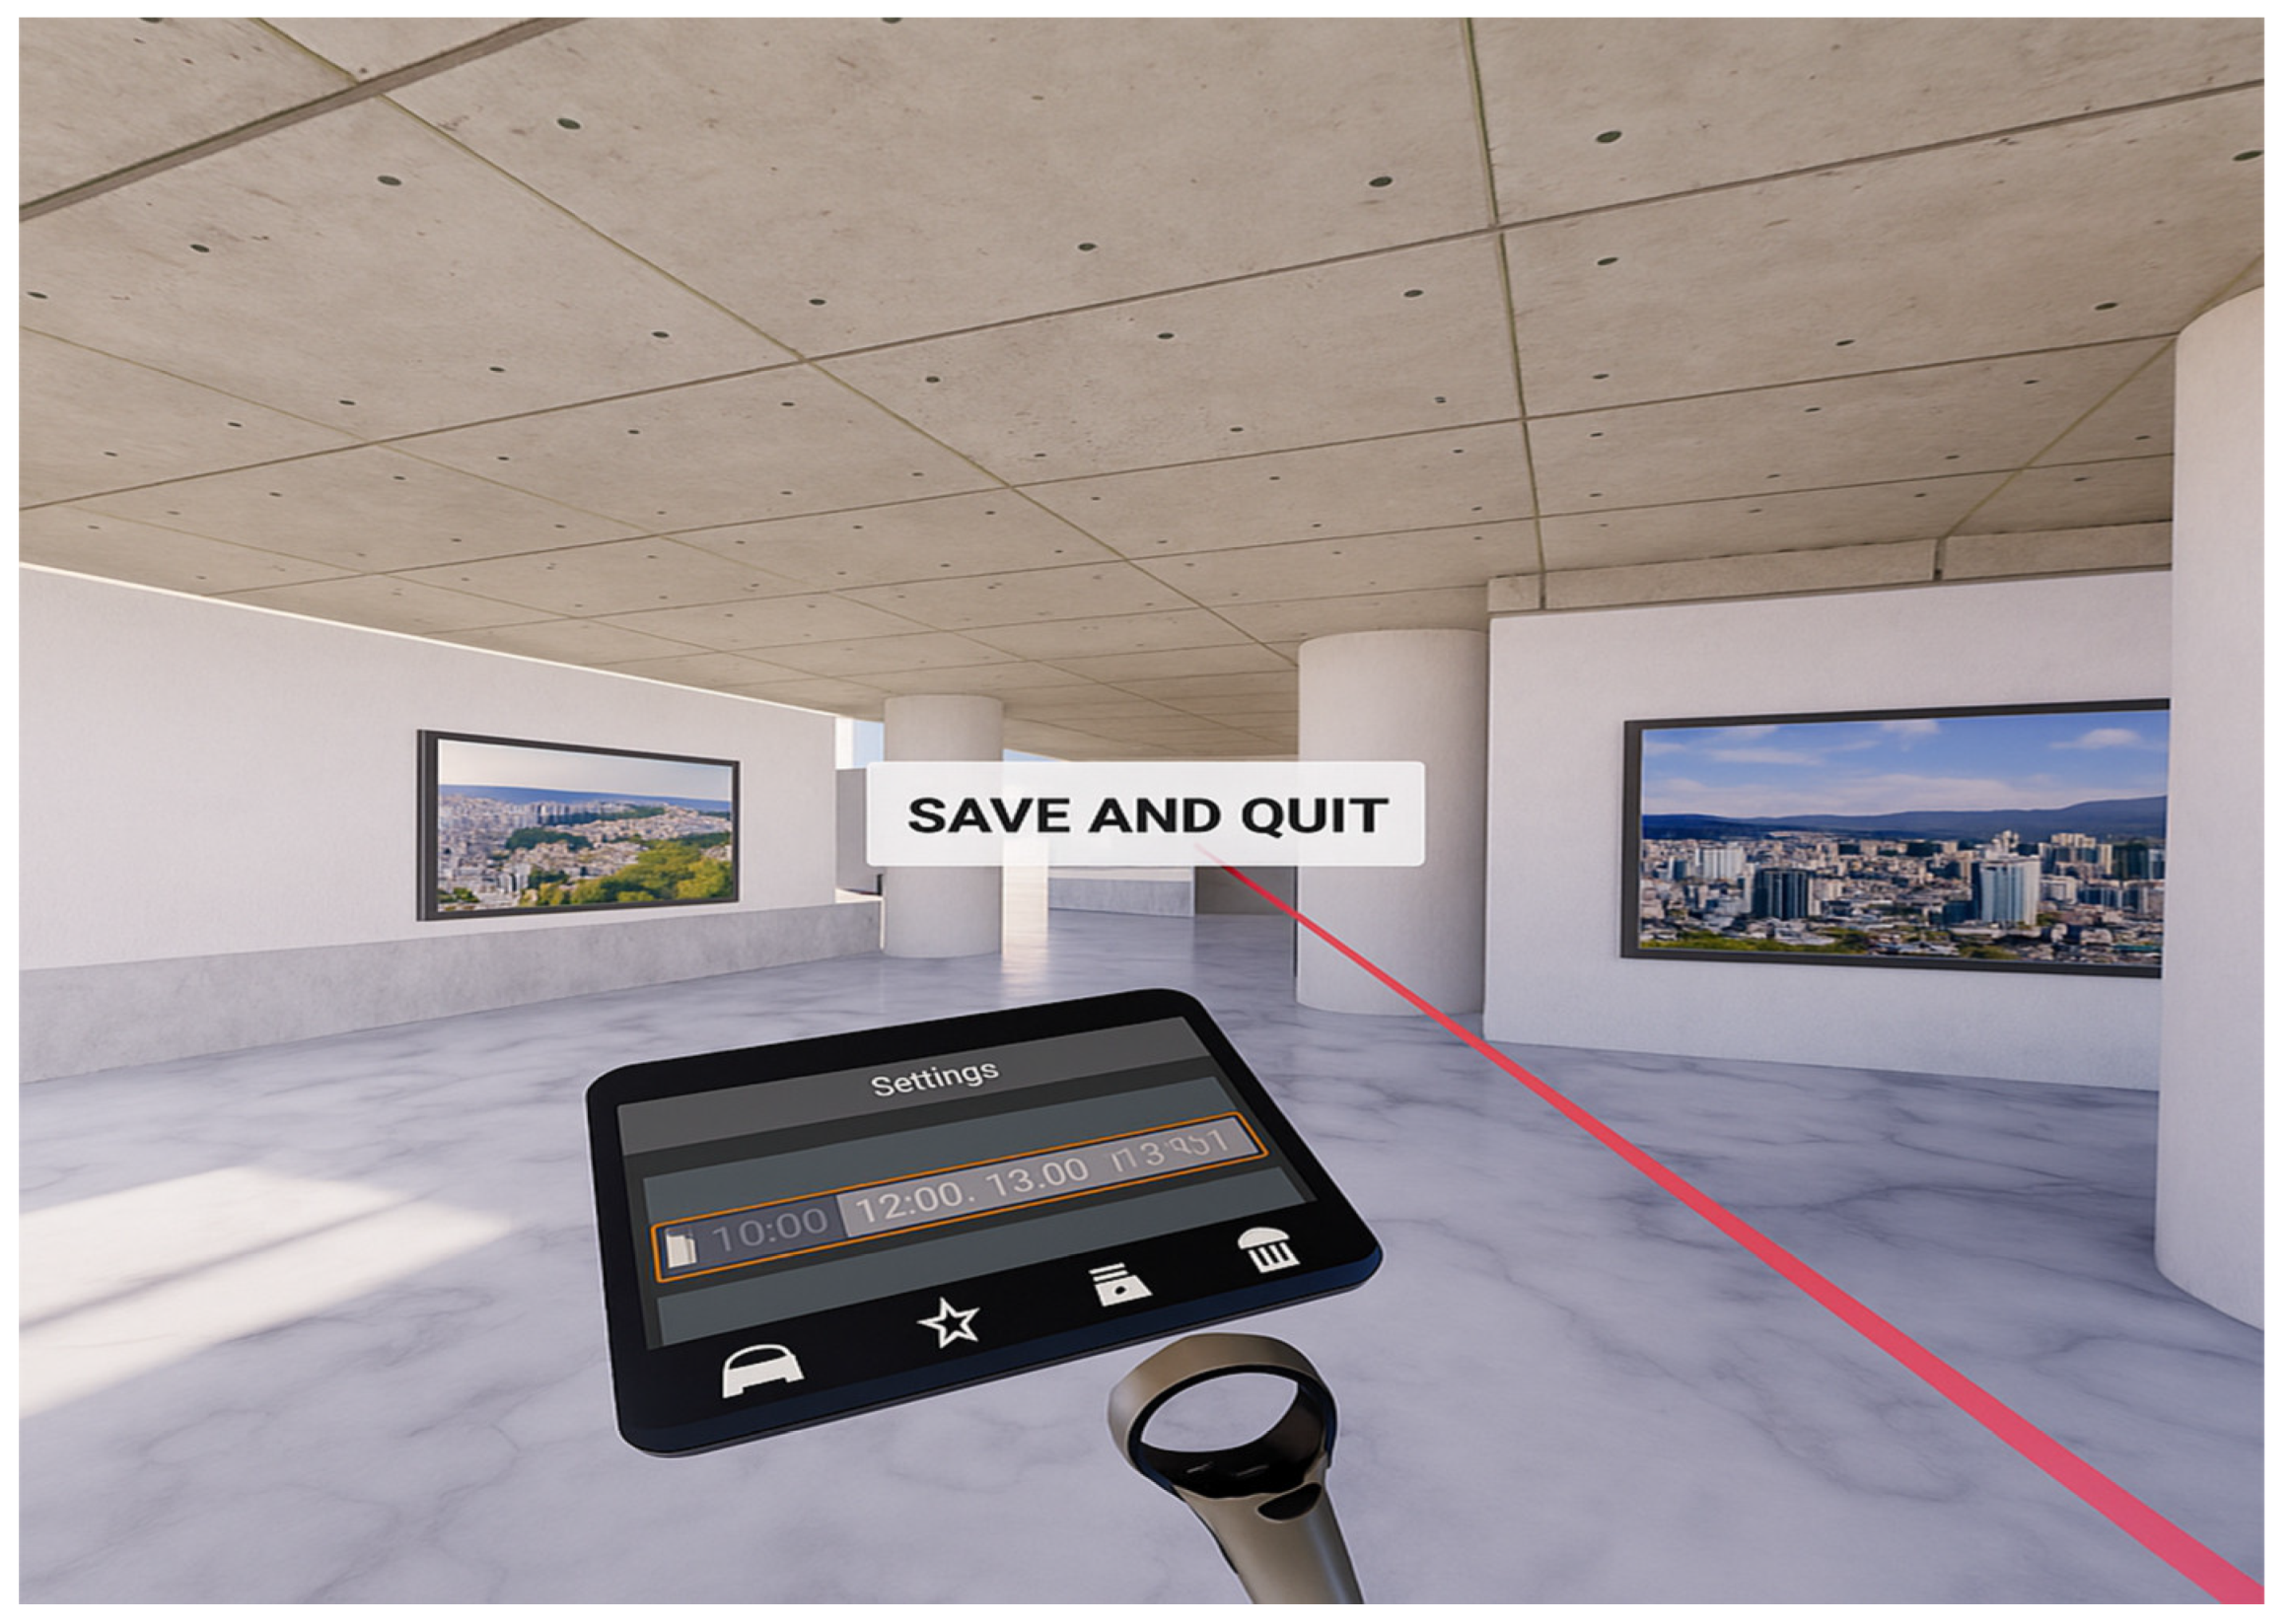
A preliminary simulation was conducted so that participants could experience the environment (see
Figure 4). The purpose was to help them become familiar with it beforehand, and familiarize themselves with the experimental method, enabling them to learn how to skillfully operate the controller and to check for any discomfort, including motion sickness.
The experiment for each visual environmental factor was divided into two parts. In the first part, participants were asked to select a passage according to their own perceptions and fill out an evaluation table for the selected passage.
Next, participants were asked to explore a path they did not choose and fill out an evaluation chart for it, too.
4.6. Cultural Background and Prior Experience
Although participants were divided by nationality (Chinese vs. Korean), cultural difference in this study is further supported by national design standards and participants’ prior experience with underground infrastructure. Chinese underground spaces emphasize functionality and efficiency, with narrower passages and brighter lighting (GB50157-2013; GB/T 16275-2008), while Korean underground spaces emphasize spatial comfort and emotion-based lighting (KSA 3071).
Moreover, the Chinese participants in this study mostly came from large cities such as Shanghai or Beijing and were more familiar with extensive commercial underground networks. Korean participants from Busan primarily experience underground spaces as part of transport infrastructure with fewer complex layouts. These factors serve as cultural context variables, making the comparison meaningful beyond nationality alone.
5. Results
The experiment was conducted in Lab 116 of the Department of Interior and Environmental Design at Pusan National University. Among the 64 students were 15 Korean males (48%), 16 Chinese males (48%), 16 Korean females (52%), and 17 Chinese females (52%). From conducting reliability tests for the items, Cronbach’s α was over 0.8, satisfying the threshold level for reliability.
5.1. Participants
Before presenting the experimental results, we first summarize the general demographic characteristics of the participants, as shown in
Table 3.
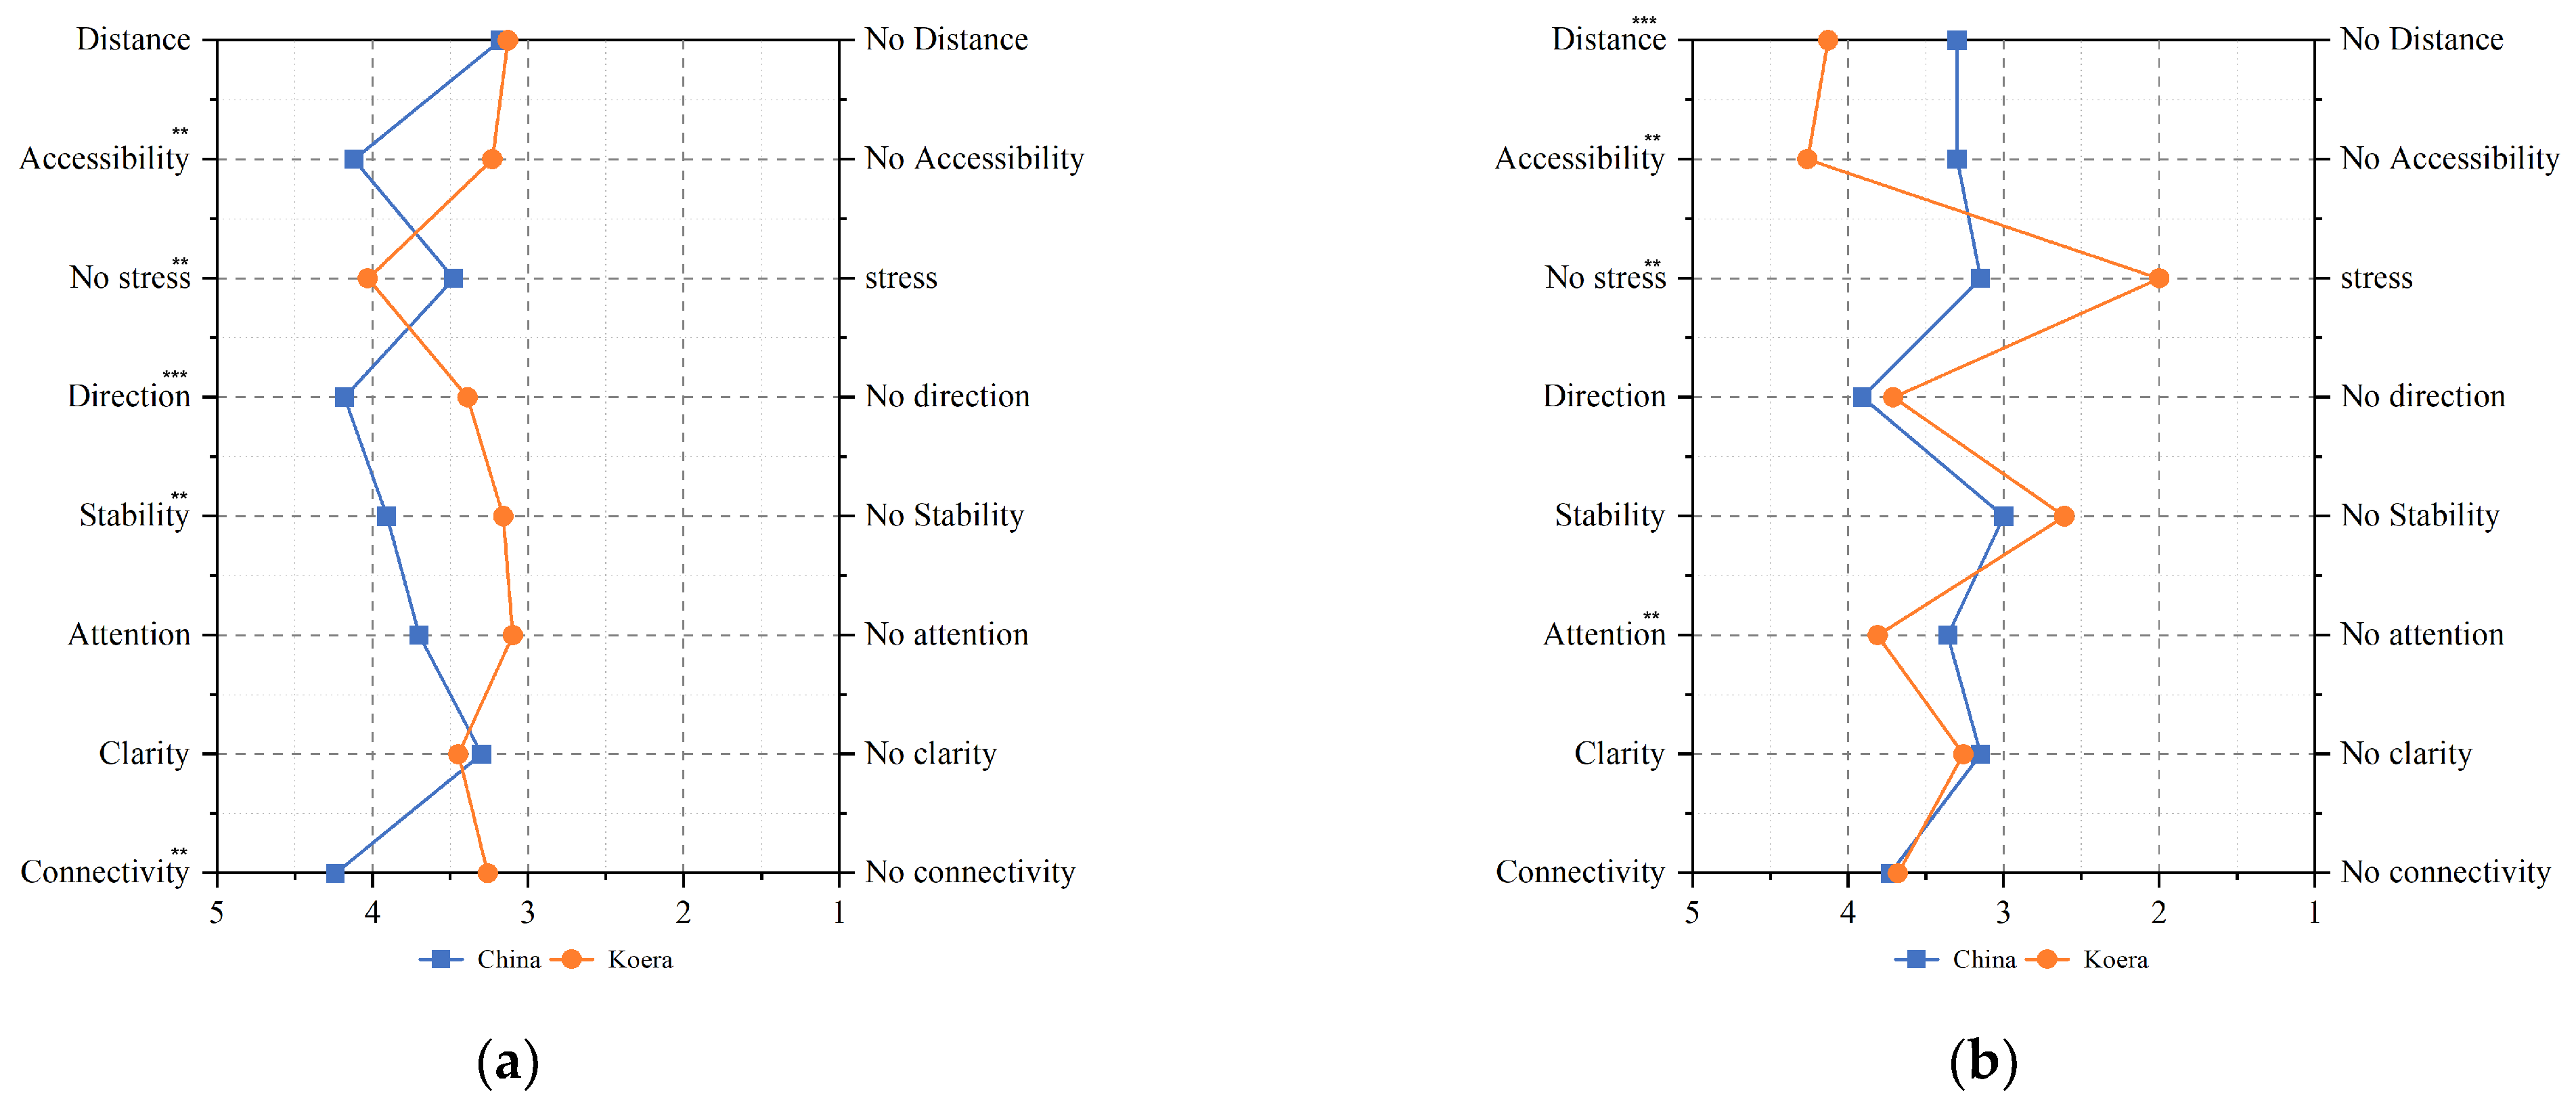
5.2. Responses to the Width of the Passageway
In the virtual underground space, the Chinese and Korean groups (C and K, respectively) were shown passageways of different widths (X2 = 4.04, p = 0.04). In Group C, 39% chose the wide passageway and 61% chose the narrow passageway, while in Group K, 65% chose the wide passageway and 35% chose the narrow passageway.
To further illustrate the cultural preferences regarding passageway width,
Table 4 presents the detailed selection frequencies by group.
The
t-test analysis showed differences between the groups regarding accessibility, stress, sense of direction, safety, and connectivity. Among them, there was a significant difference in choices based on sense of direction. Preferences for wide routes were all less than average, but there was a large difference between Korean and Chinese preferences for wide routes. Group C showed a stronger preference for accessibility, less stress, a more confident sense of direction, greater stability, a longer attention span, and stronger connectivity than Group K (
Figure 5a)
With narrow passageways,
t-test analysis showed differences in distance, accessibility, stress, and attention. There was a large difference in distance. Group K showed more sensitivity to distance, a stronger preference for accessibility, less stress, and paid closer attention to narrow routes than Group C (
Figure 5b).
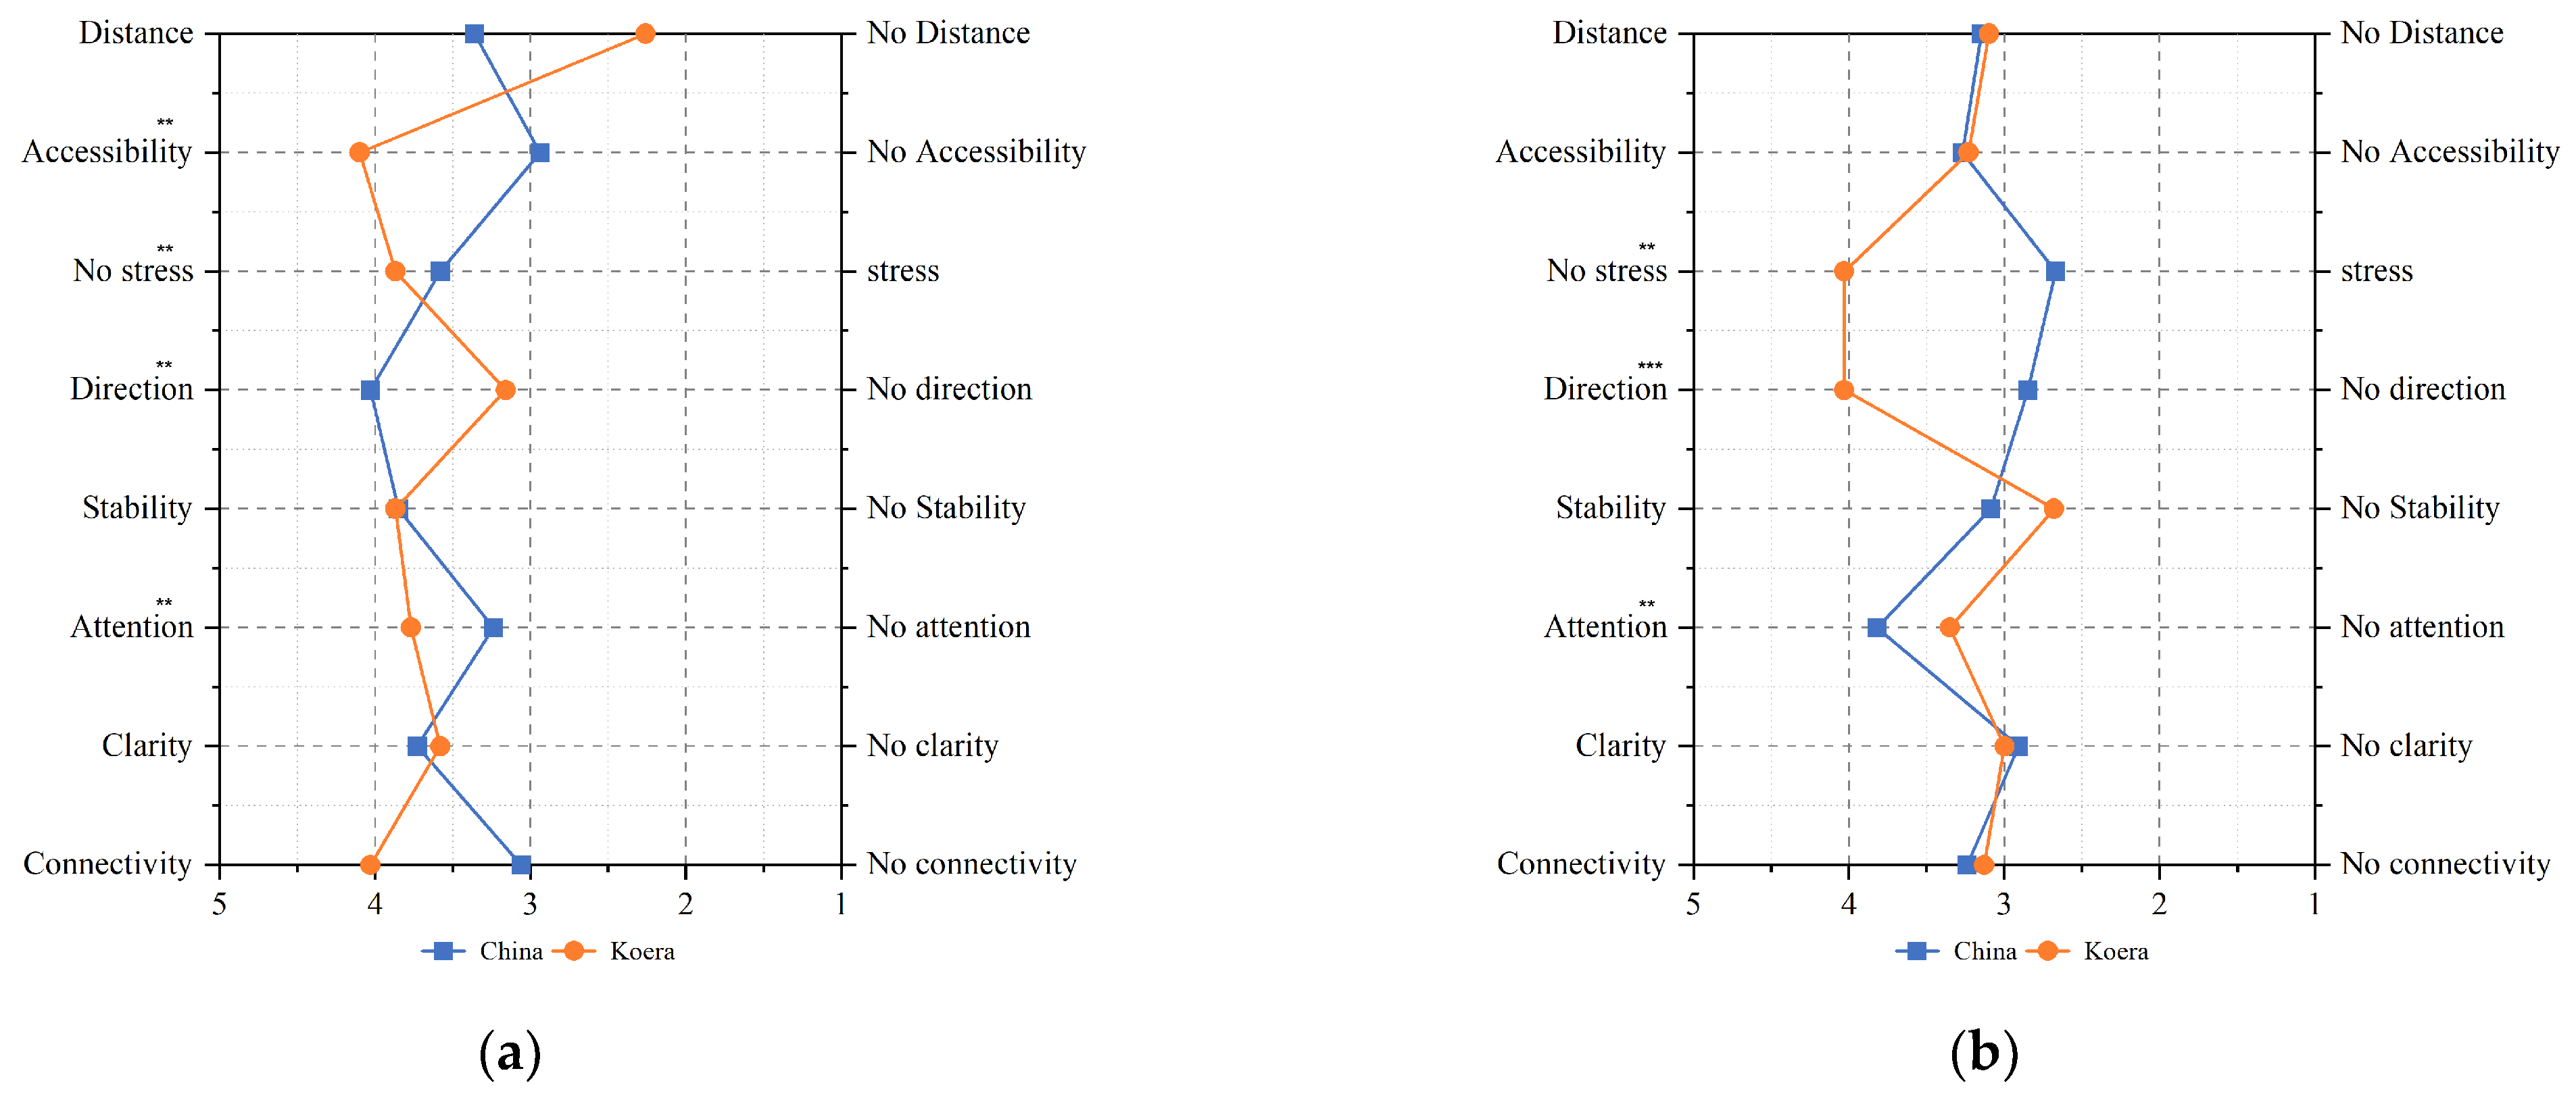
5.3. Responses to Brightness
In the simulated underground space, the Chinese and Korean groups showed differences in reactions to brightness in the passageways (X2 = 4.04, p = 0.04). In Group C, 61% chose the bright passage and 39% chose the dark passage, while in Group K, 35% chose the bright passage and 65% chose the dark passage.
To further examine the influence of lighting conditions on wayfinding preferences across cultures,
Table 5 presents the selection frequencies of bright versus dark passageways for Chinese and Korean participants.
With bright passage choices,
t-test analysis showed differences between groups in terms of accessibility, stress, sense of direction, attention, and connectivity. On average, Group C’s preference for a bright passage was stronger than Group K’s in terms of distance and direction (
Figure 6a).
In choosing a dark passage,
t-test analysis showed differences between the groups in terms of stress, sense of direction, attention, and connectivity. Group K was above average compared to Group C in terms of attention in their preference for the dark passage (
Figure 6b).
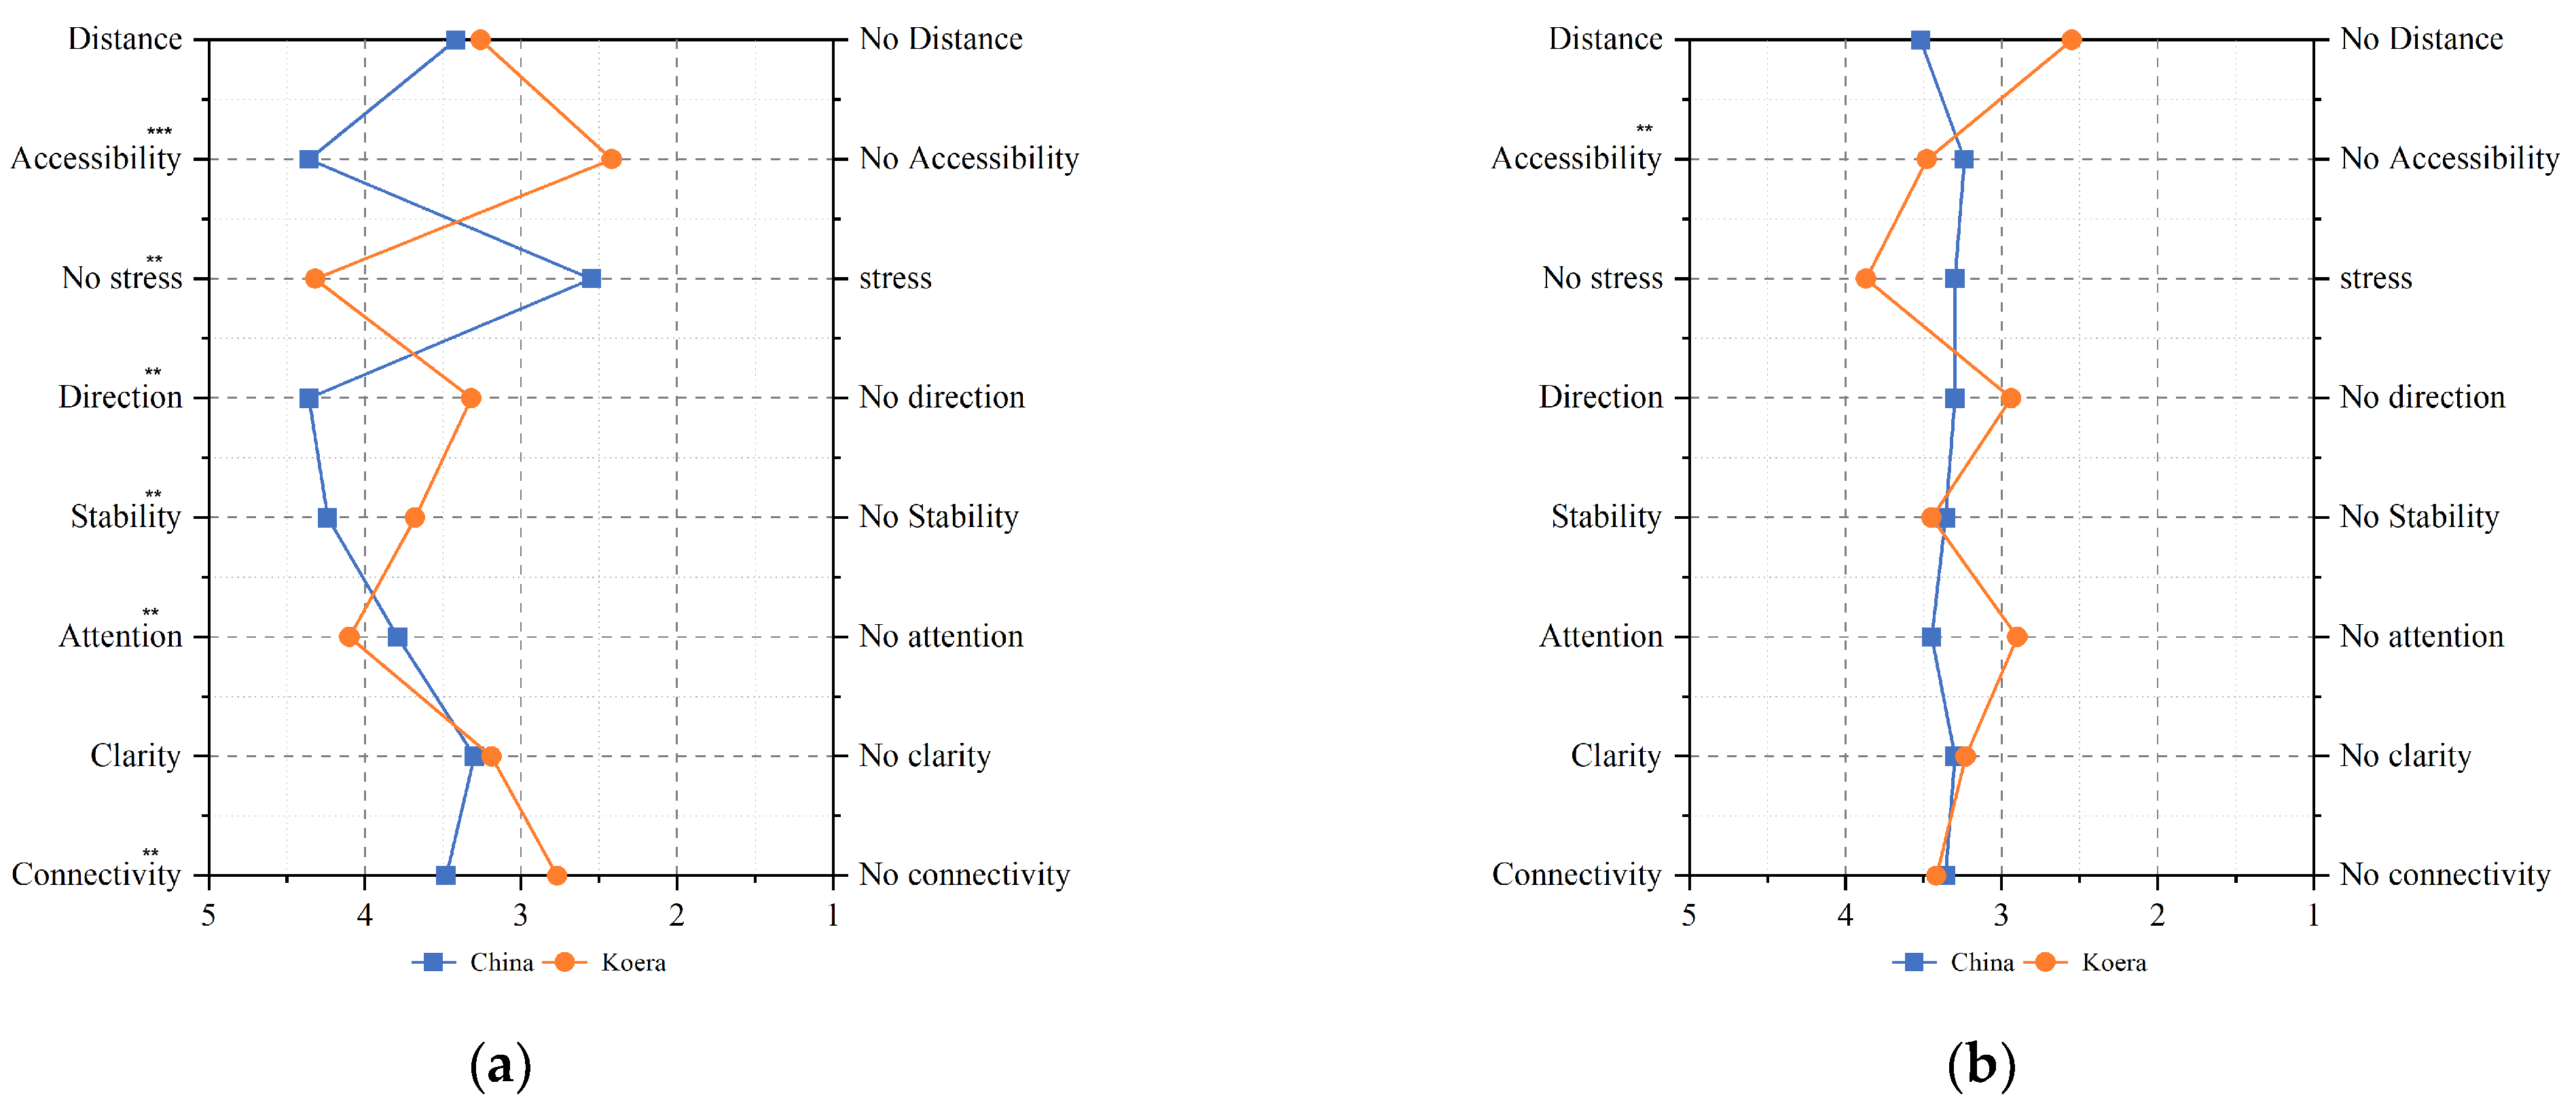
5.4. Differences in Choices Depending on the Color of the Space
In the underground space simulation, the Chinese and Korean groups showed preferential differences based on the color of the passageways (X2 = 7.58, p = 0.006). In Group C, 76% chose the cool-colored passageway and 24% chose the warm-colored passageway, while in Group K, 42% chose the cool-colored passageway and 58% chose the warm-colored passageway.
To compare the preferences for environmental color temperature in underground spaces, participants’ responses to cool- and warm-colored passageways were analyzed.
Table 6 summarizes the frequency of selections for each color option across the two cultural groups.
In preferences for the cool-colored passageway,
t-test analysis showed differences between the groups in terms of stress, sense of direction, identification, and connectivity. The differences were greater in terms of sense of direction and identification. On average, preference for the cool-colored passageway was above average in Group C compared to Group K in terms of distance and attention (
Figure 7a).
In preferences for the warm-colored passageway,
t-test analysis showed differences in terms of distance, stress, identification, and connectivity. On average, preferences for the warm-colored passage showed that Group K was above average compared to Group C in terms of distance and accessibility (
Figure 7b).
5.5. Choices Based on Obstacles Being in the Passage or Not
The Chinese and Korean groups showed differences in choices based on the presence or absence of an obstacle in the passageway (X2 = 6.42, p = 0.01). In Group C, 21% chose the passage with an obstacle, and 79% chose the passage without an obstacle. In Group K, 48% chose the passage with an obstacle, and 52% chose the passage without an obstacle.
To further illustrate the cultural preferences regarding the presence or absence of obstacles,
Table 7 presents the detailed selection frequencies by group. The results show that 79% of Chinese participants preferred passages without obstacles, while 48% of Korean participants selected passages with obstacles, indicating a notable divergence in spatial perception between the two groups.
In choosing the passage with an obstacle,
t-test analysis showed differences in accessibility, stress, sense of direction, safety, and connectivity. The difference in accessibility appeared to be greater. Group K was above average compared to Group C in terms of attention to the passageway with an obstacle. In Group K, stress appeared to be lower in the passageway with an obstacle (
Figure 8a).
In preferring the passage without an obstacle,
t-test analysis showed differences in stress between the groups. Group C was above average compared to Group K in terms of distance, sense of direction, and attention to the passageway without an obstacle (
Figure 8b).
5.6. Selections Depending on Sign Systems
The Chinese and Korean groups’ choices showed differences based on the presence or absence of hanging signs in the passageway (X2 = 0.54, p = 0.46). In Group C, 42% chose the passageway with a hanging sign, and 58% chose the passageway without a hanging sign. In Group K, 52% chose the passageway with a hanging sign, and 48% chose the passageway without a hanging sign.
In order to explore group-level differences regarding the impact of hanging signage,
Table 8 presents the distribution of choices made by Chinese and Korean participants.
For the passageway with a hanging sign,
t-test analysis showed differences between the Chinese and Korean groups in terms of attention, simplicity, and connectivity. Group K showed an above-average preference compared to Group C in terms of distance and accessibility (
Figure 9).
To provide deeper insight into participants’ preferences concerning the presence or absence of floor signage,
Table 9 presents the selection frequencies by group.
In the passageway with a floor sign,
t-test analysis showed different preferences in terms of accessibility, clarity, and simplicity, but the differences in terms of clarity and simplicity were greater (
Figure 10).
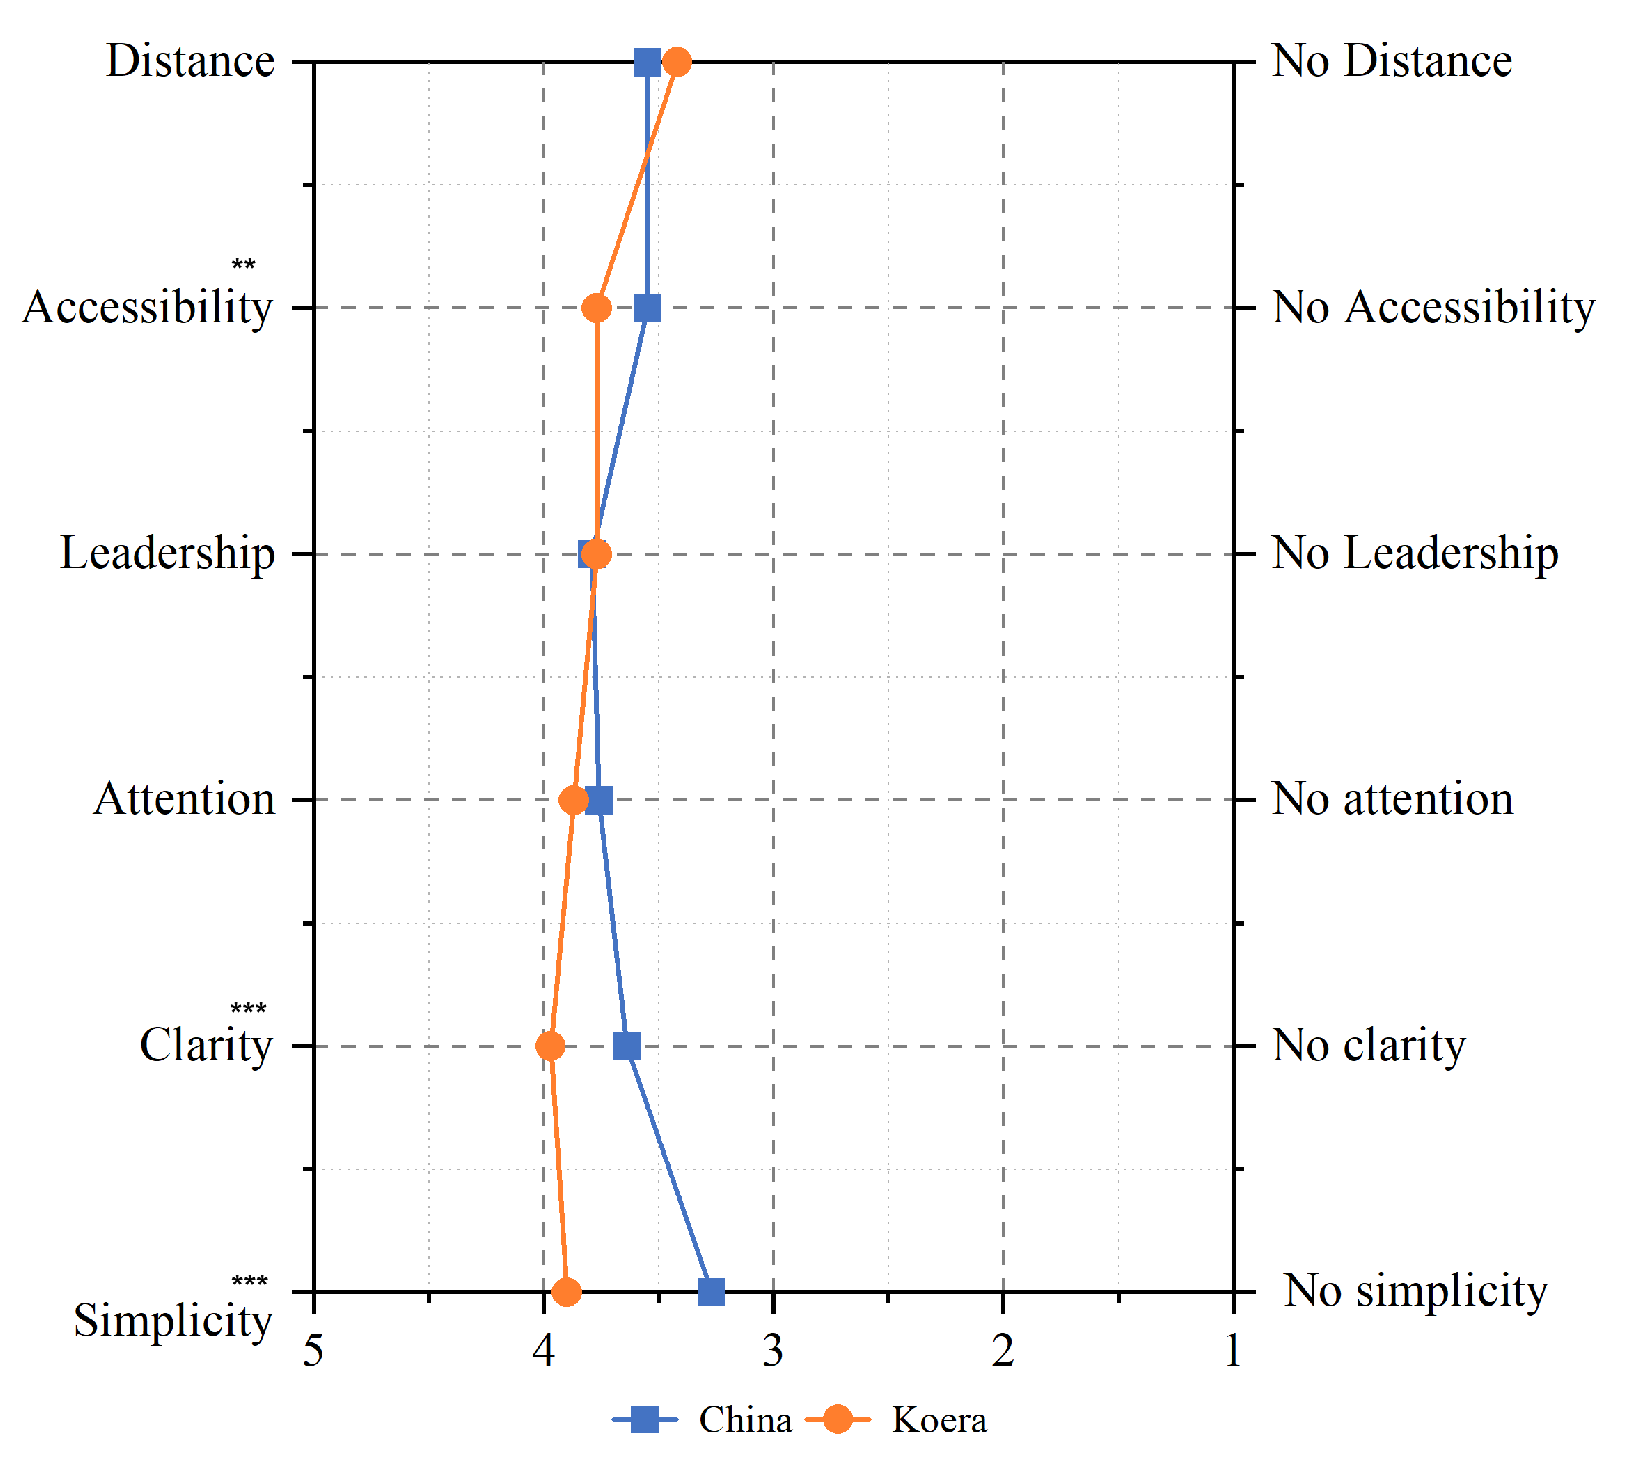
The Chinese and Korean groups showed preferential differences based on the presence or absence of hanging and floor signs in the passageways (X2 = 1.84, p = 0.18). In Group C, 55% chose passageways with hanging and floor signs, and 45% chose passageways without either type of sign. In Group K, 71% chose the passageway with hanging and floor signs, with 29% choosing the passageway without those signs.
To provide a more nuanced comparison of preferences for combined signage systems
Table 10 presents the selection frequencies by group. This helps further clarify cultural tendencies in sign system preferences between Korean and Chinese participants.
In choosing the passageway with both hanging and floor signs,
t-test analysis results showed differences in terms of accessibility, leadership, and attention, but a larger difference based on accessibility. The other average values for both groups were almost the same, but both groups showed a greater preference for the passageway with hanging and floor signs (
Figure 11).
6. Discussion
This study aimed to identify how visual environmental variables affect wayfinding in underground public spaces and to reveal cultural differences between Korean and Chinese users. Through a virtual reality-based experiment, we found statistically significant and culturally meaningful differences across five core visual factors: passage width, brightness, color temperature, obstacle presence, and signage type.
First, regarding passage width, Chinese participants preferred narrower routes, which they associated with improved directionality and reduced stress. Korean participants, on the other hand, favored wider passages, citing enhanced accessibility and stability. These findings suggest that while Chinese users may prioritize efficiency in constrained spatial layouts, Korean users tend to value spatial openness and comfort.
Second, in terms of brightness, Chinese participants showed a strong preference for brighter environments, which they linked to clarity, direction, and reduced anxiety. In contrast, Koreans preferred darker spaces, likely due to a heightened sense of attention and perceptual engagement in dimmer environments. This difference reflects divergent lighting standards in Korea and China and may be shaped by local transportation design aesthetics.
Third, color temperature was a strong cultural divider. Chinese users preferred cool colors—perceived as modern and calming—while Koreans favored warm colors that convey warmth and emotional resonance. These preferences mirror national trends in subway station interior design, as supported by regulatory and design guideline differences.
Fourth, regarding obstacles, Korean participants were more tolerant of their presence, even perceiving them as reducing stress and aiding in spatial orientation. In contrast, Chinese users overwhelmingly preferred obstacle-free paths, reinforcing a preference for unobstructed and predictable navigation.
Fifth, both groups preferred floor signage and the combination of floor + hanging signs, though Korean participants showed a significantly stronger preference for floor signs alone. This suggests that simplicity and ground-level cues are particularly valued in the Korean context, possibly due to differences in eye-level attention patterns or information processing.
These differences are not only statistically significant but also behaviorally and psychologically meaningful. The Chinese preference for cooler, brighter, and narrower passages may reflect cultural associations with clarity, order, and efficiency, as seen in their infrastructure design practices. Conversely, Korean preferences for warmer, dimmer, and wider passages may be rooted in values of emotional comfort, intuitive accessibility, and spatial openness.
To address these culturally nuanced behaviors, we argue that a unified, one-size-fits-all approach to underground space design may compromise usability and emotional comfort for multicultural users. Instead, we propose culturally adaptive spatial strategies, such as:
Using zone-based lighting with varying brightness and color temperatures based on function and local user preferences;
Integrating layered signage systems that combine both floor-level and hanging elements to accommodate different cultural habits in visual scanning;
Employing optional or context-specific obstacle cues that enhance orientation for some users while maintaining path clarity for others.
These findings reinforce that spatial cognition and emotional responses to environmental cues are shaped by cultural background. Such differences should not only inform practical design but also guide policy and planning for inclusive urban spaces.
Theoretically, this study contributes to the growing body of research in embodied cognition and cultural schema theory in environmental psychology, demonstrating that even subtle design elements can elicit varied interpretations and preferences across cultures.
One of the limitations of this study is the sample composition. Because the participants were limited to college students aged 20–29, who are generally more comfortable with virtual environments and technology, the findings may not fully represent other age groups. In particular, middle-aged individuals and older adults might experience discomfort in VR environments, leading to their exclusion from participation.
Therefore, while the observed cultural differences are statistically significant and contextually meaningful within this demographic, the generalizability of our cultural claims to broader populations—including other age groups, education levels, and cultural subgroups—remains limited. We explicitly acknowledge this as a key limitation of the study.
In addition, our focus on Chinese and Korean students limits generalizability to other cultural or national contexts. Future studies should expand participant diversity across age, occupation, and cultural background, and explore non-Asian samples for broader comparative validation. Methodologically, more immersive or mixed-reality testing may also improve ecological validity.
In conclusion, our study empirically confirms that visual design factors impact wayfinding behavior differently across cultural groups. The findings serve as practical guidelines for inclusive underground public space planning and emphasize the need to consider cultural variability in environmental design decisions.
7. Conclusions
This study aimed to examine how visual environmental factors—passage width, brightness, color temperature, obstacles, and signage—affect wayfinding behavior in underground public spaces, with a focus on cultural differences between Korean and Chinese university students. A VR-based simulation, grounded in the spatial design standards of both countries, enabled the identification of key perceptual and navigational differences.
The findings revealed that Chinese participants preferred narrower, brighter, and cool-colored environments, associating them with improved direction sense and reduced stress. Korean participants, in contrast, favored wider, darker, and warm-colored spaces, emphasizing emotional stability and accessibility. Notably, both groups strongly preferred environments with combined signage systems (floor and hanging signs), though Koreans were more tolerant of spatial obstacles. Among the five variables, color preference and response to obstacles showed the most significant cultural divergence.
These insights inform inclusive design principles for underground public spaces, especially in multicultural or transnational settings. Nonetheless, limitations remain, particularly the homogeneity of the sample—young university students familiar with VR technology. Future studies should diversify participant demographics and validate VR findings in real-world spatial environments.
Based on the findings of this study, the following recommendations are proposed for the future design and planning of underground public spaces.
Culturally Adaptive Design: Urban planners should fully consider spatial preferences rooted in different cultural backgrounds. Flexible configurations of spatial layout, lighting, and materiality should be adopted to enhance the inclusivity and comfort of underground spaces for diverse user groups.
Integrated Signage Systems: It is recommended to implement both floor-level and hanging signage within underground environments. A multi-layered signage strategy can significantly improve spatial legibility and navigation efficiency across culturally diverse populations.
Context-Sensitive Lighting and Color Strategies: Cool-colored and well-lit environments should be used in areas requiring directional clarity, while warm-colored and dimly lit environments are more appropriate for rest zones or transitional spaces. These design choices should align with the emotional and cognitive responses of users from different cultures.
Minimization of Unnecessary Obstacles: Visual and physical obstructions should be minimized, especially in public spaces serving multicultural populations, to ensure smooth circulation and reduce psychological discomfort during navigation.
Expansion of Participant Diversity: Future research should include broader demographic groups, particularly older adults and non-design majors, to improve the generalizability and practical applicability of the findings.
Application of VR in Early Design Testing: It is recommended to incorporate VR-based simulation testing in the early stages of spatial planning. This approach can help identify user behavior patterns and discomforts, allowing for iterative refinement of design solutions prior to implementation.


