1. Introduction
In buildings exposed to the natural environment over extended periods, external materials gradually erode the structure, weakening material properties. Consequently, a building’s structural safety, functionality, and durability may no longer meet the unified standards of structural reliability design. To address varying degrees of ageing [
1] or weakened structural performance, targeted reinforcement is required to restore structural capacity, stiffness, and durability.
Currently, the common reinforcement methods mainly include the increase section reinforcement method [
2,
3], the external steel reinforcing method [
4,
5], the adhesive steel reinforcement method [
6], the prestressed reinforcement method [
7,
8,
9], and the paste fibre-reinforced composite reinforcement method [
10,
11,
12]. However, the current reinforcement methods used in China have various shortcomings, including complex construction processes, significant on-site wet work, high costs, and uncontrollable bond strength. Therefore, this paper proposes a new reinforcement method: spray GFEM technology on the external surfaces of buildings or component nodes. Glass fibre [
13] has high tensile strength, high modulus, and good plasticity and toughness, which can give full play to the role of crack-blocking and toughening so that the number of micro-cracks in the early stage of hydration of the GFEM-reinforced layer is significantly reduced, effectively inhibiting the cracks and expansion, and reducing the possibility of internal micro-porosity expansion and penetration, whereas epoxy mortar [
14,
15,
16] is a widely used repair material in civil engineering. Epoxy mortar is composed of epoxy resin, diluent, curing agent, coupling agent, and other organic components, along with cement, sand, and other inorganic components in specific proportions. This combination yields new building structural materials with high compressive strength and durability. Applying this mixture using an air compressor for spraying offers easy construction, excellent durability, and broad applicability, making it an effective structural reinforcement method.
Regarding the current status of research on the freeze durability of concrete, Cao, D.F [
17] and others found that the degree of decrease in concrete quality and dynamic elastic modulus gradually increased with the increase in the number of freezing and thawing cycles, while the higher the strength grade, the slower the decrease. Li, W.S [
18] found that after 50 cycles of freezing and thawing, the rate of loss of quality and strength of ordinary concrete decreased below the specification requirements and the concrete failed.
Yu, X.M. [
19] pointed out through experimental research that the essence of freeze–thaw damage is the process of concrete under the freeze–thaw environment. The internal damage gradually accumulates and expands, leading to the volume expansion of concrete, the structure becomes crispy and then causes cracking and damage to the concrete.
Shang, H.S’s [
20] study is based on the fatigue cumulative damage theory and the freeze–thaw damage characteristics of concrete reliability analysis.
Powers, T.C. [
21] pointed out that the main reason for the freeze–thaw damage of concrete structures is the pore water infiltration pressure.
Li, J.Y. [
22] proposed that freeze–thaw damage is a phenomenon in which already hardened concrete is saturated with immersion water or is in a wet state and is subjected to a freeze–thaw environment, which results in the gradual denudation and destruction of the concrete from the outside and the inside.
Li, J.Z. [
23] investigated the deterioration characteristics of concrete properties during the freeze–thaw cycle and discussed the changes in concrete flexural strength and split tensile strength under a freeze–thaw environment.
Tang, G.P. [
24] established the material damage evolution equation by applying the damage mechanics method according to the mechanism of concrete freeze–thaw cycle damage, and established the evolution model of concrete freeze–thaw damage surface in the principal stress space by applying the concept of “effective stress”.
The current status of research on the frost durability of reinforced concrete is as follows:
Moceikis, R. et al. [
25] found that glass fibre concrete showed good frost resistance after 112 freeze–thaw cycles in de-icing salt solution.
Meng, S.Y. et al. [
26] investigated the effect of different types of fibre concrete on resistance to freeze–thaw cycles, and the test results showed that glass fibres can effectively improve the frost resistance of concrete.
Xu, L.N. et al. [
27] found that glass fibre concrete has less strength loss, higher peak strength, and less destructive strain than basalt fibre concrete during freeze–thaw cycle tests.
Shen, R.X. [
28], of the China Academy of Building Materials Science, added synthetic fibres to ordinary concrete as a way to study its mechanism of action on concrete, while the enhancement mechanism of synthetic fibres on concrete was concluded based on the experimental data and results, i.e., improved crack-resisting and toughening properties of concrete.
Cheng, Y.H. et al. [
29] compared the frost resistance of three types of fibre concrete (steel fibre, alkali-resistant glass fibre, and polypropylene fibre) and determined that polypropylene fibre concrete had the best frost resistance through tests such as dynamic modulus of elasticity and mass loss.
Ning, B.K. et al. [
30] investigated the changes in mechanical properties of concrete beams reinforced with carbon fibre cloth under the coupling of prestressing and freeze–thaw cycles.
Liu, L.N. et al. [
31] compared and analysed the effects of freeze–thaw cycles and pre-existing bond defects on the bond performance of carbon fibre-reinforced members, and used a non-destructive Pulse Imaging Tester (PPT) to assess the performance of bonded surfaces.
Wei, C.Y. et al. [
32] considered the effect of freeze–thaw cycling on double-layer glass fibre tube concrete members and carried out a study on the axial compression and seismic performance of combined columns under freeze–thaw cycling.
These national and international studies indicate extensive research on freeze–thaw concrete with many important findings. However, current studies on fibre concrete’s frost resistance typically involve mixing fibres into the concrete to form specimens. There has been no research on applying GFEM to the concrete surface for reinforcement followed by freeze–thaw cycle testing. A GFEM reinforcement layer can effectively prevent the crack expansion inside the concrete specimen, and then ensure the overall frost resistance of the specimen. At present, the research direction of concrete structure reinforcement technology is increasingly diversified, and domestic and foreign research based on the traditional reinforcement methods is constantly developing and innovating, so the study of GFEM reinforcement of concrete structure frost resistance and durability is of practical significance.
In this paper, four groups of 156 concrete specimens were reinforced and subjected to freeze–thaw cycle tests using the sprayed GFEM reinforcement technique. The objective was to determine the impact of different fibre contents on the frost durability of the reinforced specimens. Additionally, a freeze–thaw damage model of GFEM-reinforced concrete was developed based on Weibull’s distribution theory [
33], leading to the establishment of a strength attenuation model for the sprayed GFEM-reinforced concrete members.
3. Results
3.1. Analysis of Apparent Damage Patterns
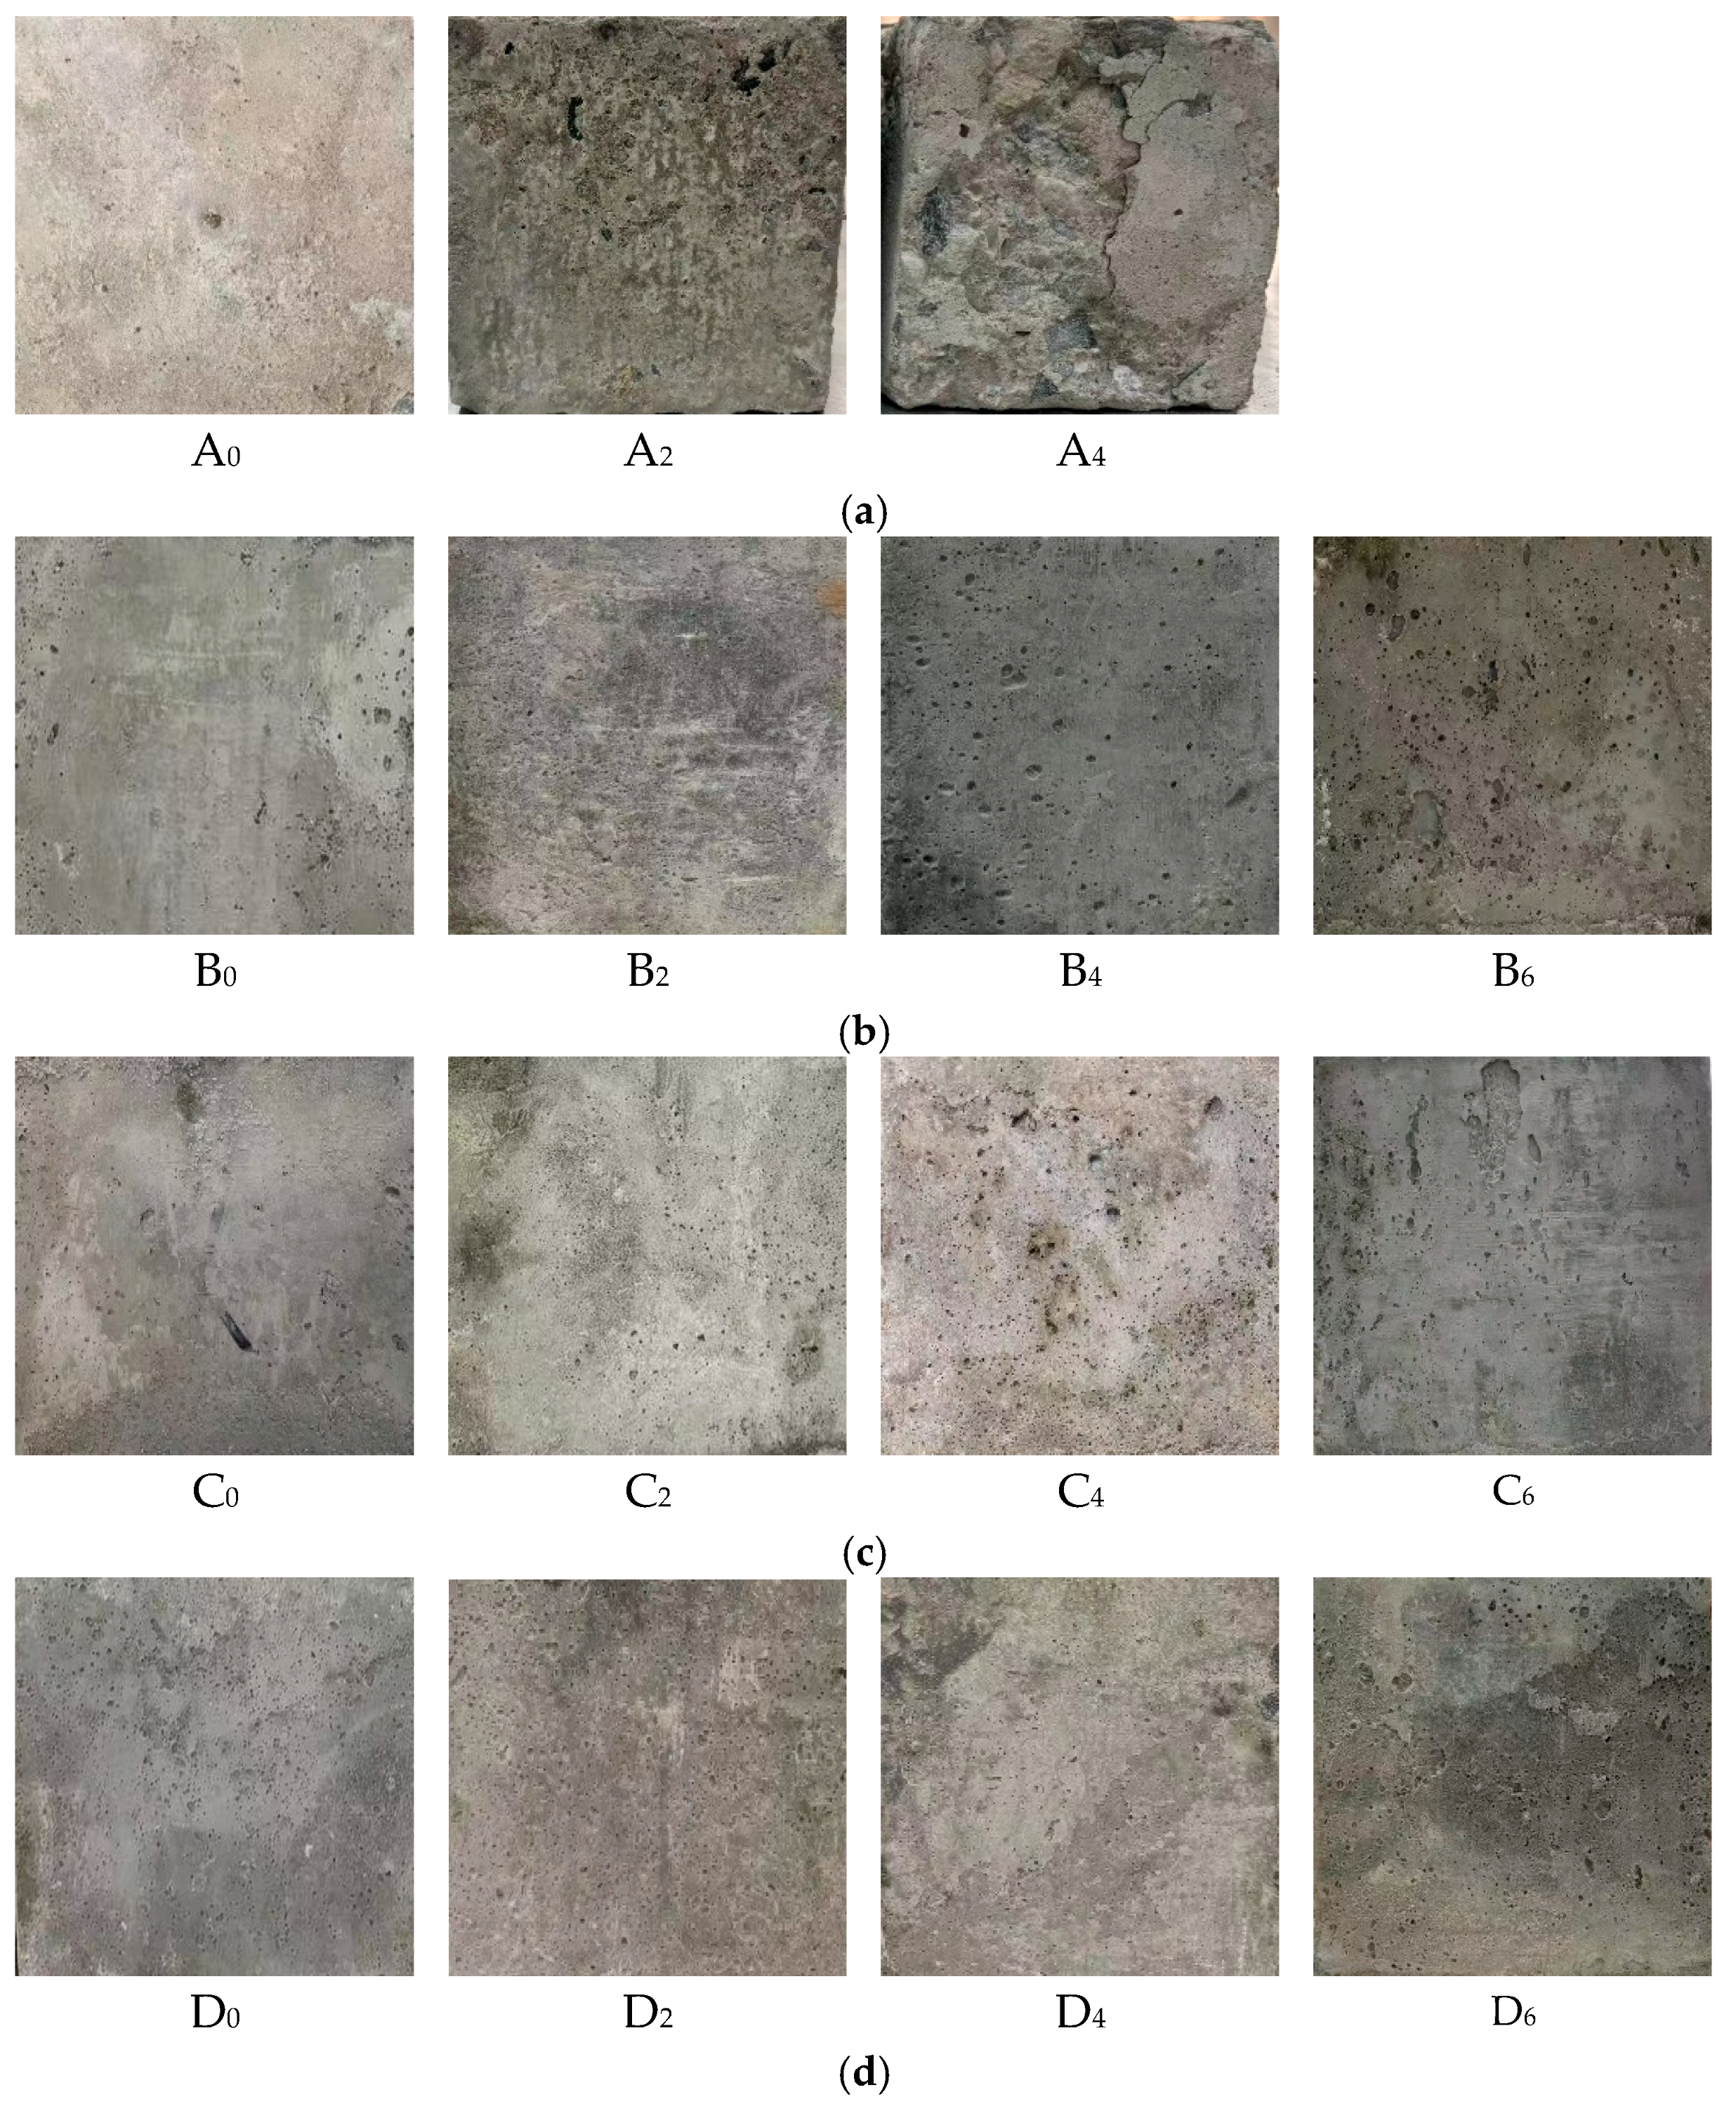
Concrete freeze–thaw damage manifests as freeze cracking and surface spalling. As the number of freeze–thaw cycles increases, the damage worsens from the surface to the interior. Initially, small holes appear on the specimen, accompanied by slight slurry shedding. In the middle stage, significant slurry peeling occurs, the number of holes increases markedly, defects appear at the corners, and fine aggregate is gradually exposed. In the later stage, a substantial amount of fine aggregate is dislodged, exposing coarse aggregate, the surface becomes pitted, and macroscopic cracks develop.
Figure 2 illustrates the apparent morphology of each group of concrete specimens throughout the freeze–thaw cycles.
As shown in
Figure 3, the surface integrity of specimens A
0, B
0, C
0, and D
0 is well preserved after 0 freeze–thaw cycles. After 50 freeze–thaw cycles, surface spalling begins in specimen A
2, while specimens B
2, C
2, and D
2 exhibit increased holes but no concrete spalling. After 100 freeze–thaw cycles, specimen A
4 is significantly damaged, with extensive surface spalling, loss of fine aggregate, numerous exposed coarse aggregates, and severe edge defects. In contrast, specimens B
4, C
4, and D
4 show increased holes and larger hole diameters but no concrete spalling. After 150 freeze–thaw cycles, small areas of surface spalling appear in specimens B
6, C
6, and D
6. The number and diameter of holes continue to increase, but D
6 has the fewest and most minor holes and the smallest spalling area. Generally, with the same number of freeze–thaw cycles, specimens with higher fibre doping within a specific range have fewer and smaller holes and less spalling. The presence of glass fibres allows for a more uniform distribution of the pressure generated within the GFEM material during icing, reducing damage in localized areas. At the same time, the GFEM reinforcement layer effectively protects the matrix concrete from internal damage, thus reducing mass loss.
3.2. Mass Loss Analysis
The mass loss rate can reflect the degree of concrete damage to a certain extent, defined as
W. The mass loss rate calculation formula is shown in Equation (1):
where
M0 (kg) and
Mn (kg) are the mass of the concrete specimens without the freeze–thaw cycle and after the
nth freeze–thaw cycle, respectively.
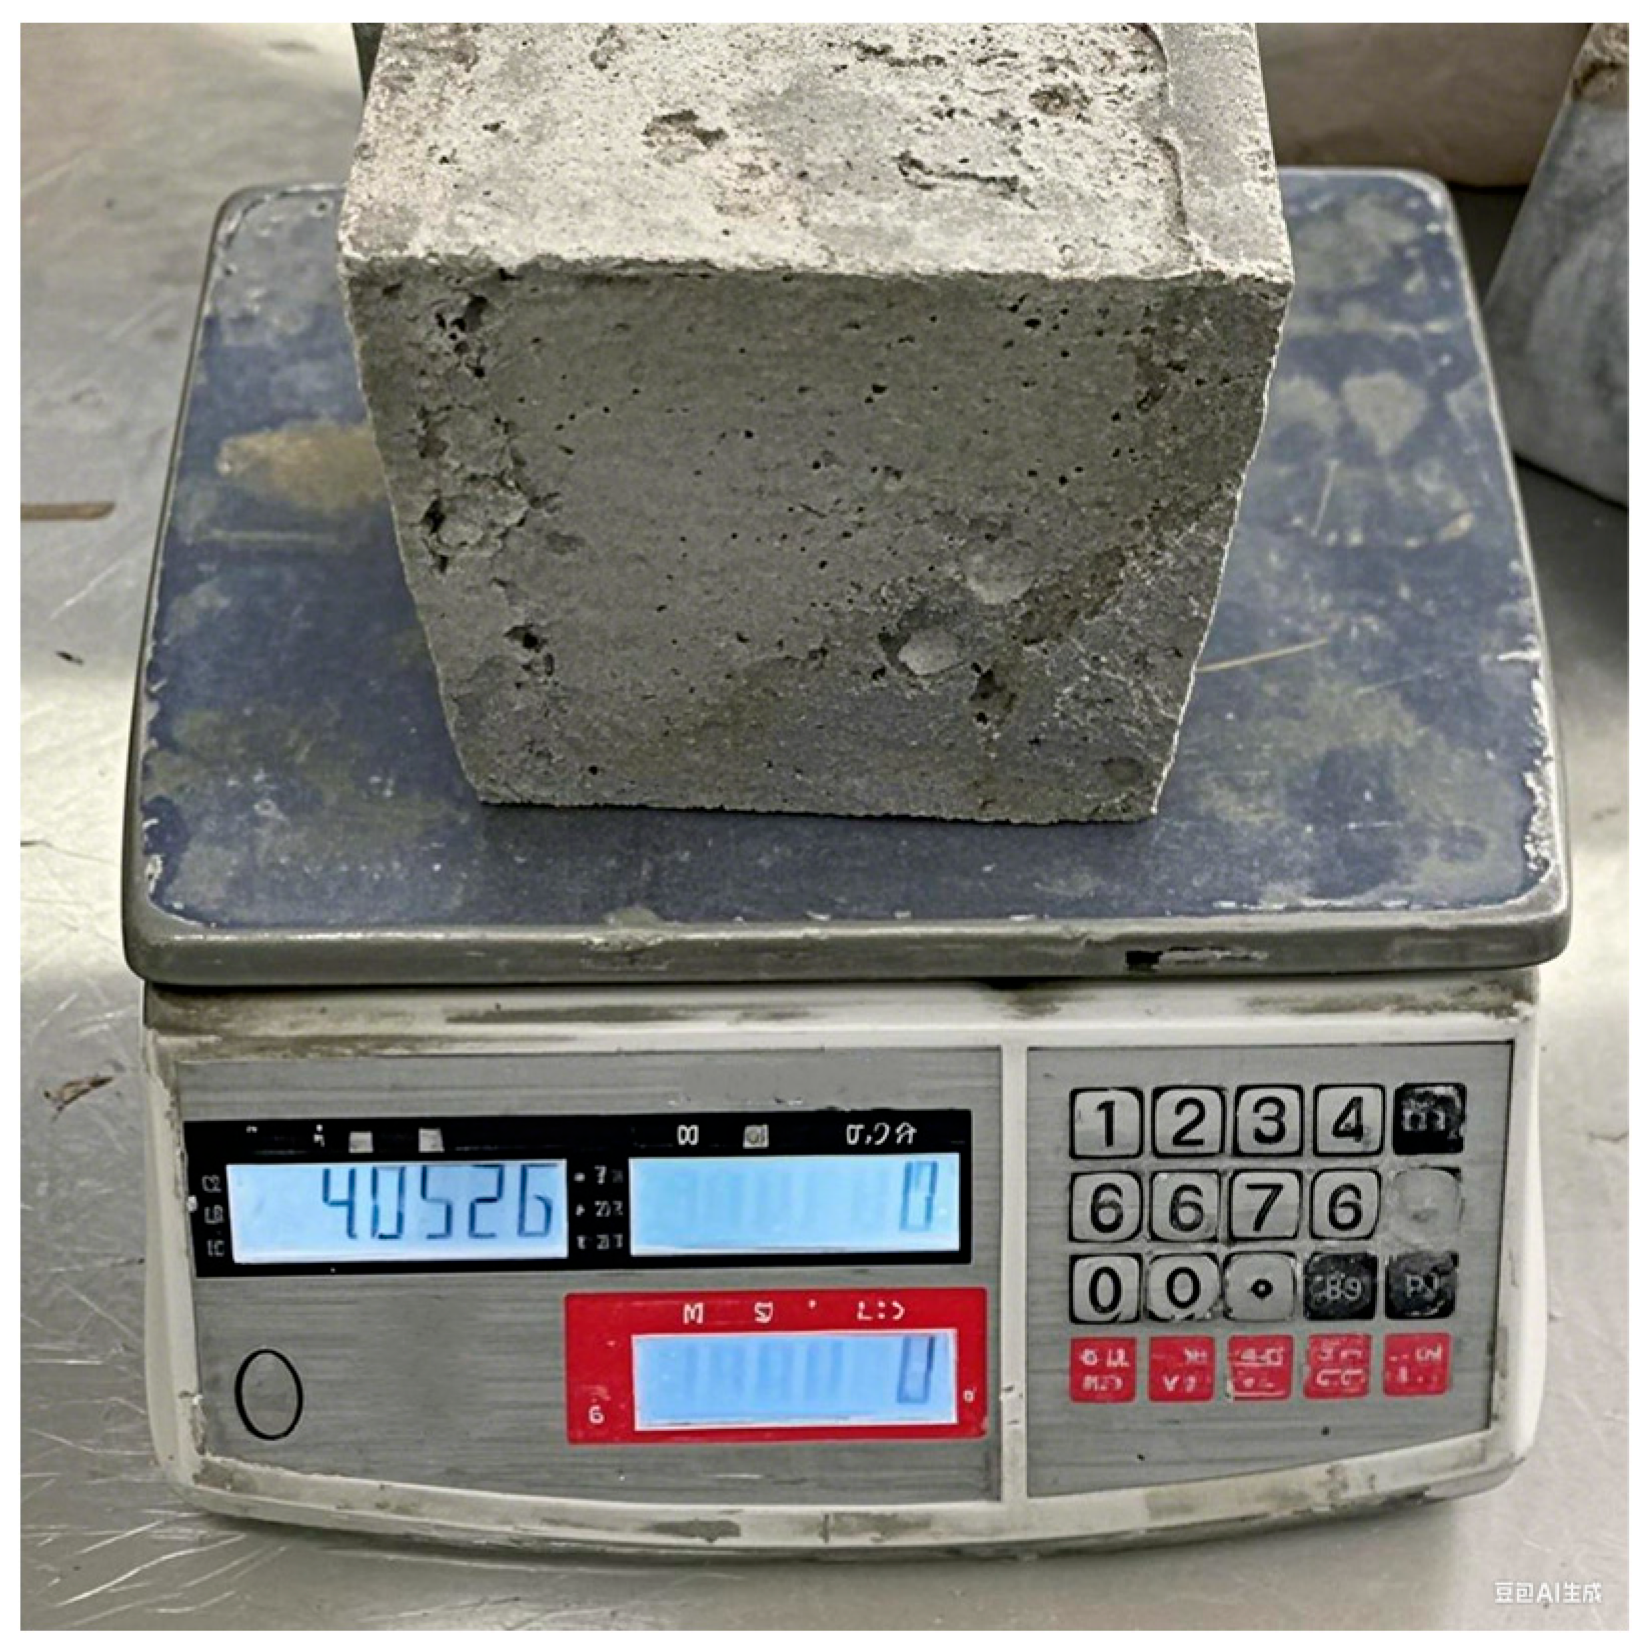
The specimen is placed in a blast dryer for 24 h prior to the freeze–thaw cycle and weighed at its mass
M0 after drying, and after the freeze–thaw cycle, the specimen is placed in a blast dryer for 24 h and weighed at its post-freeze mass
Mn (n is the number of freezes and thaws). Based on the freeze–thaw cycle test data, the mass of each group of concrete specimens was measured, and the testing process is illustrated in
Figure 4. The rate of mass loss was then calculated.
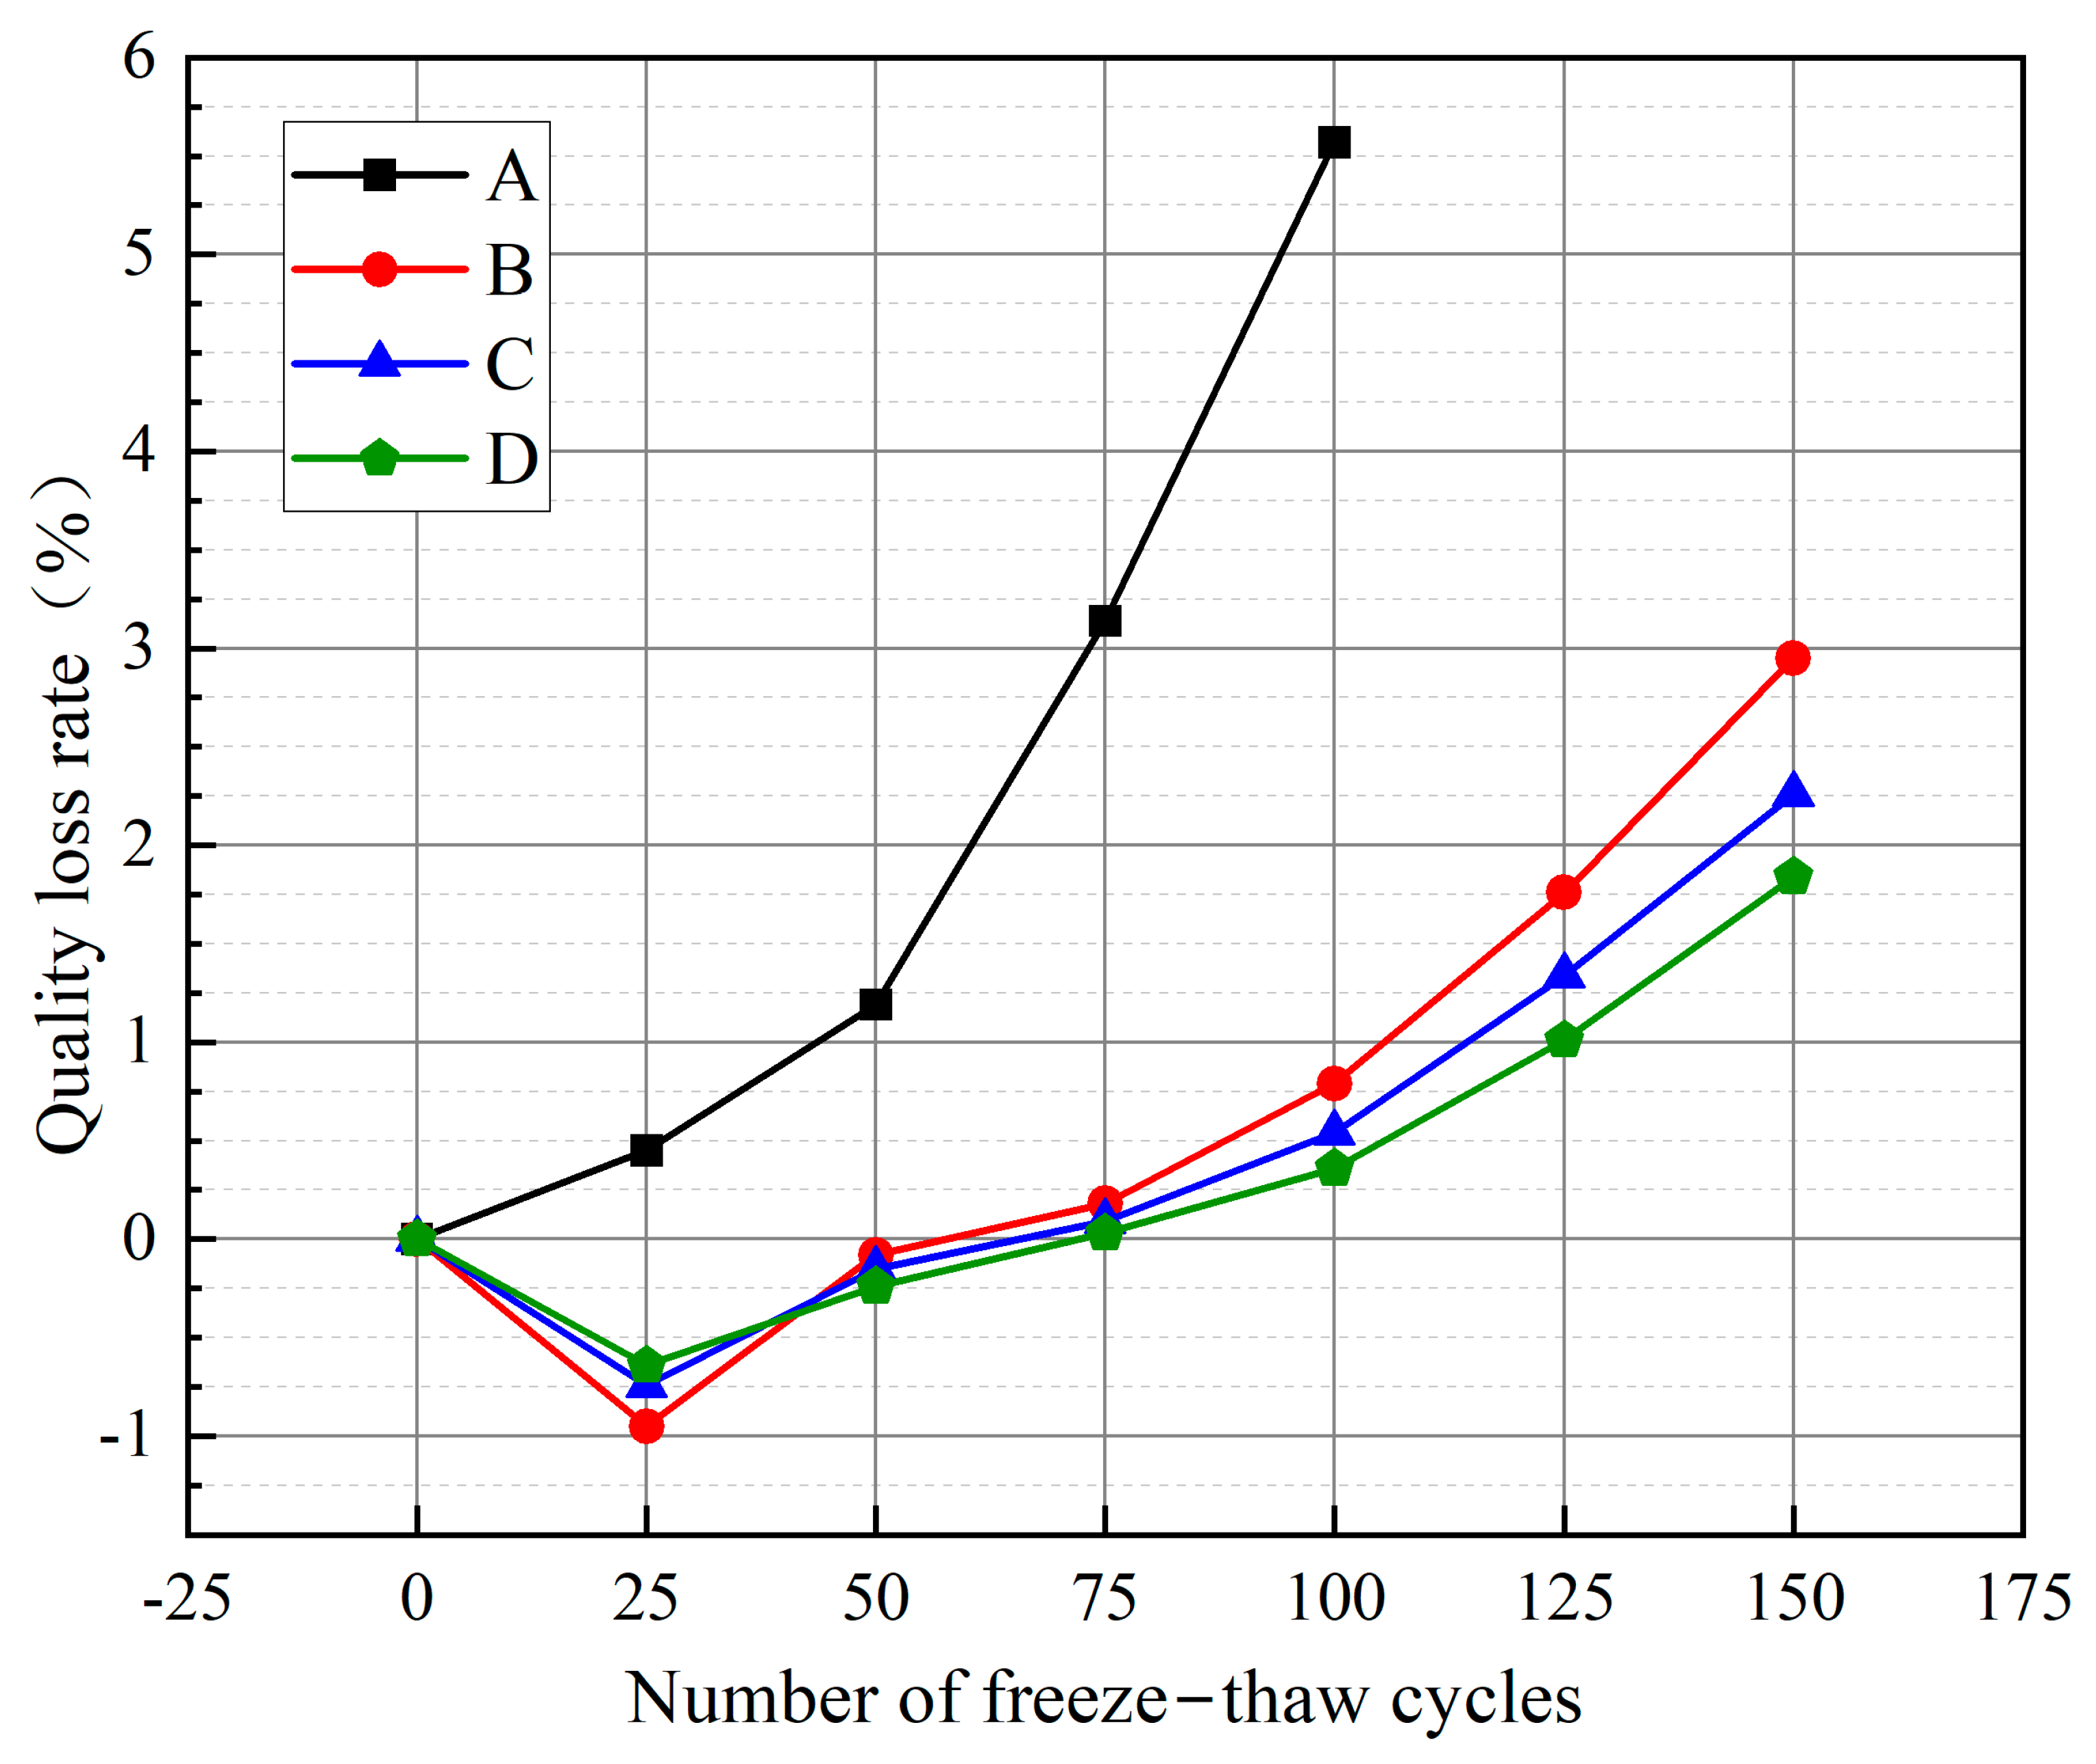
Table 4 presents the mass loss rate of each group of concrete specimens under different numbers of freeze–thaw cycles. The trend of the mass loss rate for each group after the freeze–thaw cycles is shown in
Figure 5. All test curves were plotted using Origin 2024.
As seen in
Figure 5, the mass loss rate of the group A concrete specimen increases consistently with the number of freeze–thaw cycles. Initially, internal pore damage accumulates, creating new tiny connecting pores. These pores expand under freezing and expansion forces, reducing densification. Moisture penetrates these cracks, increasing the concrete specimen’s weight, while the surface concrete paste gradually peels off. The mass of moisture in the internal voids is less than the mass loss of the concrete itself. As the number of freeze–thaw cycles increases, the surface holes multiply, fine aggregate is lost, and the damage progresses from the surface to the interior, gradually increasing in mass loss. The mass initially decreases and then increases for groups B, C, and D. This is because moisture penetrating the cracks initially increases the specimen’s weight. However, the GFEM reinforcement layer prevents internal concrete mass loss, leading to an initial increase in mass. As the number of freeze–thaw cycles increases, holes in the reinforcement layer surface multiply, eventually leading to mass loss.
The rate of concrete mass loss in group A is significantly higher than in groups B, C, and D. The rate of concrete mass loss in group D is the smallest, with D, C, B, and A in descending order. At 25 freeze–thaw cycles, the negative growth rate of D1 was the smallest, followed by C1, and B1 was the largest. This is because at the beginning of the freeze–thaw cycle, the higher the fibre admixture within a specific range, the better the frost resistance; moreover, the fewer cracks inside the concrete, the less water enters into the cracks, and the less the mass increases. At 50 freeze–thaw cycles, the mass loss rate of B2 becomes the highest, but still negative, followed by C2 and D2. This is because with the increase in freeze–thaw cycles, holes begin to appear on the surface of the concrete, and the higher the fibre content within a certain range, the fewer the holes. The mass loss rate of the concrete in groups B, C, and D becomes positive after 75 freeze–thaw cycles and the mass loss rate increases rapidly after 100 freeze–thaw cycles. After 100 cycles, the mass loss rate increases quickly. In group A, the mass loss rate becomes positive after 50 freeze–thaw cycles, and the mass loss rate increases rapidly after 100 freeze–thaw cycles. The GFEM reinforcement layer can effectively reduce the mass loss of concrete. In addition, the integration of glass fibres helps to improve the compactness and reduce the porosity of the GFEM material, thus reducing water infiltration and effectively preventing internal stresses caused by icing expansion during freeze–thaw cycles.
3.3. Ultrasonic Velocity Analysis
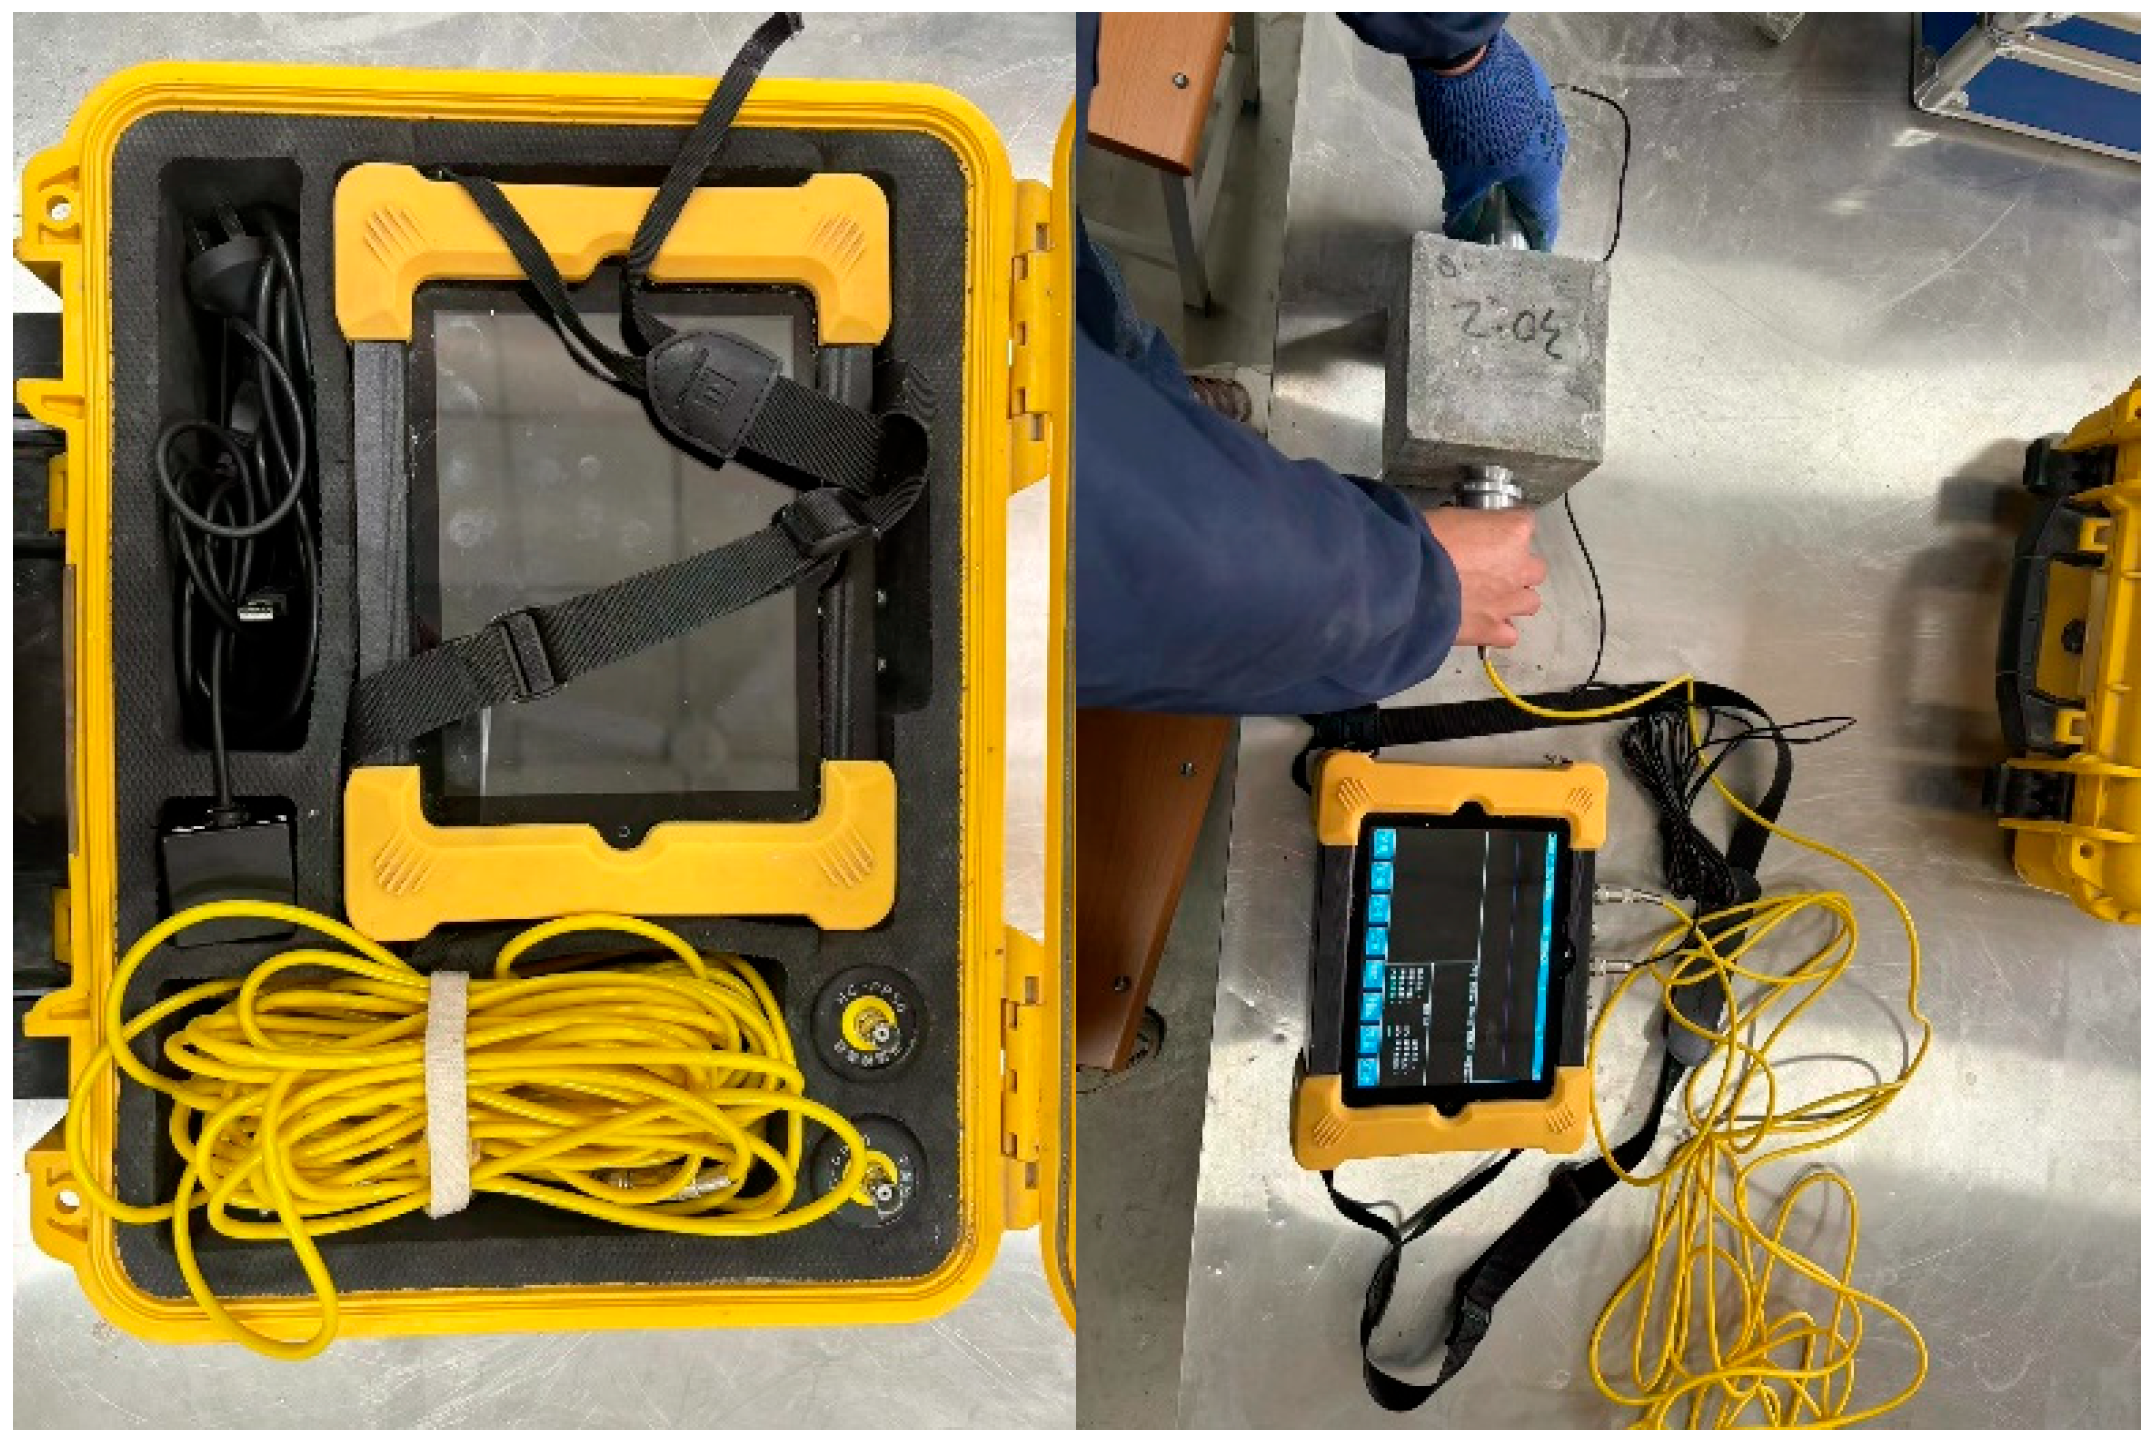
The propagation of ultrasonic velocity is closely related to the density of the material. The ultrasonic velocity remains constant in concrete with good density and few original defects, which can be considered a homogeneous medium. However, in materials with poor density and internal defects, the ultrasonic waves are refracted during propagation, reducing their speed and thus resulting in a lower propagation velocity. The freeze–thaw cycle of concrete causes fatigue damage, altering the internal structure and subsequently affecting the ultrasonic velocity. Therefore, changes in ultrasonic velocity can reflect the internal compactness of concrete. To carry out the test, the coupling agent is applied at the measurement point, the transducer is pressed firmly on the measurement point, and the gain is adjusted so that the amplitude of the first half-wave of the received signal of all tested pieces is reduced to the same amplitude of a certain amplitude, and the time readings are taken. Each specimen is evaluated based on five points using the arithmetic average of the measured value to test the ultrasonic wave velocity measurements in concrete.
Based on the freeze–thaw cycle test data, ultrasonic velocity tests were conducted on each group of concrete specimens, as shown in
Figure 6.
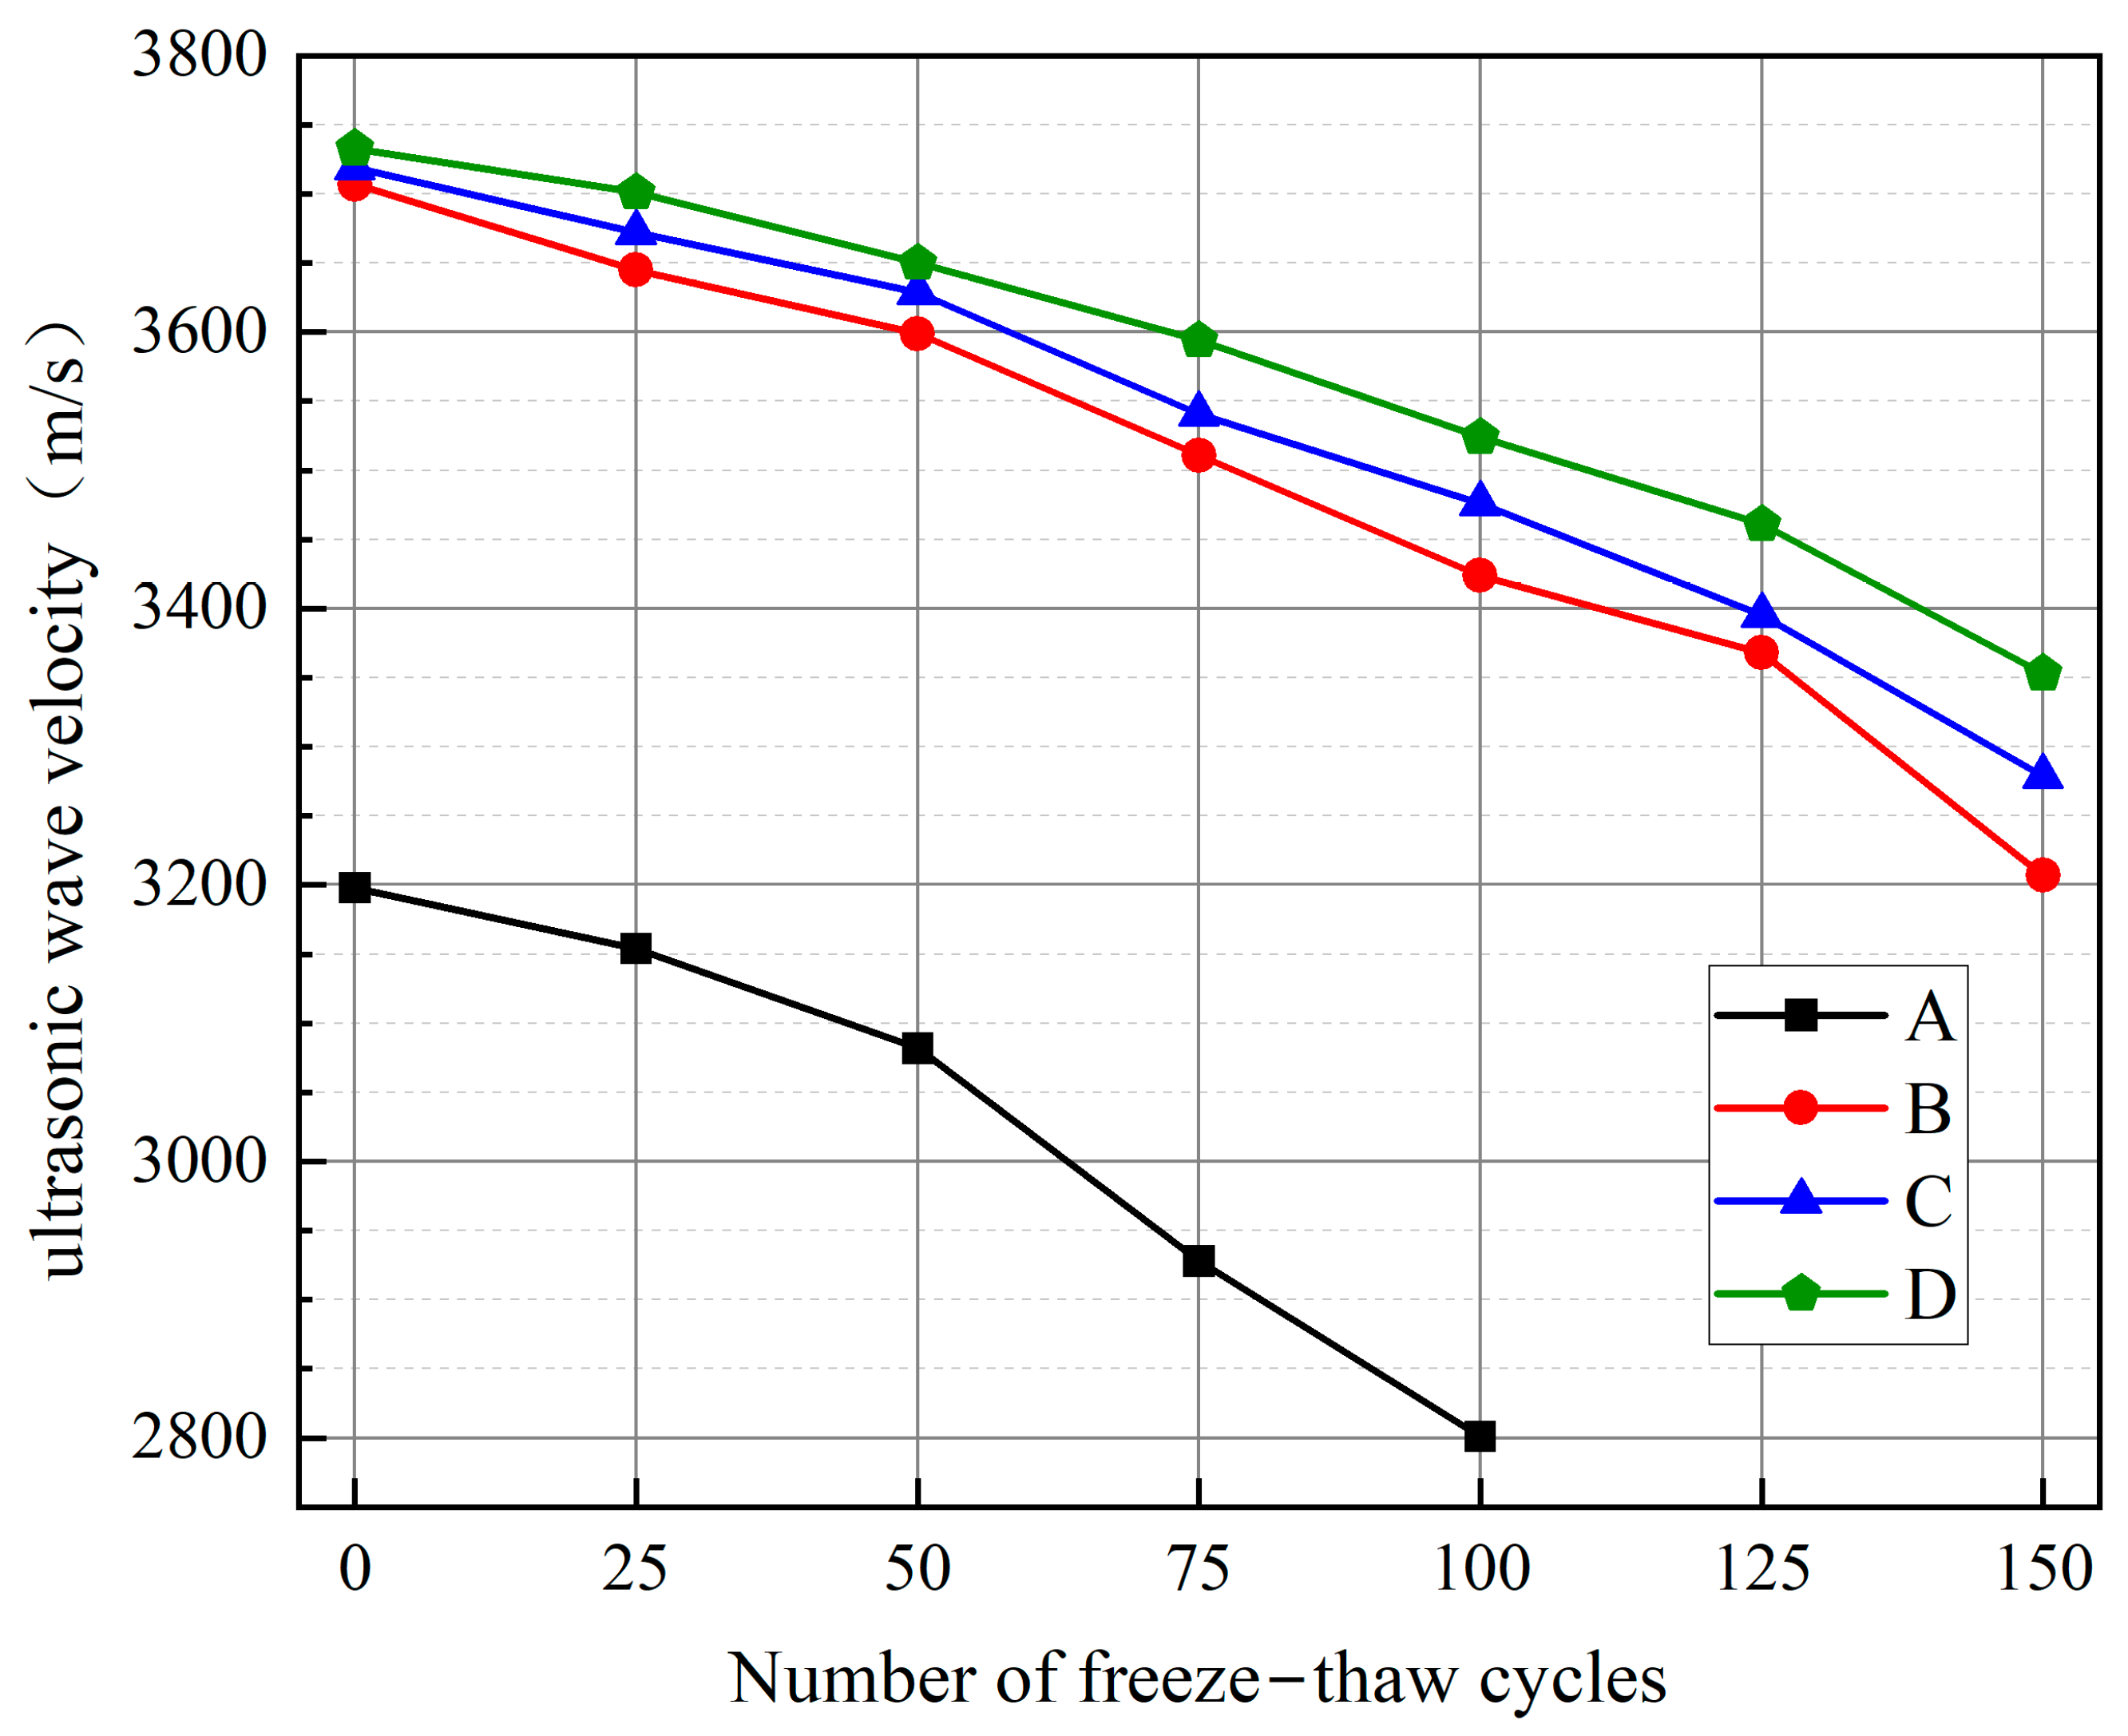
Table 5 presents the ultrasonic velocity of each group of concrete specimens under different numbers of freeze–thaw cycles. The trend in ultrasonic velocity after the freeze–thaw cycles is illustrated in
Figure 7.
As can be seen in
Figure 7, at 0 freeze–thaw cycles, the ultrasonic velocity values of B
0, C
0, and D
0 were higher than that of A
0, which were elevated by 15.92%, 16.29%, and 16.72%, respectively, relative to A
0. From the beginning to the end of the freeze–thaw cycle, the decreasing rates of the ultrasonic velocity of concrete in group A were 1.37%, 3.63%, 8.44%, and 12.41%. The decreasing rates of ultrasonic velocity of concrete in group B were 1.67%, 2.91%, 5.29%, 7.63%, 9.14%, and 13.49%; the decreasing rates of ultrasonic velocity of concrete in group C were 1.26%, 2.42%, 4.79%, 6.53%, 8.71%, and 11.83%; and the decreasing rate of ultrasonic velocity of concrete in group D was 0.86%, 2.22%, 3.72%, 5.60%, 7.29%, and 10.18% in that order. The decrease rate of A
4 at 100 freeze–thaw cycles was about twice as much as that of B
4, C
4 and D
4. The decline rate of group A concrete at the same number of freeze–thaw cycles was higher than that of B, C, and D concrete, and all of them showed a trend of decreasing all the time with the increase in the number of freeze–thaw cycles. When the number of freeze–thaw cycles is the same, the higher the glass fibre dosage in a particular range, the higher the ultrasonic velocity, the more minor the internal damage, and the better the reinforcement effect. The GFEM reinforcement layer can influence the movement of moisture within the matrix concrete so that the moisture is not concentrated in a particular location during the freeze–thaw process, reducing localized damage.
3.4. Freeze–Thaw Cycle Damage Analysis
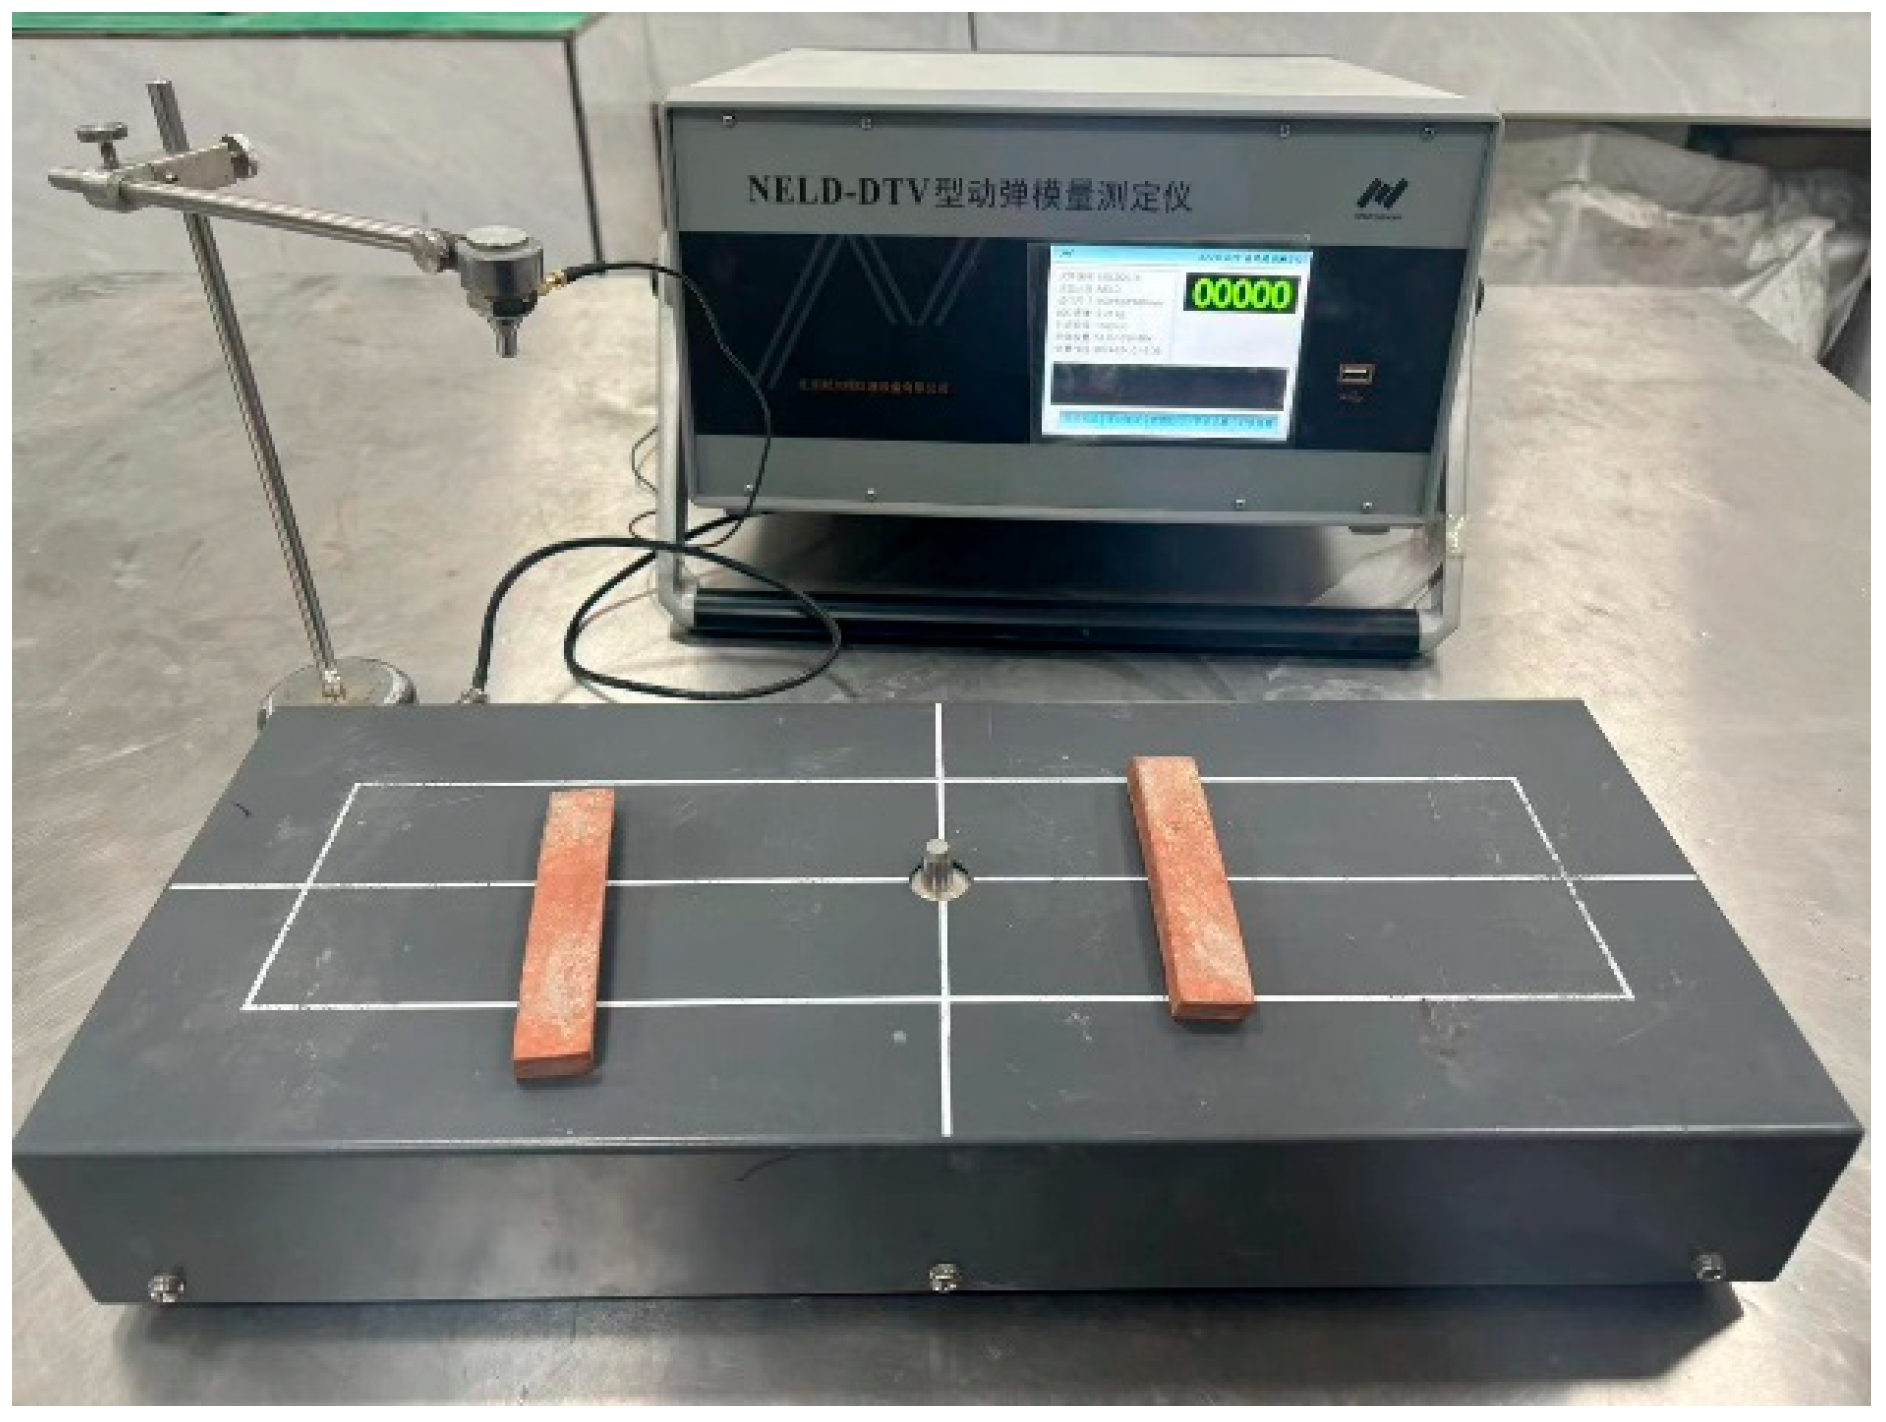
Based on the freeze–thaw cycle test data, the dynamic elastic modulus of prismatic specimens was evaluated, The dynamic modulus of elasticity was tested using a NELD-DTV dynamic modulus of elasticity tester manufactured in Beijing, China, as detailed in
Figure 8. The dynamic elastic modulus test of each group of prismatic specimens using the forced resonance method applies to specimens with the ratio of length to the maximum side length of the cross-section between 3 and 5. The dynamic elastic modulus measuring apparatus should be preheated for more than 15 min before the test. The specimen should be removed after reaching the test age. Before the test, the specimen should be saturated in water in a surface-dry state, wiping the surface of the specimen clean with a wringing wet cloth, weighing the mass accurately to 0.01 kg, and measuring the specimen size accurately to 1 mm. The changes in the relative dynamic elastic modulus were calculated accordingly.
Table 6 presents the relative dynamic elastic modulus of each concrete specimen group subjected to varying freeze–thaw cycles.
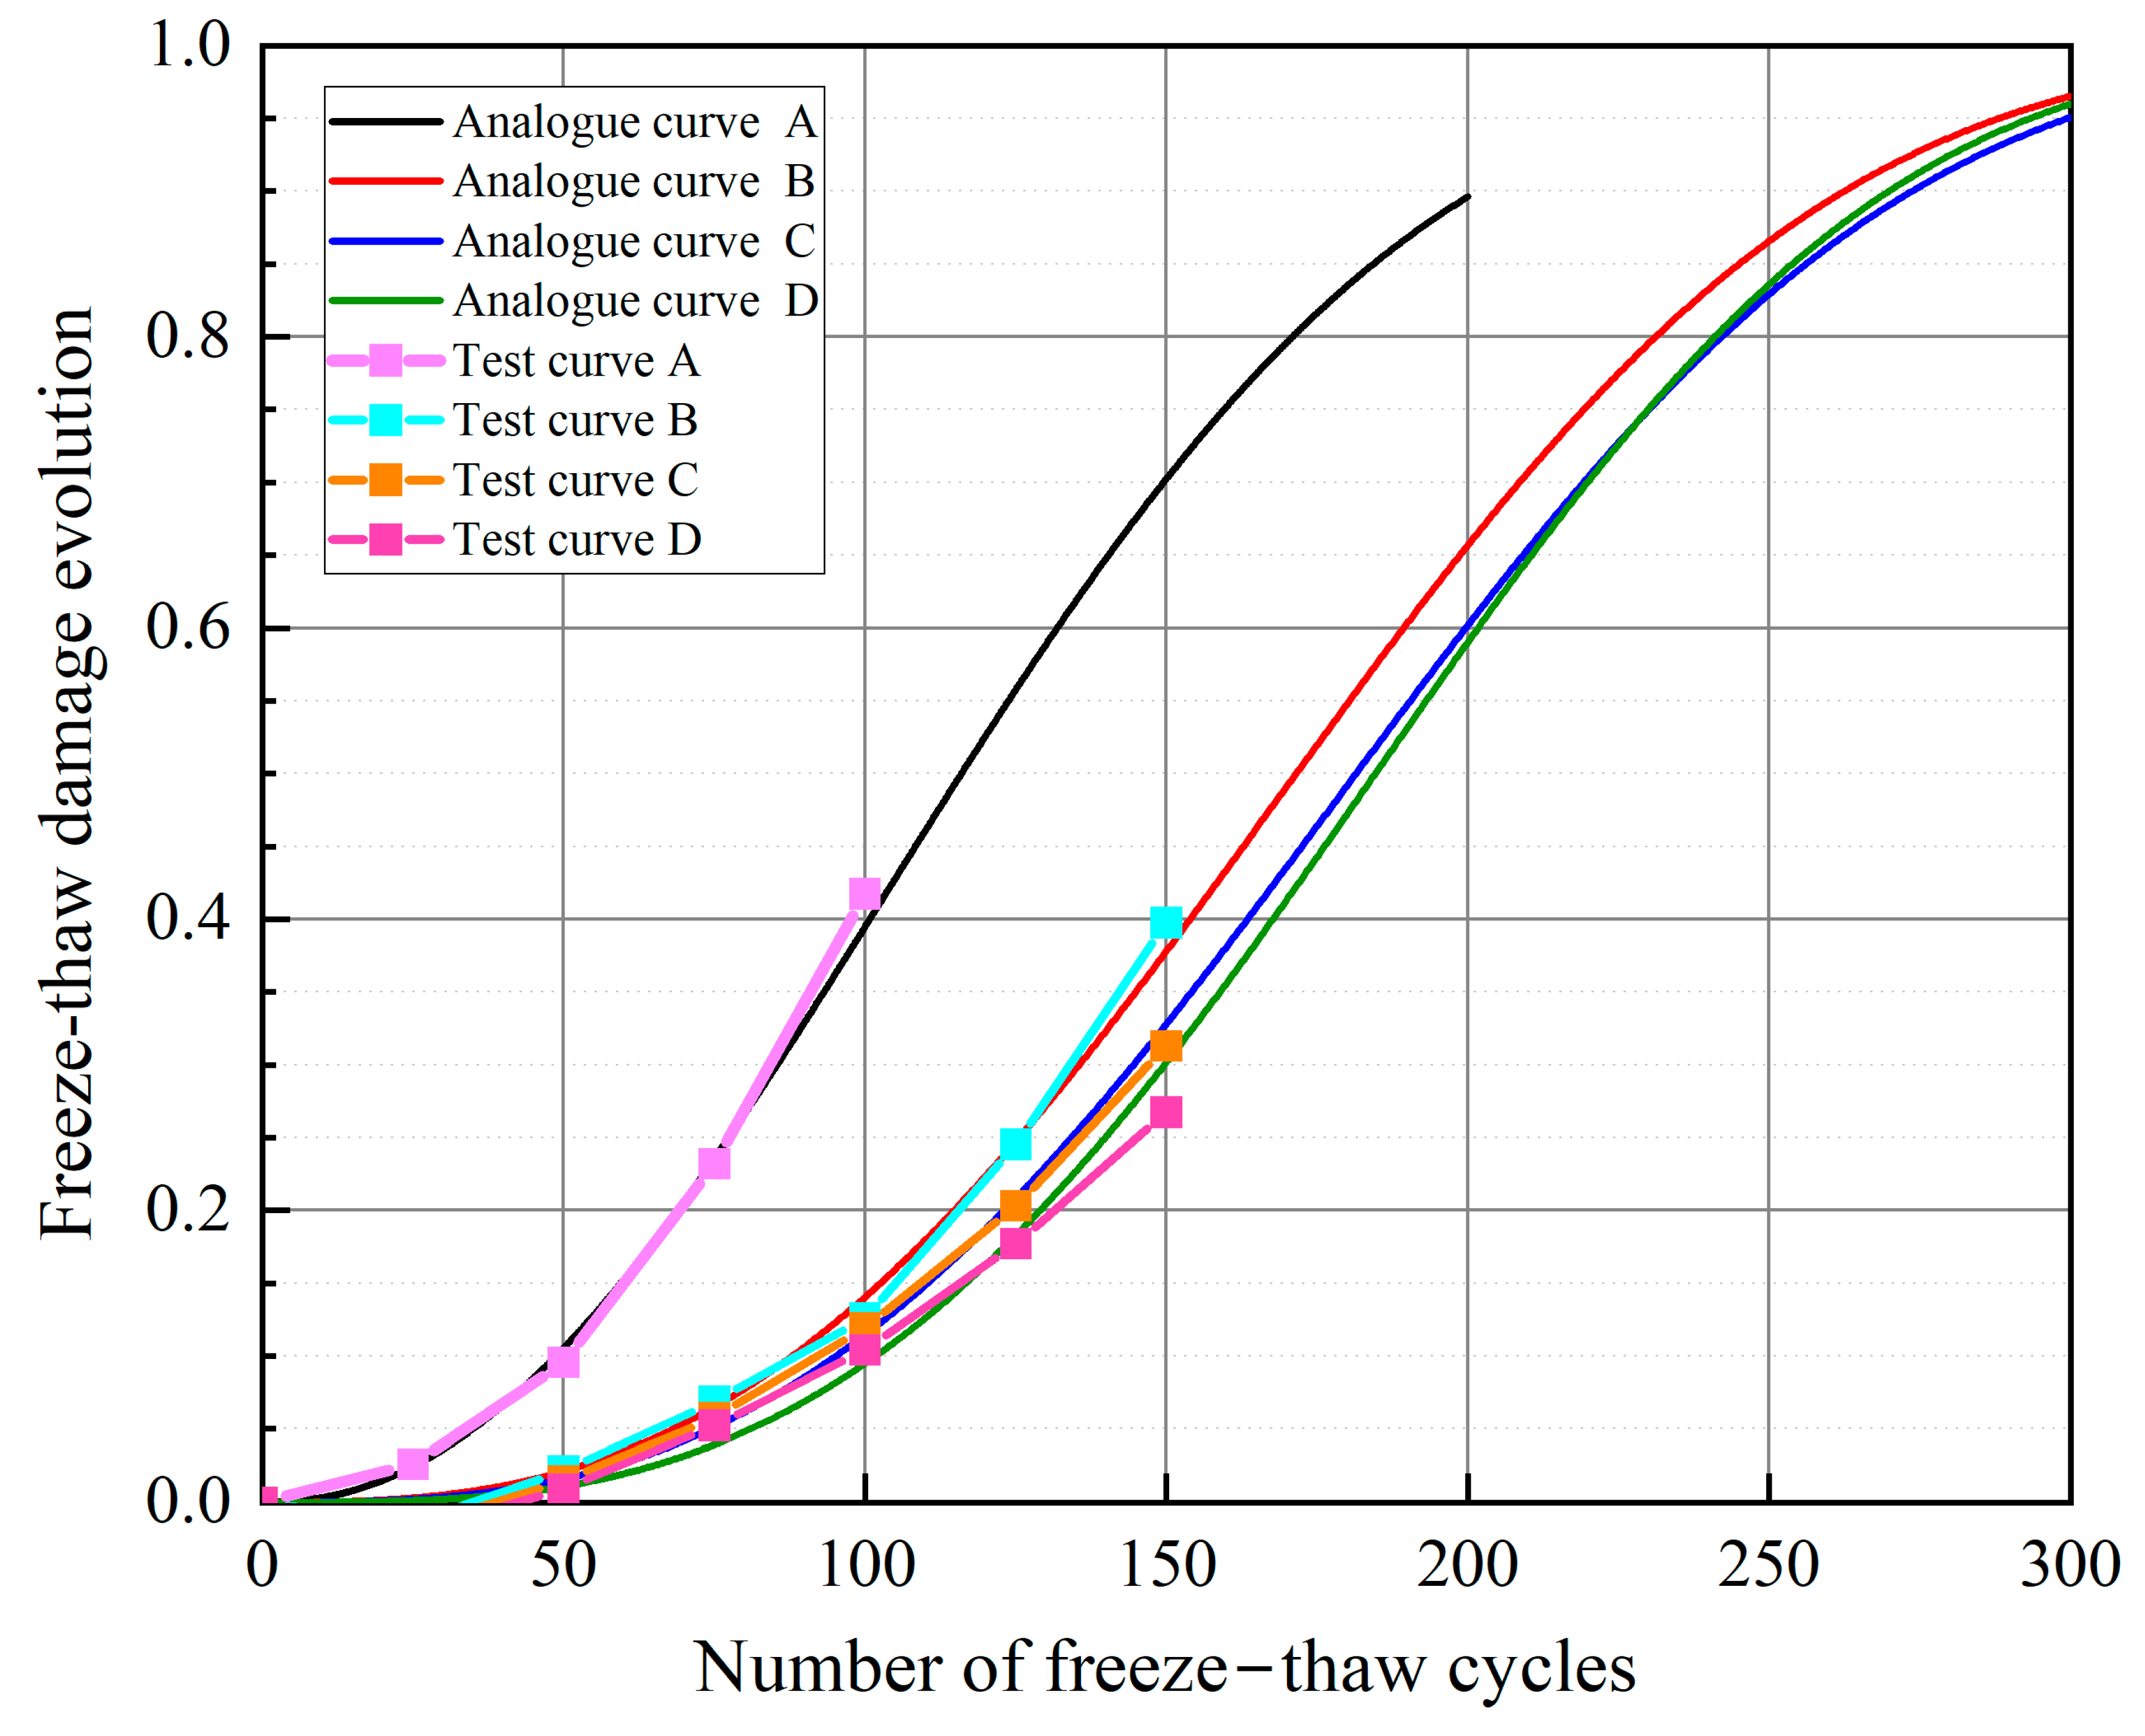
Various standards exist for evaluating concrete damage, which is typically carried out using compressive strength and mass loss rate indicators. However, these indicators are not suitable for assessing actual engineering structures. To study concrete freeze–thaw cycle damage [
38], we assume that crack extension in the concrete during the freeze–thaw process is isotropic and uniform. By combining this with the macroscopic damage mechanics definition, we use the dynamic elastic modulus of concrete as an evaluation index for damage. The degree of freeze–thaw damage, Dn, is defined by the calculation formula shown in Equation (2):
where
E0 (MPa) and
En (MPa) are the dynamic modulus of elasticity of the concrete specimens without the freeze–thaw cycle and after the
nth freeze–thaw cycle, respectively.
The degree of freeze–thaw damage for each group of concrete specimens was calculated using Equation (2).
Figure 9 illustrates the relationship between the number of freeze–thaw cycles and the degree of freeze–thaw damage.
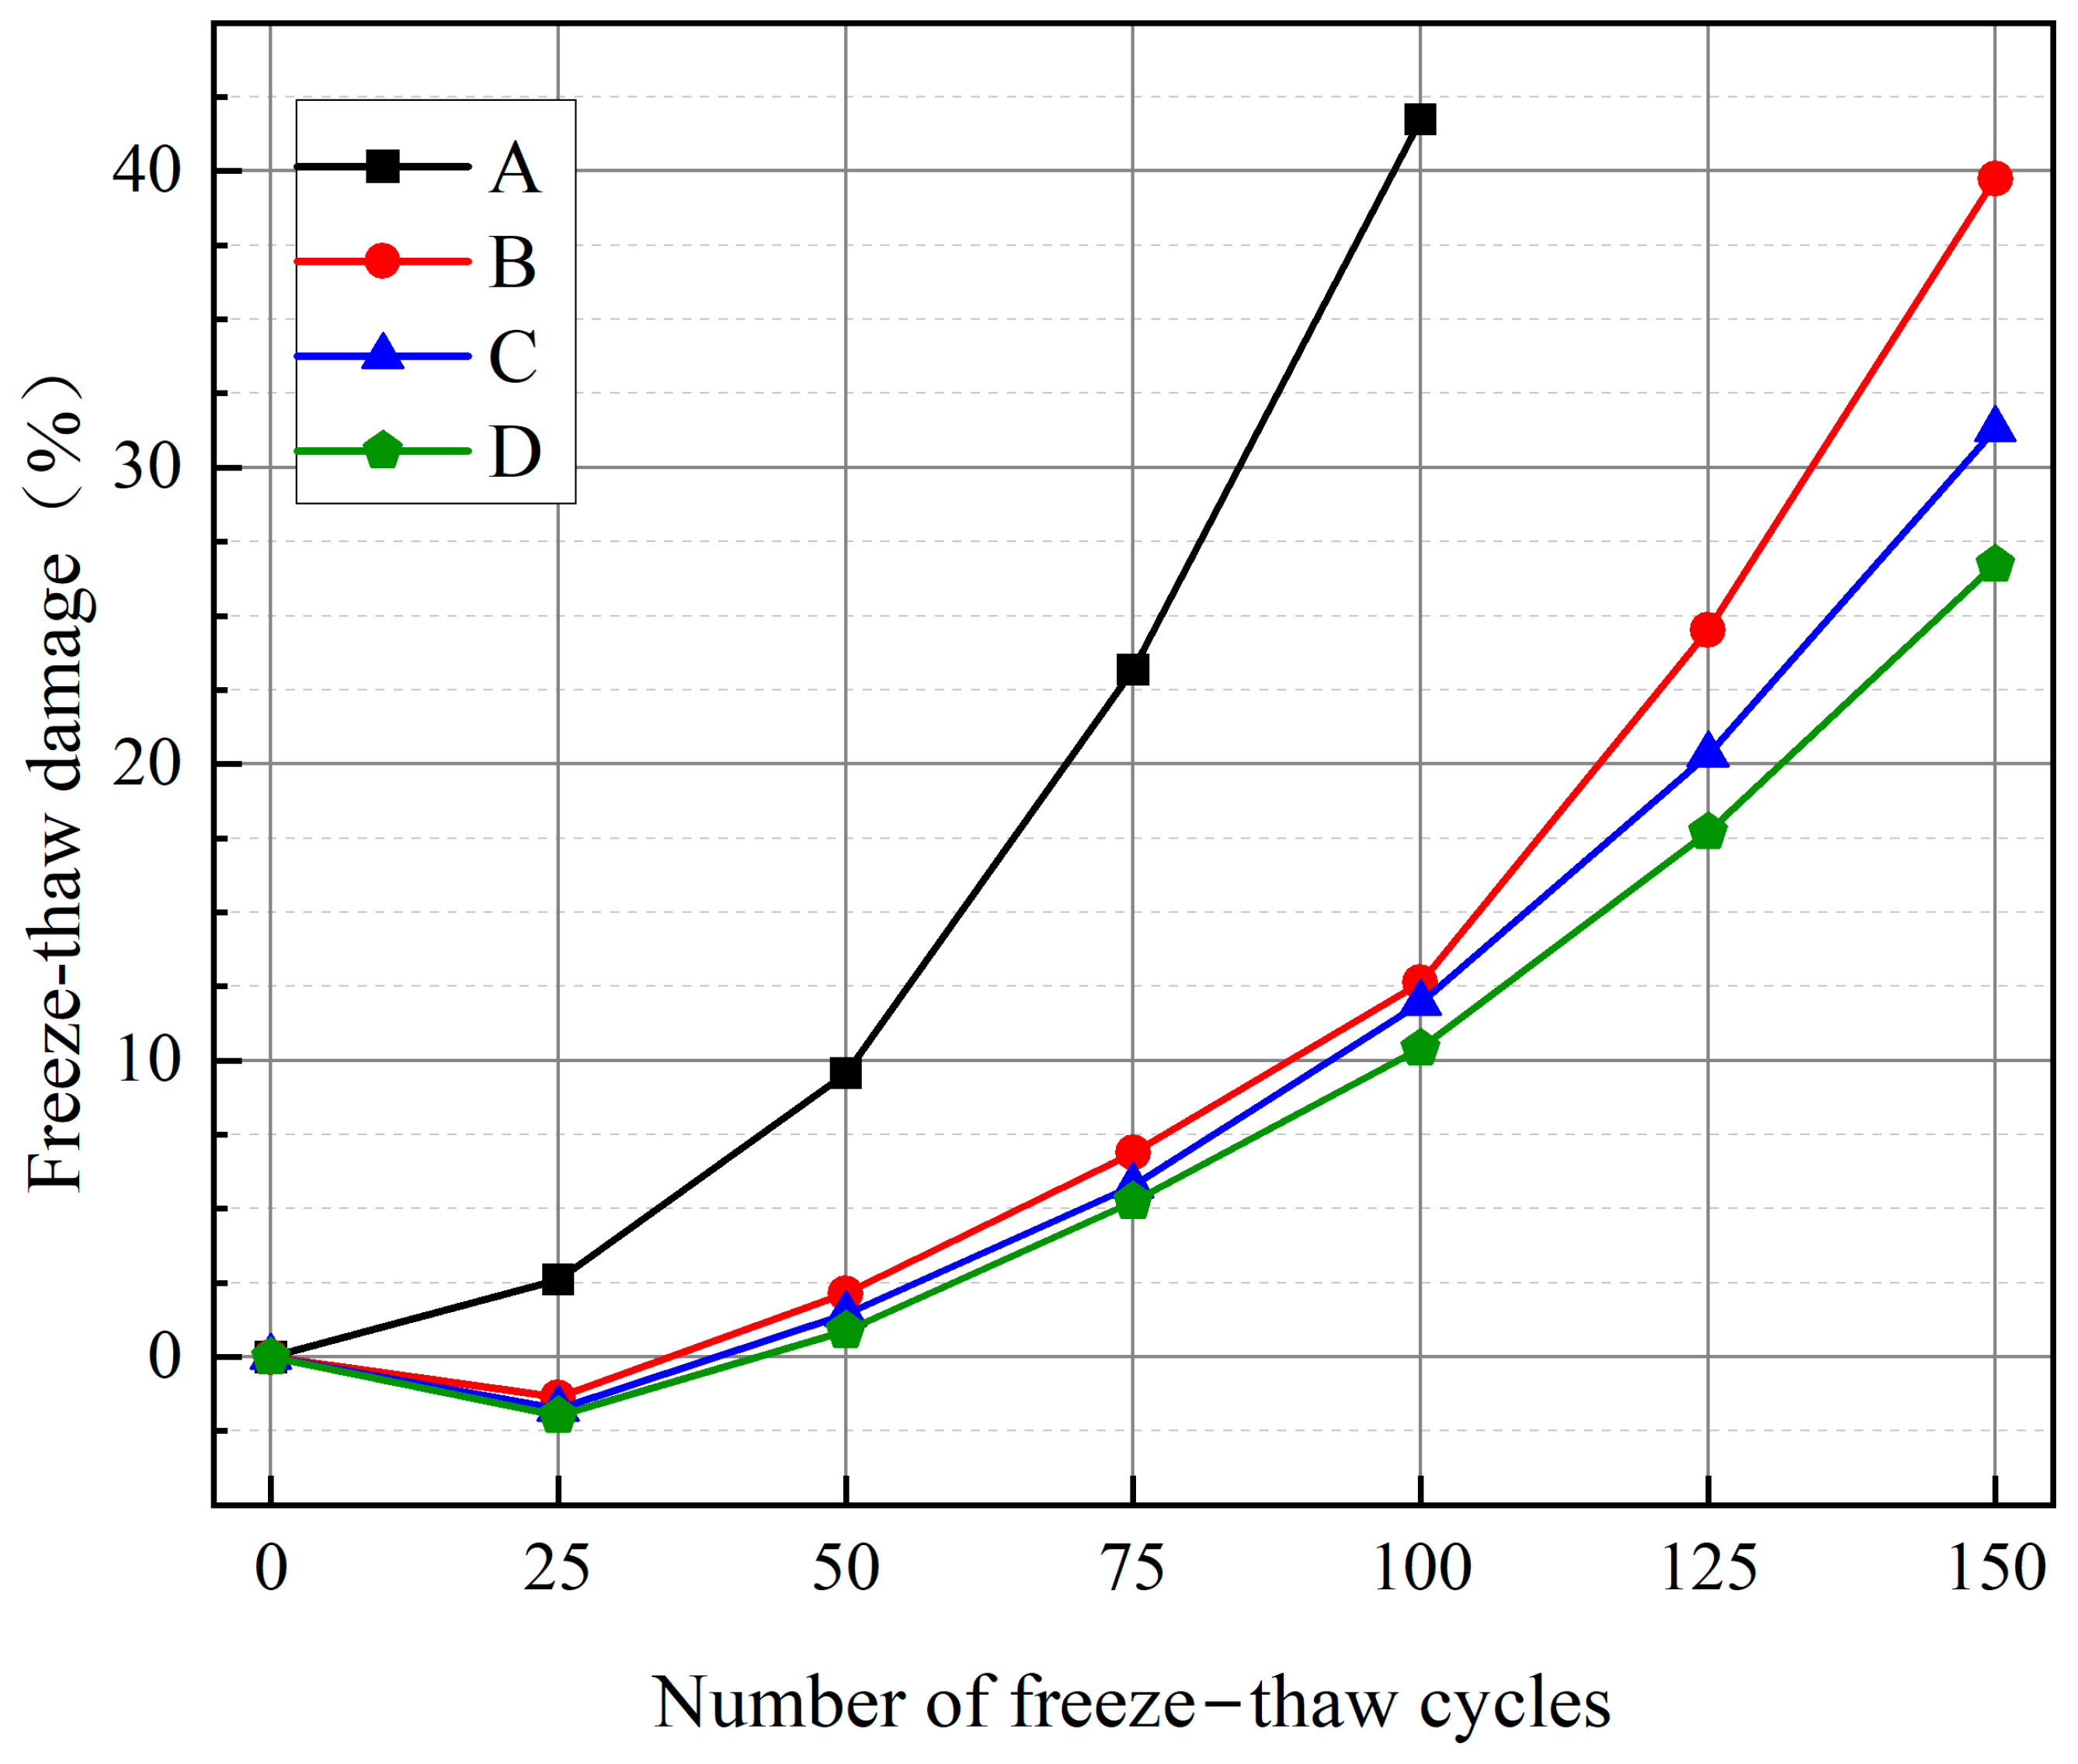
As shown in
Figure 9, the degree of freeze–thaw damage for specimens B
1, C
1, and D
1 increased negatively during the pre-freeze–thaw cycle. This can be attributed to the expansion of water within the concrete due to freezing, which created more empty spaces within the cement paste. Consequently, the fit between cement particles improved, enhancing volume stability and the dynamic elastic modulus. During the freeze–thaw cycle, the degree of damage for group A concrete was higher compared to groups B, C, and D. After 100 freeze–thaw cycles, the damage degree of A
4 exceeded 40%. In contrast, the damage degrees for B
4, C
4, and D
4 were 12.63%, 11.95%, and 10.41%, respectively, indicating better durability. Upon reaching 150 freeze–thaw cycles, the damage degree for B
6 was 39.75%, approaching critical levels of destruction. C
6 demonstrated a damage degree of 31.29%, while D
6 showed the most minor damage at 26.74%, exhibiting the best resistance against freeze–thaw cycles. Furthermore, when the number of freeze–thaw cycles was constant, an increase in glass fibre doping within a specific range resulted in better reinforcement and improved resistance against freeze–thaw cycles. Consequently, the sprayed GFEM reinforcement technology effectively suppressed the development of freeze–thaw damage in concrete, with the glass fibre admixture inhibiting crack expansion during repeated freeze–thaw cycles and enhancing the concrete’s frost resistance. The addition of glass fibres also improves the thermal expansion properties of GFEM materials during temperature changes, which helps to reduce thermal cracking caused by temperature differences and better cope with freeze–thaw cycles.
3.5. Rate of Loss of Compressive Strength Analysis
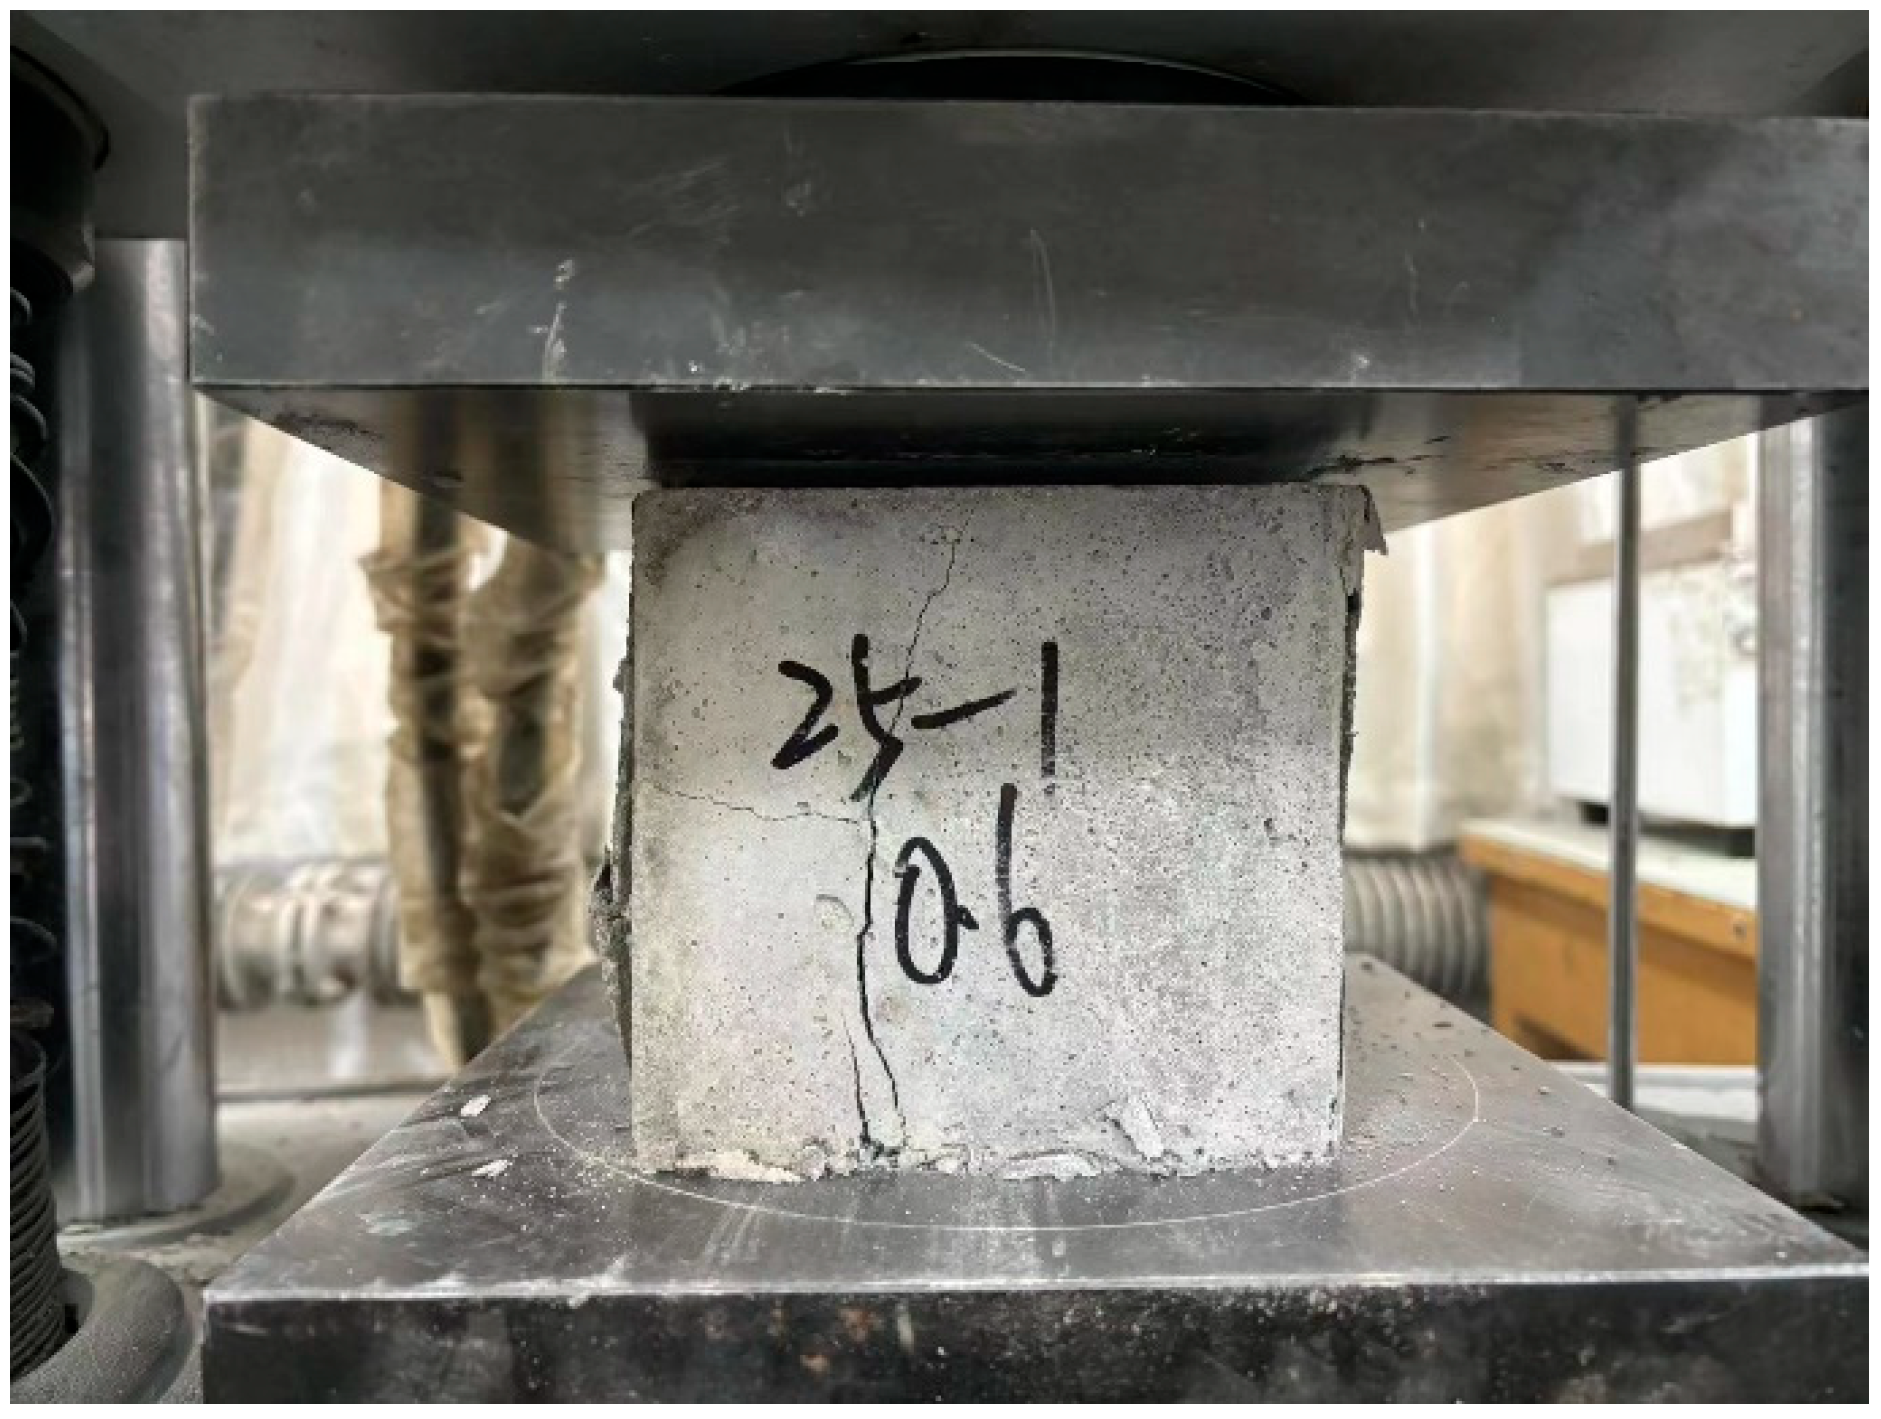
The mechanical properties of concrete materials play a crucial role in evaluating freezing resistance and analysing durability, as they visually reflect the material’s structural characteristics. This study examined the fundamental mechanical properties of regular concrete and GFEM concrete with varying dosages under the influence of freeze–thaw cycles. This analysis aimed to understand the stress progression in the specimens and investigate the mechanism behind the impact of the number of freeze–thaw cycles and fibre dosage on concrete compressive strength. A universal testing machine was used to test the compressive strength of the specimens. Universal testing machine adopts WAW-1000 electro-hydraulic servo universal testing machine from Jinan, China. For each group of three specimens, the average of the measured values of the three specimens is the specimen groups’ compressive strength test results. When there is a measured value and the difference between the intermediate value is more than 15% of the intermediate value, take the intermediate value as the test result. When the difference between two measured values and the median value is more than 15% of the median value, the test results of this group are invalid. When reaching the specified test age, take out the specimen from the curing room, cover the specimen with a wet cloth, and keep the specimen in a moist state. During the test, wipe the upper and lower platens of the testing machine clean, and place the specimen in the middle of the lower platen of the testing machine, with the side of the mould used as the pressure-bearing surface. If necessary, add steel pads between the upper and lower platens of the testing machine and the specimen, and clamp a steel ball seat between the upper platen and the specimen at the centre position.
The definition
μ of the rate of strength loss [
39] is calculated as shown in Equation (3):
where F0 (MPa) and Fn (MPa) are the compressive strength of the concrete specimens without the freeze–thaw cycle and after the nth freeze–thaw cycle, respectively.
The test procedure shown in
Figure 10 was conducted based on the measured compressive strength of each group of concrete specimens. The rate of compressive strength loss was calculated using Equation (3), and
Table 7 presents the rate of compressive strength loss for each group under varying numbers of freeze–thaw cycles. The relationship between the number of freeze–thaw cycles and the compressive strength loss rate is illustrated in
Figure 11.
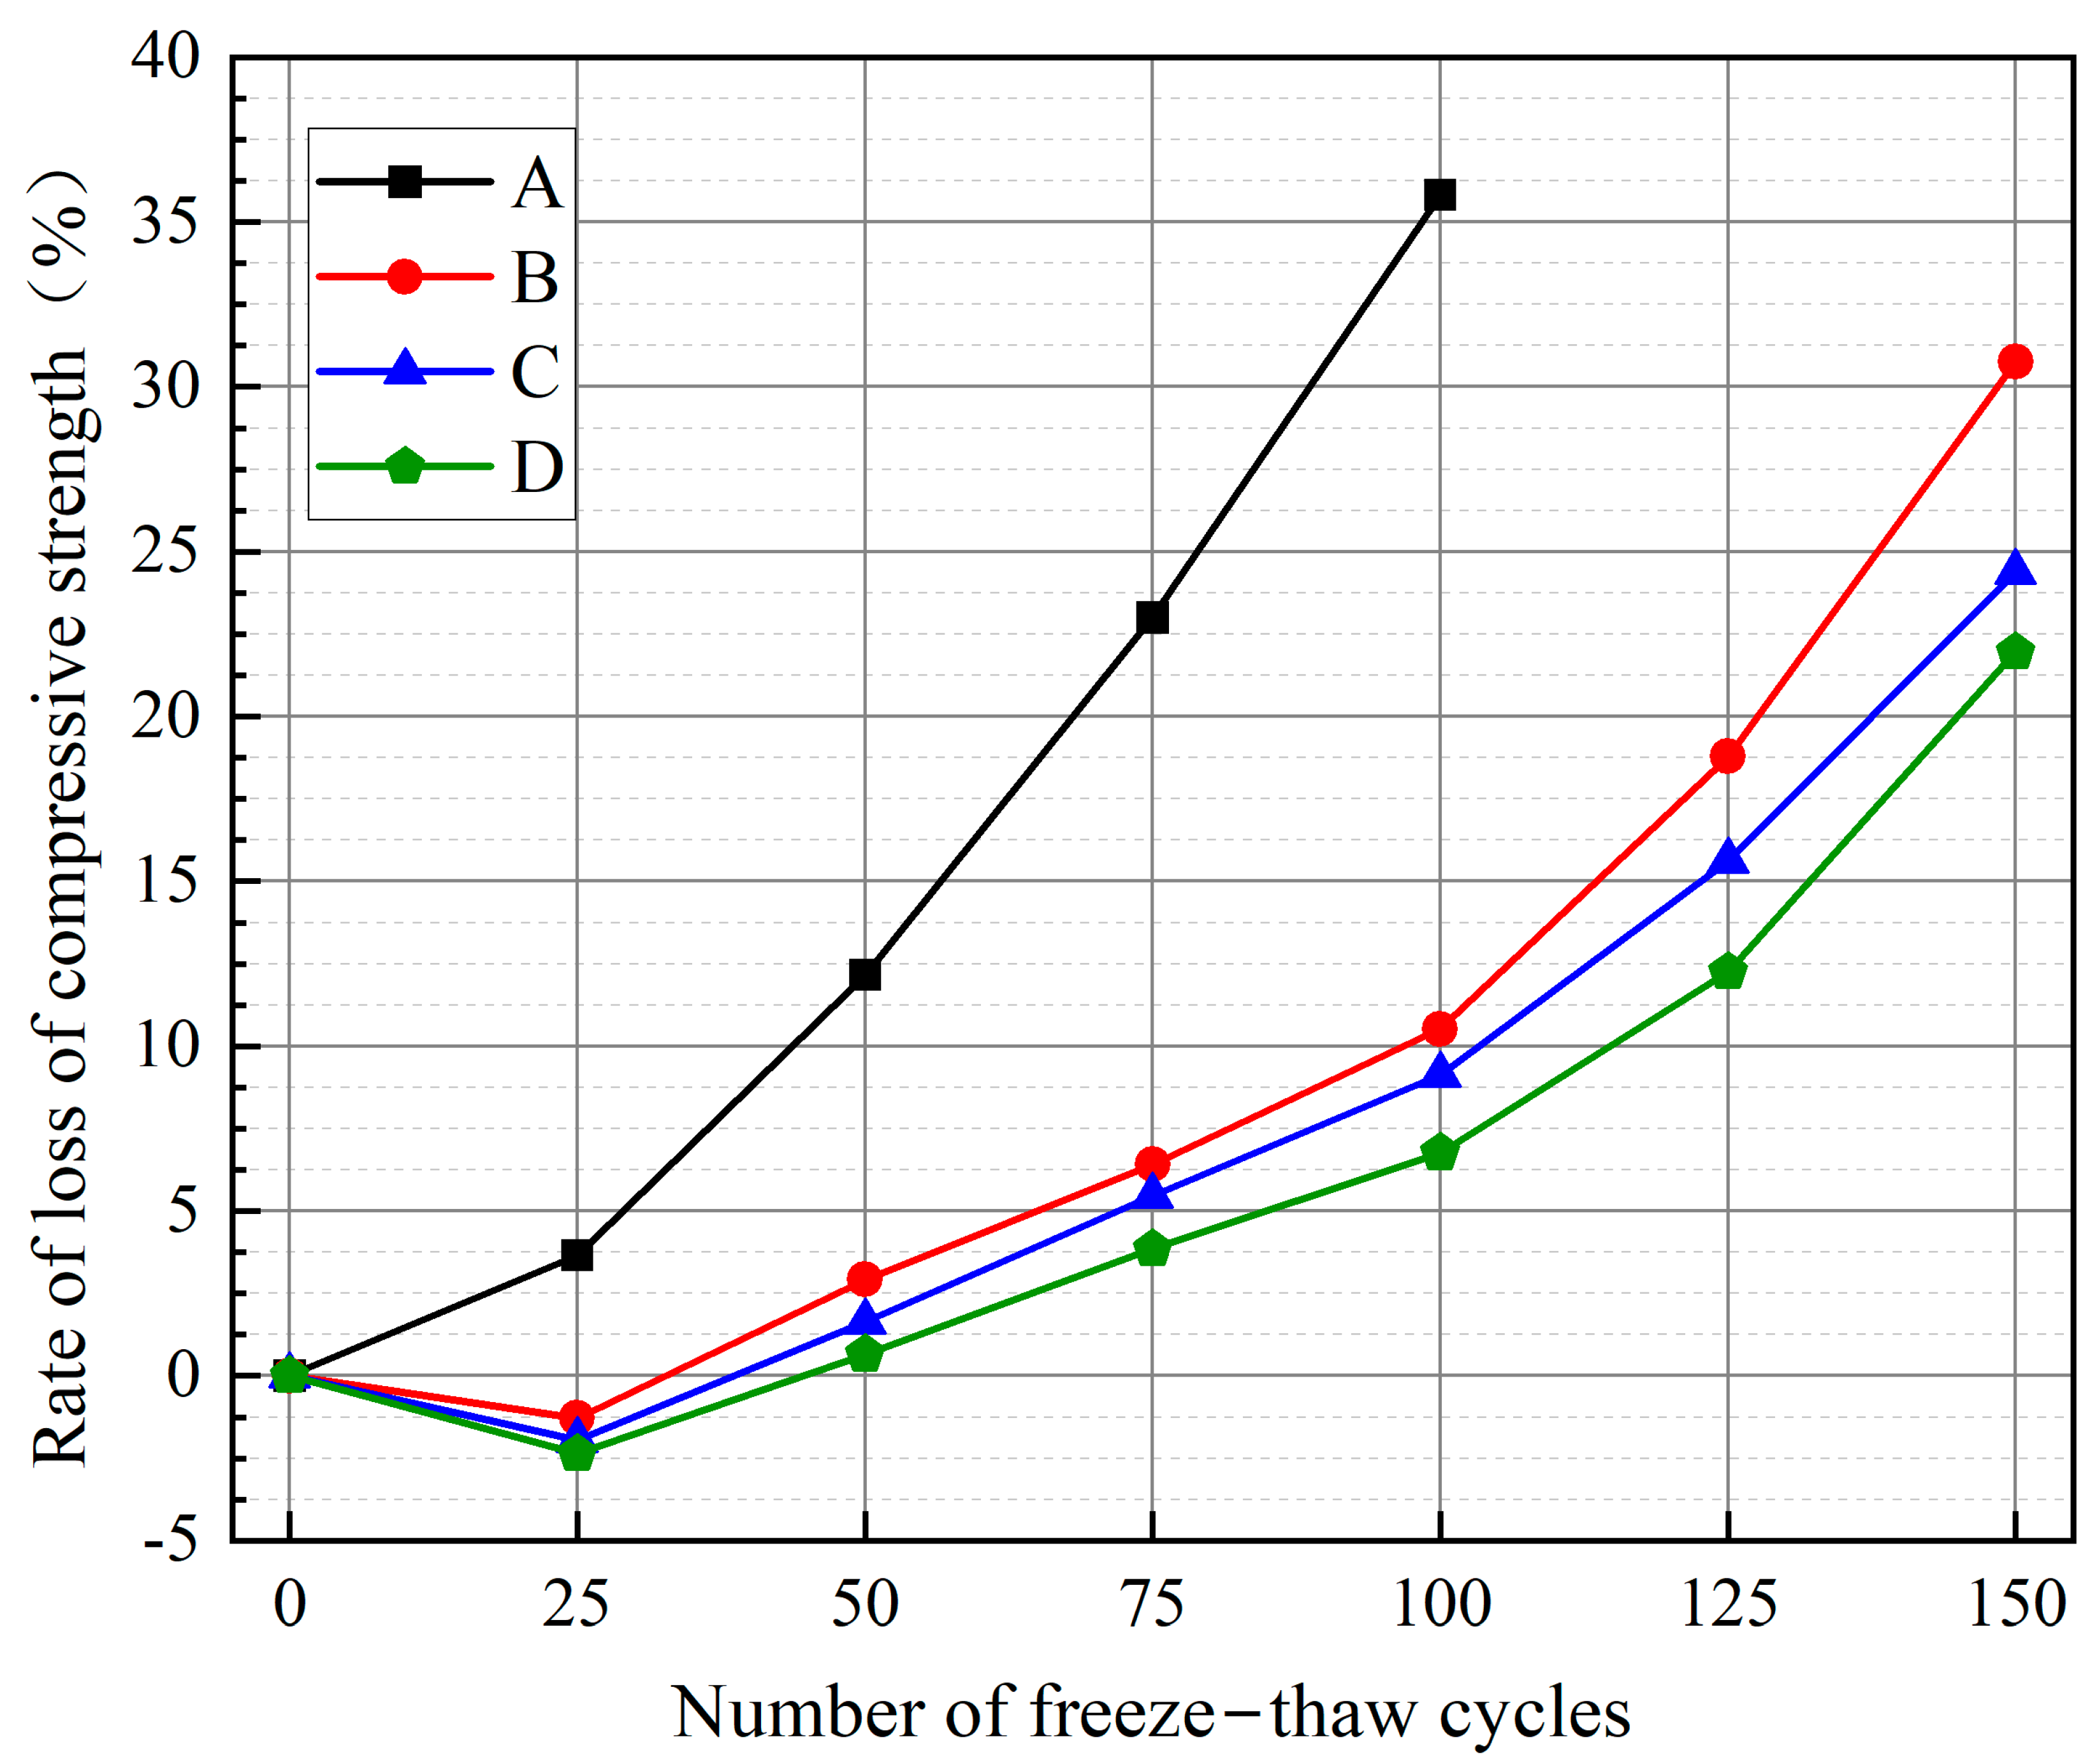
As depicted in
Figure 11, the compressive strengths of B
1, C
1, and D
1 initially exhibited negative growth up to 25 freeze–thaw cycles, reaching their lowest point. This can be attributed to the same reason that caused the negative growth in the degree of freeze–thaw damage during the early stages of the cycles. Furthermore, group A concrete’s compressive strength loss rate was higher than that of the concrete of groups B, C, and D during the freeze–thaw cycles. At 75 freeze–thaw cycles, A
3 experienced a compressive strength loss rate of 23.00%, nearing the damage threshold. At the same time, B
3, C
3, and D
3 had lower rates of 6.41%, 5.46%, and 3.85%, respectively, indicating a significant reinforcement effect and lower loss rates. At 150 freeze–thaw cycles, B
6 exhibited a compressive strength loss rate of 30.75%, reaching a damaged state. C
6 and D
6 had compressive strength loss rates of 24.39% and 21.96%, respectively, approaching the damage threshold without surpassing it. Remarkably, for a constant number of freeze–thaw cycles, increasing the fibre doping within a specific range resulted in lower rates of compressive strength loss, demonstrating a more substantial reinforcement effect and improved frost resistance.
After 100 freeze–thaw cycles, the loss rate of compressive strength for group B, C, and D concrete notably increased. The loss of compressive strength from 0 to 100 freeze–thaw cycles was 10.52%, 9.13%, and 6.76%, respectively, while the loss from 100 to 150 freeze–thaw cycles was 20.23%, 15.62%, and 15.20%, which is approximately two times higher than the previous loss rate. Comparing each group’s compressive strength loss rates after freeze–thaw cycles, it was evident that the GFEM reinforcement layer effectively mitigated the compressive strength loss caused by repeated freezing and thawing. The uniform dense structure formed by the hydration products of glass fibre, slurry, and aggregate cemented and the weak zone of the interface reduced, while the incorporation of glass fibre was accompanied by air, which optimizes the hydration environment of the GFEM-reinforced layer, increases the air content, and mitigates the freeze–thaw damage.
3.6. The Effect of Sprayed GFEM Reinforcement Technology Analysis
Glass fibres, consisting of monofilaments, can be oriented in a single direction or multiple directions, effectively determining the structural properties of the composite. As a bonding medium, epoxy mortar facilitates stress transfer between distributed fibres, ensuring their integration into a cohesive whole. Including fibre-reinforced composites in reinforced concrete technology can enhance the ultimate load-bearing capacity, durability, and seismic resistance of concrete structures.
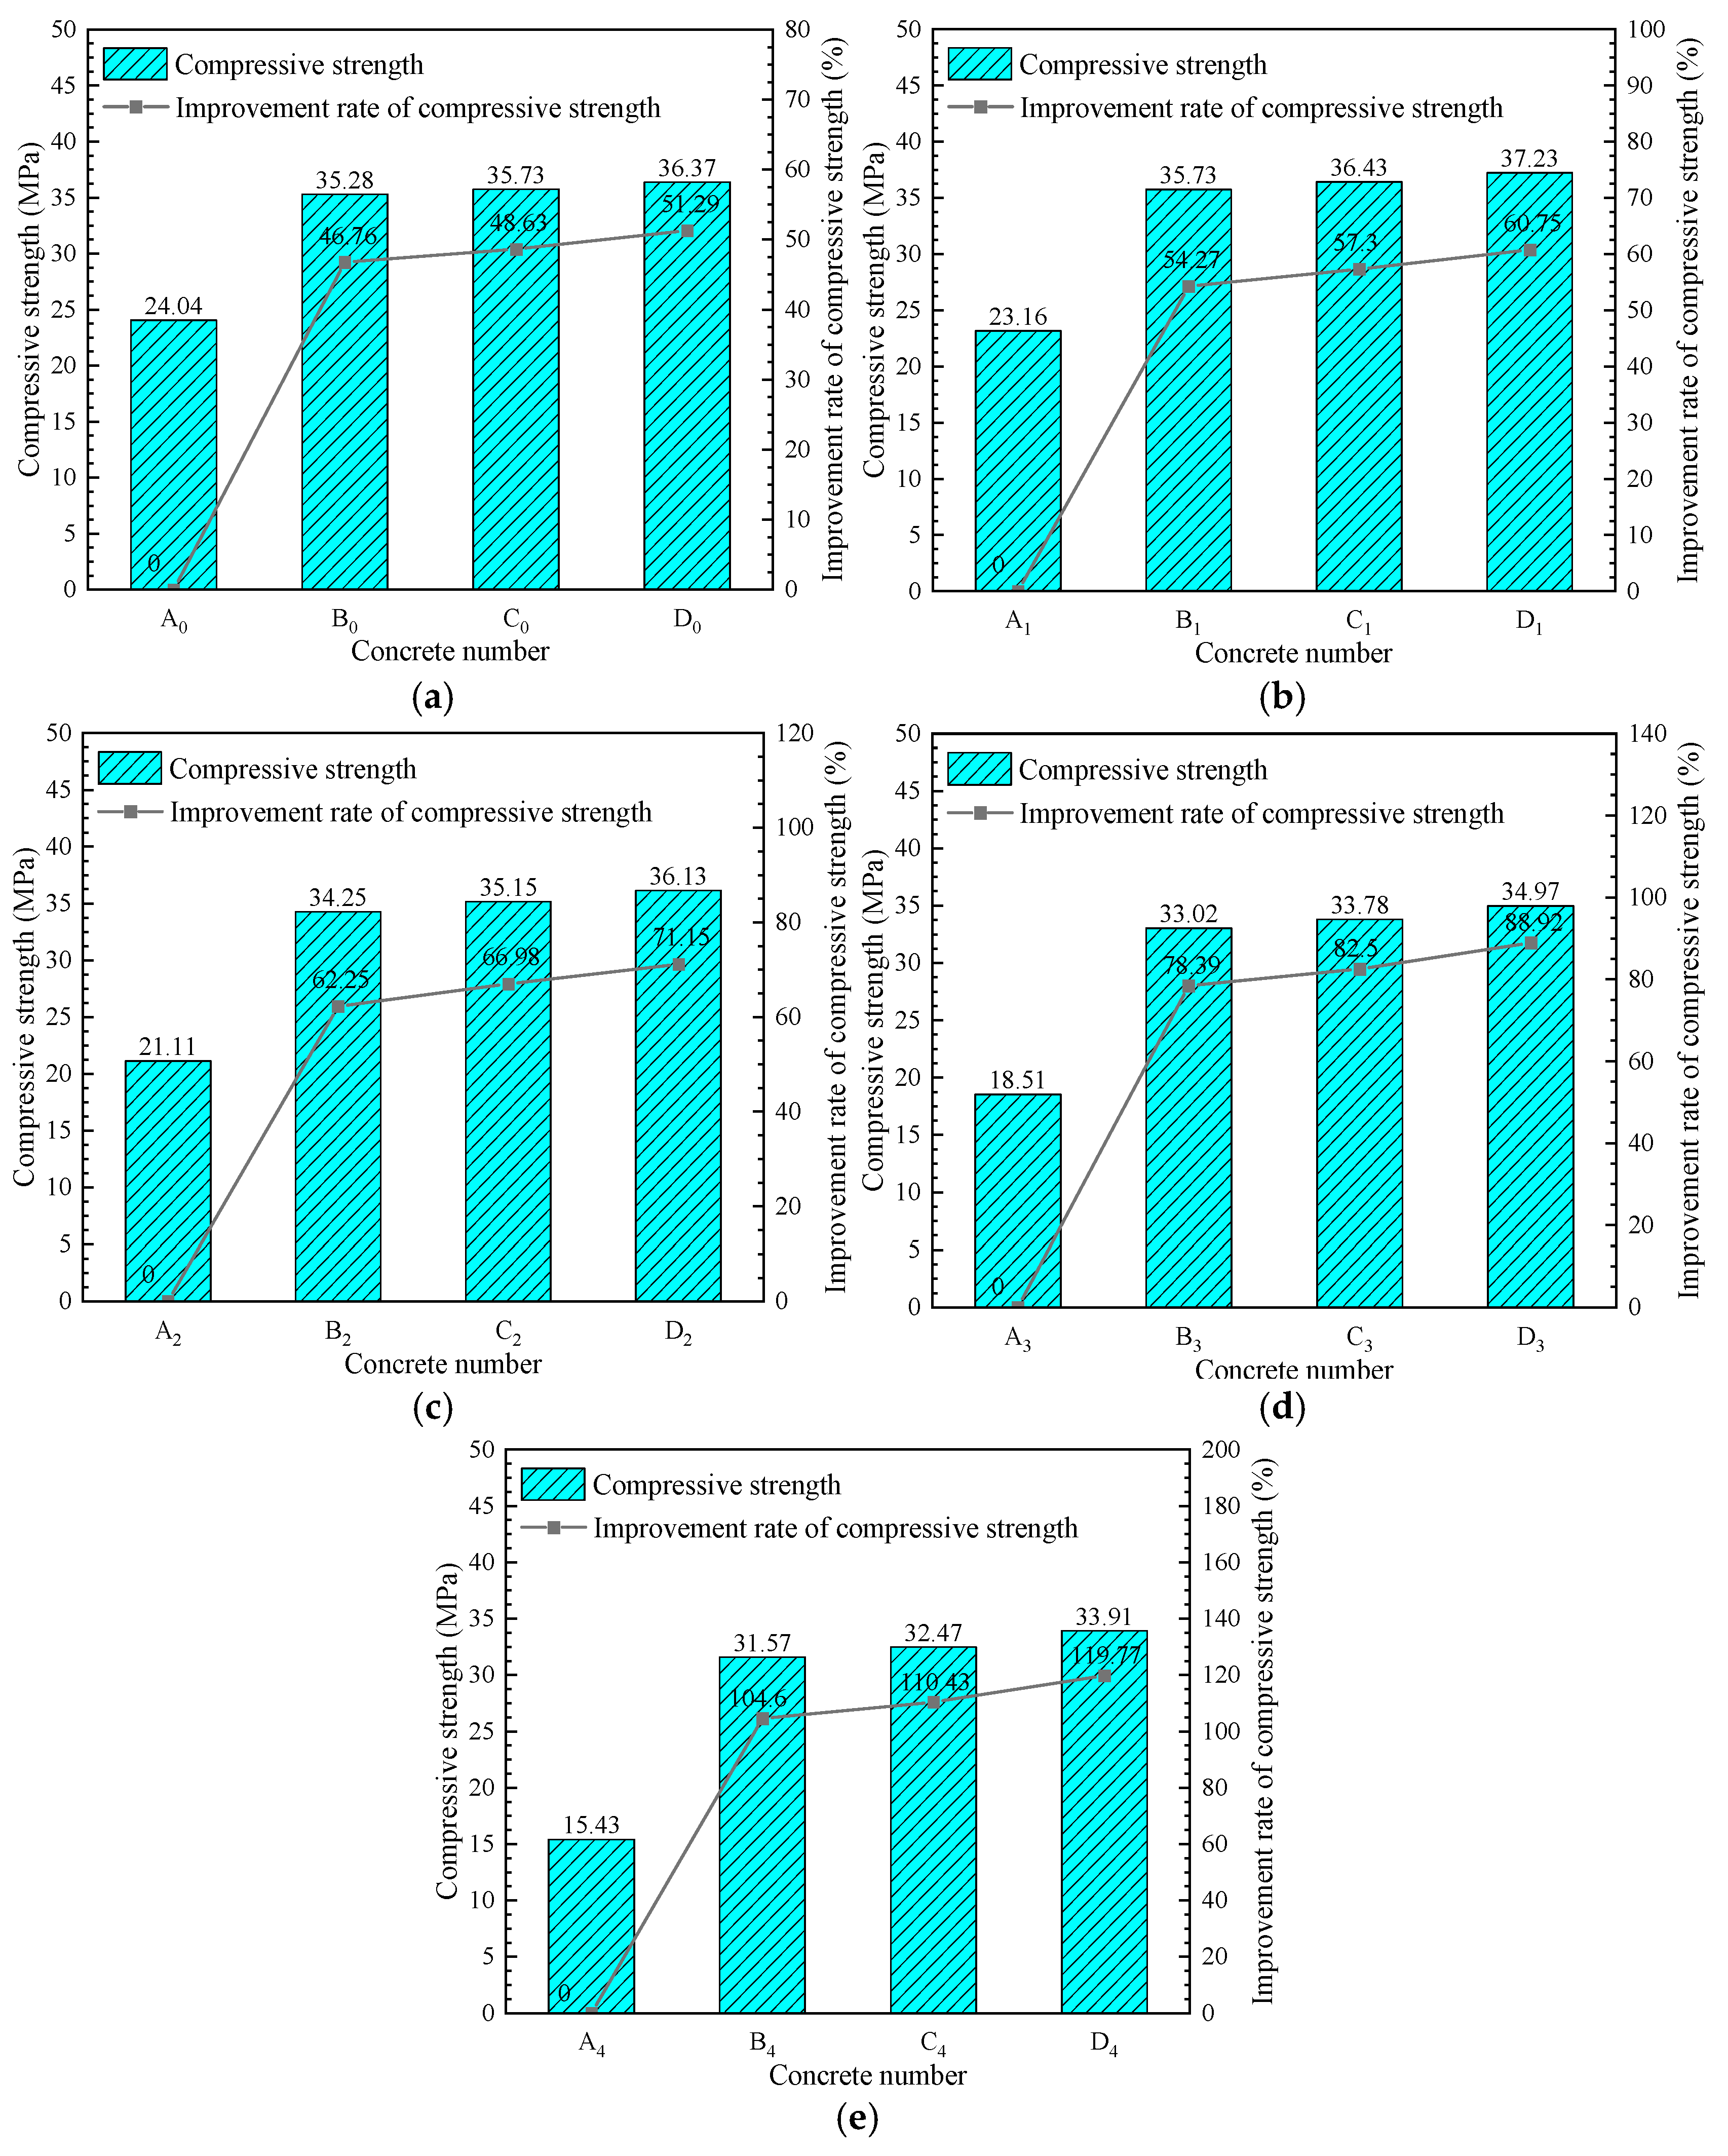
Significant improvements were observed in the compressive strength of specimens reinforced with sprayed GFEM.
Figure 12 illustrates the compressive strengths of the concrete in groups A, B, C, and D at 0, 25, 50, 75, and 100 freeze–thaw cycles, as well as the corresponding rate of compressive strength increase. As highlighted in
Figure 12, the compressive strength of A
0 was initially 24.04 MPa with no freeze–thaw cycles. Conversely, B
0, C
0, and D
0 exhibited compressive strengths of 35.28 MPa, 35.73 MPa, and 36.37 MPa, respectively, representing increases of 46.76%, 48.63%, and 51.29% compared to A
0. The reinforcing effect was significant. While a specific range of fibre doping resulted in a slight increase in compressive strength, the improvement was not substantial. Despite the freeze–thaw cycles, the concrete groups B, C, and D maintained higher compressive strengths than group A, with the enhancement rate gradually increasing. After 100 freeze–thaw cycles, A
4 was damaged, whereas B
4, C
4, and D
4 demonstrated good frost resistance, indicating that the reinforced concrete specimens exhibited excellent frost resistance and substantial reinforcing effects.
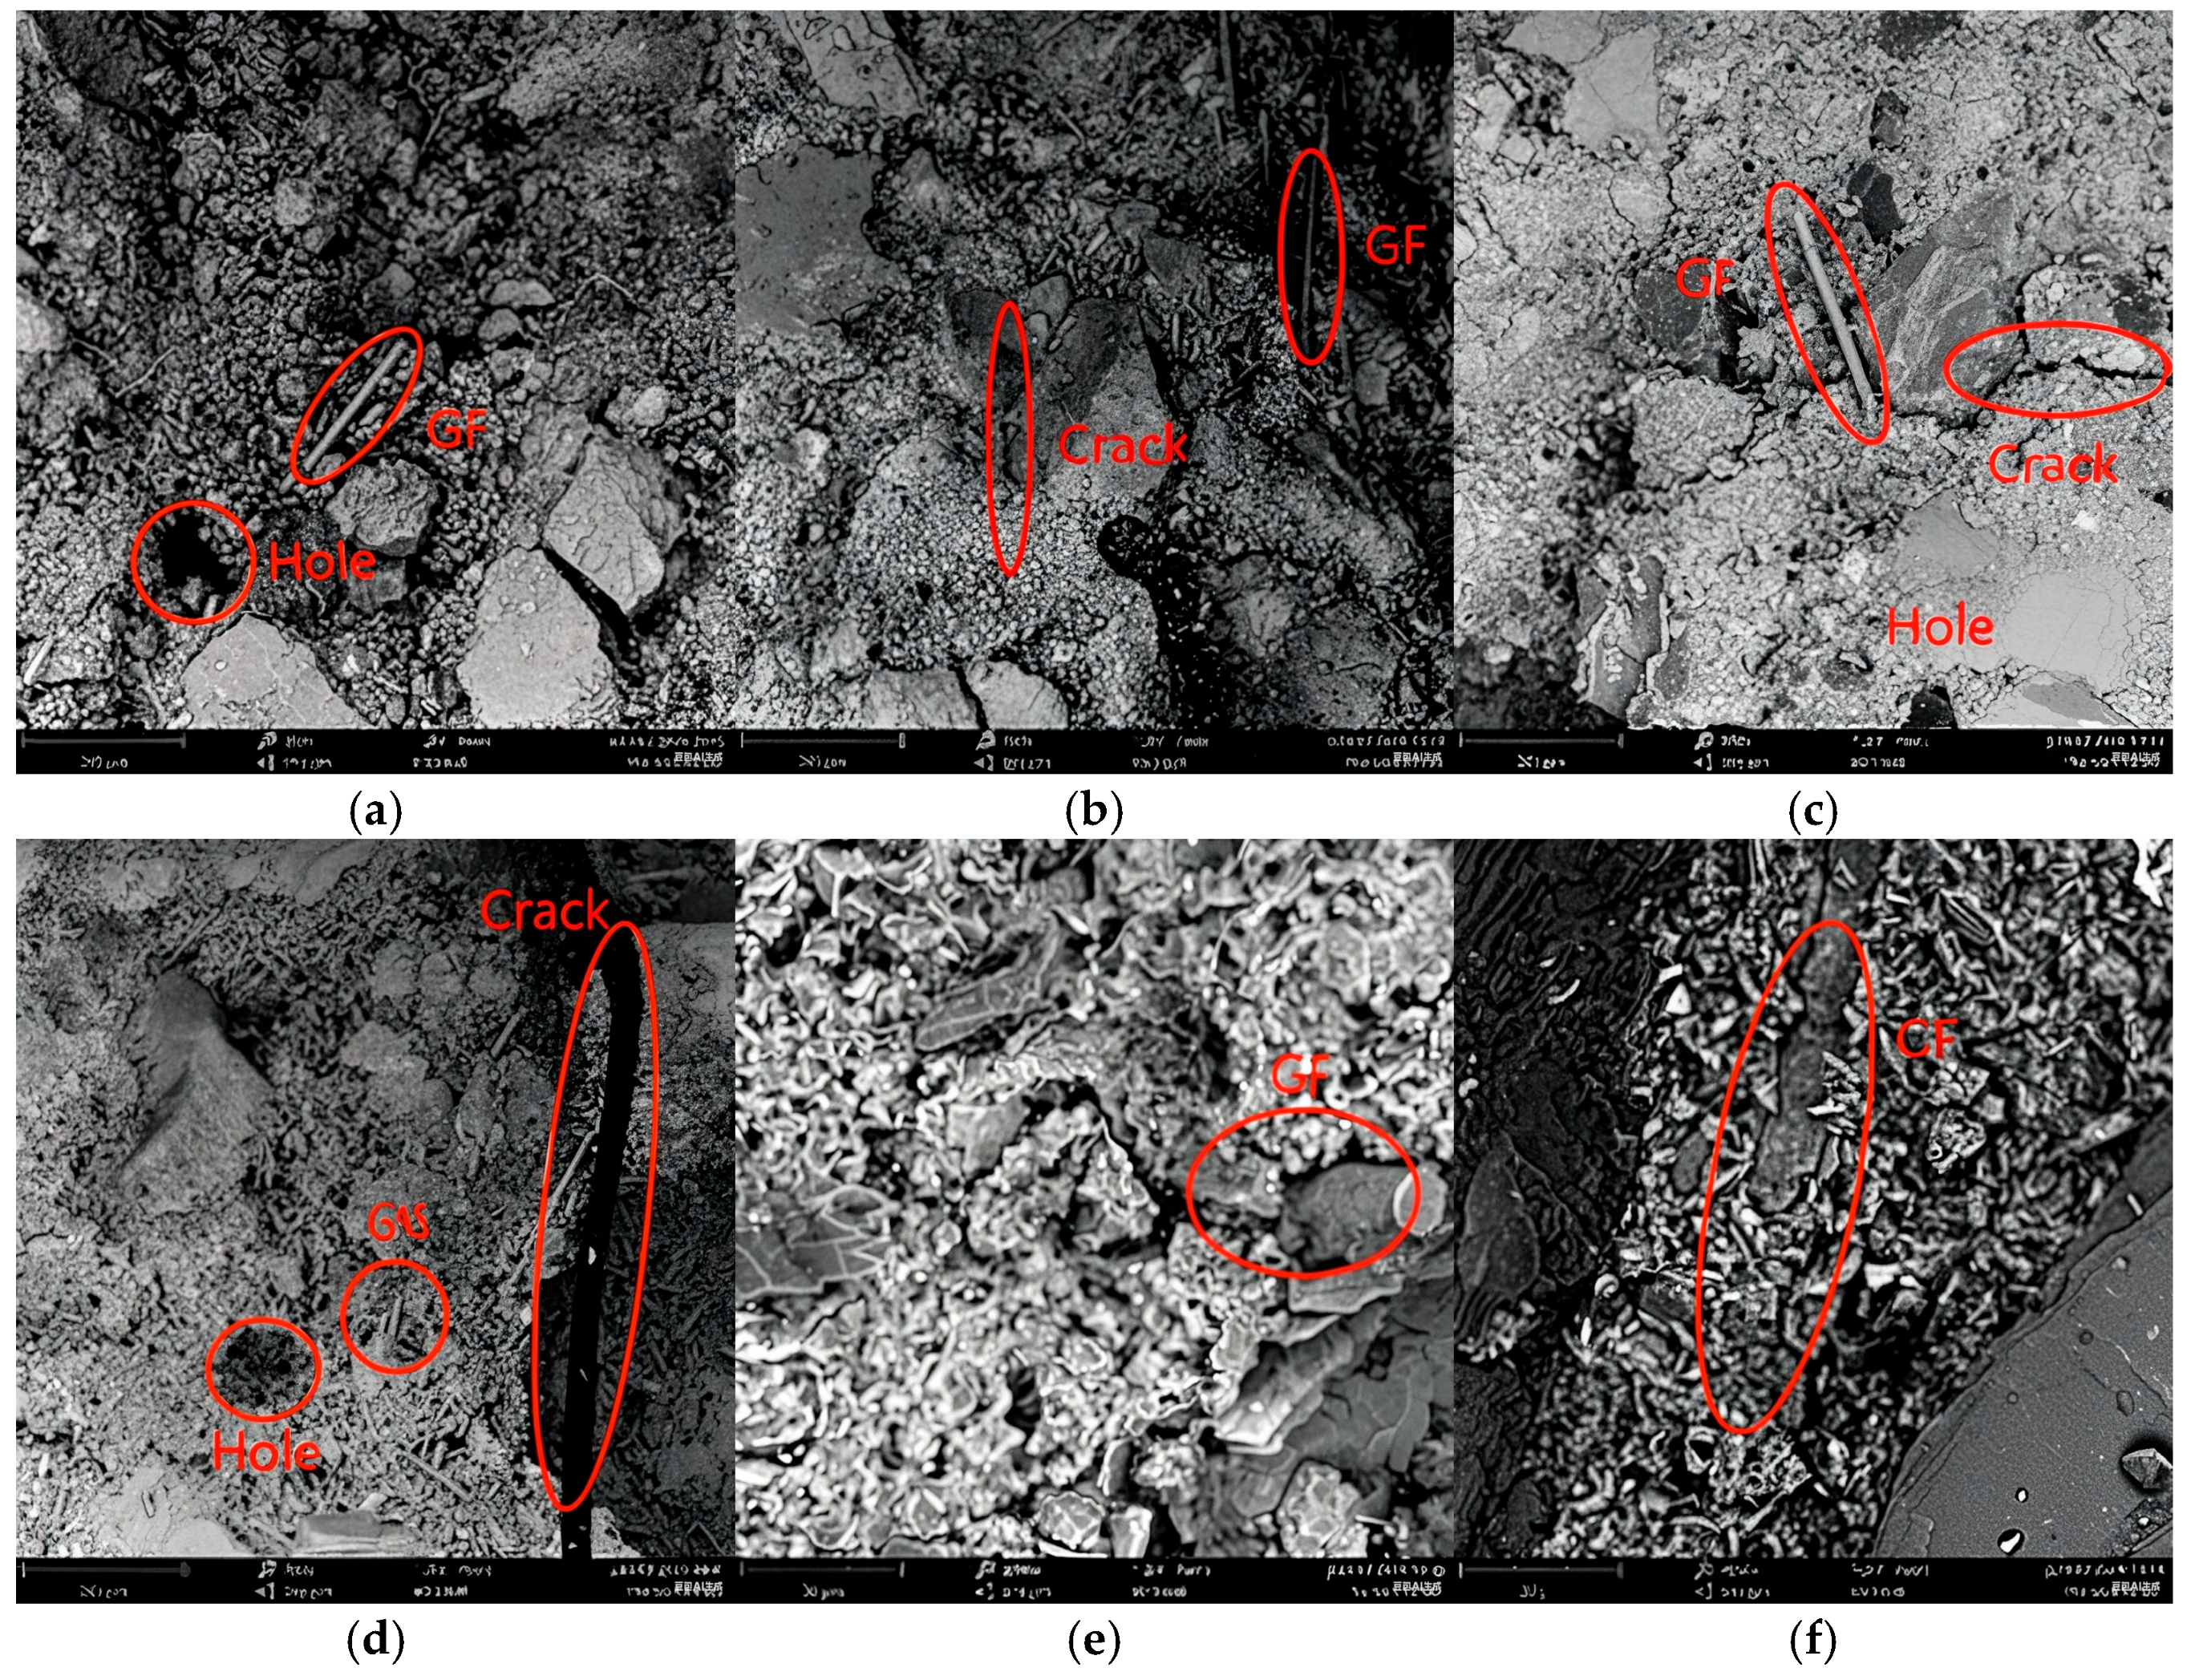
5. Microstructure Analysis
This paper uses the Phenom XL desktop scanning electron microscope produced by Funan Scientific Instruments (Shanghai) Co., Ltd. of Xi’an University of Technology to test the microstructure of concrete. The deterioration of the GFEM reinforcement in group B specimens after freeze–thaw cycles was analysed by SEM [
42], as shown in
Figure 14.
In
Figure 14a–d, it is evident that crack width increases progressively with the number of freeze–thaw cycles, causing internal structural damage within the reinforcement layer and weakening interfacial bonds. This degradation results in reduced strength of the reinforcement layer. The analysis attributes this phenomenon to freezing temperatures, where water within the reinforcement layer’s pores freezes, expands, and exerts pressure on the structure. With repeated freeze–thaw cycles, accumulated damage progressively compromises the reinforcement layer’s integrity, eventually leading to structural failure. The freeze–thaw environment induces osmotic pressure due to water freezing in pore spaces, further contributing to concrete reinforcement layer deterioration.
Figure 14e illustrates the condition prior to the onset of freeze–thaw cycles, revealing distinct layering and staggered hydration products within the reinforcement layer, with no apparent cracks or voids.
Figure 14f shows the result after 150 freeze–thaw cycles, where fibre surfaces are enveloped in dense mortar, integrating seamlessly with other components. This consolidation enhances the stability and integrity of the reinforcement layer.
In summary, the glass fibre has a certain crack-blocking and toughening capacity. In the reinforced layer structure, the glass fibre plays a “reinforcing” role, effectively enhancing the tensile strength of the reinforced layer and frost resistance.


 ,
, 
