
Reducing Cooling Energy Demand in Saudi Arabian Residential Buildings Using Passive Design Approaches


Abstract
1. Introduction
1.1. Passive Cooling and Causes for Overheating in Buildings
1.2. Climate, Design & Energy Efficiency in Saudi Arabian Residential Buildings
1.3. Analysis and Framework for a Typical Saudi Arabian Villa
1.4. Energy Efficiency in the Region
1.5. Energy-Efficient Projects Within the Region
1.6. Research Objectives and Novelty
- Evaluate how typical Saudi residential villas perform under current and future climatic conditions.
- Assess the effectiveness of various passive and retrofit strategies- including envelope insulation, window-to-wall ratio adjustments, shading, and wind-towers, individually and in combination.
- Determine which combinations yield the most significant cooling energy reductions.
- Compare the energy performance of a standard (base-case) villa to a redesigned model (such that it could be retrofitted) in both present and future climate scenarios.
2. Methodology
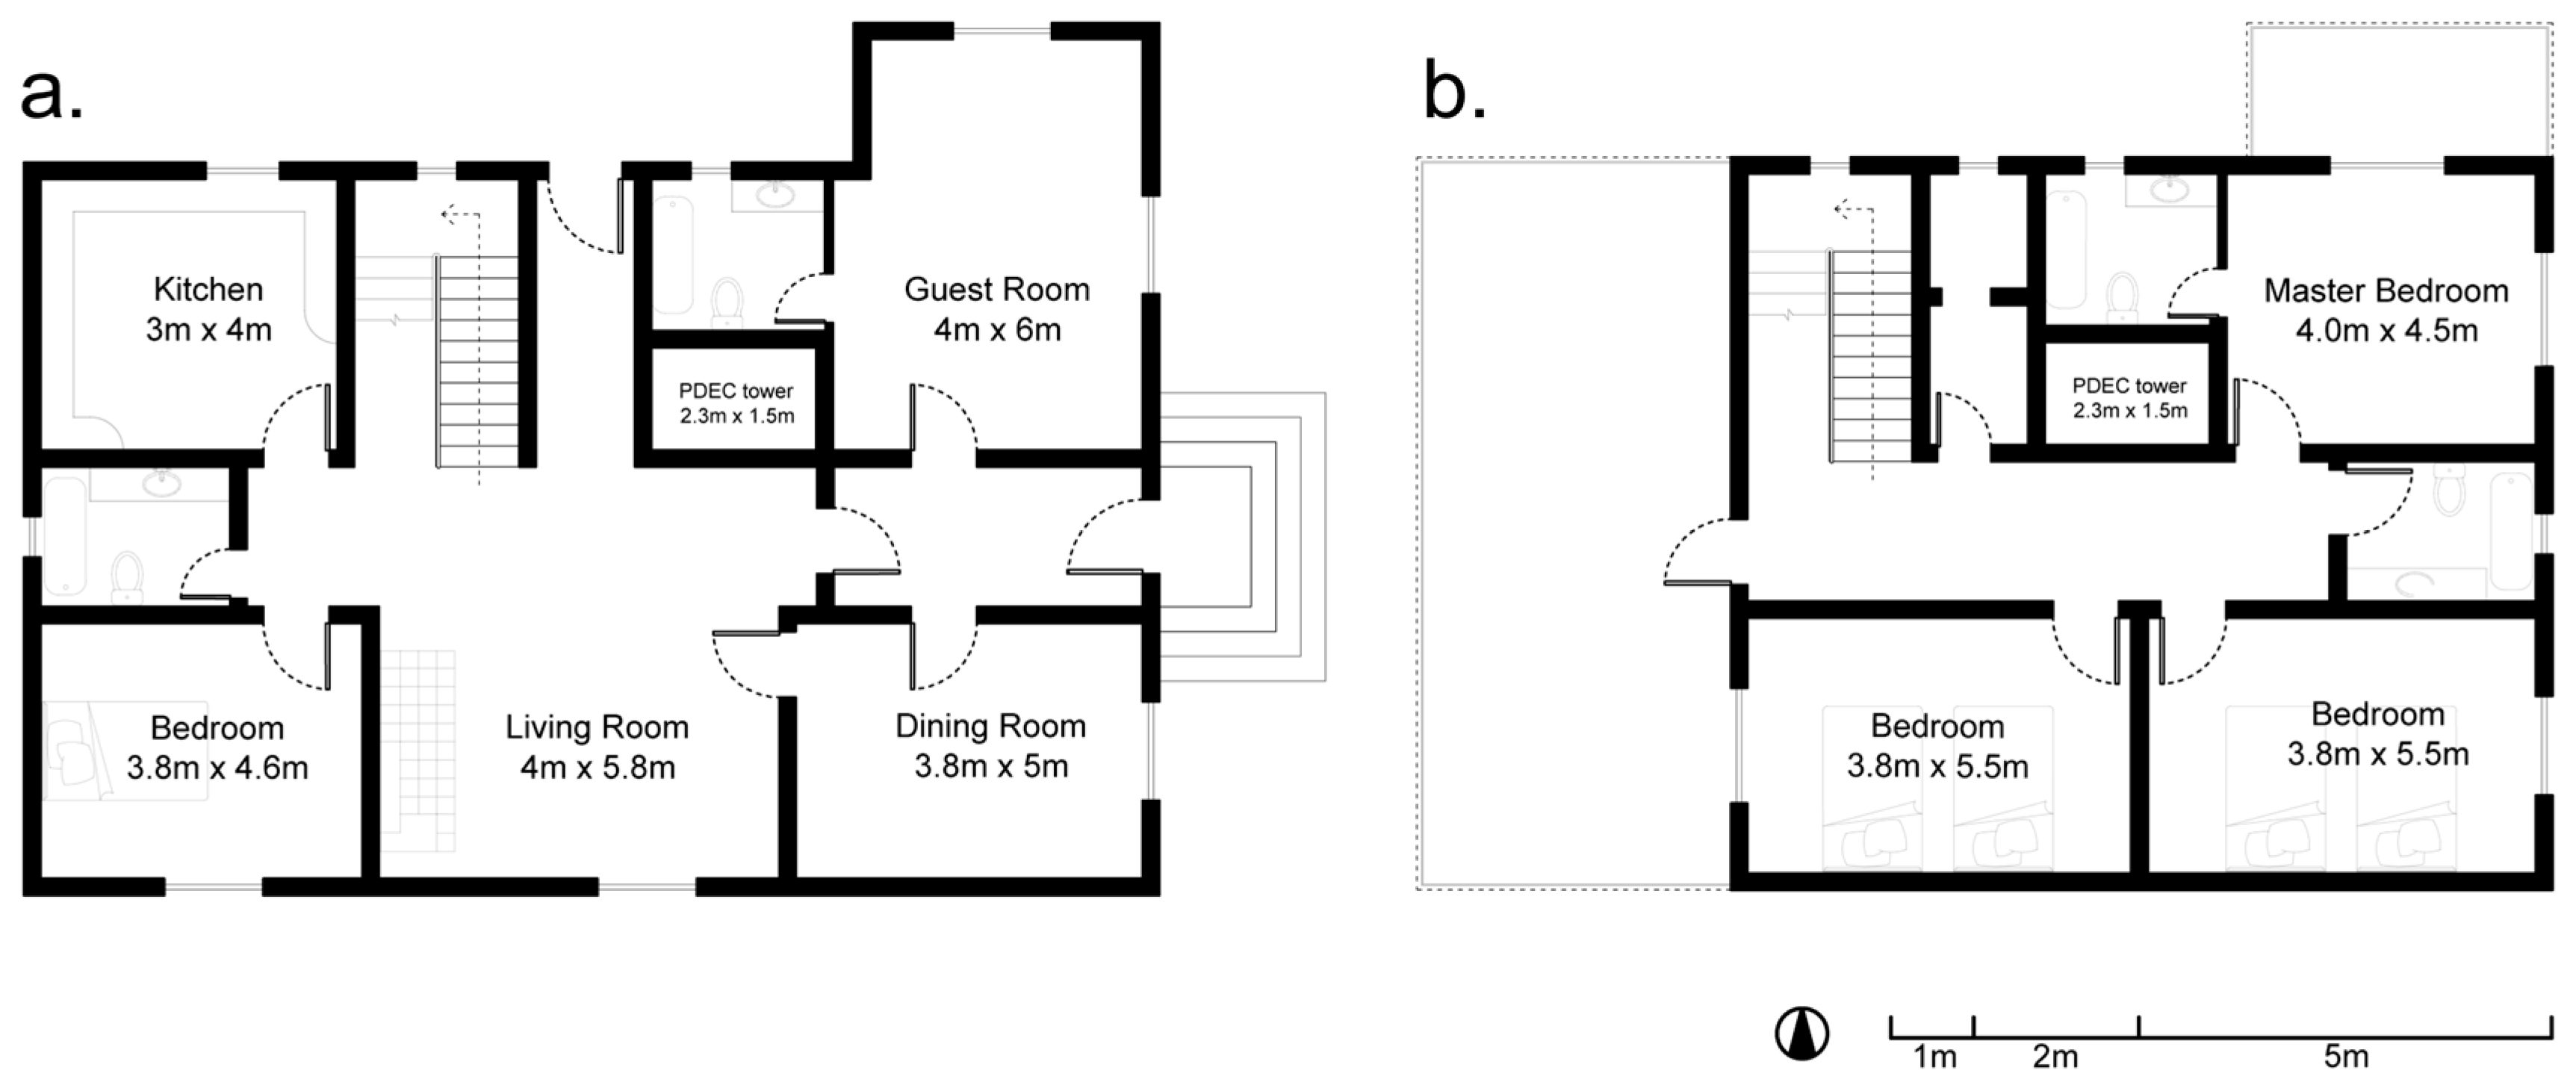
2.1. Modelled Typical Villa
2.2. Assumptions
- Although travel restrictions limit direct access to a typical Saudi villa, it is generally acknowledged that residential buildings in Saudi Arabia exhibit moderate infiltration rates. A previous study assumed an Air Changes per Hour (ACH) of 0.7 [78].
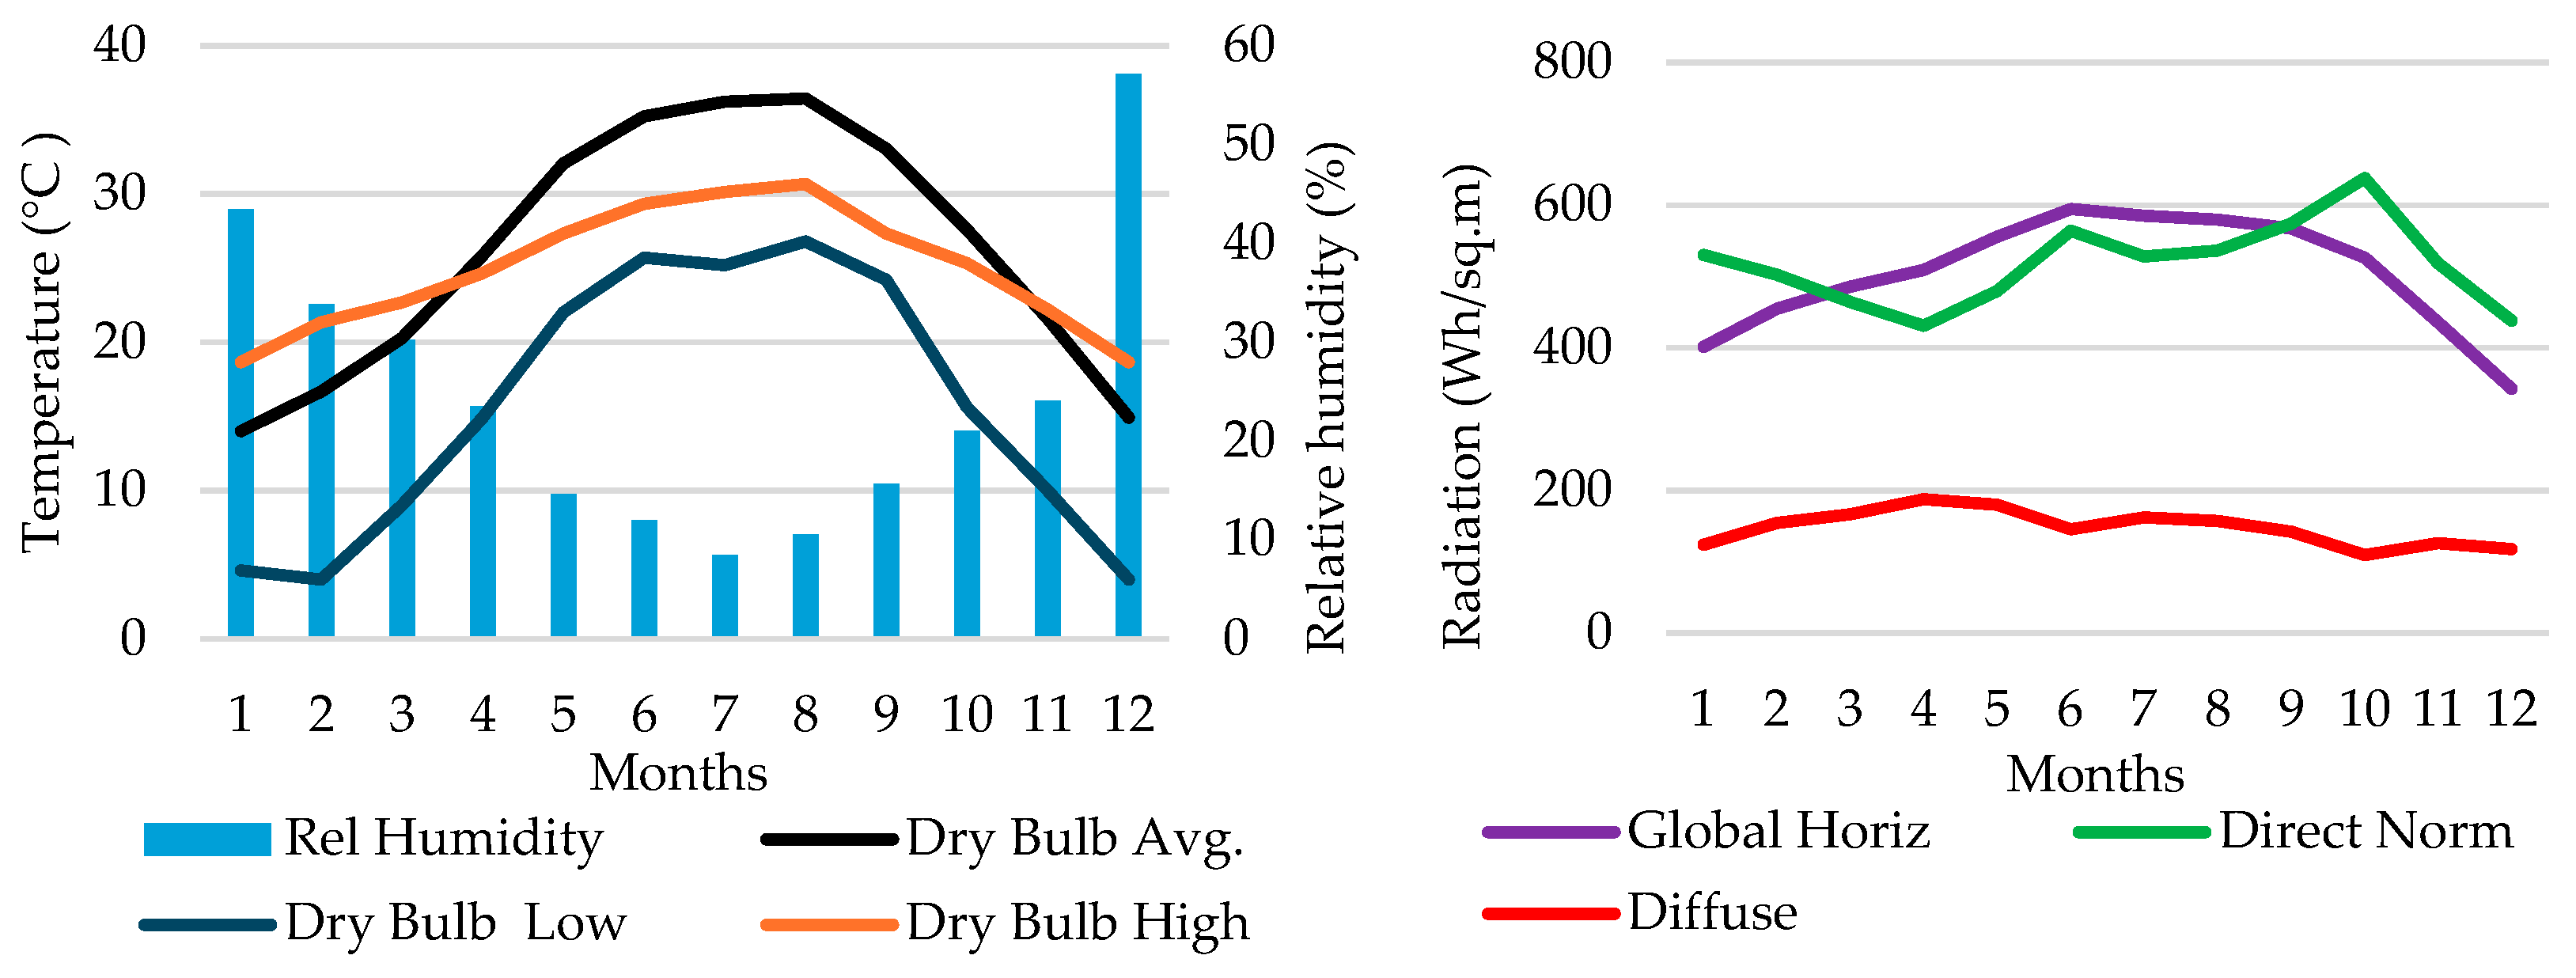
- Weather files (EPW) used for testing were based in Riyadh Airport. The chosen EPW file was morphed using CCWeatherGen [79], generating prospective weather conditions based on the climate change projections from 2002 [80]. This facilitated testing parameters against current, as well as future scenarios (2050 and 2080).
- Winter clothing levels were assigned a value of 1, while summer clothing levels received a value of 0.5.

| During Weekdays: Hours in the Day | ||||||||||||||||||||||||
|---|---|---|---|---|---|---|---|---|---|---|---|---|---|---|---|---|---|---|---|---|---|---|---|---|
| Rooms | 0 | 1 | 2 | 3 | 4 | 5 | 6 | 7 | 8 | 9 | 10 | 11 | 12 | 13 | 14 | 15 | 16 | 17 | 18 | 19 | 20 | 21 | 22 | 23 |
| Kitchen | ||||||||||||||||||||||||
| Guest | ||||||||||||||||||||||||
| Dining | ||||||||||||||||||||||||
| Living | ||||||||||||||||||||||||
| Bedroom | ||||||||||||||||||||||||
| Empty 1 | ||||||||||||||||||||||||
| During Weekends: hours in the day | ||||||||||||||||||||||||
| Rooms | 0 | 1 | 2 | 3 | 4 | 5 | 6 | 7 | 8 | 9 | 10 | 11 | 12 | 13 | 14 | 15 | 16 | 17 | 18 | 19 | 20 | 21 | 22 | 23 |
| Kitchen | ||||||||||||||||||||||||
| Guest | ||||||||||||||||||||||||
| Dining | ||||||||||||||||||||||||
| Living | ||||||||||||||||||||||||
| Bedroom | ||||||||||||||||||||||||
| Empty 1 | ||||||||||||||||||||||||
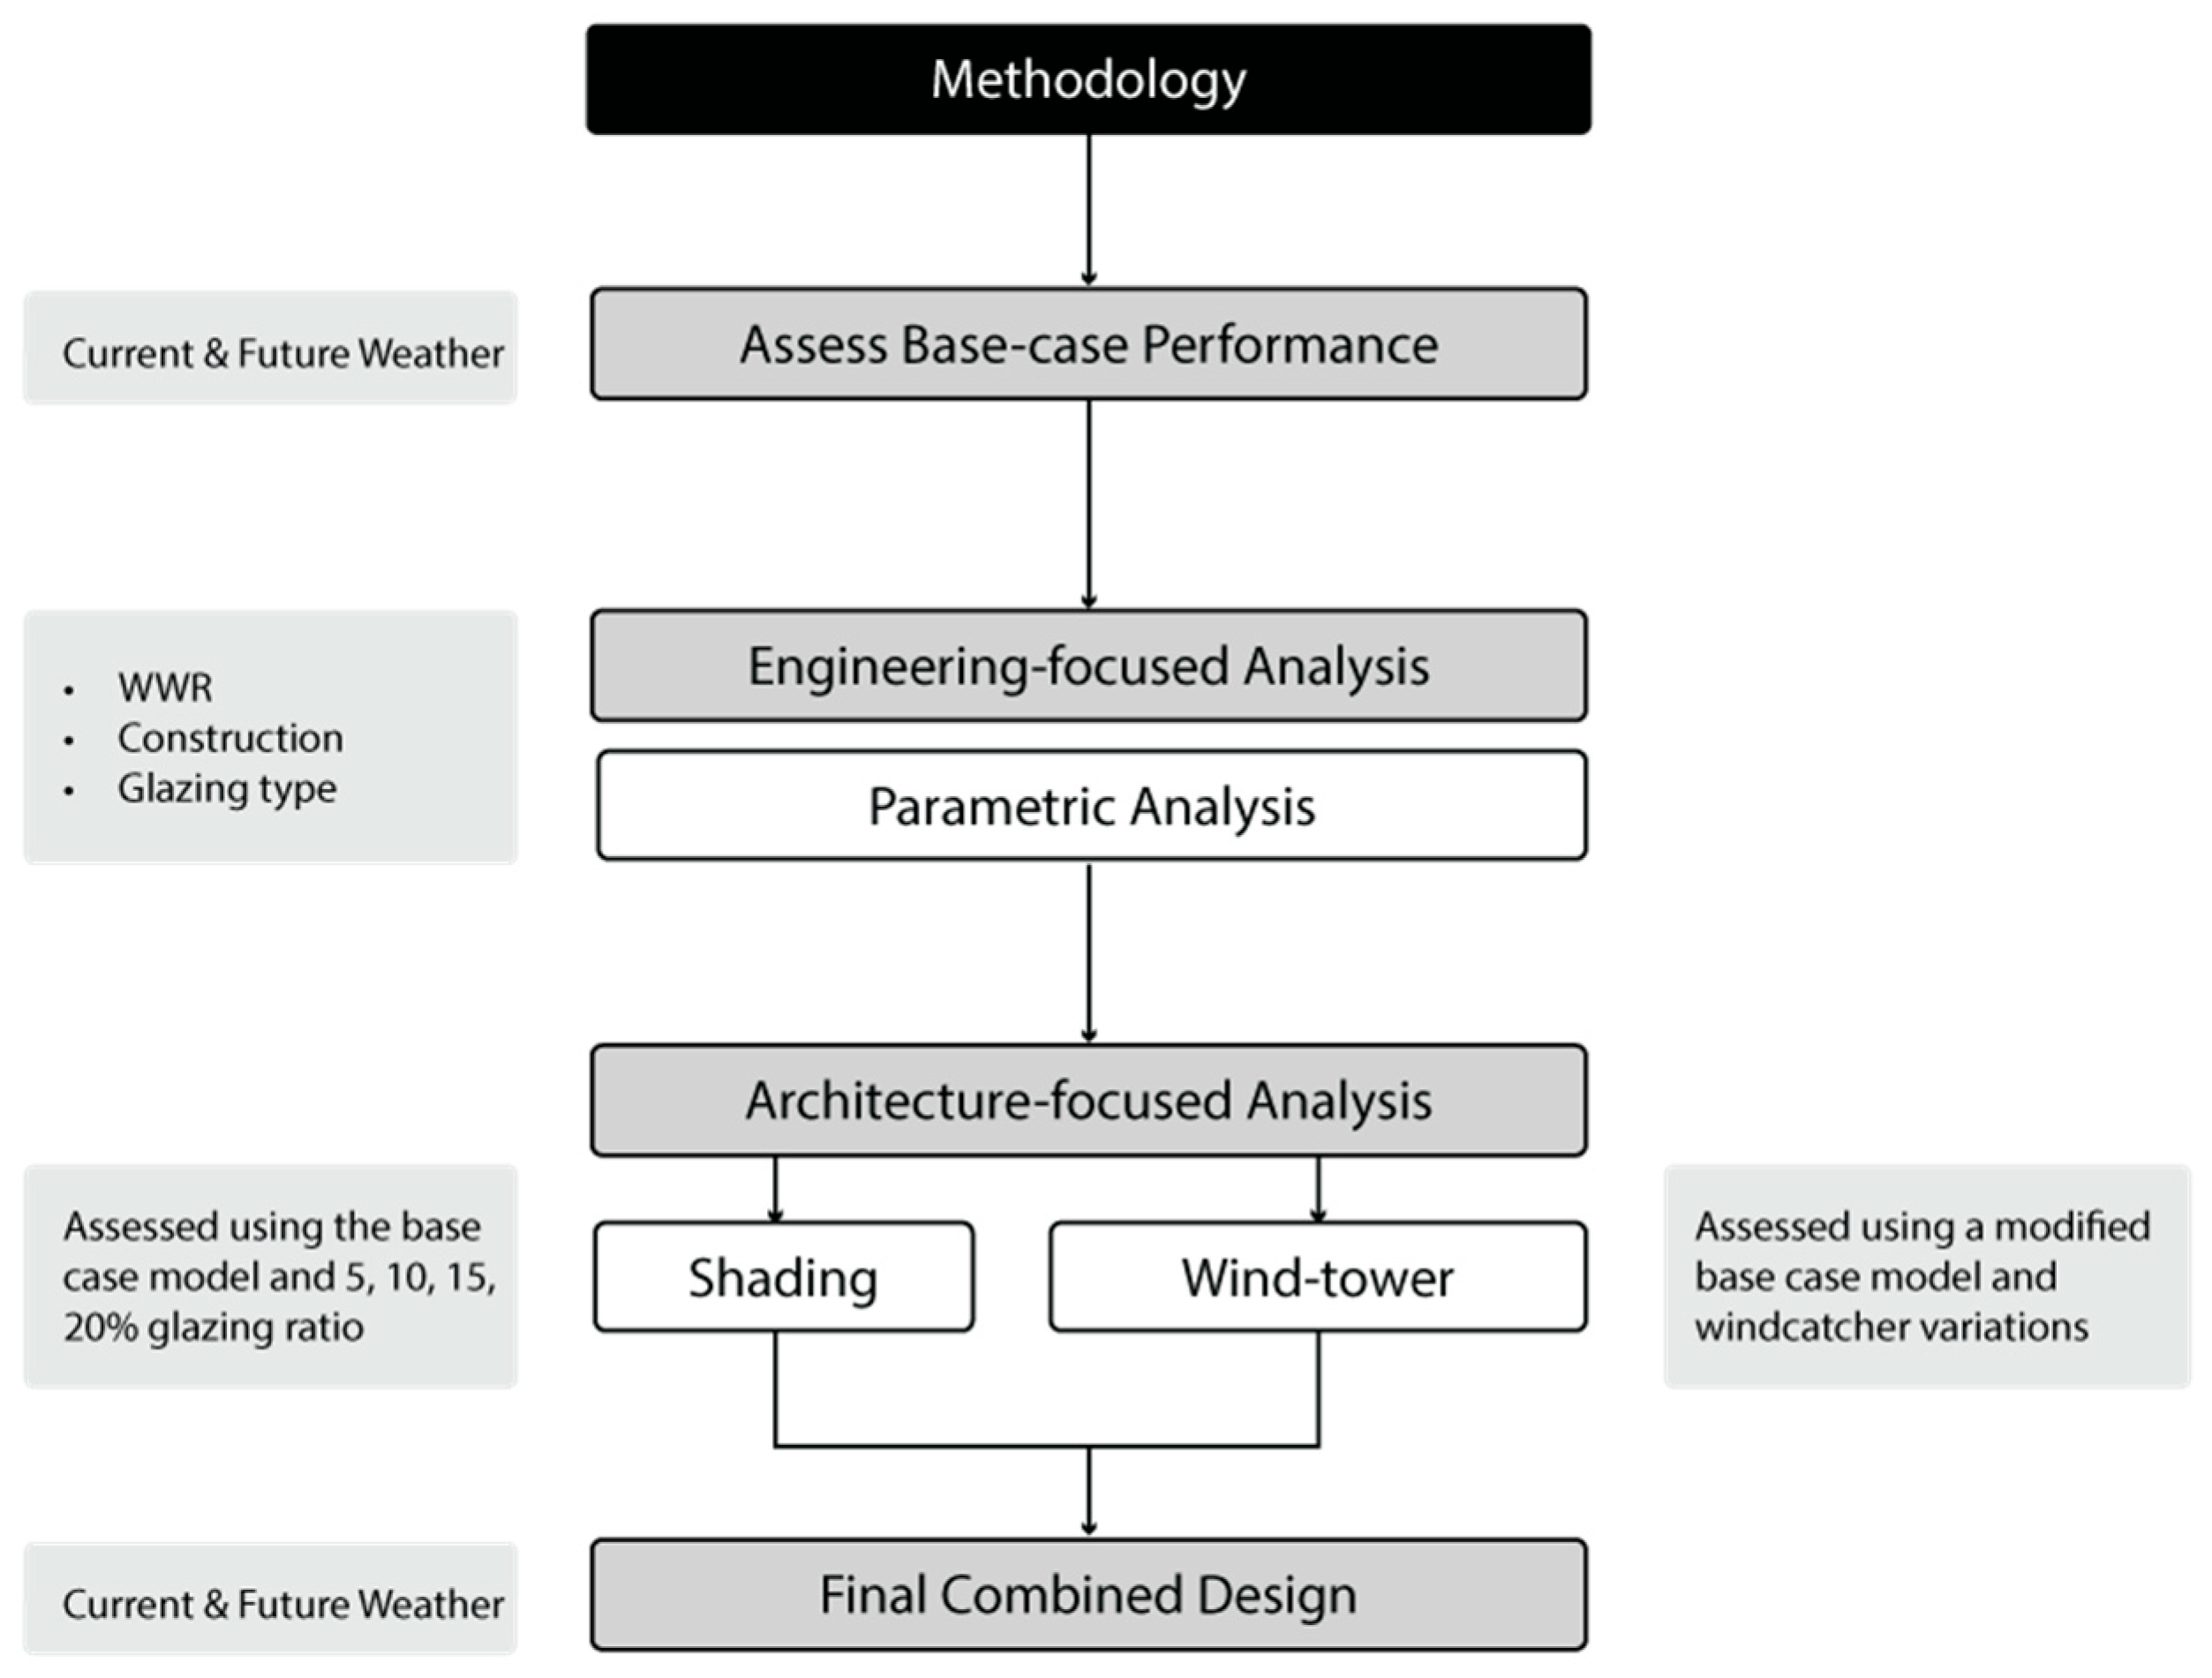
2.3. Framework: Overview of Testing Strategy
- Baseline Performance Assessment: Evaluation of the base case villa under both current and future weather conditions.
- Engineering-focused analysis: Simulation of envelope components, including glazing, wall construction, and WWR.
- Architectural-focused analysis: Testing of passive cooling features like shading and wind towers.
- Synthesized Retrofit Design: Integration of the highest-performing strategies into a redesigned model, tested for both present-day and future climatic scenarios.
2.4. Villa Simulated Base-Case Analysis (Typical Dwelling)
3. Parametric Analysis via Engineering Parameters
3.1. Input Parameters & Simulation Matrix
3.2. Results and Analysis
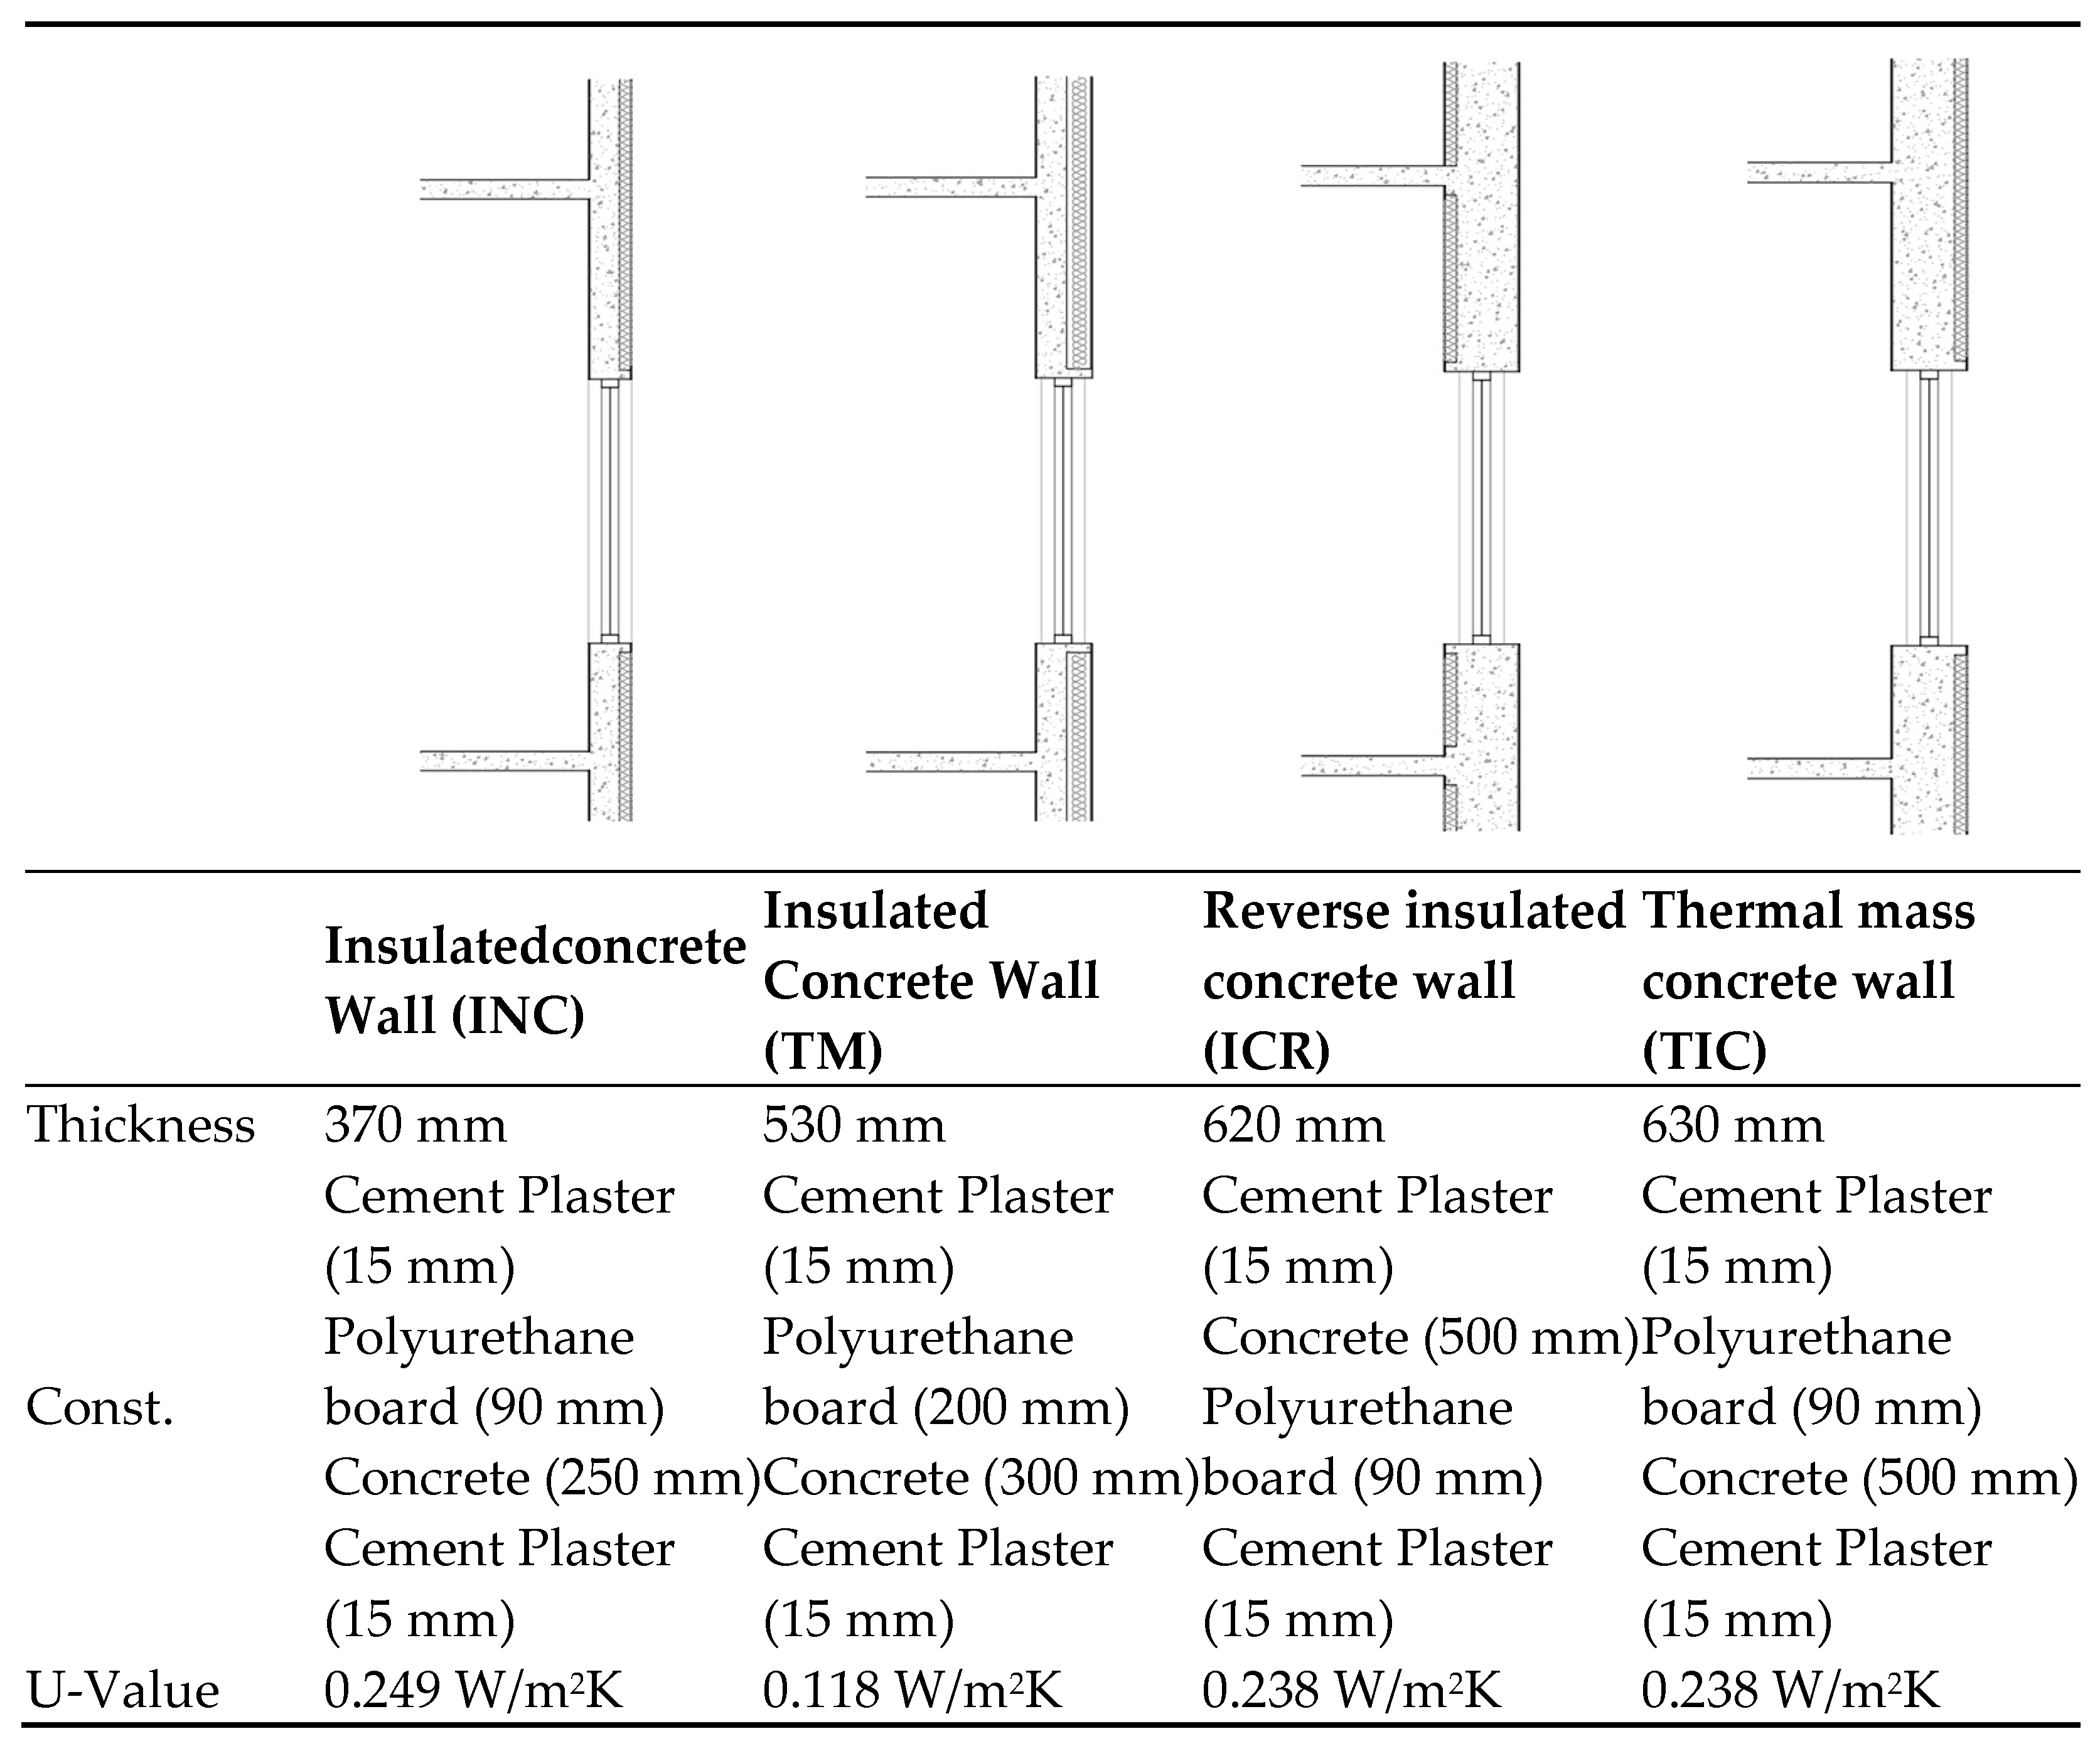
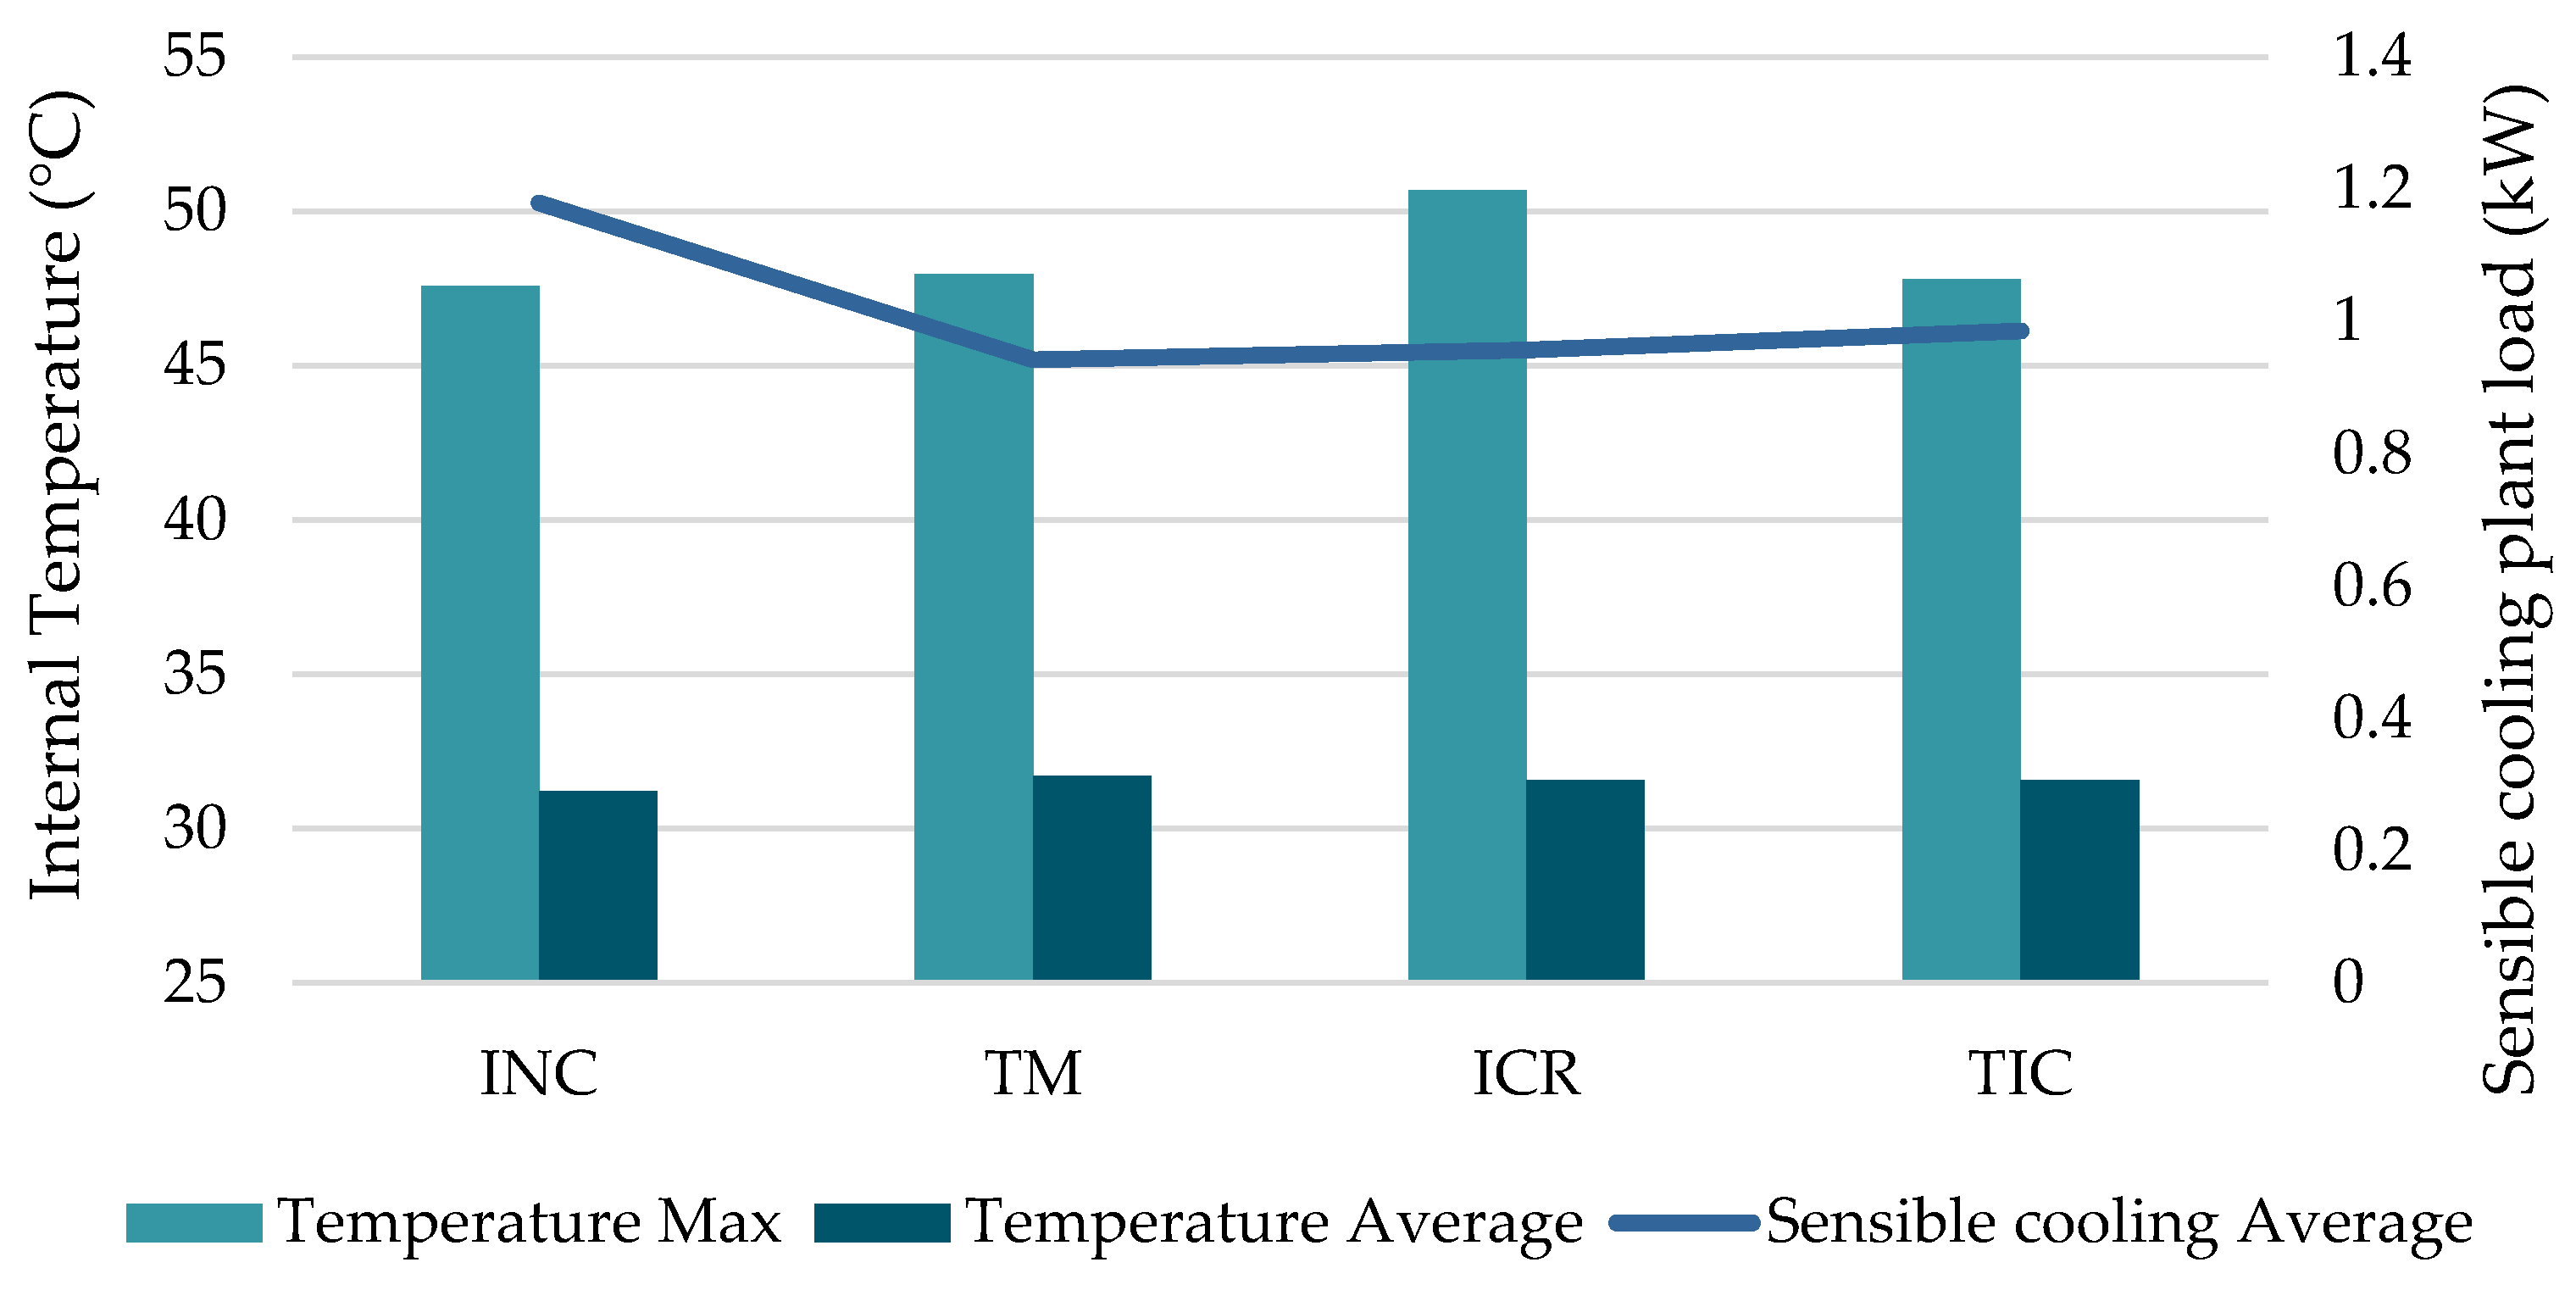
3.2.1. Evaluating Building Fabric
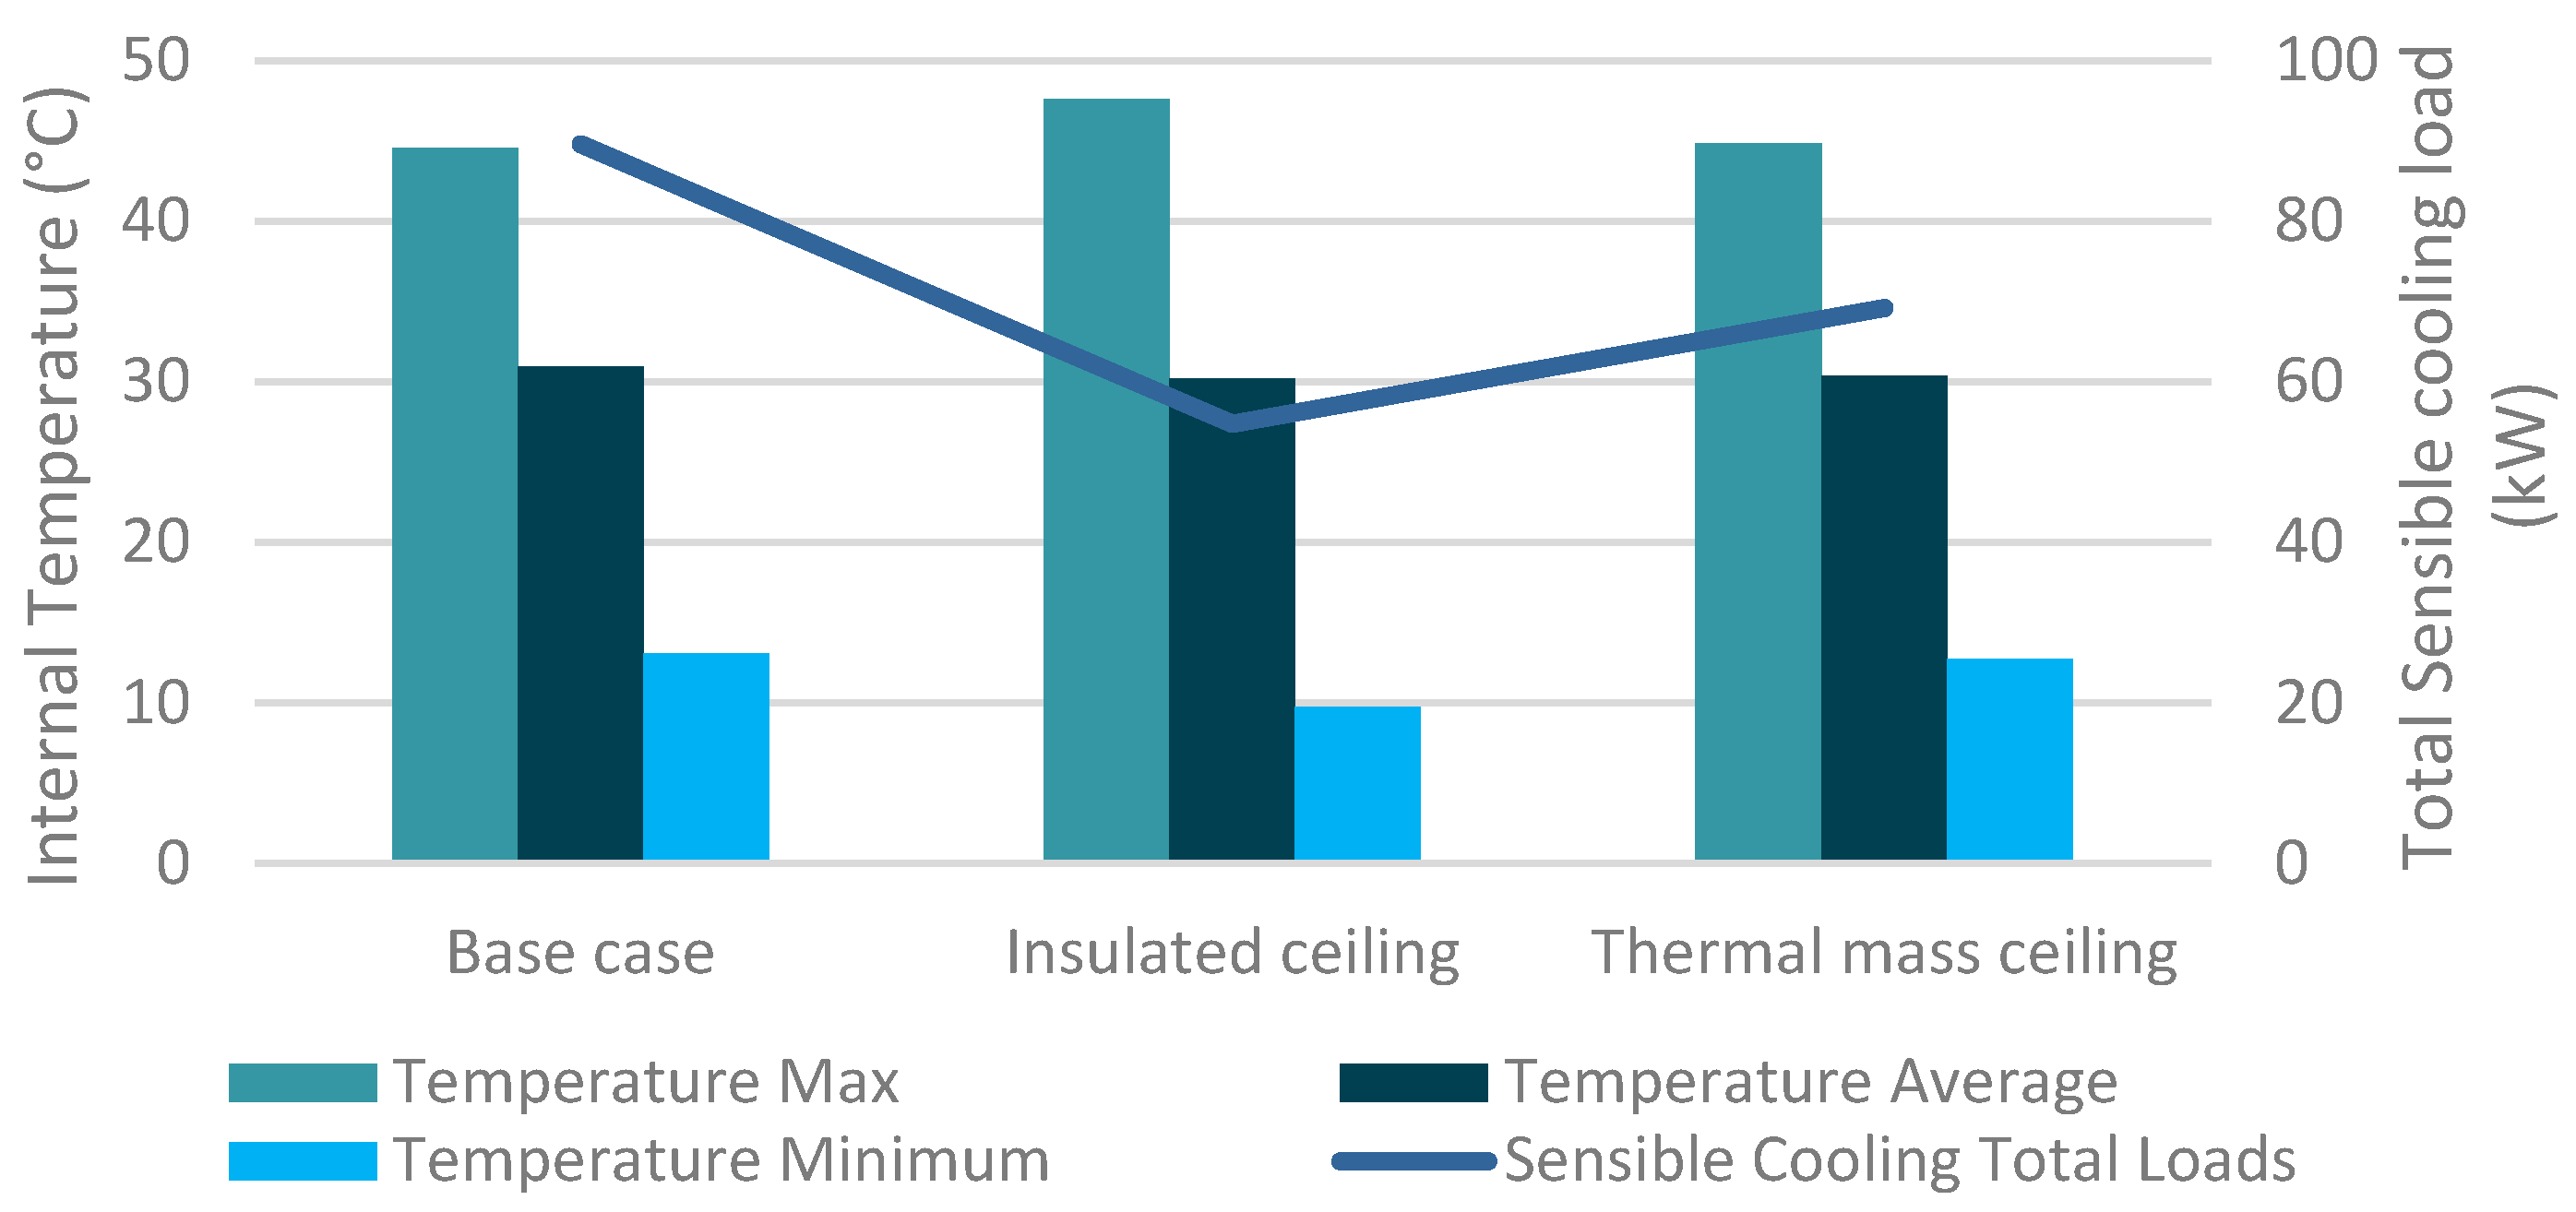
3.2.2. Evaluating Ceiling Performance
4. Parametric Analysis via Architectural Parameters
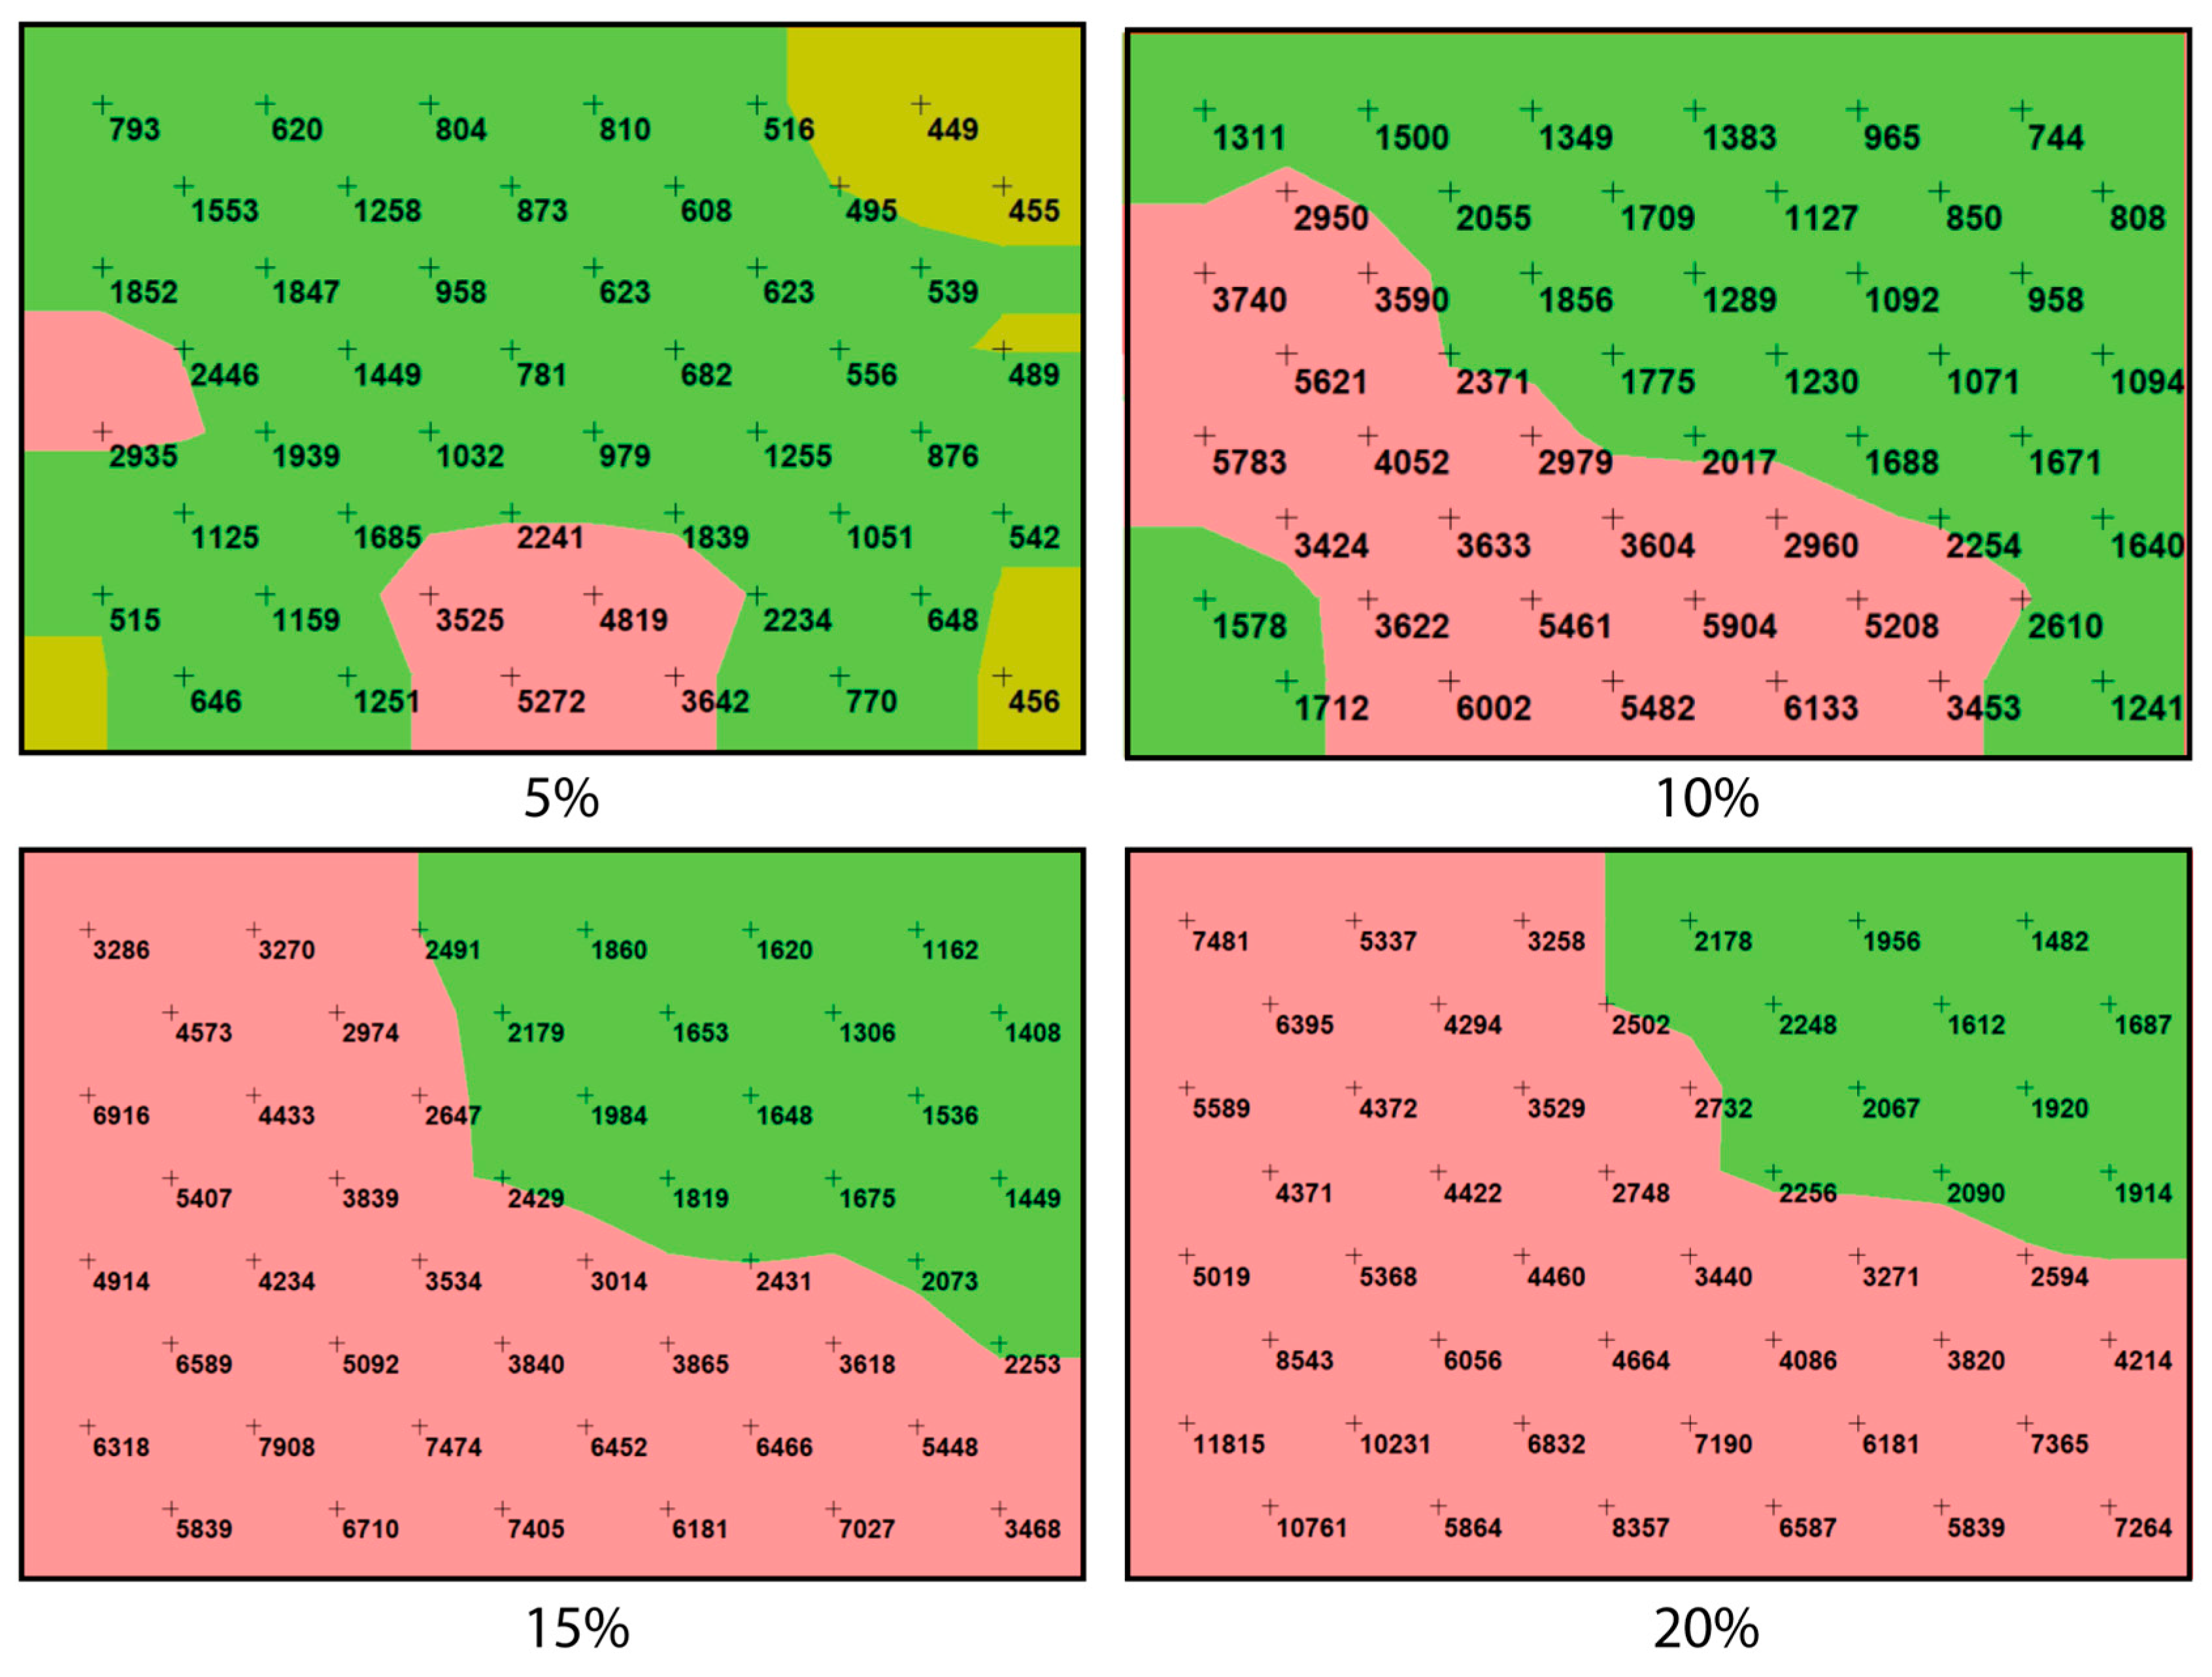
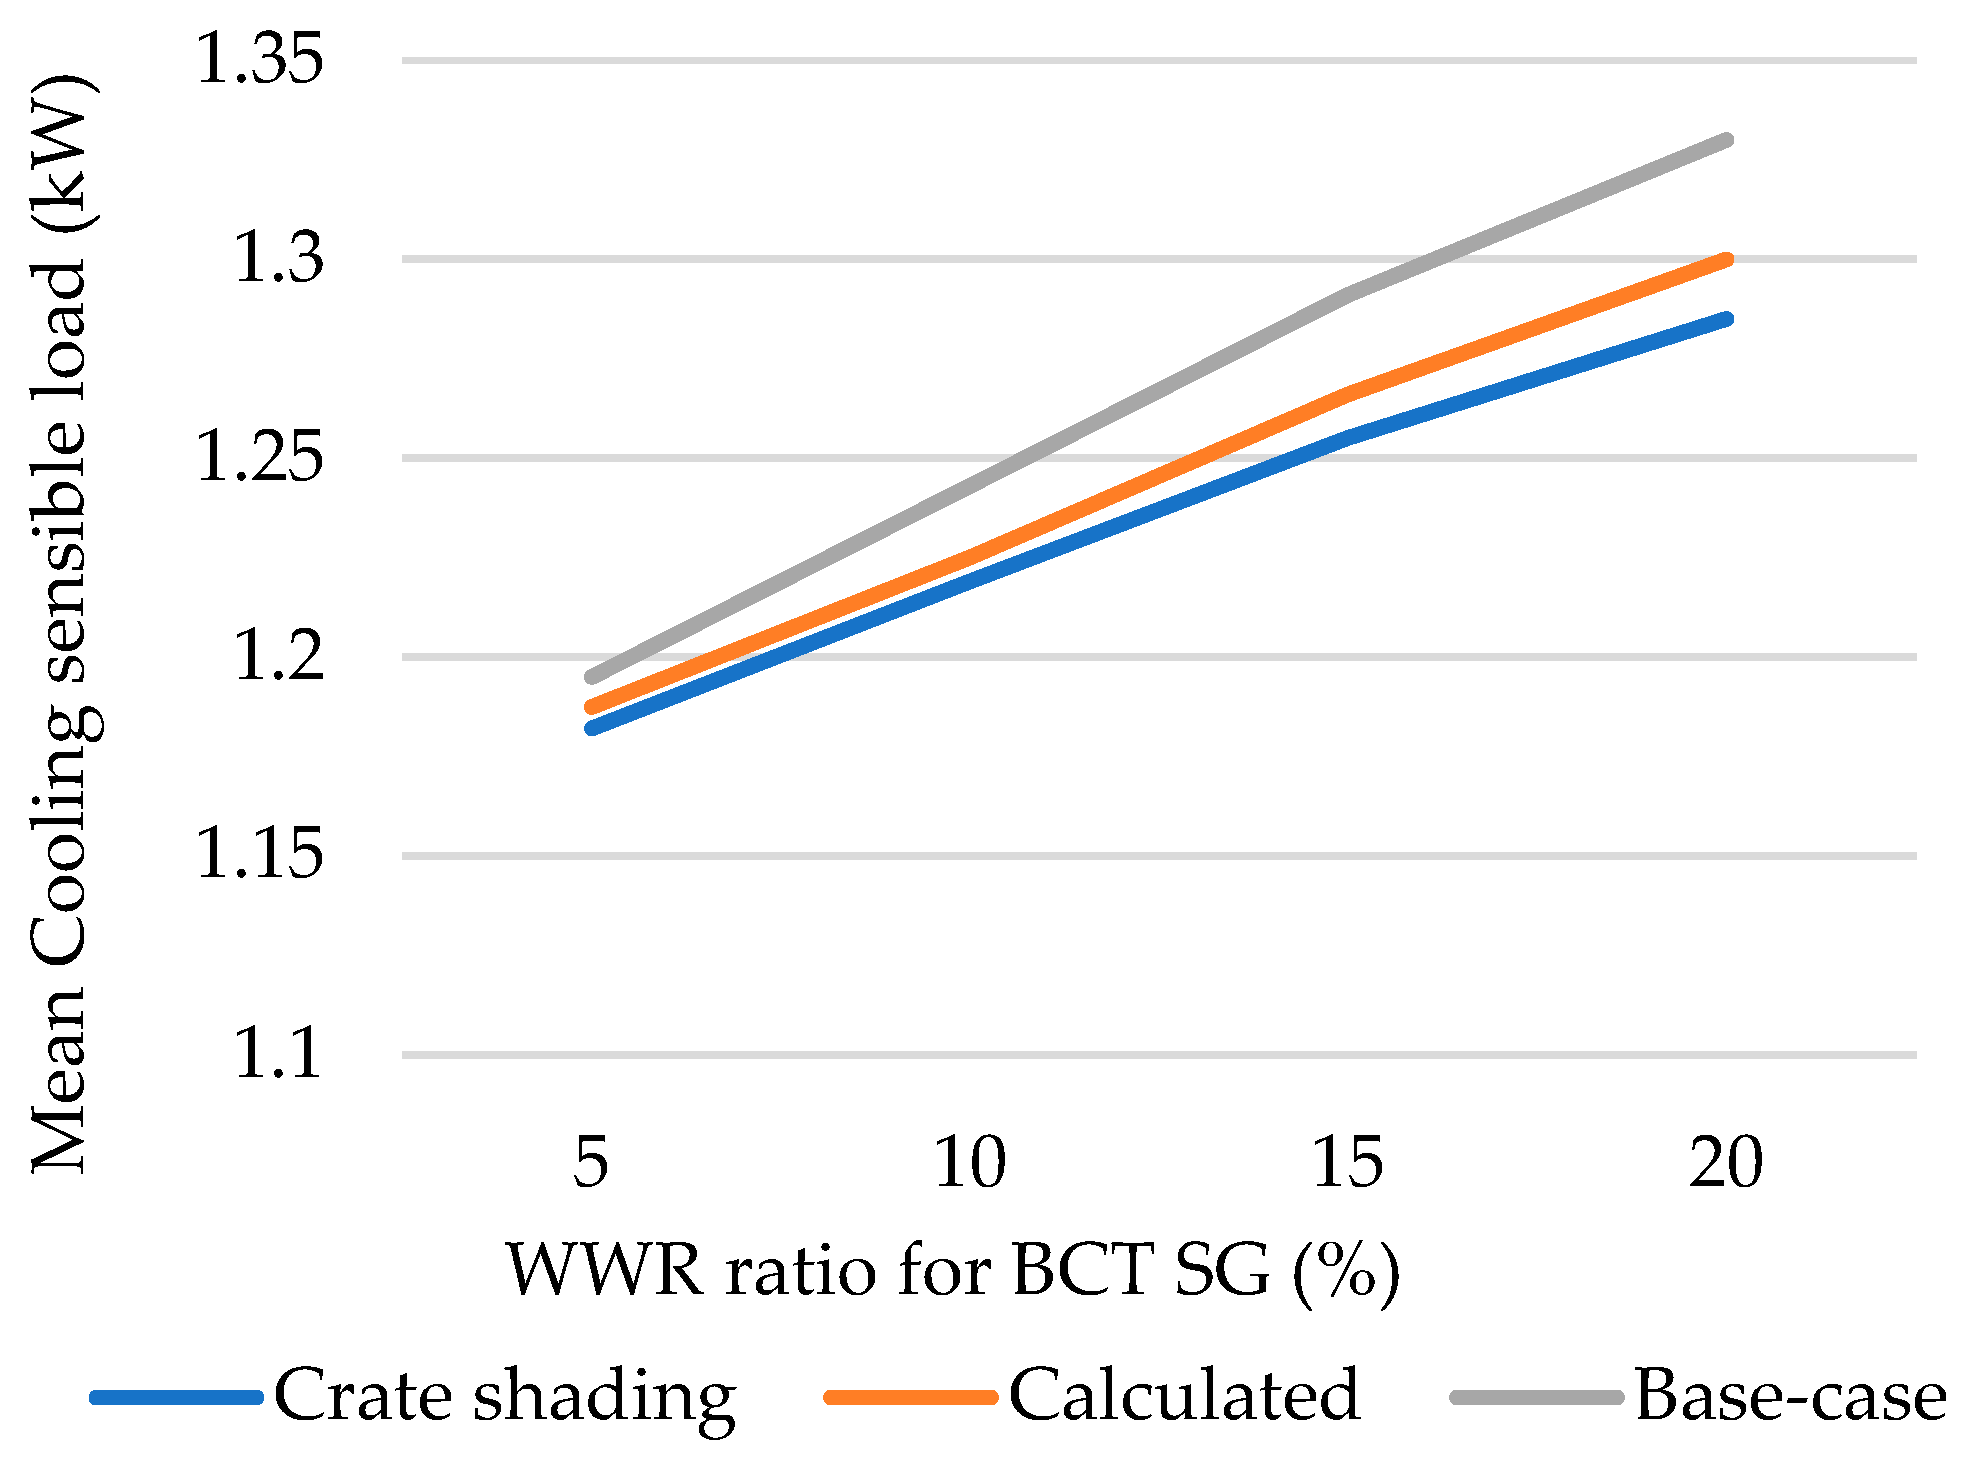
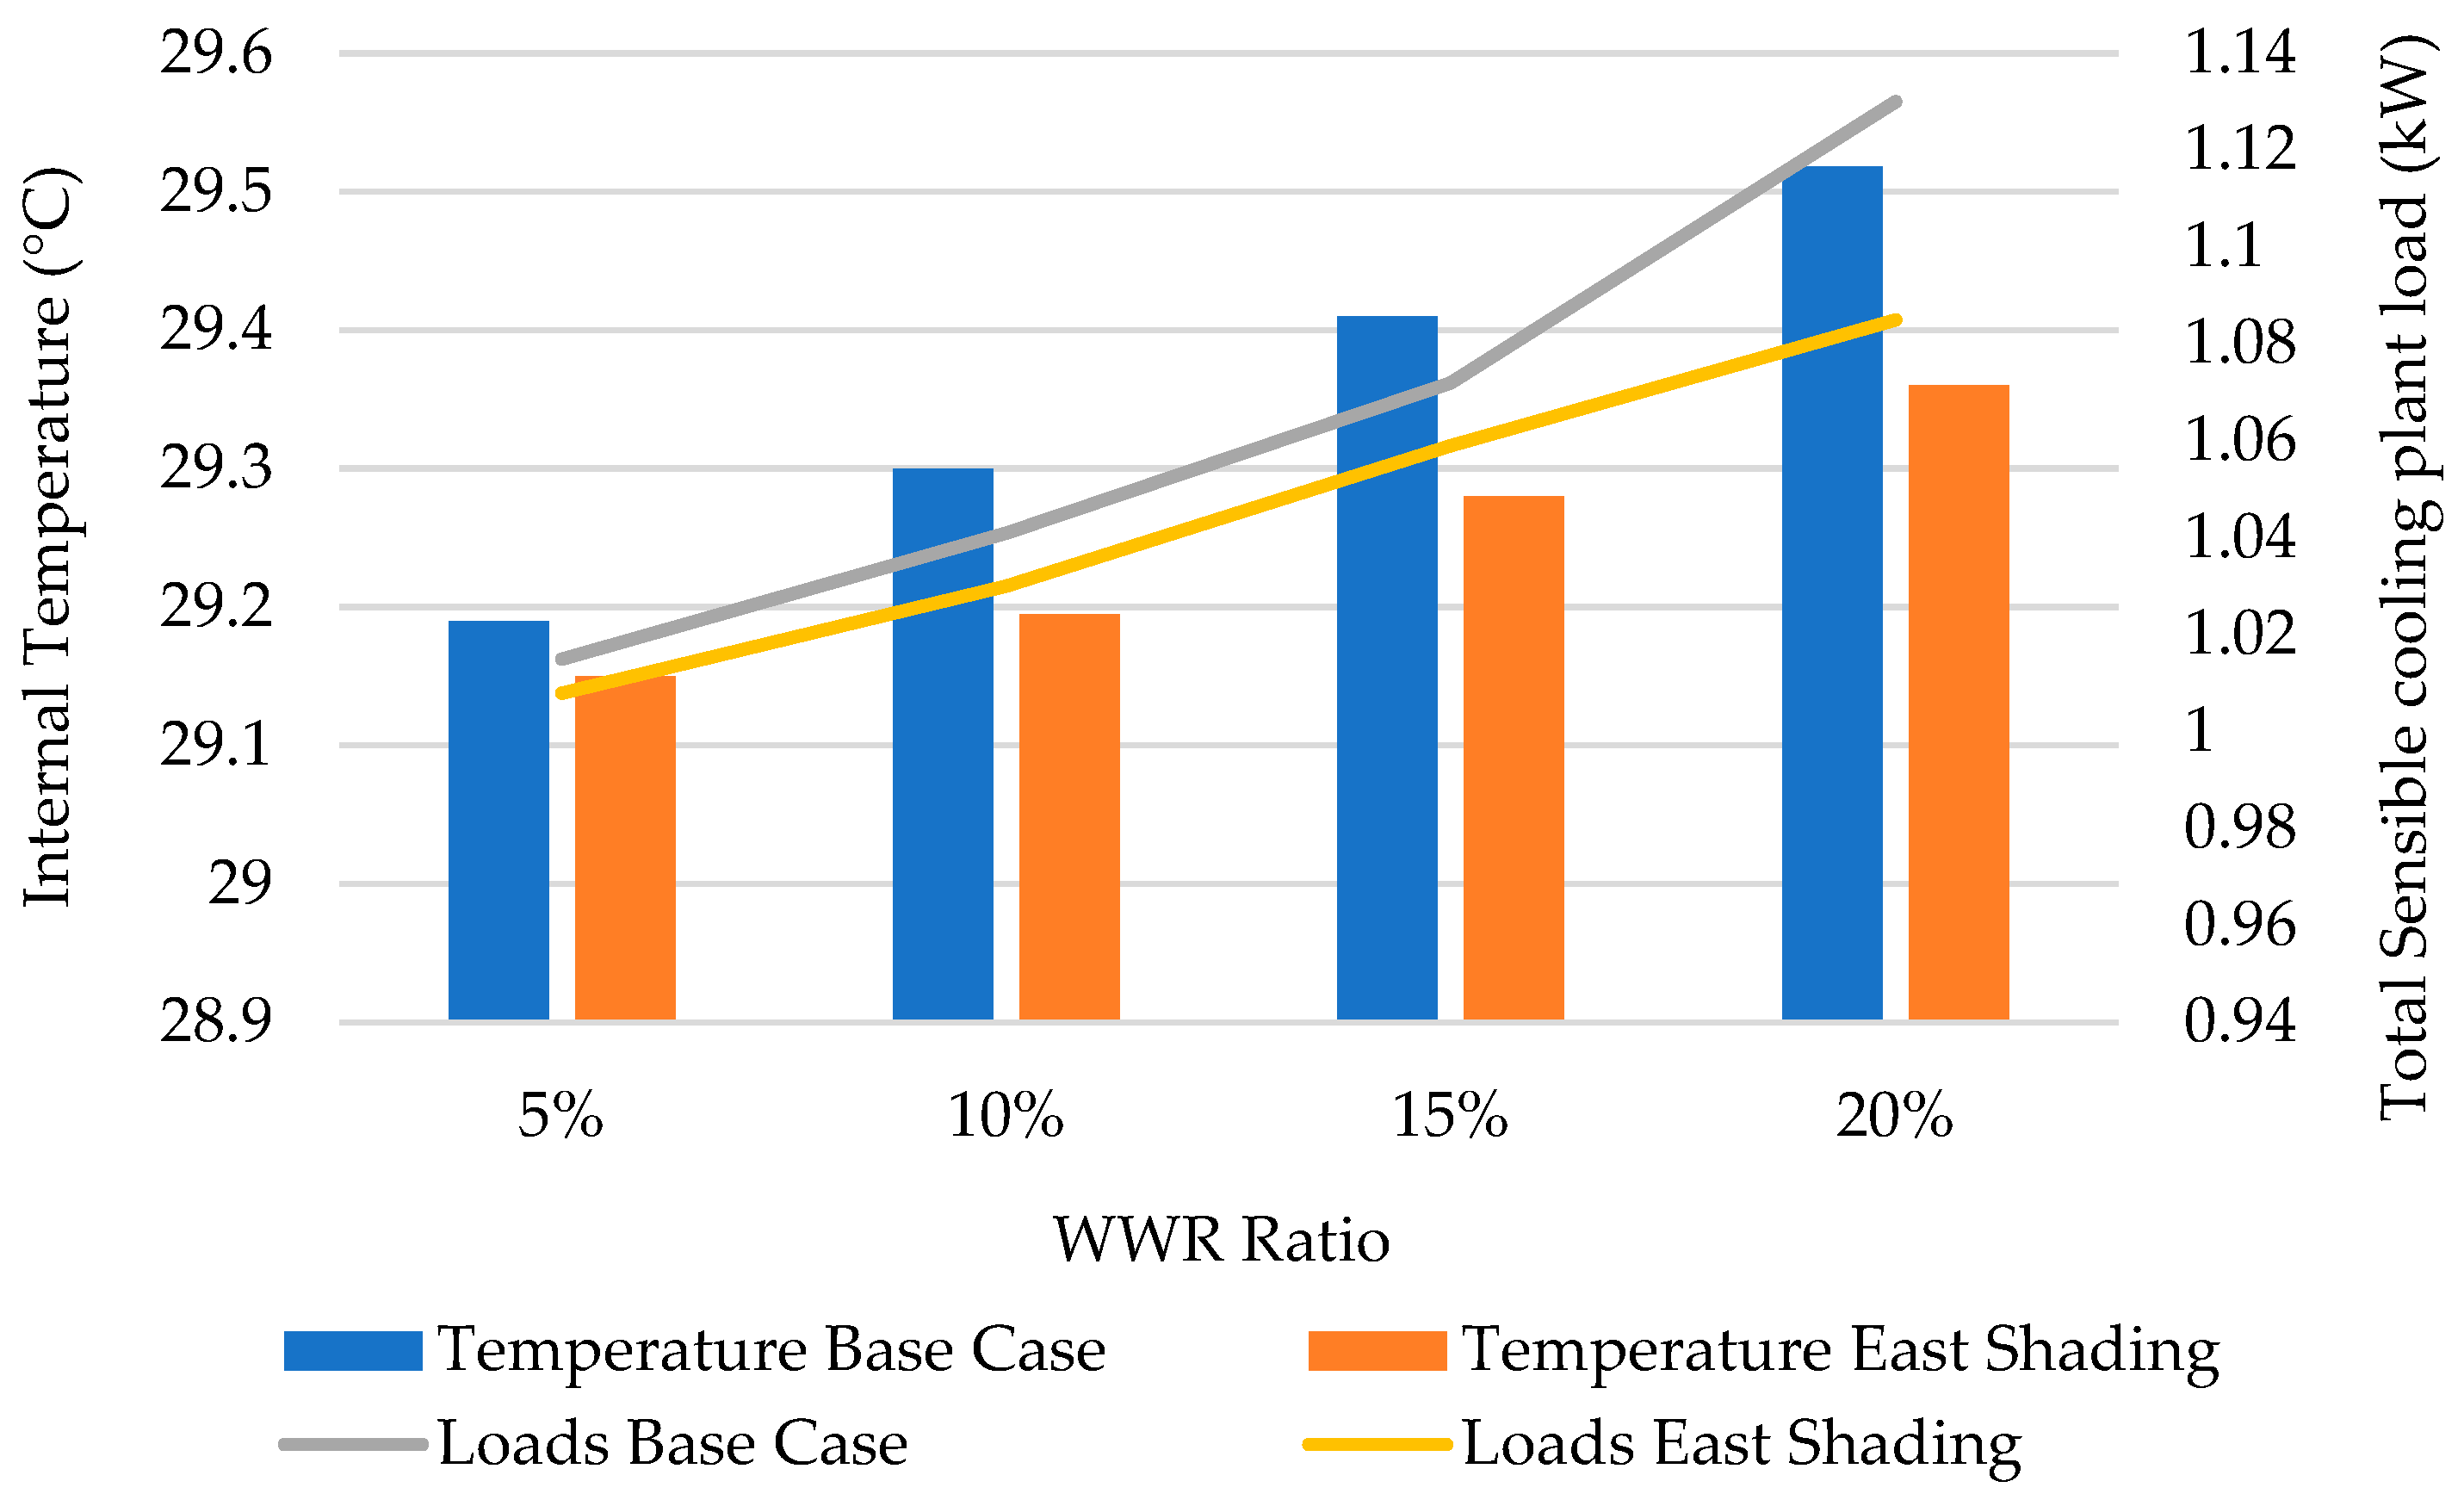
4.1. Solar Shading
Evaluating Shading Performance
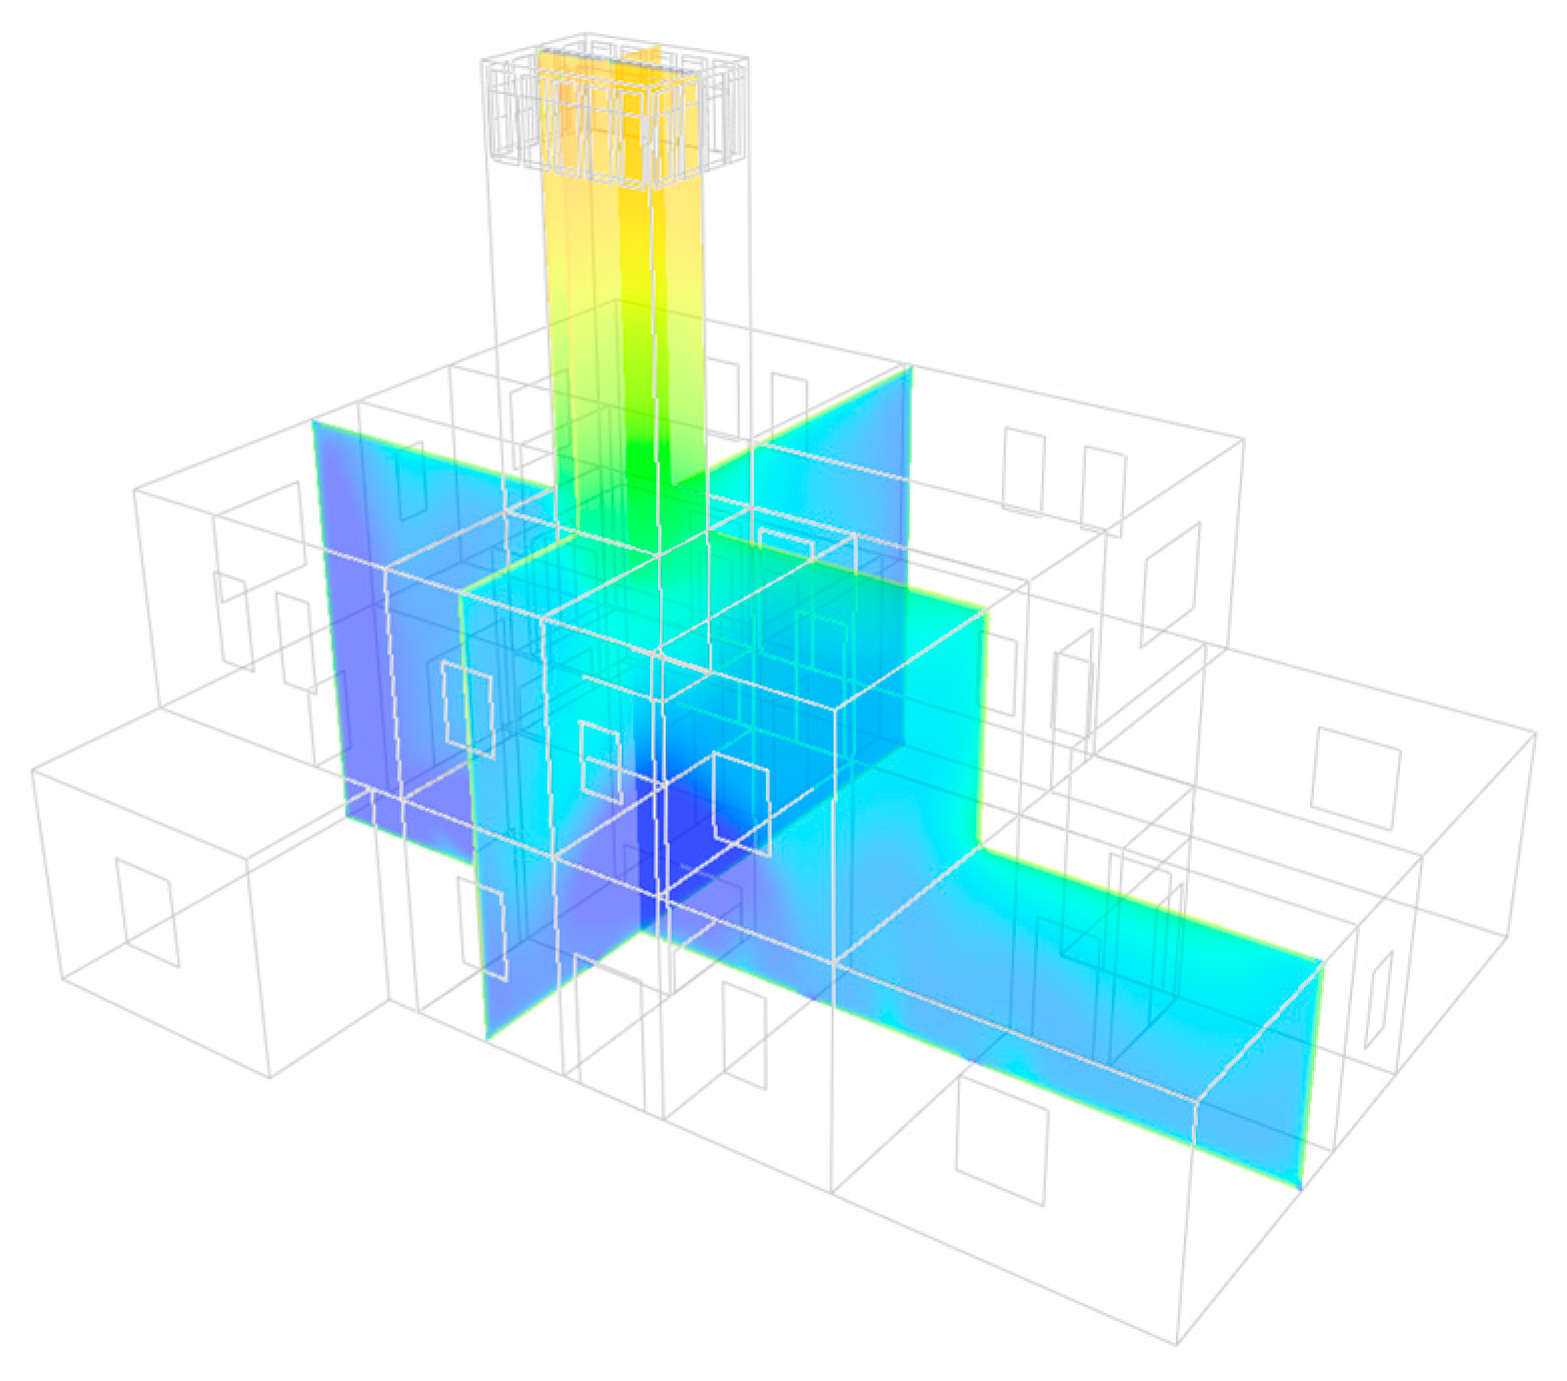
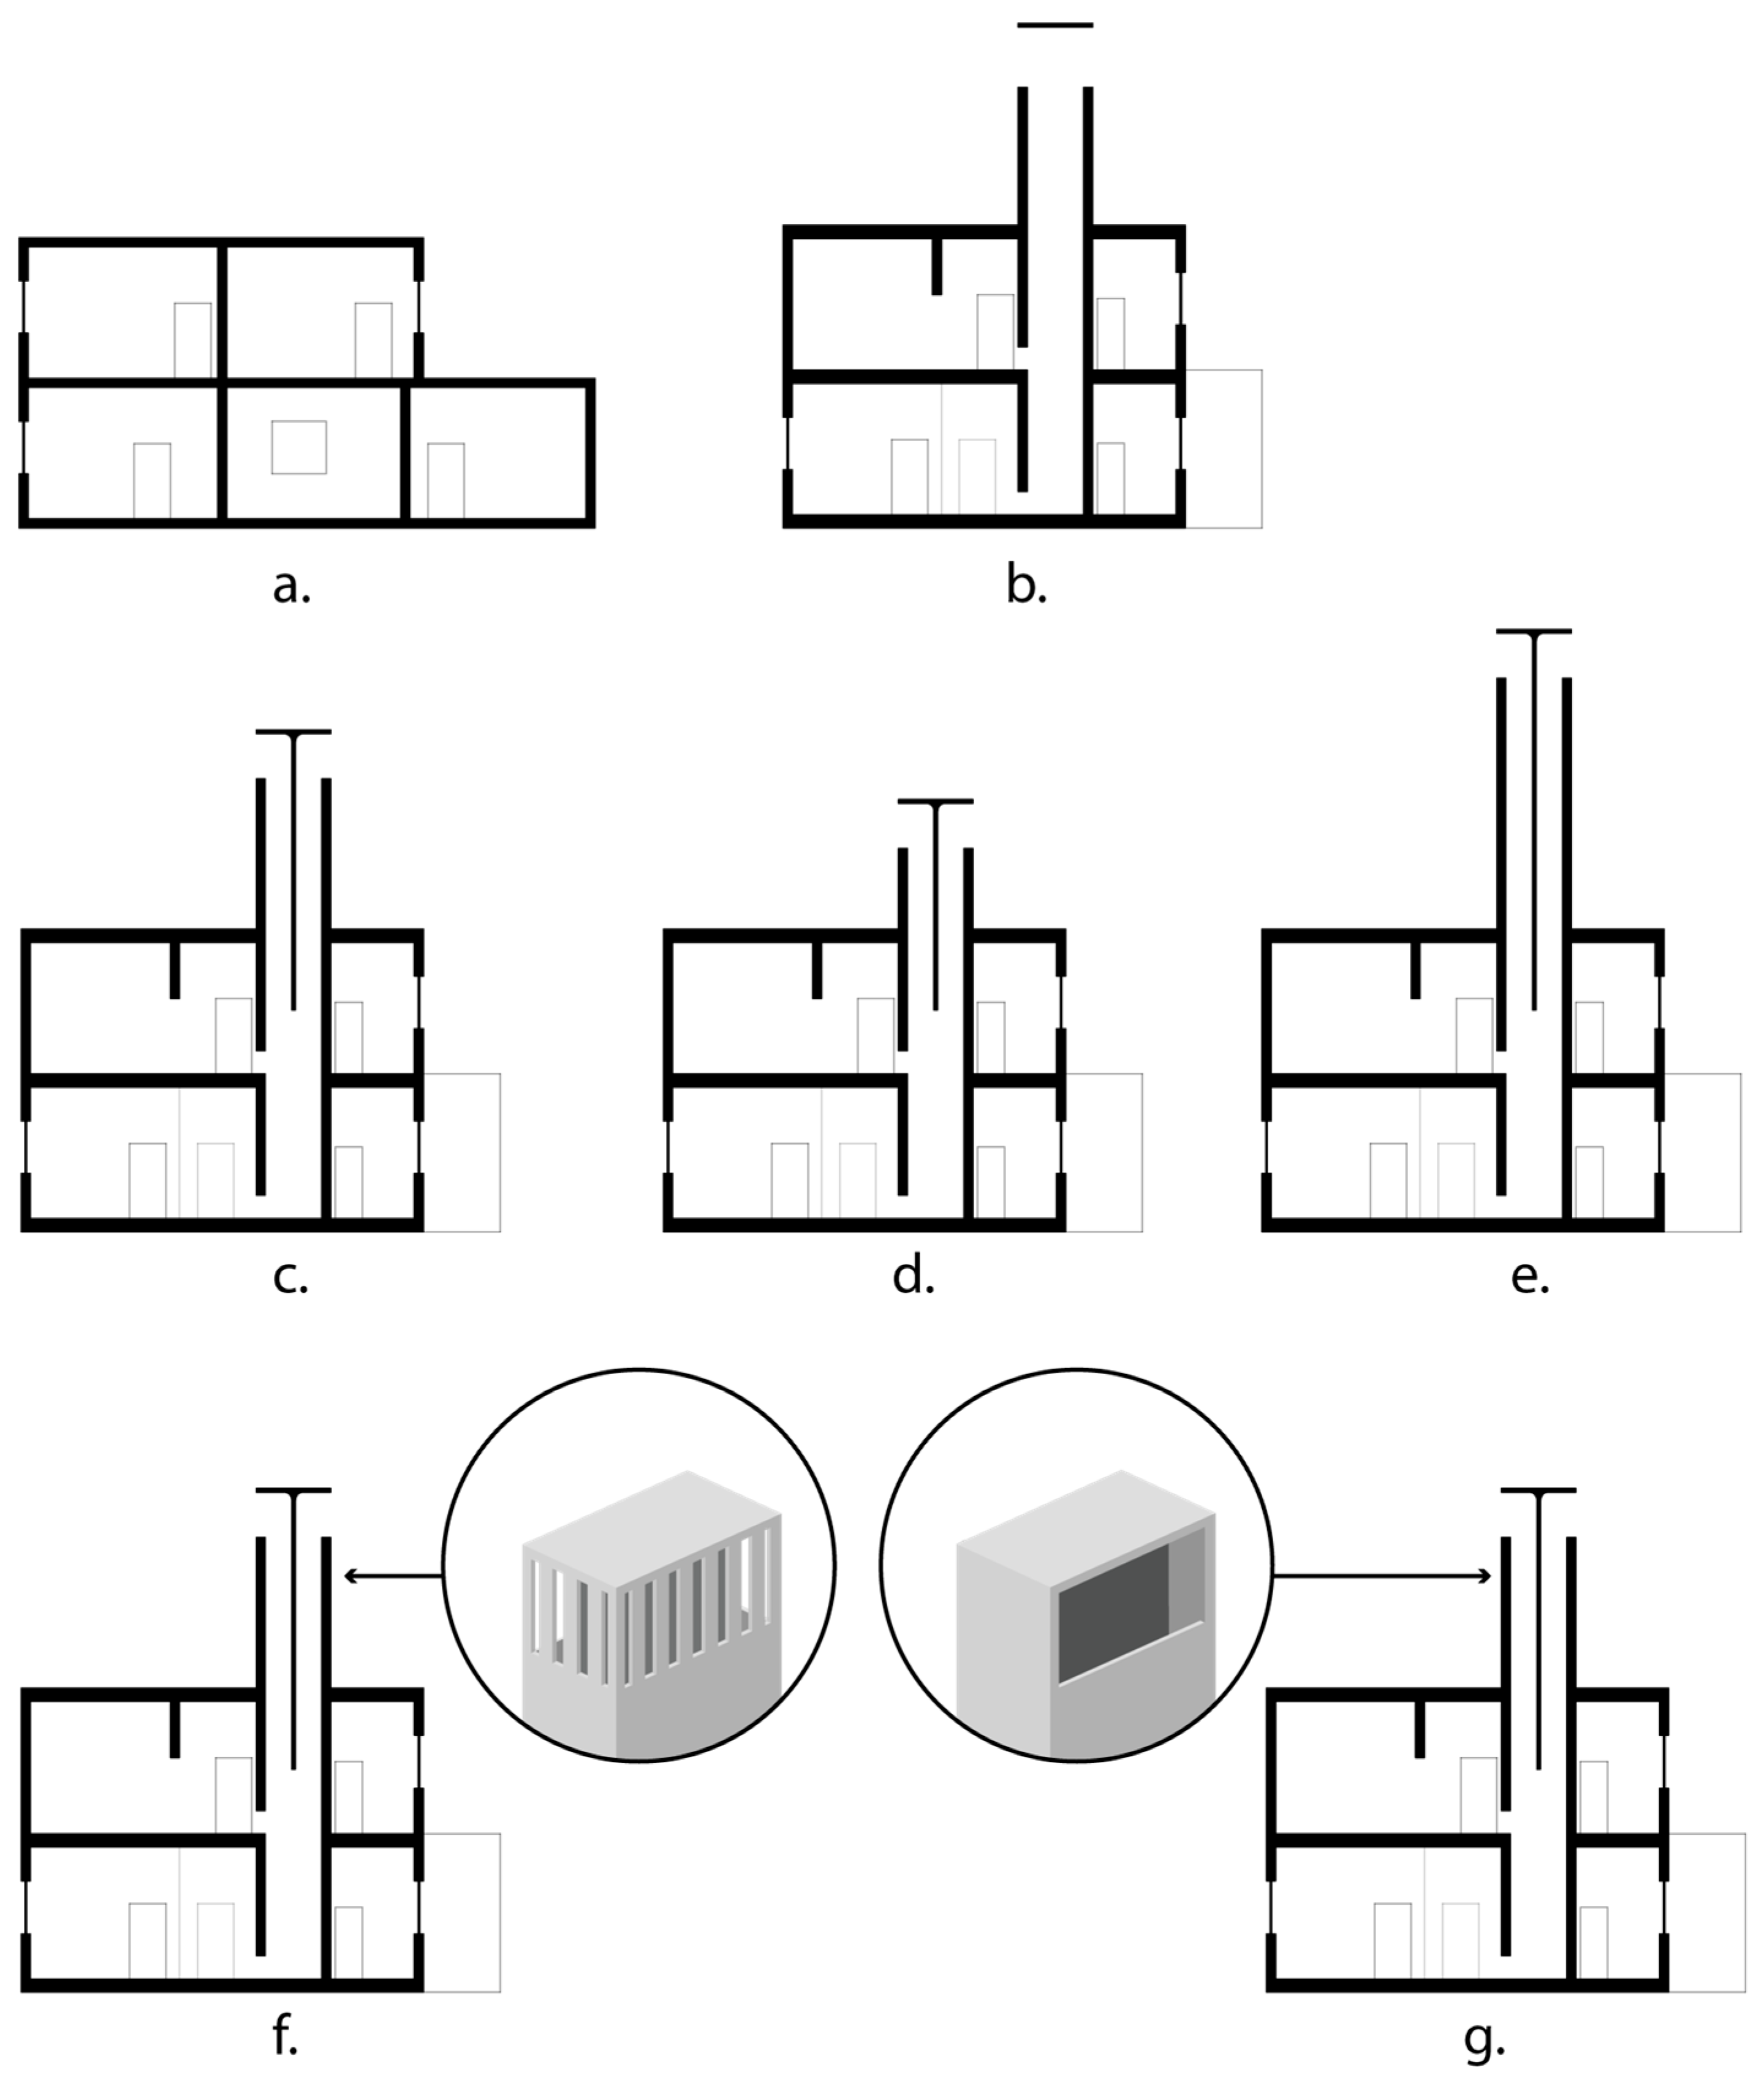
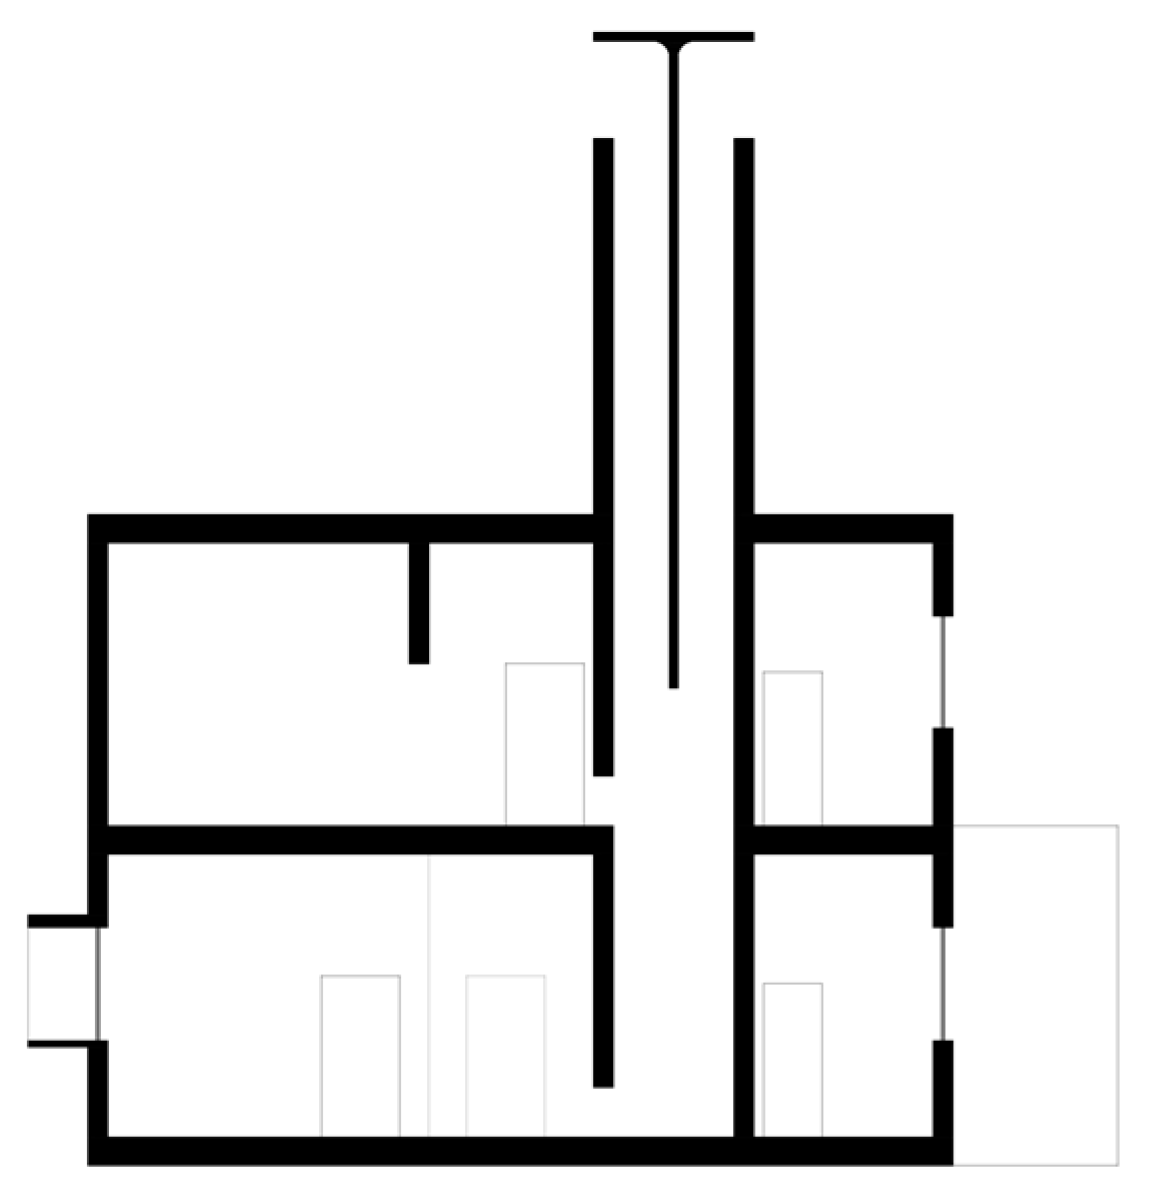
4.2. Wind Tower
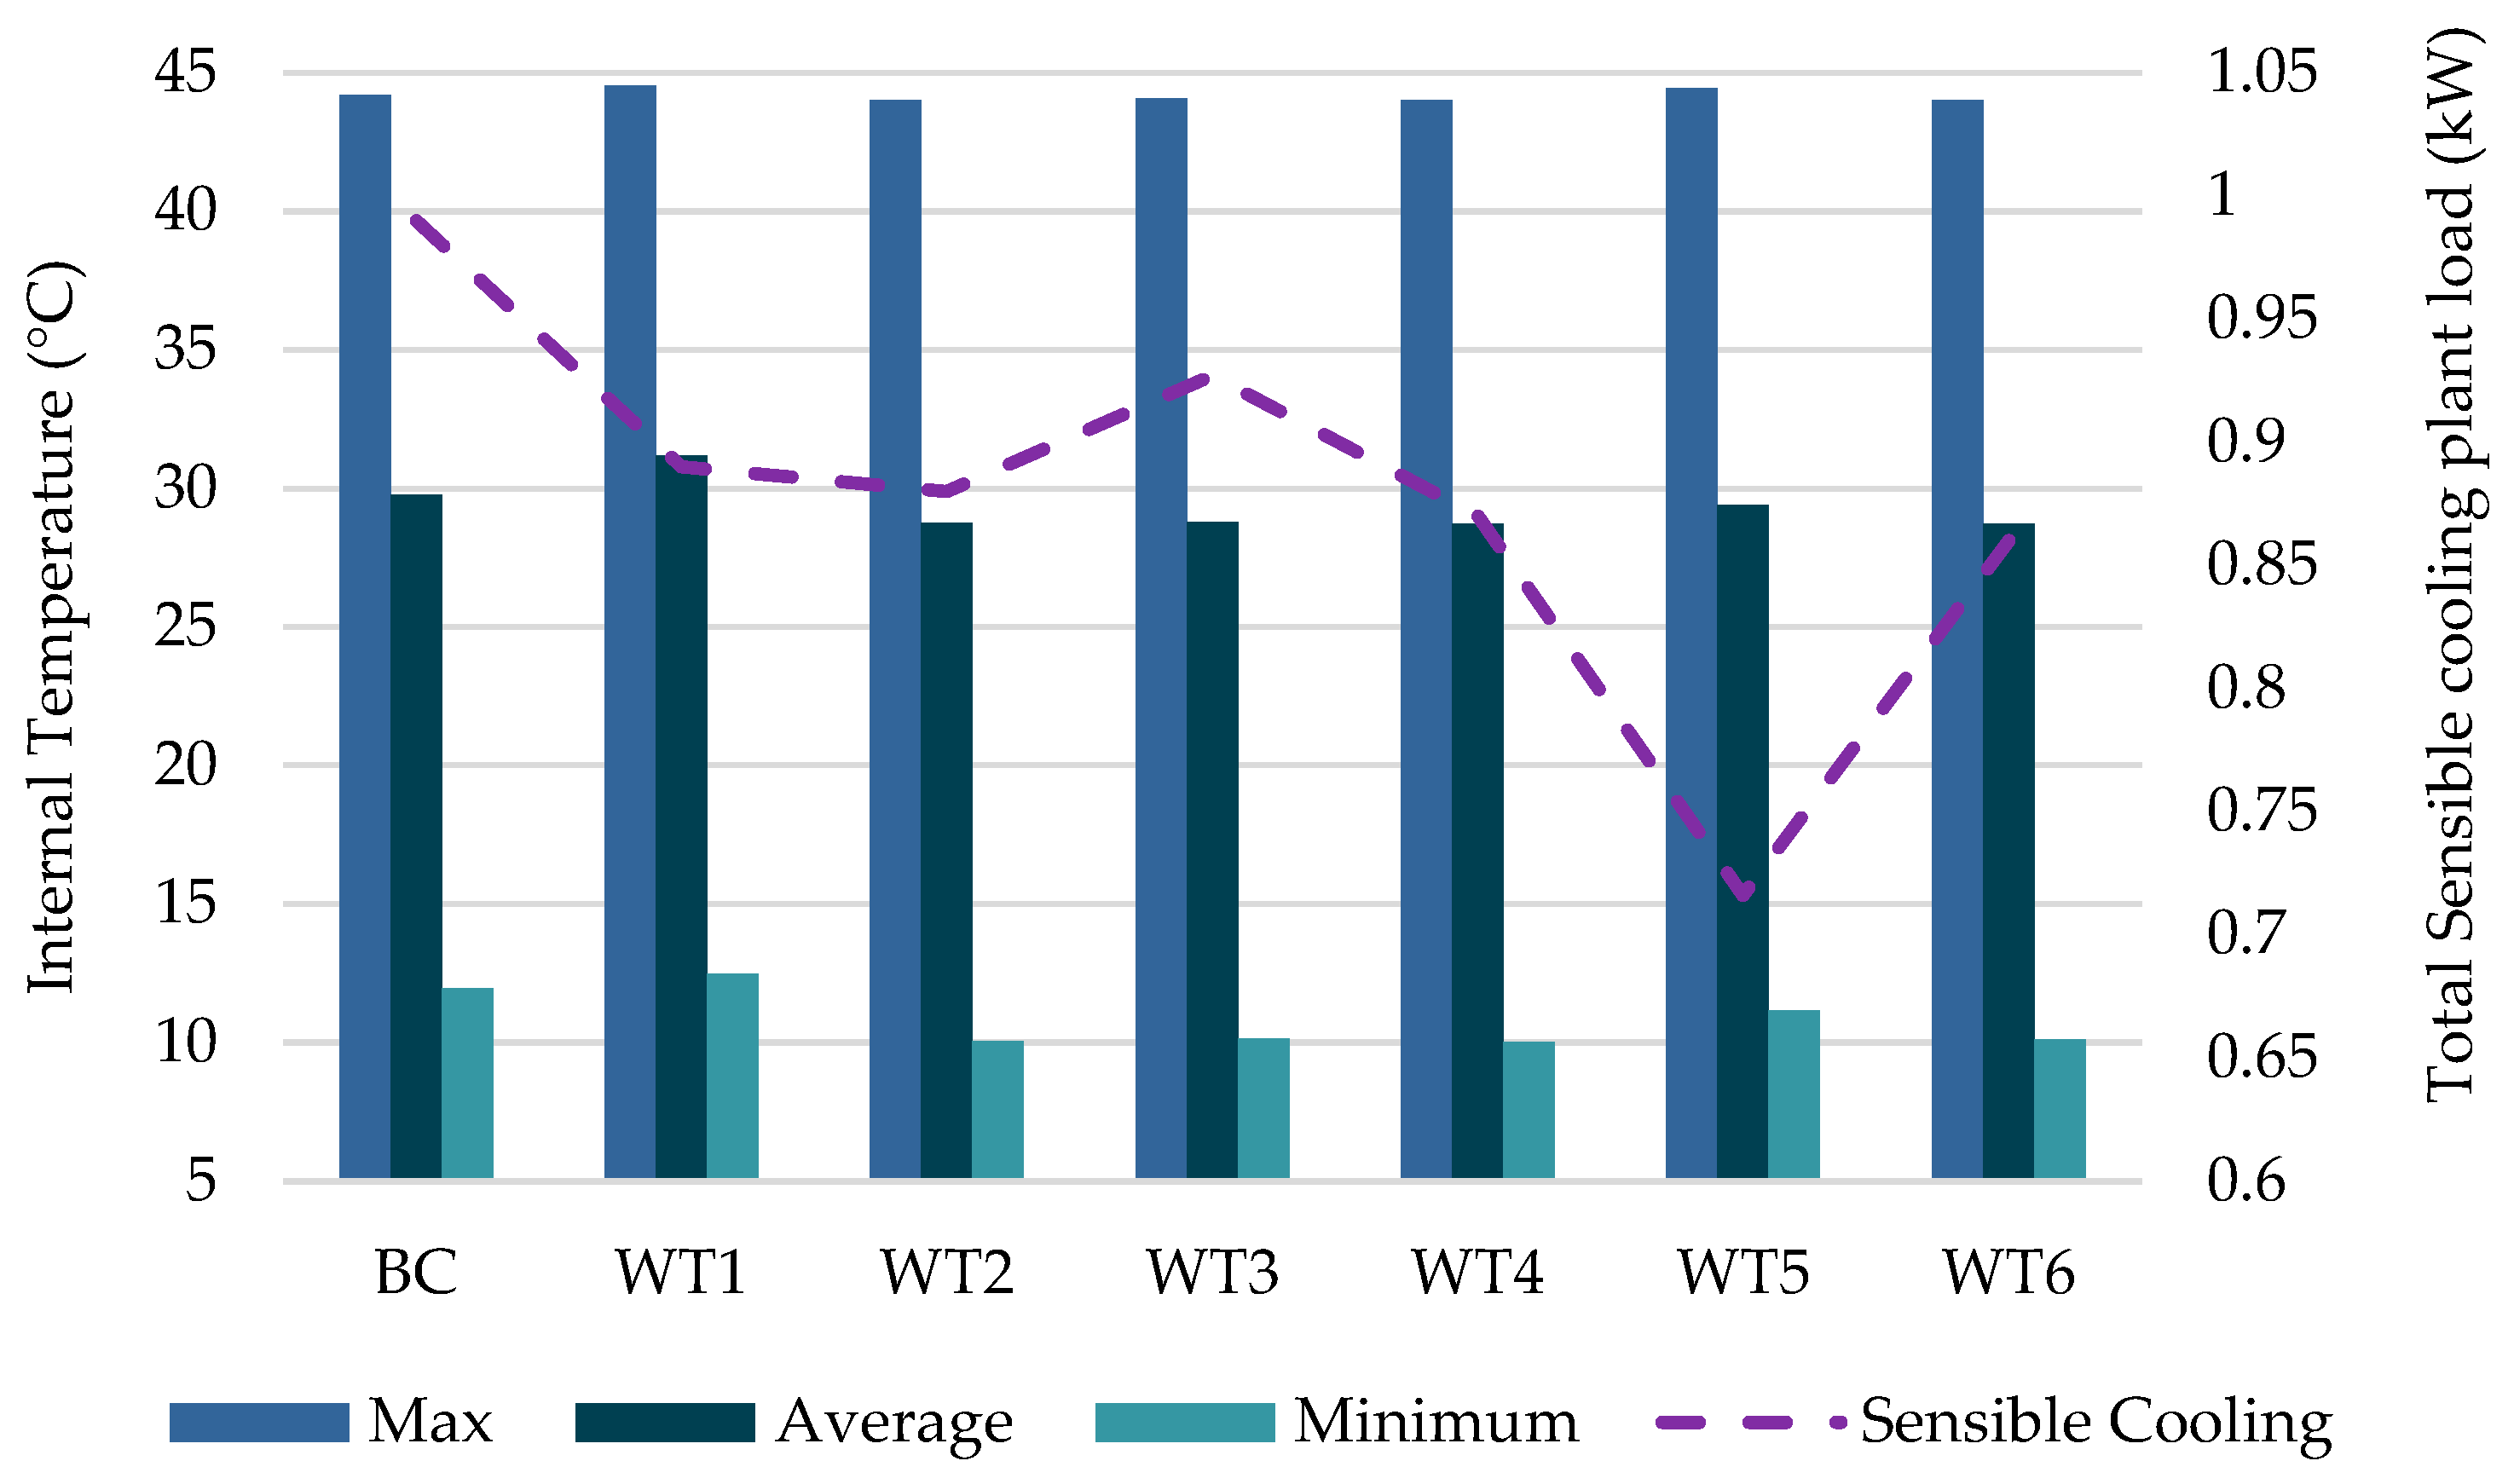
Evaluating Wind-Tower Performance
5. Design and Recommendation
6. Discussion
6.1. Limitations
- The economic feasibility of retrofitting (particularly for low and middle-income households) poses a substantial barrier. High-performance materials, glazing systems, and structural alterations such as windcatchers or green roofs may involve significant upfront costs that are not immediately recoverable without financial incentives or government subsidies. Cost-benefit analyses and lifecycle assessments should therefore complement technical evaluations in future studies.
- Implementation challenges remain significant. Many of the passive strategies tested here, especially those involving structural redesigns or additions, may face regulatory, architectural, or construction-related obstacles. Builder familiarity and technical capacity are also major limitations. Many construction firms in the region may lack experience with advanced insulation techniques, airtight envelope detailing, or traditional passive systems like windcatchers, which have fallen out of common practice. This skill gap can lead to poor implementation or resistance from developers accustomed to conventional, low-cost construction methods.
- Aesthetic preferences and cultural norms influence design acceptance. Features like reduced glazing, visible shading devices, or rooftop windcatchers may be perceived as unattractive or outdated by homeowners or developers seeking sleek, modern appearances. This aesthetic resistance can be a significant barrier, especially in markets where housing trends prioritize visual appeal over performance.
- Occupant behaviour plays a critical role in the energy performance of buildings. Even the most technically efficient villas can become an energy liability if occupants override thermostats, misuse windows or ventilation systems, or leave cooling units running unnecessarily. Bridging this “performance gap” requires not only smart technologies but also educational efforts to promote energy-aware behaviour among residents.
- Another limitation of this study lies in the assumption of infiltration rates on values derived from previous literature. While these assumptions offered a reasonable starting point and showed limited impact on results compared to other variables in the sensitivity analysis, they may not fully reflect the variability found in real-world conditions. Infiltration rates, for instance, are highly sensitive to construction quality, detailing, and long-term maintenance, factors that differ across projects and are often underrepresented in generalized datasets.
6.2. Future Work
6.3. Conclusions
Author Contributions
Funding
Data Availability Statement
Conflicts of Interest
Abbreviations
| WWR | Window to wall ratio |
| SBC | Saudi Building Code |
| ICC | International Code Council |
| IECC | International Energy Conservation Code |
| PHV | Passivhaus standard |
| STV | Conventional construction |
| ACH | Air changes per hour/ infiltration rate |
| EPW | Energy Plus Weather Files |
| INC | Insulted Concrete Wall |
| TIC | Thermal Mass Concrete Wall |
| ICR | Reverse Insulated Concrete Wall |
| TM | Hypothetical Low U-Value Wall |
| BCT | Base-case Typical |
| ICB | Insulated Clay Brick |
| PS | Passive Strategy |
| WT | Wind Tower |
Appendix A
References
- Diffenbaugh, N.S.; Barnes, E.A. Data-driven predictions of the time remaining until critical global warming thresholds are reached. Proc. Natl. Acad. Sci. USA 2023, 120, e2207183120. [Google Scholar] [CrossRef] [PubMed]
- Alshenaifi, M.A.; Sharples, S.; Abuhussain, M.A.; Alotaibi, B.S.; Aldersoni, A.A.; Abdelhafez, M.H.H. Integrating a passive downdraught evaporative cooling tower into a Saudi house—The impact of climatic conditions on PDEC performance. Build. Environ. 2023, 242, 110497. [Google Scholar] [CrossRef]
- Al-Sulaiman, F.A.; Zubair, S.M. A survey of energy consumption and failure patterns of residential air-conditioning units in Eastern Saudi Arabia. Energy 1996, 21, 967–975. [Google Scholar] [CrossRef]
- Juaidi, A.; Montoya, F.G.; Gázquez, J.A.; Manzano-Agugliaro, F. An overview of energy balance compared to sustainable energy in United Arab Emirates. Renew. Sustain. Energy Rev. 2016, 55, 1195–1209. [Google Scholar] [CrossRef]
- Statistical Review of World Energy; BP: London, UK, 2022.
- Hausladen, G.; de Saldanha, M.; Liedl, P. ClimateSkin: Concepts for Building Skins That Can Do More with Less Energy; Birkhäuser: Basel, Switzerland, 2008. [Google Scholar]
- Orme, M.; Palmer, J.; Irving, S. Control of Overheating in Well-Insulated Housing. In Proceedings of the CIBSE/ASHRAE Conference, Edinburgh, UK, 24–26 September 2003. [Google Scholar]
- Cox, S. Losing Our Cool: Uncomfortable Truths About Our Air-Conditioned World (and Finding New Ways to Get Through Summer); The New Press: New York, NY, USA, 2012; p. 272. [Google Scholar]
- Howarth, N.; Odnoletkova, N.; Alshehri, T.; Almadani, A.; Lanza, A.; Patzek, T. Staying Cool in A Warming Climate: Temperature, Electricity and Air Conditioning in Saudi Arabia. Climate 2020, 8, 4. [Google Scholar] [CrossRef]
- Taleb, H.M.; Sharples, S. Developing sustainable residential buildings in Saudi Arabia: A case study. Appl. Energy 2011, 88, 383–391. [Google Scholar] [CrossRef]
- Yannas, S. Challenging The Supremacy Of Airconditioning. 2021. Available online: https://2aiia.com/challenging-the-supremacy-of-airconditioning-simos-yannas/ (accessed on 2 May 2025).
- Nedhal, A.-T. A state-of-the-art review of the sustainability and energy efficiency of buildings in Saudi Arabia. Energy Effic. 2017, 10, 1129–1141. [Google Scholar]
- Mohammadi, A.; Saghafi, M.R.; Tahbaz, M.; Nasrollahi, F. The study of climate-responsive solutions in traditional dwellings of Bushehr City in Southern Iran. J. Build. Eng. 2018, 16, 169–183. [Google Scholar] [CrossRef]
- Ragab, A. The Influence of Buildings Proportions and Orientations on Energy Demand for Cooling in Hot Arid Climate. SVU-Int. J. Eng. Sci. Appl. 2022, 3, 8–20. [Google Scholar]
- Hu, M.; Zhang, K.; Nguyen, Q.; Tasdizen, T. The effects of passive design on indoor thermal comfort and energy savings for residential buildings in hot climates: A systematic review. Urban Clim. 2023, 49, 101466. [Google Scholar] [CrossRef]
- Alwetaishi, M. Energy performancein residential buildings: Evaluationof the potential of buildingdesignand environmental parameter. Ain Shams Eng. J. 2022, 13, 101708. [Google Scholar] [CrossRef]
- Bradshaw, V. The Building Environment: Active and Passive Control Systems, 3rd ed.; John Wiley & Sons: Hoboken, NJ, USA, 2006. [Google Scholar]
- Nedhal, A.-T. Passive Design Strategies for Energy Efficient Buildings in the Arabian Desert. Front. Built Environ. 2022, 7, 805603. [Google Scholar]
- Aldossary, N.A.; Rezgui, Y.; Kwan, A. Domestic energy consumption patterns in a hot and humid climate: A multiple-case study analysis. Appl. Energy 2014, 114, 353–365. [Google Scholar] [CrossRef]
- Meir, I.A.; Roaf, S.C. Thermal Comfort—Thermal Mass: Housing in Hot Dry Climates. Architecture. Indoor Air 2002, 9, 1050–1055. [Google Scholar]
- Rashid, S.; Voelker, C.; Kornadt, O. The influence of heat capacity on the thermal performance of buildings in hot arid climates. In Proceedings of the Bauphysiktag, Kaiserslautern, Germany, 29–30 March 2022. [Google Scholar]
- Aldersoni, A.; Albaker, A.; Alturki, M.; Said, M.A. The Impact of Passive Strategies on the Overall Energy Performance of Traditional Houses in the Kingdom of Saudi Arabia. Buildings 2022, 12, 1837. [Google Scholar] [CrossRef]
- Jones, B.M.; Kirby, R. Quantifying the performance of a top–down natural ventilation Windcatcher™. Build. Environ. 2009, 44, 1925–1934. [Google Scholar] [CrossRef]
- Yang, T.; Clements-Croome, D. References. In Encyclopedia of Sustainability Science and Technology, 1st ed.; Meyers, R., Ed.; Springer: New York, NY, USA, 2012; Volume 1, pp. 6865–6896. ISBN 978-0-387-89469-0. [Google Scholar]
- Liu, M.; Nejat, P.; Cao, P.; Jimenez-Bescos, C.; Calautit, J.K. A critical review of windcatcher ventilation: Micro-environment, techno-economics, and commercialisation. Renew. Sustain. Energy Rev. 2024, 191, 114048. [Google Scholar] [CrossRef]
- Montazeri, H. Experimental and numerical study on natural ventilation performance of various multi-opening wind catchers. Build. Environ. 2011, 46, 370–378. [Google Scholar] [CrossRef]
- Karakatsanis, C.; Bahadori, M.N.; Vickery, B.J. Evaluation of pressure coefficients and estimation of air flow rates in buildings employing wind towers. Sol. Energy 1986, 37, 363–374. [Google Scholar] [CrossRef]
- Gharakhani, A.; Sediadi, E.; Roshan, M.; Bagheri Sabzevar, H. Experimental study on perfomance of wind catcher in tropical climate. ARPN J. Eng. Appl. Sci. 2017, 12, 2551–2555. [Google Scholar]
- Muharam, A.; Amer, E.; Al-Hemiddi, N. Thermal Performance of the Extensive Green Roofs in Hot Dry Climate. Int. J. Adv. Eng. Res. Sci. 2016, 3, 2349–6495. [Google Scholar]
- Goussous, J.; Siam, H.; Alzoubi, H. Prospects of green roof technology for energy and thermal benefits in buildings: Case of Jordan. Sustain. Cities Soc. 2015, 14, 425–440. [Google Scholar] [CrossRef]
- Al-Homoud, M.S.; Krarti, M. Energy efficiency of residential buildings in the kingdom of Saudi Arabia: Review of status and future roadmap. J. Build. Eng. 2021, 36, 102143. [Google Scholar] [CrossRef]
- Asif, M.; Alrashed, F. Trends in Residential Energy Consumption in Saudi Arabia with Particular Reference to the Eastern Province. J. Sustain. Dev. Energy Water Environ. Syst. 2014, 2, 376–387. [Google Scholar]
- Al-Sanea, S.A.; Zedan, M.F.; Al-Mujahid, A.M.; Al-Suhaibani, Z.A. Optimum R-values of building walls under different climatic conditions in the Kingdom of Saudi Arabia. Appl. Therm. Eng. 2016, 96, 92–106. [Google Scholar] [CrossRef]
- Alsayed, M.F.; Tayeh, R.A. Life cycle cost analysis for determining optimal insulation thickness in Palestinian buildings. J. Build. Eng. 2019, 22, 101–112. [Google Scholar] [CrossRef]
- Çomaklı, K.; Yüksel, B. Optimum insulation thickness of external walls for energy saving. Appl. Therm. Eng. 2003, 23, 473–479. [Google Scholar] [CrossRef]
- Al-Sanea, S.A.; Zedan, M.F. Improving thermal performance of building walls by optimizing insulation layer distribution and thickness for same thermal mass. Appl. Energy 2011, 88, 3113–3124. [Google Scholar] [CrossRef]
- Alyami, S.H.; Alqahtany, A.; Ashraf, N.; Osman, A.; Aldossary, N.A.; Almutlaqa, A.; Al-Maziad, F.; Alshammari, M.S.; Al-Gehlani, W.A.G. Impact of Location and Insulation Material on Energy Performance of Residential Buildings as per Saudi Building Code (SBC) 601/602 in Saudi Arabia. Materials 2022, 15, 9079. [Google Scholar] [CrossRef]
- Wahl, E. Buildings in Arid Desert Climate: Improving Energy Efficiency with Measures on the Building Envelope; Luleå University of Technology: Luleå, Sweden, 2017. [Google Scholar]
- El-Darwish, I.; Gomaa, M. Retrofitting strategy for building envelopes to achieve energy efficiency. Alex. Eng. J. 2017, 56, 579–589. [Google Scholar] [CrossRef]
- Freire, R.Z.; Mazuroski, W.; Abadie, M.O.; Mendes, N. Capacitive effect on the heat transfer through building glazing systems. Appl. Energy 2011, 88, 4310–4319. [Google Scholar] [CrossRef]
- Fasi, M.A.; Budaiwi, I.M. Energy performance of windows in office buildings considering daylight integration and visual comfort in hot climates. Energy Build. 2015, 108, 307–316. [Google Scholar] [CrossRef]
- Al-Tamimi, N.; Fadzil, S.F.S. Energy-efficient envelope design for high-rise residential buildings in Malaysia. Archit. Sci. Rev. 2012, 55, 119–127. [Google Scholar] [CrossRef]
- Aboulnaga, M.; Wanas, A.; Hammad, M.; Hussein, M. (Eds.) Sustainability of Higher Educational Buildings: Retrofitting Measures to Enhance Energy Performance—The Case of AASTMT Business Management School Building, Egypt. In Mediterranean Green Buildings & Renewable Energy; Springer: Cham, Switzerland, 2017. [Google Scholar]
- Mirrahimi, S.; Mohamed, M.F.; Haw, L.C.; Ibrahim, N.L.N.; Yusoff, W.F.M.; Aflaki, A. The effect of building envelope on the thermal comfort and energy saving for high-rise buildings in hot–humid climate. Renew. Sustain. Energy Rev. 2016, 53, 1508–1519. [Google Scholar] [CrossRef]
- Kim, S.; Zadeh, P.A.; Staub-French, S.; Froese, T.; Cavka, B.T. Assessment of the Impact of Window Size, Position and Orientation on Building Energy Load Using BIM. Procedia Eng. 2016, 145, 1424–1431. [Google Scholar] [CrossRef]
- Dowd, R.M.; Mourshed, M. Low carbon Buildings: Sensitivity of Thermal Properties of Opaque Envelope Construction and Glazing. Energy Procedia 2015, 75, 1284–1289. [Google Scholar] [CrossRef]
- Alshahrani, J.; Boait, P. Reducing High Energy Demand Associated with Air-Conditioning Needs in Saudi Arabia. Energies 2019, 12, 87. [Google Scholar] [CrossRef]
- Felimban, A. In Saudi Arabia You Live in an Airconditioned World. 2023. Available online: https://www.tudelft.nl/en/architecture-and-the-built-environment/research/research-stories/in-saudi-arabia-you-live-in-an-airconditioned-world (accessed on 3 May 2025).
- Giusti, L.; Almoosawi, M. Impact of building characteristics and occupants’ behaviour on the electricity consumption of households in Abu Dhabi (UAE). Energy Build. 2017, 151, 534–547. [Google Scholar] [CrossRef]
- Available online: https://energyplus-weather.s3.amazonaws.com/europe_wmo_region_6/GBR/GBR_London.Gatwick.037760_IWEC/GBR_London.Gatwick.037760_IWEC.zip (accessed on 21 March 2024).
- Lasker, W.J.A. The Impact of Construction and Building Materials on Energy Consumption on Saudi Residential Buildings. Ph.D. Thesis, University of Heriot-Watt, Edinburgh, UK, 2016. [Google Scholar]
- Alayed, E.; O’Hegarty, R.; Kinnane, O. Thermal envelope analysis for new code compliance of Saudi Arabian dwellings. Energy Build. 2021, 243, 110997. [Google Scholar] [CrossRef]
- Ahmed, H.N.S. Thermal Insulation Economics for Saudi Residential Buildings Dahahran, Saudi Arabia. Master’s Thesis, King Fahd University of Petroleum & Minerals, Dhahran, Saudi Arabia, 1991. [Google Scholar]
- Abdelrahman, M.A.; Said, S.A.M.; Ahmad, A. A Comparison of Energy Consumption And Cost-effectivenes of Four Masonry Materials in Saudi Arabia. Energy 1993, 18, 1181–1186. [Google Scholar] [CrossRef]
- Al-Mulla, A.S.E. Major Components of “Typical Villa” in Saudi Arabia for Price/Cost Index Development. In Proceedings of the 6th Saudi Engineering Conference, Dhahran, Saudi Arabia, 14–17 December 2002. [Google Scholar]
- Alaidroos, A.; Krarti, M. Optimal design of residential building envelope systems in the Kingdom of Saudi Arabia. Energy Build. 2015, 86, 104–117. [Google Scholar] [CrossRef]
- Allahaim, F.S.; El shenawy, A.M.; Alfalah, G. Impact of the Saudi Building Code on Residential Construction Costs. Buildings 2024, 14, 233. [Google Scholar] [CrossRef]
- S.B.C.N.C. The Saudi Code for Energy Conservation–Residential Building (SBC 602). Available online: https://sbc.gov.sa/en/BC/Pages/BuildingCode/BCDetails.aspx?codeId=602&year=2024 (accessed on 15 April 2025).
- Alardhi, A.; Abdulaziz, S.A.; Almasri, R. Impact of the new Saudi energy conservation code on Saudi Arabia residential buildings. Aust. J. Mech. Eng. 2022, 20, 1392–1406. [Google Scholar] [CrossRef]
- Khalfan, M. Lessons Learned from the First Passivhaus Building in Qatar. Creat. Environ. Sustain. Places Living 2019, 4, 77–91. [Google Scholar] [CrossRef]
- Alalouch, C.; Saleh MS-e Al-Saadi, S. Energy-Efficient House in the GCC Region. Procedia—Soc. Behav. Sci. 2016, 216, 736–743. [Google Scholar] [CrossRef]
- Rudolph, M.; Knebel, N.; Werminghausen, M.; Frenzel, C.; Rumana, O.; Rowa, Z. Intermediate Report on the Design and Construction of a Net-Zero-Energy Building in Muscat Oman. In Proceedings of the World Sustainable Building 2014 Conference, Barcelona, Spain, 30 October 2014. [Google Scholar]
- Sabic. Sabic Demonstration Home Achieves Highest Level of Building Performance Certification in the Region. 2015. Available online: https://www.sabic.com/en/hoi/news-and-events/news/sabic-demonstration-home (accessed on 8 May 2025).
- Masdar. Eco-Villa Prototype Opens Its Doors at Masdar City. 2017. Available online: https://masdar.ae/en/news/newsroom/eco-villa-prototype-opens-its-doors-at-masdar-city (accessed on 7 May 2025).
- ArquitecturaViva. Beirut Terraces, Beirut. Available online: https://arquitecturaviva.com/works/apartamentos-beirut-terraces-7 (accessed on 7 May 2025).
- Nassar, M. Egypt’s Green Social Housing Initiative First of Its Kind in Region. 2022. Available online: https://www.csregypt.com/en/egypts-green-social-housing-initiative-first-of-its-kind-in-region/ (accessed on 8 May 2025).
- Services, E.E. Etihad ESCO Announces Completion of Hatta Solar Retrofit Project. 2019. Available online: https://etihadesco.ae/etihad-esco-announces-completion-of-hatta-solar-retrofit-project/ (accessed on 6 May 2025).
- Abdelrady, A.; Abdelhafez, M.H.; Ragab, A. Use of Insulation Based on Nanomaterials to Improve Energy Efficiency of Residential Buildings in a Hot Desert Climate. Sustainability 2021, 13, 5266. [Google Scholar] [CrossRef]
- WGBC Affordable Housing Project. 2020. Available online: https://worldgbc.org/case_study/affordable-housing-project/ (accessed on 7 May 2025).
- Bataineh, K.; Alrabee, A. Improving the Energy Efficiency of the Residential Buildings in Jordan. Buildings 2018, 8, 85. [Google Scholar] [CrossRef]
- Alyami, M.; Omer, S. Building energy performance simulation: A case study of modelling an existing residential building in Saudi Arabia. Environ. Res. Infrastruct. Sustain. 2021, 1, 35001. [Google Scholar] [CrossRef]
- IES Virtual Environment. Available online: https://www.iesve.com/software/virtual-environment (accessed on 6 May 2025).
- Qays, M.; Mohamed, M.F.; Mat Sulaiman, M.K.A.; Che-Ani, A.; Raman, S.N. Thermal Environment Accuracy Investigation of Integrated Environmental Solutions-Virtual Environment (IES-VE) Software for Double-Story House Simulation in Malaysia. J. Eng. Appl. Sci. 2019, 14, 3659–3665. [Google Scholar]
- Attia, S.; Herde, A. Early design simulation tools for net zero energy buildings: A comparison of ten tools. In Proceedings of the Building Simulation 2011: 12th Conference of International Building Performance Simulation Association, Sydney, Australia, 14–16 November 2011. [Google Scholar]
- Petrou, G.; Mavrogianni, A.; Mylona, A.; Raslan, R.; Virk, G.; Davies, M. Inter-model comparison of indoor overheating risk prediction for English dwellings. In Proceedings of the 38th AIVC Conference “Ventilating Healthy Low-Energy Buildings”, Nottingham, UK, 13–14 September 2017. [Google Scholar]
- Mahgoub, M.; Kumar, P. Evaluating Passive Housing Strategies in Extreme Climates: A Case Study of Dubai Using PHPP and IESVE Models. J. Clim. Change 2024, 10, 1–18. [Google Scholar] [CrossRef]
- Najini, H.; Nour, M.; Al-Zuhair, S.; Ghaith, F. Techno-Economic Analysis of Green Building Codes in United Arab Emirates Based on a Case Study Office Building. Sustainability 2020, 12, 8773. [Google Scholar] [CrossRef]
- Alrashed, F.A. Design and application of zero-energy homes in Saudi Arabia. Ph.D. Thesis, Glasgow Caledonian University, Glasgow, UK, 2015. [Google Scholar]
- Jentsch, M.F.; Bahaj, A.S.; James, P.A.B. Climate change future proofing of buildings—Generation and assessment of building simulation weather files. Energy Build. 2008, 40, 2148–2168. [Google Scholar] [CrossRef]
- IPCC Third Assessment Report. 2001. Available online: https://www.ipcc.ch/assessment-report/ar3/ (accessed on 6 May 2025).
- Aljammaz, M.; Wang, T.-H.; Peng, C. Understanding Occupant Behaviour in Islamic Homes to Close the Gap in Building Performance Simulation: A Case Study of Houses in Riyadh. Build. Simul. 2019, 16, 2107–2114. [Google Scholar]
- Saeed, S.A.R. Indoor climate as a function of building orientation. Int. J. Ambient Energy 1987, 8, 41–47. [Google Scholar] [CrossRef]
- Ishaq, M.; Alibaba, H. Effects Of Shading Device On Thermal Comfort Of Residential Building In Northern Nigeria. Int. J. Sci. Eng. Res. 2017, 8, 1021–1029. [Google Scholar]
- Kumar, R.; Garg, S.N.; Kaushik, S.C. Performance evaluation of multi-passive solar applications of a non air-conditioned building. Int. J. Environ. Technol. Manag. 2005, 5, 60–75. [Google Scholar] [CrossRef]
- DeKay, M.; Brown, G. Sun, Wind & Light: Architectural Design Strategies, 3rd ed.; Wiley: New York, NY, USA, 2014. [Google Scholar]
- Hughes, B.R.; Calautit, J.K.; Ghani, S.A. The development of commercial wind towers for natural ventilation: A review. Appl. Energy 2012, 92, 606–627. [Google Scholar] [CrossRef]
- Jomehzadeh, F.; Hussen, H.M.; Calautit, J.K.; Nejat, P.; Ferwati, M.S. Natural ventilation by windcatcher (Badgir): A review on the impacts of geometry, microclimate and macroclimate. Energy Build. 2020, 226, 110396. [Google Scholar] [CrossRef]

| Project | Building Specifications | Ref. |
|---|---|---|
| Qatar Passivhaus | Two 200 m2 villas compared: one built to Passivhaus standards (PHV), the other conventional (STV). PHV used 400 mm wall/roof insulation, 200 mm floor insulation, and triple glazing. PHV achieved 66% lower energy consumption than STV due to high thermal resistance and airtightness. | [60,61] |
| Ecohouse GUTech Oman | Compact cylindrical form cut solar radiation by 30%. Envelope included lightweight concrete-pumice blocks, perlite infill, and compressed earth bricks. Strategic window placement (no east/west openings) supported natural ventilation and daylighting. Cooling demand reduced by 90% vs. standard walls; projected 40% energy savings overall. | [62] |
| SABIC Home of Innovation: Riyadh | Featured a highly insulated, airtight envelope and 28 kW rooftop solar PV, achieving net-zero energy over 12 months. Used 40% less energy than a typical Saudi home. | [63] |
| Masdar City Eco-Villa: Abu Dhabi | Used 72% less energy than a typical Abu Dhabi villa. Combined passive design, high-performance insulation, and efficient systems with rooftop solar panels. Achieved 97 kWh/m2/year energy use. | [64] |
| Beirut Terraces: Lebanon | Passive cooling through staggered floor plates and deep overhangs reduced solar gain. Vegetated terraces improved air quality and microclimate. High-performance façade materials and glazing optimized daylight and thermal comfort. | [65] |
| Green Social Housing Initiative: Egypt | The apartment buildings were 30% more energy-efficient than standard units. Achieved via optimized orientation, natural ventilation, thicker insulated walls, and rooftop solar PV. | [66] |
| Hatta Solar Villa: Dubai | Retrofitted 554 villas with rooftop 4.5 kW solar PV systems each. The system generated approximately 3.6 GWh per year in total, reduced grid reliance, and supported Dubai’s 30% demand reduction goal by 2030. | [67] |
| Trombe Wall Passive Cooling/Heating: Egypt | Retrofited an uninsulated masonry apartment block with nanomaterial-based wall insulation and double-glazed windows reduced total energy use by 47.6%. Wall insulation alone saved 23%, glazing 26%. | [68] |
| Green Affordable Housing Initiative: Jordan | Retrofitted 48 homes and built 3 new low-cost green homes for vulnerable families. Upgrades included thermal insulation, double-glazing, solar water heaters, low-flow fixtures, and rainwater harvesting. Results saw noticeable energy and water savings, improved comfort, better indoor air quality, and strong community engagement. Recognized as a scalable model for affordable green housing in Arab regions. | [69] |
| Residential Retrofit Strategy: Jordan | Deep retrofits (insulation, glazing, HVAC, solar water heaters) projected to cut 43% of annual electricity use and reduce national peak demand by 842 MW. Pilot homes showed improved comfort and lower bills. | [70] |
| Building Parameters | Base Case Assumptions |
|---|---|
| Location | Riyadh, Saudi Arabia |
| Height | 7.6 m |
| Storey | 2 |
| Form | Rectangular- spread |
| Typical floor GFA | 172 m2 |
| Floor- floor height | 3.5 |
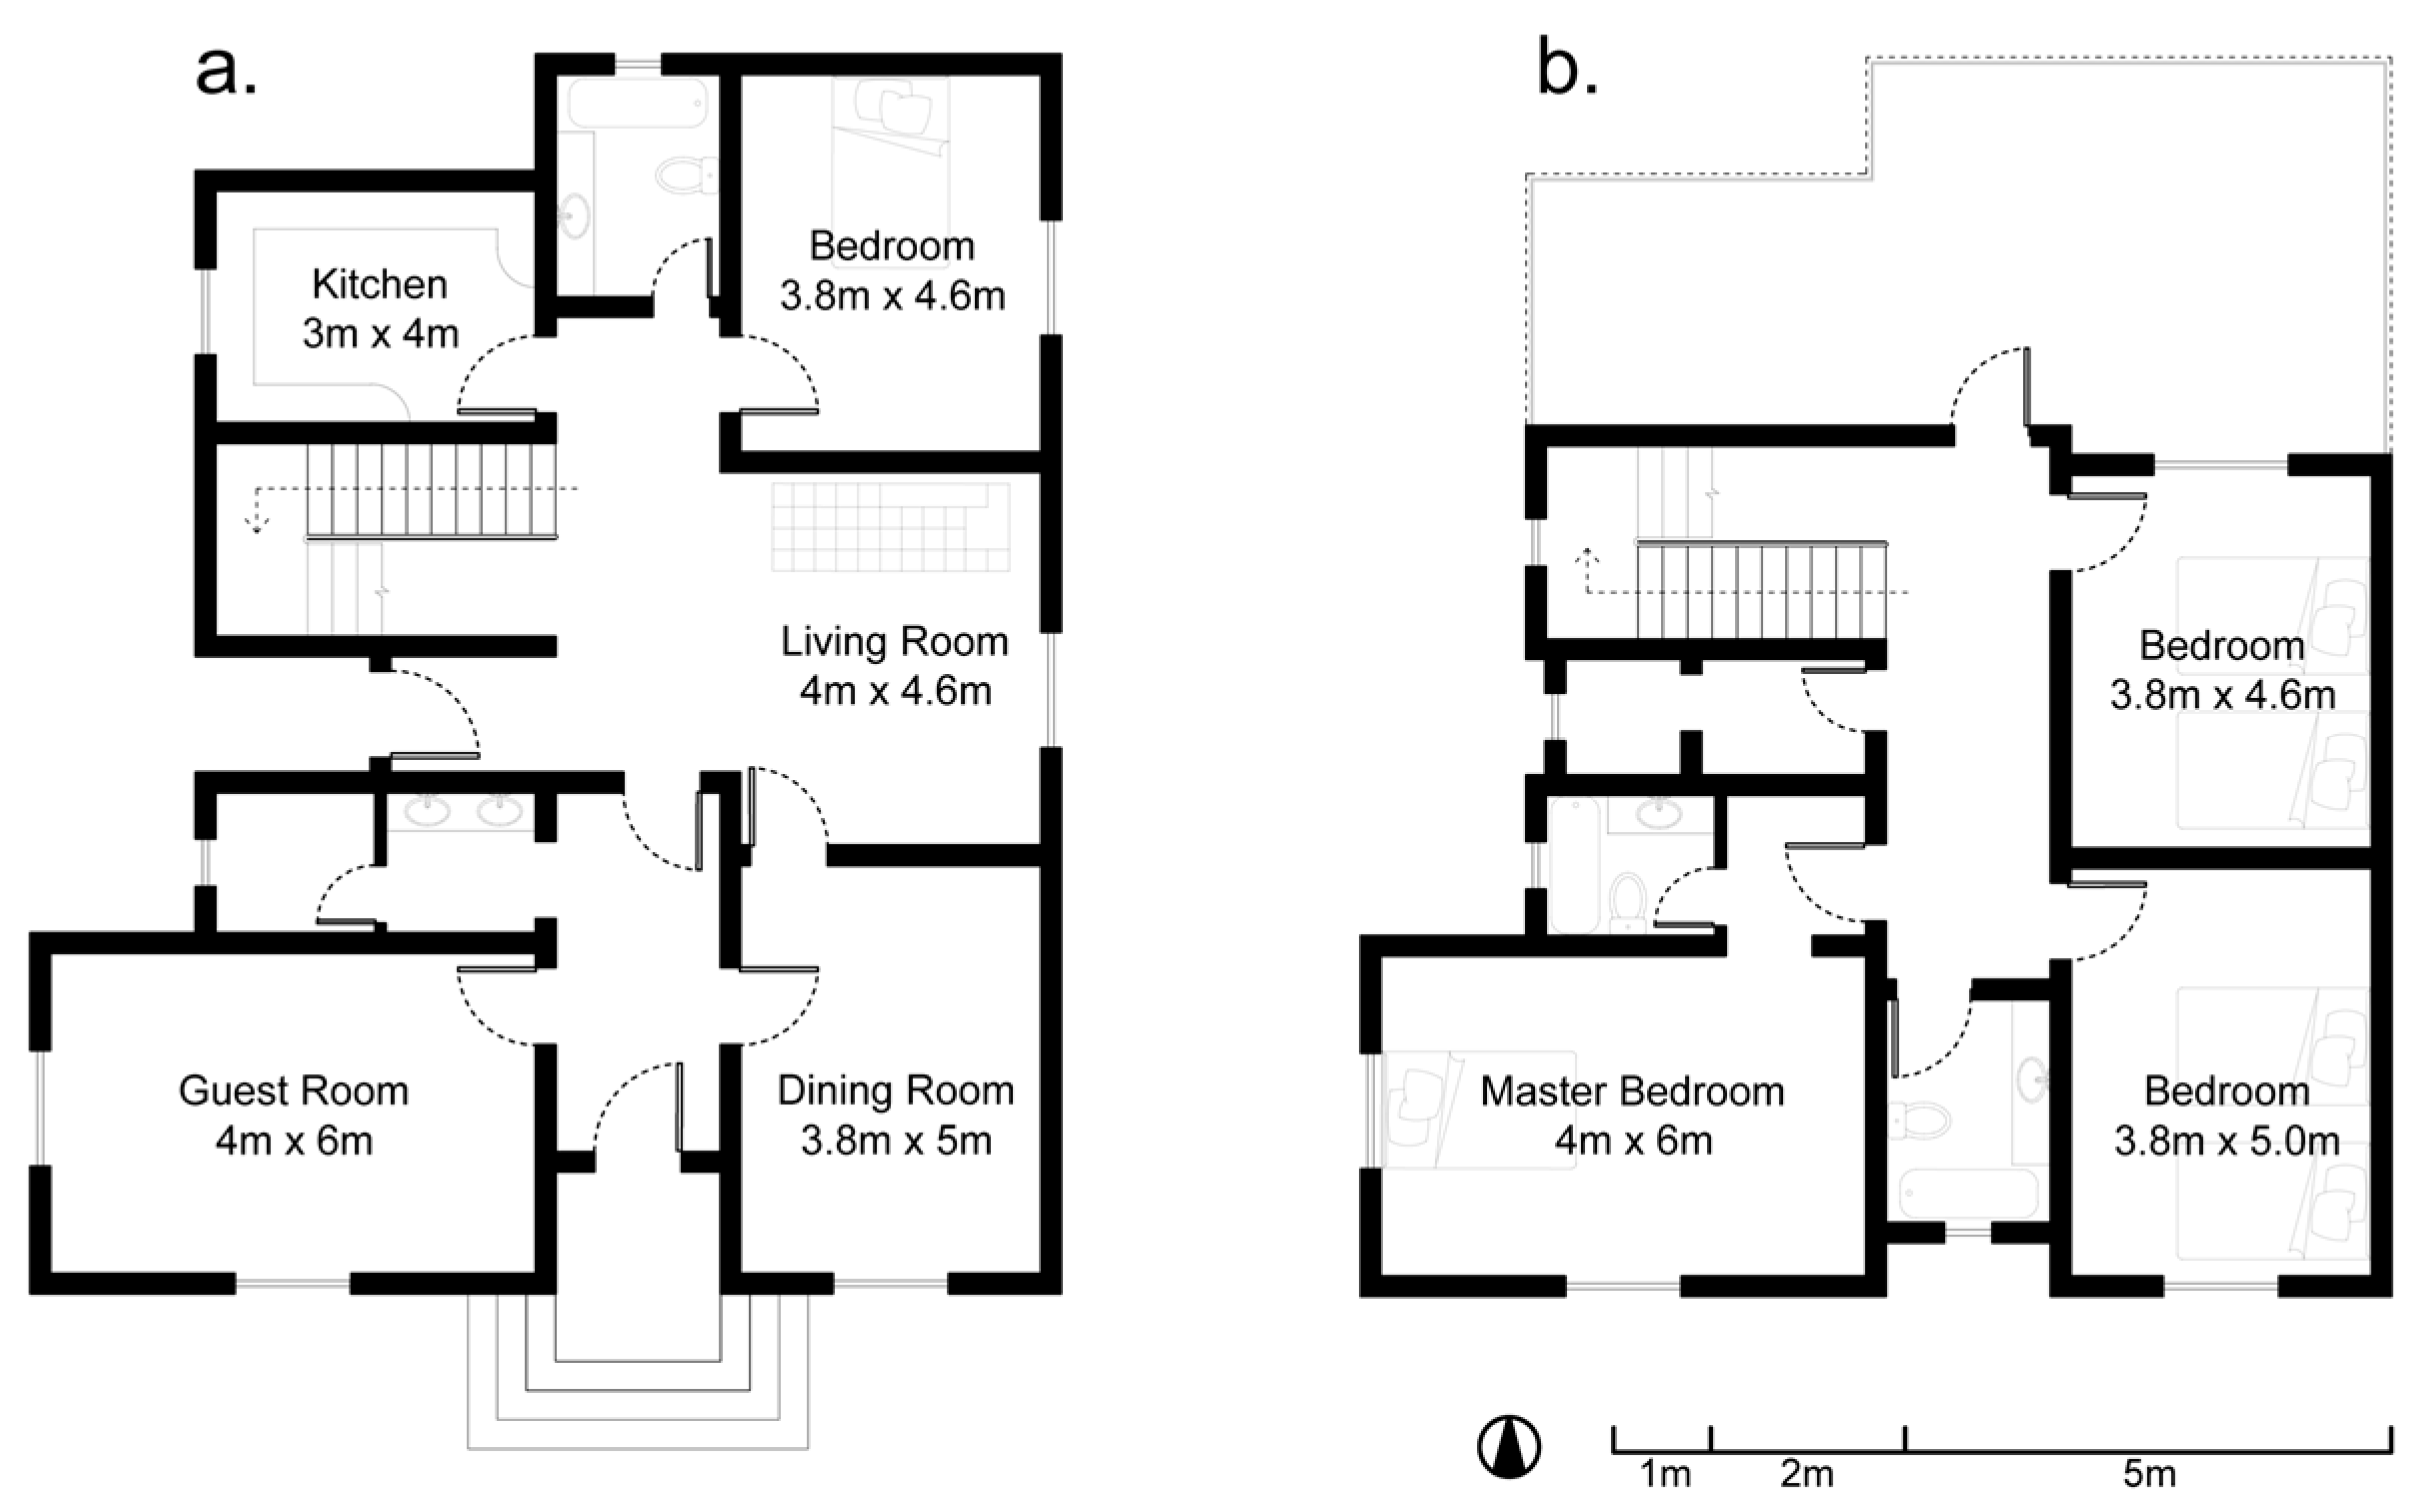
| Ground floor planning | Kitchen, living room, bedroom, guest and dining room |
| First floor planning | Master bedroom, regular bedroom |
| Window-to-wall ratio | 15% |
| Typical glazed window | 1.73 m2 |
| External wall | Concrete blocks (20 cm thick) |
| Slabs | Concrete (20 cm thick) |
| Occupancy Schedules and Analysis Considerations | |||
|---|---|---|---|
| Number of occupants | 4 | ||
| Infiltration | 0.7 ACH | ||
| Sensible loads | Living space: 180 W | Master bed: 80 W | Other bed: 80 W |
| Lighting power (LED) | 2 W/m2 | ||
| Occupant heat gain | Zone | Sensible heat | Latent heat |
| Living | 225 | 165 | |
| Bedroom | 150 | 110 | |
| Kitchen | 150 | 110 | |
| PCS 1 | Description | Testing Parameter |
|---|---|---|
| PCS1 | Window-to-wall ratio | 20%: Base case |
| 15% | ||
| 10% | ||
| PCS2 | Fabric | Base-case |
| Insulated concrete wall | ||
| Insulated- clay brick wall | ||
| PCS3 | Glazing | Single glazed: Base case |
| Double glazed | ||
| PCS4 | Shading | Calculate shading |
| Crate shading | ||
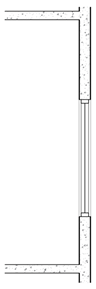
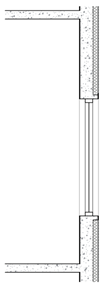
| PCS5 | Wind tower | WT1 2: Open wind-tower |
| WT2: Split wind-tower | ||
| WT3: Split wind-tower: 3 m shorter | ||
| WT4: Split wind-tower: 3 m taller | ||
| WT5: Split wind-tower: reduced aperture | ||
| WT6: Split wind-tower: closed on the east and west |
| Scenarios | Current | 2050 | 2080 |
|---|---|---|---|
| Air temperature (°C) | 30.22 | 33.12 | 35.16 |
| Total cooling plant sensible load (kW) | 89.45 | 120.67 | 144.13 |
| WWR Ratio | 5% | 10% | 15%% | 20% |
|---|---|---|---|---|
| Living room | 0.81 m2 | 1.62 m2 | 2.42 m2 | 3.20 m2 |
| Master bedroom | 1.05 m2 | 2.10 m2 | 3.15 m2 | 4.20 m2 |
| Single Glazed | Double Glazed | Double Glazed | |
|---|---|---|---|
| Thickness | 4 mm | 24 mm | 24 mm |
| Glass construction (From out to in) | Aluminium Cladding (4 mm) Unventilated Air Cavity (100 mm) Gypsum Blocks (60 × 60 × 10 cm) | Glass (4 mm) Air (16 mm) Glass (4 mm) | Glass (4 mm) Argon (16 mm) Glass (4 mm) |
| U-Value | 2.7 W/m2K | 2.7 W/m2K | 1.3 W/m2K |
 |  |  |  | |
|---|---|---|---|---|
| Base-Case Typical (BCT) | Insulated Concrete (INC) | Insulated Clay-Brick (ICB) | Low U-Value (TM) | |
| Thickness | 230 mm | 370 mm | 320 mm | 530 mm |
| Const. | Cement Plaster (15 mm) Concrete (200 mm) Cement Plaster (15 mm) | Cement Plaster (15 mm) Polyurethane board (90 mm) Concrete (250 mm) Cement Plaster (15 mm) | Cement Plaster (15 mm) Clay Brick (100 mm) Polyurethane board (90 mm) Clay brick (100 mm) Cement Plaster (15 mm) | Cement Plaster (15 mm) Polyurethane board (200 mm) Concrete (300 mm) Cement Plaster (15 mm) |
| U-Value | 2.736 W/m2K | 0.249 W/m2K | 0.244 W/m2K | 0.118 W/m2K |
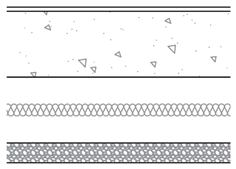 |  | |
|---|---|---|
| Insulated Ceiling | Thermal Mass Ceiling | |
| Thickness | 472 mm | 472 mm |
| Construction | Gravel bedding (60 mm) Cement plaster (12.7 mm) Polyurethane board (200 mm) Concrete (200 mm) Cement Plaster (12.7 mm) | Layers from outside to inside Gravel bedding (60 mm) Cement plaster (12.7 mm) Polyurethane board (80 mm) Concrete (320 mm) Cement Plaster (12.7 mm) |
| U-Value | 0.110 W/m2K | 0.275 W/m2K |
| WWR Ratio | Fabric Component | Glazing | Combination |
|---|---|---|---|
| 20% | Base case typical (BCT) | Single glazed | 20-BCT-SG |
| Double glazed | 20-BCT-DG | ||
| Doubled glazed Ar. | 20-BCT-AR | ||
| 15% | Single glazed | 15-BCT-SG | |
| Double glazed | 15-BCT-DG | ||
| Doubled glazed Ar. | 15-BCT-AR | ||
| 10% | Single glazed | 10-BCT-SG | |
| Double glazed | 10-BCT-DG | ||
| Doubled glazed Ar. | 10-BCT-AR | ||
| 5% | Single glazed | 5-BCT-SG | |
| Double glazed | 5-BCT-DG | ||
| Doubled glazed Ar. | 5-BCT-AR | ||
| 20% | Insulated concrete (INC) | Single glazed | 20-INC-SG |
| Double glazed | 20-INC-DG | ||
| Doubled glazed Ar. | 20-INC-AR | ||
| 15% | Single glazed | 15-INC-SG | |
| Double glazed | 15-INC-DG | ||
| Doubled glazed Ar. | 15-BCT-AR | ||
| 10% | Single glazed | 10-INC-SG | |
| Double glazed | 10-INC-DG | ||
| Doubled glazed Ar. | 10-INC-AR | ||
| 5% | Single glazed | 5-INC-SG | |
| Double glazed | 5-INC-DG | ||
| Doubled glazed Ar. | 5-INC-AR | ||
| 20% | Insulated clay brick (ICB) | Single glazed | 20-ICB-SG |
| Double glazed | 20-ICB-DG | ||
| Doubled glazed Ar. | 20-ICB-AR | ||
| 15% | Single glazed | 15-ICB-SG | |
| Double glazed | 15-ICB-DG | ||
| Doubled glazed Ar. | 15-ICB-AR | ||
| 10% | Single glazed | 10-ICB-SG | |
| Double glazed | 10-ICB-DG | ||
| Doubled glazed Ar. | 10-ICB-AR | ||
| 5% | Single glazed | 5-ICB-SG | |
| Double glazed | 5-ICB-DG | ||
| Doubled glazed Ar. | 5-ICB-AR | ||
| 20% | Low U-value const. (TM) | Single glazed | 20-TM-SG |
| Double glazed | 20-TM-DG | ||
| Doubled glazed Ar. | 20-TM-AR | ||
| 15% | Single glazed | 15-TM-SG | |
| Double glazed | 15-TM-DG | ||
| Doubled glazed Ar. | 15-TM-AR | ||
| 10% | Single glazed | 10-TM-SG | |
| Double glazed | 10-TM-DG | ||
| Doubled glazed Ar. | 10-TM-AR | ||
| 5% | Single glazed | 5-TM-SG | |
| Double glazed | 5-TM-DG | ||
| Doubled glazed Ar. | 5-TM-AR |
| Parameter | 5% | 10% | 15% | 20% |
|---|---|---|---|---|
| BCT SG | 88.62 | 89.58 | 90.58 | 91.49 |
| BCT DG | 85.09 | 85.35 | 85.63 | 85.89 |
| BCT AR | 85.04 | 85.30 | 85.58 | 85.83 |
| INC SG | 68.87 | 69.50 | 70.17 | 70.81 |
| INC DG | 66.18 | 66.56 | 66.95 | 67.32 |
| INC AR | 66.13 | 66.50 | 66.88 | 67.25 |
| TM SG | 67.89 | 68.54 | 69.22 | 69.86 |
| TM DG | 65.18 | 65.56 | 65.96 | 66.34 |
| TM AR | 65.13 | 65.50 | 65.90 | 66.27 |
| ICB SG | 68.92 | 69.56 | 70.23 | 70.87 |
| ICB DG | 66.24 | 66.61 | 67.00 | 67.37 |
| ICB AR | 66.18 | 66.55 | 66.94 | 67.30 |
| File | Minimum °C | Maximum °C | Mean °C | Mean Load | Solar Gain |
|---|---|---|---|---|---|
| BCT SG | 9.76 °C | 47.57 °C | 30.20 °C | 1.295 kW | 0.439 kW |
| BCT DG | 9.91 °C | 47.01 °C | 20.92 °C | 1.185 kW | 0.202 kW |
| BCT AR | 9.94 °C | 47.02 °C | 29.94 °C | 1.185 kW | 0.201 kW |
| WWR Ratio | 5% | 10% | 15% | 20% | |
|---|---|---|---|---|---|
| BCT SG Base-case | Average | 29.78 | 29.89 | 30.19 | 30.37 |
| Maximum | 46.75 | 47.11 | 47.57 | 47.92 | |
| Minimum | 9.67 | 9.79 | 9.76 | 9.73 | |
| BCT SG Calculated | Average | 29.69 | 29.80 | 29.93 | 30.14 |
| Maximum | 46.75 | 47.11 | 47.47 | 47.92 | |
| Minimum | 9.57 | 9.66 | 9.61 | 9.55 | |
| BCT SG Crate | Average | 29.64 | 29.62 | 29.79 | 29.90 |
| Maximum | 46.76 | 47.1 | 47.53 | 47.86 | |
| Minimum | 9.42 | 9.36 | 9.31 | 9.35 |
| Wind Tower Specifications | |
|---|---|
| Tower height | 13.3 m |
| Tower cross section | 2.3 × 1.5 m |
| Wind catcher openings | 1.6 × 2.5 m broad end; 1.6 × 1.9 m short end |
| Intra- floor supply openings | 0.7 m × 2.2 m broad end; 0.7 × 1.6 m short end |
| Scenarios | Current | 2050 | 2080 |
|---|---|---|---|
| Air temperature (°C) | 30.22 | 33.12 | 35.16 |
| Total cooling plant sensible load (kW) | 89.45 | 120.67 | 144.13 |
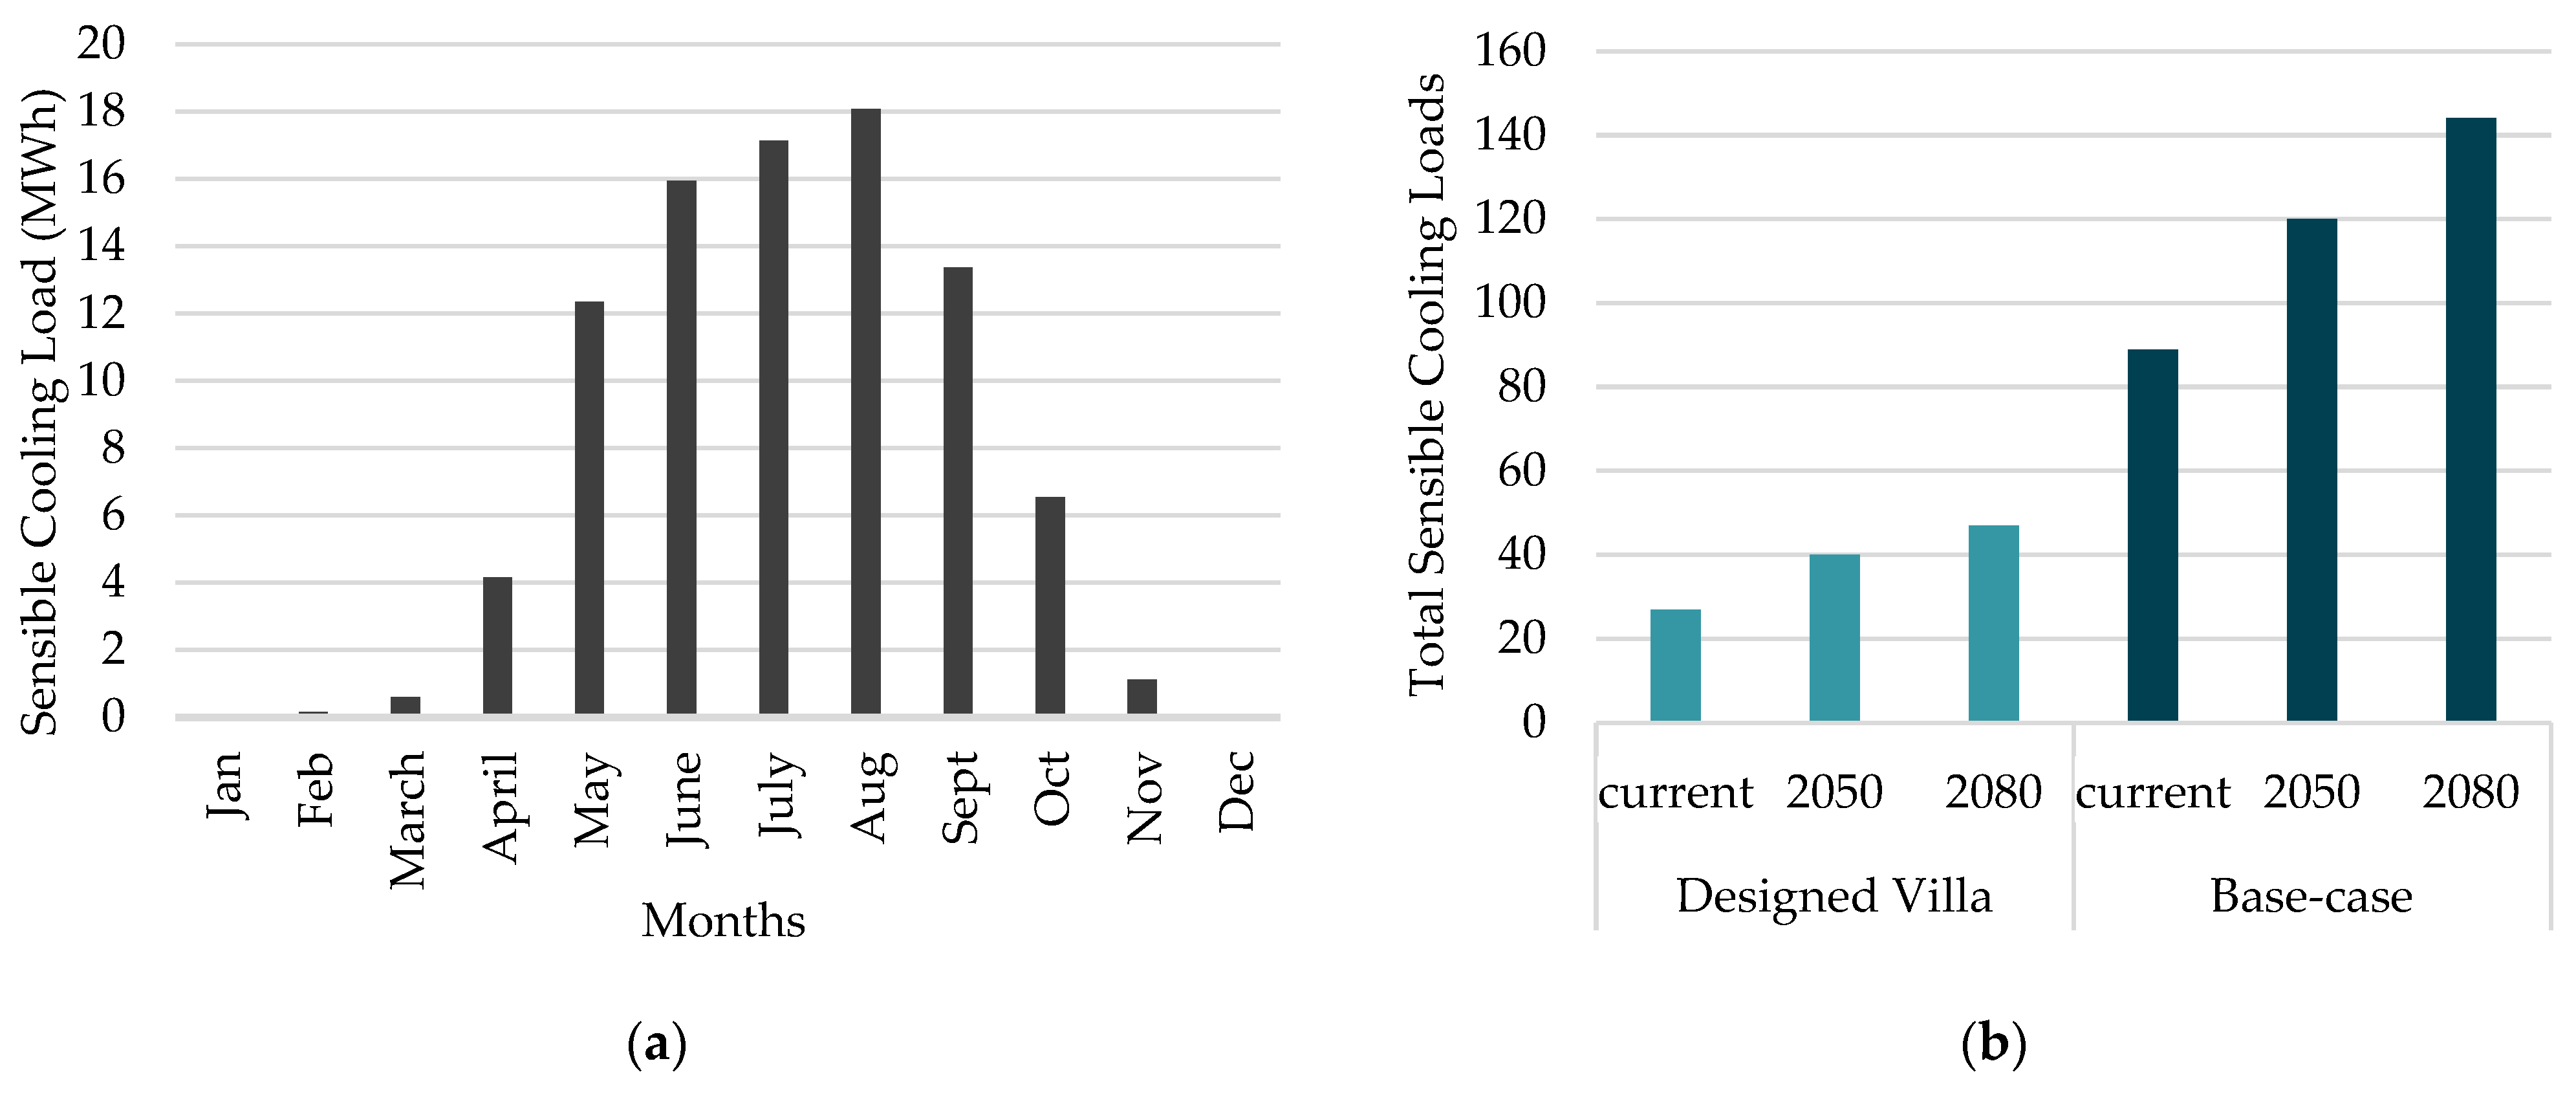
| Scenarios | Current | 2050 | 2080 |
|---|---|---|---|
| Air temperature (°C) | 29.92 | 32.13 | 34.15 |
| Total cooling plant sensible load (kW) | 28.23 | 39.53 | 47.82 |
| Improvement over base case | 68.4% | 67.24% | 66.82% |
Disclaimer/Publisher’s Note: The statements, opinions and data contained in all publications are solely those of the individual author(s) and contributor(s) and not of MDPI and/or the editor(s). MDPI and/or the editor(s) disclaim responsibility for any injury to people or property resulting from any ideas, methods, instructions or products referred to in the content. |
© 2025 by the authors. Licensee MDPI, Basel, Switzerland. This article is an open access article distributed under the terms and conditions of the Creative Commons Attribution (CC BY) license (https://creativecommons.org/licenses/by/4.0/).
Share and Cite
Rodrigues, L.; Cherian, B.A.; Tokbolat, S. Reducing Cooling Energy Demand in Saudi Arabian Residential Buildings Using Passive Design Approaches. Buildings 2025, 15, 1895. https://doi.org/10.3390/buildings15111895
Rodrigues L, Cherian BA, Tokbolat S. Reducing Cooling Energy Demand in Saudi Arabian Residential Buildings Using Passive Design Approaches. Buildings. 2025; 15(11):1895. https://doi.org/10.3390/buildings15111895
Chicago/Turabian StyleRodrigues, Lucelia, Benjamin Abraham Cherian, and Serik Tokbolat. 2025. "Reducing Cooling Energy Demand in Saudi Arabian Residential Buildings Using Passive Design Approaches" Buildings 15, no. 11: 1895. https://doi.org/10.3390/buildings15111895
APA StyleRodrigues, L., Cherian, B. A., & Tokbolat, S. (2025). Reducing Cooling Energy Demand in Saudi Arabian Residential Buildings Using Passive Design Approaches. Buildings, 15(11), 1895. https://doi.org/10.3390/buildings15111895