


The Synergy and Accumulation Model for Analysis (SAMA): A Novel Approach to Transforming Risk Analysis in Construction with a Focus on the Deepwater Horizon Disaster Case


Abstract
1. Introduction
2. Literature Review
2.1. Why RM and SCM?
2.2. Literature on the Swiss Cheese Model (SCM)
2.3. Literature on Risk Matrix Model (RM)
2.4. Conceptual Framework
3. Methodology
3.1. Conceptual Theoretical Principles of SAMA
3.2. Input Phase
3.2.1. Developing the Basic Structure of the Studied Case
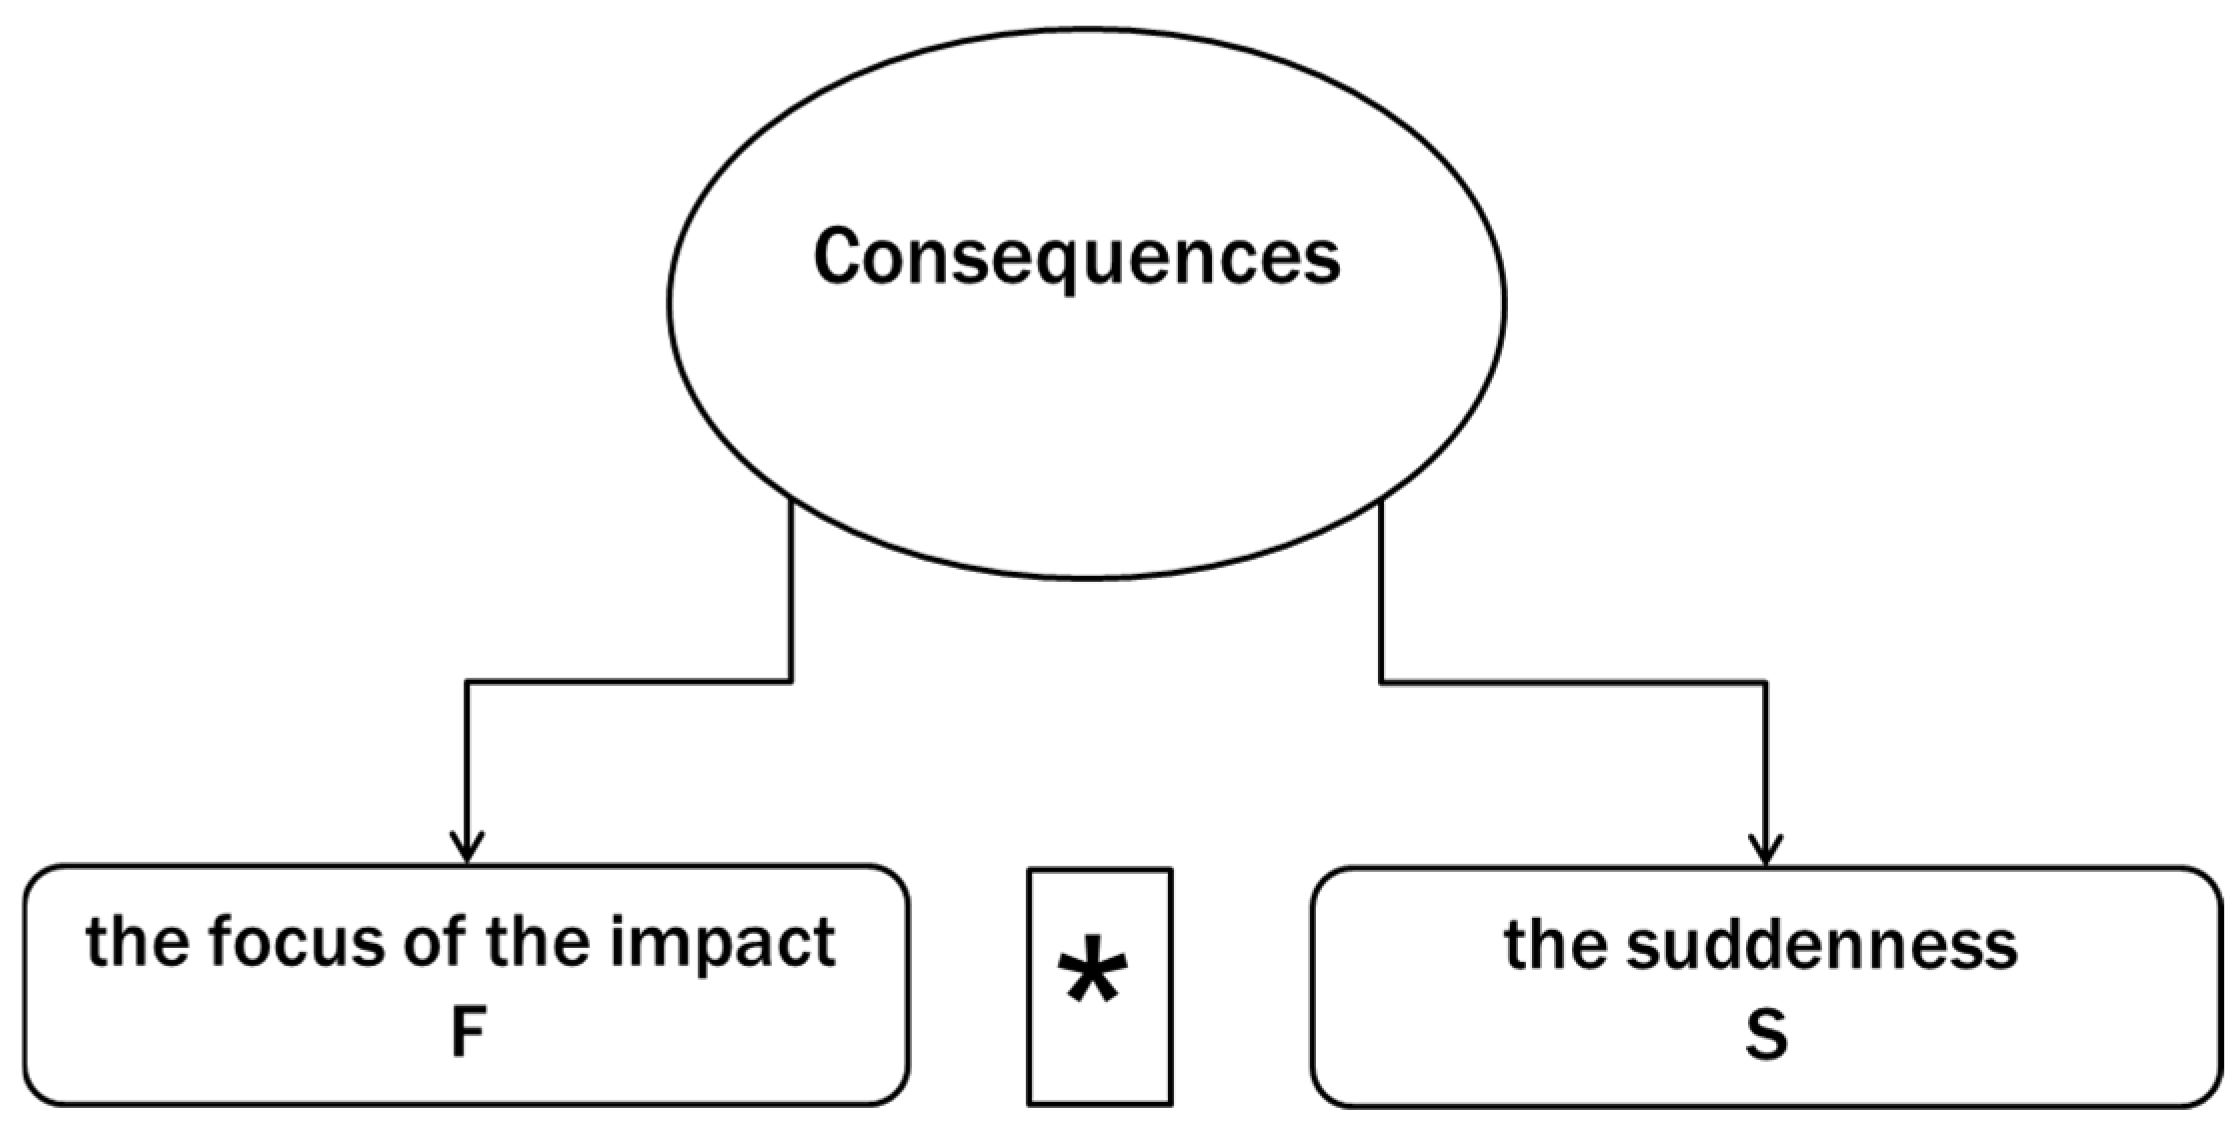
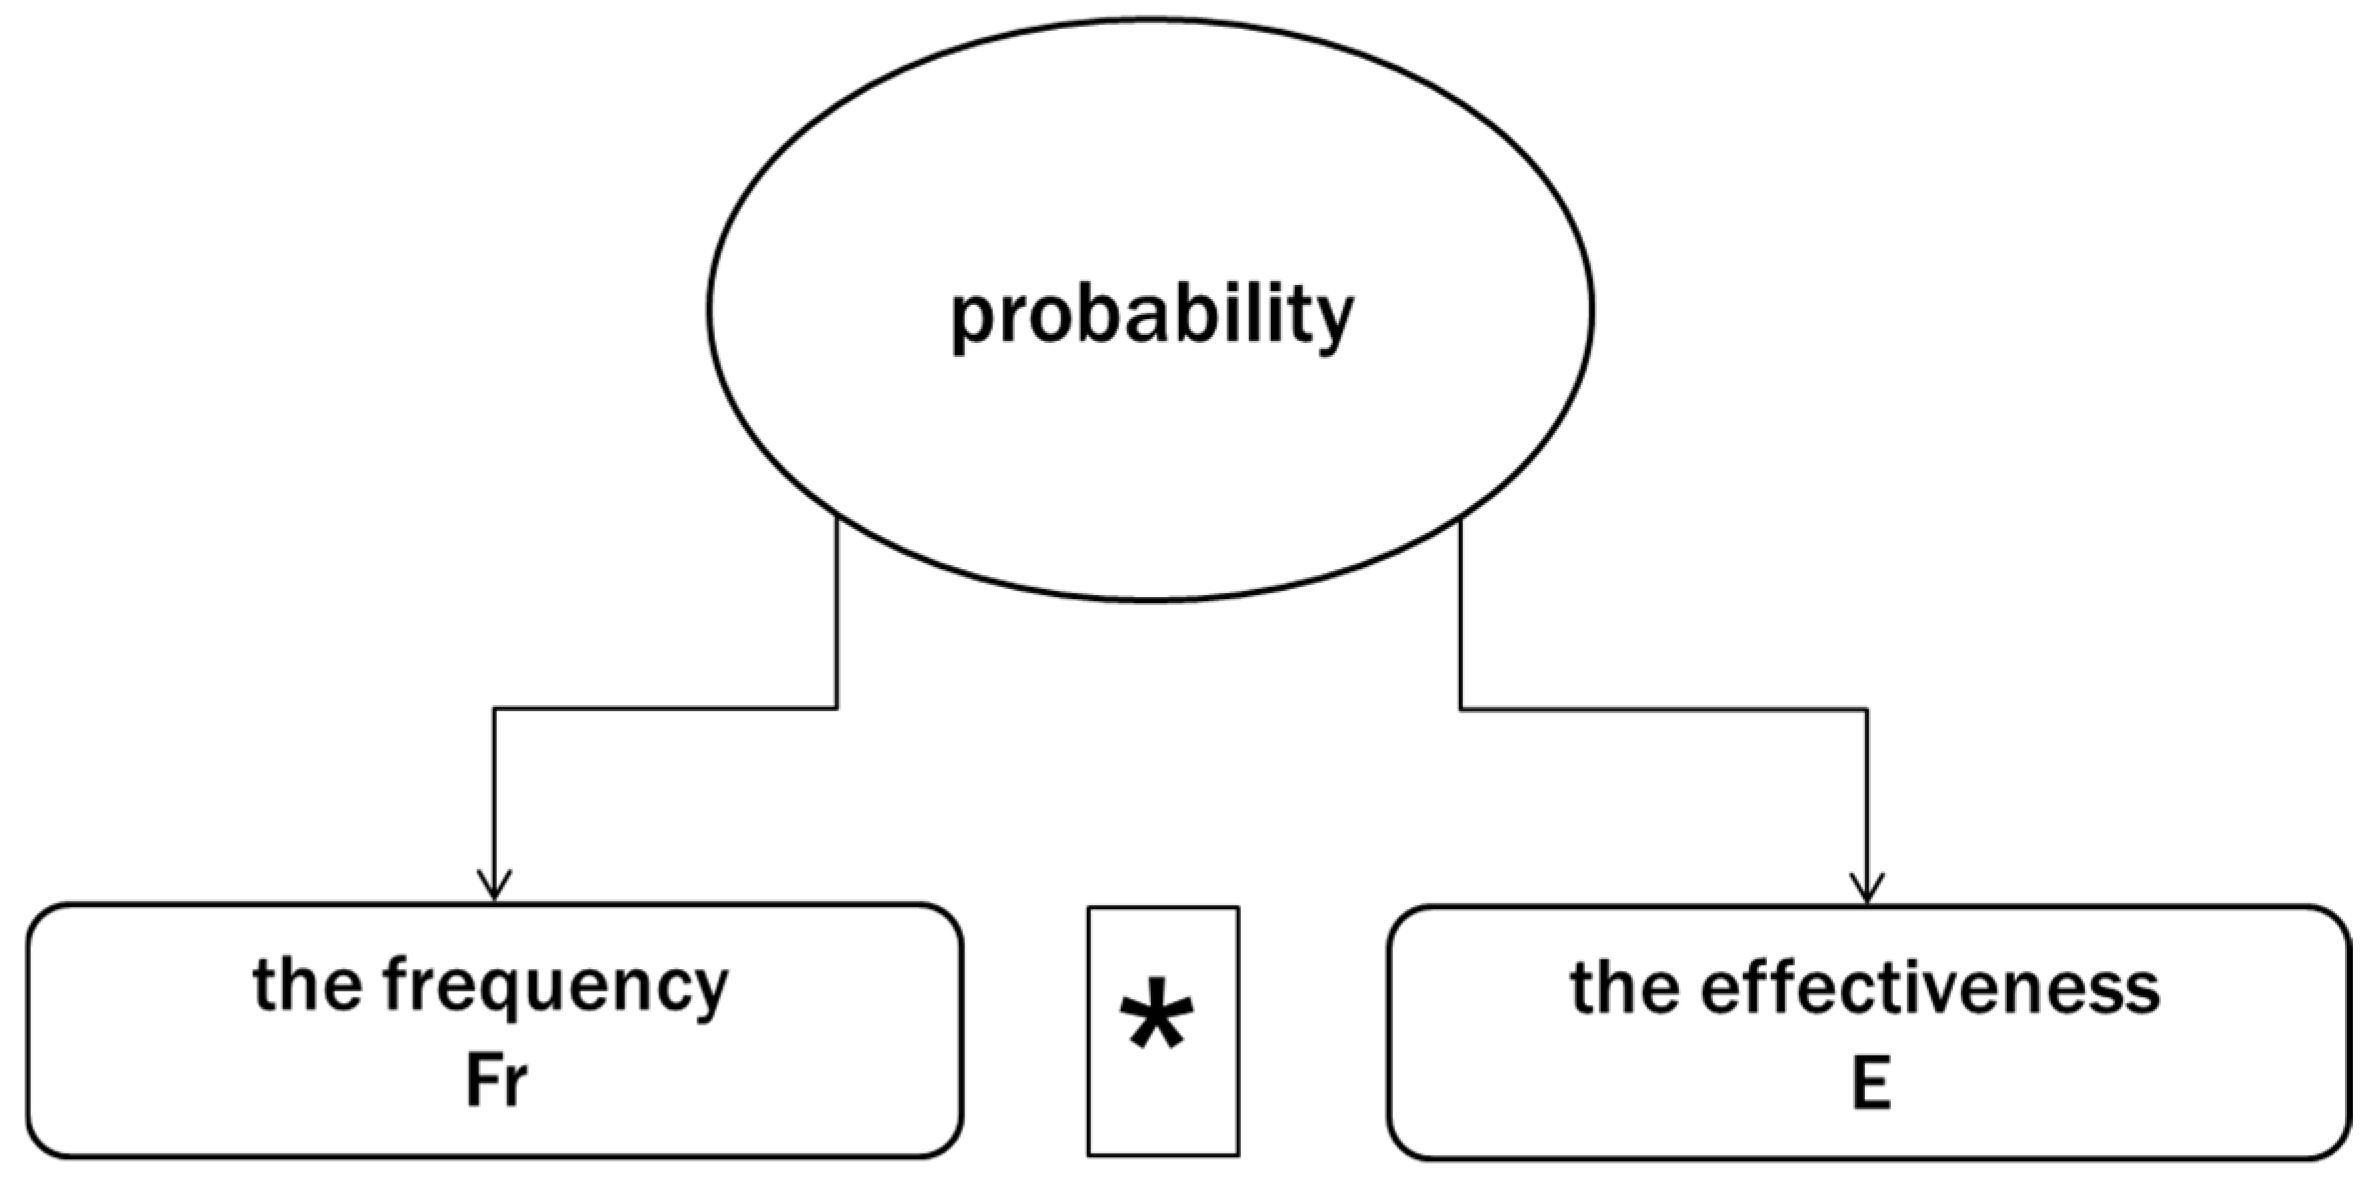
3.2.2. The New Definition of Constituent Risk Parameters
3.3. Processes Phase
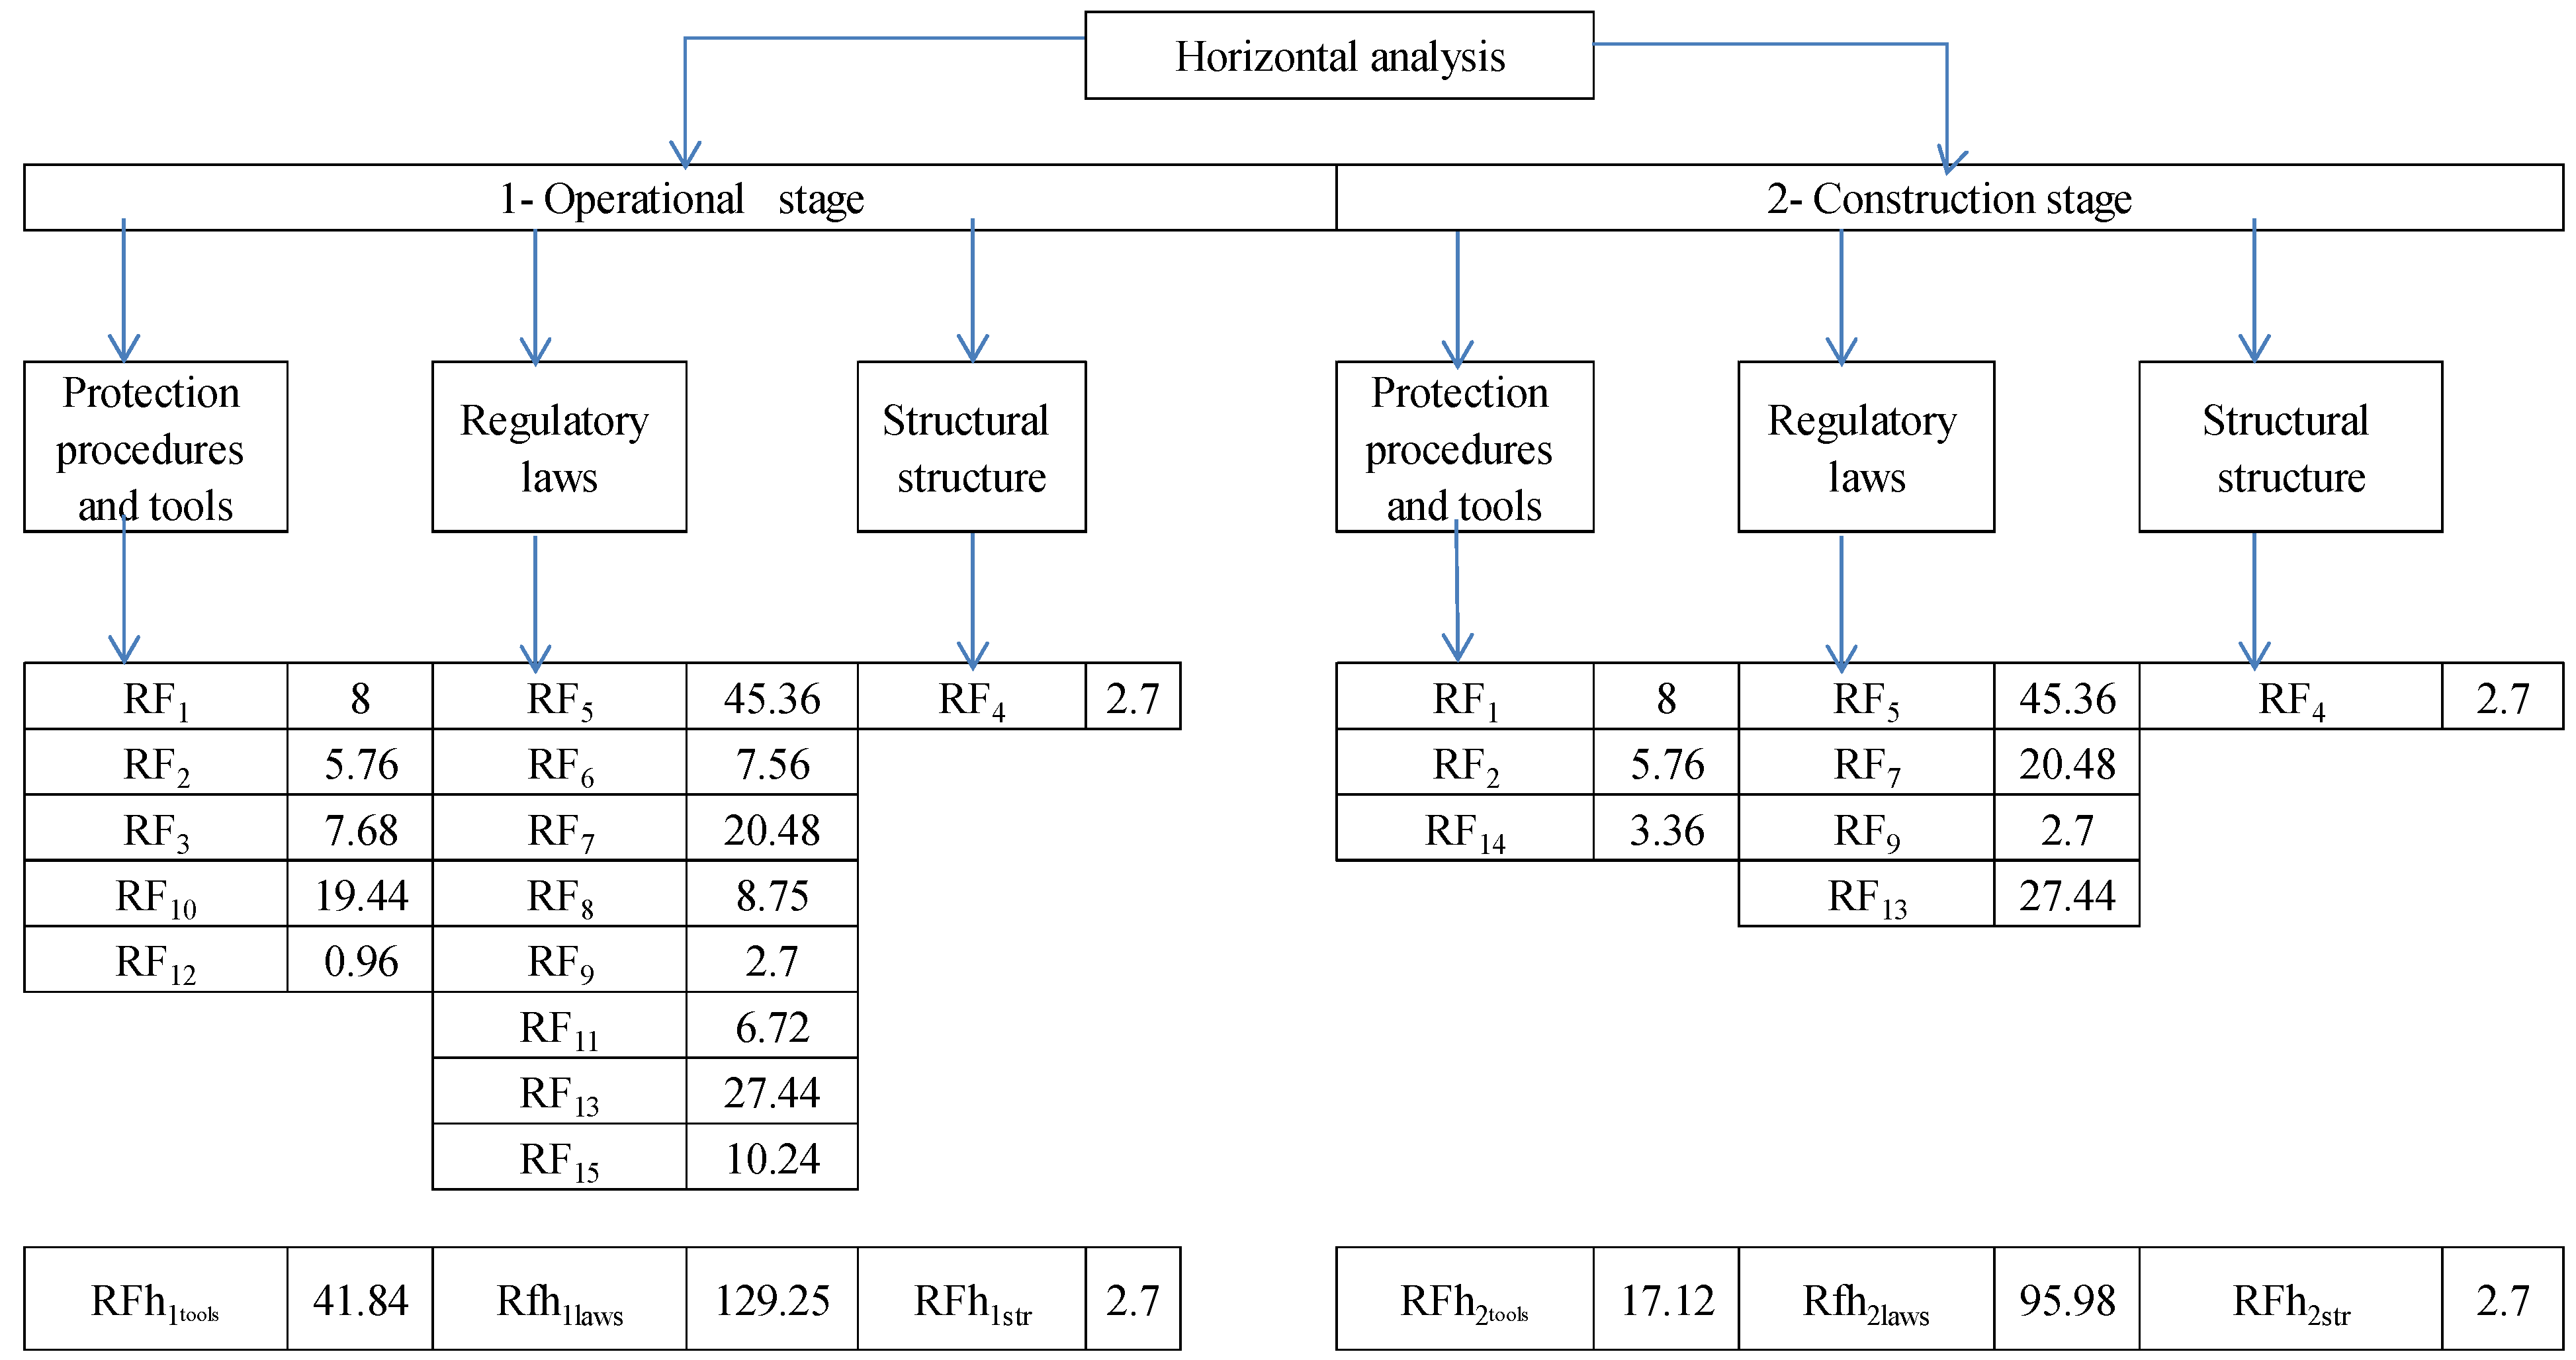
3.3.1. Horizontal Tracking and Analysis
- The horizontal analysis and evaluation of risks are predicated on identifying and assessing common risks during a specific phase in the project life cycle. This approach involves studying the impact of these risks within the designated stage, primarily focusing on their effects on project resources as recipients of risk. Consequently, the method facilitates the identification and cumulative impact of shared risks in terms of both temporal occurrence and resource utilization.
- The proposed model exclusively considers risks with negative implications while disregarding those associated with positive outcomes.
- For horizontal analysis, segmented objectives or any other suitable delineation that aligns with the project’s requirements may be employed rather than relying exclusively on resource-related considerations.
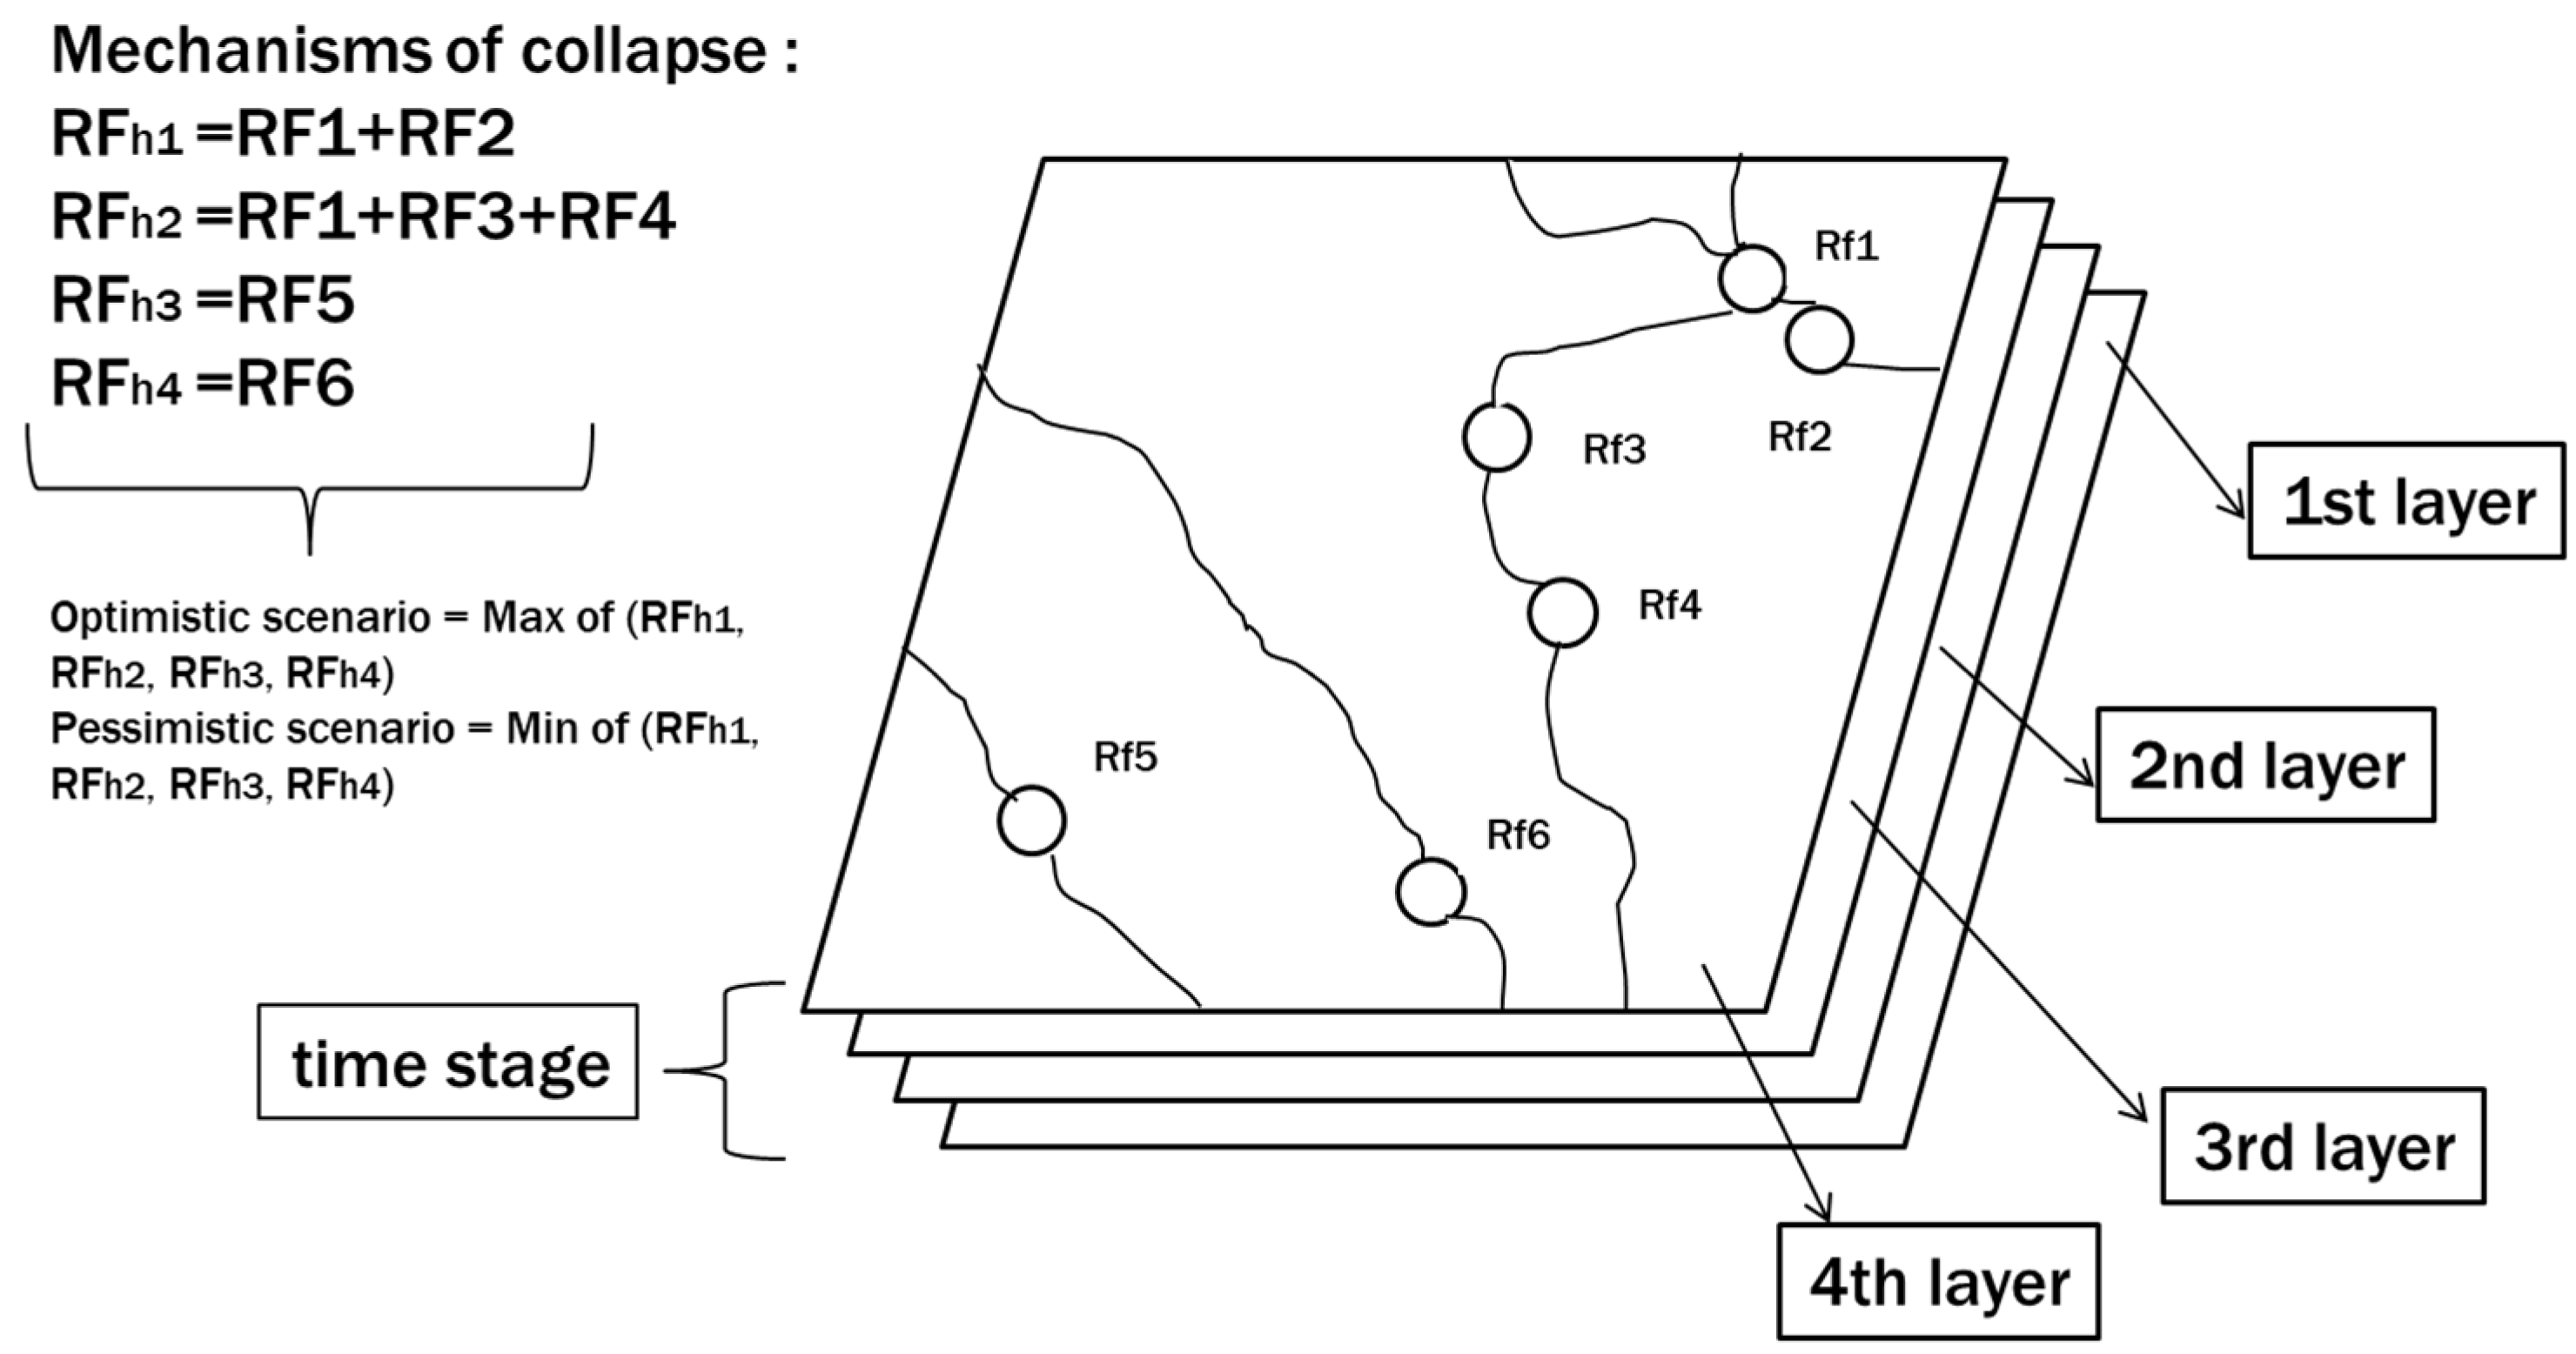
- Risks that manifest a similar impact can be grouped in the same risk path. Therefore, risks can be aggregated within a collapse paths mechanism when they affect a specific type of resource or recipient.
- The collapse path mechanisms shall be identified within each resource segment of a given project life cycle phase. Subsequently, the most optimistic and pessimistic scenarios are selected based on the following criteria:
- ○
- The highest horizontal Risk Factor (Max RFh) determines the most optimistic scenario;
- ○
- The lowest horizontal risk factor (Min RFh) determines the most pessimistic scenario.
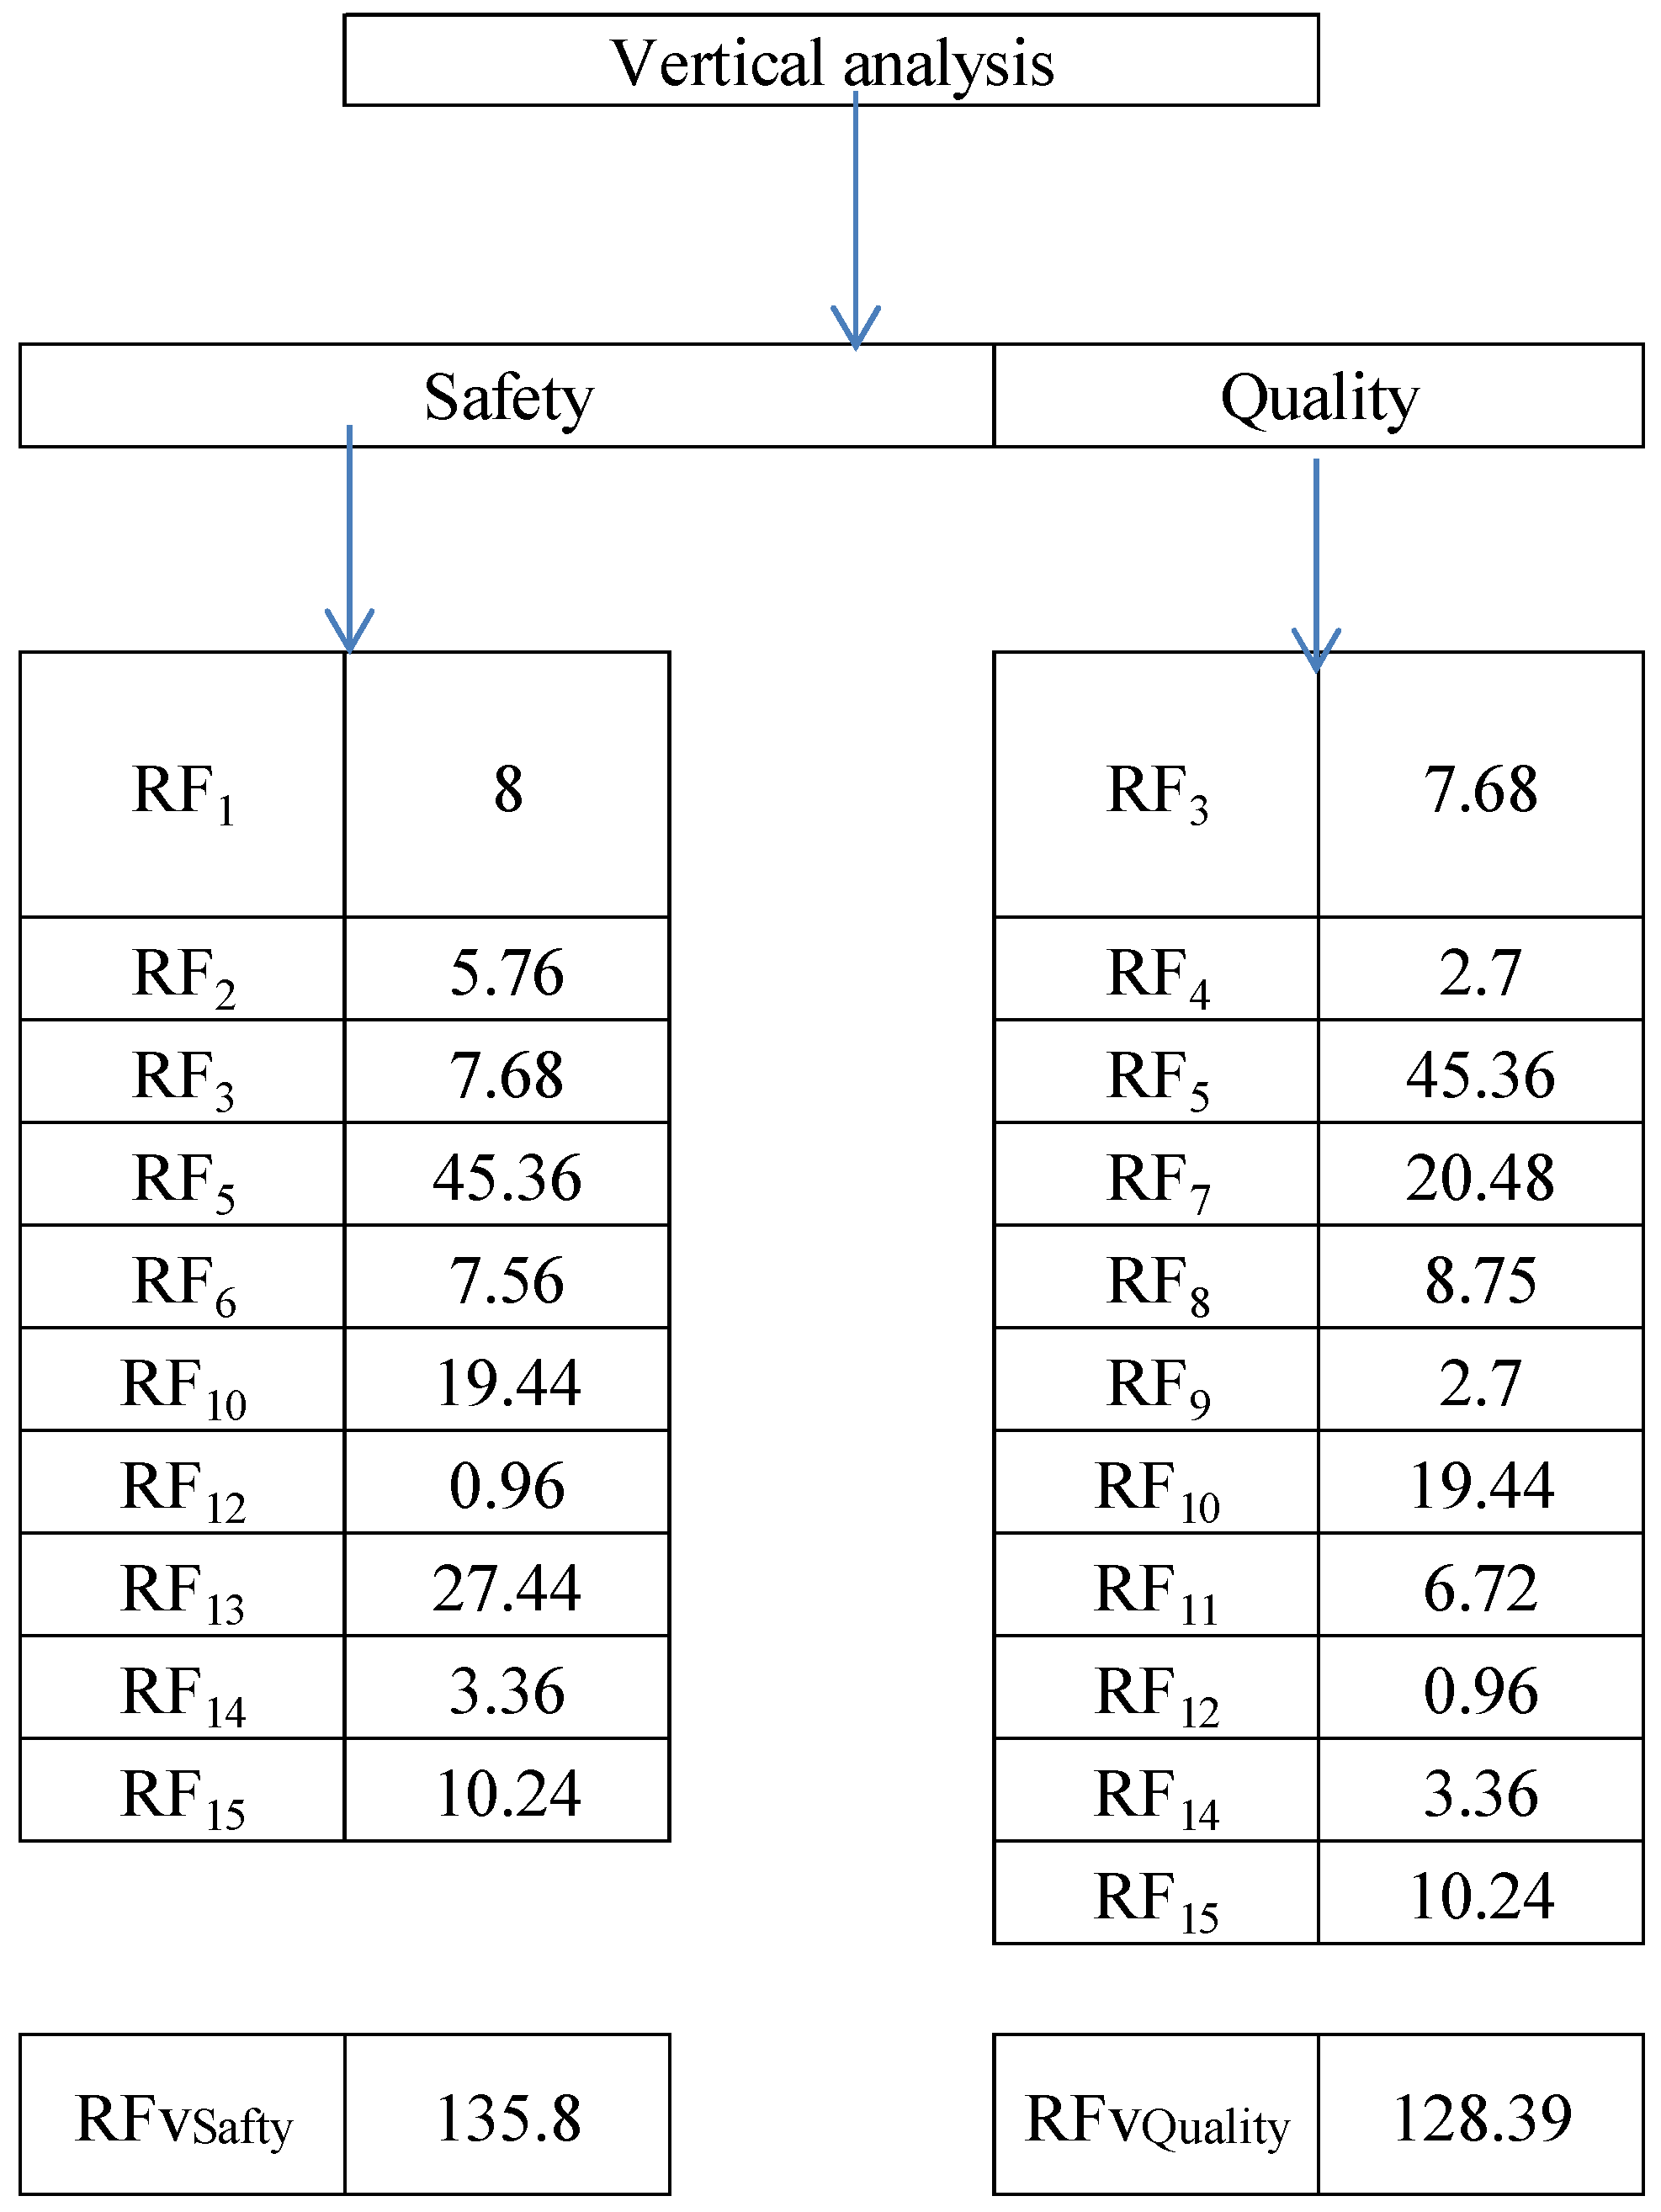
3.3.2. Vertical Tracking and Analysis:
- The progression of the project, embraced by defensive layers or stages in the Swiss cheese model, necessitates an exact definition based on the project life cycle. If warranted by the project’s significance and magnitude, a solitary stage may be subdivided into several segments corresponding to the specific project.
- Determining the significance of the defensive layers is paramount. The impact diagram and the cost associated with responding to risks, as expounded in the relevant literature [61], indicate that addressing risks may prove more arduous in the project’s later stages than in the early stages. The model advocates assigning greater weight to the defensive layers, which exhibit a higher risk factor whenever a stage progresses within the project life cycle. Estimating the value of this weight, ascribed to the defensive layer, necessitates considering the project’s importance, scope, precision required in risk analysis, and overall project duration, as shown in Figure 5.
- Certain risks solely impact a singular stage and do not reverberate across other stages. Consequently, these risks should be excluded from the analysis of the vertical risk trajectory unless they act as causative agents or catalysts for generating additional risks.
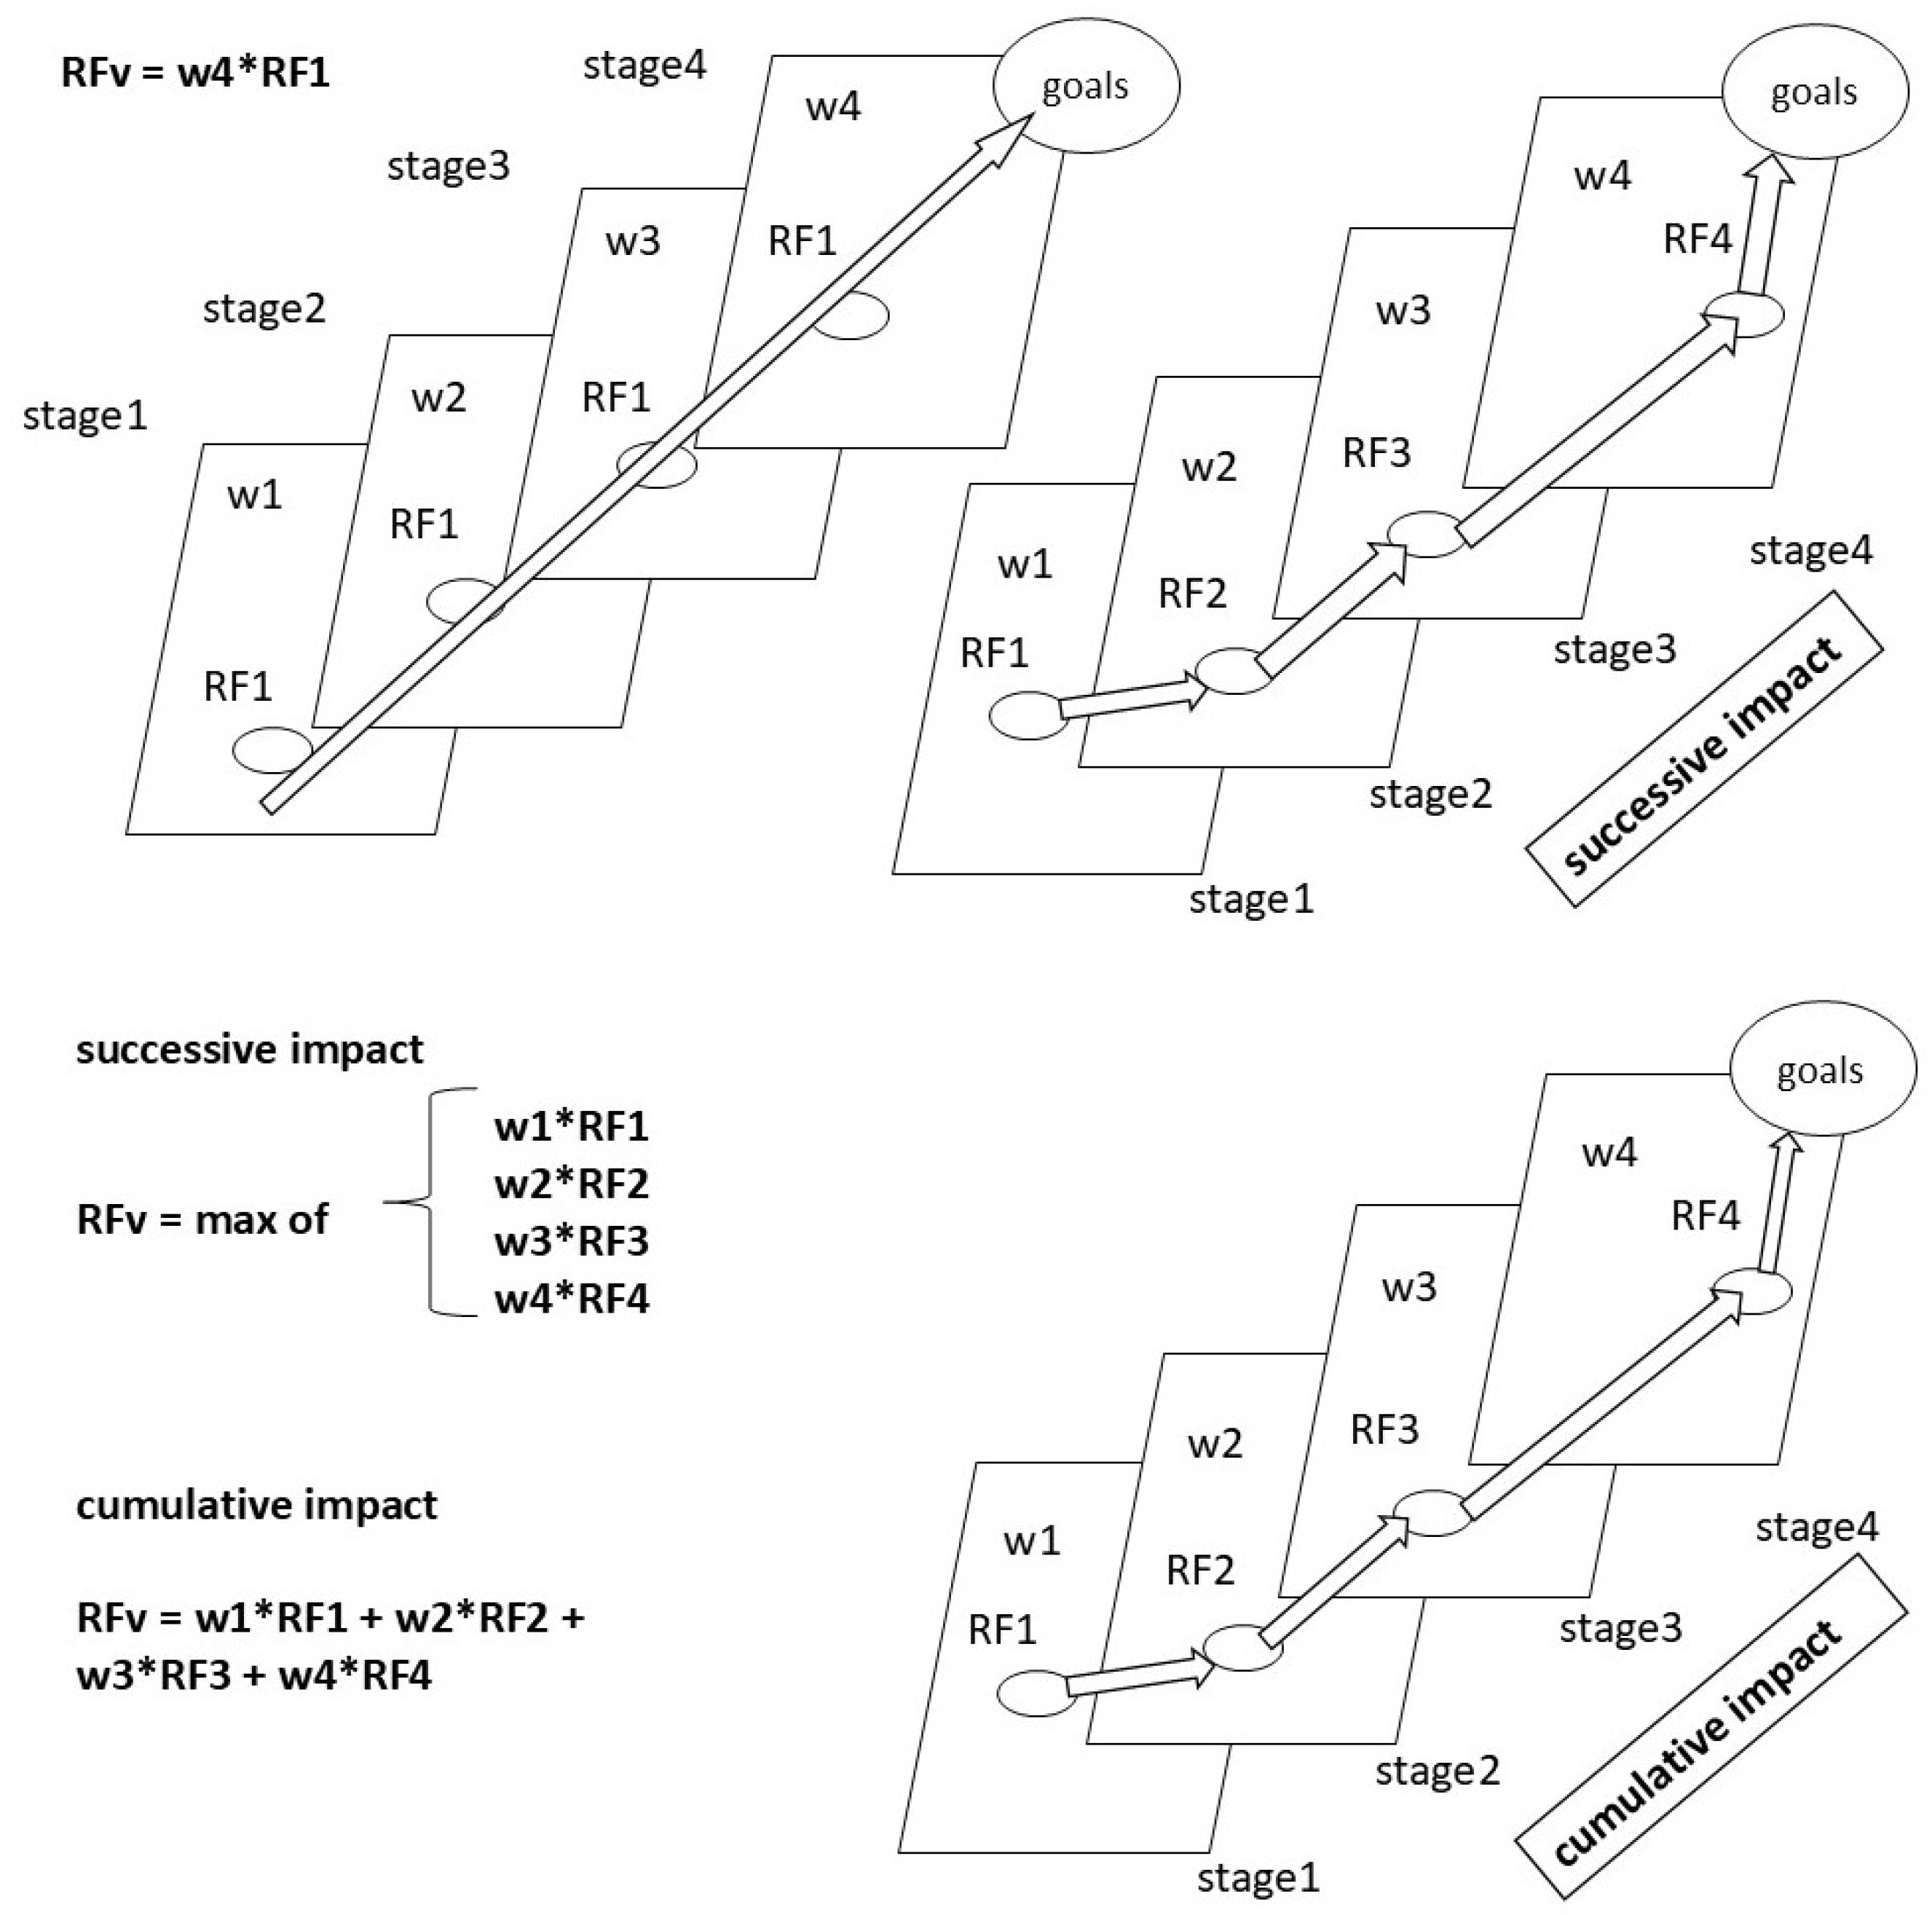
- There are risks that directly and primarily affect the project’s ultimate objectives, manifesting across all stages of the project life cycle. These risks align with the Swiss cheese model and warrant separate examination, resulting in the derivation of a final vertical risk factor (RFv) as Equation (4).
- Additionally, certain risks recur across multiple layers or demonstrate associations with risks in other layers. These risks may engender vertical overlap, cumulative effects, or cascading impacts, wherein the initial risk begets subsequent risks, and so forth.
- In the case of cumulative risks, it is logical to posit that the vertical risk factor is the aggregate of the risk factors, as in Equation (5), duly considering the weight assigned to each stage during the risk factor computation.
- When confronted with a situation involving successive impacts of risks, wherein the effect of one risk is implicitly embedded in the effect of another, careful consideration is required. For instance, let us consider the delay in the team’s arrival at the work site and the subsequent delay in delivering essential materials needed. Both cases result in the same effect. Traditionally, when multiple risks are present, the prevailing practice involves attributing the vertical risk factor to be equivalent to the final risk within the sequence, typically occurring during the later stages of the project’s life cycle. However, our proposed model challenges this convention by advocating for the assignment of the vertical risk factor based on the risk factor exhibiting the most significant influence within the analyzed series, as shown in Equation (6).
3.3.3. Assessing Risk Interactions
- Synergize: Two or more risks amplify one another’s effects. In order to check their cumulative impact, their RFh or RFv scores must be combined.
- Cancel out: certain risks may counteract each other. The combined score is adjusted downward to reflect the reduction, although ignoring the cancellation effect is safer.
- Overlap without synergy: When risks arise from a similar root cause but do not materially interact with one another, only the higher of the individual scores is counted to avoid double-counting.
3.4. Output Phase
3.4.1. Outputs and Implications Derived from the Computation of the Horizontal Risk Factor RFh
- RFh serves as a quantitative indicator of the risk level associated with a given time stage in the project life cycle. Consequently, it apprises management of the imperative need to intensify focus on risk management activities, particularly in stages characterized by heightened risk, thereby advancing the overall state of risk management.
- The computation of RFh facilitates the determination of resource management direction during a specific stage of the project life cycle. It provides insights into the requisite maximum and minimum resource allocations essential for effectively managing anticipated project risks at that stage. Consequently, the outcomes of the new model SAMA are linked to resource management, specifically if the defensive layers employed in the model encompass project resources.
- When employing staged objectives as defensive layers at each time stage, RFh aids in identifying the most hazardous risk combinations and synergy scenarios that threaten the staged objectives based on each time stage. By comparing these scenarios, predicated on the risk of attaining staged objectives as delineated by SAMA, it plays a pivotal role in diverse domains such as time management, quality management, and the strategic management of phased plans within the scrutinized project.
3.4.2. Outputs and Implications Derived from the Computation of the Vertical Risk Factor RFv
- Assessment of Impact Magnitude and Identification of At-Risk Goals: The utilization of RFv provides a means to gauge the magnitude of impact, thereby facilitating the evaluation of the extent to which identified risks or the synergy and accumulation of risks influence the project’s ultimate goals. These goals encompass crucial elements such as time, cost, and quality. By discerning the potential impact of risks on these vital goals, RFv emerges as a valuable instrument for identifying specific areas necessitating concentrated efforts to mitigate risks or allocate additional resources for their resolution. This, in itself, constitutes a form of goal management.
- Facilitating project comparisons: RFv contributes to the project selection by enabling a comparative analysis of different projects regarding their respective risk levels. Projects with lower risk levels may be perceived as more desirable investments than those with higher ones.
4. Case Study
4.1. Explanation of the Case Study
4.2. The Risks of the Macondo Well
- Cementing Process Failures: The cement job on the Macondo well, intended to seal the well from hydrocarbon zones, suffered significant failures. Post-incident investigations revealed that the cement slurry design and testing were flawed [63]. Halliburton, the contractor responsible for the cementing, was aware of the cement’s instability but did not adequately communicate these concerns, nor were they incorporated into the risk assessments [65].
- Blowout Preventer (BOP) Reliability: The BOP, a critical safety device designed to seal the well in case of uncontrolled pressure, was fraught with design and maintenance issues. Investigations revealed that the BOP had a dead battery and a miswired solenoid, which prevented it from functioning correctly during the blowout [64]. The compounded technical failures highlighted significant gaps in risk management practices.
- Kick Detection and Response: Kick detection, the process of identifying uncontrolled hydrocarbon flow, is critical in well operations. On the day of the blowout, there were clear signs of a kick that the crew either misinterpreted or ignored, leading to a delayed response [65]. The failure to emphasize the urgency and protocols for kick detection and response was a critical oversight.
- Negative Pressure Test Interpretation: The negative pressure test, used to ensure well integrity, was misinterpreted by the rig crew. Conflicting pressure readings during the test were disregarded, leading to the erroneous conclusion that the well was secure [68]. This false sense of security directly resulted from not recognizing the criticality of correctly interpreting negative pressure tests.
- Emergency Disconnect System (EDS) Activation: The EDS, designed to allow the rig to disconnect from the well in case of a blowout, failed during the incident. Attempts to activate the EDS were unsuccessful, exacerbating the disaster [66]. The underestimation of the EDS’s critical role and potential failure modes highlighted significant gaps in risk management.
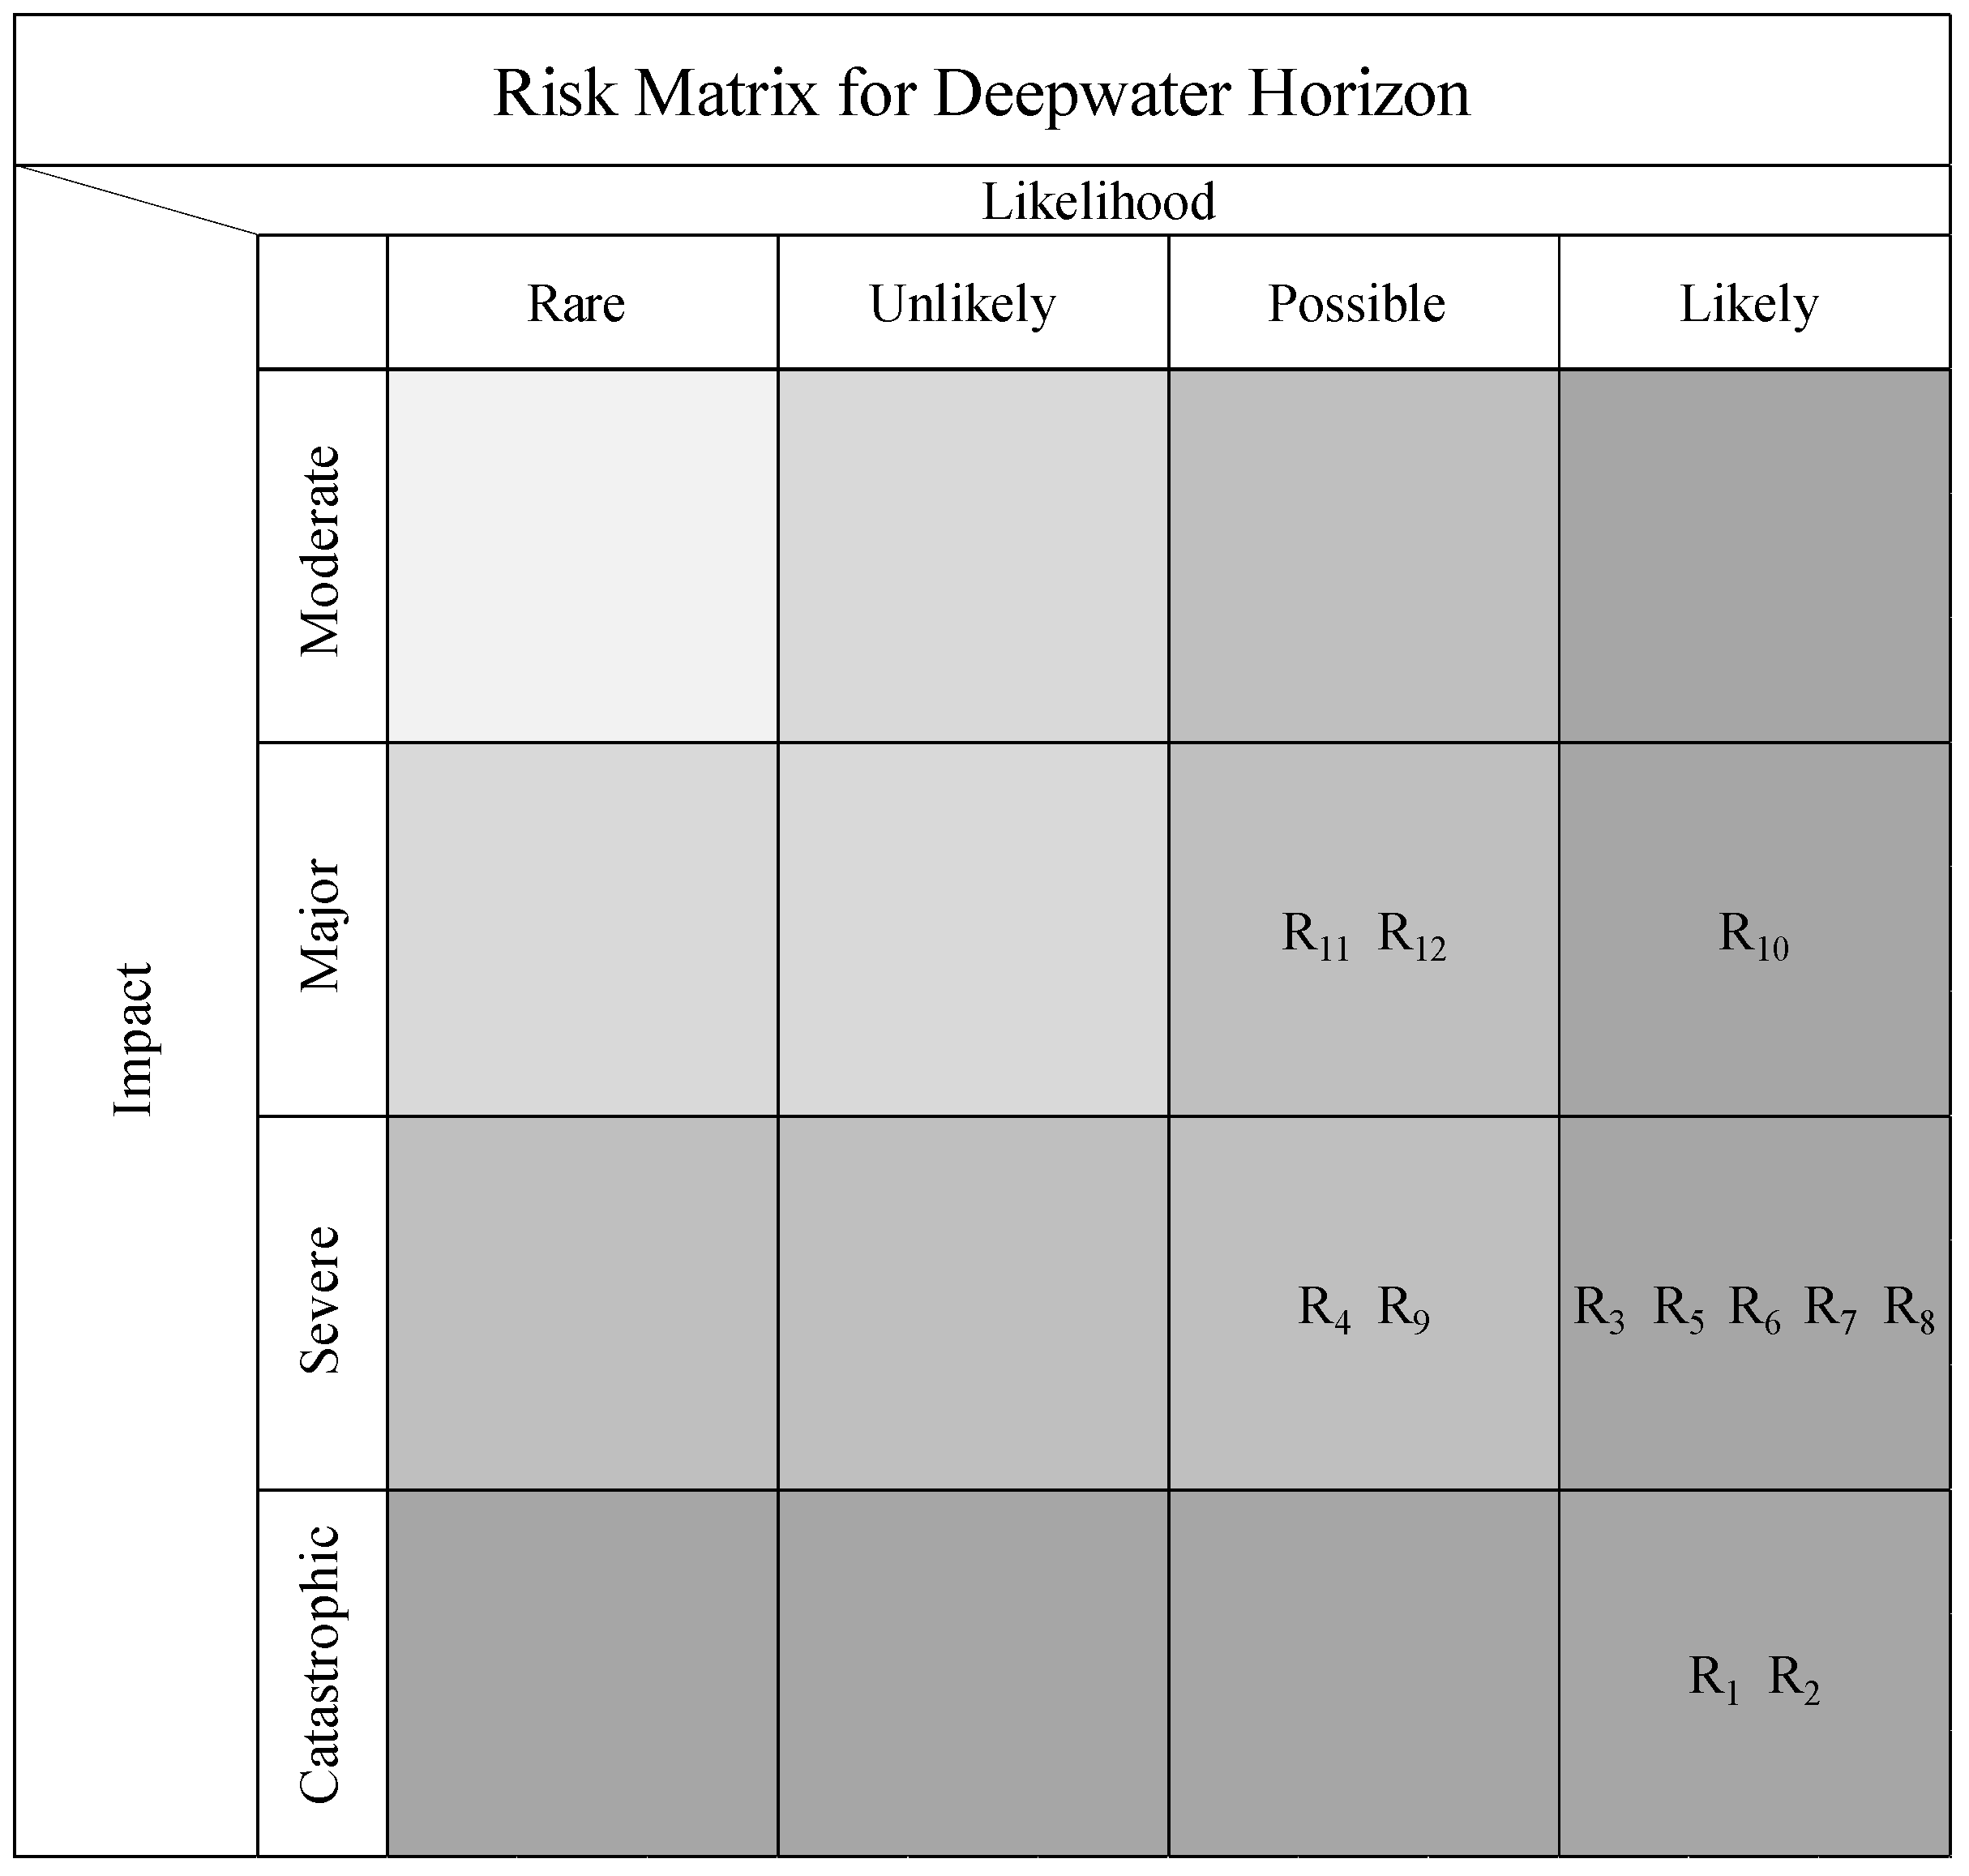
4.3. Risk Matrix Analysis Shortcomings for the Deepwater Horizon Disaster
4.4. Swiss Cheese Model Analysis of the Deepwater Horizon Incident
- Latent Failures (Organizational and Regulatory Weaknesses):
- 1.
- Regulatory Oversight: Inadequate regulatory oversight and enforcement by the Minerals Management Service (MMS). The MMS had conflicts of interest, as it was both promoting offshore drilling and responsible for its regulation, so the MMS’s oversight was not strict in enforcing regulatory requirements on ongoing offshore operations.
- 2.
- Safety Culture: BP’s organizational culture prioritized cost-cutting and speed over safety. BP’s main focus was meeting financial targets, leading to compromised safety standards and inadequate risk management practices.
- Active Failures (Errors and Violations):
- 3.
- Decision-Making Errors: Critical decisions were made without adequate risk assessment. Decisions such as using a single long string casing instead of a safer liner/tieback system were made to save time and money despite being riskier.
- 4.
- Operational Deviations: Failure to adhere to established procedures and best practices. The negative pressure test, a crucial step in determining well integrity, was misinterpreted, leading to the incorrect assumption that the well was secure.
- Preconditions for Unsafe Acts (Human and Environmental Factors):
- 5.
- Crew Training and Competence: The rig crew lacked adequate training and preparedness. Crew members were not sufficiently trained to handle the negative pressure test and other critical procedures, resulting in misjudgments and errors.
- 6.
- Communication Failures: Poor communication between BP, Transocean, and Halliburton. Significant lapses in communication regarding changes in drilling plans and risk assessments resulted in misunderstandings and a lack of coordinated response.
- Defenses in Depth (Safety Systems and Equipment):
- 7.
- Blowout Preventer (BOP) Failures: The BOP, a critical safety device, failed to function correctly. The BOP had several design and maintenance issues, including a dead battery and a miswired solenoid valve, which prevented it from sealing the well effectively.
- 8.
- Well Design Flaws: Design choices increased the risk of a blowout. The well design included fewer barriers to hydrocarbon flow, and the decision to use a long string casing instead of a liner/tieback system increased the likelihood of a blowout.
4.5. SAMA Analysis of the Deepwater Horizon Incident
5. Findings
- Regulatory Laws (Horizontal Track): The case study shows a persistent weakness in regulatory enforcement and communication. The accumulation of risks in this layer means there is no feedback mechanism, administrative delays, and a lack of operational adaptation to regulatory expectations. To address this, one must implement continuous monitoring systems, dynamic regulatory frameworks that evolve with project conditions, and integration between field operations and legal compliance teams. A real-time regulatory risk tracking system could have flagged the inconsistencies and prompted preventive action before the disaster struck. This issue is consistent with the U.S. report of the Chemical Safety and Hazard Investigation Board [64], which addressed this disastrous incident and its causes.
- Safety (Vertical Track): The synergy and accumulation of risks on the safety objective shows a major systemic failure—defective cement seals, postponed maintenance, and inadequate emergency protocols aligned to create a high-risk environment. Post-incident reports show that despite knowing of these failures, the decision-makers did not act [64]. Strengthening this layer means proactive maintenance protocols, cross-verifying critical safety systems, and a culture of accountability where safety is prioritized even under cost or schedule pressure.
6. Discussion
- Overlapping Probability–Impact Ranges and Color-Based Classification:
- 2.
- Ignoring Synergy and Accumulation of Risks:
- 3.
- “Holes” Without Time Factor or Quantification:
- 4.
- Event-Centric Focus vs. Recipient-Centric Framework:
- Enterprise Risk Management (ERM) Suites: Export RFh/RFv tables from SAMA into ERM dashboards (e.g., as custom metrics in Power BI or Tableau) for continuous monitoring and analysis.
- Project Management Tools: Link stage-specific RFh values to scheduling software (e.g., Microsoft Project or Primavera) so that timelines automatically flag high-risk tasks for additional review.
- Maintenance and Compliance Systems: Feed vertical RFv scores into Computerized Maintenance Management Systems (CMMS) to prioritize work orders where synergy of failures heightens potential impact.
7. Conclusions
- Robust Framework: SAMA provides a structured schema where layers are weighted recipients of risk, allowing for precise classification based on temporal and systemic attributes.
- Dual Analytical Approach: Horizontal analysis identifies the most hazardous paths within each time stage. In contrast, vertical analysis uncovers the synergy and accumulation of risks that, although temporally distinct, jointly threaten core objectives.
- Risk Manager’s Role: The model incorporates expert judgment to evaluate the interrelationships between risks and to identify the highest-risk collapse paths, thereby integrating rational oversight into an otherwise quantitative process.
Author Contributions
Funding
Data Availability Statement
Conflicts of Interest
Abbreviations
| SAMA | The Synergy and Accumulation Model for Analysis |
| RM | The Risk Matrix |
| SCM | The Swiss Cheese Model |
| BP | British Petroleum |
| BOP | Blowout Preventer |
| EDS | Emergency Disconnect System |
References
- Larouzee, J.; Le Coze, J.-C. Good and bad reasons: The Swiss cheese model and its critics. Saf. Sci. 2020, 126, 104660. [Google Scholar] [CrossRef]
- Stein, J.E.; Heiss, K. The Swiss cheese model of adverse event occurrence—Closing the holes. In Seminars in Pediatric Surgery; Elsevier: Amsterdam, The Netherlands, 2015. [Google Scholar]
- Reason, J.; Hollnagel, E.; Paries, J. Revisiting the Swiss cheese model of accidents. J. Clin. Eng. 2006, 27, 110–115. [Google Scholar]
- Haghighattalab, S.; Chen, A.; Fan, Y.; Mohammadi, R. Engineering ethics within accident analysis models. Accid. Anal. Prev. 2019, 129, 119–125. [Google Scholar] [CrossRef] [PubMed]
- Altabbakh, H.M. Risk Analysis: Comparative Study of Various Techniques. Ph.D. Thesis, Missouri University of Science and Technology, Rolla, MO, USA, 2013. [Google Scholar]
- Jafarnejad, A.; Ebrahimi, M.; Abbaszadeh, M.A.; Abtahi, S.M. Risk management in supply chain using consistent fuzzy preference relations. Int. J. Acad. Res. Bus. Soc. Sci. 2014, 4, 77. [Google Scholar]
- Yazdani, M.; Abdi, M.R.; Kumar, N.; Keshavarz-Ghorabaee, M.; Chan, F.T. Improved decision model for evaluating risks in construction projects. J. Constr. Eng. Manag. 2019, 145. [Google Scholar] [CrossRef]
- Qazi, A.; Dikmen, I. From risk matrices to risk networks in construction projects. IEEE Trans. Eng. Manag. 2019, 68, 1449–1460. [Google Scholar] [CrossRef]
- Preiser, W.F. Post-occupancy evaluation: How to make buildings work better. Facilities 1995, 13, 19–28. [Google Scholar] [CrossRef]
- Zimring, C.M.; Reizenstein, J.E. Post-occupancy evaluation: An overview. Environ. Behav. 1980, 12, 429–450. [Google Scholar] [CrossRef]
- Eccleston, C.; Doub, J.P. Preparing NEPA Environmental Assessments: A User’s Guide to Best Professional Practices; CRC Press: Boca Raton, FL, USA, 2012. [Google Scholar]
- Mostofi, F.; Toğan, V.; Ayözen, Y.E.; Tokdemir, O.B. Construction safety risk model with construction accident network: A graph convolutional network approach. Sustainability 2022, 14, 15906. [Google Scholar] [CrossRef]
- Cotoarbă, D.; Straub, D.; Smith, I.F. Probabilistic digital twins for geotechnical design and construction. arXiv 2024, arXiv:2412.09432. [Google Scholar]
- Reason, J. Understanding adverse events: Human factors. BMJ Qual. Saf. 1995, 4, 80–89. [Google Scholar] [CrossRef]
- Larouzée, J.; Guarnieri, F. From theory to practice: Itinerary of Reasons’ Swiss Cheese Model. In Proceedings of the Safety and Reliability of Complex Engineered Systems, ESREL, ETH, Zurich, Switzerland, 7–10 September 2015; pp. 817–824. [Google Scholar]
- Qureshi, Z.H. A review of accident modelling approaches for complex critical sociotechnical systems. In Proceedings of the Twelfth Australian Workshop on Safety Critical Systems and Software and Safety-Related Programmable Systems, Adelaide, Australia, 30–31 August 2008. [Google Scholar]
- Cassano-Piche, A.L.; Vicente, K.J.; Jamieson, G.A. A test of Rasmussen’s risk management framework in the food safety domain: BSE in the UK. Theor. Issues Ergon. Sci. 2009, 10, 283–304. [Google Scholar] [CrossRef]
- Rausand, M. Risk Assessment: Theory, Methods, and Applications; John Wiley & Sons: Hoboken, NJ, USA, 2013; Volume 115. [Google Scholar]
- Fukuoka, K. Visualization of a hole and accident preventive measures based on the Swiss cheese model developed by risk management and process approach. WMU J. Marit. Aff. 2016, 15, 127–142. [Google Scholar] [CrossRef]
- Reason, J. Human Error; Cambridge University Press: Cambridge, UK, 1990. [Google Scholar]
- Reason, J. Human error: Models and management. BMJ 2000, 320, 768–770. [Google Scholar] [CrossRef] [PubMed]
- Perneger, T.V. The Swiss cheese model of safety incidents: Are there holes in the metaphor? BMC Health Serv. Res. 2005, 5, 71. [Google Scholar] [CrossRef] [PubMed]
- Salmon, P.M.; Stanton, N.A.; Lenné, M.; Jenkins, D.P.; Rafferty, L.; Walker, G.H. Human Factors Methods and Accident Analysis: Practical Guidance and Case Study Applications; CRC Press: Boca Raton, FL, USA, 2017. [Google Scholar]
- Smith, S.; Wang, S. Reading and grammar learning through mobile phones. Lang. Learn. Technol. 2013, 17, 117–134. [Google Scholar]
- Wiegmann, D.A.; Shappell, S.A. A Human Error Approach to Aviation Accident Analysis: The Human Factors Analysis and Classification System; Routledge: London, UK, 2017. [Google Scholar]
- Shappell, S.A.; Wiegmann, D.A. The Human Factors Analysis and Classification System—HFACS; Routledge: London, UK, 2000. [Google Scholar]
- Luxhøj, J.T.; Kauffeld, K. Evaluating the effect of technology insertion into the national airspace system. Rutger Sch. 2003, V. [Google Scholar]
- Leveson, N.G. Applying systems thinking to analyze and learn from events. Saf. Sci. 2011, 49, 55–64. [Google Scholar] [CrossRef]
- Dekker, S. The Field Guide to Human Error Investigations; Routledge: London, UK, 2017. [Google Scholar]
- Thomas, P.; Bratvold, R.B.; Bickel, E. The risk of using risk matrices. SPE Econ. Manag. 2014, 6, 56–66. [Google Scholar] [CrossRef]
- Baybutt, P. Guidelines for designing risk matrices. Process Saf. Prog. 2018, 37, 49–55. [Google Scholar] [CrossRef]
- Solís Toro, C. Constructing Operational Risk Matrices from Organizational Business Processes Using a Fuzzy Ahp Method. Bachelor’s Thesis, Universidad EIA, Envigado, Colombia, 2019. [Google Scholar]
- Hillson, D. The Risk Management Handbook: A Practical Guide to Managing the Multiple Dimensions of Risk; Kogan Page Publishers: London, UK, 2016. [Google Scholar]
- Leveson, N. Improving the Standard Risk Matrix using STPA. J. Syst. Saf. 2019, 55, 13–22. [Google Scholar] [CrossRef]
- Åkerberg, F. Risk Ranking Reversals and Classification Ranking Reversals in Risk Matrices. Master’s Thesis, University of Gävle, Gavle, Sweden, 2021. [Google Scholar]
- Clemen, R.T.; Reilly, T. Making Hard Decisions with DecisionTools; Cengage Learning: Belmont, CA, USA, 2013. [Google Scholar]
- Anthony Cox, L., Jr. What’s wrong with risk matrices? Risk Anal. Int. J. 2008, 28, 497–512. [Google Scholar] [CrossRef] [PubMed]
- Baybutt, P. Designing risk matrices to avoid risk ranking reversal errors. Process Saf. Prog. 2016, 35, 41–46. [Google Scholar] [CrossRef]
- Budescu, D.V.; Broomell, S.; Por, H.-H. Improving communication of uncertainty in the reports of the Intergovernmental Panel on Climate Change. Psychol. Sci. 2009, 20, 299–308. [Google Scholar] [CrossRef]
- Markowski, A.S.; Mannan, M.S. Fuzzy risk matrix. J. Hazard. Mater. 2008, 159, 152–157. [Google Scholar] [CrossRef] [PubMed]
- Scolese, C.J. Improved Definition for Use of Risk Matrices in Project Development; The George Washington University: Washington, DC, USA, 2016. [Google Scholar]
- Pickering, A.; Cowley, S.P. Risk Matrices: Implied accuracy and false assumptions. J. Health Saf. Res. Pract. 2010, 2, 11–18. [Google Scholar]
- Oliveira, M.D.; Bana e Costa, C.A.; Lopes, D.F. Designing and exploring risk matrices with MACBETH. Int. J. Inf. Technol. Decis. Mak. 2018, 17, 45–81. [Google Scholar] [CrossRef]
- Olson, D.L.; Wu, D.D. Enterprise Risk Management Models; Springer: Berlin/Heidelberg, Germany, 2010. [Google Scholar]
- Levine, E. Improving risk matrices: The advantages of logarithmically scaled axes. J. Risk Res. 2012, 15, 209–222. [Google Scholar] [CrossRef]
- Pence, J.; Mohaghegh, Z. A discourse on the incorporation of organizational factors into probabilistic risk assessment: Key questions and categorical review. Risk Anal. 2020, 40, 1183–1211. [Google Scholar] [CrossRef]
- Dreyer, M.; Bierwirth, M. The Impact of the Pandemic on German Academic IT Facilities in 2020 and beyond. Results of the Annual ZKI Survey on Trends at Academic IT Centres. Proc. Eur. Univer 2021, 78, 159–170. [Google Scholar]
- Lu, Y.; Ding, N.; Wang, Y. Crime Prediction: An Empirical Study on the Impact of Housing Prices on the Regional Criminal Rate. J. Phys. Conf. Ser. 2021, 1948, 012045. [Google Scholar] [CrossRef]
- Aznar-Crespo, P.; Aledo, A.; Melgarejo-Moreno, J.; Vallejos-Romero, A. Adapting social impact assessment to flood risk management. Sustainability 2021, 13, 3410. [Google Scholar] [CrossRef]
- Weber, O. Measuring the Impact of Socially Responsible Investing. Available online: https://ssrn.com/abstract=2217784 (accessed on 14 February 2013).
- Panychev, S.; Guzik, V.; Samoylenko, A.; Panychev, A. The prerequisites of forming a risk management system in the design of facilities space application. MATEC Web Conf. 2017, 102, 01030. [Google Scholar] [CrossRef]
- Loh, B. Disaster risk management in Southeast Asia: A developmental approach. ASEAN Econ. Bull. 2005, 22, 229–239. [Google Scholar] [CrossRef]
- Mensi, W.; Naeem, M.A.; Vo, X.V.; Kang, S.H. Dynamic and frequency spillovers between green bonds, oil and G7 stock markets: Implications for risk management. Econ. Anal. Policy 2022, 73, 331–344. [Google Scholar] [CrossRef]
- Revilla, E.; Saenz, M.J. The impact of risk management on the frequency of supply chain disruptions: A configurational approach. Int. J. Oper. Prod. Manag. 2017, 37, 557–576. [Google Scholar] [CrossRef]
- Diebold, F.X.; Hahn, J.; Tay, A.S. Multivariate density forecast evaluation and calibration in financial risk management: High-frequency returns on foreign exchange. Rev. Econ. Stat. 1999, 81, 661–673. [Google Scholar] [CrossRef]
- Aven, T. On the new ISO guide on risk management terminology. Reliab. Eng. Syst. Saf. 2011, 96, 719–726. [Google Scholar] [CrossRef]
- James, L.; James, S.; Hesketh, I. Evaluating the effectiveness of the fatigue and shift working risk management strategy for UK home office police forces: A pilot study. Int. J. Emerg. Serv. 2021, 11, 292–299. [Google Scholar] [CrossRef]
- Crawford, M.; Stein, W. Risk management in UK local authorities: The effectiveness of current guidance and practice. Int. J. Public Sect. Manag. 2004, 17, 498–512. [Google Scholar] [CrossRef]
- Williams, S.L.; To, Q.; Vandelanotte, C. What is the effectiveness of a personalised video story after an online diabetes risk assessment? A Randomised Controlled Trial. PLoS ONE 2022, 17, e0264749. [Google Scholar] [CrossRef] [PubMed]
- Lundberg, R.; Willis, H.H. Examining the effectiveness of risk elicitations: Comparing a deliberative risk ranking to a nationally representative survey on homeland security risk. J. Risk Res. 2019, 22, 1546–1560. [Google Scholar] [CrossRef]
- Jiang, Y.; Cukic, B.; Menzies, T. Cost curve evaluation of fault prediction models. In Proceedings of the 2008 19th International Symposium on Software Reliability Engineering (ISSRE), Seattle/Redmond, WA, USA, 10–14 November 2008; IEEE: New York, NY, USA, 2008. [Google Scholar]
- Houck, O.A. Worst case and the Deepwater Horizon blowout: There ought to be a law. Envtl. L. Rep. News Anal. 2010, 40, 11033. [Google Scholar]
- BP. Deepwater Horizon Accident Investigation Report; British Petroleum: London, UK, 2010. [Google Scholar]
- Investigation Report Executive Summary, Drilling Rig Explosion and Fire at the Macando Well. 2016. Available online: https://www.dco.uscg.mil/Portals/9/OCSNCOE/Casualty-Information/DWH-Macondo/CSB/CSB-Macondo-Exec-Summary.pdf?ver=669ixQbnkL1l-OpgtcCpiA%3D%3D (accessed on 25 April 2025).
- National Commission on the BP Deepwater Horizon Oil Spill and Offshore Drilling. Deep Water: The Gulf Oil Disaster and the Future of Offshore Drilling: Report to the President, January 2011: The Gulf Oil Disaster and the Future of Offshore Drilling; Government Printing Office: Washington, DC, USA, 2011.
- Deepwater Horizon Study Group. Final report on the investigation of the Macondo well blowout. Cent. Catastrophic Risk Manag. 2011, 192. [Google Scholar]
- Crooks, E. BP Case Told of ‘Swiss Cheese’ Theory; Financial Times: London, UK, 2013. [Google Scholar]
- Bly, M. Deepwater Horizon Accident Investigation Report; Diane Publishing: Darby, PA, USA, 2011. [Google Scholar]
- Ahmed, F. Assessing the Impact of the Deepwater Horizon Oil Spill on Procedural Immunity and Crisis Response in the Industry: Lessons for Sustainable Offshore Management. Int. J. Humanit. Soc. Sci. Manag. 2023, 3, 604–609. [Google Scholar]
- Xue, L.; Fan, J.; Rausand, M.; Zhang, L. A safety barrier-based accident model for offshore drilling blowouts. J. Loss Prev. Process Ind. 2013, 26, 164–171. [Google Scholar] [CrossRef]


| The Method | The Standard Provided for Comparison | ||||||||||||
|---|---|---|---|---|---|---|---|---|---|---|---|---|---|
| Qualitative Analysis | Quantitative Analysis | Semi-Quantitative Analysis | Graphical Representation | Theoretical Representation | Focuses on One Risk | Focuses on a Group of Risks Together | Focuses on the System’s Risk | Focuses on a Person’s Risk | Explains the Intertwining of Risks | Difficult to Apply | Easy to Apply | Used in Construction Projects | |
| Swiss Cheese Model | * | * | * | * | * | * | * | ||||||
| The Risk in Early Design (RED) | * | * | * | * | * | * | |||||||
| Event Tree | * | * | * | * | * | * | * | ||||||
| Fishbone Diagram | * | * | * | * | * | * | |||||||
| Fault Tree Analysis | * | * | * | * | * | * | * | ||||||
| Layer of Protection Analysis | * | * | * | * | * | * | |||||||
| Risk Matrices | * | * | * | * | * | * | |||||||
| Failure Mode and Effects Analysis | * | * | * | * | * | * | |||||||
| Category | Source | Quotes |
|---|---|---|
| Criticisms related to the holes | [25,26] | Failure to locate cheese holes accurately—failure to determine the nature of holes and their interrelationships |
| [3] | The holes’ location, cause, and change—the mechanism of aligning the holes—focus on barriers rather than risks. | |
| Criticisms related to relationships and etiology | [27] | Failure to take into account the interrelationship between the causative factors |
| [28] | Ignore the reasons behind the events | |
| [1] | Lack of understanding of causal links, regulatory, and local—over-general | |
| Criticisms related to defenses | [29] | Inconsistency in defenses and their independence |
| Category | Criticisms Related to Results | Criticisms Related to Estimates | ||||
|---|---|---|---|---|---|---|
| Criticisms Source | Risk-Ranking Errors | Risk-Ranking Reversals | Accessing the Wrong Actions | Not Accounting for the Accumulation of Risks | Uncertainty in Estimating Probability and Consequences | Color Classification Problem |
| [37] | * | * | * | * | * | |
| [30] | * | * | ||||
| [39] | * | |||||
| [40] | * | |||||
| [41] | * | |||||
| [38] | * | * | ||||
| [42] | * | |||||
| [43] | * | * | * | * | ||
| [44] | * | * | ||||
| [45] | * | * | * | |||
| [31] | * | * | ||||
| Parameter’s Name | Value from-to | Value Details | Description | References and Semantic Sentences |
|---|---|---|---|---|
| The focus of the impact | 1–2.5 | The effect includes a quarter of the statistical community or less | It indicates the extent of the impact of the risk on the studied statistical community, and it is left within a single or wide range | “The focus of the impact was on the procurement of …” [47] “It is found that the focus of the impact of housing prices and …” [48] “Which the main inductive focus of the impact belongs …” [49] “Strategic refers to the focus of the impact …” [50] |
| 2.6–5 | The effect includes one-quarter to one-half of the statistical community | |||
| 5.1–7.5 | The effect includes one-half to three-quarters of the statistical community | |||
| 7.6–10 | The effect includes three-quarters of the whole of the statistical community | |||
| The suddenness | 0.1–0.25 | We are clearly alert to the occurrence of danger through warning signs | Indicates the extent of warning of the occurrence of risk through warning signs that warn of imminent risk | “Any suddenness in the later stages of the development system can …” [51] “The suddenness of impact in many disasters and the urgency …” [52] |
| 0.26–0.5 | Warning signs can alert to the occurrence of danger | |||
| 0.51–0.75 | There are warning signs, but they are not very clear | |||
| 0.76–1 | There are no warning signs at all | |||
| The frequency | 1–2.5 | The frequency of the occurrence of the risk is less than the frequency mentioned in historical records | It refers to the frequency with which a particular risk occurs during a specified period. This is related to previous studies on the history of the risk and its impact on the statistical community studied. | Frequency spillovers between global Green Bonds (GBs), WTI oil, and G7 stock markets using the time–frequency … [53] performance with regard to the frequency of supply … [54] We provide a detailed application to multivariate high-frequency … [55] the expected frequency or predict the frequency … [56] |
| 2.6–5 | The frequency of the occurrence of the risk is close to or equal to the frequency mentioned in the historical records | |||
| 5.1–7.5 | The frequency of the occurrence of the risk is more than the frequency mentioned in historical records but less than twice that frequency | |||
| 7.6–10 | The frequency of the occurrence of the risk is more than twice the frequency mentioned in historical records | |||
| The effectiveness | 0.1–0.25 | Risk exhibits a constant effect intensity during its repetition within one time period | Indicates the fluctuation of the intensity for this risk over one time period | Purpose To evaluate the effectiveness of a … [57] The effectiveness of current guidance and practice … [58] The study design was based on previous evidence for the effectiveness of … [59] Examining the effectiveness of risk elicitations … [60] |
| 0.26–0.5 | Risk exhibits a little change in effect intensity during its recurrence within one time period | |||
| 0.51–0.75 | Risk exhibits a variable effect intensity during its recurrence within one time period | |||
| 0.76–1 | Risk exhibits a significantly variable effect intensity during its recurrence within one time period |
| # | Code | Risk | Impact | Likelihood | Mitigation Failure |
|---|---|---|---|---|---|
| 1 | R1 | Blowout Preventer (BOP) Failure | Catastrophic | Likely | BOP was not maintained properly and failed to seal the well in an emergency |
| 2 | R2 | Cement Seal Failure | Catastrophic | Likely | The cement job at the well bottom failed to isolate hydrocarbons |
| 3 | R3 | Misinterpretation of Pressure Test | Severe | Likely | Negative pressure test results were misinterpreted, indicating no issues when there were multiple issues |
| 4 | R4 | Inadequate Well Design | Severe | Possible | Design did not account for the potential high pressure and gas influx |
| 5 | R5 | Failure in Risk Assessment and Management | Severe | Likely | Risks were underestimated, and proper assessments were not conducted |
| 6 | R6 | Emergency Response Failure | Severe | Likely | Emergency response plans were not effective, leading to delayed containment efforts |
| 7 | R7 | Poor Decision-Making | Severe | Likely | Multiple poor decisions and tradeoffs led to the disaster |
| 8 | R8 | Human and Organizational Malfunctions | Severe | Likely | Organizational and human errors significantly contributed to the failures |
| 9 | R9 | Regulatory Failures | Severe | Possible | Regulatory bodies did not enforce proper safety measures and regulations |
| 10 | R10 | Equipment Maintenance | Major | Likely | Equipment was not maintained or tested according to industry standards |
| 11 | R11 | Communication Failures | Major | Possible | Poor communication between the parties involved in the operation and management |
| 12 | R12 | Training Deficiencies | Major | Possible | The crew was not adequately trained for emergencies |
| The Studied Risks | Coding | Parameters | Objectives | Time Stages | Defensive Layers (the Recipients of the Risks) | ||||||||||
|---|---|---|---|---|---|---|---|---|---|---|---|---|---|---|---|
| The Focus of the Impact | Suddenness | Frequency | Effectiveness | Consequences | Probability | Risk Factor | Safety | Quality | 1-Operational | 2-Construction | Protection Procedures and Tools | Regulatory Laws | Structural Structure | ||
| Blowout Preventer (BOP) Failure | RF1 | 10 | 0.8 | 1 | 1 | 8 | 1 | 8 | * | * | * | 1 + 2 | |||
| Cement Seal Failure | RF2 | 8 | 0.3 | 4 | 0.6 | 2.4 | 2.4 | 5.76 | * | * | * | 1 + 2 | |||
| Misinterpretation of Pressure Test | RF3 | 6 | 0.2 | 8 | 0.8 | 1.2 | 6.4 | 7.68 | * | * | * | 1 | |||
| Inadequate Well Design | RF4 | 9 | 0.3 | 1 | 1 | 2.7 | 1 | 2.7 | * | * | * | 1 + 2 | |||
| Failure in Risk Assessment and Management | RF5 | 8 | 0.9 | 7 | 0.9 | 7.2 | 6.3 | 45.36 | * | * | * | * | 1 + 2 | ||
| Emergency Response Failure | RF6 | 9 | 0.2 | 7 | 0.6 | 1.8 | 4.2 | 7.56 | * | * | 1 | ||||
| Poor Decision-Making | RF7 | 8 | 0.8 | 8 | 0.4 | 6.4 | 3.2 | 20.48 | * | * | * | 1 + 2 | |||
| Human and Organizational Malfunctions | RF8 | 7 | 0.5 | 5 | 0.5 | 3.5 | 2.5 | 8.75 | * | * | 1 | ||||
| Regulatory Failures | RF9 | 5 | 0.1 | 9 | 0.6 | 0.5 | 5.4 | 2.7 | * | * | * | 1 + 2 | |||
| Neglecting Equipment Maintenance | RF10 | 8 | 0.3 | 9 | 0.9 | 2.4 | 8.1 | 19.44 | * | * | * | 1 | |||
| Communication Failures | RF11 | 4 | 0.3 | 7 | 0.8 | 1.2 | 5.6 | 6.72 | * | * | 1 | ||||
| Training Deficiencies | RF12 | 3 | 0.2 | 2 | 0.8 | 0.6 | 1.6 | 0.96 | * | * | * | 1 | |||
| Weak Safety Culture | RF13 | 8 | 0.7 | 7 | 0.7 | 5.6 | 4.9 | 27.44 | * | * | * | 1 + 2 | |||
| Unsatisfactory Concrete Tests | RF14 | 7 | 0.4 | 2 | 0.6 | 2.8 | 1.2 | 3.36 | * | * | * | 2 | |||
| Operational Deviations | RF15 | 8 | 0.2 | 8 | 0.8 | 1.6 | 6.4 | 10.24 | * | * | * | 1 | |||
| Time Stage | Defensive Layers | Coding | Horizontal Paths | The Value |
|---|---|---|---|---|
| Operational stage | Protection procedures and tools | RFh1tools | RF1 + RF2 + RF3 + RF10 + RF12 | 41.84 |
| Regulatory laws | Rfh1laws | RF5 + RF6 + RF7 + RF8 + RF9 + RF11 + RF13 + RF15 | 129.25 | |
| Structural structure | RFh1str | RF4 | 2.7 | |
| Construction stage | Protection procedures and tools | RFh2tools | RF1 + RF2 + RF14 | 17.12 |
| Regulatory laws | Rfh2laws | RF5 + RF7 + RF9 + RF13 | 95.98 | |
| Structural structure | RFh2str | RF4 | 2.7 |
| The Objective | The Objective | Coding | Vertical Paths | The Value |
| Safety | RFvSafty | RF1 + RF2 + RF3 + RF5 + RF6 + RF10 + RF12 + RF13 + RF14 + RF15 | 135.8 | |
| Quality | RFvQuality | RF3 + RF4 + RF5 + RF7 + RF8 + RF9 + RF10 + RF11 + RF12 + RF14 + RF15 | 128.39 |
Disclaimer/Publisher’s Note: The statements, opinions and data contained in all publications are solely those of the individual author(s) and contributor(s) and not of MDPI and/or the editor(s). MDPI and/or the editor(s) disclaim responsibility for any injury to people or property resulting from any ideas, methods, instructions or products referred to in the content. |
© 2025 by the authors. Licensee MDPI, Basel, Switzerland. This article is an open access article distributed under the terms and conditions of the Creative Commons Attribution (CC BY) license (https://creativecommons.org/licenses/by/4.0/).
Share and Cite
Medaa, E.; Shirzadi Javid, A.A.; Malekitabar, H.; Banihashemi, S. The Synergy and Accumulation Model for Analysis (SAMA): A Novel Approach to Transforming Risk Analysis in Construction with a Focus on the Deepwater Horizon Disaster Case. Buildings 2025, 15, 1879. https://doi.org/10.3390/buildings15111879
Medaa E, Shirzadi Javid AA, Malekitabar H, Banihashemi S. The Synergy and Accumulation Model for Analysis (SAMA): A Novel Approach to Transforming Risk Analysis in Construction with a Focus on the Deepwater Horizon Disaster Case. Buildings. 2025; 15(11):1879. https://doi.org/10.3390/buildings15111879
Chicago/Turabian StyleMedaa, Elias, Ali Akbar Shirzadi Javid, Hassan Malekitabar, and Saeed Banihashemi. 2025. "The Synergy and Accumulation Model for Analysis (SAMA): A Novel Approach to Transforming Risk Analysis in Construction with a Focus on the Deepwater Horizon Disaster Case" Buildings 15, no. 11: 1879. https://doi.org/10.3390/buildings15111879
APA StyleMedaa, E., Shirzadi Javid, A. A., Malekitabar, H., & Banihashemi, S. (2025). The Synergy and Accumulation Model for Analysis (SAMA): A Novel Approach to Transforming Risk Analysis in Construction with a Focus on the Deepwater Horizon Disaster Case. Buildings, 15(11), 1879. https://doi.org/10.3390/buildings15111879