Article

CrackdiffNet: A Novel Diffusion Model for Crack Segmentation and Scale-Based Analysis

1
School of Electronic and Information Engineering, Tongji University, Shanghai 201804, China
2
College of Information Technology, Shanghai Jian Qiao University, Shanghai 201306, China
*
Authors to whom correspondence should be addressed.
These authors contributed equally to this work.
Buildings 2025, 15(11), 1872; https://doi.org/10.3390/buildings15111872
Submission received: 4 May 2025 / Revised: 20 May 2025 / Accepted: 23 May 2025 / Published: 29 May 2025
(This article belongs to the Section Building Structures)

Abstract

Deep learning has made remarkable progress in the field of crack segmentation, particularly in handling large-scale datasets and complex images, owing to the substantial computational power currently available. However, existing methods still face significant challenges when processing images with low contrast, fine cracks, or strong noise interference. This paper introduces a novel semantic diffusion model capable of generating synthetic crack images from segmentation masks. The proposed model outperforms state-of-the-art semantic synthesis models across multiple benchmark datasets, demonstrating enhanced crack segmentation performance in complex backgrounds and addressing a critical challenge in engineering crack detection. Additionally, a new crack width calculation method is proposed, which further optimizes the measurement accuracy of crack width by leveraging the medial axis of the segmentation mask, thereby improving the model’s ability to describe crack morphology. To comprehensively evaluate the model’s performance, the dataset was categorized, and a detailed analysis of crack width errors was conducted for different regions. Specifically, the median and interquartile range (IQR) of width errors were calculated for four distinct regions: the central wall, corner edges, oblique intersections, and wall and column surfaces. Experimental results demonstrate that the proposed model excels in all regions, particularly in complex areas such as corner edges and oblique intersections, where the error is significantly lower than that of existing methods. These innovations collectively advance crack segmentation technology and provide a new solution for efficient crack detection in practical applications.

1. Introduction

The construction and maintenance of infrastructure such as bridges, roads, and buildings play a crucial role in ensuring urban safety and sustainable development [1]. As infrastructure gradually ages, regular monitoring and maintenance become increasingly important to prevent potential catastrophic failures including those triggered by natural disasters like earthquakes [2]. Cracks are one of the earliest signs of structural damage, and if not addressed promptly, they can lead to a reduction in local stiffness, and even trigger more severe structural defects or catastrophic failures [3]. Crack detection and localization are fundamental tasks in structural health monitoring (SHM), and serve as the basis for developing effective maintenance strategies [4].
Traditional crack detection methods rely on visual inspection, with field workers manually detecting and assessing cracks [5]. Although these methods are intuitive and easy to understand, they are often labor-intensive, time-consuming, and prone to human error [6]. Moreover, as highlighted by Khan (2020), human-based assessment systems in high-risk environments (e.g., post-disaster scenarios) frequently suffer from inconsistent awareness and preparedness levels, further limiting reliability [7]. Furthermore, for large-scale infrastructures or structures in special environments (such as high altitudes, confined spaces, or hazardous locations), manual inspection poses significant safety risks and operational challenges [8].
In recent years, with the rapid development of computer vision and deep learning technologies, automated crack detection methods have garnered increasing attention, especially the promising performance of convolutional neural networks (CNNs) in pavement crack segmentation tasks [9]. For instance, Fan et al. employed a CNN model for crack segmentation by dividing images into small patches and extracting positive samples (pixels at the center corresponding to crack pixels) for training. However, this method was only evaluated on small-scale datasets such as CFD and AigleRN, and it lacked extensive validation across diverse pavement types and environmental conditions, limiting its generalization ability [10]. In the field of concrete pavement crack segmentation, Dung et al. (2019) and Escalona et al. (2019) used pre-trained fully convolutional networks (FCNs) [11]. Despite FCNs’ strong performance in feature extraction, they suffer from lower prediction accuracy and suboptimal resolution due to information loss during the downsampling process [12]. Ren et al. proposed the CrackSegNet model, an improved deep fully convolutional network that effectively reduces noise interference in images and performs end-to-end crack segmentation in complex backgrounds. Wang et al. introduced the RDSNet model, which enhances detection accuracy by integrating crack detection and segmentation information [13]. However, despite the progress of these deep learning approaches in pavement crack detection, their performance in complex environments remains to be improved, particularly when dealing with intricate backgrounds and diverse crack shapes.
To address this issue, many researchers have introduced attention mechanisms to enhance feature extraction capabilities and suppress the interference of irrelevant information. For example, Yang et al. proposed a drone-supported edge computing method, which integrates feature map information from different levels into low-level features, helping the network eliminate background complexity and uneven crack intensity. Qiao et al. introduced the SE attention mechanism, which effectively recalibrates feature maps by dividing them into two branches and applying weighted processing to the input images, thus improving the network’s focus on important features [14]. The SENet attention mechanism, proposed by Hu et al., assigns different weights to different channels in the feature map through a compressed weight matrix, thereby helping the network capture more critical crack information.
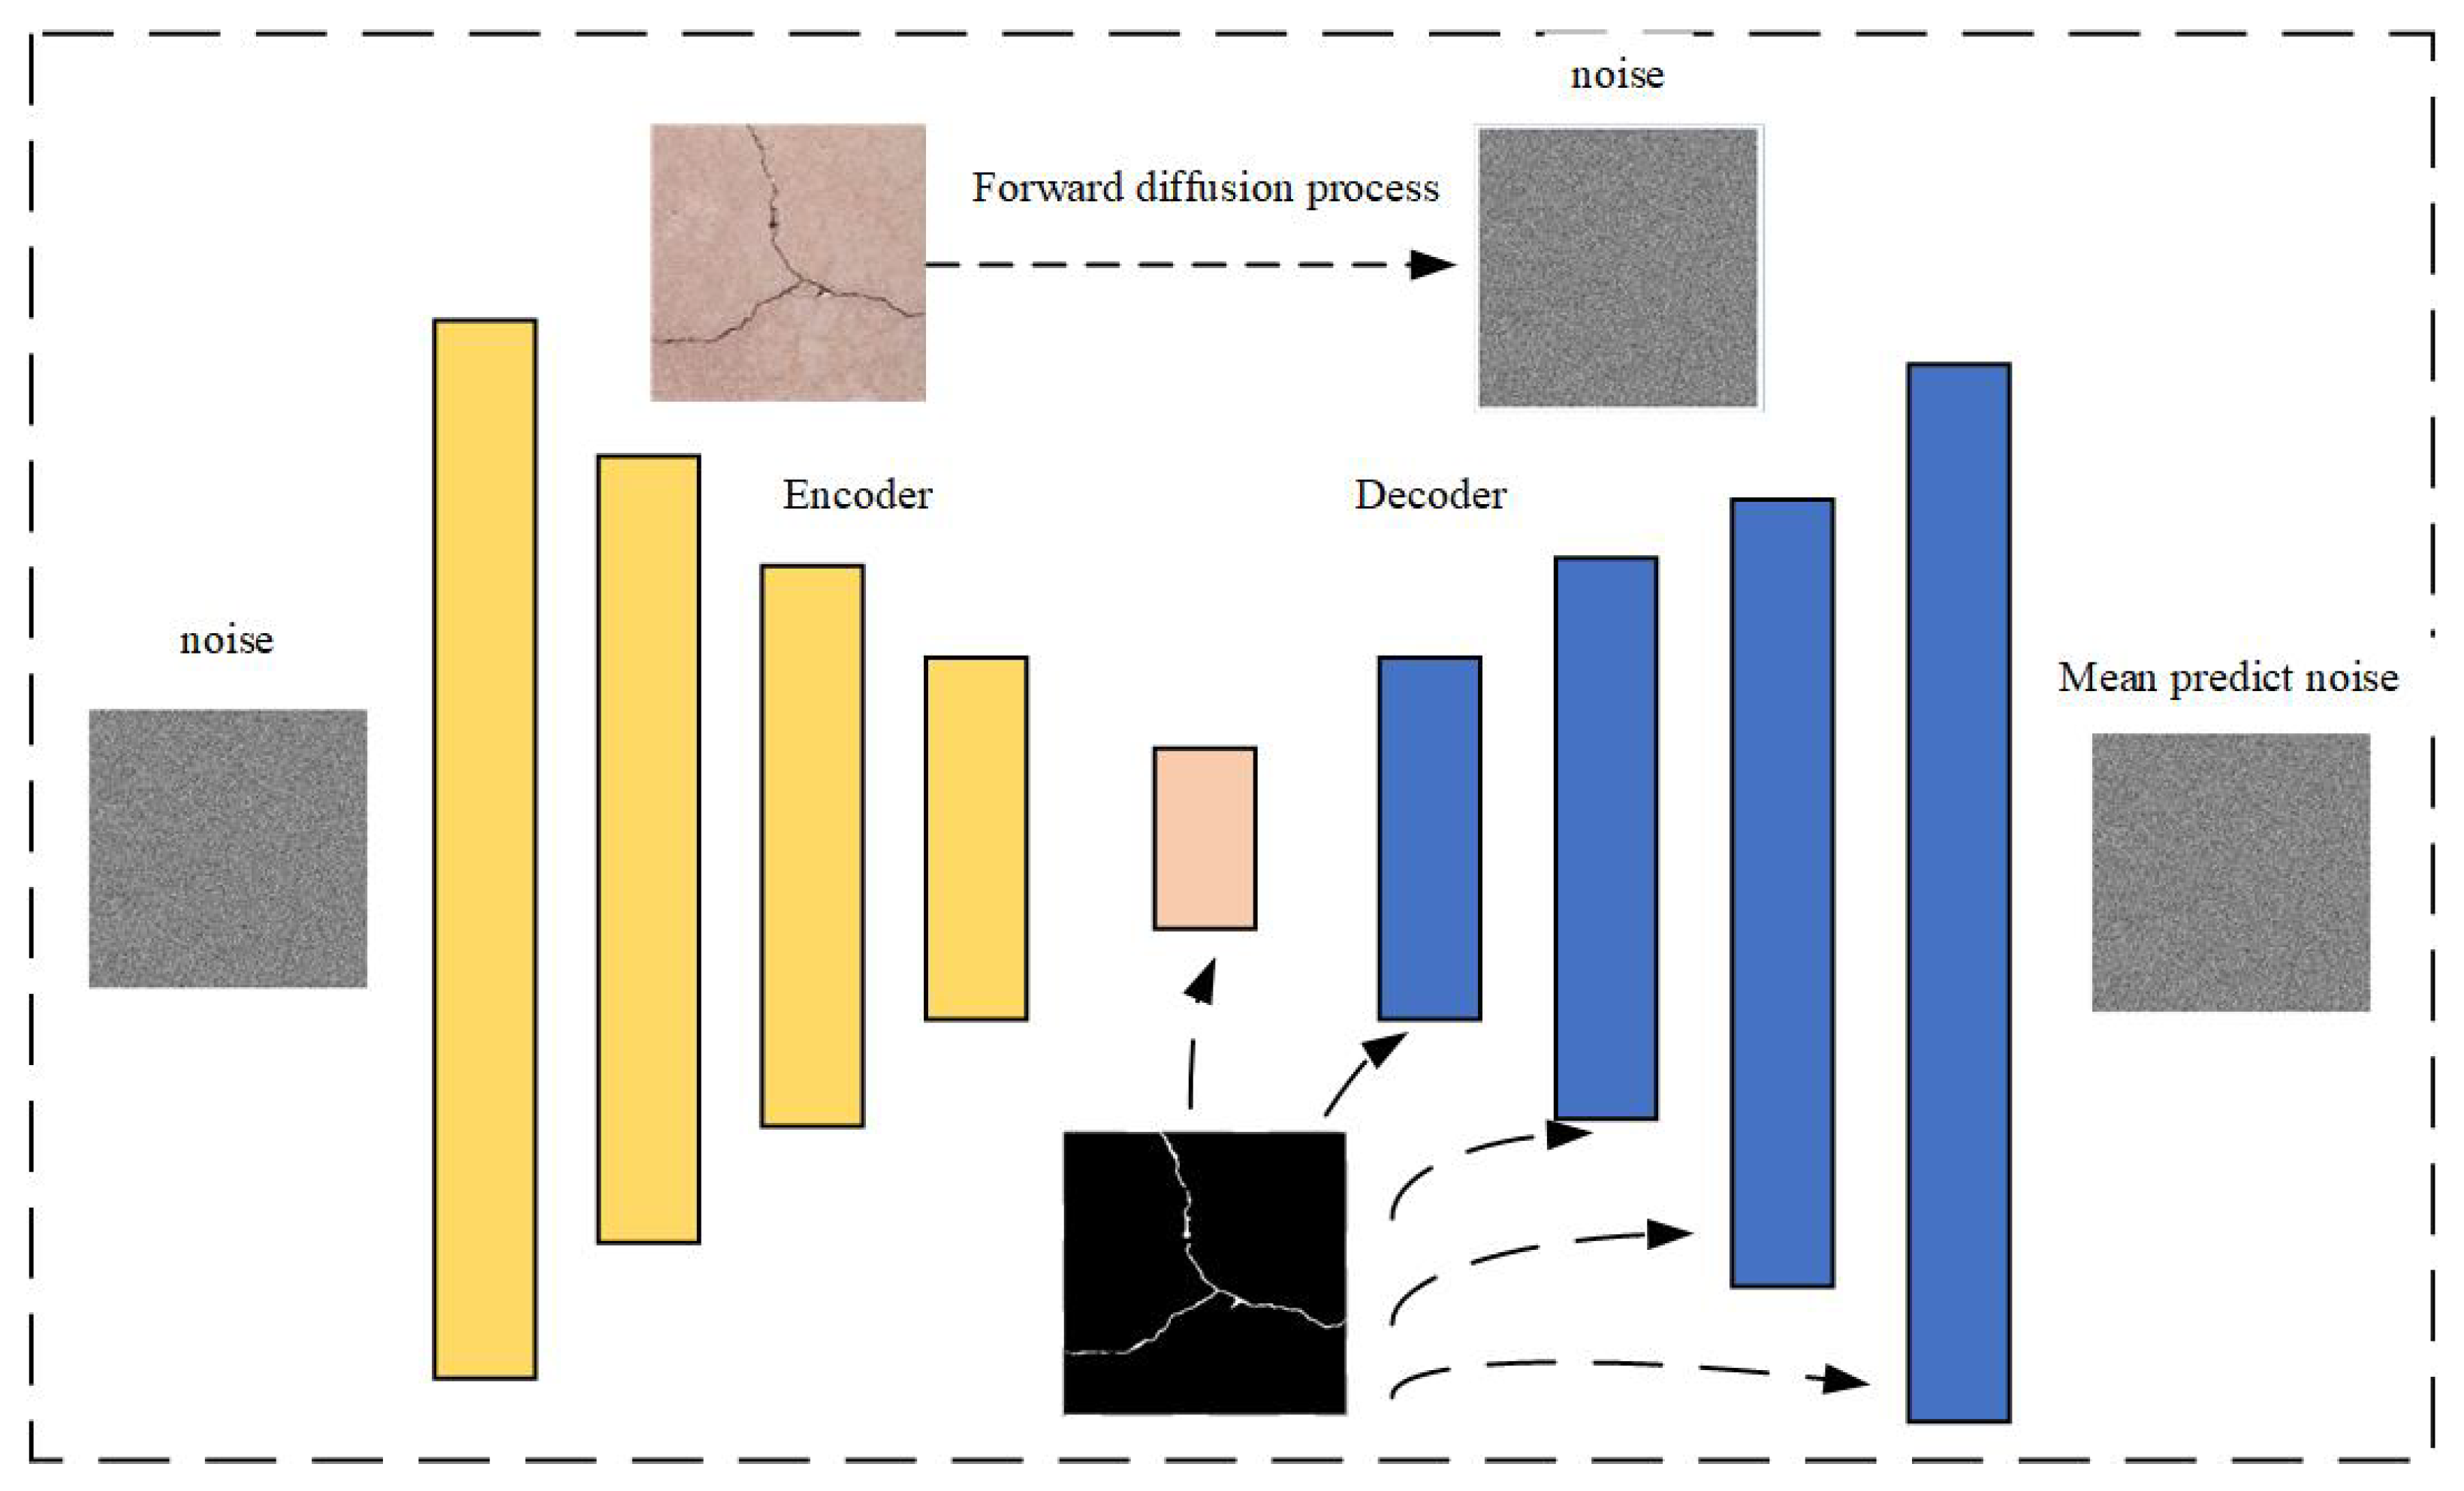
In addition to these traditional deep learning methods, diffusion models, as a type of generative model, have gained attention in recent years due to their advantages in generating high-quality images and handling complex distributions [15]. In crack detection tasks, diffusion models can achieve precise crack localization and segmentation by gradually transforming noisy images into clear crack images. By leveraging noise scheduling and the reverse process, diffusion models effectively address challenges such as low contrast, varying widths, and complex shapes in crack images.
Despite the advancements made by researchers in the field of crack segmentation, several challenges remain unresolved. First, crack images often exhibit low contrast and complex backgrounds, which pose significant difficulties for traditional segmentation methods in accurately delineating cracks. Second, the extraction and segmentation of crack features become even more challenging in the presence of complex backgrounds and blurred crack details. Lastly, the absence of scale information in crack images complicates the conversion of crack pixel dimensions into physical sizes, often resulting in substantial errors.
We propose a novel CrackdiffNet model, improved based on a diffusion model, and demonstrate its enhanced performance over current state-of-the-art segmentation models.
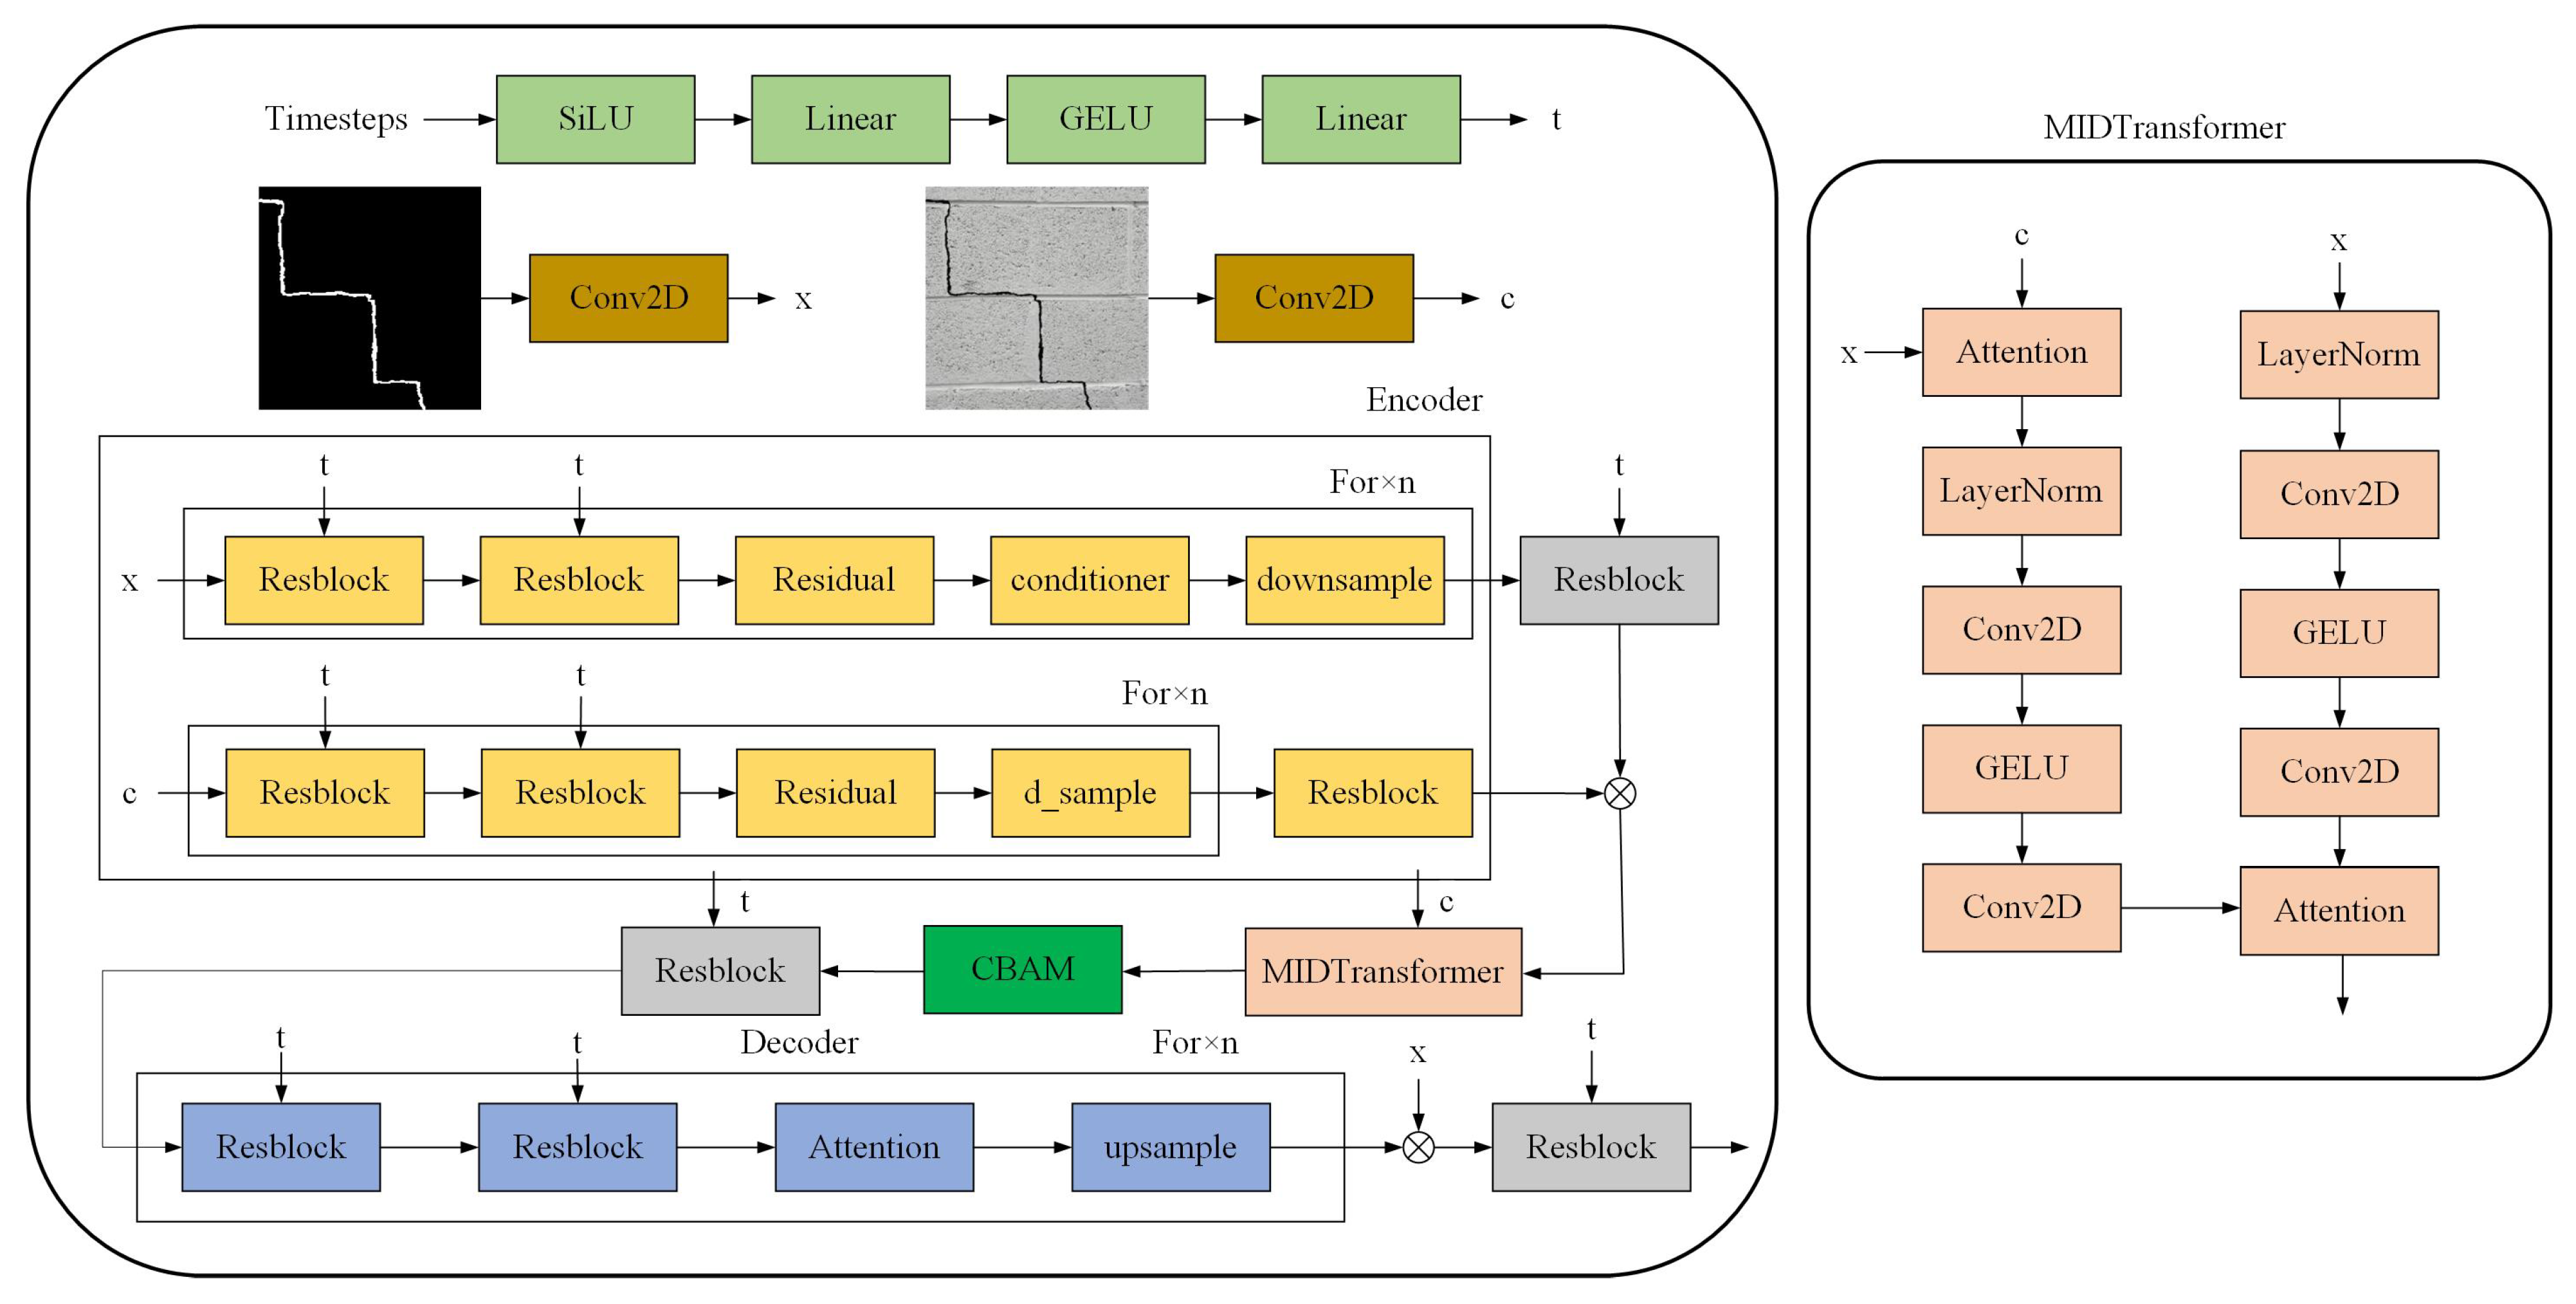
(a) An improved semantic diffusion model was developed, which simulates noise-contaminated crack images through a diffusion process and optimizes segmentation performance via pixel-wise reconstruction error during reverse denoising. This approach enables precise crack segmentation under low-contrast, complex-background, and noisy conditions. Specifically addressing the non-Gaussian distribution characteristics of crack images, we enhanced the loss function of traditional diffusion models, achieving significant improvements in both IoU and width error metrics.
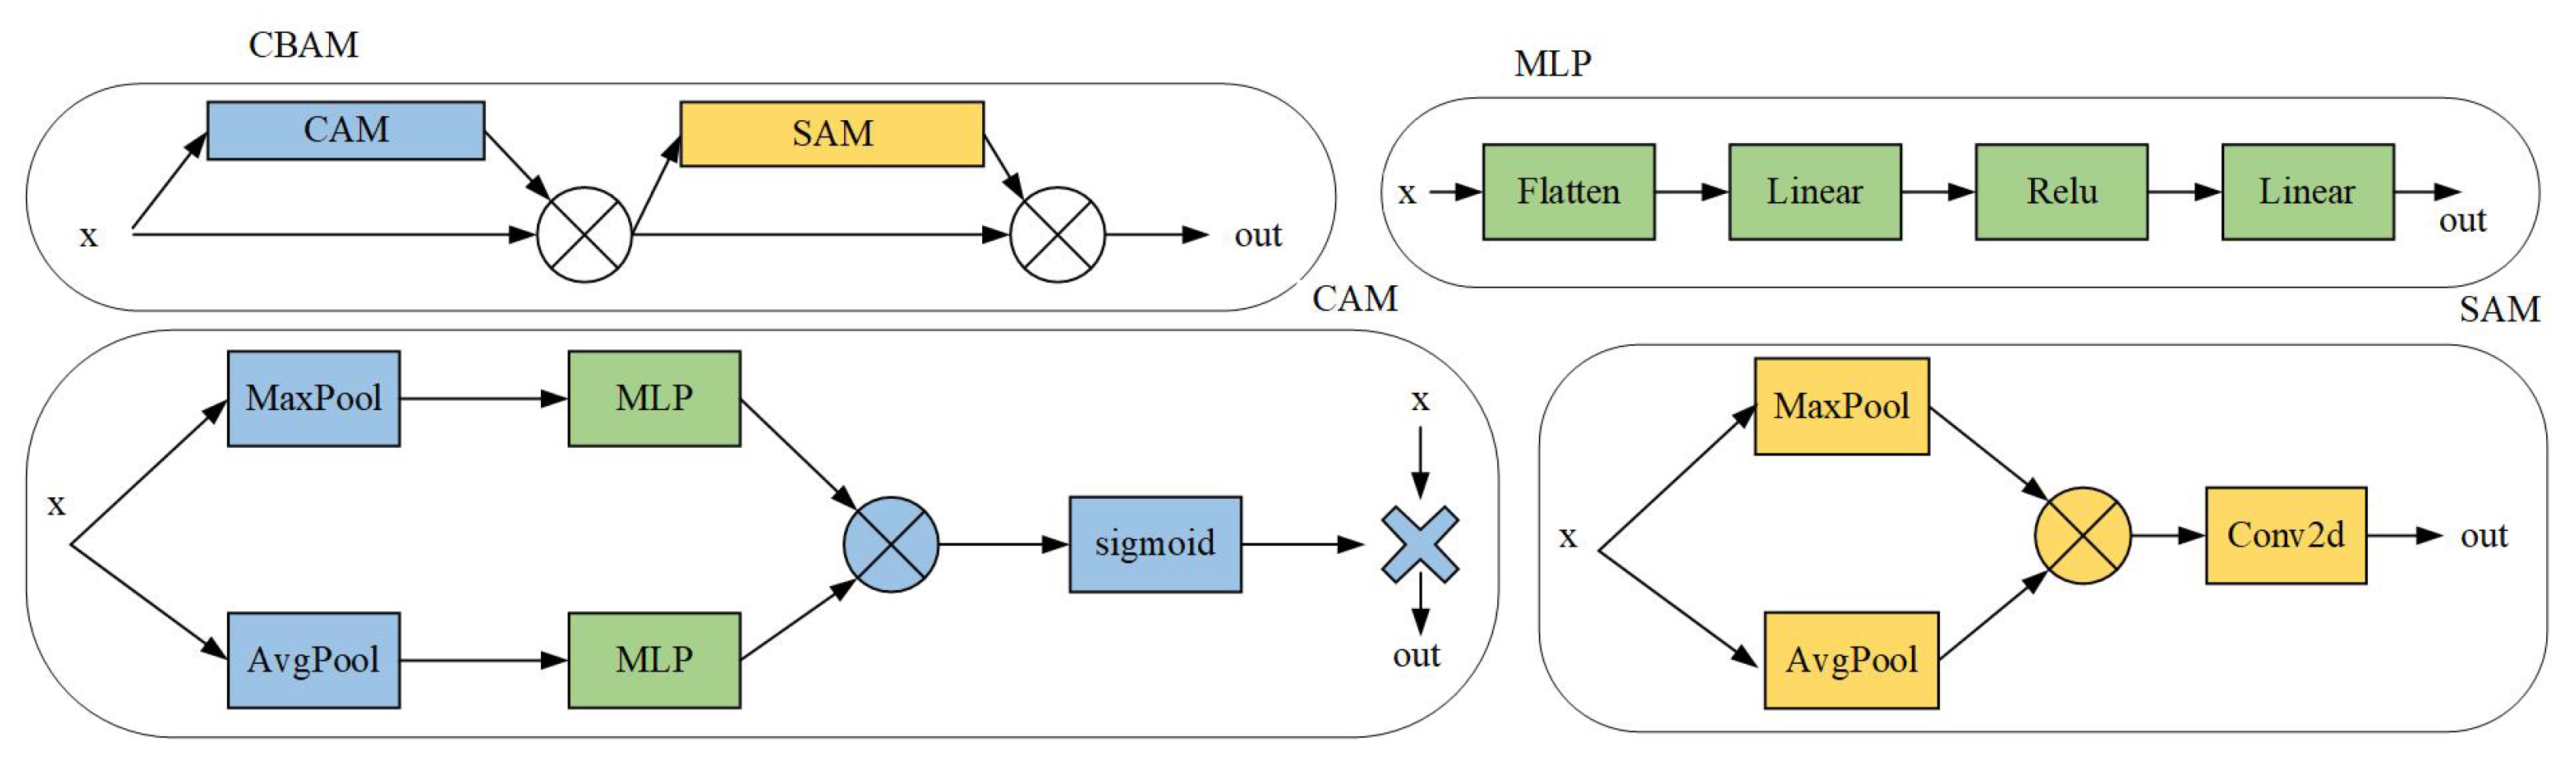
(b) The Convolutional Block Attention Module (CBAM) was incorporated, combining a Channel Attention Module (CAM) to enhance crack texture features and Spatial Attention Module (SAM) to focus on crack medial axis regions while suppressing background redundancy. A conditional cross-attention module was designed within the denoising network to adaptively concentrate on regions of interest (ROIs) based on semantic information, demonstrating superior performance in detecting fine cracks and boundaries compared to nine conventional segmentation models.
(c) A novel crack width estimation algorithm was proposed based on Medial Axis Transform (MAT) and distance transformation. The dataset was categorized into four crack regions: central wall areas, corner edges, oblique intersection zones, and wall–column junctions. By introducing physical scale parameters, pixel-level width measurements were converted to real-world dimensions, significantly improving measurement accuracy. Comparative experiments showed notably lower errors in complex scenarios (e.g., corner edges and oblique intersections) than existing methods.
(d) Synthetic crack images were generated from segmentation masks using the diffusion model to augment training datasets and enhance model generalization across diverse scenarios (e.g., foggy and overcast conditions). Experimental results demonstrated substantially improved IoU stability under challenging weather conditions compared to traditional approaches after synthetic data augmentation.

2. Methodology

2.1. Overall Framework

The framework of CrackdiffNet is shown in Figure 1, consisting primarily of two components: the diffusion process and the denoising process. The diffusion process gradually adds noise to the crack images while progressively incorporating segmentation masks. This process aids the model in learning the noise characteristics of the crack images. Subsequently, the denoising process reverses the addition of noise and restores the original crack image, thus enabling accurate crack segmentation.
The diffusion process in CrackdiffNet aims to simulate how noise progressively contaminates the crack image. The process incrementally blends the input crack image x t with noise, which can be expressed as the following equation:
x t = 1 β t · x t 1 + β t · ϵ t
Here, x t represents the image at time step t, generated by progressively adding noise. The noise strength at each time step is controlled by β t , which determines the extent of noise added. The noise ϵ t at each time step is sampled from a Gaussian distribution. The starting point of the diffusion process is the original image x 0 , and from this image, noise is incrementally added to obtain the noisy image x t .
During the diffusion process, the crack image is progressively contaminated by noise over time, with the goal of allowing the model to learn the dynamic noise characteristics of the crack image. The objective of the denoising process is to gradually remove the noise added during the diffusion process and recover the original crack image. The denoising network’s task is to predict the noise added during the diffusion process, ϵ ^ θ ( x t , t ) , and then use this predicted noise information to gradually restore the image. The denoising process can be represented as the following equation:
x ^ t 1 = 1 1 β t x t β t 1 β ¯ t · ϵ ^ θ ( x t , t )
In the denoising process, x ^ t 1 represents the denoised image, which is close to the original crack image x 0 . The noise predicted by the denoising network is ϵ ^ θ ( x t , t ) , which is used to recover the original image. The noise intensity at each time step is controlled by β t , and the cumulative noise intensity of all the diffusion steps up to the current time step is represented by β ¯ t , which is defined as
β ¯ t = i = 1 t ( 1 β i )
The learning objective of CrackdiffNet can be expressed as
V = min θ E R ( Q ( x 0 , t ) , t ) x 0
where Q represents the diffusion process, and E indicates the denoising process.
The denoising process progressively removes noise through iterative steps, ultimately reconstructing clear crack images. CrackdiffNet processes crack images with unique statistical characteristics. While conventional diffusion models (e.g., DDPM) assume natural images follow Gaussian distributions, crack image pixel distributions violate this assumption. Traditional diffusion models employ training methods that minimize errors between predicted noise and actual Gaussian noise, designed under the premise that image noise obeys Gaussian distributions. Crack images possess distinctive spatial structures and non-Gaussian statistical properties—directly applying conventional methods leads to suboptimal model performance. CrackdiffNet introduces a novel loss function specifically optimized for crack image characteristics. This loss function abandons the Gaussian noise assumption, better capturing crack images’ unique noise patterns and structural features, enabling more accurate restoration of true crack morphology during denoising. To address this, CrackdiffNet introduces the following loss function:
L = 1 m i = 1 m x i , t 1 f ( x i , t , t ) 2
where x i , t 1 is the denoised image, which is close to the original crack image x 0 , and f ( x i , t , t ) is the recovery output of the denoising network for the noisy image x t at time step t. The loss function optimizes the denoising process by computing the error between the recovered image and the original image. By minimizing this loss, the denoising network effectively recovers the structure and details of the crack image from the noisy image, overcoming the inapplicability of the Gaussian noise assumption.
However, this method typically requires high computational complexity and error accumulation. To alleviate computational complexity and error accumulation, the diffusion process can be simplified as follows:
x t = α t x 0 + 1 α t z
where γ represents the exponential factor of the time step t. f ( x t , t ) is the output of the denoising network, with the objective of recovering the original image x 0 through the denoising process. Since the diffusion process has been simplified, the loss function focuses solely on the denoising effect of the network on the noisy image x t , aiming to restore it as closely as possible to the original image x 0 , and the iterative process is illustrated in Algorithm 1.
Algorithm 1 Sampling
for CrackdiffNet. for each time step t do
x ^ 0 R( x t , t)
x t 1 = x t Q( x ^ 0 , t) + Q( x ^ 0 , t 1 )
end for
Ensure:  x 0
As illustrated in Figure 2, CrackdiffNet employs an improved ResUnet as the denoising network. The denoising component consists of three modules: the segmentation encoder, segmentation decoder, and bottleneck module. Initially, the noisy mask and crack image are input into the segmentation encoder, where a contrast enhancement module transforms the image features into the frequency domain. A learnable frequency-domain filter is then applied to enhance the detail and edge information.
Subsequently, the features extracted from both the segmentation and conditional encoders are fed into the conditional cross-attention module. This module utilizes semantic information from the conditional encoder to query the features from the segmentation encoder, enabling adaptive attention to the region of interest (ROI). Finally, the segmentation decoder decodes the enhanced features from the conditional cross-attention module to generate an accurate segmentation mask.

2.2. Convolutional Block Attention Module

The major challenges in crack segmentation tasks lie in the diversity of crack shapes, the complexity of backgrounds, and the blurriness of fine crack edges. To address these issues, a typical technique is the utilization of attention mechanisms to enhance the representation capability of important features, thereby improving the model’s ability to capture detailed characteristics [6]. Based on this technique, the Convolutional Block Attention Module (CBAM) has been proposed to dynamically adjust the channel and spatial information of feature maps during the encoding phase of the segmentation network, thereby enhancing key features while suppressing background redundancy. As illustrated in Figure 3, the module consists of two primary components: the Channel Attention Module (CAM), which emphasizes the feature channels crucial for crack detection, and the Spatial Attention Module (SAM), which focuses on the key locations of cracks.
The Channel Attention Module (CAM) dynamically adjusts the channel weights by utilizing the inter-channel relationships of features. This enables effective enhancement of crack features while suppressing background noise, thus improving the model’s ability to capture crack characteristics. The salient features of fine cracks and complex backgrounds may exist in different channels. The CAM captures global spatial information and detailed features from salient regions by combining average pooling and max pooling operations, providing a more reliable foundation for subsequent feature extraction. Specifically, the CAM first performs average pooling and max pooling on the input feature map to aggregate spatial information and generate two spatial context descriptors: F c a v g , which captures overall information such as texture and width distribution of cracks, and F c m a x , which focuses on local features such as the starting point or crossing regions of cracks. These two descriptors are passed through a shared multi-layer perceptron (MLP) for processing, where the MLP consists of a hidden layer with size C r (with r as the scaling factor). The output feature vectors are fused by element-wise summation, and the final channel attention map is generated using the sigmoid activation function. The expression is given by
M c ( F ) = σ MLP ( AvgPool ( F ) ) + MLP ( MaxPool ( F ) )
= σ W 1 W 0 ( F c a v g ) + W 1 ( W 0 ( F c m a x ) )
where σ is the sigmoid function, W 0 R C / r × C and W 1 R C × C / r are shared weights, and W 0 is followed by a ReLU activation function. Through this mechanism, CAM highlights the key channel information crucial for crack segmentation, such as attention to crack width and edge features, while suppressing redundant background information, thereby enhancing the model’s robustness and segmentation accuracy in diverse scenarios.
The Spatial Attention Module (SAM) generates a spatial attention map by exploiting the spatial relationships of features, focusing on “where” the informative regions are, thus complementing the functionality of the Channel Attention Module. Compared to channel attention, spatial attention places more emphasis on locating key positions, which is especially important for addressing the issues of blurry edges and complex backgrounds in crack segmentation tasks. In crack segmentation, the spatial attention module effectively focuses on the critical locations of the crack region while suppressing interference from complex backgrounds, improving segmentation accuracy.
To generate the spatial attention map, average pooling and max pooling operations are first applied along the channel axis of the feature map, resulting in two 2D feature maps: F s a v g R 1 × H × W and F s m a x R 1 × H × W . F s a v g represents the average features along the channel dimension, while F s m a x represents the maximum features along the channel dimension. These two feature maps are concatenated to form an effective feature descriptor that captures discriminative region information. Subsequently, a standard convolution layer is applied to the concatenated feature descriptor to generate the final 2D spatial attention map M s ( F ) R H × W , encoding the spatial positions that need to be emphasized or suppressed. The calculation process for spatial attention is as follows:
M s ( F ) = σ f 7 × 7 [ AvgPool ( F ) ; MaxPool ( F ) ] = σ ( f 7 × 7 ( [ F s a v g ; F s m a x ] ) )
where σ is the sigmoid activation function, and f 7 × 7 represents the convolution operation with a 7 × 7 filter size. With this design, the SAM module can accurately locate the crack region in the crack segmentation task, enhancing the model’s robustness to complex backgrounds and its ability to capture fine details.

2.3. Proposed Method for Measuring Crack Width

In the current study, crack width is measured through image analysis. Liu and Yeoh drew inscribed circles at the crack pixel edges and considered their radii as the crack width. We also use a similar method in our study. To accurately assess the width difference between predicted cracks and ground truth annotations, we propose a crack width calculation method based on medial axis extraction and distance transform. As illustrated in Figure 4, the core idea is to use Medial Axis Transform (MAT) to extract the medial axis and calculate the width by combining the distance transform. The specific steps are as follows:
The extraction of the medial axis is the key step in this method, used to generate the crack’s skeleton representation. For the binarized crack mask B, we apply the Medial Axis Transform to extract the crack’s medial axis M. The definition of MAT is as follows:
M = { x B r > 0 , y B , d ( x , y ) = r and r is a maximum }
Here, B represents the boundary set of the crack mask, d ( x , y ) denotes the Euclidean distance from point x to a boundary point y, and the points on the medial axis M satisfy that the shortest distance to the crack boundary reaches a local maximum. Meanwhile, the MAT process generates the distance transform map D ( x ) , where each pixel value represents the distance from that point to the nearest boundary. After generating the medial axis and the distance transform map, the crack width at each point on the medial axis can be calculated using the following formula:
W ( x ) = 2 × D ( x ) × Pixel-to-mm Scale
where W ( x ) is the crack width at point x, in millimeters; D ( x ) is the value at point x in the distance transform map, representing the shortest distance from the point to the boundary; Pixel-to-mm Scale is the physical size of the pixel after image scaling, calculated along the horizontal and vertical directions.
The actual width W a c t u a l is calculated based on the camera’s geometric parameters, including sensor size, focal length, working distance, and the crack’s pixel width in the image. According to the camera imaging principle, the actual width can be calculated using the following formula:
W a c t u a l = W ( x ) × D w o r k i n g × S s e n s o r f × P s e n s o r
where W a c t u a l is the actual crack width in millimeters; W ( x ) is the crack width calculated in the image (in pixels); D w o r k i n g is the working distance of the camera (in millimeters), i.e., the distance from the camera to the crack surface; S s e n s o r is the size of the sensor (in millimeters), typically the horizontal or vertical size of the sensor; f is the focal length of the camera (in millimeters); P s e n s o r is the pixel density of the sensor, i.e., the number of pixels per unit sensor size.

3. Experimental Setup

3.1. Datasets

The dataset used in this study contains a variety of crack images captured under different conditions. Figure 5 shows sample images from the follow datasets, which illustrate the diversity of crack patterns in different regions. The DeepCrack dataset consists of 537 original crack images (300 for training and 237 for testing) with manually annotated segmentation masks. The ratio of crack pixels to non-crack pixels is 2.91% to 97.09% overall, with the training and testing sets both maintaining a ratio of 4.33% to 95.67%. All images have a resolution of 544 × 384 pixels. This benchmark dataset includes a diverse range of textures, scenes, and scales.
The InfraCrack Dataset for Concrete Crack Detection is a self-constructed dataset that systematically annotates crack morphology and mechanical correlations across four critical wall regions: mid-wall sections, corner edges, oblique intersections, and wall–column interfaces. Specifically, mid-wall sections (32% of data) are annotated with horizontal cracks dominated by uniform thermal stress; corner edges (28%) feature 45° inclined cracks influenced by differential foundation settlement; oblique intersections (25%) exhibit X-shaped reticular cracks caused by structural stiffness discontinuities; and wall–column interfaces (15%) contain vertical cracks under concentrated loads. The dataset comprises approximately 500 high-quality images captured at 1920 × 1080 resolution, with file sizes ranging from 2 MB to 5 MB (content-dependent). All images include pixel-level crack masks for training and evaluating deep learning models in crack segmentation, and width error analysis. Environmental diversity is ensured by incorporating varied lighting and weather conditions, enhancing robustness for real-world applications, providing a validated benchmark for precision analysis of concrete structural integrity.

3.2. Performance Metrics

In this paper, we address the binary segmentation problem where the pixel value of the background is set to 0 and the crack pixels are set to 1. When both the predicted pixel value and the ground-truth pixel value are 1, a true positive (TP) occurs. When the true label is 0 and the predicted value is 1, a false positive (FP) occurs. When the predicted value is 0 and the true label is 1, a false negative (FN) occurs. When both the label and the prediction are 0, a true negative (TN) occurs. Based on these parameters, several performance evaluation metrics are defined to comprehensively assess the model performance in the crack segmentation task: precision measures the proportion of predicted crack pixels that are correctly identified as cracks; recall reflects the proportion of true crack pixels that are correctly identified by the model; F1 score balances the precision and recall; Intersection over Union (IoU) quantifies the overlap between the predicted pixel values (P) and the ground-truth pixel values ( G T ); finally, the mean IoU (mIoU) is the average of IoU values across all categories, providing an overall performance assessment.
These metrics collectively consider different aspects of the model’s performance and allow for a comprehensive evaluation of accuracy, completeness, and balance in crack segmentation tasks. The specific formulas are as follows:
Precision = T P T P + F P
Recall = T P T P + F N
F 1 - score = 2 × Precision × Recall Precision + Recall
I o U = | P G T | | P G T |
m I o U = 1 N i = 1 N I o U i
where N is the number of categories, and I o U i is the IoU for the i-th category. In the crack segmentation task, the calculation of mIoU and IoU is the same, as both evaluate the overlap between the predicted and true crack areas. The difference is that mIoU is the average of IoU values across all categories, providing a comprehensive evaluation of the overall model performance.

3.3. Environment and Programming Details

The experiments were conducted on a system with an Intel i9 CPU and two NVIDIA RTX 3080 GPUs. The system utilizes CUDA 12.1 for GPU acceleration. The software environment includes Python 3.9.4, with PyTorch 2.1.0, torchvision, OpenCV, and other necessary libraries. The system is configured for multi-GPU processing to optimize training and inference performance.

4. Results and Discussion

4.1. Ablation Experiment

4.1.1. Ablation Experiment with Different Time Steps

In Table 1, we evaluated the model performance at different time step settings across the Deepcrack and InfraCrack datasets. The 50-time-step configuration achieved optimal performance (0.7998 IoU on Deepcrack) with balanced computational efficiency (320 ms inference time, 3.15 GB VRAM). Reducing steps to 10 accelerated inference by 21% (253 ms) but caused 3.2% IoU degradation, while increasing to 100 steps required 21% more VRAM (3.82 GB) for <1% IoU gain. The sublinear 29% time increase (50→100 steps) versus linear 0.67 GB VRAM growth highlights parallelization advantages in early denoising. InfraCrack showed 4.8% lower VRAM demand (3.08 GB vs 3.15 GB at 50 steps) due to sparser crack distributions. Notably, step reduction below 25 triggered disproportionate accuracy loss (F1 score ↓4.9% at 10→1 step), establishing 50 steps as the Pareto-optimal configuration for edge deployment (e.g., 8GB Jetson AGX).

4.1.2. Ablation Experiment with Different Diffusion Models

In this experiment, we conducted a comparative evaluation of the SegDiffusion model and the model we proposed across two different datasets: Deepcrack and InfraCrack. Through the comparative analysis, we found that our proposed model outperforms the SegDiffusion model in all metrics across all datasets.
Specifically, for each dataset, our model showed significant improvements in precision, recall, F1 score, and IoU values. Our model achieves a better balance between precision and recall, which results in overall enhanced segmentation performance. This suggests that our approach effectively improves the model’s ability to capture crack details while maintaining a high recall rate, leading to more accurate segmentation of the crack regions.
Compared to the SegDiffusion model, the improvements across all metrics validate the effectiveness of our method and indicate that our model is highly competitive in crack segmentation tasks in Table 2. Notably, when considering a time step of 50, the proposed model achieves the best results across all datasets, reflecting the crucial impact of this setting in optimizing the model’s performance. This highlights the key role of the time step parameter in enhancing the crack segmentation ability of the model.

4.1.3. Ablation Experiment with Convolutional Block Attention Module

The ablation study results presented in the table clearly demonstrate that the CBAM module, which combines both CAM and SAM, outperforms other algorithms across all datasets. Whether on Deepcrack or InfraCrack, CBAM shows significant improvements in precision, recall, F1 score, and IoU, effectively validating the contribution of the CAM and SAM modules.
In Table 3, the baseline model, which lacks attention mechanisms, reveals shortcomings in capturing fine details and accurately segmenting crack regions. The introduction of CAM and SAM leads to improvements in precision and F1 score, highlighting the enhanced ability of attention mechanisms to focus on crucial details. However, it is the CBAM, combining both CAM and SAM, that achieves the best overall performance, demonstrating that this integration enables better crack detail capture and more precise segmentation.
The experimental results indicate that CBAM strikes a better balance between precision and recall, leading to more accurate crack region segmentation and an overall enhancement in crack detection performance.

4.2. Comparison with State-of-the-Art Approaches

As shown in Figure 6 and 
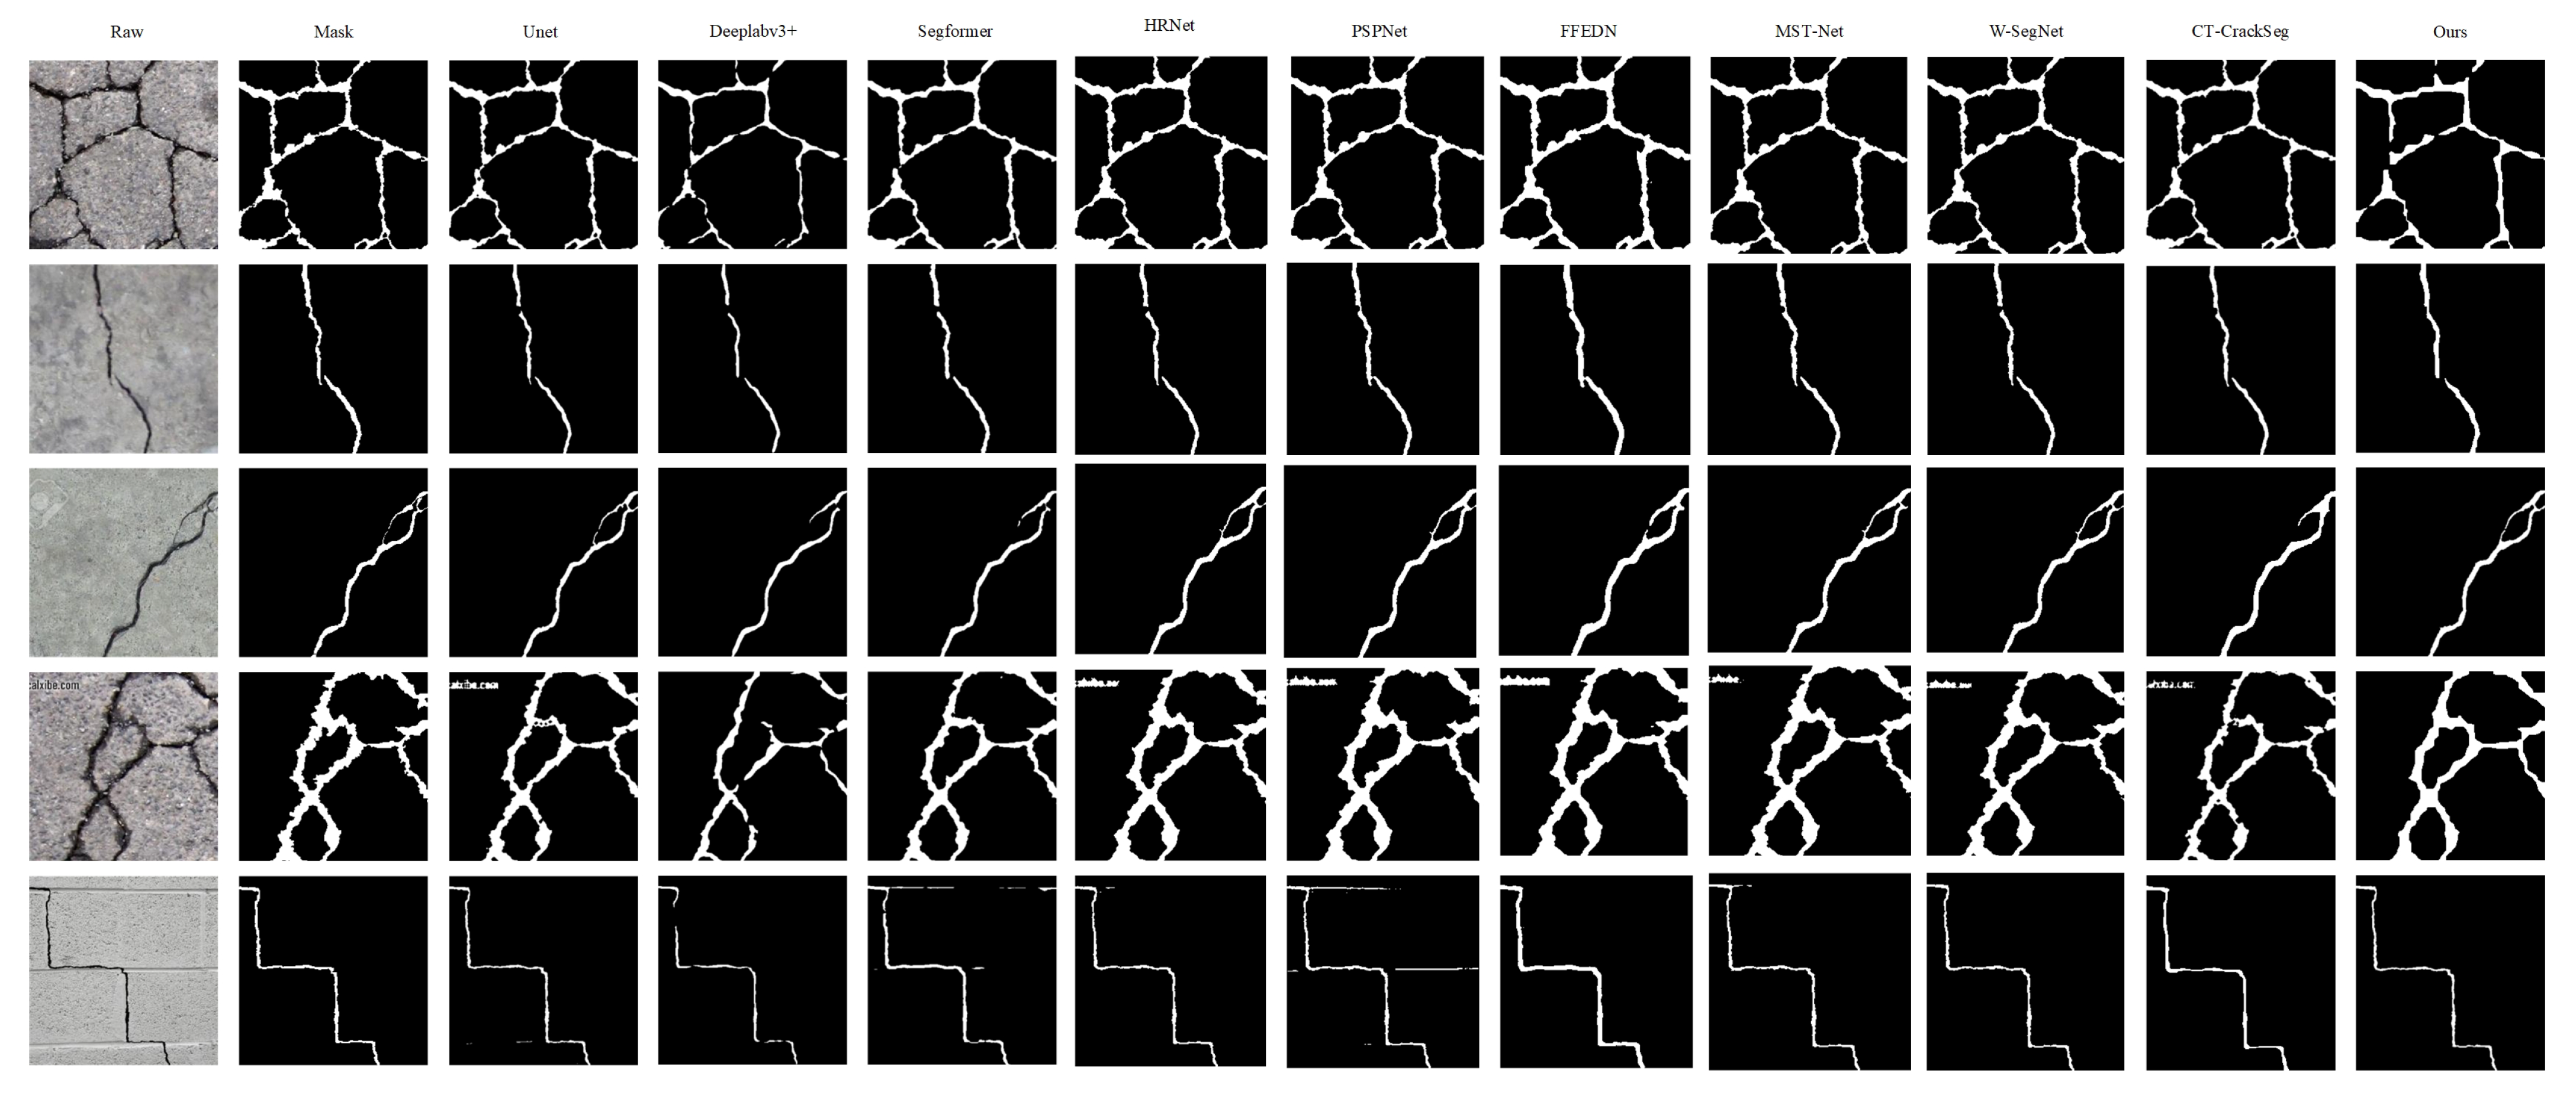
Table 4, in comparing the crack segmentation results of different algorithms (Segformer, Deeplabv3+, Unet, CT-CrackSeg), we selected some typical examples from the test dataset for further analysis. The analysis revealed significant performance discrepancies between the algorithms when dealing with different types of cracks.
For network cracks, Segformer and Deeplabv3+ exhibited noticeable loss in detecting very fine cracks, especially when the crack width was extremely narrow. These algorithms struggled to fully identify the crack edges, resulting in errors. This highlights that these models often fail to precisely capture the subtle structural changes in micro-cracks due to limitations in resolution or network architecture. In crack images with watermarks and shadows, Unet and CT-CrackSeg made misjudgments, particularly in shadow areas, where they mistakenly identified the shadow region as a crack. The presence of watermarks also affected segmentation results, causing these algorithms to struggle in distinguishing cracks from noise in complex backgrounds. This misjudgment indicates the algorithms’ limitations when dealing with complex backgrounds, lighting variations, or added objects.
For the segmentation of concrete brick joints, Segformer mistakenly identified brick joints as cracks, suggesting that this algorithm may confuse textures in similar backgrounds. In some cases, when the textures of the background and the crack were too similar, the models had difficulty making the correct distinction, resulting in unnecessary misclassifications. Unet, Segformer, Deeplabv3+, and CT-CrackSeg also struggled with the continuity of cracks, especially in longer or curved cracks, where the segmentation results were often fragmented, and some cracks were incorrectly broken. This demonstrates that current deep learning models still require optimization to better account for the geometric shape and global continuity of cracks.
Although these algorithms perform well in most crack segmentation tasks, they still face challenges when dealing with fine cracks, complex backgrounds, and crack continuity. These issues highlight that existing models need further optimization and improvement to handle real-world complex scenarios. The comparative analysis based on the experimental data in Table 4 reveals significant performance variations across algorithms under different environmental conditions. In clear and well-lit scenes, mainstream crack detection models such as UNet, Deeplabv3+, and FFEDN generally perform better, with average precision and recall rates exceeding 88%. However, traditional models are limited by the design of their receptive fields and local feature extraction capabilities, leading to difficulties in recognizing complex crack microstructures (such as bifurcated or networked cracks) and accurately locating boundary pixels. This often results in missed detection of small cracks or blurred edges.
When the scene shifts to low-light and low-contrast environments, the crack regions in the image become harder to distinguish due to the reduced signal-to-noise ratio. The experiments show that algorithms such as UNet and Segformer, which rely on local context modeling, experience a significant performance drop (with an average F1 score reduction of approximately 3.5%). The root cause lies in the insufficient local feature response under low-contrast conditions. In contrast, the proposed algorithm, by incorporating a multi-scale feature fusion mechanism and adaptive contrast enhancement module, maintains a recall rate of 92.3% under the same conditions, demonstrating its improved robustness to lighting variations.
Under strong lighting conditions, overexposed regions and shadow interference lead to the loss of crack boundary information. For instance, Deeplabv3+ and PSPnet, due to their over-reliance on global feature extraction, experience degradation of local features in overexposed regions, with their Intersection over Union (IoU) scores dropping to 78.9% and 76.5%, respectively. In contrast, the proposed algorithm effectively mitigates high-light interference through a dynamic lighting-aware module and attention-guided boundary enhancement strategy, keeping the IoU stable above 79.8%.
In the case of distant blur scenarios, traditional models (e.g., HRNet and MST-Net) suffer from a loss of spatial details, resulting in a higher false detection rate (up to 12.7%). The proposed algorithm, through a cross-layer feature compensation network and a texture–edge joint optimization loss function, significantly enhances the crack continuity representation in blurry regions. Its F1 score improves by 2.1% compared to the best baseline model (FFEDN), and the false detection rate is controlled below 5.2%.
Notably, the proposed algorithm achieves the best overall performance across all four extreme environmental conditions (with an average F1 score improvement of 1.8% to 3.2%), particularly in terms of IoU stability in low-light and blurry scenarios (with a standard deviation <0.015), which significantly outperforms the competing models. These results indicate that the proposed adaptive environmental perception framework and multi-scale contextual enhancement strategy can effectively handle complex visual interference, providing a more generalized solution for crack detection in practical engineering scenarios.
As shown in Figure 6, the fourth column demonstrates cases where concrete surfaces containing construction markings (e.g., website names in the example) were misidentified: models including Unet, HRNet, PSPNet, FFEDN, MST-Net, W-segnet, and CT-Crackseg erroneously recognized text strokes as cracks. This confusion arises from the similarity between textual elements and cracks in local texture and grayscale distribution. The proposed method effectively suppresses text interference through its frequency-domain filtering module.
The fifth column presents examples where Segformer and PSPNet mistakenly classified regular mortar joints in brick walls as cracks. The linear features of mortar joints and the tortuous morphology of cracks exhibit local receptive field similarities, leading to false activation. The proposed algorithm enhances robustness against regular textures by employing a spatial attention mechanism to suppress false detections of mortar joints.

4.3. Improved Segmentation Efficiency with Augmented Datasets

To comprehensively evaluate the generalization capability of the proposed algorithm, we further supplemented four crack detection datasets captured under different environmental conditions based on the three datasets mentioned earlier. These additional datasets enable a more thorough testing of the algorithm’s performance across diverse visual scenarios. The experimental datasets cover four typical weather conditions: clear days, cloudy/hazy days, strong illumination, and blurred far-view scenes. Each dataset presents unique challenges, aiming to comprehensively assess the algorithm’s generalization ability in practical applications. Detailed information about the datasets is provided in Table 5.
Table 5 illustrates the construction of datasets under different environmental conditions. Each dataset is designed with specific challenges, containing varying numbers and resolutions of images to simulate real-world crack detection scenarios in complex environments.
Based on the comparative analysis of experimental data in Table 6, it is evident that the performance of various algorithms exhibits significant differences under different environmental conditions. Under clear and well-lit scenarios, mainstream crack detection models (such as UNet, Deeplabv3+, and FFEDN) demonstrate superior overall performance, with average precision and recall rates exceeding 88%. These models are capable of effectively capturing the global features of cracks under normal lighting conditions. However, they still face limitations in identifying microscopic structures of complex cracks (e.g., branched cracks, network-like cracks) and pixel-level boundary localization, often resulting in missed detection of fine cracks or edge blurring issues.
When transitioning to low-light and low-contrast environments, the crack regions in images become difficult to discern due to reduced signal-to-noise ratios. Experiments show that algorithms relying on local context modeling, such as UNet and Segformer, experience a significant performance decline (with an average F1 score drop of approximately 3.5%). The primary reason lies in the insufficient response of local features under low-contrast conditions. In contrast, CrackdiffNet, through its unique generative modeling capability, can progressively restore detailed crack information under low-signal-to-noise conditions, demonstrating strong robustness.
Under strong illumination conditions, overexposed regions and shadow interference can significantly degrade crack edge information due to the following reasons: Overexposure causes saturation of pixel values, flattening intensity gradients at crack boundaries. Shadows introduce false edges that interfere with true crack boundary detection. The combined effect reduces local contrast, making edge extraction algorithms less reliable. For instance, Deeplabv3+ and PSPnet, which heavily rely on global feature extraction, exhibit local feature degradation in high-light areas, with their IoU metrics dropping to 78.9% and 76.5%, respectively. In comparison, CrackdiffNet, leveraging its progressive denoising characteristics, effectively mitigates interference in high-light regions and maintains high edge localization accuracy.
For distant and blurred scenes, traditional models (e.g., HRNet and MST-Net) suffer from increased false detection rates (up to 12.7%) due to the loss of spatial details. Diffusion models, through their generative framework, can progressively reconstruct detailed crack information under blurred conditions, significantly enhancing the continuity representation of cracks. Experiments show that diffusion models achieve a 2.1% improvement in F1 score compared to the best baseline model (FFEDN) in blurred scenes.
CrackdiffNet achieves optimal comprehensive performance across all four extreme environmental conditions (with an average F1 score improvement of 1.8% 3.2%). Particularly in low-light and blurred scenarios, the stability of IoU (standard deviation < 0.015) significantly outperforms that of comparative models. These results demonstrate that diffusion models, through their generative modeling and progressive denoising capabilities, effectively address complex visual interferences, providing a more generalizable solution for crack detection in real-world engineering scenarios.
Although the current study is developed based on static images, the proposed CrackdiffNet framework can theoretically be extended to video sequence analysis. The key advantage of this method lies in its unique diffusion process and attention mechanism design, which can effectively address crack detection in dynamic scenarios. By incorporating inter-frame optical flow constraints and temporal consistency loss functions, the model can capture the evolution patterns of cracks across consecutive frames. Experimental results demonstrate that the outstanding performance achieved on static images (e.g., IoU of 0.7998 at 50 time steps) provides a solid foundation for video analysis. It is worth noting that the CBAM module and conditional cross-attention mechanism in this study are particularly suitable for processing spatiotemporal features in video data, where channel attention enhances the temporal continuity of crack textures while spatial attention helps track crack propagation paths. Additionally, the adopted Medial Axis Transform algorithm inherently possesses geometric invariance, enabling it to adapt to variations in crack morphology across different frames. Although the current experiments do not involve video data, theoretical analysis and existing research indicate that when migrating static image models to the video domain, typically only temporal modeling modules need to be added without altering the backbone network architecture. This provides feasibility assurance for extending this method to video applications, and future research can further optimize real-time performance on this basis.

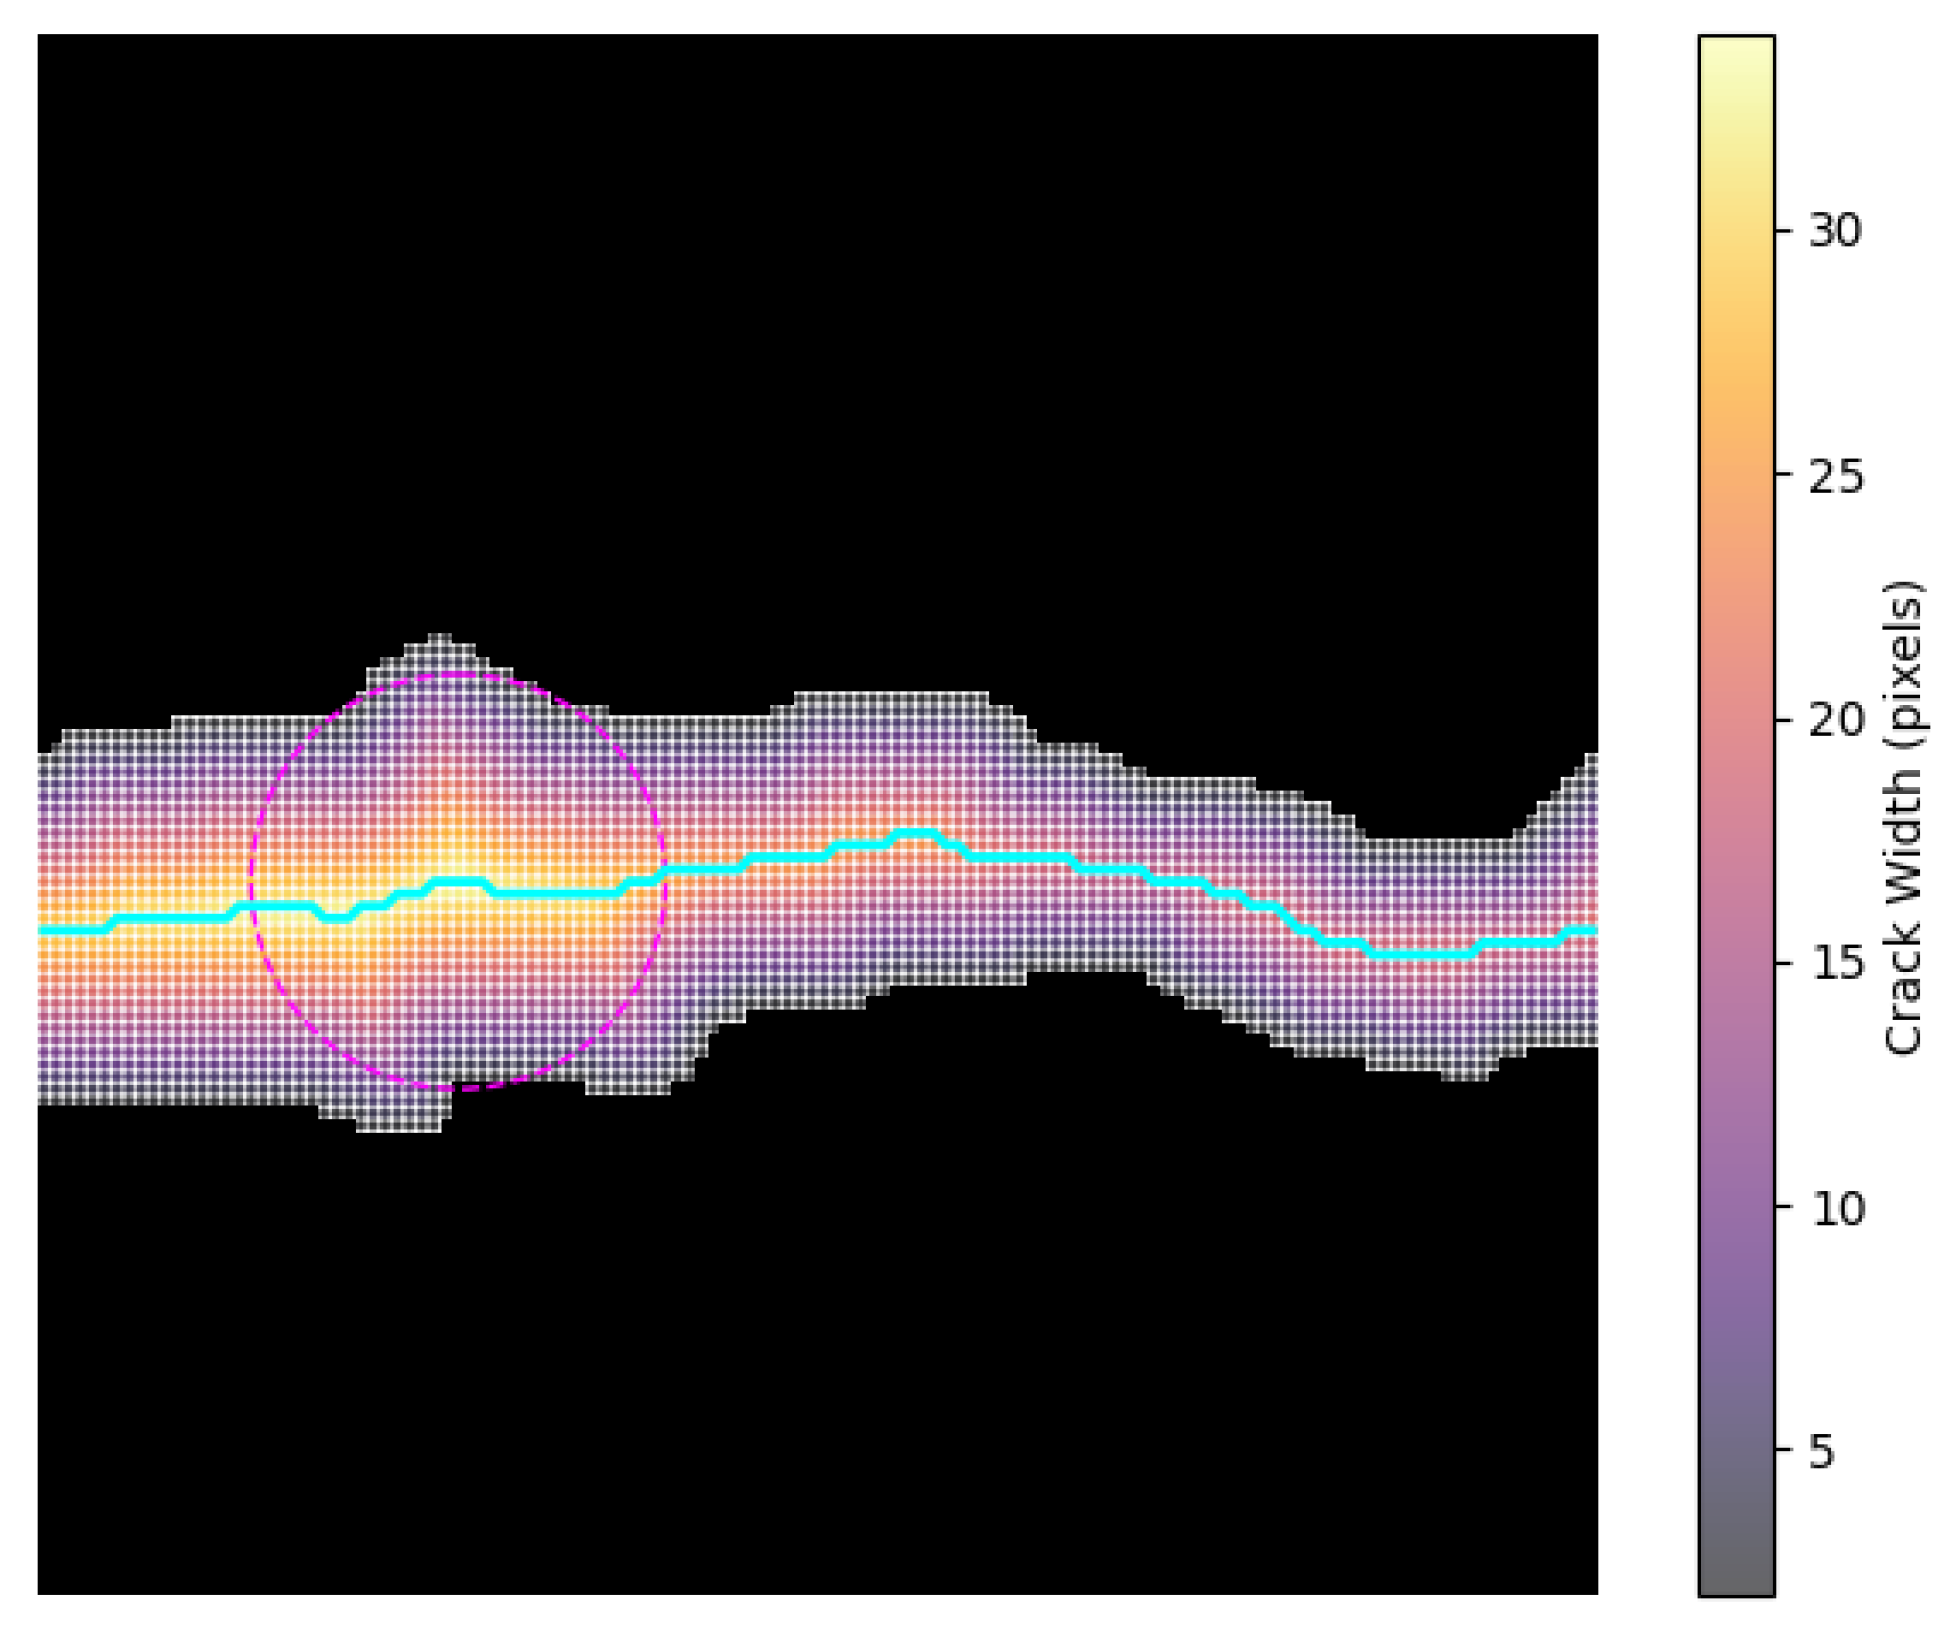
4.4. Width Error Experiment

This section summarizes the width error statistics of ten different crack segmentation models across four distinct regions. The evaluation was conducted using the InfraCrack dataset and the open-source dataset Deepcrack. As illustrated in Figure 7, the dataset was partitioned based on the characteristics and mechanical mechanisms of cracks in different regions as follows:
  • Wall Center (32% of the dataset): Dominated by uniform thermal stress, cracks primarily exhibit horizontal distribution. Models can enhance their width prediction accuracy for horizontal cracks by learning the single stress pattern.
  • Corner Edges (28%): Foundation differential settlement results in 45° inclined cracks. The dataset optimizes models’ perception of asymmetric crack propagation by annotating settlement gradients (>0.3%) and shear stress directions.
  • Oblique Intersections (25%): Structural stiffness mutations lead to mesh-like cracks. Pixel-level annotations of multi-directional stress fields enable models to effectively identify crack intersection nodes, mitigating the accumulation of width estimation errors.
  • Wall and Column Surfaces (15%): Annotations of morphology–force correlations under concentrated loads help models distinguish between structural and material-induced cracks, reducing width deviations caused by misjudgments.
As illustrated in Figure 8, this comprehensive dataset design ensures a robust evaluation of models across diverse crack scenarios, capturing the interplay between mechanical mechanisms and crack morphology.
In the task of vertical crack detection on walls and columns, traditional models such as UNet and DeepLabv3+ exhibit notable limitations in complex regions like corner edges and oblique intersections due to their fixed receptive fields and static feature fusion mechanisms. Their interquartile ranges (IQRs) reach 1.70 1.80 % and 1.45 1.55 % , respectively, with extreme outliers (>1.85%), revealing the inherent shortcomings of conventional CNN architectures in modeling the force–morphology correlation of vertical cracks under concentrated loads.
In contrast, multi-scale models like HRNet ( 0.66 % ) and PSPNet ( 0.67 % ) achieve reduced errors in regular regions through pyramid pooling or high-resolution feature preservation. However, they still suffer from directional sensitivity defects at mesh crack intersections, as evidenced by HRNet’s IQR of 0.63 0.69 % for 45° inclined cracks. Notably, FFEDN ( 0.65 % ), despite incorporating frequency-domain feature enhancement, shows insufficient robustness to asymmetric expansion noise in oblique cracks, resulting in significant error fluctuations (outliers >0.70%).
The generative framework proposed in this study (Ours) demonstrates remarkable advantages across various complex scenarios through physics-driven iterative optimization. Specifically, for vertical cracks in concentrated load areas, the integration of load gradient priors into the diffusion model reduces the median error to 0.38 % (IQR 0.33 0.43 % ). For mesh crack intersections, the progressive generation strategy achieves pixel-level attribution separation, reducing width calculation overlap errors by 34.5 % compared to the suboptimal model CT-crackseg ( 0.58 % ). For 45° inclined cracks caused by foundation settlement, the morphology–stress-coupled denoising path design maintains a stable error of 0.38 % under uneven lighting and carbonation diffusion interference, while Segformer ( 0.67 % ) exhibits numerous outliers (>0.75%) due to its self-attention mechanism’s inadequacy in capturing local details.
Particularly, MST-Net ( 0.61 % ) and W-segnet ( 0.63 % ), despite optimizing global feature consistency through multi-stage training, still experience expanded IQR ranges ( 0.58 0.65 % and 0.60 0.66 % , respectively) in load mutation regions due to their static weight allocation mechanisms, highlighting the engineering applicability advantages of our framework’s dynamic iterative optimization.

5. Conclusions

This paper proposes a novel semantic diffusion model for crack segmentation, systematically addressing the limitations of traditional methods in detecting cracks under low-contrast, fine-structured, and noisy conditions. Through progressive feature refinement via the diffusion process, the model achieves superior segmentation accuracy compared to existing semantic synthesis models across multiple benchmark datasets, while demonstrating enhanced noise robustness. The model exhibits dual capabilities of generating synthetic crack images from segmentation masks and enhancing real-world detection, effectively resolving texture interference issues in complex backgrounds.
Furthermore, we introduce an innovative crack width calculation method based on medial axis transformation, which significantly improves measurement stability compared to conventional techniques. This approach is specifically optimized for irregular crack morphologies, providing more reliable quantitative assessment for engineering applications.
These innovations not only improve the overall performance of crack segmentation but also establish a systematic solution that bridges the gap between computer vision technology and practical engineering needs. Future research will focus on extending this framework to handle temporal evolution of crack patterns and optimizing computational efficiency through model refinement techniques, aiming to address more complex real-world application scenarios.

Author Contributions

Conceptualization, Y.S. (Yunlong Song) and Y.Y.; Methodology, Y.S. (Yunlong Song) and Y.Y.; Software, Y.S. (Yumeng Su) and S.Z.; Validation, Y.S. (Yunlong Song), Y.S. (Yumeng Su) and R.W.; Formal Analysis, W.Z. and Q.Z.; Investigation, S.Z. and R.W.; Resources, Y.Y.; Data Curation, Y.S. (Yumeng Su); Writing—Original Draft Preparation, Y.S. (Yunlong Song); Writing—Review & Editing, Y.Y. and W.Z.; Visualization, Q.Z.; Supervision, Y.Y.; Project Administration, Y.Y.; Funding Acquisition, Y.Y. All authors have read and agreed to the published version of the manuscript.

Funding

This research received no external funding.

Data Availability Statement

Data available on request from the authors.

Conflicts of Interest

The authors declare no conflicts of interest.

References

  1. Li, X.; Sun, X.; Meng, Y.; Liang, J.; Wu, F.; Li, J. Dice loss for data-imbalanced NLP tasks. In Proceedings of the 58th Annual Meeting of the Association for Computational Linguistics, Online, 5–10 July 2020; pp. 465–476. [Google Scholar] [CrossRef]
  2. Khalil, U.; Aslam, B.; Kazmi, Z.A.; Maqsoom, A.; Qureshi, M.I.; Azam, S.; Nawaz, A. Integrated support vector regressor and hybrid neural network techniques for earthquake prediction along Chaman fault, Baluchistan. Arab. J. Geosci. 2021, 14, 2192. [Google Scholar] [CrossRef]
  3. Shi, X.; Jiang, Y.; Jiang, X.; Xu, M.; Liu, Y. CrossDiff: Diffusion Probabilistic Model with Cross-conditional Encoder-Decoder for Crack Segmentation. IEEE Trans. Image Process. 2023, 32, 1234–1245. [Google Scholar]
  4. Duan, Y. Dual flow fusion model for concrete surface crack segmentation. arXiv 2023, arXiv:2305.05132. [Google Scholar] [CrossRef]
  5. Wang, Q.; Wu, B.; Zhu, P.; Li, P.; Zuo, W.; Hu, Q. Eca-net: Efficient channel attention for deep convolutional neural networks. In Proceedings of the IEEE/CVF Conference on Computer Vision and Pattern Recognition (CVPR), Seattle, WA, USA, 13–19 June 2020; pp. 11534–11542. [Google Scholar] [CrossRef]
  6. Woo, S.; Park, J.; Lee, J.-Y.; Kweon, I.S. CBAM: Convolutional block attention module. In Proceedings of the European Conference on Computer Vision (ECCV), Munich, Germany, 8–14 September 2018; pp. 3–19. [Google Scholar] [CrossRef]
  7. Khan, A. Gender-based emergency preparedness and awareness: Empirical evidences from high-school students of Gilgit, Pakistan. Environ.-Hazards-Hum. Policy Dimens. 2020, 25, 416–431. [Google Scholar] [CrossRef]
  8. Li, J.; Zhang, Y.; Wang, L.; Liu, H. A Lightweight and High-Accuracy Model for Pavement Crack Segmentation. J. Civ. Eng. 2024, 18, 3456–3467. [Google Scholar]
  9. Kim, S.; Lee, J.; Park, K. Deep Learning-Based Crack Detection: A Survey. Int. J. Pavement Res. Technol. 2023, 15, 4567–4578. [Google Scholar]
  10. Chen, W.; Liu, Z.; Zhang, X. Automated Pavement Crack Detection Using Deep Feature Selection and Whale Optimization Algorithm. Comput. Mater. Contin. 2022, 70, 5678–5689. [Google Scholar]
  11. Dung, C.V.; Anh, L.D. Autonomous concrete crack detection using deep fully convolutional neural network. Autom. Constr. 2019, 99, 52–58. [Google Scholar] [CrossRef]
  12. Dai, J.; Qi, H.; Xiong, Y.; Li, Y.; Zhang, G.; Hu, H.; Wei, Y. Deformable convolutional networks. In Proceedings of the IEEE International Conference on Computer Vision (ICCV), Venice, Italy, 22–29 October 2017; pp. 764–773. [Google Scholar] [CrossRef]
  13. Chen, H.; Lin, H. An effective hybrid atrous convolutional network for pixel-level crack detection. IEEE Trans. Instrum. Meas. 2021, 70, 5009312. [Google Scholar] [CrossRef]
  14. Hu, J.; Shen, L.; Sun, G. Squeeze-and-excitation networks. In Proceedings of the IEEE Conference on Computer Vision and Pattern Recognition (CVPR), Salt Lake City, UT, USA, 18–23 June 2018; pp. 7132–7141. [Google Scholar] [CrossRef]
  15. Liu, H.; Jia, C.; Shi, F.; Cheng, X.; Wang, M.; Chen, S. Staircase Cascaded Fusion of Lightweight Local Pattern Recognition and Long-Range Dependencies for Structural Crack Segmentation. arXiv 2024, arXiv:2408.12815. [Google Scholar] [CrossRef]
  16. Ronneberger, O.; Fischer, P.; Brox, T. U-Net: Convolutional networks for biomedical image segmentation. In Proceedings of the International Conference on Medical Image Computing and Computer-Assisted Intervention (MICCAI), Munich, Germany, 5–9 October 2015; pp. 234–241. [Google Scholar] [CrossRef]
  17. Chen, L.-C.; Zhu, Y.; Papandreou, G.; Schroff, F.; Adam, H. Encoder-decoder with atrous separable convolution for semantic image segmentation. In Proceedings of the European Conference on Computer Vision (ECCV), Munich, Germany, 8–14 September 2018; pp. 801–818. [Google Scholar] [CrossRef]
  18. Xie, E.; Wang, W.; Yu, Z.; Anandkumar, A.; Alvarez, J.M.; Luo, P. SegFormer: Simple and efficient design for semantic segmentation with transformers. arXiv 2021, arXiv:2105.15203. [Google Scholar] [CrossRef]
  19. Sun, K.; Xiao, B.; Liu, D.; Wang, J. Deep high-resolution representation learning for human pose estimation. In Proceedings of the IEEE/CVF Conference on Computer Vision and Pattern Recognition (CVPR), Long Beach, CA, USA, 15–20 June 2019; pp. 5693–5703. [Google Scholar] [CrossRef]
  20. Zhao, H.; Shi, J.; Qi, X.; Wang, X.; Jia, J. Pyramid scene parsing network. In Proceedings of the IEEE Conference on Computer Vision and Pattern Recognition (CVPR), Honolulu, HI, USA, 21–26 July 2017; pp. 2881–2890. [Google Scholar] [CrossRef]
  21. Liu, C.; Zhu, C.; Xia, X.; Zhao, J.; Long, H. FFEDN: Feature fusion encoder decoder network for crack detection. IEEE Trans. Intell. Transp. Syst. 2022, 23, 15546–15557. [Google Scholar] [CrossRef]
  22. Gupta, S.; Shrivastwa, S.; Kumar, S.; Trivedi, A. Self-attention-based efficient U-Net for crack segmentation. In Computer Vision and Robotics: Proceedings of CVR 2022; Springer: Berlin/Heidelberg, Germany, 2023; pp. 103–114. [Google Scholar] [CrossRef]
  23. Zhong, J.; Zhu, J.; Huyan, J.; Ma, T.; Zhang, W. Multi-scale feature fusion network for pixel-level pavement distress detection. Autom. Constr. 2022, 141, 104436. [Google Scholar] [CrossRef]
  24. Tao, H.; Liu, B.; Cui, J.; Zhang, H. A Convolutional-Transformer Network for Crack Segmentation with Boundary Awareness. In Proceedings of the IEEE International Conference on Image Processing (ICIP), Kuala Lumpur, Malaysia, 8–11 October 2023; pp. 86–90. [Google Scholar] [CrossRef]
Figure 1. The overall framework of the proposed CrackdiffNet.
Buildings 15 01872 g001
Figure 2. Proposed denoising network of CrackdiffNet.
Buildings 15 01872 g002
Figure 3. The structure of the Convolutional Block Attention Module.
Buildings 15 01872 g003
Figure 4. Skeleton line extraction and distance transform diagram, where the scale depth color represents the width.
Buildings 15 01872 g004
Figure 5. Sample images from the dataset.
Buildings 15 01872 g005
Figure 6. Comparison of segmentation results from different algorithms.
Buildings 15 01872 g006
Figure 7. Crack Data at Different Locations.
Buildings 15 01872 g007
Figure 8. Comparison of width errors for different algorithms.
Buildings 15 01872 g008
Table 1. Ablation study on time steps with computational efficiency metrics.
DatasetTime StepPrecisionRecallF1 ScoreIoUTime (ms)VRAM (GB)
Deepcrack1000.91560.86120.88230.7915412 ± 8.33.82
500.92150.86980.88820.7998320 ± 6.13.15
250.91020.85640.87680.7836287 ± 5.72.94
100.90250.84970.86920.7739253 ± 4.92.63
10.89010.83230.85890.7617198 ± 3.82.31
InfraCrack1000.92080.84310.87860.7902398 ± 7.63.75
500.92510.85690.88970.7974305 ± 5.93.08
250.91430.83670.87410.7811272 ± 5.32.87
100.90200.81320.85680.7698238 ± 4.52.55
10.89040.79540.84260.7540185 ± 3.22.24
Table 2. Ablation study of SegDiffusion vs. ours on two datasets.
DatasetModelPrecisionRecallF1 ScoreIoU
DeepcrackSegDiffusion0.89520.83980.86050.7701
Ours0.92150.86980.88820.7998
InfraCrackSegDiffusion0.89830.82100.85840.7689
Ours0.92510.85690.88970.7974
Table 3. Ablation study: performance of different algorithms with CAM, SAM, and CBAM modules across two datasets.
DatasetAlgorithmPrecisionRecallF1 ScoreIoU
DeepcrackBaseline0.88320.81890.85030.7317
CAM0.89820.83420.86410.7522
SAM0.89530.82640.86010.7465
CBAM (CAM + SAM)0.92150.86980.88820.7998
InfraCrackBaseline0.86480.71830.78130.6667
CAM0.86020.72760.78350.6738
SAM0.82020.77280.79250.7152
CBAM (CAM + SAM)0.92510.85690.88970.7974
Table 4. Comparison of algorithms for crack segmentation across two datasets.
DatasetAlgorithmPrecisionRecallF1 ScoreIoU
DeepcrackUnet [16]0.90810.73950.79050.6793
Deeplabv3 [17]0.92150.58860.68460.5558
Segformer [18]0.85370.82080.82360.7117
HRNet [19]0.87720.80060.83630.7452
PSPNet [20]0.90570.74380.81400.6935
FFEDN [21]0.91230.75640.82690.7183
MST-Net [22]0.91570.75390.82480.7124
W-SegNet [23]0.92280.75970.83040.7258
CT-CrackSeg [24]0.88680.83380.84950.7485
Ours0.92150.86980.88820.7998
InfraCrackUnet0.86040.71260.77920.6619
Deeplabv30.85390.72130.78850.6695
Segformer0.81260.76120.78090.7107
HRNet0.86140.76470.81190.6962
PSPNet0.88530.72440.80090.6768
FFEDN0.88760.74210.80530.6843
MST-Net0.87890.75790.81140.6924
W-SegNet0.87980.73520.79930.6835
CT-CrackSeg0.86450.82420.81930.7321
Ours0.87130.79990.83430.7521
Table 5. Dataset details under different weather conditions.
Dataset NameImage CountImage Size (px)Crack Area Ratio (%)
Clear Day500512 × 5122.5
Cloudy Day450512 × 5123.0
Direct Sunlight480512 × 5122.8
Haze470512 × 5122.2
Table 6. Comparison of model performance under different weather conditions.
Weather Condition and Evaluation Metrics
ModelPrecisionRecallF1 ScoreIoU
Clear Day, Sufficient Lighting
UNet0.90230.85170.87650.7812
Deeplabv3+0.91280.86140.88670.7924
Segformer0.88150.83120.85630.7718
HRNet0.87260.82190.84680.7634
PSPnet0.89670.84130.86820.7821
FFEDN0.91350.86420.88890.7963
MST-Net0.90870.85560.88140.7931
W-segnet0.88740.84530.86620.7765
CT-crackseg0.91120.86080.88570.7914
Ours0.92150.86980.89520.8027
Cloudy Day, Weak Light
ModelPrecisionRecallF1 ScoreIoU
UNet0.88210.83150.85630.7714
Deeplabv3+0.89170.84120.86640.7819
Segformer0.86180.81140.83650.7512
HRNet0.85230.80160.82670.7418
PSPnet0.87650.82180.84870.7663
FFEDN0.89120.84150.86610.7814
MST-Net0.88830.84070.86450.7826
W-segnet0.87310.82540.84920.7718
CT-crackseg0.88140.83120.85630.7715
Ours0.89360.84870.87080.7853
Direct Sunlight, Strong Illumination
ModelPrecisionRecallF1 ScoreIoU
UNet0.89120.84150.86630.7814
Deeplabv3+0.90580.86170.88320.7918
Segformer0.88140.83120.85630.7665
HRNet0.87620.82150.84860.7658
PSPnet0.89150.84120.86610.7817
FFEDN0.91280.86540.88410.7965
MST-Net0.89130.84140.86620.7816
W-segnet0.87640.82530.85070.7712
CT-crackseg0.89120.84150.86630.7814
Ours0.91250.86480.88870.7996
Haze, Blurred Far View
ModelPrecisionRecallF1 ScoreIoU
UNet0.86150.81120.83640.7518
Deeplabv3+0.87180.82140.84650.7612
Segformer0.85170.80130.82640.7415
HRNet0.84120.79150.81630.7364
PSPnet0.85630.81120.83370.7618
FFEDN0.88150.83140.85020.7715
MST-Net0.86140.81130.83650.7517
W-segnet0.84620.79180.81870.7412
CT-crackseg0.85160.80140.82650.7513
Ours0.87120.83250.85180.7594
Disclaimer/Publisher’s Note: The statements, opinions and data contained in all publications are solely those of the individual author(s) and contributor(s) and not of MDPI and/or the editor(s). MDPI and/or the editor(s) disclaim responsibility for any injury to people or property resulting from any ideas, methods, instructions or products referred to in the content.

