Article

Dynamic Response of a Bedding Rock Slope Reinforced by a Pile–Anchor Structure Under Earthquakes

1
YCIC Group Investment Co., Ltd., Kunming 650228, China
2
Broadvision Engineering Consultants of Yunnan Province, Kunming 650011, China
3
College of Architecture and Civil Engineering, Beijing University of Technology, Beijing 100124, China
*
Author to whom correspondence should be addressed.
Buildings 2025, 15(11), 1869; https://doi.org/10.3390/buildings15111869
Submission received: 20 March 2025 / Revised: 25 May 2025 / Accepted: 27 May 2025 / Published: 28 May 2025
(This article belongs to the Section Building Structures)

Abstract

Pile–anchor structures offer an effective way to reinforce slopes in earthquake-prone regions. Static and quasi-static analysis on pile–anchor structures has been widely conducted, but their dynamic behaviors have not been well addressed. This study explores the dynamic behavior of a bedding rock slope strengthened by pile–anchor structures in a seismic-prone region of China. We propose a method for the automatic application of viscoelastic boundaries and input of seismic waves in ABAQUS (version 2021) using MATLAB R2023a programming. A series of numerical simulations for the pile–anchor-reinforced slope under seismic motions with different acceleration amplitudes and excitation directions are performed. We find that the PGA amplification factors at the slope surface are larger than those in the middle of the slope, which is because the bedding planes near the slope surface cause reflections of seismic waves. The maximum axial force of the anchors of the upper and lower rows is greater than that of the middle rows. For example, under an acceleration amplitude of 0.1 g, the maximum axial forces of the anchors with numbers ranging from 1 to 6 are 466, 462, 461, 460, 461, and 463 kN, respectively. The distribution of the peak values of the earth pressure presents a significant change around the sliding surface. The maximum bending moment of the pile increases from 0.55 × 10³ to 0.90 × 10³ kN·m as the acceleration amplitudes of the seismic waves increase from 0.2 to 0.3 g, indicating that the pile can bear the load caused by the movement of the slope.

1. Introduction

Earthquakes have triggered many landslides in the mountainous regions of southwest China. For example, the 2008 Wenchuan earthquake (Mw 7.9) induced about 56,000 landslides [1,2], and the 2014 Ludian earthquake (Mw 6.1) triggered more than 1400 landslides [3]. How to improve the seismic performance of slopes and reduce landslide disasters in earthquake-prone areas is a hot topic in geotechnical engineering. Engineering practice shows that pile–anchor structures can effectively transfer sliding forces of a slope to stable strata to maintain the stability of the slope [4,5]. Their wide use in stabilizing slopes can be attributed to their good performance, economy, and simple construction [4,6,7,8]. Due to the complexity of the force transmission mechanism in the pile–anchor slope system, basic problems such as dynamic behaviors and pile–anchor–soil interactions are still poorly understood [9]. Slope failures caused by pile damage and anchor head failure during earthquakes still exist [8,10,11]. Therefore, further understanding of how these systems respond under earthquakes is very important for the seismic design of slopes in earthquake-prone zones.
Research methods on slope seismic stability are broadly divided into four categories, i.e., the pseudostatic method [12,13,14], the Newmark method [15,16,17,18,19], physical test methods [20,21], and numerical simulation methods [22,23,24,25]. The pseudostatic method treats complex seismic loads as permanent body forces and then calculates the slope safety factor through a limit equilibrium analysis [14]. It fails to consider the time and period effects of earthquakes, often resulting in the overly conservative design of slopes. The Newmark method assesses the stability of a slope by calculating its permanent displacement, but it neglects the randomness and complexity of earthquakes [26]. Physical modeling tests, including shaking table tests [24,27,28] and centrifuge tests [6,29,30,31], serve as a valid method to explore the dynamic response of reinforced slopes. However, their practical application is constrained by factors like model scale, testing duration, and cost. In contrast, numerical simulations provide a cost-effective and dependable approach for analyzing the dynamic characteristics of slopes and reinforcements during earthquakes, among which the finite element method (FEM) [32,33,34] and finite difference method (FDM) [35,36,37] are the most widely used.
Much work has been carried out regarding the seismic behavior of natural slopes [38,39,40,41,42], while relatively few studies have been conducted on the dynamic behaviors of reinforced slopes, especially the pile–anchor slope system. Currently, attempts have been made to explore the dynamic mechanisms of pile–anchor structures, primarily through physical model experiments and numerical modeling. For example, Xu and Huang [34] utilized the FEM to analyze how pile length, anchor positioning, and anchor prestress affect the seismic stability of slopes. Huang et al. [6] reported a 50× g centrifuge test on the failure patterns of a pile–anchor-reinforced slope. Bao et al. [43] and Chen et al. [5] conducted a sequence of shaking table tests to investigate acceleration amplification effects and soil–structure interactions under different ground motions. Asgari et al. [44,45] adopted three-dimensional parallel finite element methods to study the seismic resistance of pile groups against lateral spreading in liquefiable soils. These studies provide valuable insights into the seismic behavior of pile–anchor structures in homogeneous soil slopes under earthquakes. However, further investigations on the dynamic behavior of pile–anchor slope systems considering the heterogeneity of slope materials and time-dependent features of seismic loadings are still needed.
In this study, the dynamic behavior of a bedding rock slope strengthened by pile–anchor systems in a seismic-prone region of China is analyzed. Through examining parameters including slope deformation, anchor axial forces, and shear forces and bending moments in piles, the research intends to uncover the dynamic response of both the slope and the reinforcement structure. The results of this investigation may offer valuable insights for the seismic design of slopes in earthquake-prone zones.

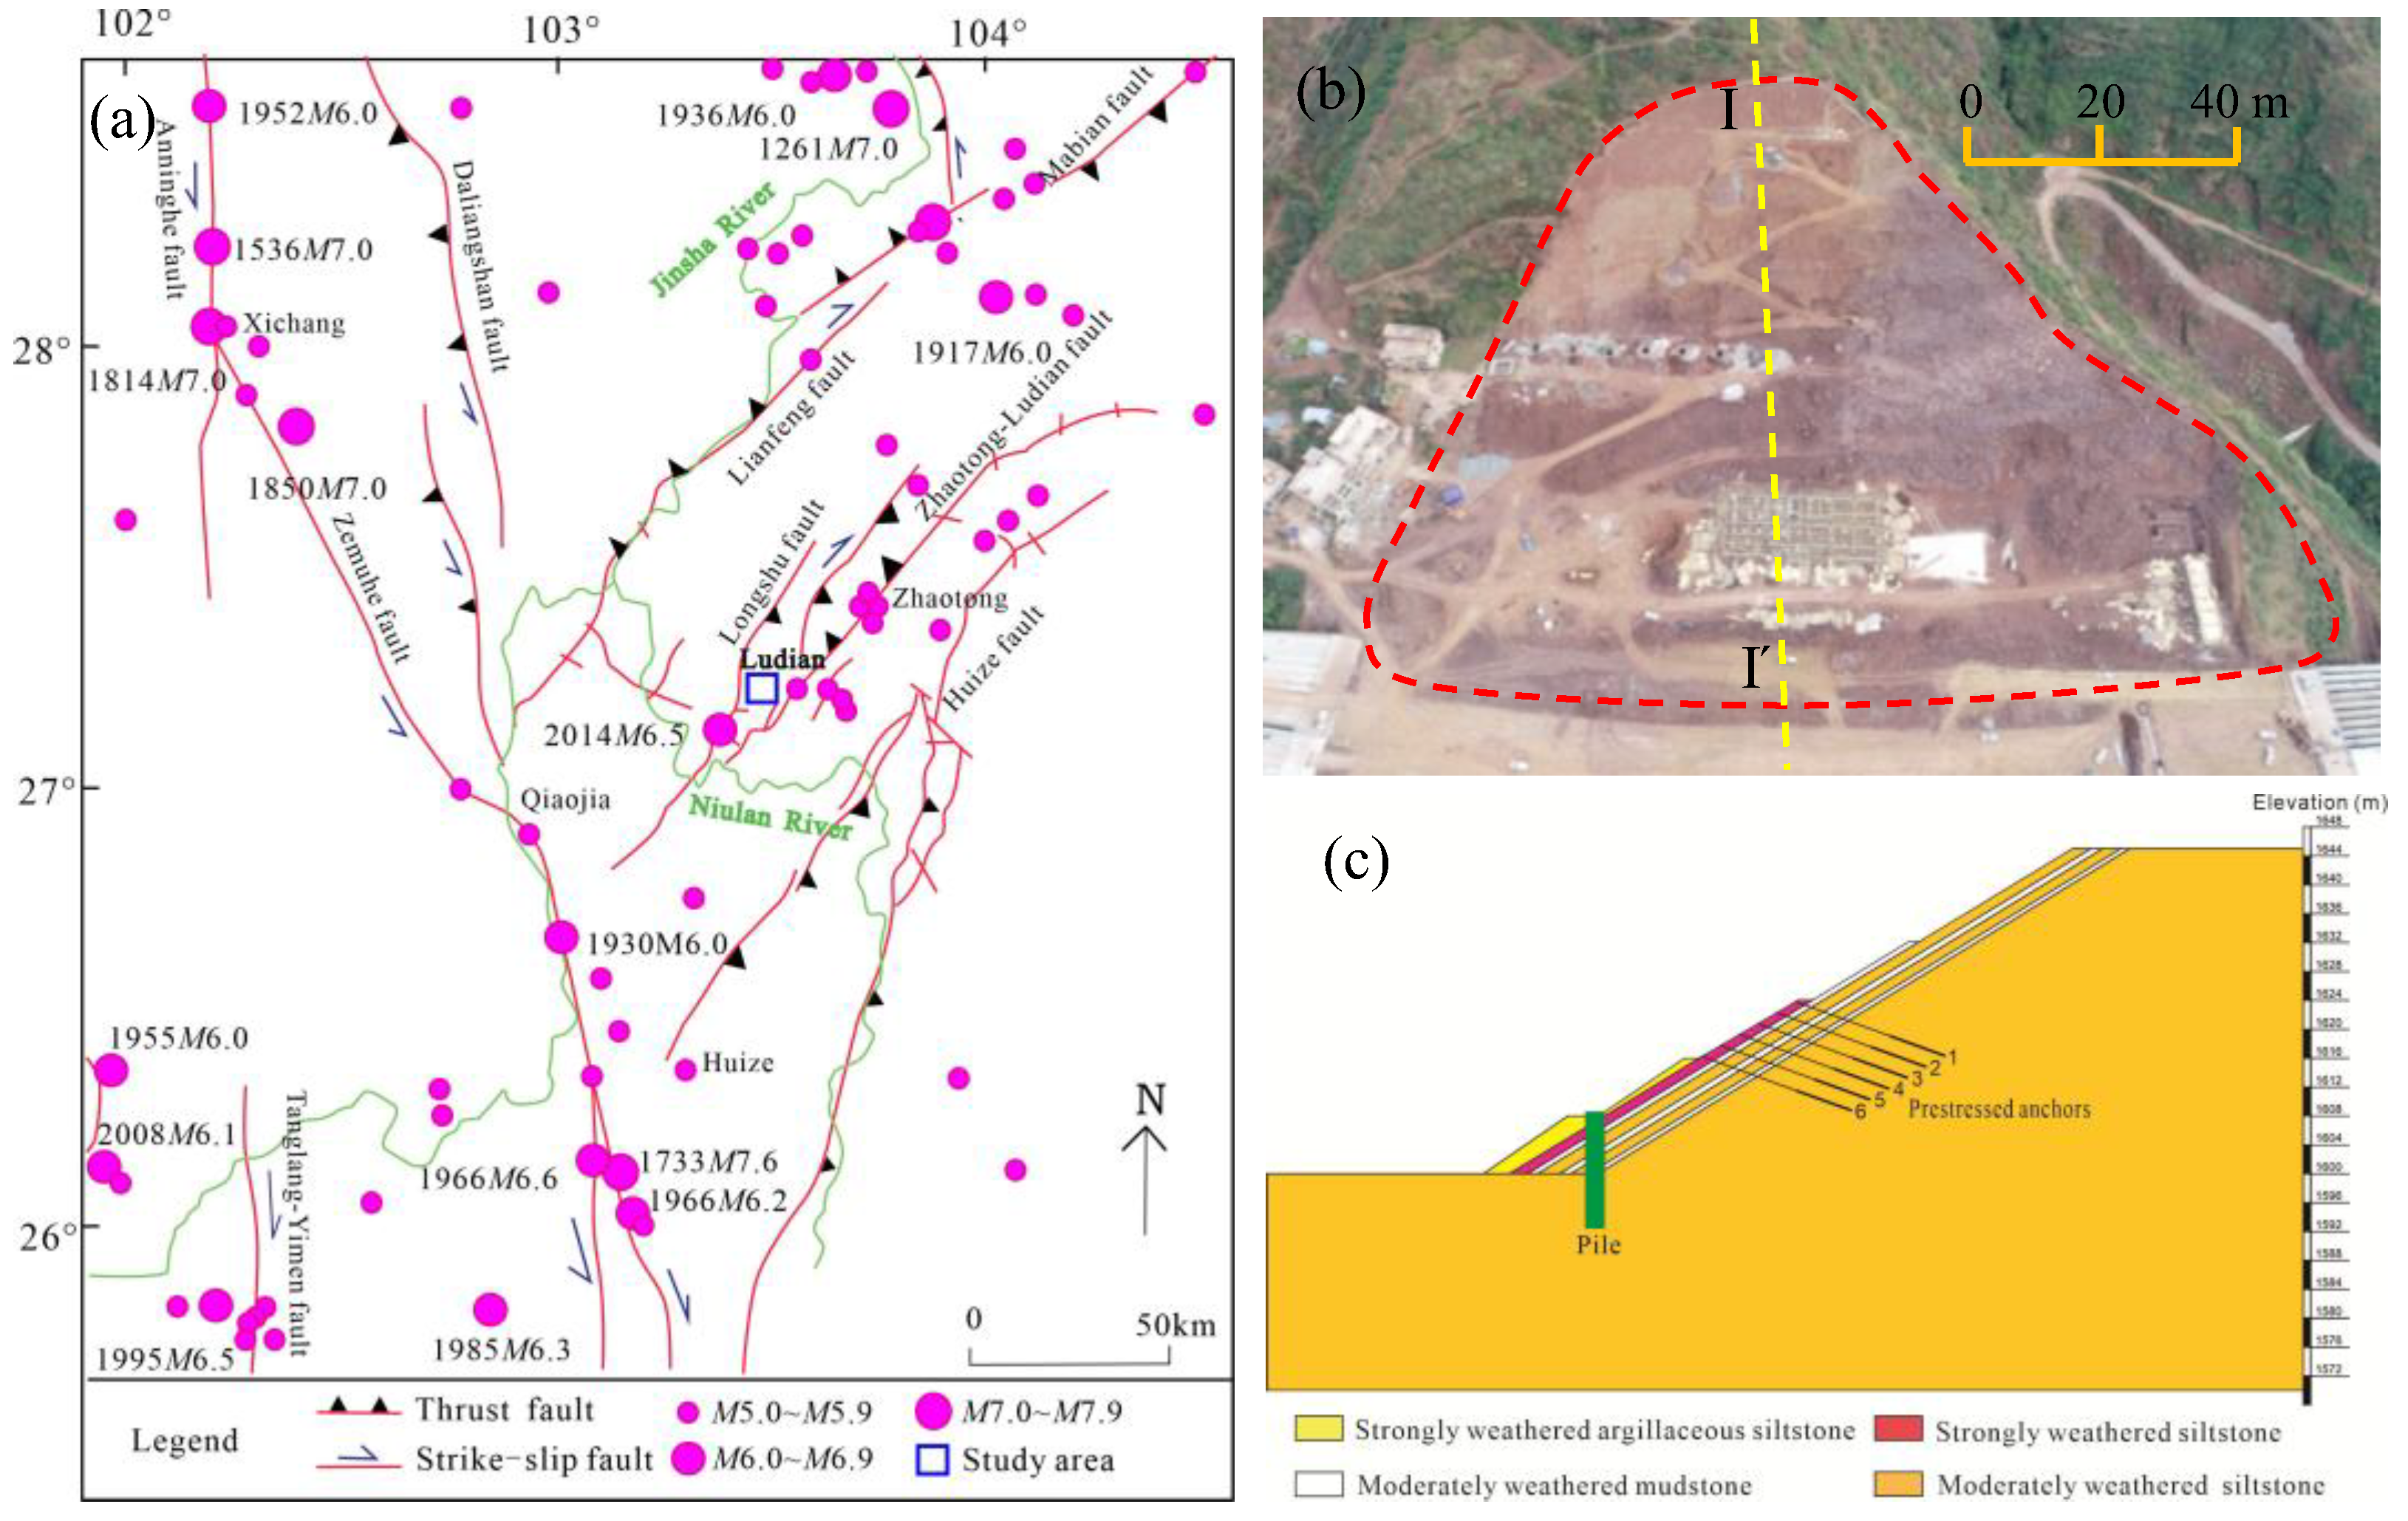
2. Geological Background

The studied slope is in Ludian County, Yunnan Province, China. Tectonically, the study area is situated in the Zhaotong–Lianfeng fault zone, which is composed of four NE-trending right-lateral thrust faults, including the Zhaotong–Ludian fault, the Lianfeng fault, the Huize fault, and the Longshu fault [3,46], as shown in Figure 1a. Historical records show that this area has experienced 12 earthquakes with Mw ≥ 5 since 1920 (Table 1) [2,47]. An especially significant Mw 6.1 earthquake occurred in Ludian County on 3 August 2014, with the epicenter in Longtoushan Town, triggering more than 1400 landslides [3]. Strong tectonic movement and frequent seismic activity have created a fragile environment that increases the occurrence of landslides in this region, resulting in a high-risk area for geological disasters.
The geomorphology of the slope is depicted in Figure 1b. The bedding rock slope, with a height of 45 m, is composed of siltstone, mudstone, and argillaceous siltstone, with a slope angle of 31°. The strike and dip of the rock layers are 318° and 31°, respectively. The thickness of the highly weathered argillaceous siltstone layer is 1.0 m and 2.7 m from top to bottom, respectively, the highly weathered siltstone layer is 1.3 m thick, the moderately weathered mudstone layer is 0.7 m, 1.1 m, and 1.1 m thick from top to bottom, respectively, and the upper moderately weathered siltstone layer is 1.6 m and 1.9 m thick in sequence. The Duxiang highway is designed to pass through the toe of the slope. A small landslide with a volume of approximately 7830 m3 occurred in September 2020 after road excavation. The field investigation shows that the rock block slid along the weak interlayer of mudstone. To stabilize the slope, a five-stage excavation scheme with pile–anchor structure reinforcement was designed (Figure 1c). A set of piles, each measuring 2.5 m (length) × 2 m (width) × 16 m (height), is positioned at the mid-slope. The center-to-center spacing between piles is 2.4 m. Six rows of 22 m long prestressed anchors, each with an anchored section of 8 m and a free section of 14 m, are installed at the slope’s mid-region with an inclination angle of 20°. The applied prestress for these anchors is 460 kN.

3. Numerical Model

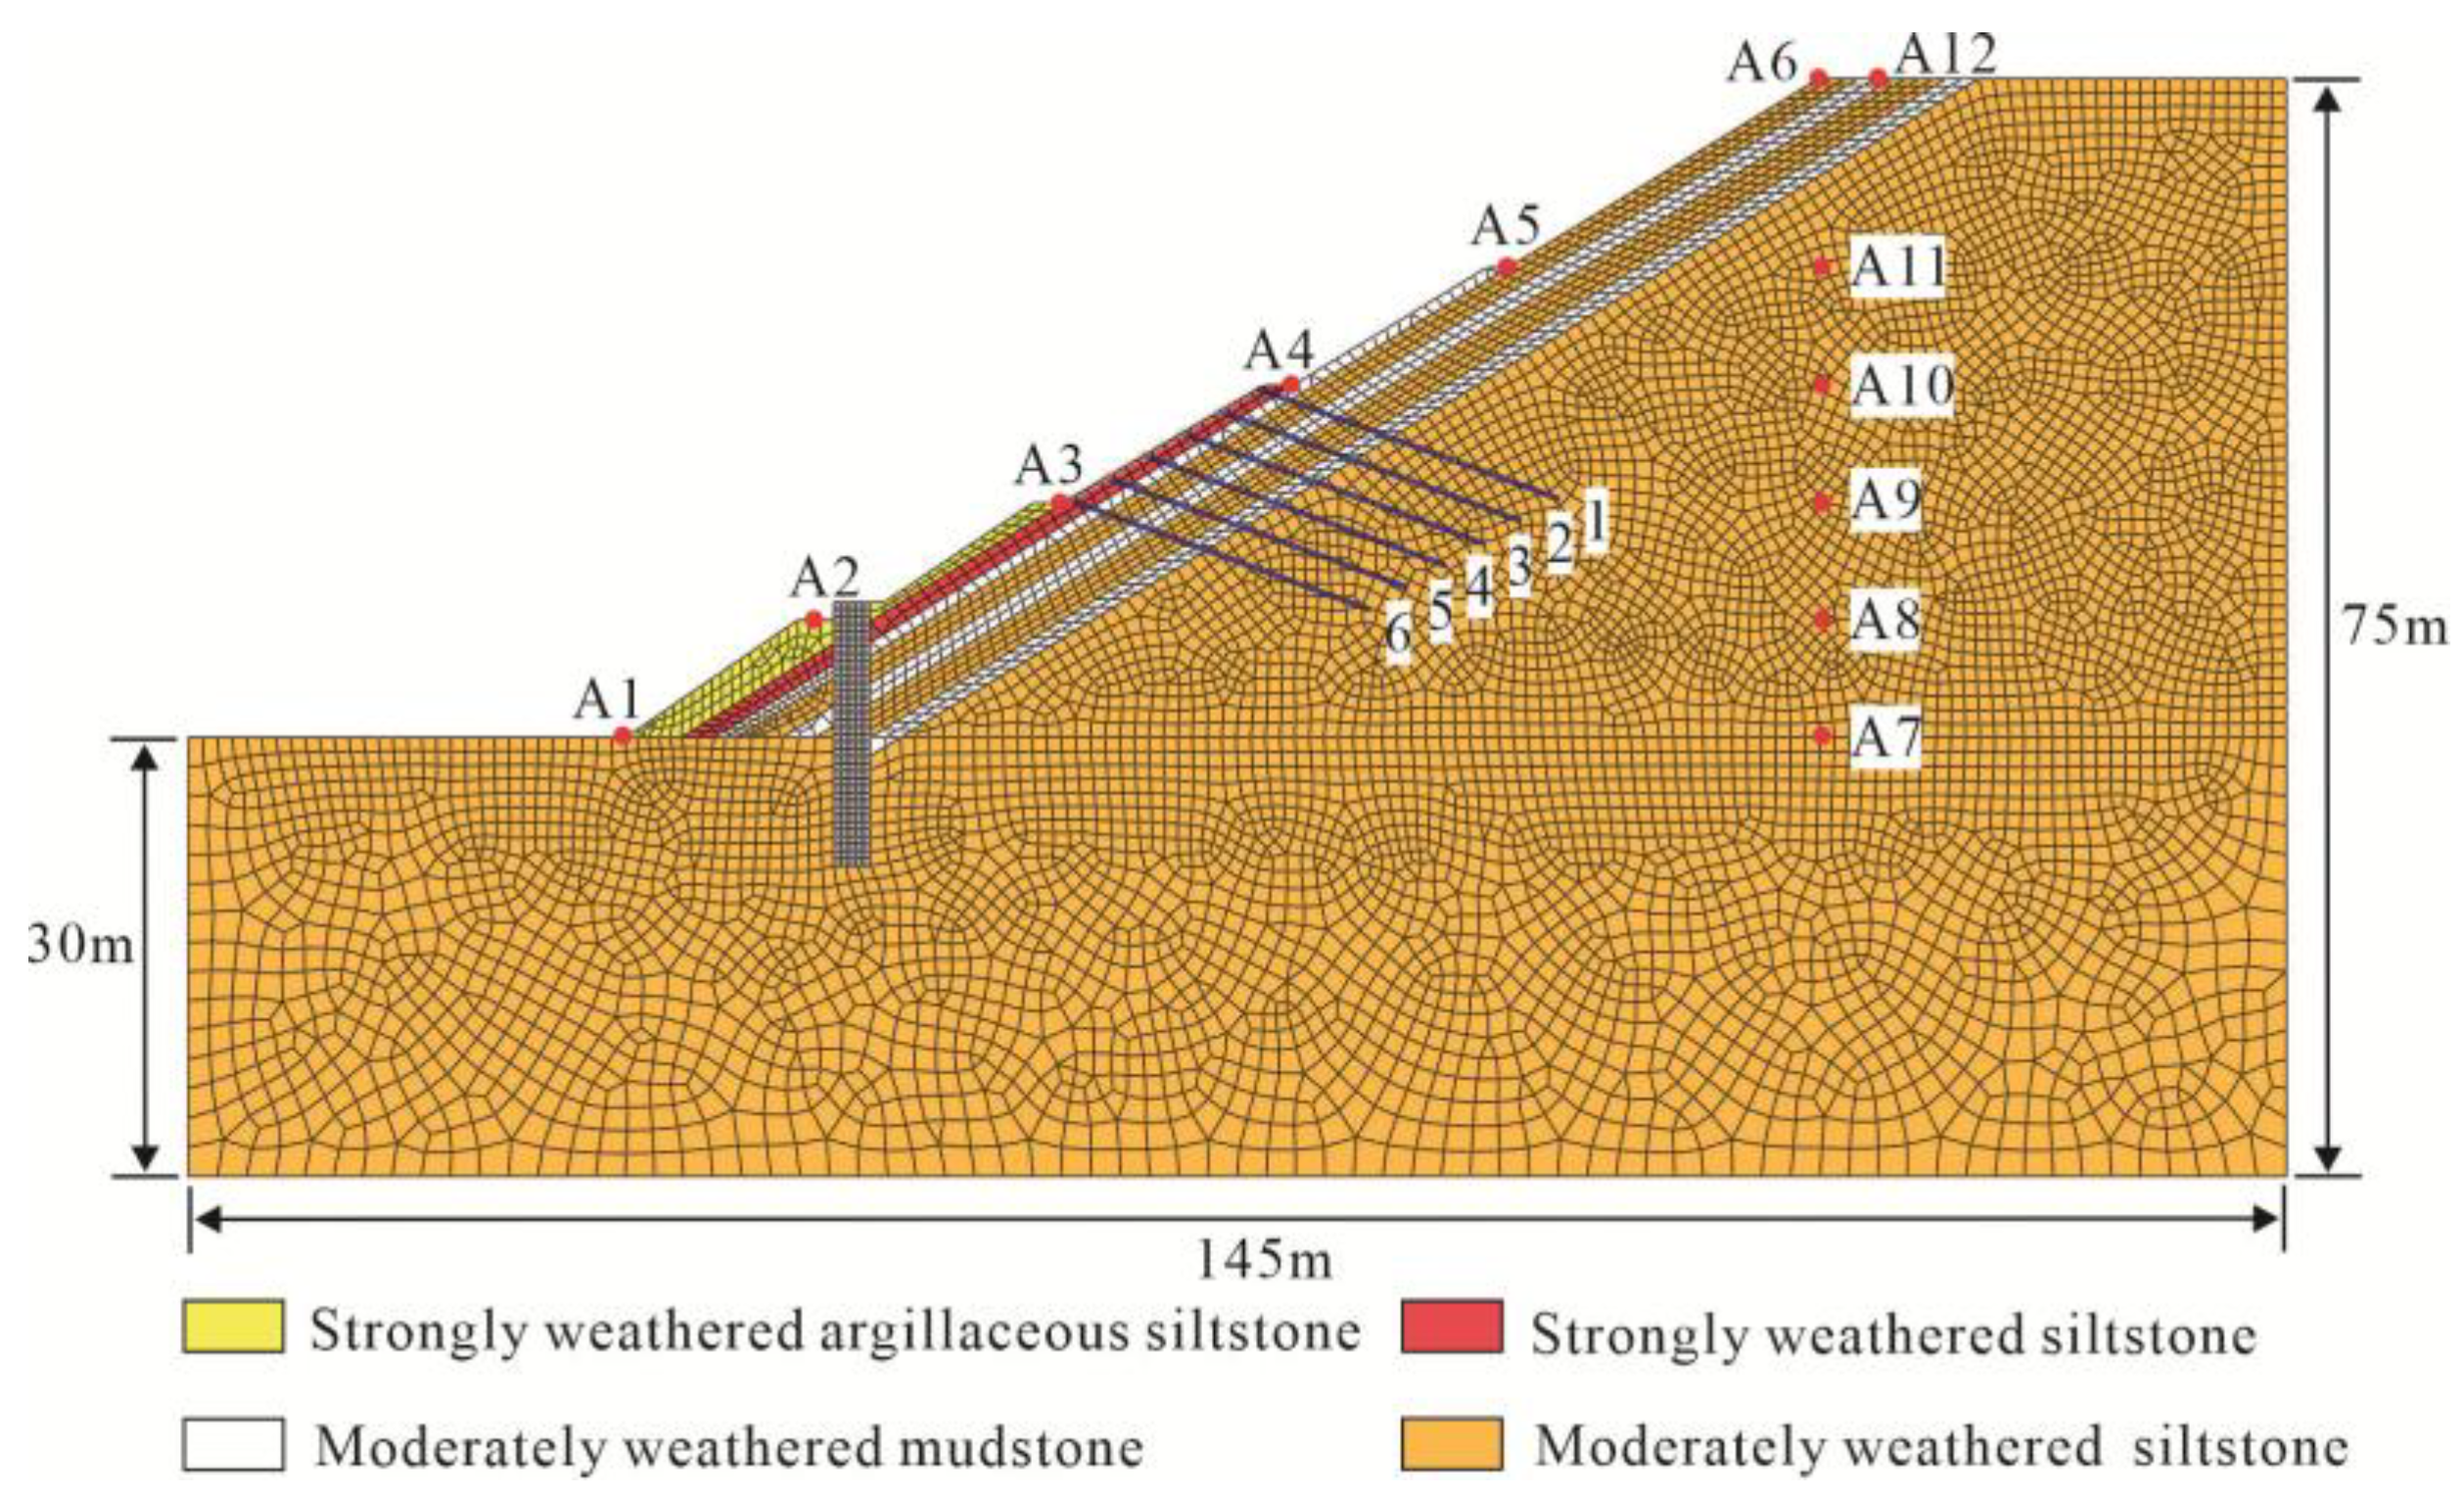
3.1. Model Description

The numerical model is established according to the geological profile (Figure 1c), as shown in Figure 2. The size of the mesh ranges from 0.5 to 5.0 m. The parameters used in the simulations are listed in Table 2. In the model, the Mohr–Coulomb constitutive model is adopted for the rocks. The piles and anchors, which are treated as linear elastic materials, are simulated by the C3D8R solid element and the T3D2 truss element, respectively. The anchor head and the frame beam are connected using a tie constraint, while the anchor cable and the surrounding rock mass are fixed through an embedded region. The friction between the piles and the surrounding rock is not considered. The master–slave contact algorithm is adopted to model interactions between the pile and rocks. In this modeling approach, the pile surface is designated as the master surface, while the contact surface of the rocks is defined as the slave surface. For normal contact behavior, a hard contact model is adopted, which permits separation between the pile and surrounding rocks when tensile forces arise. In the tangential direction, contact mechanics incorporate a penalty function that adheres to Coulomb’s friction law. Consequently, slippage between the pile and surrounding rocks may occur when the shear stress acting on the contact interface surpasses the frictional strength [48]. The prestress of the anchors is implemented using the cooling method [49]. To monitor the dynamic response of the reinforced slope, twelve monitoring points (A1–A12) are strategically positioned within the model (Figure 2).

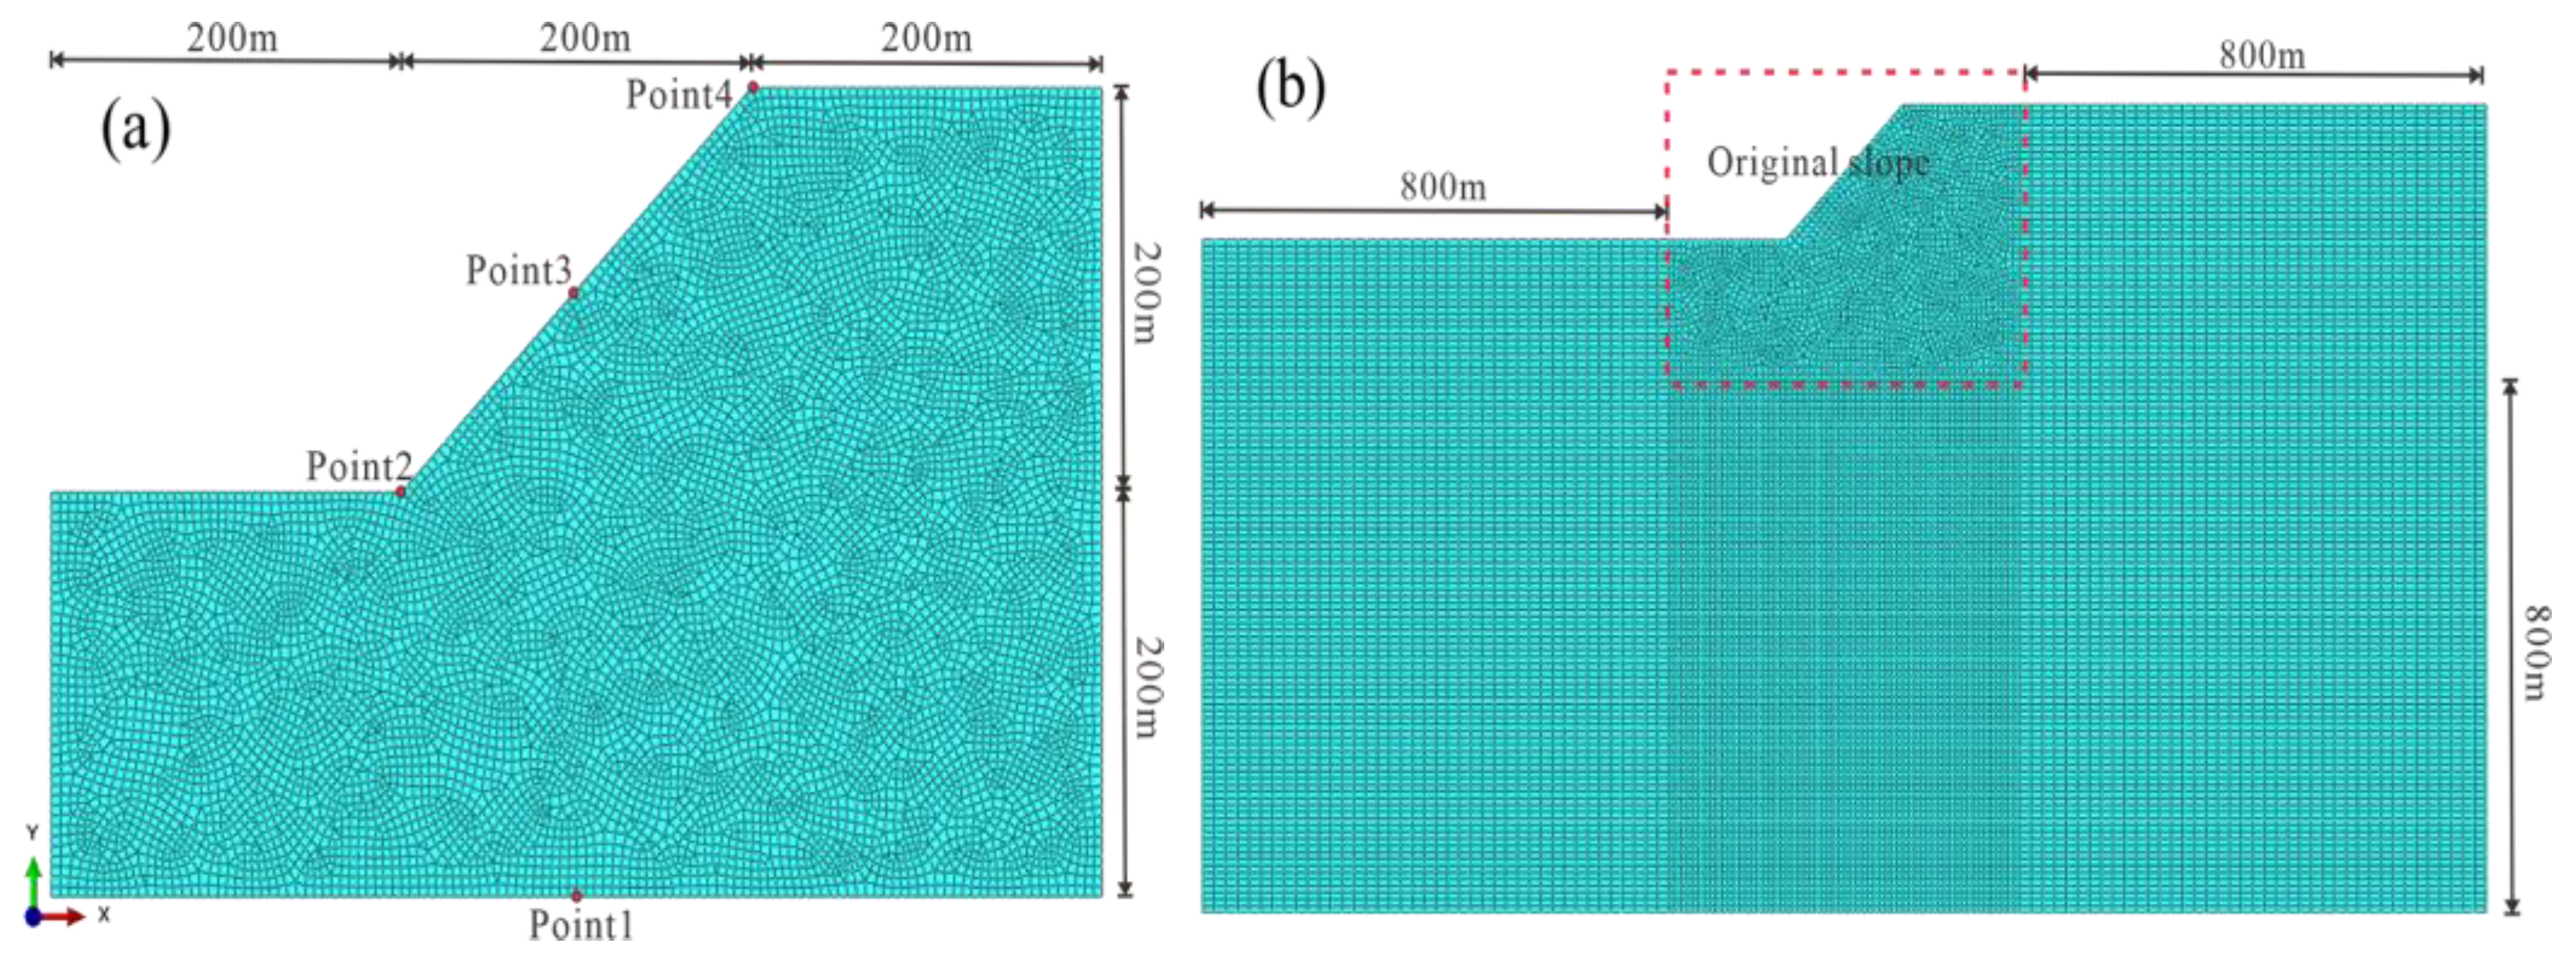
3.2. Boundary Conditions

Viscoelastic artificial boundaries are set for the lateral sides and the base of the model to simulate the propagation of seismic waves. The parameters for the viscoelastic artificial boundary are calculated by [50,51]
K N = α N G R A ,   C N = ρ C p A
K T = α T G R A ,   C T = ρ C s A
where KN and KT are the stiffness coefficients of the normal and tangential springs, respectively; CN and CT are the normal and tangential damping coefficients, respectively; αN and αT are the correction factors; R is the distance between the wave source and the artificial boundary point; ρ is the material density; G is the shear modulus; A is the control area of the boundary element nodes; CP and CS are the compression and shear wave velocities, respectively.
A seismic wave needs to be converted into equivalent loads, and its input is realized by acting concentrated forces on the model boundaries [52]. We adopt the wave field separation method proposed by Du [53] to realize the input of seismic waves. The equivalent nodal load Fli is described as [53]
F l i = ( K l i u l i f + C l i u l i f + σ l i f ) A l
where Al is the control area of the boundary node l; Kli and Cli are the spring and damping coefficients in the i direction, respectively; σ l i f , u l i f , and u l i f are the surface stress, displacement, and velocity of the site reaction at the artificial boundary, respectively.
Based on the wave field separation method, we propose a method for the automatic application of viscoelastic boundaries and input of seismic waves in the finite element software ABAQUS. The MATLAB program is developed, and the effectiveness of the proposed input method is verified in Section 3.3.

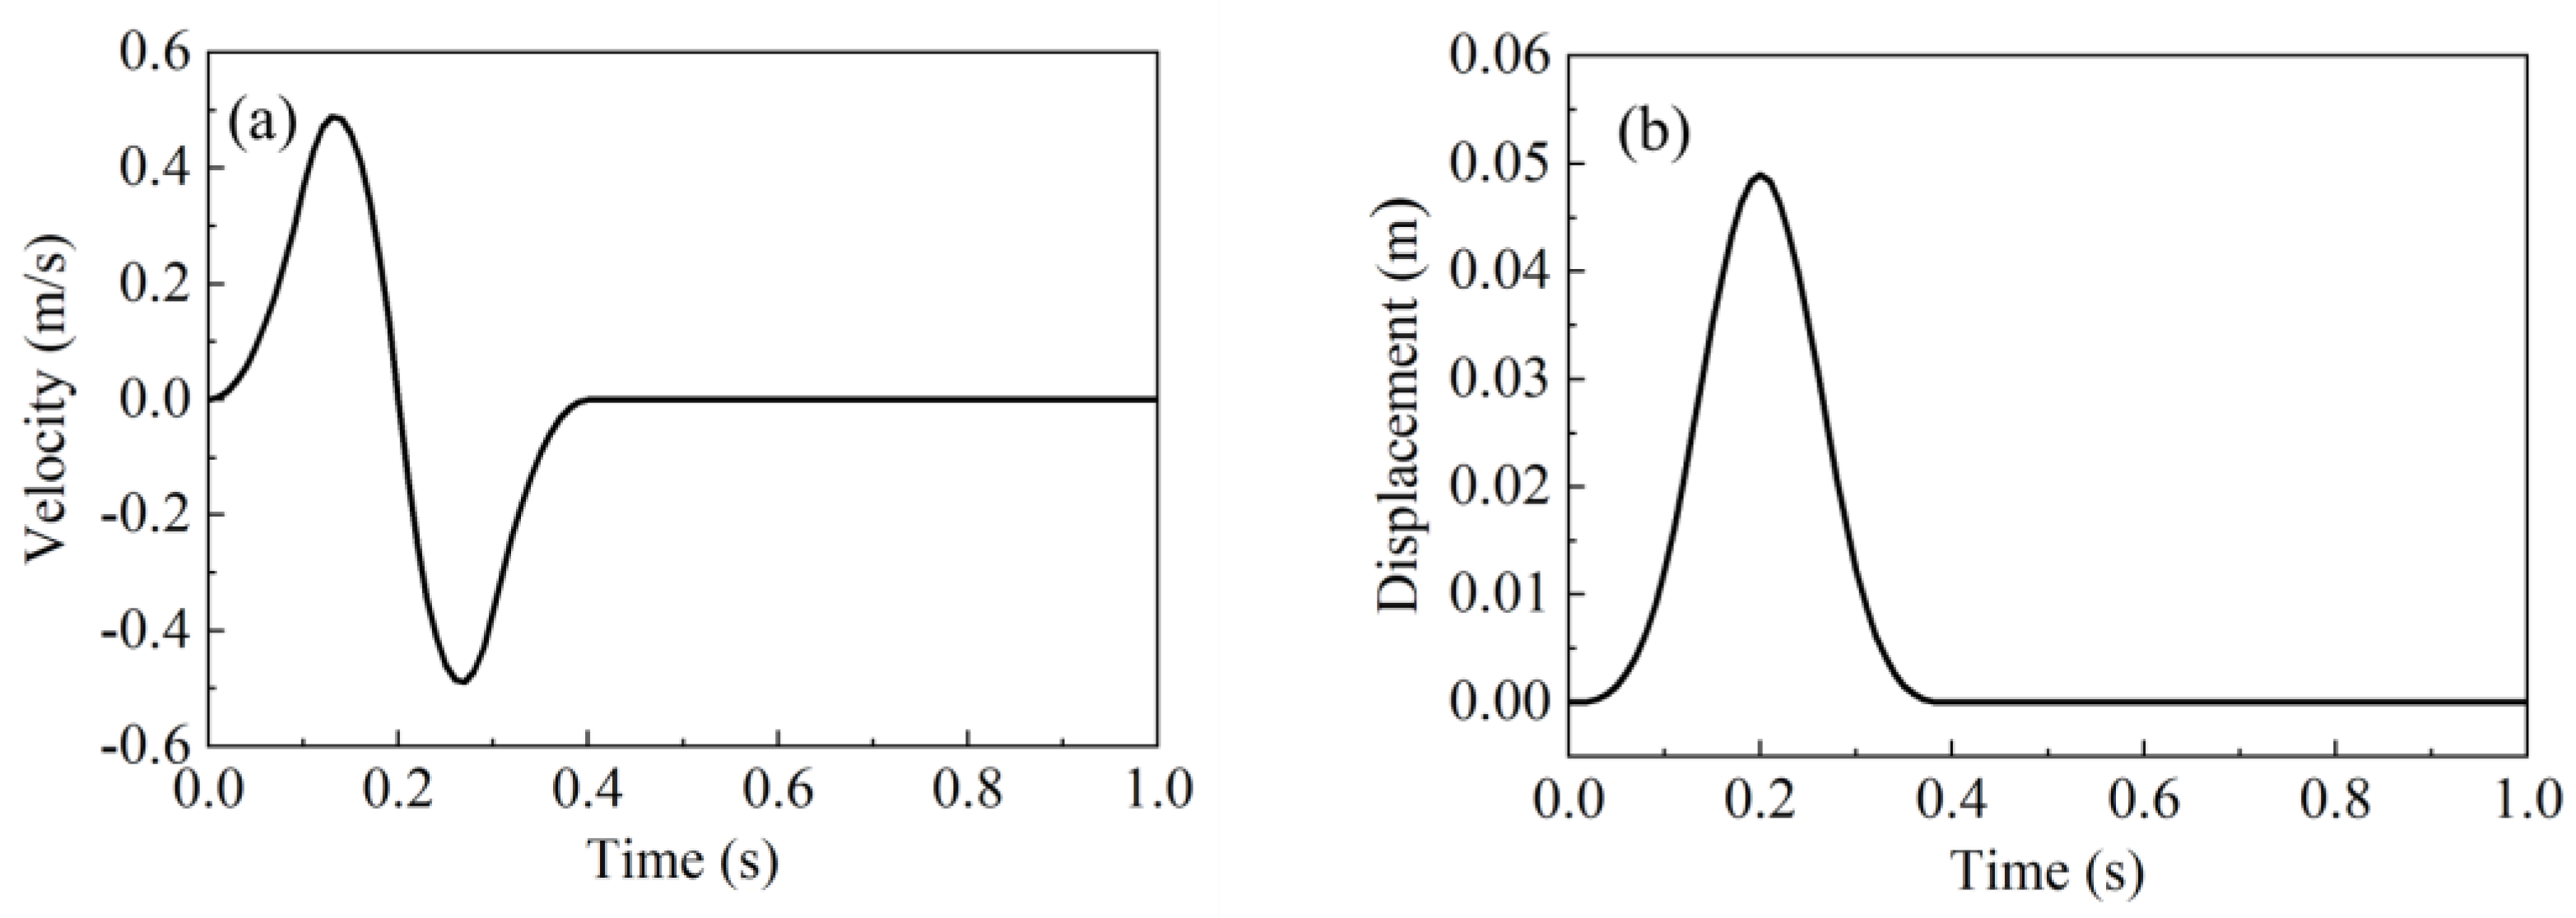
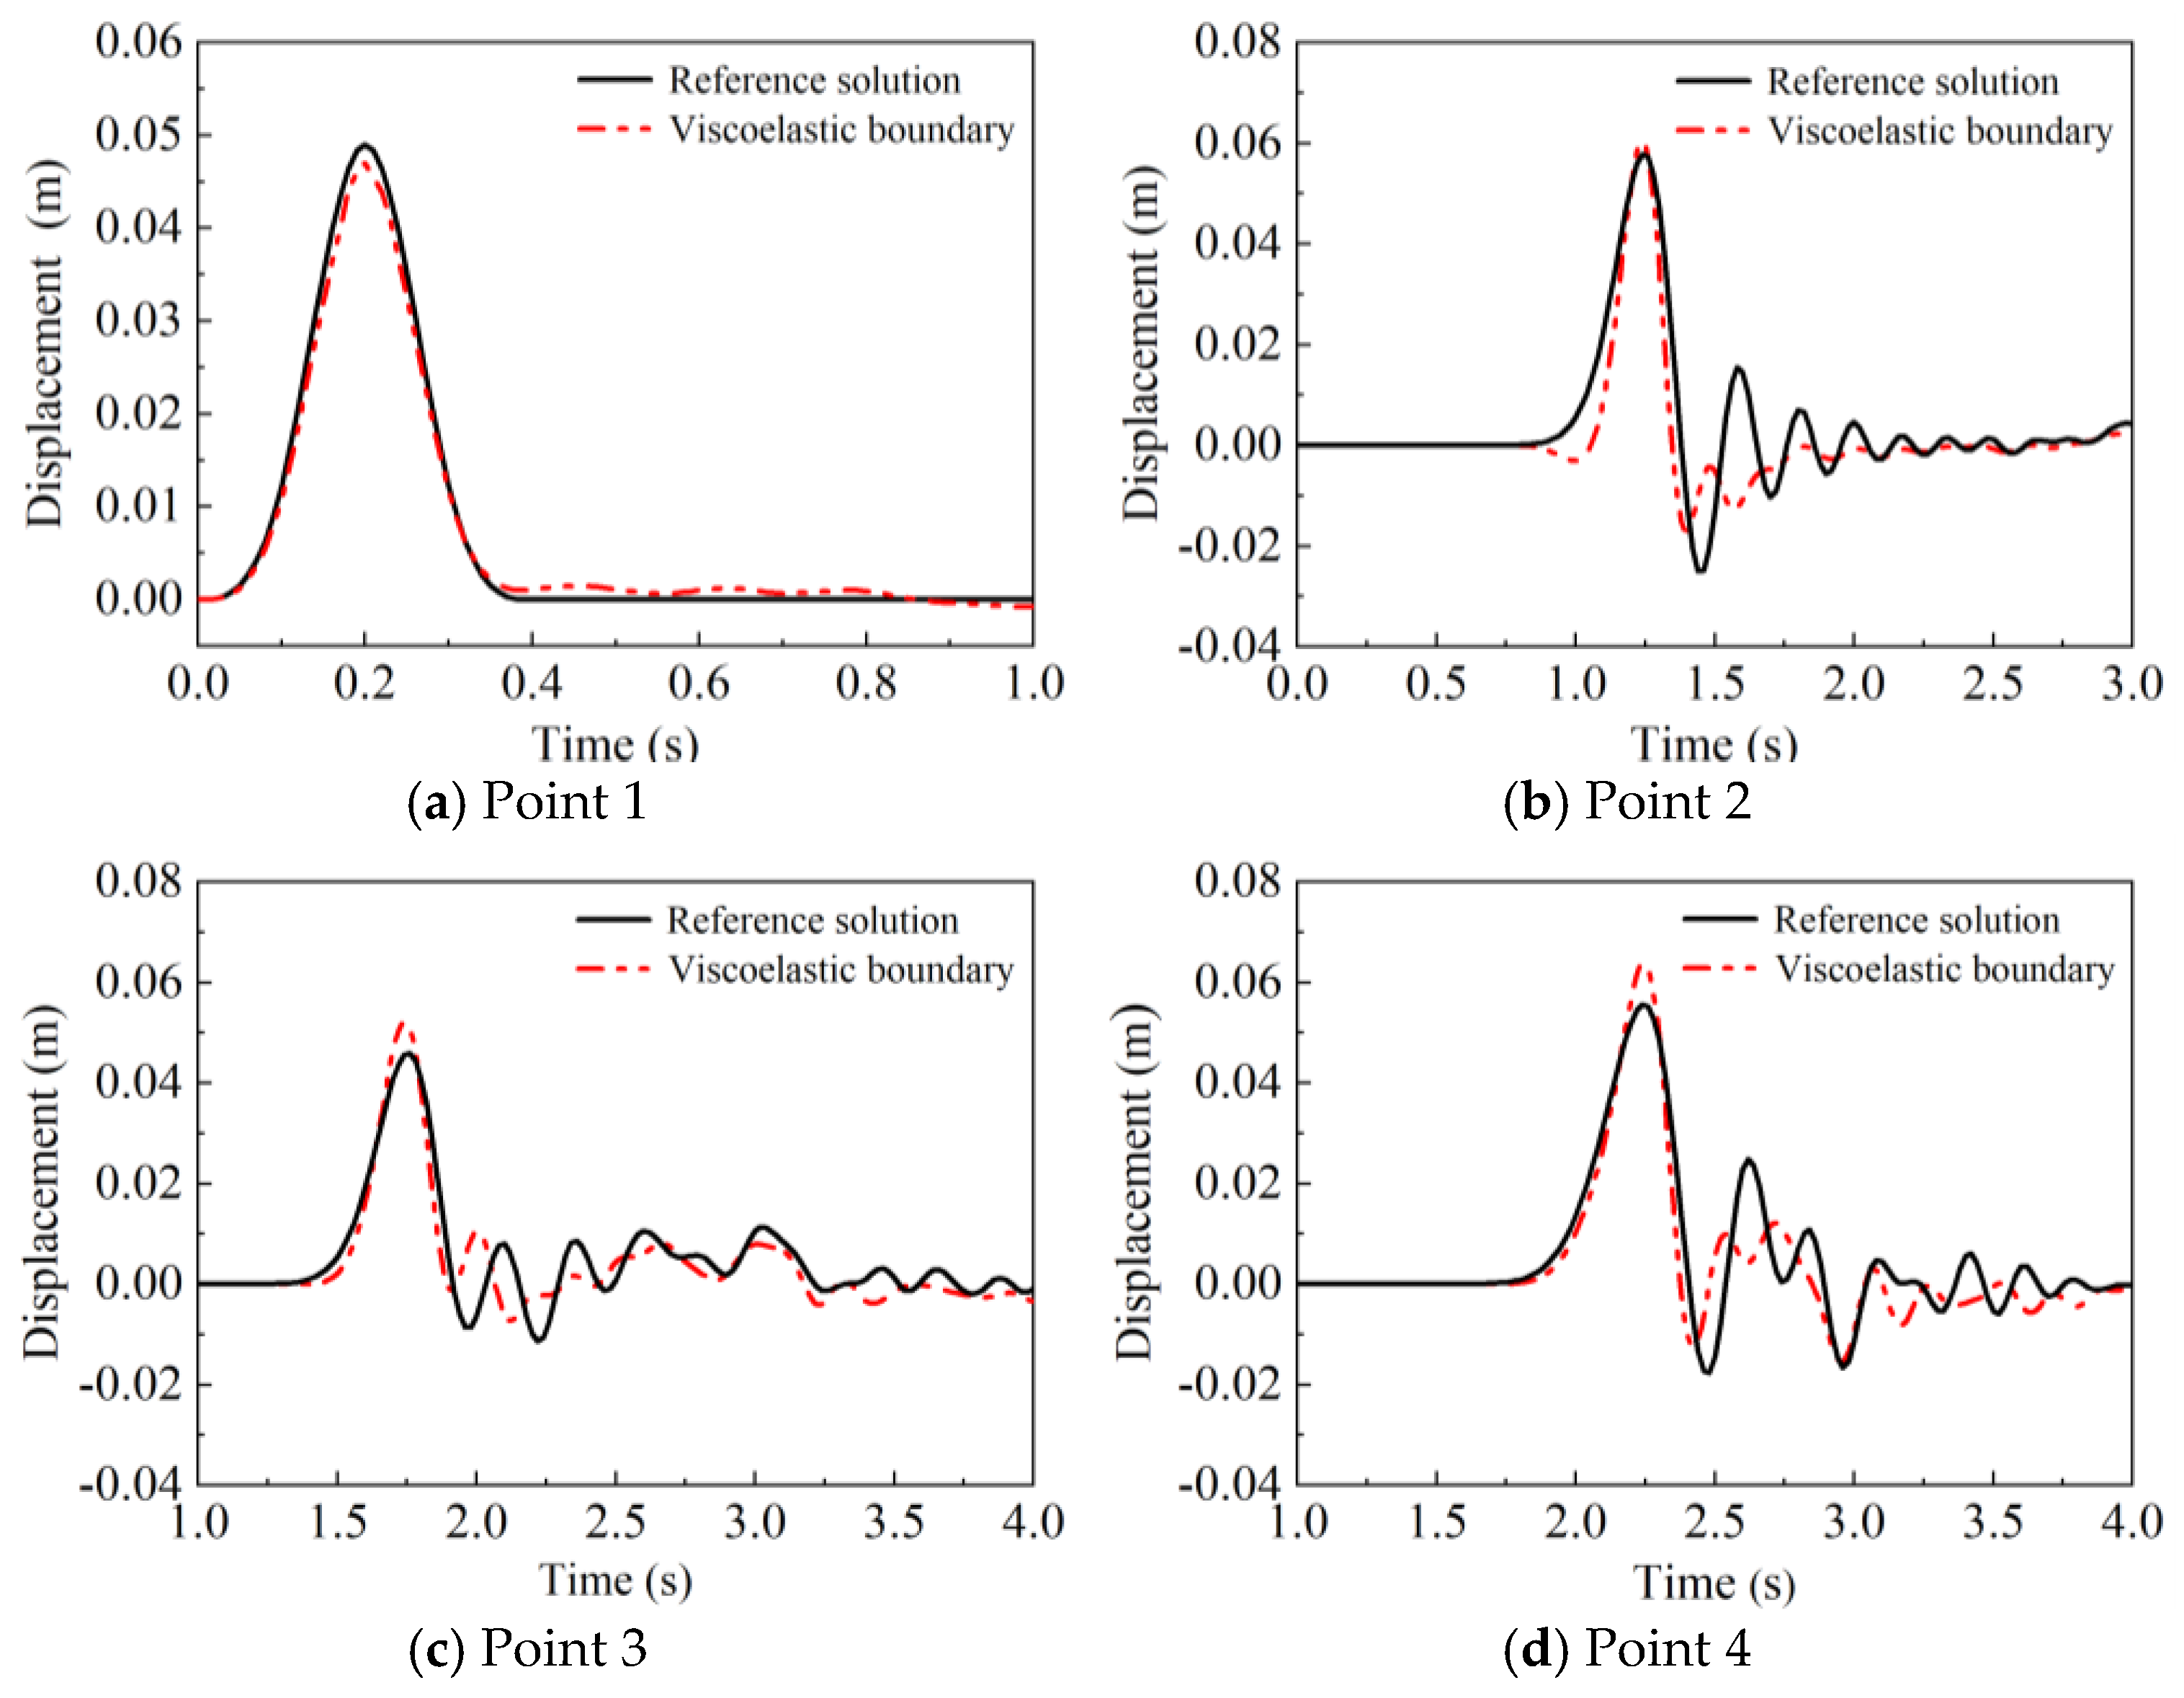
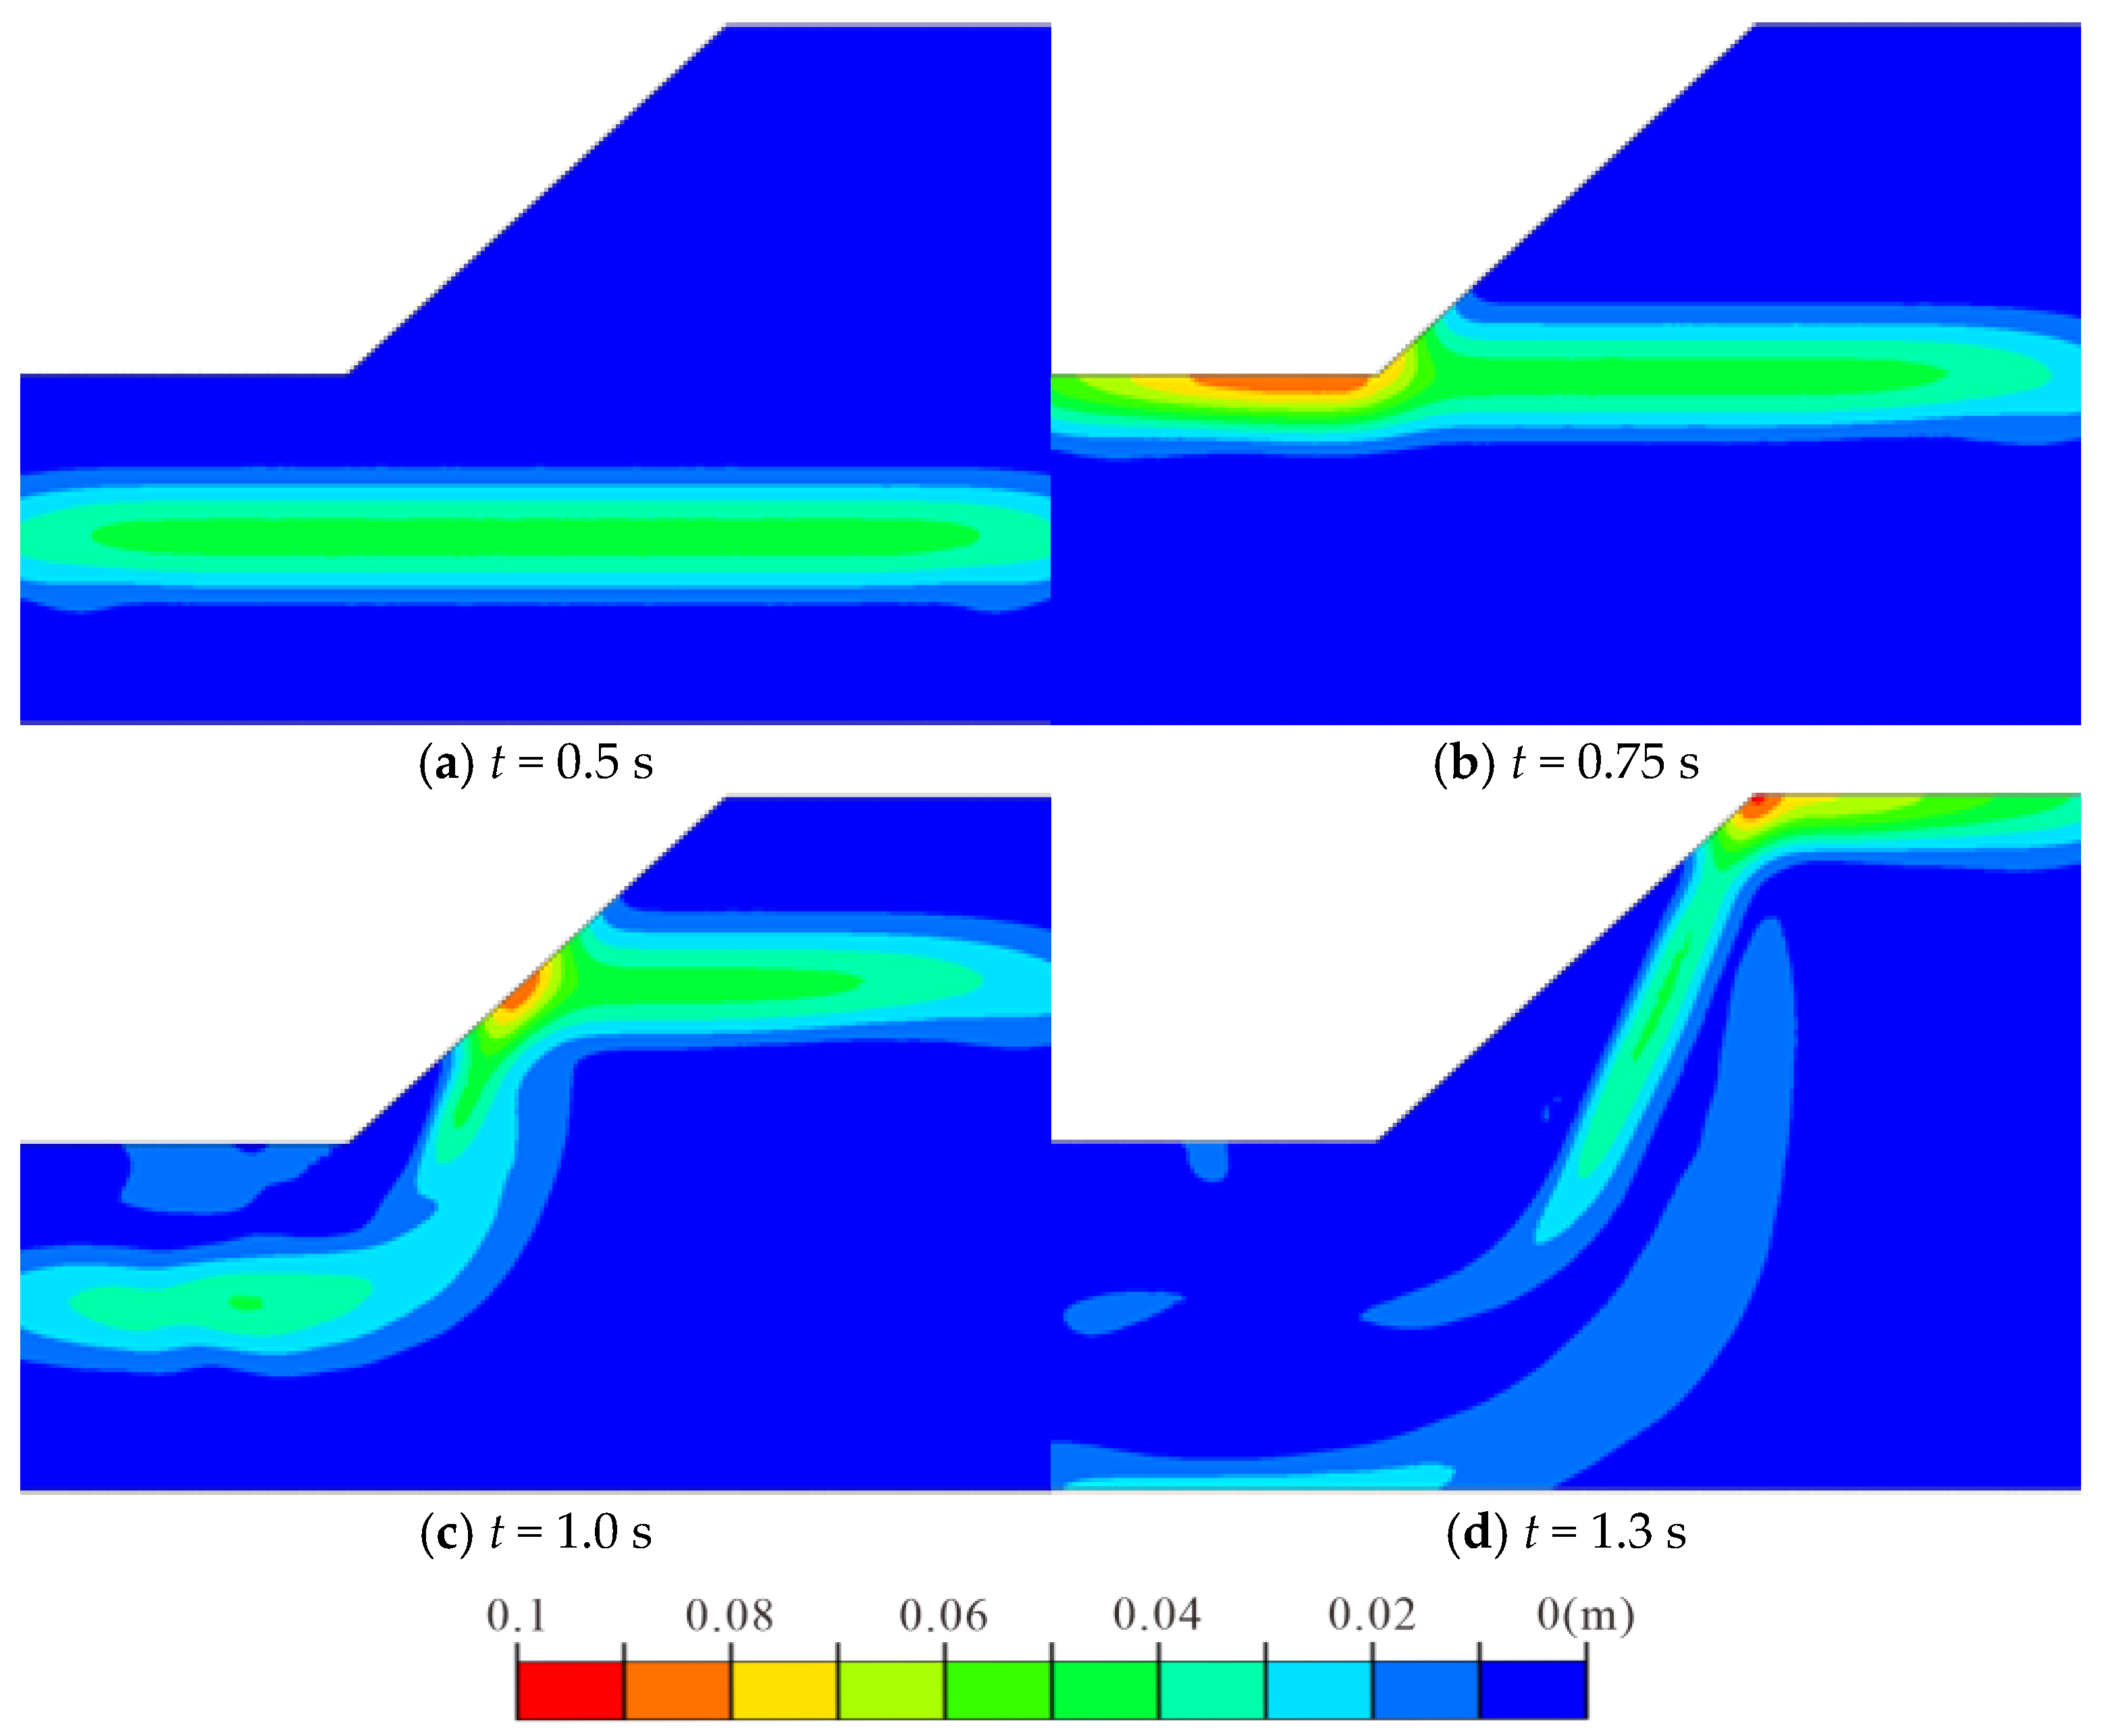
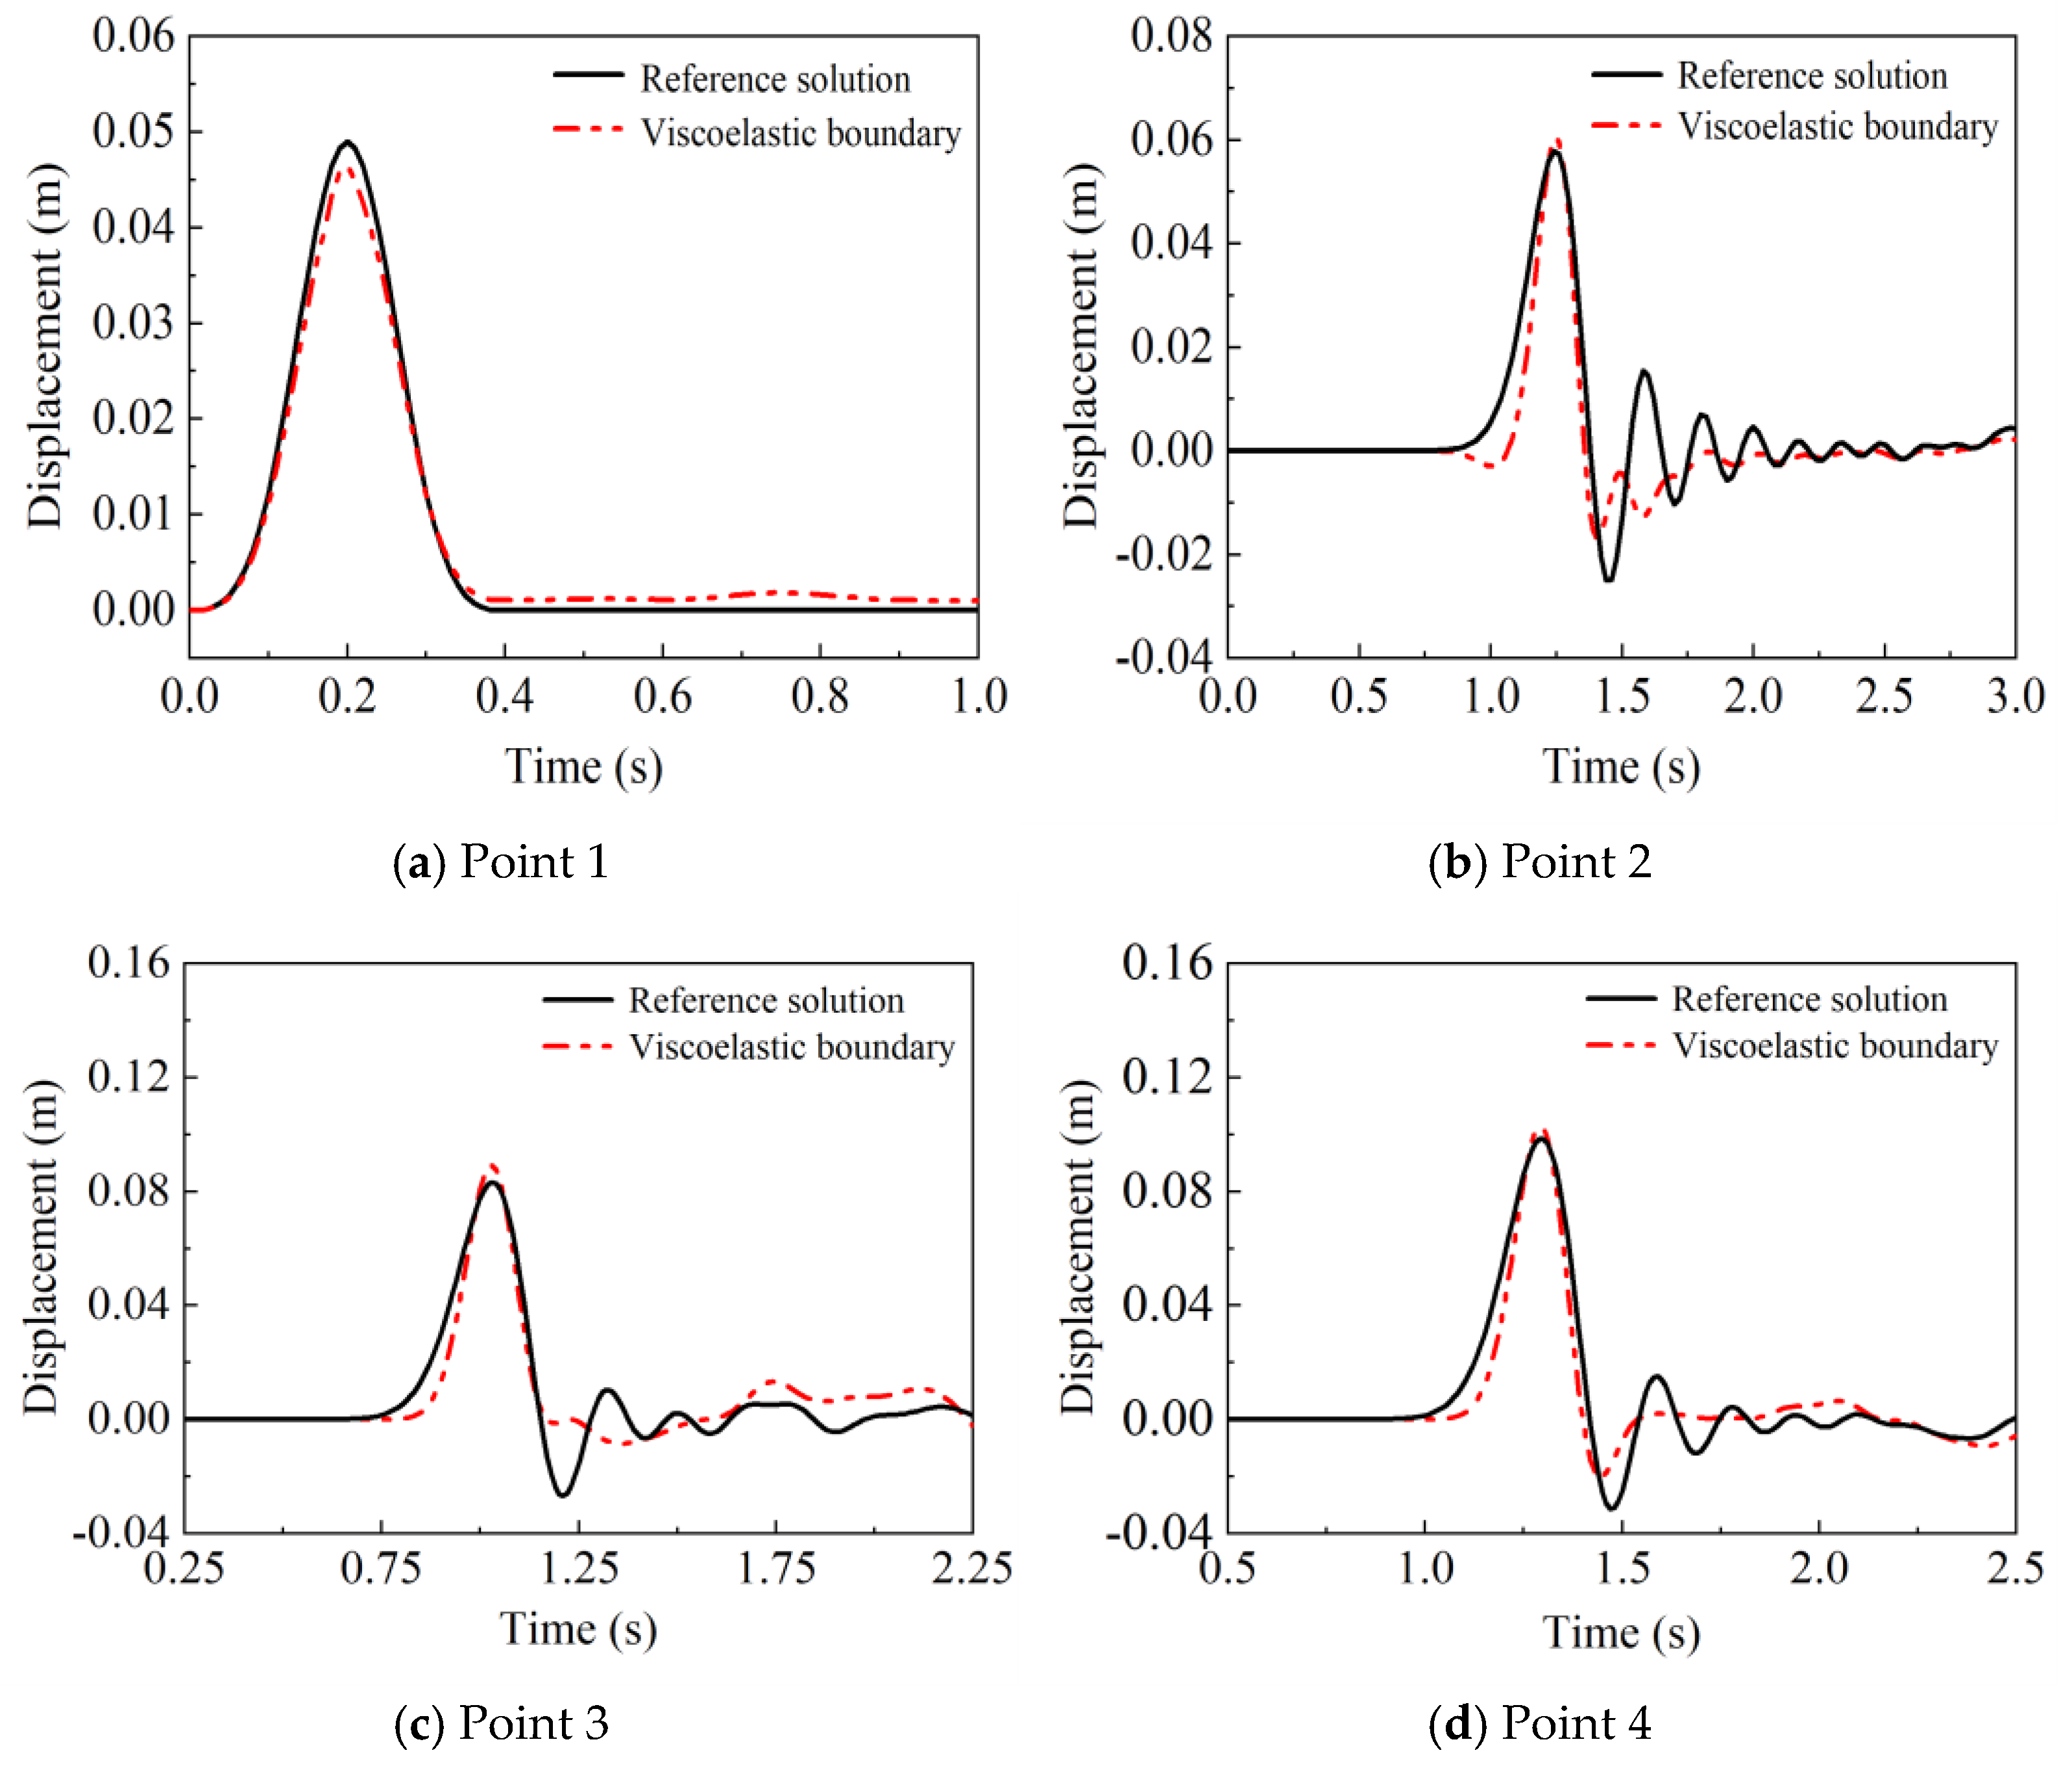
3.3. Verification for the Seismic Wave Input Method

A 2D soil slope model is built to simulate the transmission process of the SV and P waves (Figure 3). The slope spans 200 m in width and 200 m in height, with a slope angle of 45°. The slope soil has a density of 2.0 g/cm3, an elastic modulus of 0.208 GPa, and a Poisson’s ratio of 0.3. Four monitoring points are set (Figure 3a). Seismic wave reflection at the slope boundaries is inevitable, leading to a complex wave field that makes analytical solutions difficult to derive. In this research, an extended model is developed based on the slope model (Figure 3b). The extended model extends 800 m outward from the original slope model, to make sure that the scattered waves caused by reflections at the truncated boundaries cannot reach the monitoring points during the analysis period. We choose the simulation results of wave transmission in the extending model as the benchmark solution. The Dirac pulse is selected as the input wave (Figure 4).
(1)
Validation through an SV wave.
Figure 5 shows how slope displacement changes with time when an SV wave propagates vertically into the slope base. The SV wave enters the slope with a horizontal wavefront (Figure 5a), undergoes reflection at the slope surface (Figure 5b,c), produces reflected waves, and interacts with them (Figure 5d). Figure 6 shows the displacement time history curves monitored in the two models. The displacement response obtained by the wave field separation method agrees well with the benchmark solution for the input of the SV wave, suggesting that the viscoelastic boundary could effectively absorb reflected waves.
(2)
Validation through a P wave
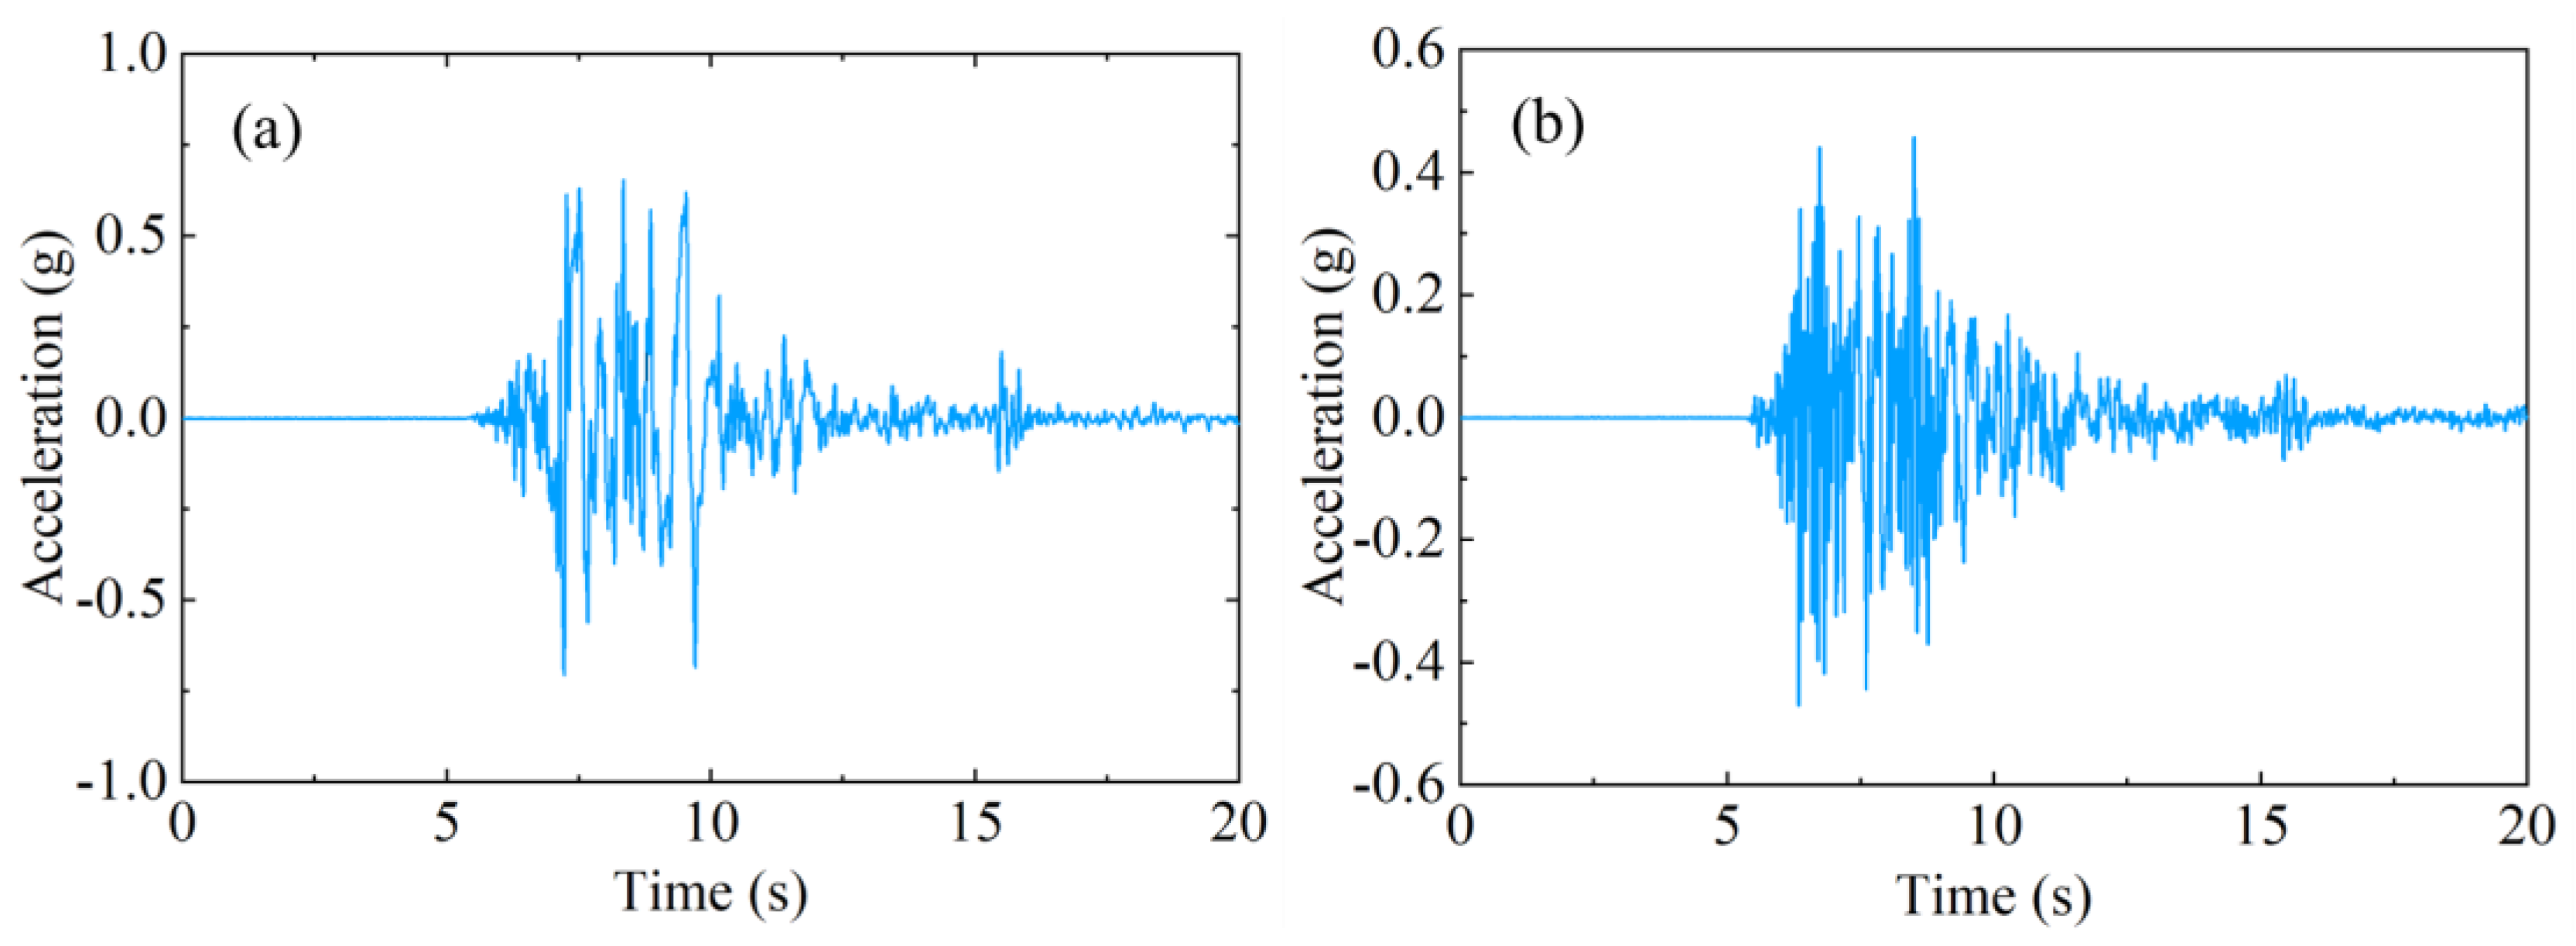
Figure 7 shows the variation in slope displacement versus time after an input of a P wave at the base of the slope. It can be observed that the P wave propagates into the slope with a horizontal wavefront, reflects at the slope surface, and produces reflected P and SV waves. Figure 8 indicates that the displacement response obtained by the wave field separation method also matches well with the benchmark solution for the input of the P wave.

3.4. Input Motions

The slope lies in the vicinity of the earthquake-prone Zhaotong–Ludian fault zone. Since seismic activity has been recorded, this fault zone and its adjacent areas have witnessed a total of 18 earthquakes with magnitudes exceeding 5.0, reflecting the high level of seismic activity in this fault zone. On 3 August 2014, a magnitude 6.1 earthquake (the Ludian earthquake) occurred in Ludian County, Yunnan Province, causing damage of different degrees in 54 townships. Therefore, the north–south (NS) and up–down (UD) ground motions of the Ludian wave recorded in Longtoushan Town during the 2014 Ludian earthquake are chosen as the input motions for the simulations (Figure 9). To explore the effect of excitation directions on the behavior of the reinforced slope, three loading directions are adopted, namely the horizontal direction (x direction), the vertical direction (y direction), and the bidirection (x and y directions). In the simulations, the acceleration amplitudes of the horizontal and vertical motions range from 0.1 to 0.3 g and 0.06 to 0.2 g, respectively, to examine the influence of acceleration amplitudes on the reinforced slope. A total of 12 loading schemes are applied to the model (Table 3). We need to clarify that the amplitudes lower than the recorded PGA (Figure 9) are used; this is because those lower PGAs can ensure the pile and anchor remain elastic during the simulation, facilitating the analysis of the seismic response characteristics within the elastic range.

4. Dynamic Response of the Slope

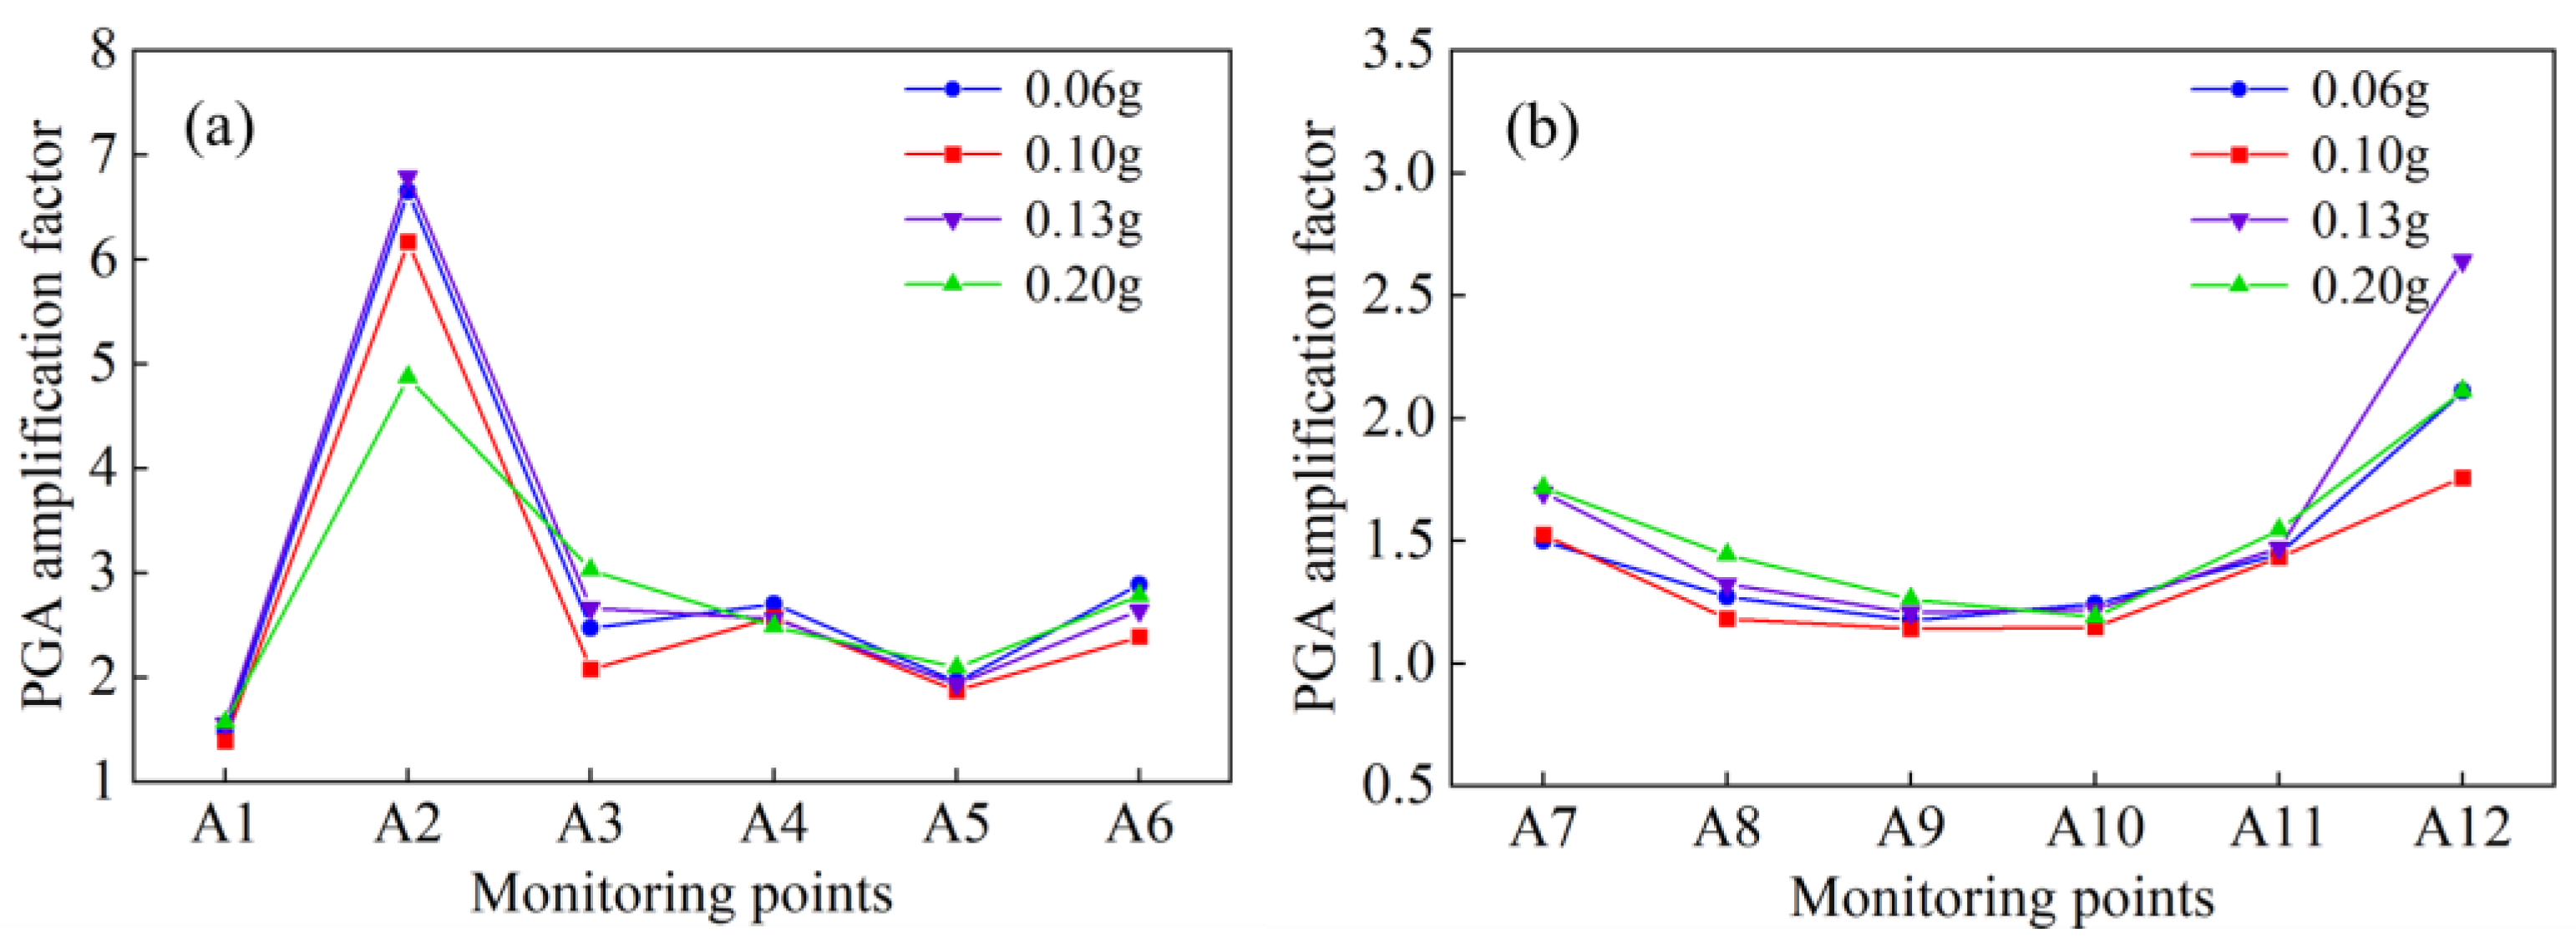
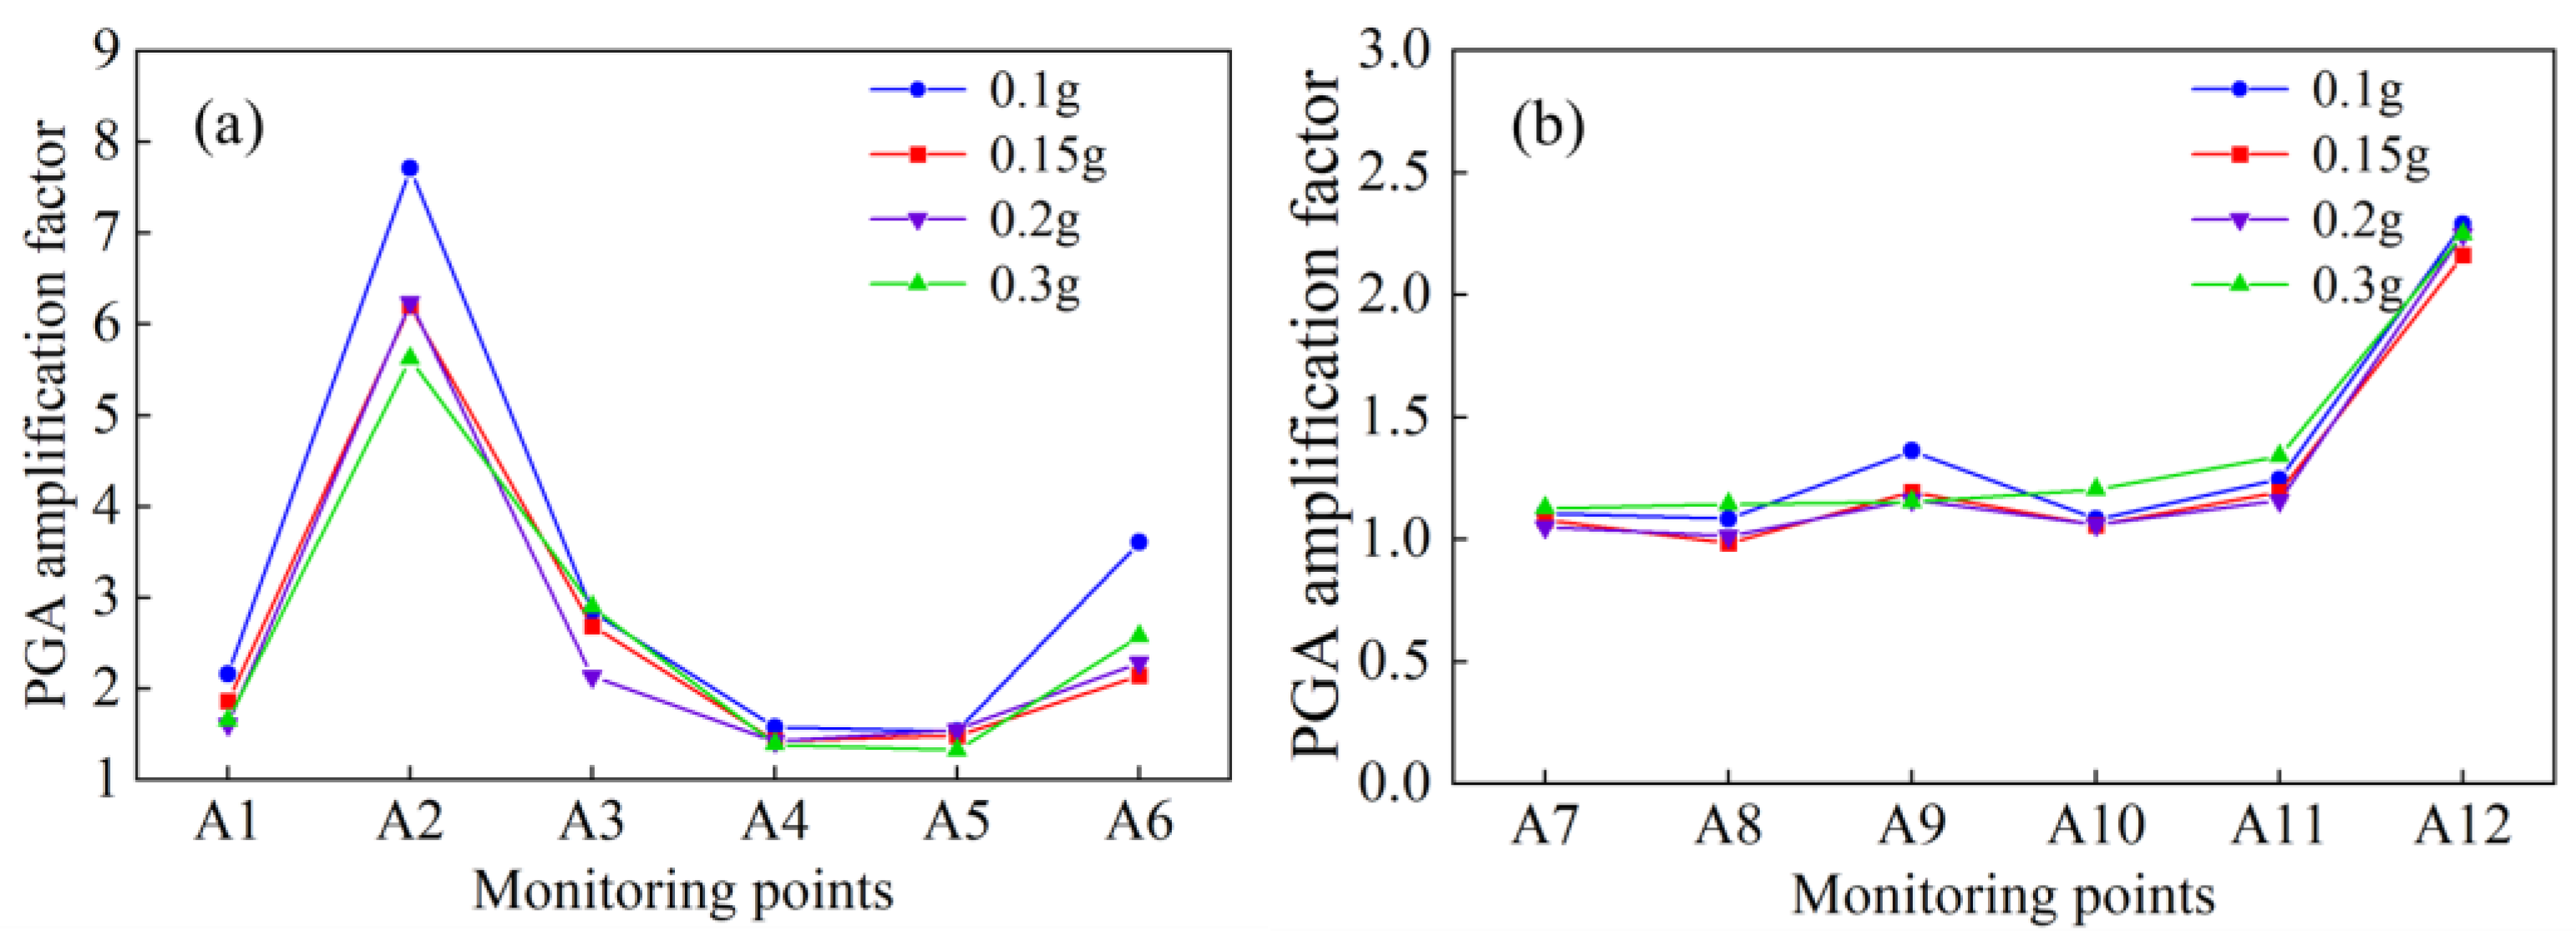
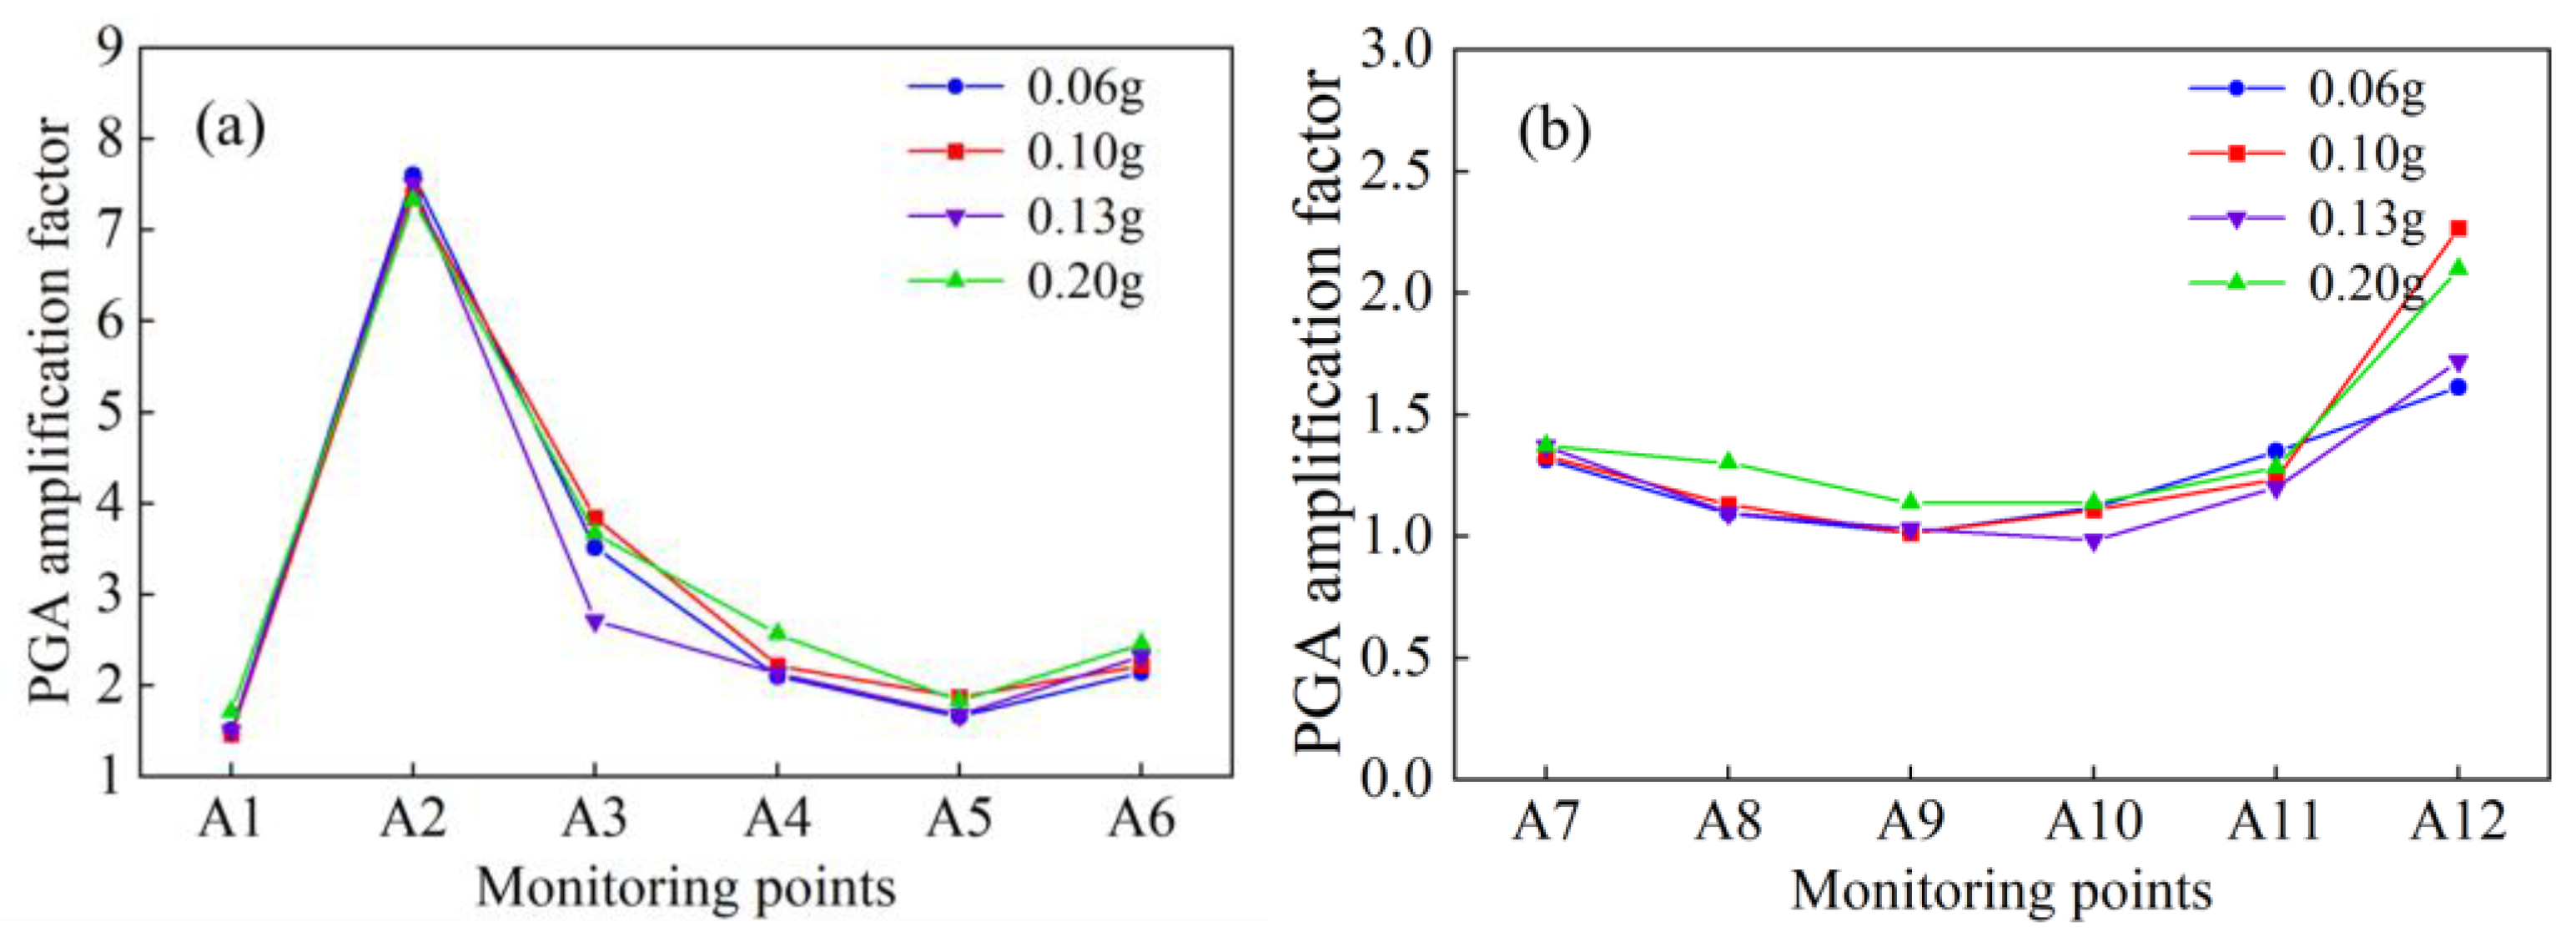
4.1. Acceleration Response

(1)
Horizontal acceleration response
Different acceleration amplitudes of the NS component from the Ludian wave are applied to the model. The peak ground acceleration (PGA) amplification factor, defined as the ratio of the PGA at a monitoring point to that of the input motion, reflects how the slope responds to seismic loading [54,55]. Figure 10 shows the PGA amplification factors for the twelve monitoring points. We can see that the PGA amplification factor, in most cases, decreases with the increasing PGA of the input motions [56]. Affected by the pile–anchor structure, the PGA amplification factors at the reinforced area (A3–A6) are smaller than that at the unreinforced area (A2), suggesting that the pile–anchor structure can reduce the acceleration amplification effect at the slope surface. In addition, the PGA amplification factors at the areas reinforced by the anchors (A4 and A5) display a significant decrease, indicating that the anchors, acting as active support structures, perform well in stabilizing slopes. Figure 10b indicates that the acceleration amplitudes of the input motions nearly have no influence on the PGA amplification factor. The PGAs in the middle of the slope, in general, exhibit a nonlinear elevation amplification effect. An especially sharp increase in the PGA factor occurs at the slope crest (A12). The PGA amplification factors at the slope surface are greater than those in the middle of the slope with the same elevation, which is because the bedding planes of the rocks near the slope surface enhance the reflections of seismic waves. This highlights the adverse effect of weak planes in rocks on the dynamic stability of slopes, to which can be attributed not only the low strength of the weak planes but also their amplification effect on the PGAs.
(2)
Vertical acceleration response
The model is subjected to the UD component of the Ludian wave with varying acceleration amplitudes. As illustrated in Figure 11, the distribution patterns of the PGA amplification factor under vertical seismic loadings are similar to those under horizontal seismic loadings. The PGA amplification factors in the reinforced area (A3–A6) are lower than that in the unreinforced area (A2), suggesting that the pile–anchor structure can also mitigate the impact of vertical seismic shaking. In comparison with horizontal seismic loadings, the PGA amplification factors are higher under vertical seismic loadings.
(3)
Horizonal and vertical acceleration response
Four bidirectional loading schemes, i.e., (1) x-0.10 g and y-0.06 g, (2) x-0.15 g and y-0.10 g, (3) x-0.20 g and y-0.13 g, and (4) x-0.30 g and y-0.20 g, are adopted in the simulations to investigate the influence of horizonal and vertical seismic loadings on the slope. Figure 12 and Figure 13 show the PGA amplification factors at the slope surface and inside the slope for the bidirectional loading schemes. The distribution patterns of the PGA amplification factors are basically the same as those under unidirectional (horizonal or vertical) loadings. However, the bidirectional loadings yield larger values of the PGA amplification factors, compared with the unidirectional loading, which is attributed to the superposition of the seismic waves in different directions. This highlights the necessary of considering the complex effect of various reflections of seismic waves in the design of slopes.

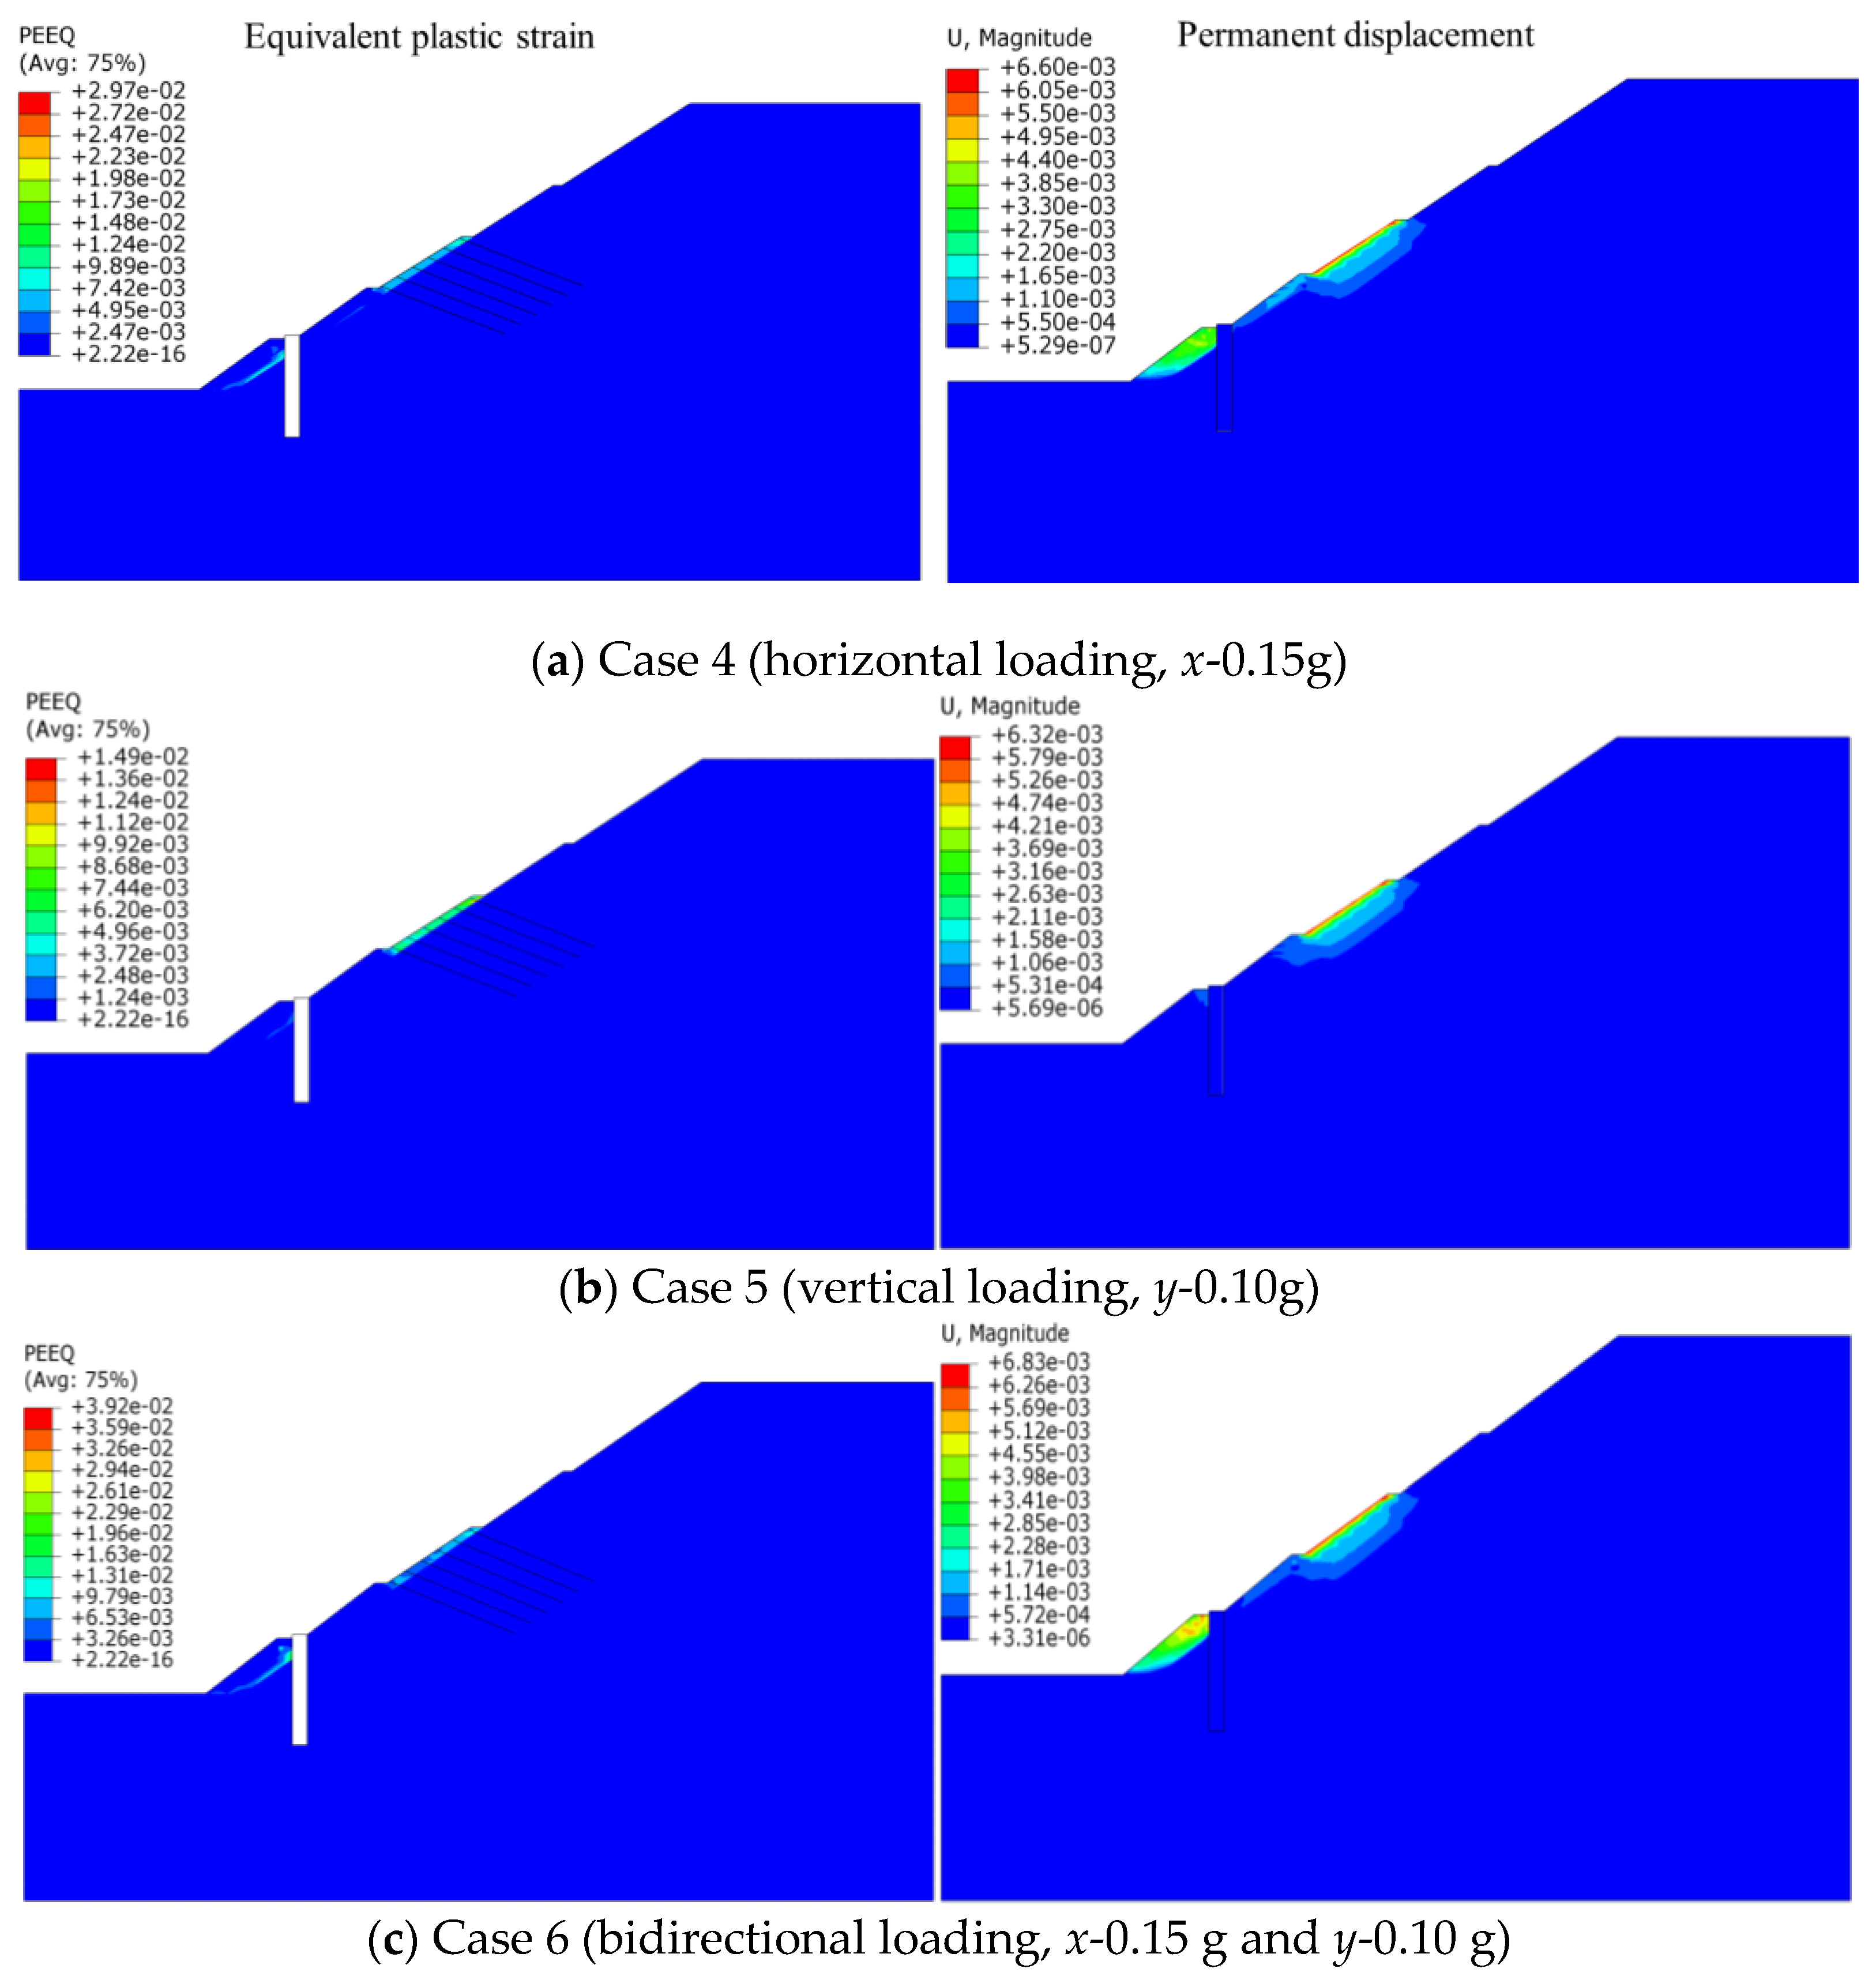
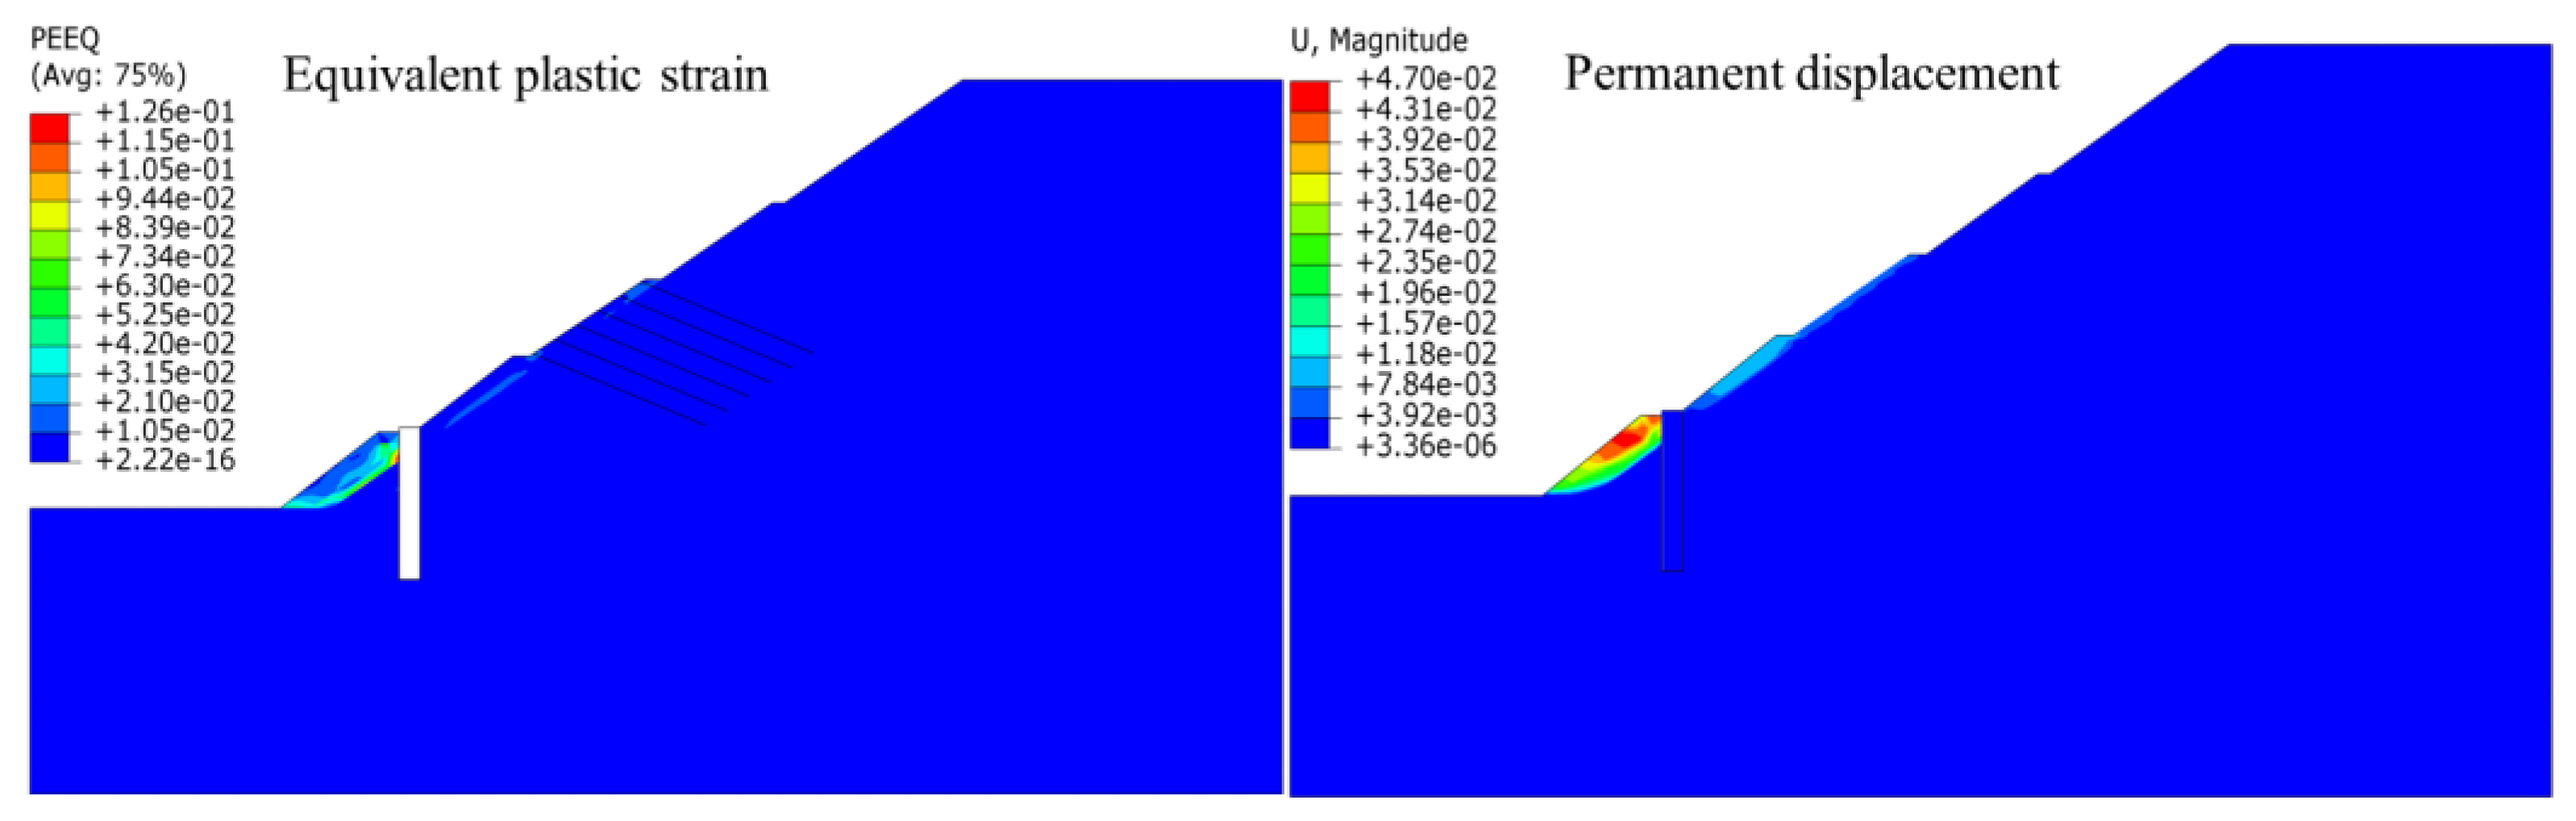
4.2. Deformation Behavior

The equivalent plastic strain represents the cumulative plastic strains throughout the entire loading process, which can reflect the cumulative effect of seismic loadings [57]. The permanent displacement can quantify the degree of damage and is a critical indicator for the seismic design of slopes in seismic-prone regions. Here, we present the simulation results for three cases (cases 4, 5, and 6 in Table 3) as examples to demonstrate the influence of excitation directions on slope response. The equivalent plastic strain and the permanent displacement of the slope for the three cases are shown in Figure 14. Note that the plastic strain and displacement in the anchor-reinforced area occur immediately when the prestress of the anchors is applied and almost remain constant during the seismic loadings; thus, they are caused by the prestress of the anchors rather than by the seismic loadings. It seems that the dynamic behaviors of the slope in different cases are similar, with the plastic strain and displacement mainly concentrating in the unreinforced area in front of the piles. The maximum displacements of the slope in the three cases are all less than 7 mm. Especially, no obvious plastic strain and displacement occur in the pile–anchor-reinforced area, demonstrating the effective performance of the pile–anchor structure in stabilizing the slope.
Figure 15 presents the simulation results under the bidirectional loading (x-0.30 g and y-0.20 g) to illustrate the impact of a severe earthquake on slope stability. It can be observed that under intense seismic shaking, the potential failure mode of the reinforced rock slope is characterized by localized failure in the unreinforced area, rather than large-scale overall sliding along weak bedding planes. The results indicate that the pile–anchor structure can reduce permanent displacement and improve slope stability during strong earthquakes.

5. Dynamic Response of the Pile–Anchor Structures

5.1. Dynamic Response of Anchors

In this section, the simulation results for the dynamic behavior of anchors in three cases (cases 10, 11, and 12 in Table 3) are presented as examples to show the influence of strong earthquakes. Figure 16 displays the time history curves of the axial force for anchor 1 (Figure 3a) in different loading cases. The variation in the anchor’s axial force over time generally aligns with the time history of the input seismic wave (Figure 4a). For instance, the maximum axial force in the anchor under horizontal loading with a 0.3 g acceleration amplitude (case 10) reaches 473 kN, nearly matching the value under bidirectional loading (case 12, x-0.30 g and y-0.20 g). By contrast, the maximum axial force under vertical loading (case 11, y-0.20 g) is lower than in other cases. This indicates that horizontal excitations have a more dominant influence on changes in the anchors’ axial force.
Figure 17 illustrates the maximum axial force of the anchors under horizontal seismic loadings with varying acceleration amplitudes. The maximum axial force of the anchors rises as the acceleration amplitude of the input motions increases. In general, the values of the upper and lower rows are greater than those of the middle rows. For example, under an acceleration amplitude of 0.1 g, the maximum axial forces of the anchors with numbers ranging from 1 to 6 are 466, 462, 461, 460, 461, and 463 kN, respectively. Specifically, the first row of anchors yields the largest axial force during the earthquakes, followed by the second row and the seventh row. Thus, during the reinforcement design, particular focus should be placed on the upper and lower rows of anchors to prevent their damage.
In the two-dimensional model, the representation of anchor effects is based on the plane strain assumption, which neglects stress gradient variations along the depth direction and assumes uniform force distribution of anchors in the out-of-plane direction. While this simplification can effectively capture the primary mechanical behavior of anchors within the plane, it underestimates the actual three-dimensional stress gradients along the anchor length and their influence on the distribution of anchoring forces—a fundamental limitation inherent to two-dimensional modeling approaches.

5.2. Dynamic Response of Piles

Figure 18 displays the time history curves of the earth pressure behind the pile when a bidirectional loading (case 6, x-0.15 g and y-0.10 g) is applied. The change trend of the earth pressure along the pile at different elevations is basically the same, which also agrees with the input horizontal ground motions.
Figure 19 shows the distributions of the peak values of the earth pressure along the pile under bidirectional loadings with different acceleration amplitudes. The distribution patterns of the peak earth pressure values are comparable across different cases. Additionally, the peak earth pressure increases as the acceleration amplitudes of the input motions rise. For a soil slope, the peak values of the earth pressure are deemed to increase from the top to the bottom of a pile [5]. Our results show that the peak values of the earth pressure increase from 2 m to 4 m below the top of the pile, then decrease to extreme values at the buried depth of 8 m, and finally increase to the maximum at the bottom of the pile. We can see that the distribution of the peak values of the earth pressure present significant change at the buried depth of 8 m. This is because the area above this depth is an interlayer of mudstone and siltstone, whereas the area below this depth is stable bedrock. The portion of slope above the bedrock deforms toward the outside of the slope, which reduces the earth pressure behind the pile.
The shear force and bending moment of the pile under different seismic loadings are calculated (Figure 20). The shear force of the pile has extreme values near the mudstone layers (layers 2 and 3). When the acceleration amplitudes of the seismic waves increase from 0.2 to 0.3 g, the shear force of the pile rises significantly; and the first extreme value of the shear force occurs in the mudstone layer 1, indicating that a potential sliding surface exists in this layer under the strong motions. The bending moment of the pile displays multiple extreme points in the mudstone layers 2 and 3, among which the maximum bending moment appears below the mudstone layer 3. The maximum bending moment of the pile increases from 0.55 × 10³ to 0.90 × 10³ kN·m as the acceleration amplitudes of the seismic waves increase from 0.2 to 0.3 g, indicating that the pile plays a critical role in bearing the load induced by slope displacement.

6. Conclusions

In this research, the dynamic response of a bedding rock slope reinforced by a pile–anchor structure in Ludian County, Yunnan Province, China, is simulated using the finite element method. We propose a method for the automatic application of viscoelastic boundaries and the input of seismic waves in the finite element software ABAQUS based on MATLAB programming. The method is validated through the input of a P wave and an S wave in a slope model. A series of numerical simulations were performed on pile–anchor-reinforced slopes under seismic motions with different acceleration amplitudes and excitation directions. The main conclusions are as follows:
(1)
The PGA amplification factors at the slope surface are greater than those in the middle of the slope, primarily due to seismic wave reflections caused by bedding planes near the surface. Additionally, PGA amplification factors in the reinforced area are lower than those in the unreinforced area, demonstrating that the pile–anchor structure can mitigate the impact of seismic shaking.
(2)
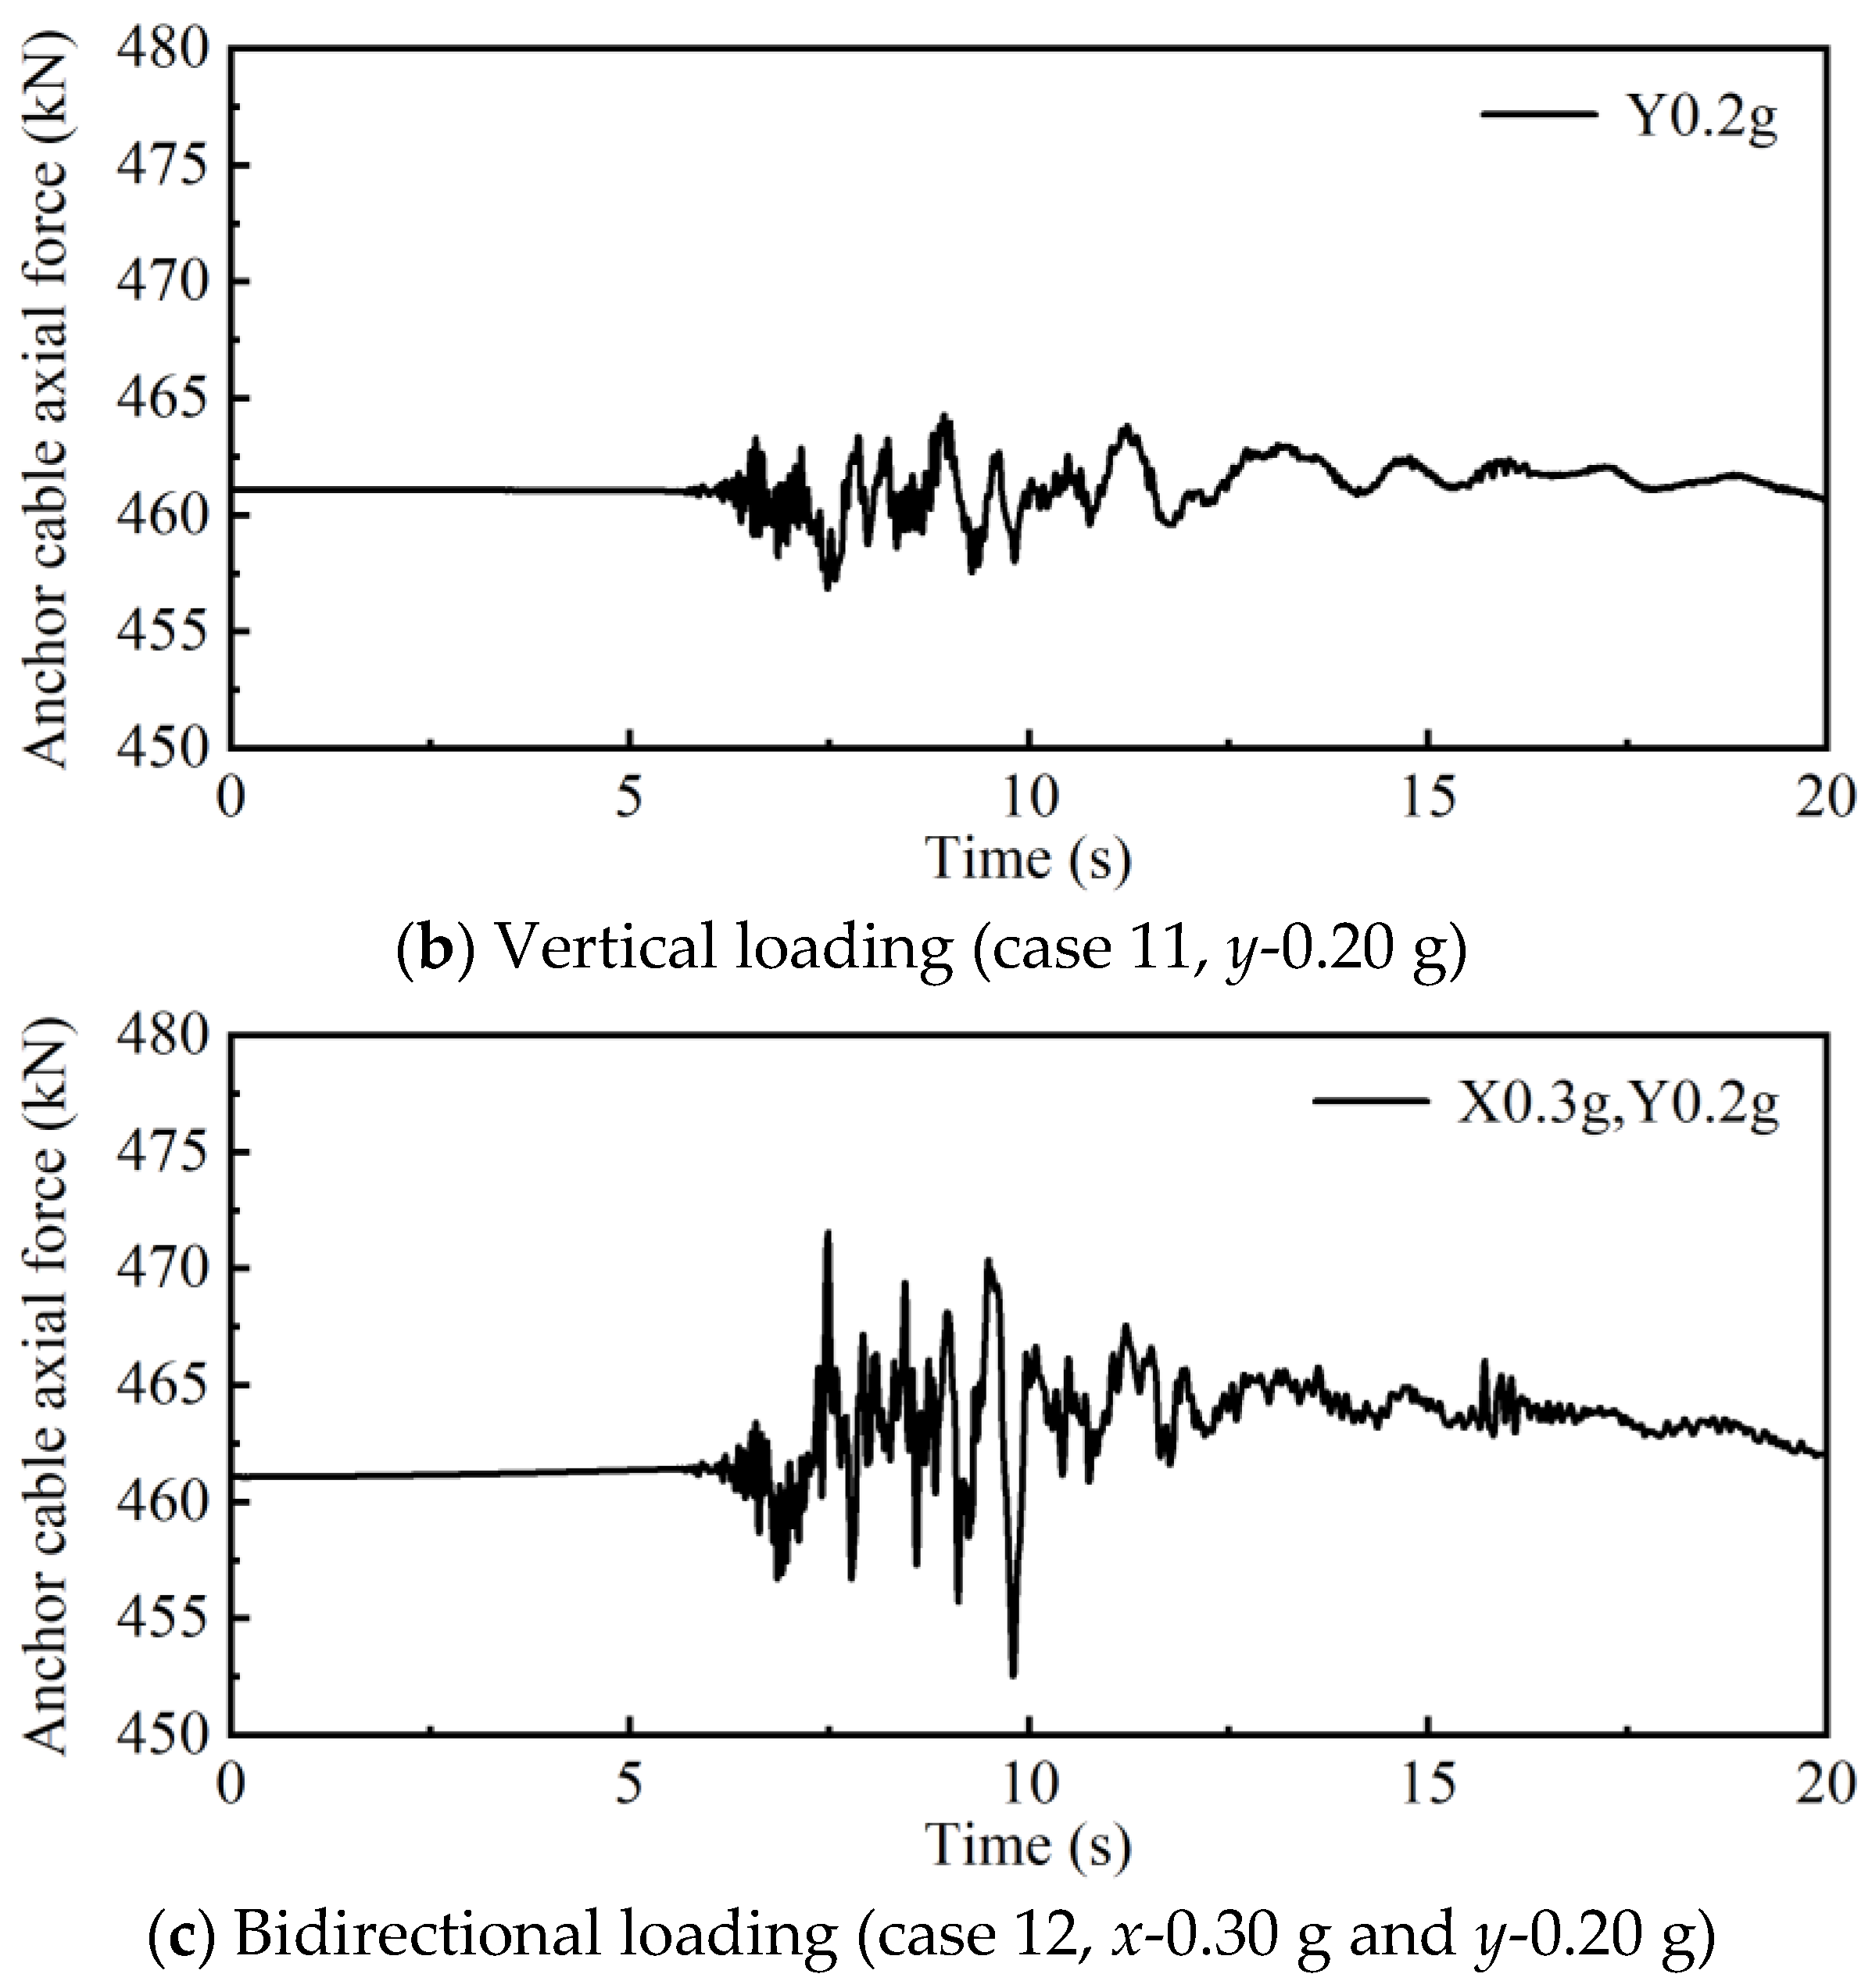
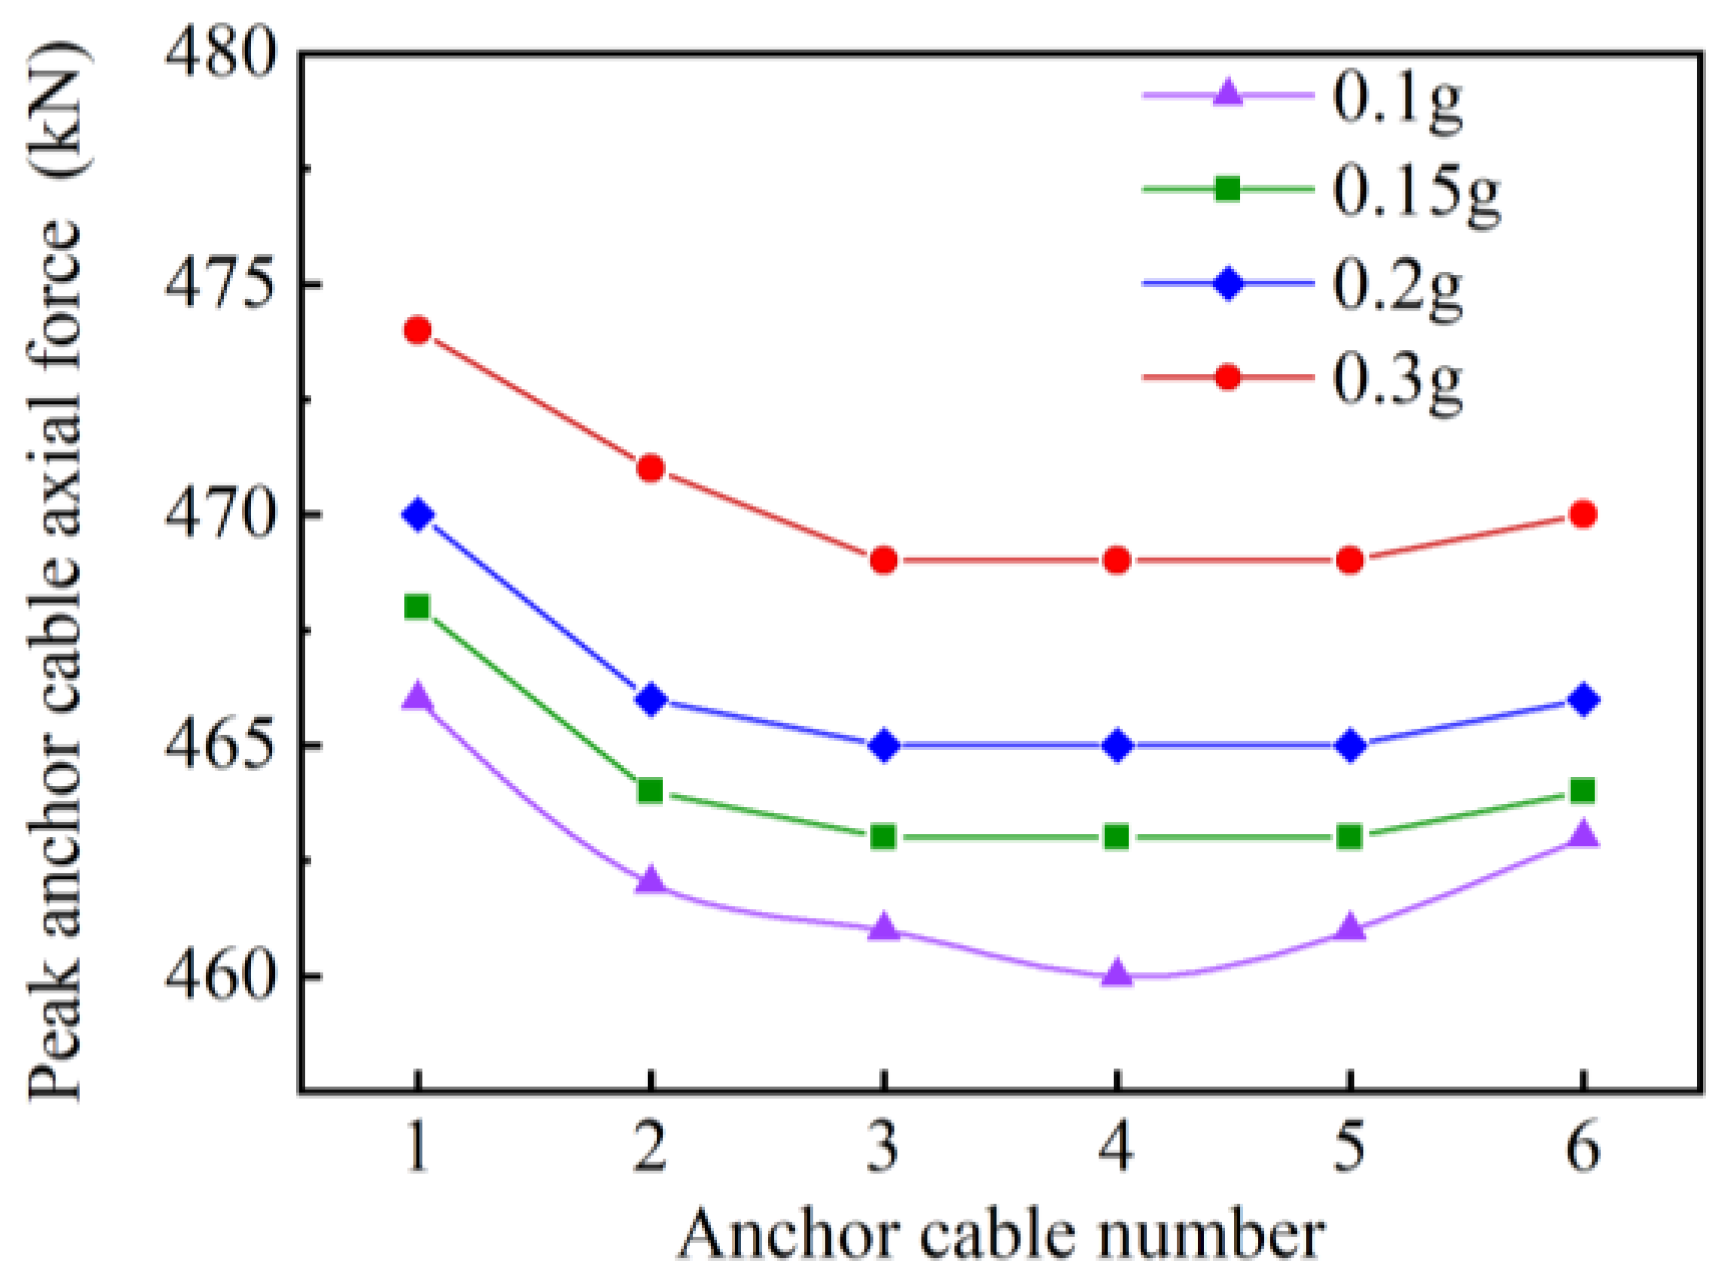
The maximum axial force in the anchors increases with the acceleration amplitude of the input motions. The upper and lower rows of anchors exhibit greater maximum axial forces than the middle rows. Specifically, the first row of anchors experiences the largest axial force during earthquakes, followed by the second and seventh rows.
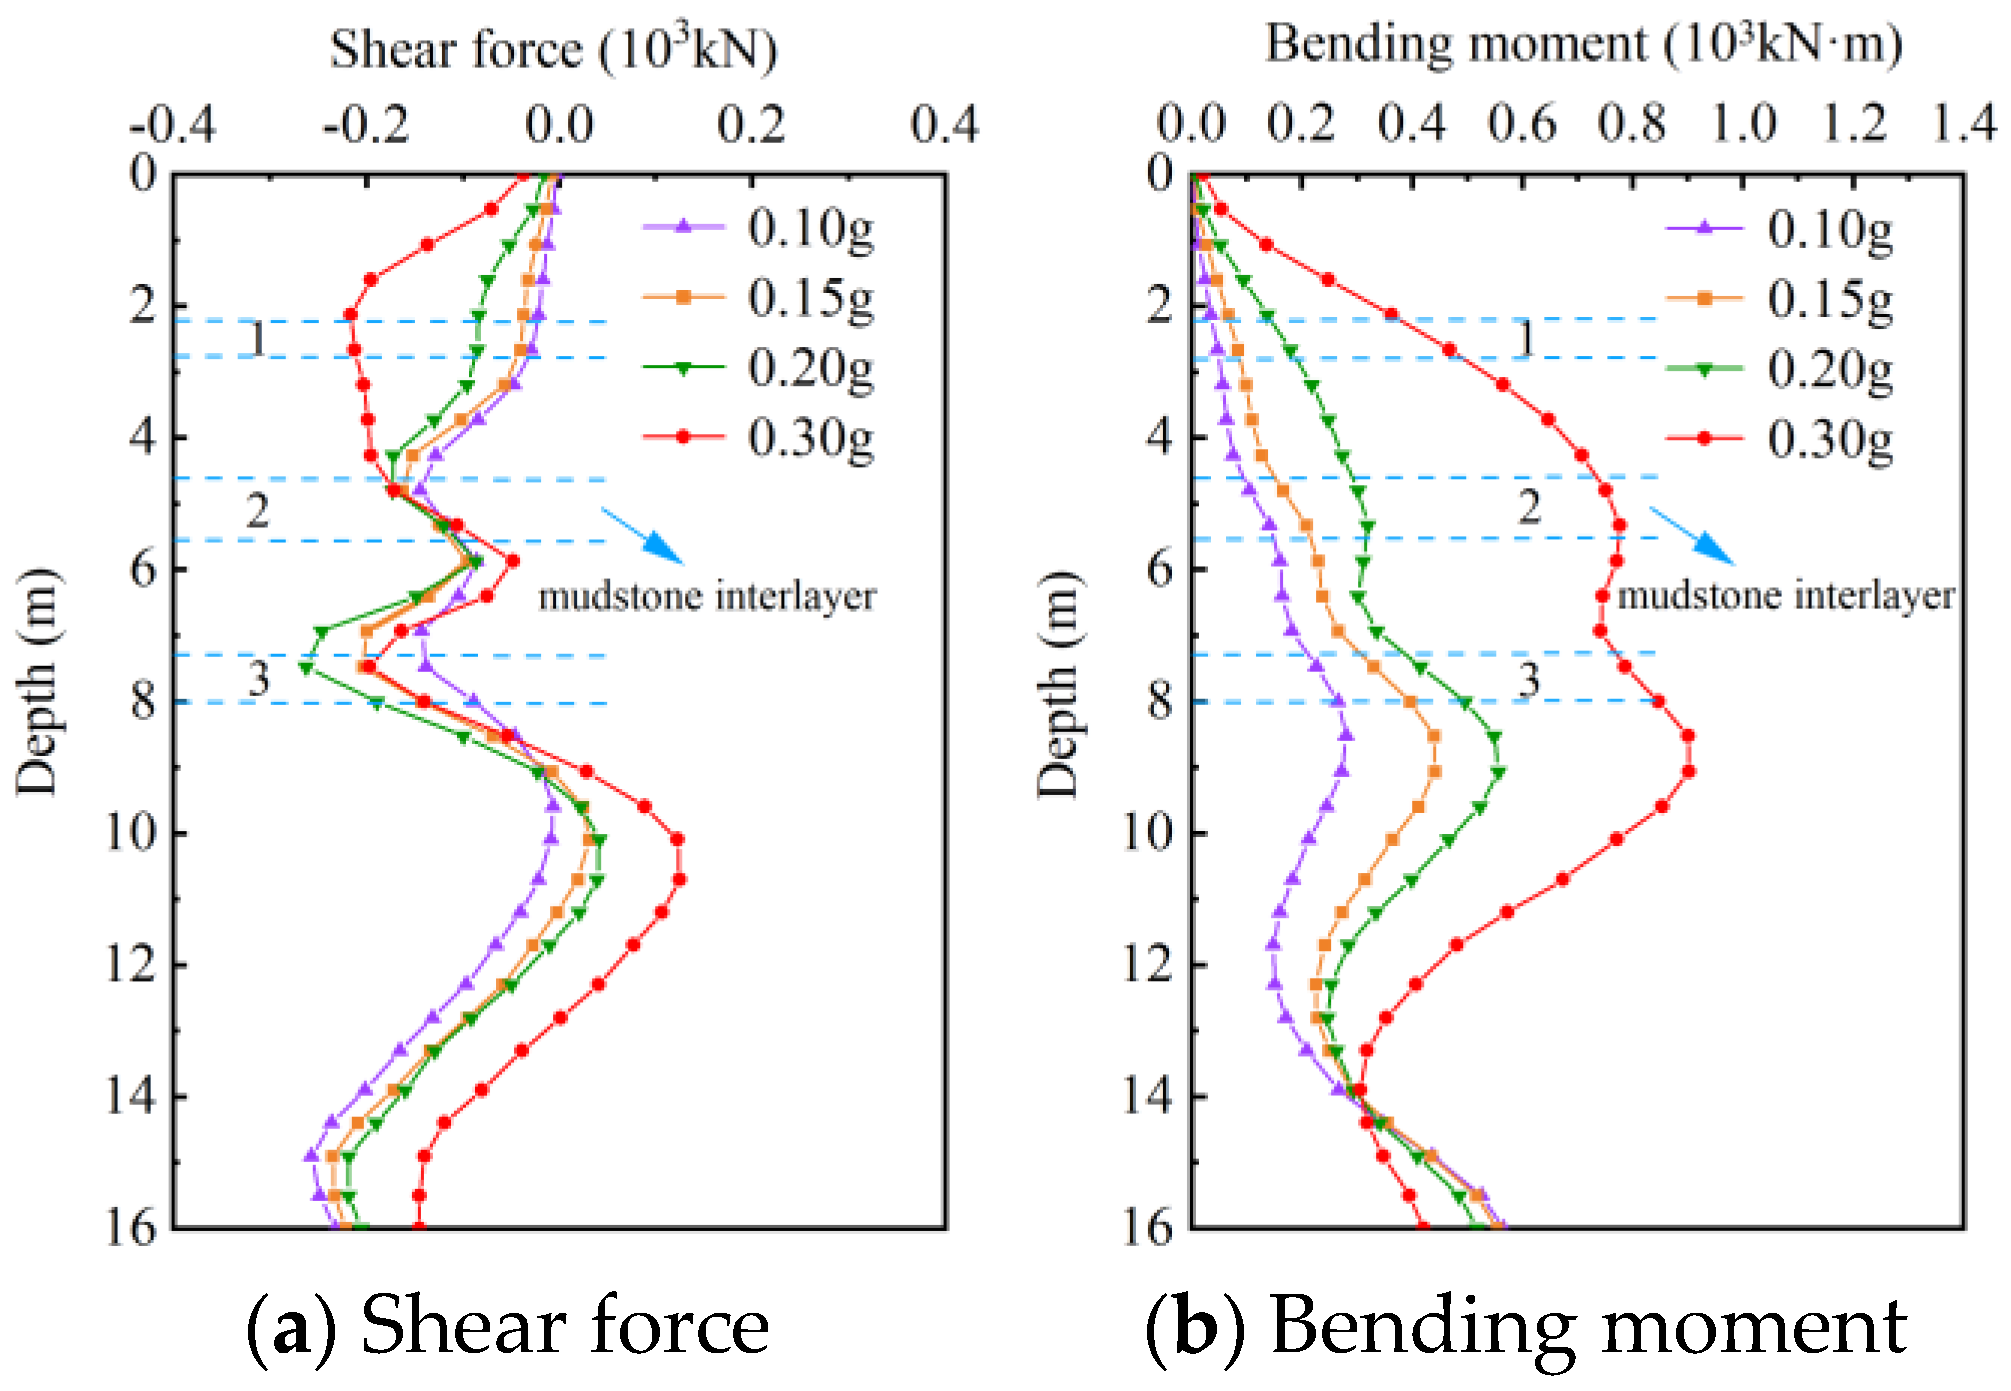
(3)
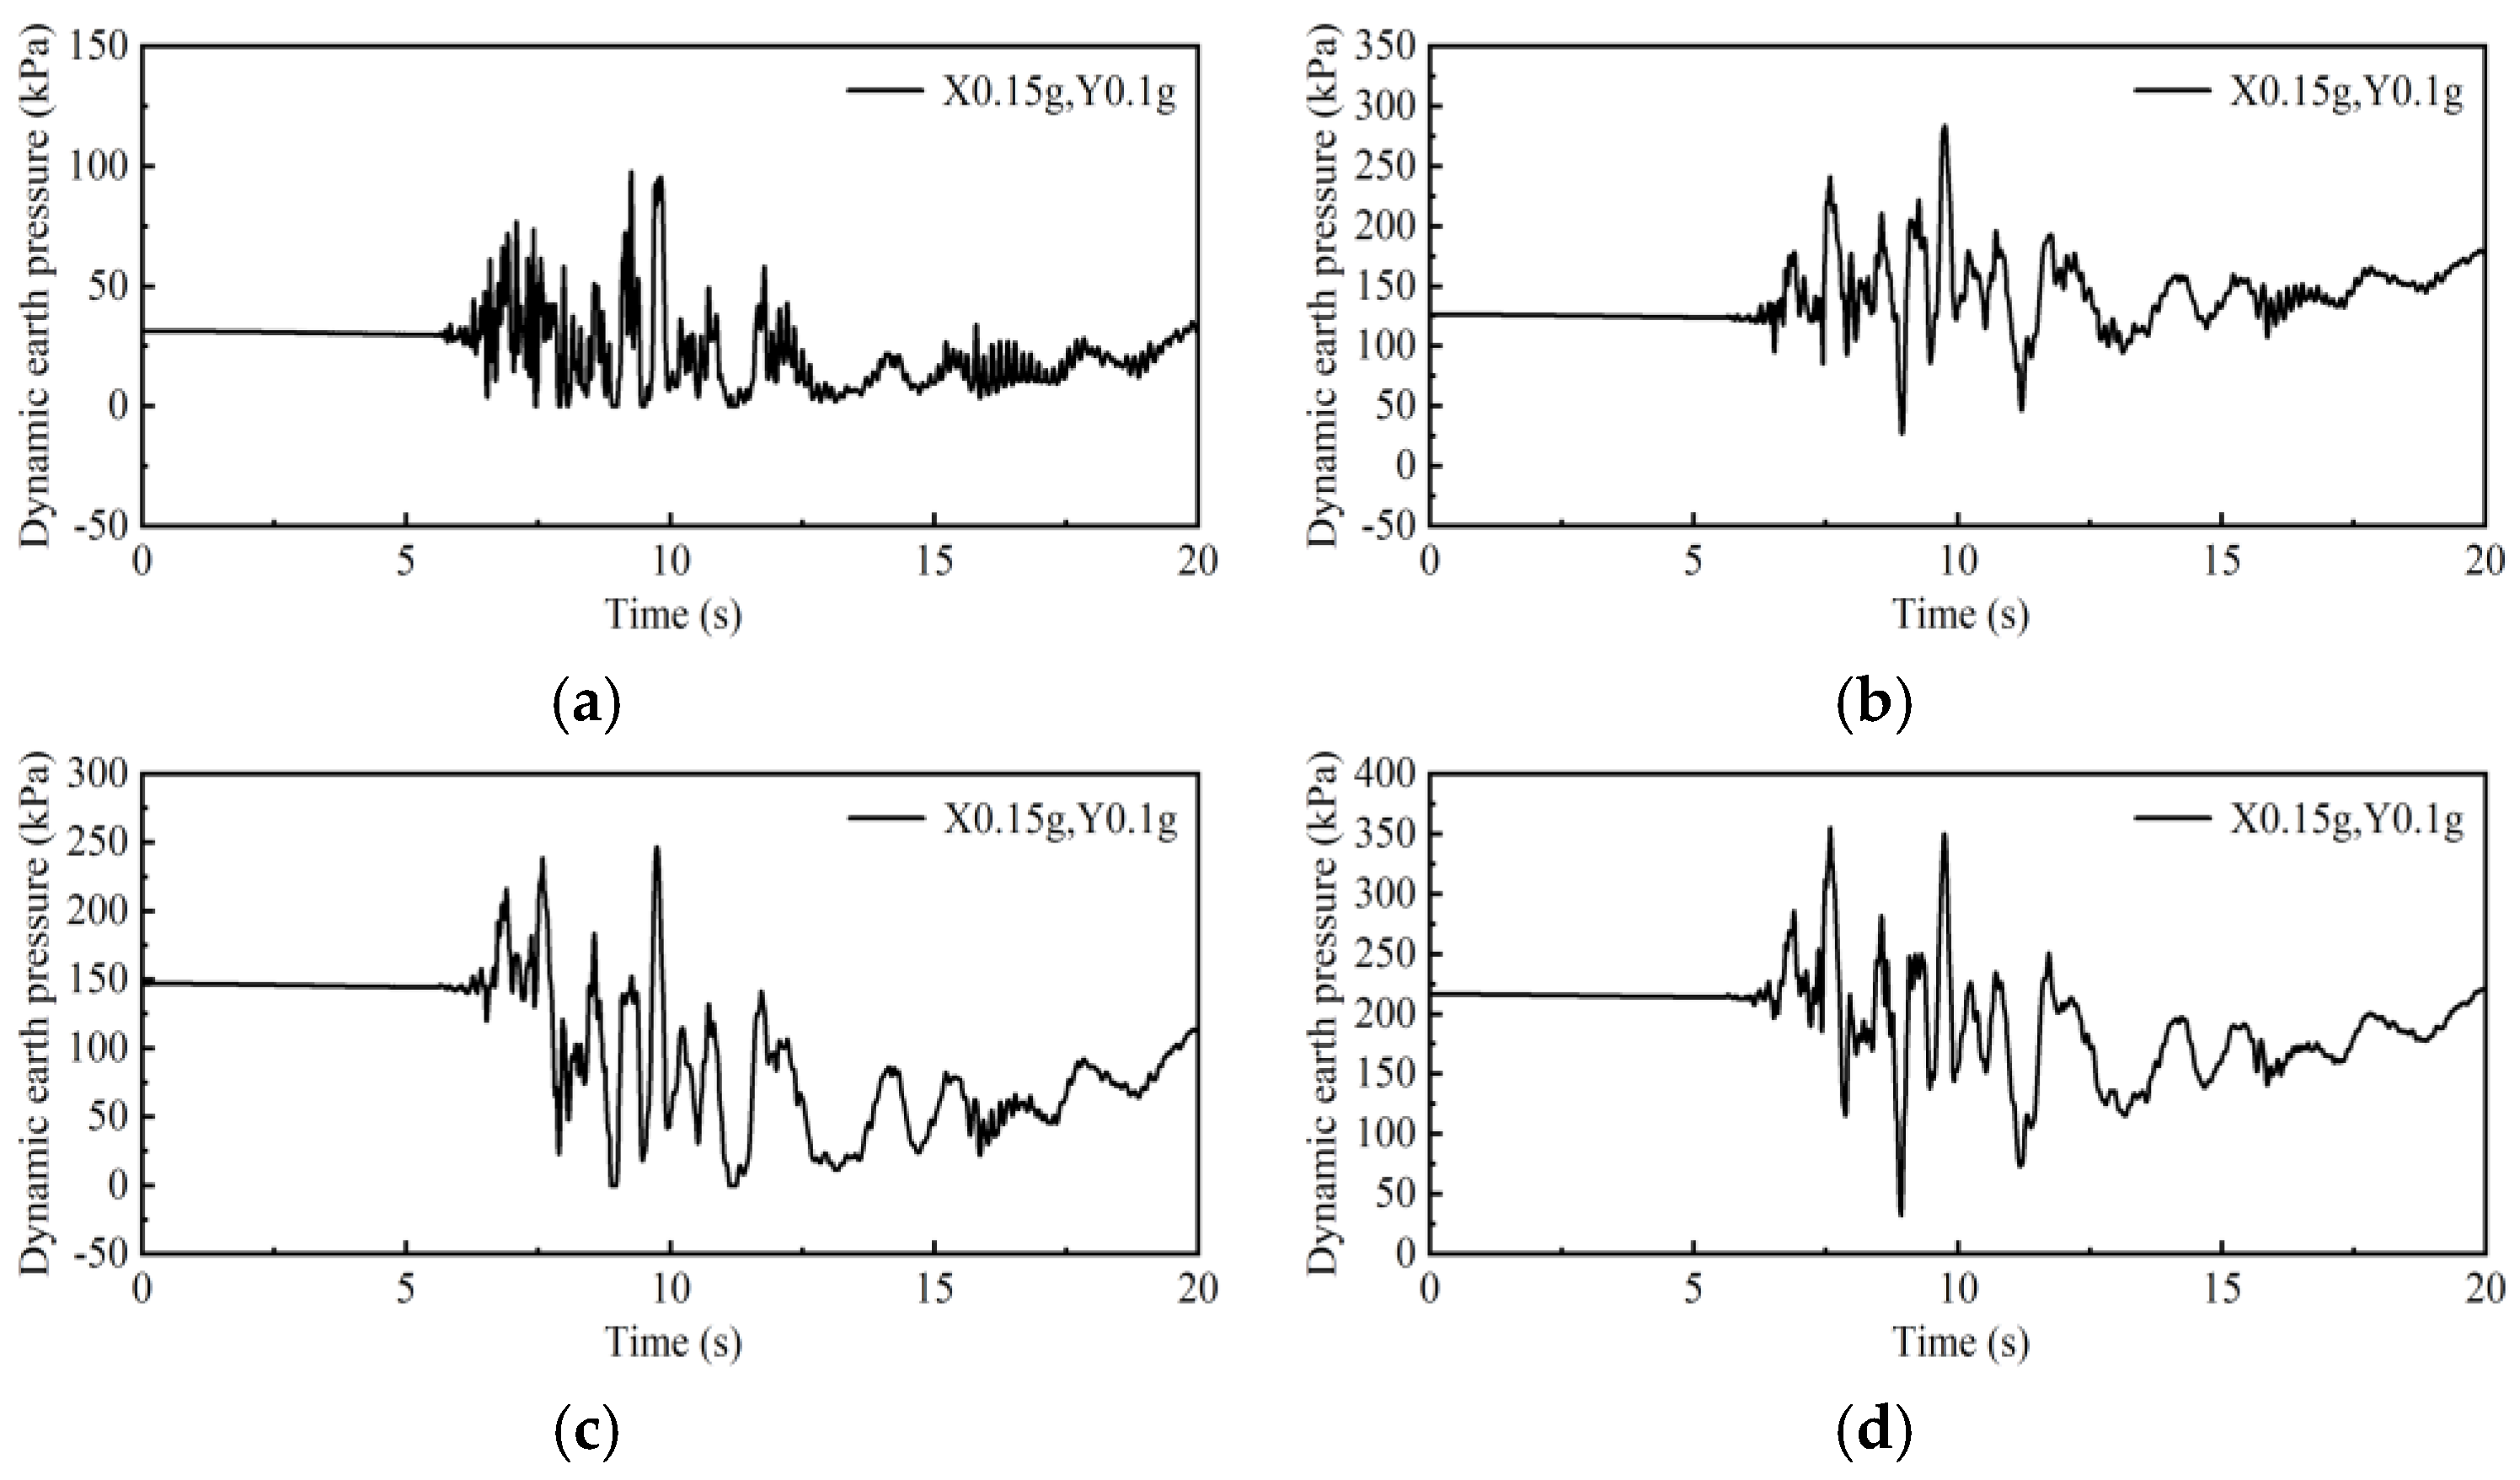
The distribution of peak earth pressure values shows significant changes near the sliding surface. The maximum bending moment of the pile increases from 0.55 × 10³ to 0.90 × 10³ kN·m as the acceleration amplitudes of the seismic waves increase from 0.2 to 0.3 g, indicating that the pile plays an important role in bearing the load caused by the movement of the slope.
This study focuses on the dynamic coupling between pile–anchor structures and geotechnical bodies, revealing the dynamic response laws of these systems under seismic action. It provides a theoretical foundation and technical support for the seismic design of pile–anchor structures in landslide prevention engineering, and holds important guiding significance for disaster prevention and mitigation in slope engineering.
The two-dimensional numerical model employs an idealized isolation assumption for the rock strata adjacent to the pile elements, which simplifies the soil–pile interaction mechanisms. This modeling approach may lead to incorrect estimation of the pile’s load-bearing capacity and deformation characteristics, as it fails to account for the complex three-dimensional wave propagation phenomena, including seismic wave reflection and scattering effects. Consequently, this limitation compromises the accuracy of critical dynamic response parameters such as peak ground acceleration (PGA) amplification factors and the distribution patterns of anchor cable axial forces. Given these inherent constraints in the 2D modeling methodology, the research findings should be applied with appropriate engineering discretion, and further validation through 3D numerical simulations or field monitoring data is recommended for practical engineering applications.

Author Contributions

Conceptualization, K.W. and Y.L.; methodology, Y.L. and K.W.; software, Y.L. and Z.C.; validation, Y.L. and X.Y.; formal analysis, Y.L. and X.Y.; investigation, Y.L. and Z.C.; resources, K.W. and X.Y.; data curation, Y.L.; writing—original draft preparation, Y.L., K.W. and Z.C.; writing—review and editing, K.W., X.Y. and Y.L.; visualization, K.W.; supervision, Y.L.; project administration, K.W. and Y.L.; funding acquisition, K.W. and Y.L. All authors have read and agreed to the published version of the manuscript.

Funding

This work was financially supported by Yunnan Fundamental Research Projects (grant No. 202401AU070049) and the National Key Research and Development Project of China (grant No. 2019YFC1509702).

Data Availability Statement

Data will be made available on request.

Conflicts of Interest

Author Kaiyang Wang is employed by the YCIC Group Investment Co., Ltd. The remaining authors declare that the research was conducted in the absence of any commercial or financial relationships that could be construed as a potential conflict of interest.

References

  1. Dai, F.C.; Xu, C.; Yao, X.; Xu, L.; Tu, X.B.; Gong, Q.M. Spatial distribution of landslides triggered by the 2008 Ms 8.0 Wenchuan earthquake, China. J. Asian Earth Sci. 2011, 40, 883–895. [Google Scholar] [CrossRef]
  2. Zhao, H.J.; Ma, F.S.; Li, Z.Q.; Guo, J.; Zhang, J.X. Optimization of parameters and application of probabilistic seismic landslide hazard analysis model based on newmark displacement model: A case study in Ludian earthquake area. Earth Sci. 2022, 47, 4401–4416. [Google Scholar] [CrossRef]
  3. Zou, Y.; Qi, S.W.; Guo, S.F.; Zheng, B.W.; Zhan, Z.F.; He, N.W.; Huang, X.L.; Hou, X.K.; Liu, H.Y. Factors controlling the spatial distribution of coseismic landslides triggered by the Mw 6.1 Ludian earthquake in China. Eng. Geol. 2022, 296, 106477. [Google Scholar] [CrossRef]
  4. Qu, H.L.; Luo, H.; Hu, H.G.; Jia, H.Y.; Zhang, D.Y. Dynamic response of anchored sheet pile wall under ground motion: Analytical model with experimental validation. Soil Dyn. Earthq. Eng. 2018, 115, 896–906. [Google Scholar] [CrossRef]
  5. Chen, G.P.; Yang, C.W.; Tong, X.H.; Wen, H.; Yue, M. Shaking table test on dynamic response of a deposit slope with a weak interlayer reinforced by the pile-anchor structure. Soil Dyn. Earthq. Eng. 2023, 170, 107912. [Google Scholar] [CrossRef]
  6. Huang, Y.; Xu, X.; Liu, J.; Mao, W.W. Centrifuge modeling of seismic response and failure mode of a slope reinforced by a pile-anchor structure. Soil Dyn. Earthq. Eng. 2020, 131, 106037. [Google Scholar] [CrossRef]
  7. Huang, Y.; Xu, X.; Mao, W.W. Numerical performance assessment of slope reinforcement using a pile-anchor structure under seismic loading. Soil Dyn. Earthq. Eng. 2020, 129, 105963. [Google Scholar] [CrossRef]
  8. Dong, X.G.; Li, Z.; Cui, Z.Z.; Zhou, C.M. Stability analysis of the pile-prestressed anchor composite structure based on failure mode. Eng. Fail. Anal. 2022, 137, 106223. [Google Scholar] [CrossRef]
  9. Peng, S.; Liao, W.; Liu, E. Pipe–soil interaction under the rainfall-induced instability of slope based on soil strength reduction method. Energy Rep. 2020, 6, 1865–1875. [Google Scholar] [CrossRef]
  10. Zhou, D.P.; Zhang, J.J.; Tang, Y. Seismic damage analysis of road slope engineering in Wenchuan earthquake. Chin. J. Rock Mech. Eng. 2010, 29, 565–576. [Google Scholar]
  11. Shin, G.B.; Jo, B.H.; Baek, S.H.; Kim, S.R.; Chung, C.K. Load transfer mechanism of a load distributive compression anchor installed in weathered rock layer. Can. Geotech. J. 2022, 59, 473–484. [Google Scholar] [CrossRef]
  12. Ling, H.I.; Leshchinsky, D.; Perry, E.B. Seismic design and performance of geosynthetic reinforced soil structures. Geotechnique 1997, 47, 933–952. [Google Scholar] [CrossRef]
  13. Michalowski, R.L.; You, L.Z. Displacements of reinforced slopes subjected to seismic loads. J. Geotech. Geoenviron. Eng. 2000, 126, 685–694. [Google Scholar] [CrossRef]
  14. Jibson, R.W. Methods for assessing the stability of slopes during earthquakes-A retrospective. Eng. Geol. 2011, 122, 43–50. [Google Scholar] [CrossRef]
  15. Newmark, N.M. Effects of earthquakes on dams and embankments. Geotechnique 1965, 15, 139–160. [Google Scholar] [CrossRef]
  16. You, L.Z.; Michalowski, R.L. Displacement charts for slopes subjected to seismic loads. Comput. Geotech. 1999, 25, 45–55. [Google Scholar] [CrossRef]
  17. Nadukuru, S.S.; Michalowski, R.L. Three dimensional displacement analysis of slopes subjected to seismic loads. Can. Geotech. J. 2013, 50, 650–661. [Google Scholar] [CrossRef]
  18. Du, W.Q. Effects of directionality and vertical component of ground motions on seismic slope displacements in Newmark sliding-block analysis. Eng. Geol. 2018, 239, 13–21. [Google Scholar] [CrossRef]
  19. Kokusho, T. Energy-based Newmark method for earthquake-induced slope displacements. Soil Dyn. Earthq. Eng. 2019, 121, 121–134. [Google Scholar] [CrossRef]
  20. Wartman, J.; Seed, R.B.; Bray, J.D. Shaking table modeling of seismically induced deformations in slopes. J. Geotech. Geoenviron. Eng. 2005, 131, 610–622. [Google Scholar] [CrossRef]
  21. Lin, M.L.; Wang, K.L. Seismic slope behavior in a large-scale shaking table model test. Eng. Geol. 2006, 86, 118–133. [Google Scholar] [CrossRef]
  22. Ye, S.H.; Fang, G.W.; Zhu, Y.P. Model establishment and response analysis of slope reinforced by frame with prestressed anchors under seismic considering the prestress. Soil Dyn. Earthq. Eng. 2019, 122, 228–234. [Google Scholar] [CrossRef]
  23. Song, D.Q.; Chen, Z.; Ke, Y.T.; Nie, W. Seismic response analysis of a bedding rock slope based on the time-frequency joint analysis method: A case study from the middle reach of the Jinsha River, China. Eng. Geol. 2020, 274, 105731. [Google Scholar] [CrossRef]
  24. Wu, Z.J.; Zhang, D.; Wang, S.N.; Liang, C.; Zhao, D.Y. Dynamic-response characteristics and deformation evolution of loess slopes under seismic loads. Eng. Geol. 2020, 267, 105507. [Google Scholar] [CrossRef]
  25. Huang, Y.; He, Z.Y.; Yashima, A.; Chen, Z.Y.; Li, C.X. Multi-objective optimization design of pile-anchor structures for slopes based on reliability theory considering the spatial variability of soil properties. Comput. Geotech. 2022, 147, 104751. [Google Scholar] [CrossRef]
  26. Lu, L.; Lin, Y.L.; Guo, D.D.; Xing, H.; Zhang, Z.; Duan, J.Y. A modified Newmark block method for determining the seismic displacement of a slope reinforced by prestressed anchors. Comput. Geotech. 2023, 162, 105697. [Google Scholar] [CrossRef]
  27. Lin, Y.L.; Li, Y.X.; Yang, G.L.; Li, Y. Experimental and numerical study on the seismic behavior of anchoring frame beam supporting soil slope on rock mass. Soil Dyn. Earthq. Eng. 2017, 98, 12–23. [Google Scholar] [CrossRef]
  28. Xu, M.; Tang, Y.F.; Liu, X.S.; Yang, H.Q.; Luo, B. A shaking table model test on a rock slope anchored with adaptive anchor cables. Int. J. Rock Mech. Min. Sci. 2018, 112, 201–208. [Google Scholar] [CrossRef]
  29. Van Nguyen, D.; Kim, D.; Choo, Y. Seismic responses, damage mechanisms and retrofitting methods for deep braced excavation: Centrifuge test and numerical analysis. Soil Dyn. Earthq. Eng. 2023, 168, 107829. [Google Scholar] [CrossRef]
  30. Yoo, B.S.; Tran, N.X.; Hwang, B.Y.; Kim, S.R. Variation in axial load distribution of piles in liquefiable slope by centrifuge test. Soil Dyn. Earthq. Eng. 2023, 167, 107802. [Google Scholar] [CrossRef]
  31. Yun, J.W.; Han, J.T. Evaluation of the dynamic behavior of pile groups considering the kinematic force of the slope using centrifuge model tests. Soil Dyn. Earthq. Eng. 2023, 173, 108106. [Google Scholar] [CrossRef]
  32. Nian, T.K.; Jiang, J.C.; Wang, F.W.; Yang, Q.; Luan, M.T. Seismic stability analysis of slope reinforced with a row of piles. Soil Dyn. Earthq. Eng. 2016, 84, 83–93. [Google Scholar] [CrossRef]
  33. Wang, C.; Hawlader, B.; Islam, N.; Soga, K. Implementation of a large deformation finite element modelling technique for seismic slope stability analyses. Soil Dyn. Earthq. Eng. 2019, 127, 105824. [Google Scholar] [CrossRef]
  34. Xu, X.; Huang, Y. Parametric study of structural parameters affecting seismic stability in slopes reinforced by pile-anchor structures. Soil Dyn. Earthq. Eng. 2021, 147, 106789. [Google Scholar] [CrossRef]
  35. Zhang, Y.B.; Zhang, J.; Chen, G.Q.; Zheng, L.; Li, Y.G. Effects of vertical seismic force on initiation of the Daguangbao landslide induced by the 2008 Wenchuan earthquake. Soil Dyn. Earthq. Eng. 2015, 73, 91–102. [Google Scholar] [CrossRef]
  36. Lin, Y.L.; Yang, G.L.; Yang, X.; Zhao, L.H.; Shen, Q.; Qiu, M.M. Response of gravity retaining wall with anchoring frame beam supporting a steep rock slope subjected to earthquake loading. Soil Dyn. Earthq. Eng. 2017, 92, 633–649. [Google Scholar] [CrossRef]
  37. Lin, Y.L.; Cheng, X.M.; Yang, G.L.; Li, Y. Seismic response of a sheet-pile wall with anchoring frame beam by numerical simulation and shaking table test. Soil Dyn. Earthq. Eng. 2018, 115, 352–364. [Google Scholar] [CrossRef]
  38. Bozzano, F.; Lenti, L.; Martino, S.; Montagna, A.; Paciello, A. Earthquake triggering of landslides in highly jointed rock masses: Reconstruction of the 1783 Scilla rock avalanche (Italy). Geomorphology 2011, 129, 294–308. [Google Scholar] [CrossRef]
  39. Aaron, J.; Hungr, O. Dynamic simulation of the motion of partially-coherent landslides. Eng. Geol. 2016, 205, 1–11. [Google Scholar] [CrossRef]
  40. Zare, M.A.; Haghshenas, E.; Jafari, M.K. Interpretation of dynamic response of a very complex landslide (Latian-Tehran) based on ambient noise investigation. Soil Dyn. Earthq. Eng. 2017, 100, 559–572. [Google Scholar] [CrossRef]
  41. Sun, L.; Liu, Q.S.; Abdelaziz, A.; Tang, X.H.; Grasselli, G. Simulating the entire progressive failure process of rock slopes using the combined finite-discrete element method. Comput. Geotech. 2022, 141, 104557. [Google Scholar] [CrossRef]
  42. Bagheri, M.; Jamkhaneh, M.E.; Samali, B. Effect of seismic soil–pile–structure interaction on mid- and high-rise steel buildings resting on a group of pile foundations. Int. J. Geomech. 2018, 18, 04018103. [Google Scholar] [CrossRef]
  43. Bao, Y.J.; Hu, H.Q.; Gan, G. Seismic response analysis of slope reinforced by pile-anchor structures under near-fault pulse-like ground motions. Soil Dyn. Earthq. Eng. 2023, 164, 107576. [Google Scholar] [CrossRef]
  44. Asgari, A.; Bagheri, M.; Hadizadeh, M. Advanced seismic analysis of soil-foundation-structure interaction for shallow and pile foundations in saturated and dry deposits: Insights from 3D parallel finite element modeling. Structures 2024, 69, 107503. [Google Scholar] [CrossRef]
  45. Asgari, A.; Ranjbar, F.; Bagheri, M. Seismic resilience of pile groups to lateral spreading in liquefiable soils: 3D parallel finite element modeling. Structures 2025, 74, 108578. [Google Scholar] [CrossRef]
  46. Luo, J.; Evans, S.G.; Pei, X.J.; Huang, R.Q.; Liu, M.; Dong, X.J. Anomalous co-seismic surface effects produced by the 2014 Mw 6.2 Ludian earthquake, Yunnan, China: An example of complex faulting related to Riedel shear structures. Eng. Geol. 2020, 266, 105476. [Google Scholar] [CrossRef]
  47. Duan, M.; Zhou, L.; Zhao, C.; Zhang, X. High-resolution 3D crustal velocity structure imaging in the middle eastern boundary of the Sichuan-Yunnan Rhombic block. Tectonophysics 2023, 862, 229986. [Google Scholar] [CrossRef]
  48. Liu, X.; Cai, G.; Liu, L.; Zhou, Z. Investigation of internal force of anti-slide pile on landslides considering the actual distribution of soil resistance acting on anti-slide piles. Nat. Hazards 2020, 102, 1369–1392. [Google Scholar] [CrossRef]
  49. Sun, P.; Qin, W.; Chen, M.; Lu, W. Influence of blasting in deep excavations on anchored pile supporting structures and its mechanism. J. Vib. Shock 2021, 40, 144–150. [Google Scholar]
  50. Liu, J.B.; Du, Y.X.; Du, X.; Wang, Z.Y.; Wu, J. 3D viscous-spring artificial boundary in time domain. Earthq. Eng. Eng. Vib. 2006, 5, 93–110. [Google Scholar] [CrossRef]
  51. Bao, X.; Liu, J.B.; Li, S.T.; Wang, F. A new viscoelastic artificial boundary with improved numerical stability in explicit calculation of wave propagation problems in infinite domains. Comput. Geotech. 2022, 145, 104698. [Google Scholar] [CrossRef]
  52. Liu, J.; Lü, Y. A direct method for the analysis of structure-foundation dynamic interaction problems. J. Civ. Eng. 1998, 83, 261–276. [Google Scholar] [CrossRef]
  53. Du, X. Engineering Wave Theory and Method; Beijing Science Press: Beijing, China, 2009; pp. 367–374. [Google Scholar]
  54. Bao, Y.; Huang, Y.; Zhu, C. Effects of near-fault ground motions on dynamic response of slopes based on shaking table model tests. Soil Dyn. Earthq. Eng. 2021, 149, 106869. [Google Scholar] [CrossRef]
  55. Qi, S.; He, J.; Zhan, Z. A single surface slope effects on seismic response based on shaking table test and numerical simulation. Eng. Geol. 2022, 306, 106762. [Google Scholar] [CrossRef]
  56. Xu, X.; Huang, Y.; Yashima, A.; Du, X. Failure evolution process of pile-anchor reinforced rock slope based on centrifuge shaking table tests. Eng. Geol. 2022, 311, 106920. [Google Scholar] [CrossRef]
  57. Zhang, J.; Li, X.; Wang, X.; Chi, M.; Wang, Y. Method for judging seismic stability state of soil slopes. Chin. J. Rock Mech. Eng. 2018, 40, 2096–2102. [Google Scholar] [CrossRef]
Figure 1. (a) Regional tectonic map of the research area [2], (b) overall view and geomorphology of the slope, and (c) slope profile I-I’. The bedding rock slope is composed of siltstone, mudstone, and argillaceous siltstone, with a slope angle of 31°.
Buildings 15 01869 g001
Figure 2. Numerical model, where six rows of 22 m long prestressed anchors, with numbers ranging from 1 to 6, are arranged at an anchor angle of 20°. Twelve monitoring points (A1–A12) are positioned within the model.
Buildings 15 01869 g002
Figure 3. Models used for validation. (a) A soil slope model and (b) an extended model.
Buildings 15 01869 g003
Figure 4. Time history curves of (a) the velocity and (b) displacement of the Dirac pulse.
Buildings 15 01869 g004
Figure 5. Displacement cloud of the slope with an input of an SV wave.
Buildings 15 01869 g005aBuildings 15 01869 g005b
Figure 6. Comparison between the displacement response of the slope obtained by the wave field separation method and the benchmark solution for an input of an SV wave.
Buildings 15 01869 g006
Figure 7. Displacement cloud of the slope with an input of a P wave.
Buildings 15 01869 g007
Figure 8. Comparison between the displacement response of the slope obtained by the wave field separation method and the benchmark solution for an input of a P wave.
Buildings 15 01869 g008
Figure 9. Acceleration time history curve of the (a) north–south (NS) and (b) up–down (UD) components of the Ludian seismic wave.
Buildings 15 01869 g009
Figure 10. PGA amplification factors (a) at the slope surface and (b) inside the slope under horizontal seismic loadings.
Buildings 15 01869 g010
Figure 11. PGA amplification factors (a) at the slope surface and (b) in the middle of the slope under vertical seismic loadings.
Buildings 15 01869 g011
Figure 12. Horizontal PGA amplification factors (a) at the slope surface and (b) inside the slope under bidirectional loadings.
Buildings 15 01869 g012
Figure 13. Vertical PGA amplification factors (a) at the slope surface and (b) inside the slope under bidirectional loadings.
Buildings 15 01869 g013
Figure 14. Deformation behavior of the slope in different loading schemes. (a) Case 4 (horizontal loading, x-0.15g), (b) case 5 (vertical loading, y-0.10g), (c) case 6 (bidirectional loading, x-0.15 g and y-0.10 g).
Buildings 15 01869 g014
Figure 15. Deformation behavior of the slope for case 12 (bidirectional loading, x-0.30 g and y-0.20 g).
Buildings 15 01869 g015
Figure 16. Time history curve of the axial force of anchor 1 under different seismic loadings. (a) Horizontal loading (case 10, x-0.30 g), (b) vertical loading (case 11, y-0.20 g), (c) bidirectional loading (case 12, x-0.30 g and y-0.20 g).
Buildings 15 01869 g016aBuildings 15 01869 g016b
Figure 17. The maximum axial force of the anchors under horizontal seismic loadings with different acceleration amplitudes.
Buildings 15 01869 g017
Figure 18. Time history curve of earth pressure along the pile body located (a) 3 m, (b) 6 m, (c) 9 m, and (d) 12 m below the top of the pile.
Buildings 15 01869 g018
Figure 19. Peak dynamic earth pressure behind the pile under bidirectional loadings with different acceleration amplitudes.
Buildings 15 01869 g019
Figure 20. The shear force and bending moment of the pile under horizontal loadings with different acceleration amplitudes.
Buildings 15 01869 g020
Table 1. Earthquake statistics near the study zone over the past century [2,47].
NumberTimeLongitudeAttitudeMw
131 July 191728°00′104°00′6.5
210 October 194827°06′103°08′5.75
311 May 197428°06′103°54′7.1
415 November 2003 27°12′103°18′5.1
526 November 2003 27°12′103°38′5.0
63 August 200427°06′103°18′6.5
725 August 200427°12′103°36′5.6
822 July 200628°00′104°12′5.1
97 September 201227°30′104°00′5.7
103 August 201427°06′103°18′6.5
1117 August 201428°06′103°18′5.0
1218 May 202027°11′103°10′5.0
Table 2. Parameters used in the simulations.
MaterialsDensity (kg/m3)Elastic
Modulus (MPa)
Poisson’s
Ratio
Frictional Angle (°)Cohesion (Kpa)
Strongly weathered argillaceous siltstone1950650.321917
Strongly weathered
siltstone
19801200.32120
Moderately weathered mudstone21003000.2717.449.5
Moderately weathered siltstone233021720.21431220
Pile240030,0000.2--
Anchor7800198,0000.2--
Table 3. Input motions in the simulations.
CaseMotionAcceleration Amplitudes (g)
HorizontalVertical
Case 1Ludian NS0.100
Case 2Ludian UD00.06
Case 3Ludian NS + UD0.100.06
Case 4Ludian NS0.150
Case 5Ludian UD0.0.10
Case 6Ludian NS + UD0.150.10
Case 7Ludian NS0.200
Case 8Ludian UD00.13
Case 9Ludian NS + UD0.200.13
Case 10Ludian NS0.300
Case 11Ludian UD00.20
Case 12Ludian NS + UD0.300.20
Disclaimer/Publisher’s Note: The statements, opinions and data contained in all publications are solely those of the individual author(s) and contributor(s) and not of MDPI and/or the editor(s). MDPI and/or the editor(s) disclaim responsibility for any injury to people or property resulting from any ideas, methods, instructions or products referred to in the content.

