1. Introduction
With the rapid advancement of economic globalization and urbanization, commercial districts have gradually transformed from traditional enclosed commercial complexes into vibrant urban public spaces that integrate functions such as dining, leisure, and shopping. Although the development of commercial districts in China began relatively late, it has experienced rapid growth since the 1990s. In alignment with China’s 14th Five-Year Plan—which emphasizes “accelerating the transformation of urban development patterns, coordinating urban planning, construction, and governance, implementing urban renewal strategies, and promoting spatial optimization and quality enhancement” [
1]—several well-known people-oriented commercial streets have emerged in recent years. Examples include Wangfujing in Beijing, as well as Nanjing Road and Xintiandi in Shanghai, which have become iconic symbols of urban vitality and charm.
With the fast development of information technology, new methods and tools for analyzing commercial district vitality have continuously emerged [
2,
3], offering new avenues for fine-grained, data-driven research in the field of urban design [
4,
5]. Against this backdrop, scholars at home and abroad have conducted extensive studies on various aspects of commercial district vitality, including evaluation methodologies [
6], correlation analysis [
7], evolutionary mechanisms [
8], and optimization strategies [
9,
10]. Many of these studies rely on the integration of multi-source urban data and spatial modeling techniques to identify spatial features associated with vitality [
11].
Building upon this foundation, the present study introduces a perspective from environmental psychology. Drawing on Xu Leiqing’s theoretical interpretations of the relationships between environment, perception, and behavior, we emphasize the impact of spatial perception on behavioral patterns. Lynch’s “Image of the City” theory is used to highlight the link between spatial legibility and behavioral response. Mumford’s view on urban multifunctionality supports the positive role of functional diversity and usage mixing in promoting spatial vitality. In addition, we incorporate Proshansky and Fabian’s conceptualization of the psychological dimensions of urban quality of life and Gehl’s empirical observations on the interactions between street space and human activity, thereby enriching the theoretical basis for studying commercial district vitality.
Notably, while existing research has produced many valuable insights, few studies have systematically applied the SOR (stimulus–organism–response) model from psychology to the study of commercial district vitality. Humans play a central role in the generation and sustenance of spatial vitality through their perception, behavior, and emotional responses. Considering this, the present study introduces the SOR theoretical model into commercial district vitality research [
12], constructing a three-layered analytical framework of “stimulus–organism–response.” Three representative commercial districts are selected as case studies: Huaihe Road District in Hefei, Ronghui Old Port District in Jinan, and Jiefangbei District in Chongqing. By integrating spatial syntax analysis, streetscape semantic segmentation, POI diversity calculation, and crowd density data, this study systematically identifies and compares the mechanisms through which different variables influence commercial vitality.
To this end, this study focuses on the following three research questions:
Among spatial, functional, and environmental variables in commercial districts, which factors have a significant impact on vitality?
How do these variables indirectly affect vitality through behavioral, perceptual, and psychological responses, i.e., the “organism” layer?
Based on the SOR framework, how can we propose targeted strategies for enhancing and renewing commercial district vitality?
By constructing a vitality analysis framework grounded in the SOR theoretical model, this study systematically identifies and compares the effects of various variables on commercial vitality. It not only enriches the theoretical dimensions of vitality research but also provides operable theoretical support and empirical reference for the renewal and optimization of urban commercial districts.
2. SOR Theory Model and the Vitality of Commercial Districts
2.1. Overview of the SOR Theory Model
2.1.1. Definition of the Model
The SOR (stimulus–organism–response) model originated in environmental psychology and is an evolution of the behaviorist S-R (stimulus–response) model developed by Mehrabian and Russell [
13]. The SOR model holds that organisms with cognitive capacities respond to external environmental stimuli by undergoing a series of psychological processes, which subsequently lead to corresponding reactions [
14]. The model consists of three components: stimulus (S), organism (O), and response (R). Among them, stimulus (S) refers to external environmental factors, including physical environment, social dynamics, economic conditions, policies, and information. Organism (O) represents the internal state changes within the organism that are affected by these stimuli, including psychological behavior, emotional changes, and cognitive shifts. Response (R) refers to the attitudes and behavioral outcomes of the organism because of the stimuli, typically manifested as either approach or avoidance behaviors towards a given stimulus [
15]. Stimuli activate the internal states of the organism—such as cognition, structure, thought processes, and feelings—thus influencing the organism’s ultimate behavioral response. The organism’s perception plays a critical role in determining the relationship between the stimulus and response, reflecting the process by which the organism responds to external stimuli.
2.1.2. Feasibility Study of the Model’s Application in Commercial District Vitality
Urban commercial districts primarily consist of various retail shops, streetscapes, greenery, pedestrian traffic, and roadways. The pedestrian flow and the extent of visitor engagement are crucial indicators for evaluating the vitality of a district [
16]. The vitality of a commercial area is influenced by various factors. These include, for example, the cultural and historical significance of the district, the quality of its green spaces, the comfort of its roadways, and the overall sense of enclosure within the space [
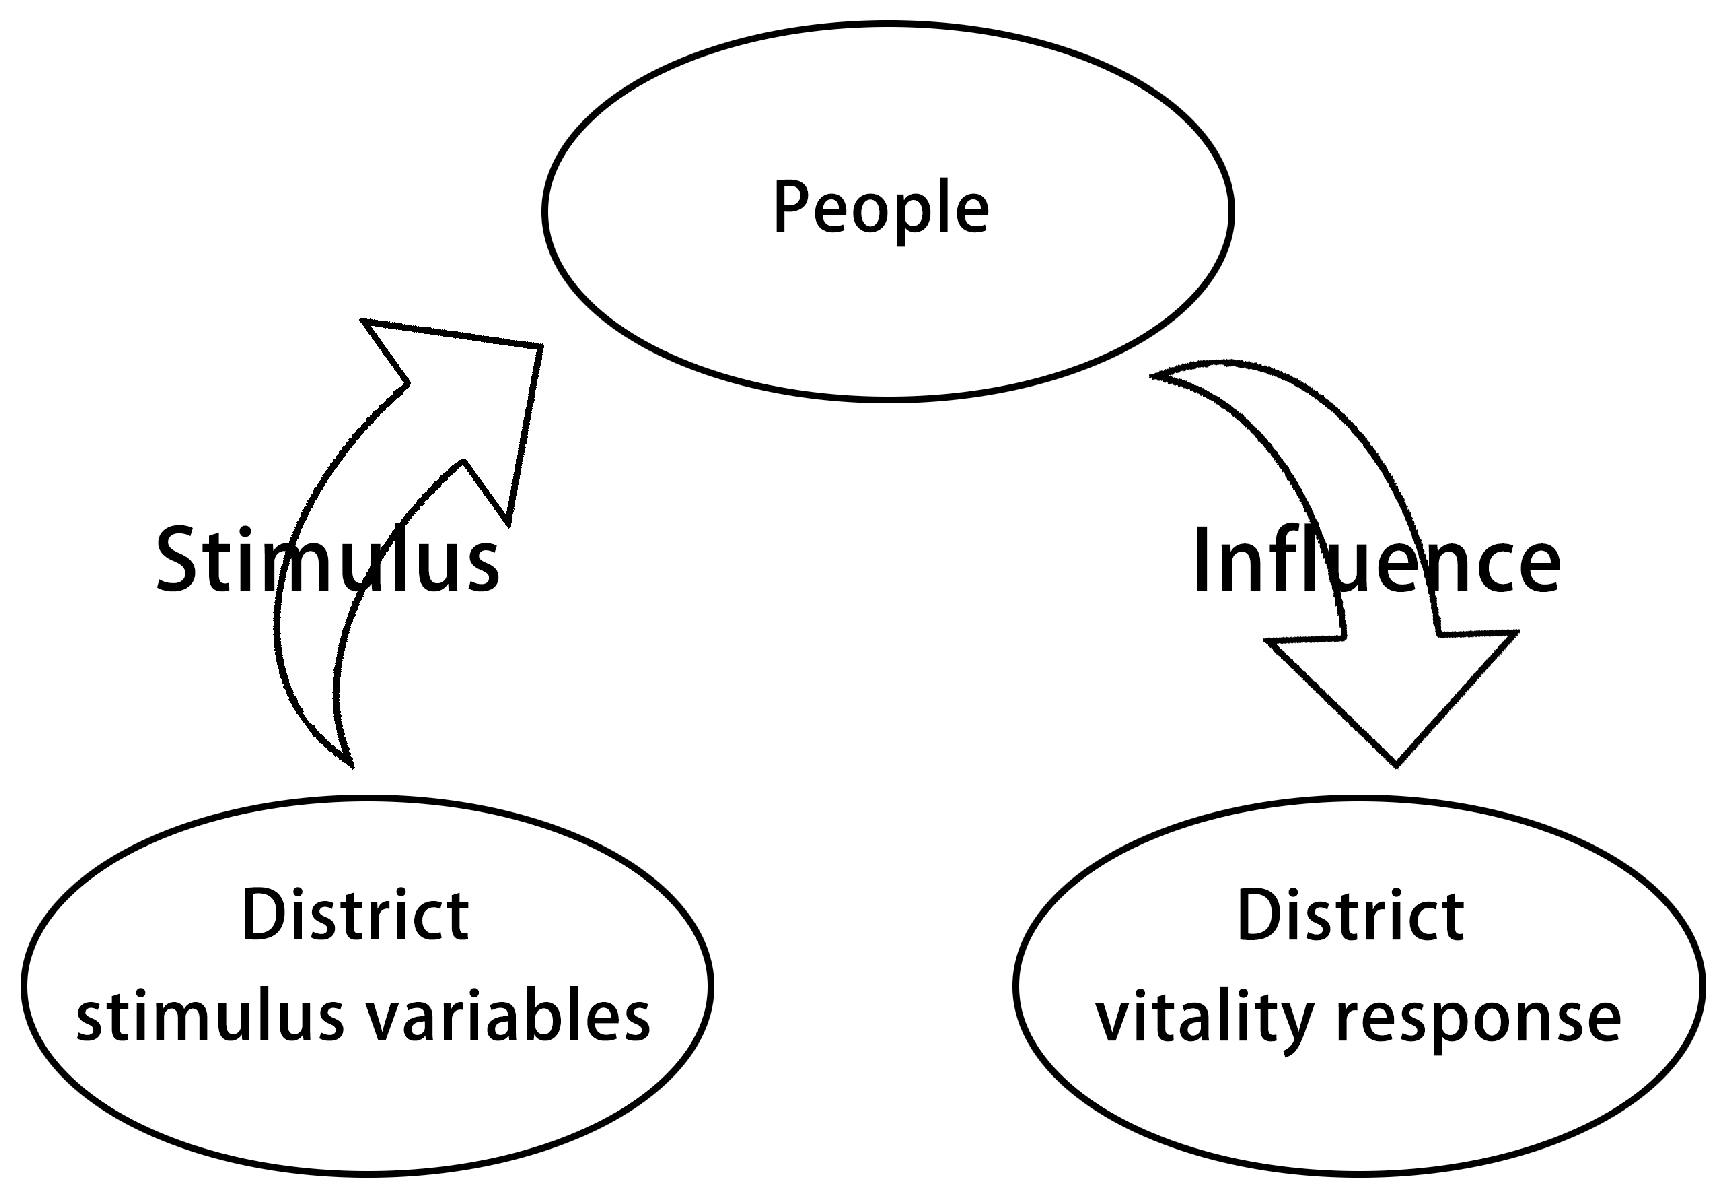
17]. These factors can be actively altered by human activities, so they are variable factors. These variable factors can also stimulate visitors’ psychological behaviors and comfort levels, indirectly influencing their choices regarding the district and, consequently, impacting the area’s vitality. Therefore, this paper attempts to incorporate the SOR theory model into the study of commercial district vitality, aiming to develop a “stimulus–organism–response” [
18] theoretical framework to explore the influencing factors of vitality. Within this framework, the stimulus can be represented by variables such as district morphology and green space coverage; the organism can be represented by variables related to visitors’ behavior, psychology, and comfort levels; and the response can be represented by pedestrian flow within the district. Thus, the theoretical framework can be conceptualized as “stimulus variables–organism variables–vitality response.” In this framework, the causal relationships among the stimulus, organism, and response are clear and logically coherent, allowing for an effective analysis of how variable factors stimulate pedestrian behavior, thereby influencing the vitality of commercial districts.
2.2. Definition and Assessment of Commercial District Vitality
2.2.1. Definition of Commercial District Vitality
Commercial district vitality refers to the level of dynamism and activity exhibited by a commercial area in terms of its economic, social, cultural, and environmental aspects [
19]. It reflects the attractiveness, competitiveness, and sustainability of a commercial district. Specifically, commercial district vitality typically involves several dimensions: economic vitality, social vitality, cultural vitality, and environmental vitality [
20]. Economic vitality is manifested in the frequency of commercial activities, the volume of sales, the diversity of business types, and the competitiveness of the market. Social vitality is reflected by the pedestrian flow, the diversity of visitors, and the interactions between residents and businesses within the district. Cultural vitality reflects the richness of cultural activities, the integration of traditional and modern cultures, and the historical and cultural values of the area. Lastly, environmental vitality is reflected in the aesthetic quality of the environment, the adequacy of public facilities, and the efforts made towards green space and ecological preservation.
2.2.2. Assessment Indicators of Commercial District Vitality
From a human-centered perspective, the vitality of commercial districts is primarily reflected in their social vitality. In the early 21st century, the famous architect Jan Gehl proposed that the overall social vitality of a spatial environment is determined by the number of participants and the duration of their stay in that space. Therefore, the external representation of commercial district vitality can typically be regarded as the quantity and frequency of social activities in which people engage within the district [
21]. Then, social vitality can be divided into two key indicators for study: pedestrian flow and types of activities. Given that the types of activities in commercial districts tend to be relatively fixed, the vitality of these areas can be effectively assessed by observing the density of crowds within the district [
22,
23].
The assessment of spatial vitality in commercial districts can be categorized into two levels: the intrinsic characteristics of the district itself and the surrounding environments [
24]. In terms of space vitality assessment indicators, Hamid Shirvanl from the United States has summarized six standard criteria: accessibility, descriptiveness, vistas, recognizability, perception, and livability. Meanwhile, Professor Guo Enzhang from China has proposed that a quality urban public space should have at least ten characteristics: recognizability, sociability, comfort, accessibility, safety, pleasure, harmony, diversity, cultural significance, and ecological sustainability. Based on the existing literature and the inherent characteristics of commercial streets [
24], this study proposes six assessment indicators—cultural attributes, environmental quality, spatial characteristics, accessibility, traffic safety, and functionality—to systematically evaluate the vitality of commercial districts. These indicators and their detailed factors are outlined below (see
Table 1). Specifically, cultural attributes encompass the cultural features and historical heritage of the commercial districts [
25]. Environmental quality includes elements such as street vegetation, ecological plants and organisms, landscaped miniatures, water features, and the visual accessibility of green spaces. Spatial characteristics refer primarily to the psychological effects that the district’s spatial scale exerts on individuals. Accessibility measures the convenience for pedestrians reaching the district, including the distribution and accessibility of public transportation stops. Traffic safety assesses the level of pedestrian–vehicle interaction, evaluating whether mixed-use traffic conditions pose risks to pedestrian safety. Lastly, functionality examines the overall quantity and spatial distribution of retail stores and other functional establishments throughout the commercial district.
3. Variable Factors and Analysis of Commercial District Vitality
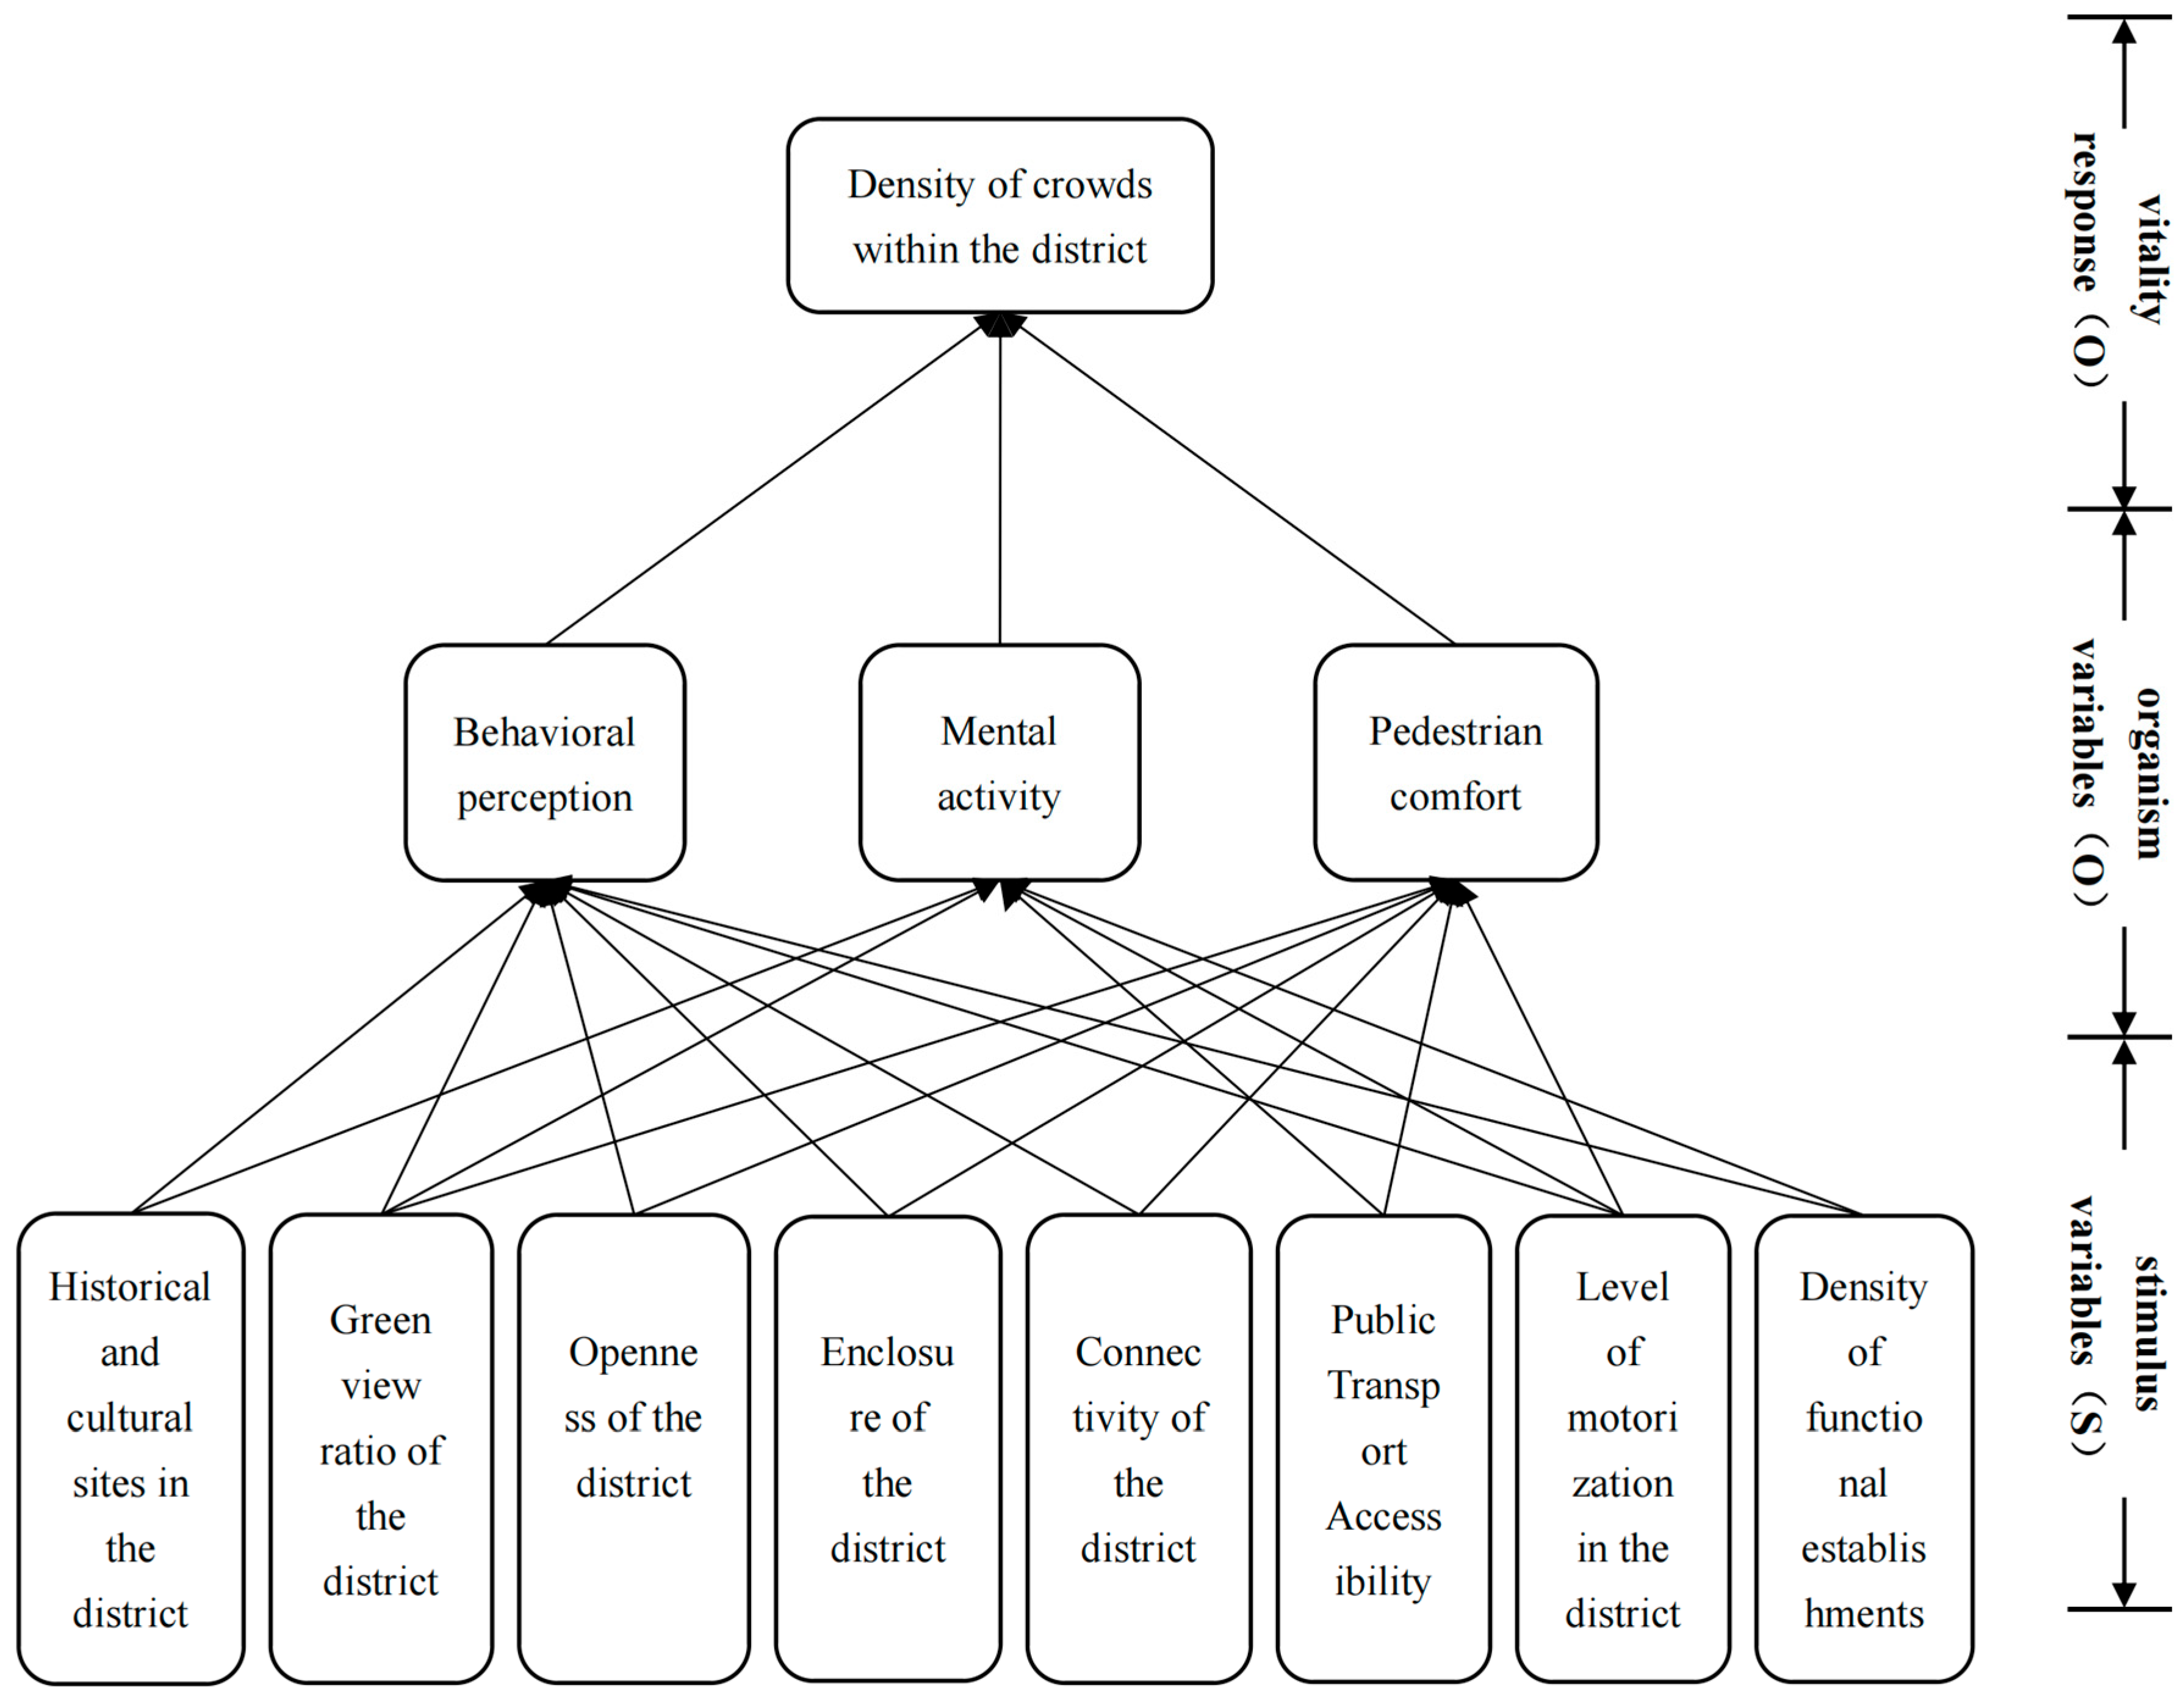
3.1. Establishment of SOR Model
The corresponding relationship model of stimulus variables, organism variables, and vitality responses in the variables affecting block vitality is shown in the figure below (see
Figure 1).
3.2. Research Sample
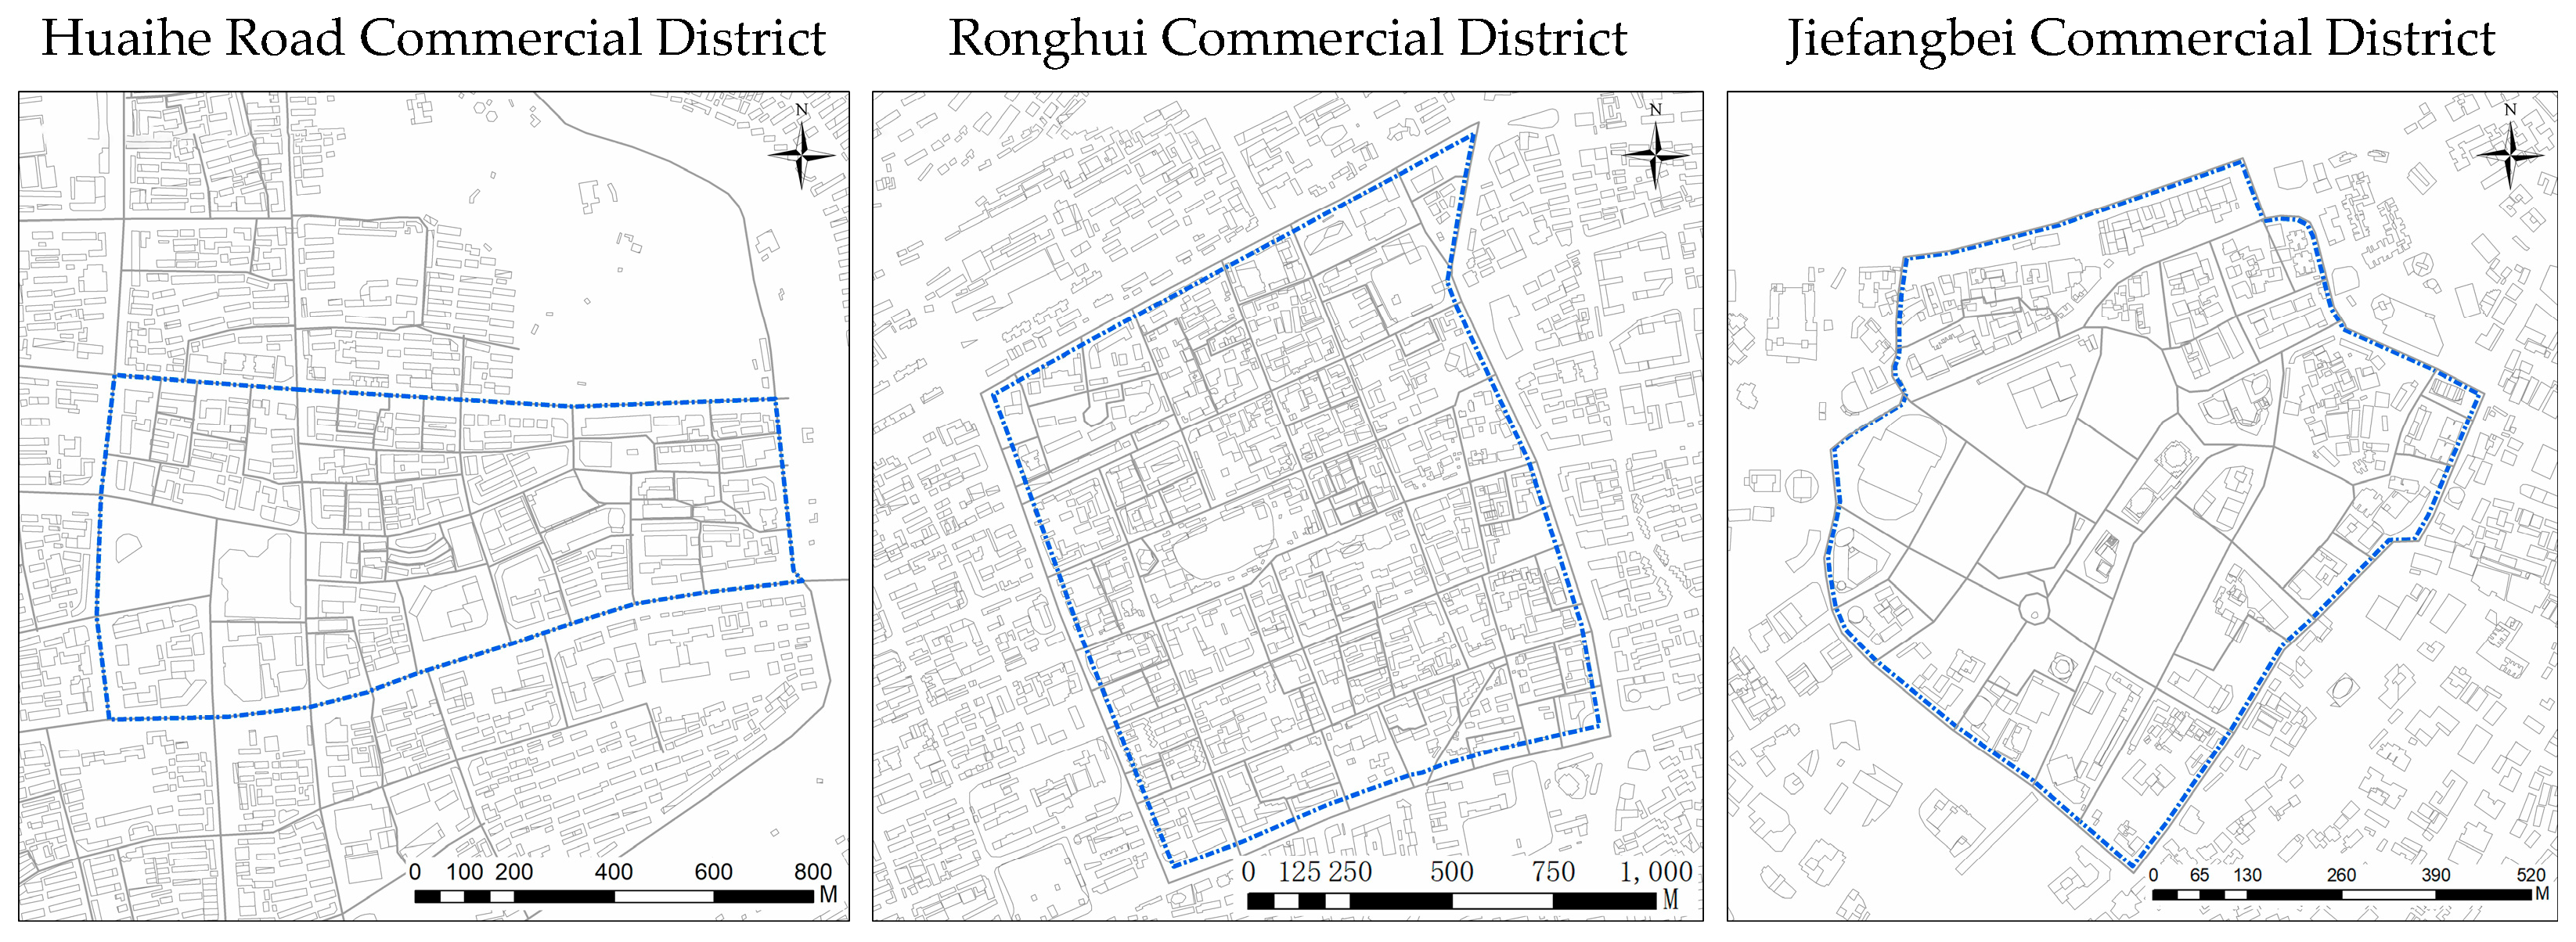
The Huaihe Road Commercial District in Hefei is a well-known area where historical architecture and modern businesses coexist harmoniously. Located in the Xiaoyaojin area of Luyang District, the commercial district covers approximately 59.63 hm2. The district’s boundaries stretch from Shouchun Road in the north to Yangtze River Middle Road in the south, as well as from Fuyang Road in the west to the Huancheng Park East Road in the east. The surrounding road network consists of the city’s main arteries, providing convenient urban transportation options. The district exudes a rich cultural and historical atmosphere, showcasing both the profound imprint of history and the vibrancy of contemporary life.
The Ronghui Commercial District is located at the junction of Shizhong District and Huaiyin District in Jinan City, covering a planned area of 140 hm2. It is situated in the core zone of Jinan’s port-style landscape and is characterized by its rich heritage of over a century of commercial culture. Guided by the development concept of “Revival and Beyond,” the commercial district aims to restore the historical appearance and prosperity of the commercial port from a century ago while integrating contemporary lifestyle elements. By blending culture, tourism, and commerce, it merges urban memories, cultural fragments, life scenes, and commercial spaces into a century-old commercial district that is both a stylish commercial street and a place for cultural heritage preservation, tourism, and commerce.
The Jiefangbei Commercial District is in the Yuzhong District of Chongqing. It serves dual functions of commerce and trade. The research area extends from Jialing Riverside Road in the north to Xinhua Road in the south, and from Minzu Road in the east to Zhonghua Road in the west, with a planned area of 53.32 hm
2. This district features a landmark building, the Liberation Monument, which has undergone more than 70 years of transformation and has witnessed the historical rise and fall of the Chinese nation (see
Figure 2).
3.3. Analysis of Stimulus Variables
Cultural attributes represent a vital indicator for evaluating the factors influencing the vitality of commercial districts. Typically, the richer a district’s cultural attributes, the deeper its historical and cultural heritage. In this study, cultural attributes were assessed through field surveys and data collection of scenic landmarks as well as POI locations related to science, technology, and cultural services. Environmental quality can be quantitatively represented through indicators such as the green-view index (GVI) and openness. The green-view index is defined as the ratio of greenery-covered areas to the total visual area observed by pedestrians, whereas openness refers to the proportion of visible sky area within pedestrians’ horizontal field of vision. These two metrics generally exhibit an inverse relationship to some extent. Spatial characteristics also constitute a crucial indicator of a district’s vitality. Different spatial enclosure scales evoke varying emotional responses among pedestrians and may significantly influence their psychological comfort. In this study, we used an enclosure to assess spatial characteristics. Specifically, an enclosure is defined as the proportion of building facades and other structures within pedestrians’ horizontal visual fields. Notably, excessively high enclosure levels in streets or alleys may lead to reduced spatial comfort. Accessibility is a critical measure of how conveniently pedestrians can navigate within commercial districts, significantly affecting vitality. This study evaluates district accessibility through two specific dimensions: connectivity and public transportation accessibility. Connectivity refers to the extent of intersections among streets within the district, which is analyzed by retrieving road networks of the studied areas and employing space syntax methods. Meanwhile, public transportation accessibility is determined by examining the distribution of bus stops within commercial districts. Given the high pedestrian density typically found in commercial districts, traffic safety is another indispensable factor. In this research, traffic safety is assessed through motorization level, which is defined as the proportion of visually observable motor vehicles within pedestrians’ horizontal visual fields. A higher motorization level typically indicates lower pedestrian safety. Finally, functionality is regarded as the essence underpinning district vitality. This study utilizes the density of functional formats (POI density) to quantify functionality. According to the Classification and Encoding Standards of Geographic Information Points of Interest, commercial district functions can be categorized into 15 major types: catering services, scenic landmarks, public facilities, enterprises, shopping services, transportation services, financial and insurance services, science and cultural services, residential and commercial complexes, living services, indoor facilities, sports and leisure services, medical and healthcare services, governmental institutions and social organizations, and accommodation services. Data and imagery for these categories were collected using network API crawling and comprehensive on-site surveys.
3.3.1. Variables for the Huaihe Road Commercial District
Through field surveys and the collected streetscape images, data points were selected every 50 m along the street [
26]. For each selected point, vertical images were taken from four directions. Semantic segmentation [
17] tools were utilized to classify the content of each image into 150 categories. Based on the relevant factors, the area of specific categories within the images was quantified, and subsequent visualization was achieved using kernel density estimation methods.
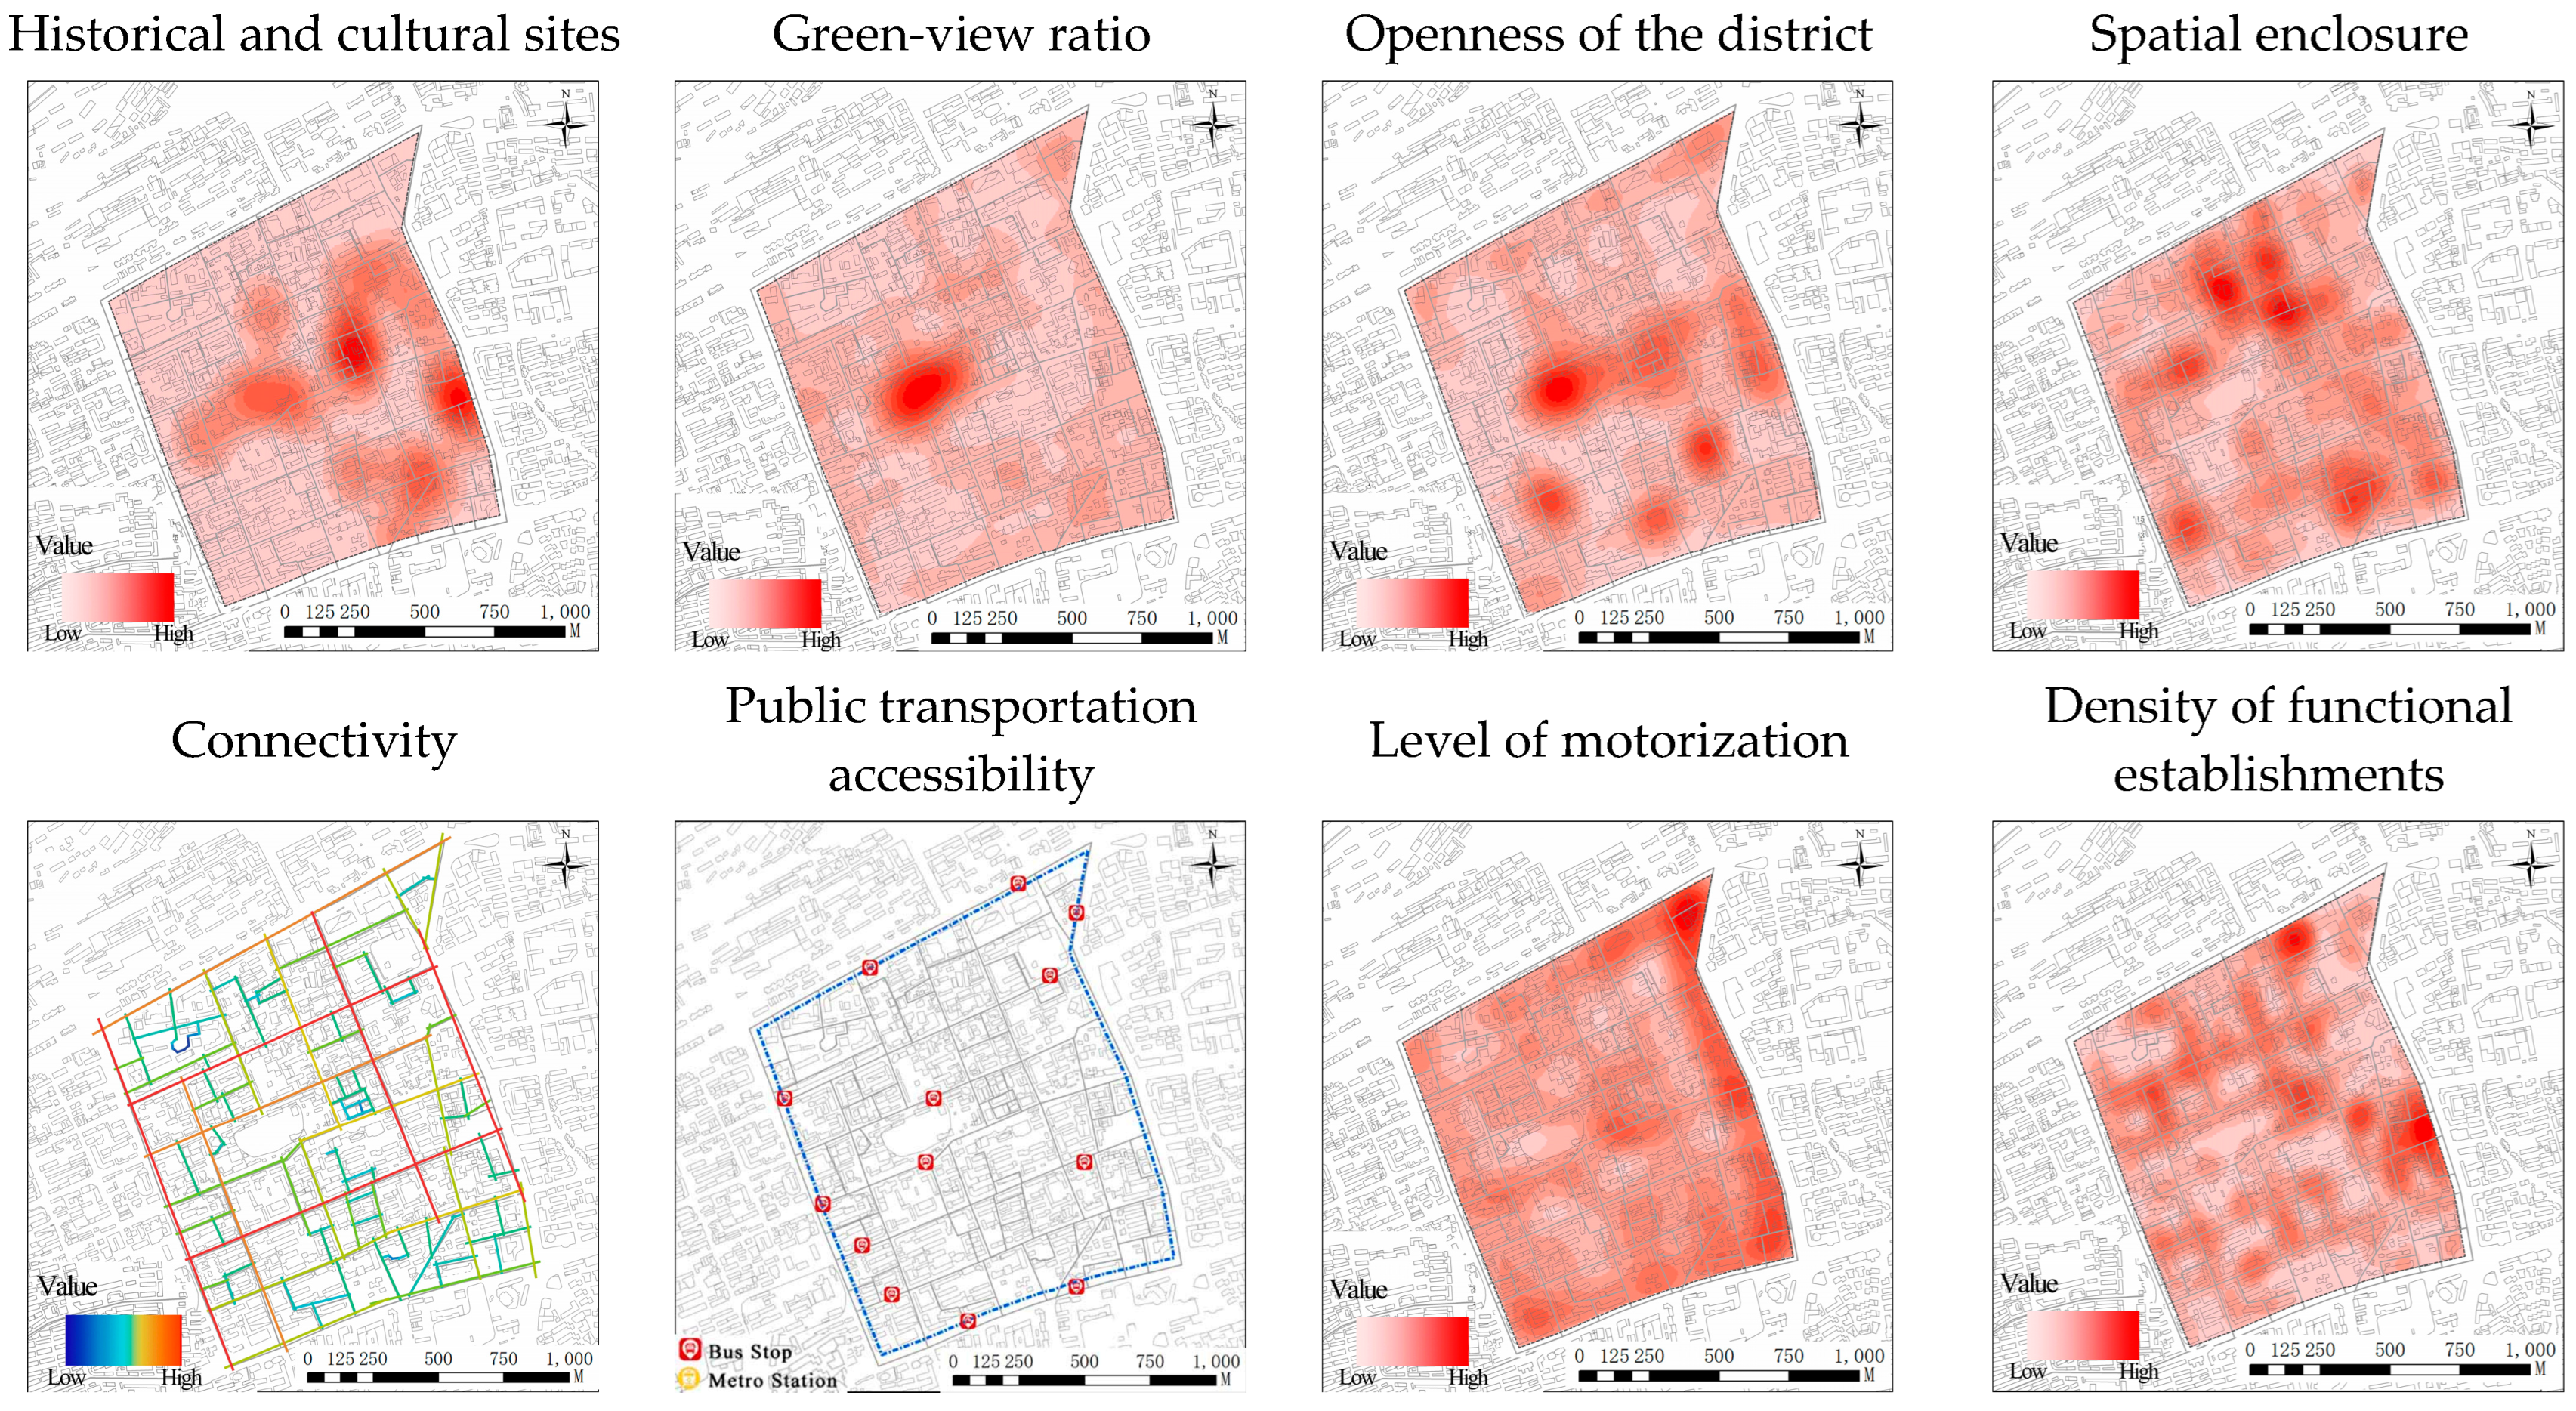
Taking the Huaihe Road Commercial District as an example (see
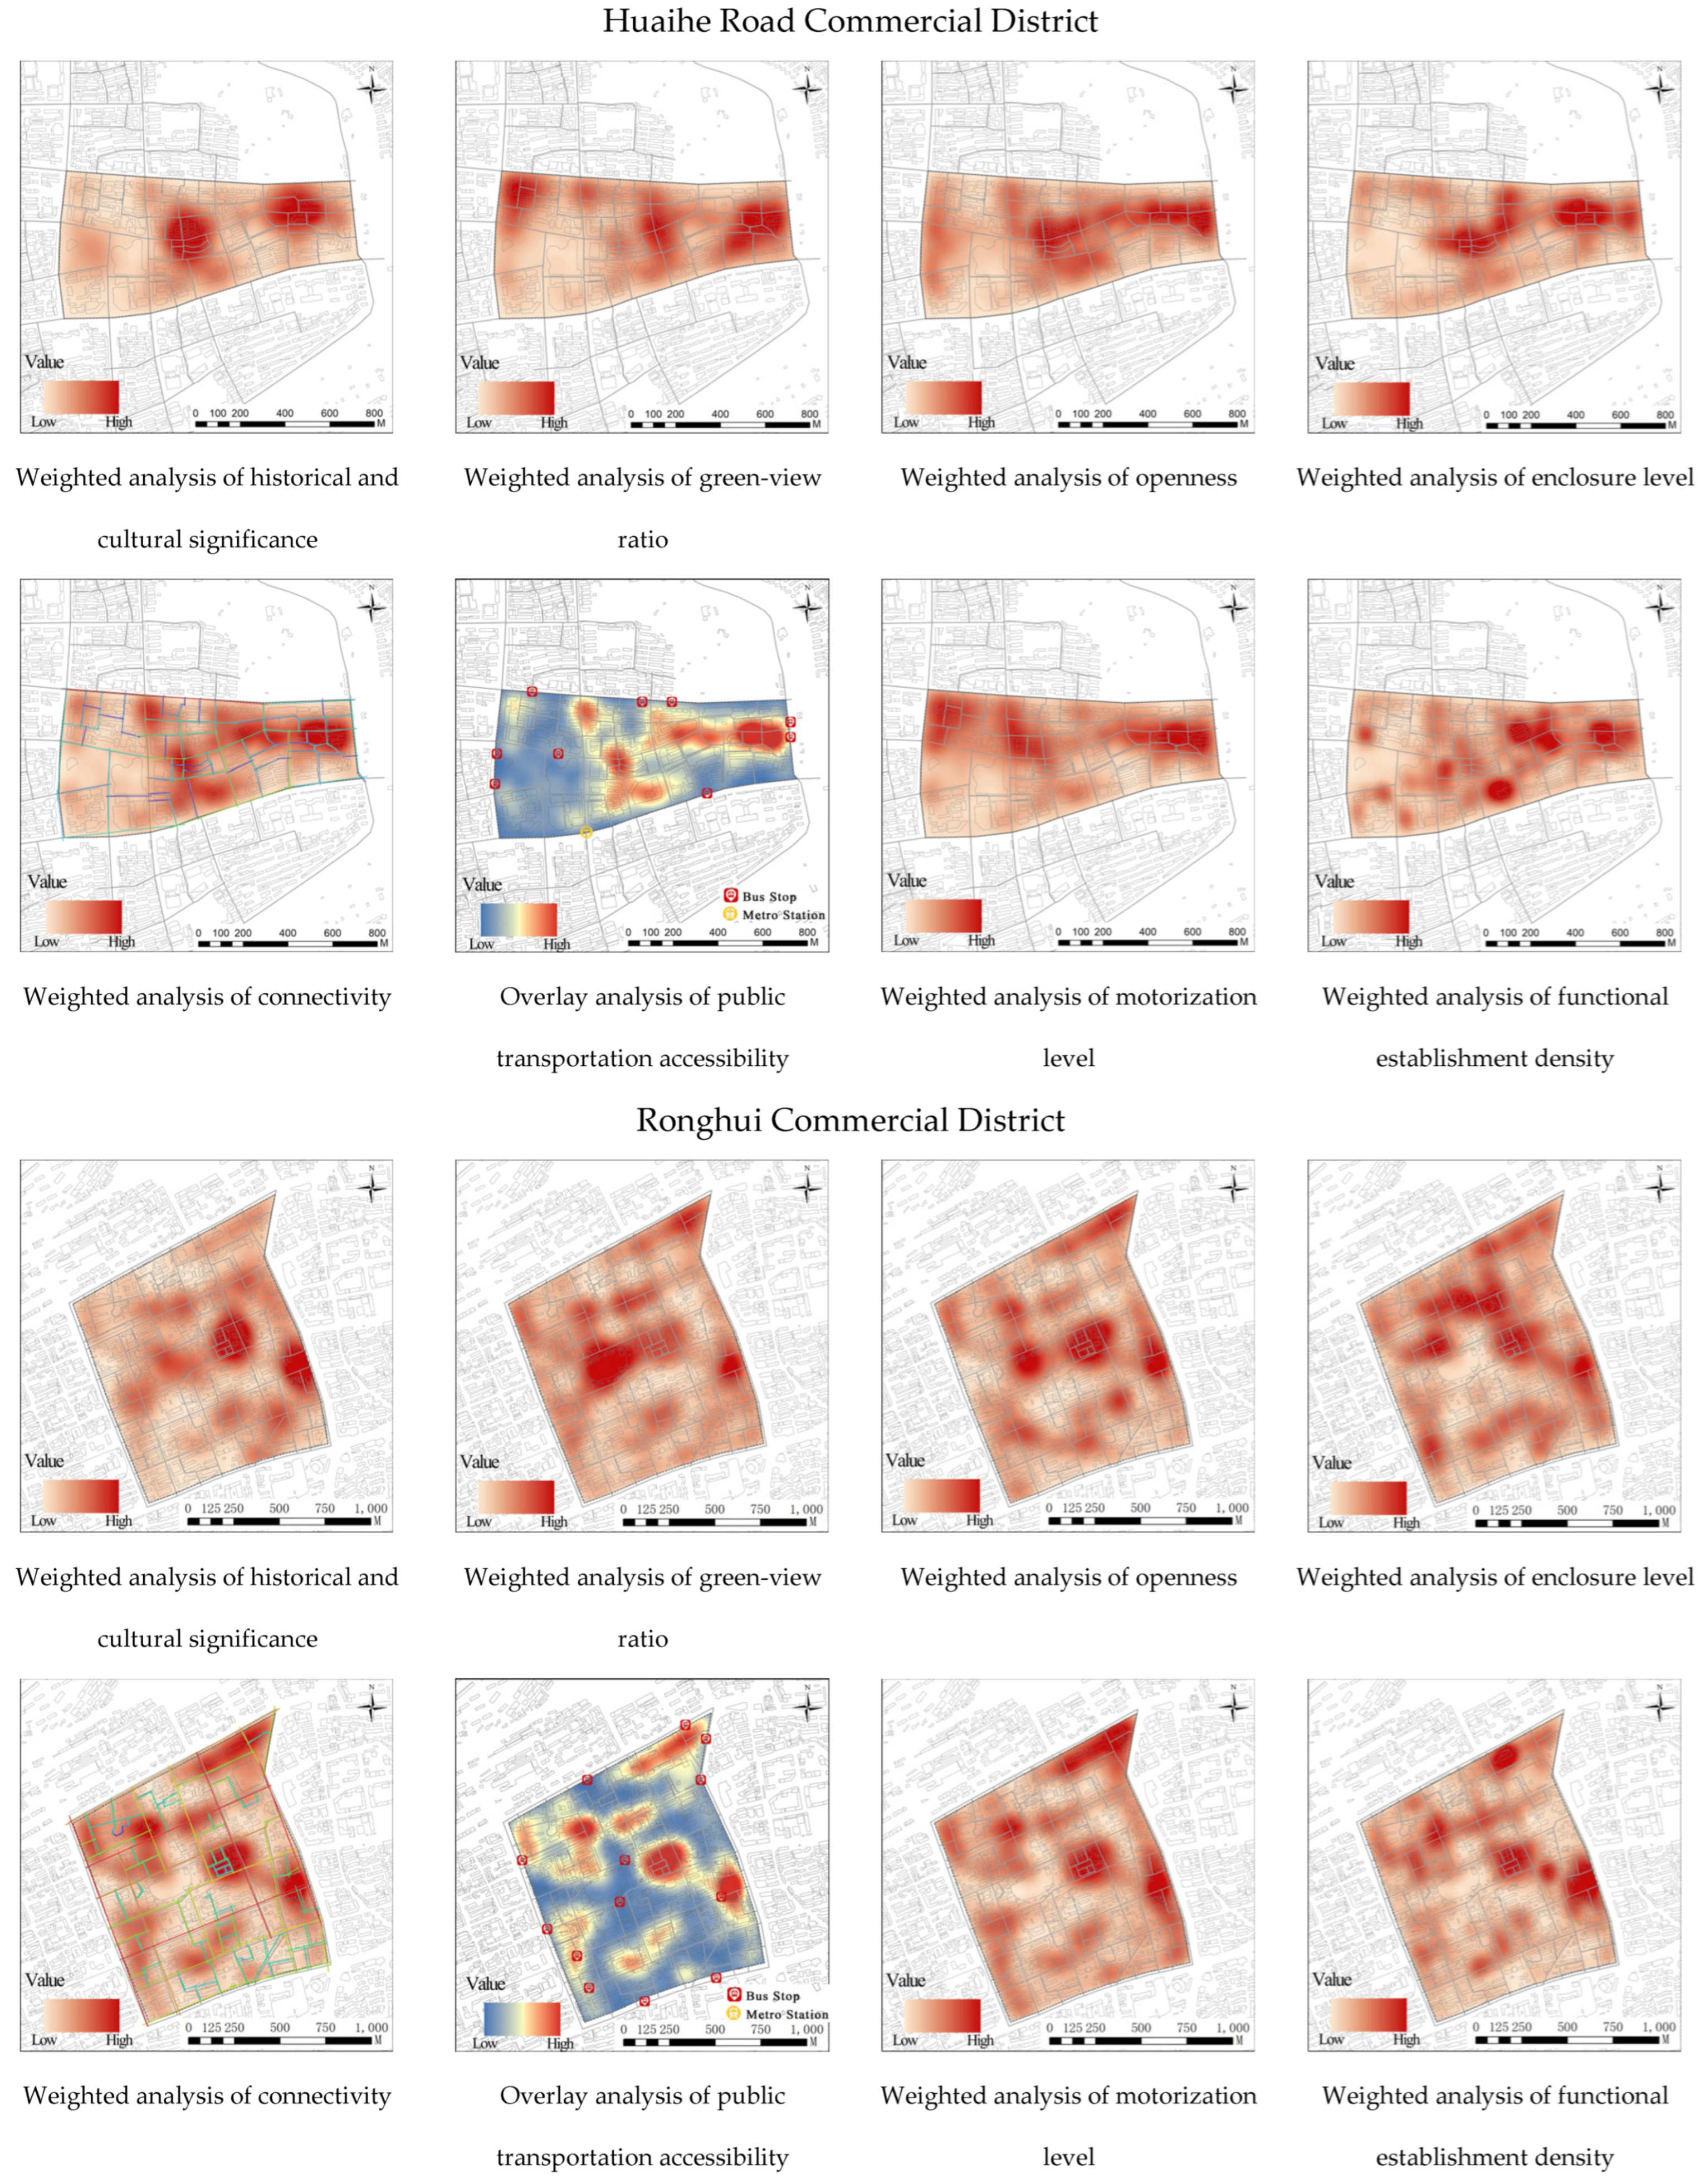
Table 2), a total of 15 cultural historical sites were identified as contributing to the district’s cultural significance. Key cultural locations, such as the Former Residence of Li Hongzhang and Mingjiao Temple, are primarily distributed along Huaihe Road. In terms of ecological greening, the areas around the intersection of Beihanshan Road and Huaihe Road, as well as near Shouchun Lane and Qindao Lane, exhibited a high green-view ratio of 51.9%. However, the visual rate of the sky within the district varied, with an average value of 19.86%, which was predominantly observed in the middle section and at both ends of Huaihe Road. Regarding spatial organization, densely enclosed areas were found in the middle segment of Huaihe Road and around Mingjiao Temple, with a high enclosure value of 83.72%. The accessibility of internal roads showed favorable connectivity, with streets such as Huaihe Road, Shouchun Road, and Suzhou Road providing convenient access. Public transportation stops are mainly distributed along the major roads surrounding the commercial district. Most motor vehicles were distributed around Shouchun Lane and Qindao Lane and in the vicinity of Suzhu Road, as well as the main Huaihe Road, yielding an average motorization level of 4.19%. The functional establishments in the commercial district appeared scattered, with concentrations near Gulou, the Yintai Center, the Pacific Shopping Center, and Haiya World. The predominant functions were retail and dining, which together constituted 58.83% of the offerings and were mostly distributed along both sides of Huaihe Road.
Using the data outlined above, a kernel density analysis was conducted within ArcGIS to produce the corresponding visual images for the variable factors of the district (see
Figure 3). Based on these images, the levels of the different variable factors within the district can be observed. Areas shaded in darker colors, or those approaching warmer tones, indicate higher values for these factors, whereas lighter shades correspond to lower values. The images show that along the central east–west thoroughfare of Huaihe Road, the distribution of various factors is relatively high on both sides of the street, except for the connectivity that is around the median value.
3.3.2. Variable Factors of the Ronghui Commercial District
The Ronghui Commercial District in Jinan City exhibits a wide distribution of historical and cultural sites, with a total of 18 such units. Notable locations include the Former Residence of Zhang Caicheng, the Defu Foreign Firm, the Christian Church on Jingsi Road, and Daguanyuan Garden. Ecological greening levels are particularly high in the Zhongshan Park area, reaching 61.98%. The distribution of street trees along other roads is relatively uniform, with an approximate green-view ratio of 26.59%. The openness within key areas of the district, including Zhongshan Park and Daguanyuan Garden, is favorable, with a maximum value of 49.98%. The district lacks high-rise buildings, predominantly featuring multi-story structures. This results in a high building density, particularly around the intersection of Jinger Road and Weisi Road, where the spatial enclosure is notably intense. Consequently, the enclosure metric exhibits a maximum value of 80.81%, with an average value of only 26.73%. Both Jinger Road and Jingwu Road intersect numerous other roads, demonstrating good connectivity and running through the entire district from east to west. Public transportation stops are mainly distributed along the major roads both around and within the commercial district, while there are relatively few stops in the core area of the old commercial hub. The level of motorization is primarily concentrated near Jingqi Road and Weier Road; additionally, there is a notable presence of motor vehicles around the Yinggong Building and the core area of the district, resulting in an average motorization level of 4.98% (see
Table 3).
The kernel density map provides insights into the distribution of various indicators across the Ronghui Commercial District (see
Figure 4). The data indicates a pronounced tendency for these indicators to cluster towards the northeastern part of the district. Notably, areas with higher values are concentrated around the core of the district and near Zhongshan Park. The green-view ratio is relatively high in Zhongshan Park and the regions surrounding it. Functional establishments primarily distribute along the roadways, with certain concentrations in the core area of the district, Daguanyuan Garden, and the vicinity of the Pearl International Business Port.
3.3.3. Variable Factors of Jiefangbei Commercial District
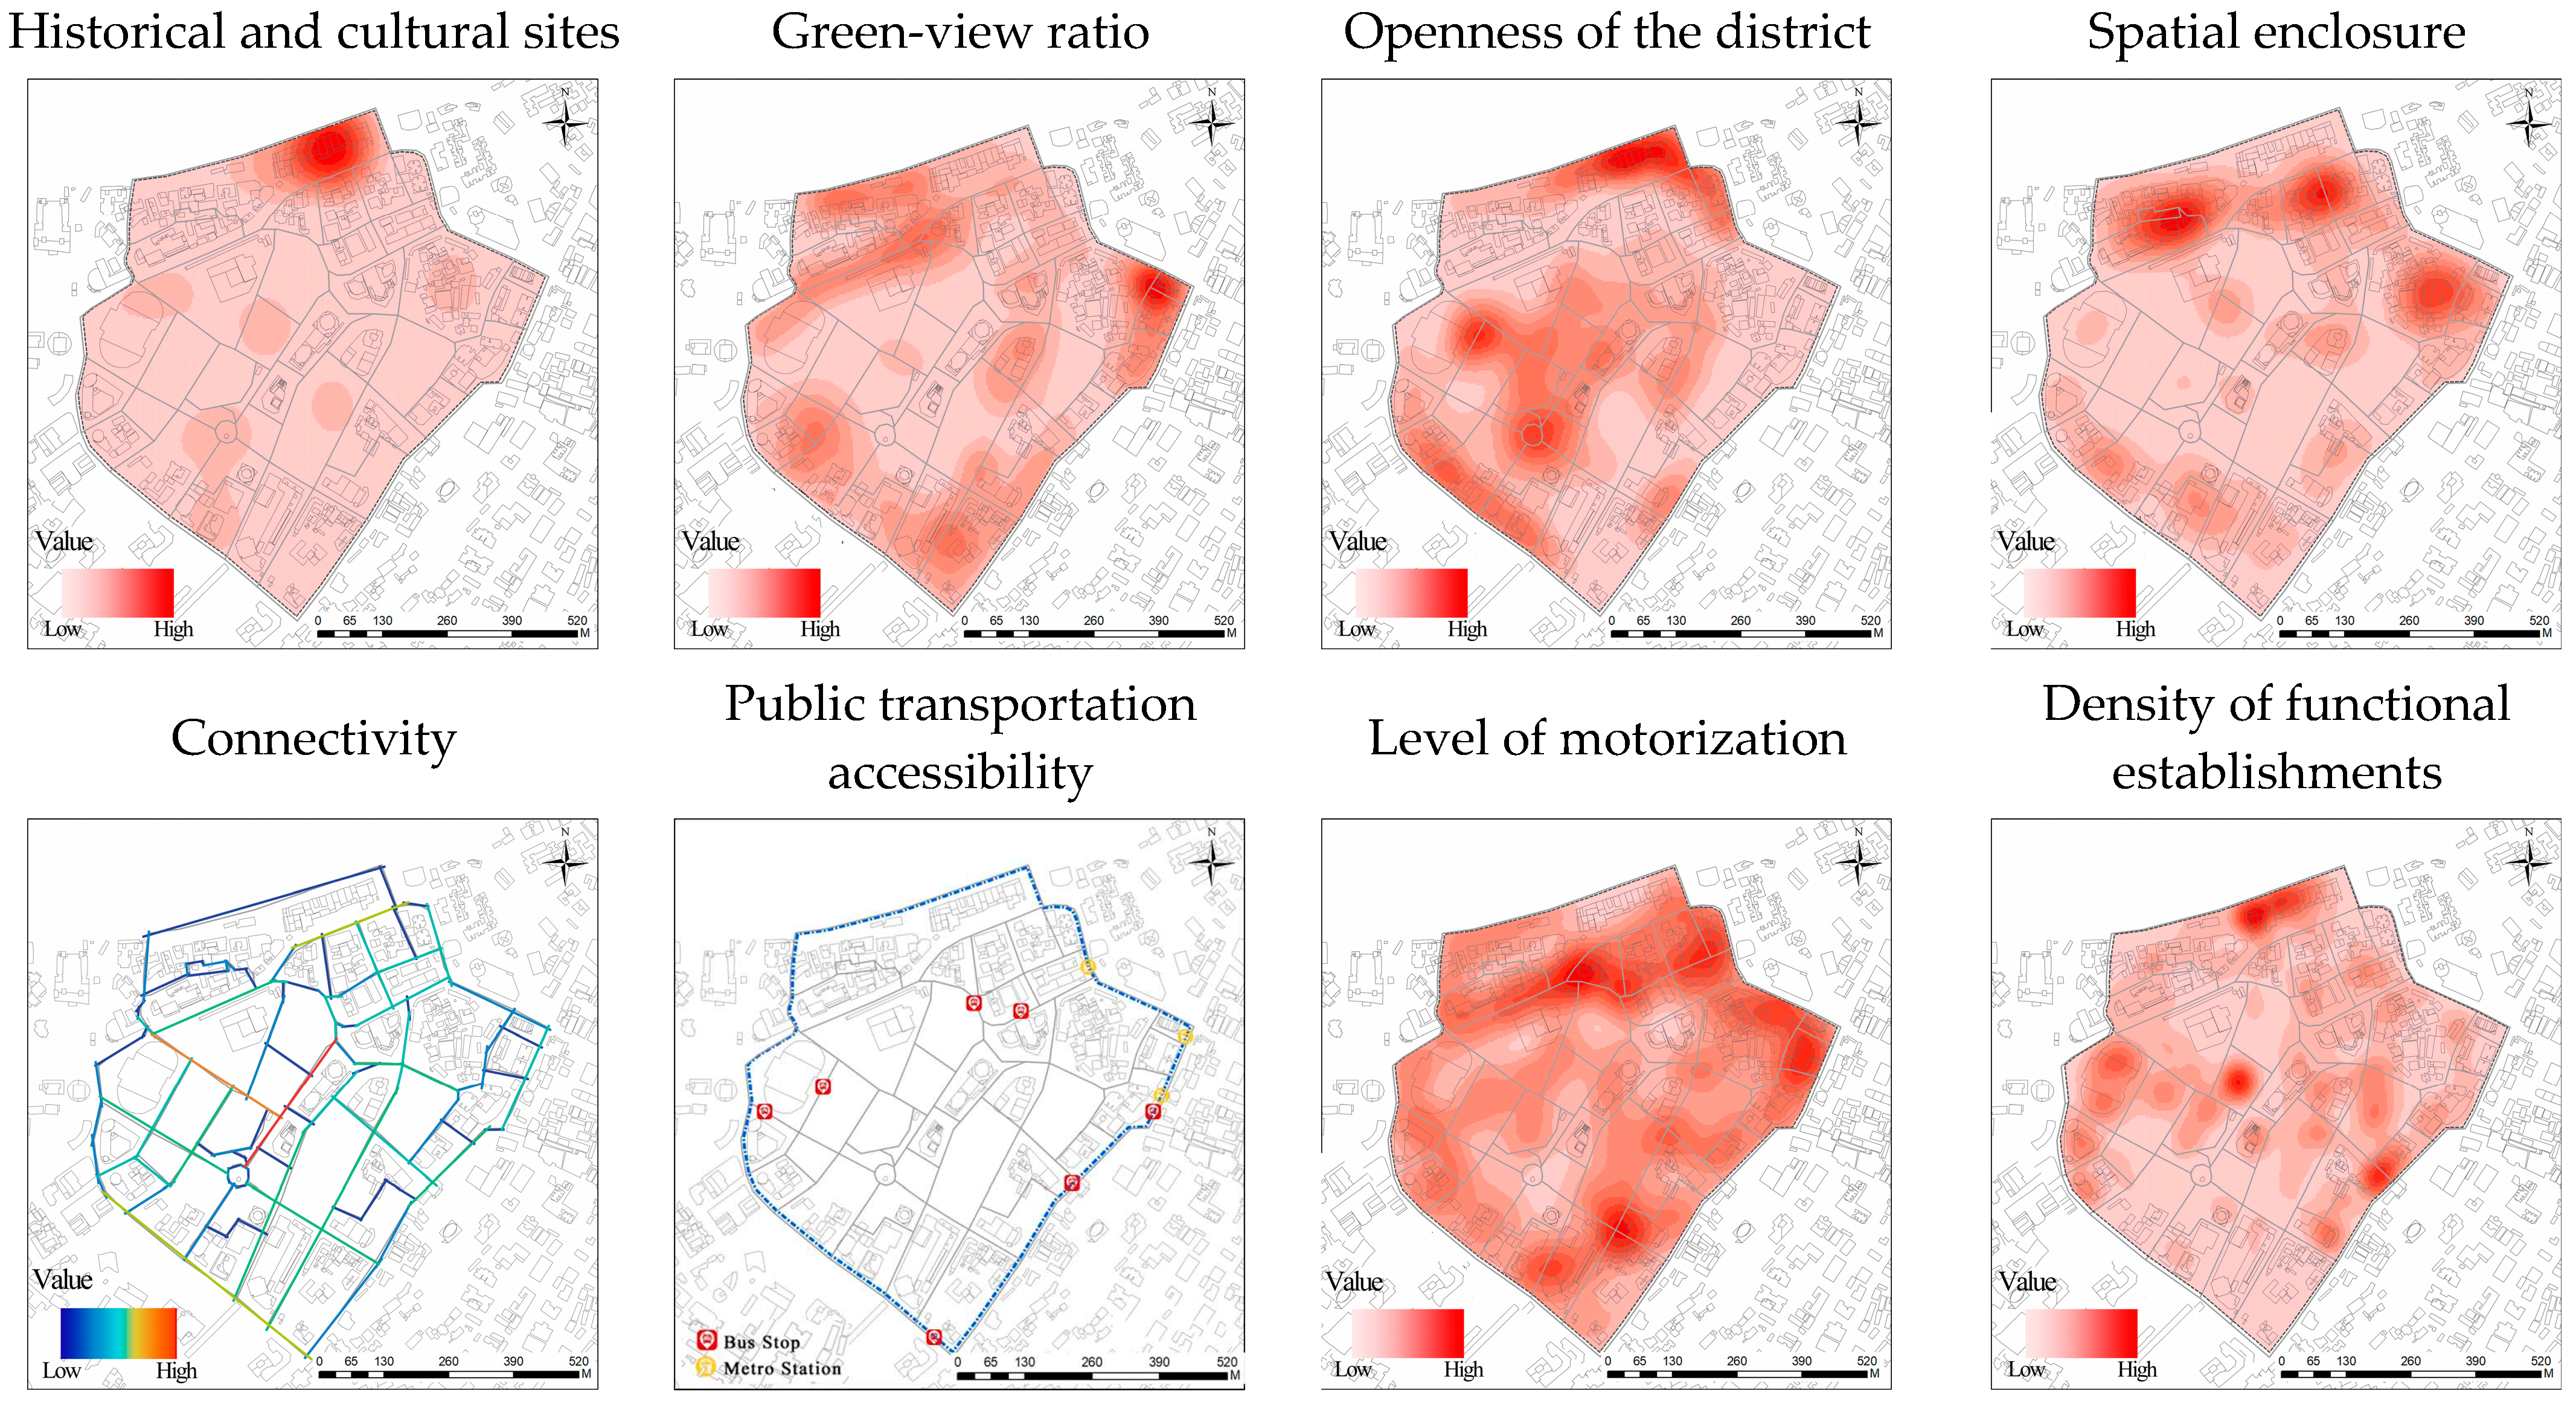
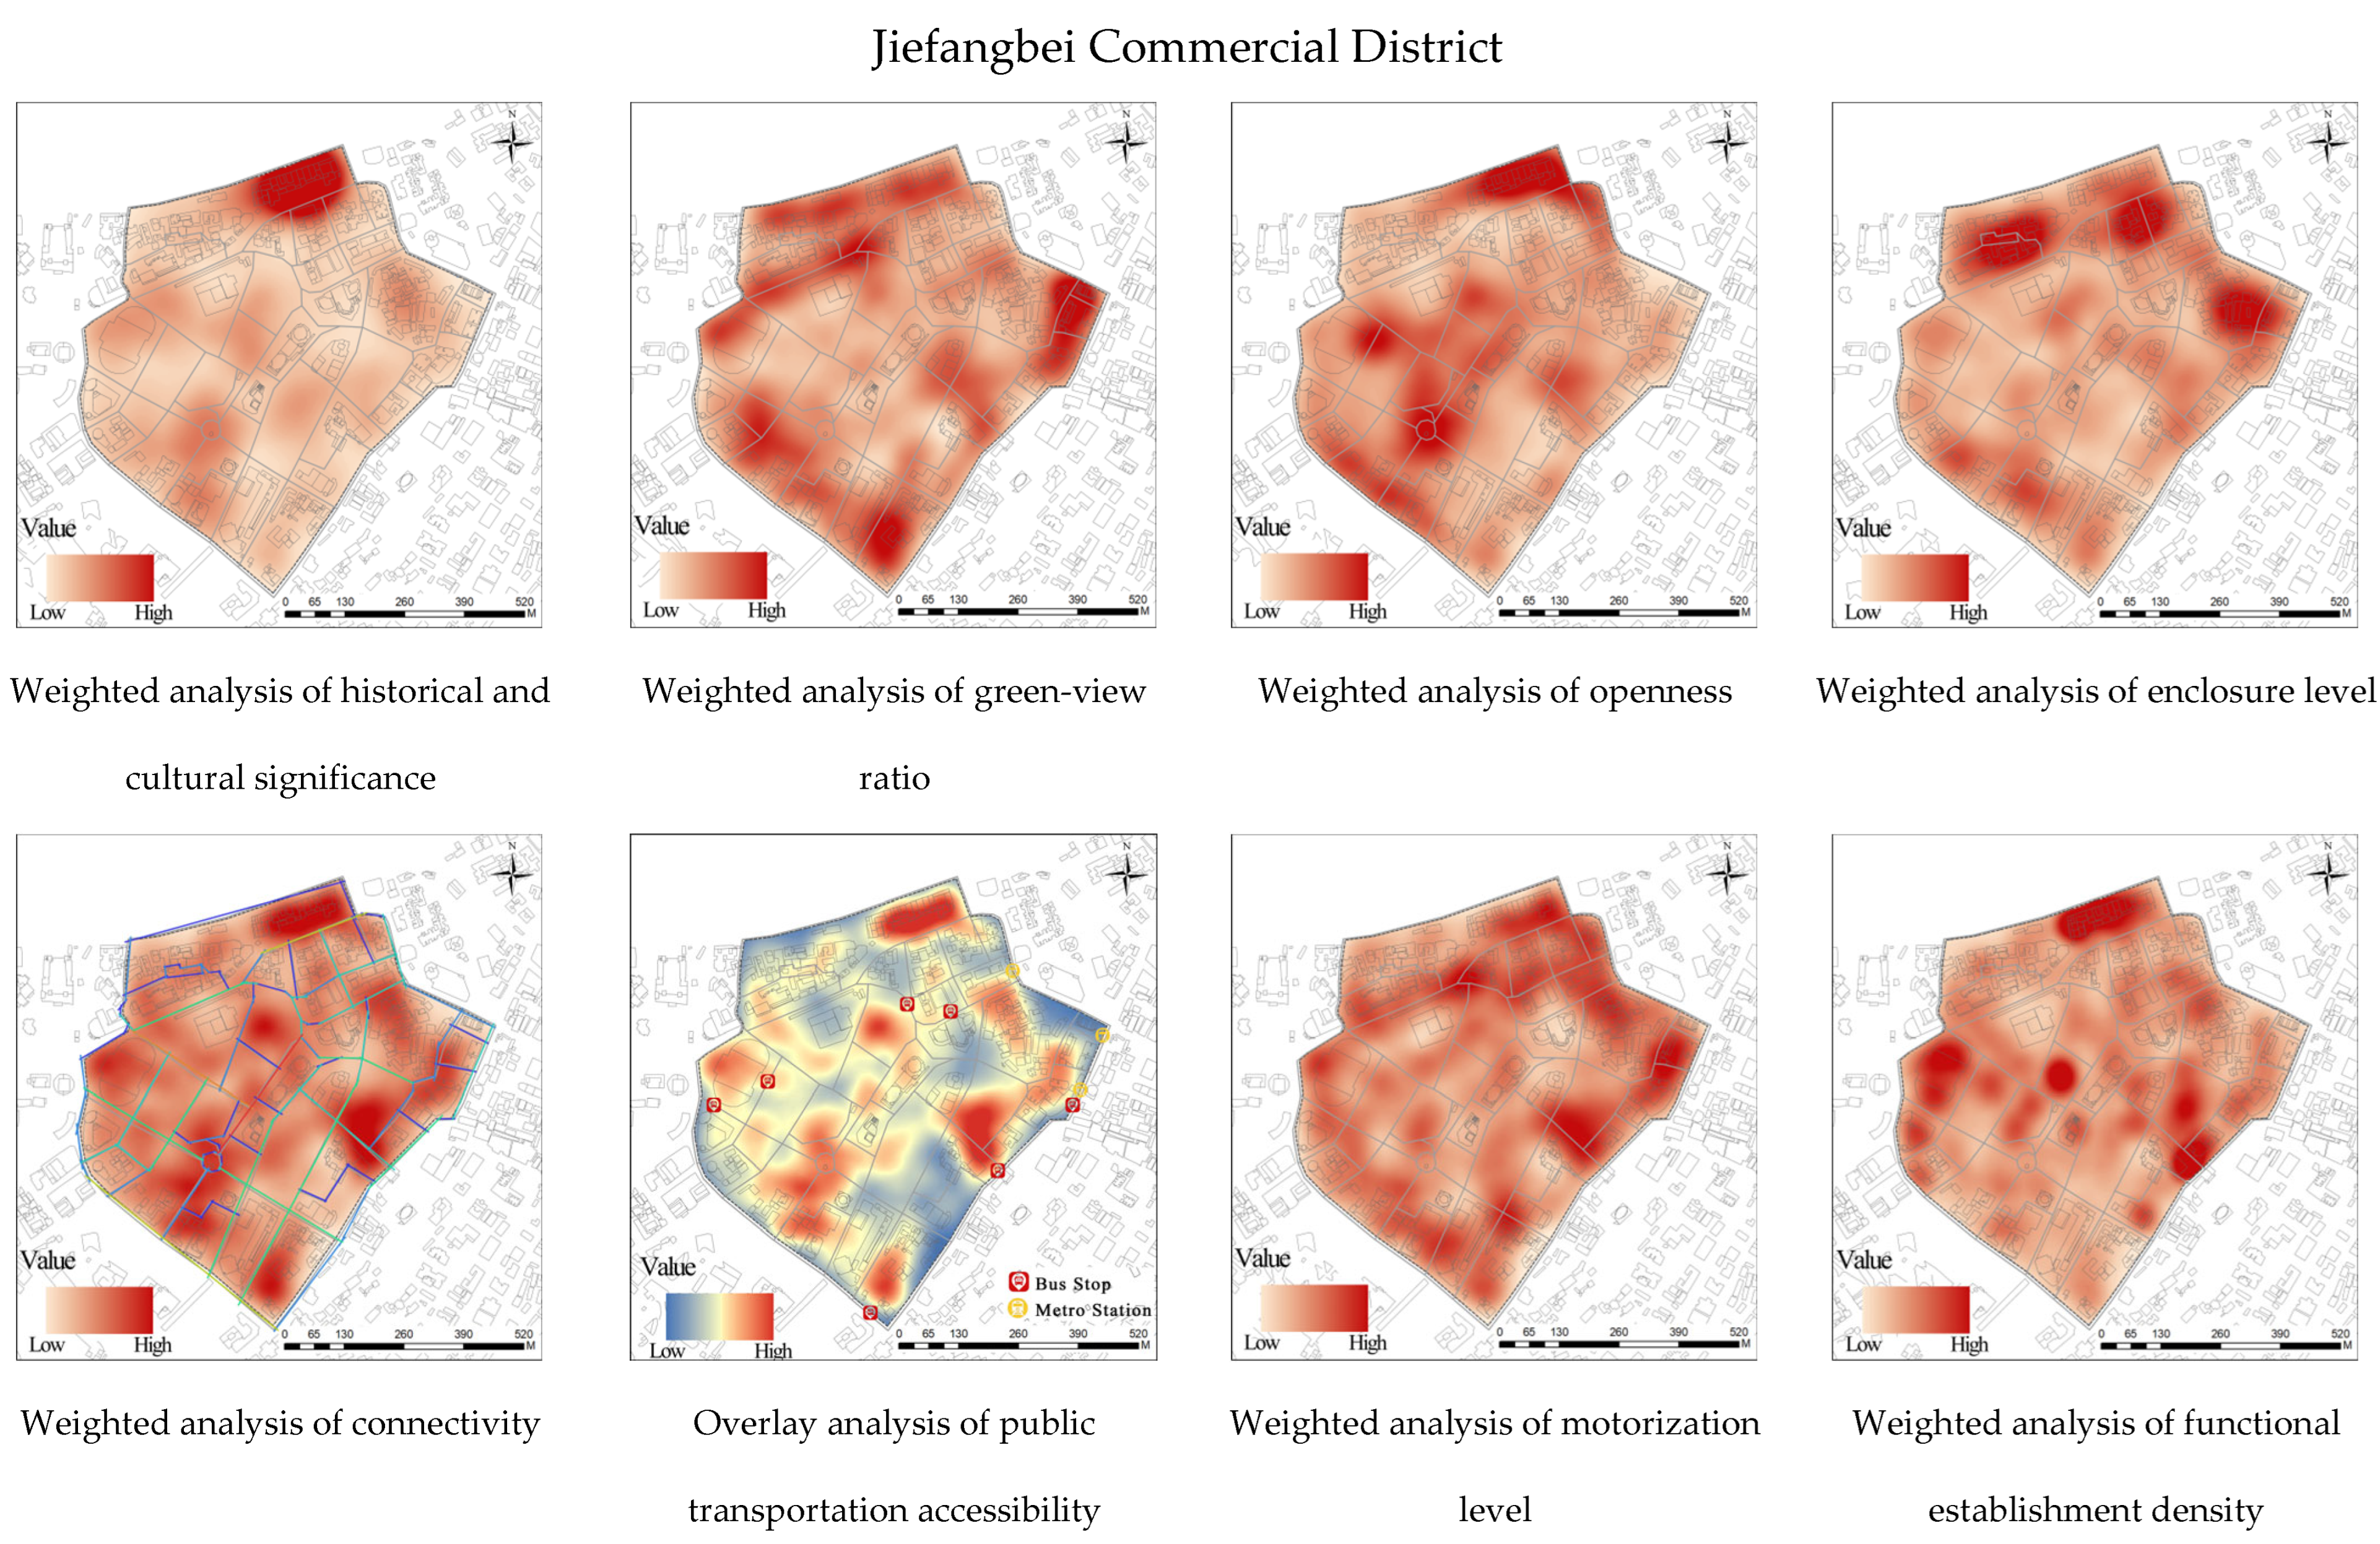
The Jiefangbei Commercial District in Chongqing, characterized by a strong atmosphere of historical significance, is home to numerous cultural heritage sites, totaling 34 historical units. In addition to the central landmark of the Liberation Monument, most of the other sites are located near Hongyadong. However, due to the high density of buildings within the district, both the ecological green-view ratio and the openness are generally low. The areas with higher green coverage are found northwest of Xiaoshizhi, reaching a rate of 51.28%, and the ecological conditions around the Hongyamen underground passage are also relatively good. The street openness is notably higher along the banks of the Jialing River and around the Liberation Monument, with a maximum value of 43.28%. The district has a considerable number of high-rise buildings, resulting in a generally higher enclosure level compared to the previous two districts, with an average value of 38.55%. Within the district, Minzu Road directly connects to the Liberation Monument, contributing to its high accessibility. Public transportation stops are mainly distributed around the perimeter of the district. The level of motorization in the Jiefangbei Commercial District is significantly higher than in the other two districts, displaying a distribution pattern along the roads, with a maximum value of 22.46%. The density of functional activities is notably high near Hongyadong, the WFC Global Financial Shopping Center, and the Yalan International Building. Furthermore, the proportion of public facilities within the entire district stands at 4.11%, which is significantly higher than the combined total of the other two districts (see
Table 4).
The indicators for the Jiefangbei Commercial District differ slightly from those of the previously discussed districts (see
Figure 5). Aside from the historical and cultural sites, the distribution of other indicators is relatively uniform in the district. The historical and cultural sites are primarily concentrated around Hongyadong. The motorization level within the district is notably high and is characterized by dense traffic and good accessibility. However, in comparison to the previous two districts, the green-view ratio in the Jiefangbei District is relatively low.
Based on the above analysis and research findings, a comparative integration of the average values of various variable factors was conducted (see
Table 5).
3.4. Analysis of Organism Variables
For a commercial district to thrive, it requires active engagement and interaction among its inhabitants. The district is composed of various elements, including streets, buildings, cultural and historical sites, green spaces, and diverse functional establishments. These stimulating variables play a crucial role in attracting individuals and influencing their behavioral responses (see
Figure 6), which in turn fosters more communication and engagement, thereby enhancing the vitality of the district.
Research findings indicate that the cultural landscape, the design layout of the streets, and other characteristics of different types of districts can significantly impact people’s psychological behaviors and perceptions of comfort. Commonly, individuals perceive factors such as the level of greening, openness of the district, the sense of enclosure provided by streets and alleys, the connectivity between various roads, and the volume of motor vehicles on the streets as crucial determinants of their overall experience and comfort within the district. Therefore, the closer these indicators agree with individuals’ satisfaction levels, the more popular the area becomes. In terms of psychological impact, cultural and historical significance, green coverage, safety, motorization levels, and the density of various functional establishments greatly influence people’s psychological preferences. When choosing destinations, individuals naturally prefer locations that are cooler and safer. For those who appreciate history and culture, districts with rich cultural heritage become a priority, while shoppers tend to favor areas rich in diverse commercial offerings. Therefore, these factors initially stimulate individuals’ psychological responses prior to visiting, indirectly affecting the vitality of the district. All these factors impact pedestrians within the district, stimulating their behavioral perceptions, which in turn indirectly influence the vitality of the district. Therefore, the importance of organism variables in a district is evident. Human engagement with various stimuli within the district reflects the level of vitality experienced there. Thus, in researching district vitality, humans play an indispensable role in bridging various components.
3.5. Analysis of District Vitality Response
In assessing the response of district vitality, population density serves as the most direct indicator of a district’s vitality. The following analysis utilizes data collected from the Baidu API heatmap throughout the day (see
Figure 7), which has been averaged to generate a daily average heatmap. The research data spans from 8:00 AM to 10:00 PM on 14 August 2024, with measurements taken every hour to ensure accuracy, resulting in the findings below. As shown in the figure, the color gradient transitions from cool to warm tones; cooler colors indicate lower average daily population density, while warmer colors signify higher population density and, consequently, greater district vitality.
In the case of the Huaihe Road Commercial District, the areas with higher average daily heatmap values are linear along the Huaihe River, particularly around the densely populated Yintai Center and in its vicinity, which is characterized by a high pedestrian flow and vitality. Similarly, the Ronghui Commercial District shows elevated daily average heatmap values concentrated in the core area of the old commercial port, Daguanyuan Garden, and the Mingzhu International Business Port, reflecting a similar density distribution of functional establishments. In contrast, the overall distribution of the Jiefangbei Commercial District is relatively uniform. The daily average heatmap indicates that Hongyadong exhibits the highest heatmap value, followed by areas surrounding the Liberation Monument, the Yalan International Building, the Hengda Center, and the WFC Global Financial Shopping Center. This distribution effectively covers regions with a high density of functional activities.
4. Impact of Variable Factors on the Vitality of Commercial Districts
4.1. Influence of Variable Factors on District Vitality
4.1.1. Weighted Overlay Analysis of Variable Factors
Following the analysis of the distribution of various influencing factors, it became evident that, due to the use of the average value method across multiple datasets for the study of vitality, a visual representation of these results could not be easily presented. Therefore, conventional correlation analysis methods were employed to investigate the extent of the influence of these factors on the district’s vitality. However, this approach only allowed for numerical analysis and did not provide a clear understanding of the varying degrees of impact from the different influencing factors. To address this, the study utilized the Geographically Weighted Regression (GWR) module available in ArcGIS for analysis. Compared with traditional correlation regression analysis, GWR offers significant advantages [
27]. The research indicated that when the vitality value and the influencing factors were weighted in a ratio of 1:1, the accuracy of the weighted overlay analysis increased. For this reason, the analysis was performed by conducting a 1:1 weighted overlay with crowd density data and seven categories of stimulus variables. This approach allows for the observation of the effect of each variable factor on crowd density, as illustrated in
Figure 8. If two factors exhibit high numerical values in the same location, the overlay will show deeper colors; conversely, if one factor has a high value while the other is lower, the colors will reflect the average value of both factors due to the equal weighting. As illustrated in
Figure 8, the areas with higher values indicate a higher degree of overlap between the variable factor value and the crowd density value. Since a 1:1 weighted overlay was implemented, it ensures that neither side disproportionately influences the value range results of the other factor.
4.1.2. Comparative Analysis of the Degree of Impact of Factors
It should be noted that the weighted overlay analysis presented above cannot sufficiently demonstrate whether the variable factors promote or inhibit the vitality of the district. Therefore, it is necessary to conduct a differentiated analysis by overlaying the weighted image data with the original image data of the seven variable factors. The image data for each variable factor was subjected to image differentiation processing with the corresponding weighted overlay image data, yielding the results below (see
Table 6). More differentiation indicates a greater discrepancy between the seven variable factors and the pedestrian traffic patterns within the district, suggesting a more significant impact of that factor on the district’s vitality. Consequently, based on this analysis, we can gain a clearer understanding of which of the studied variable factors positively influence the vitality of the district.
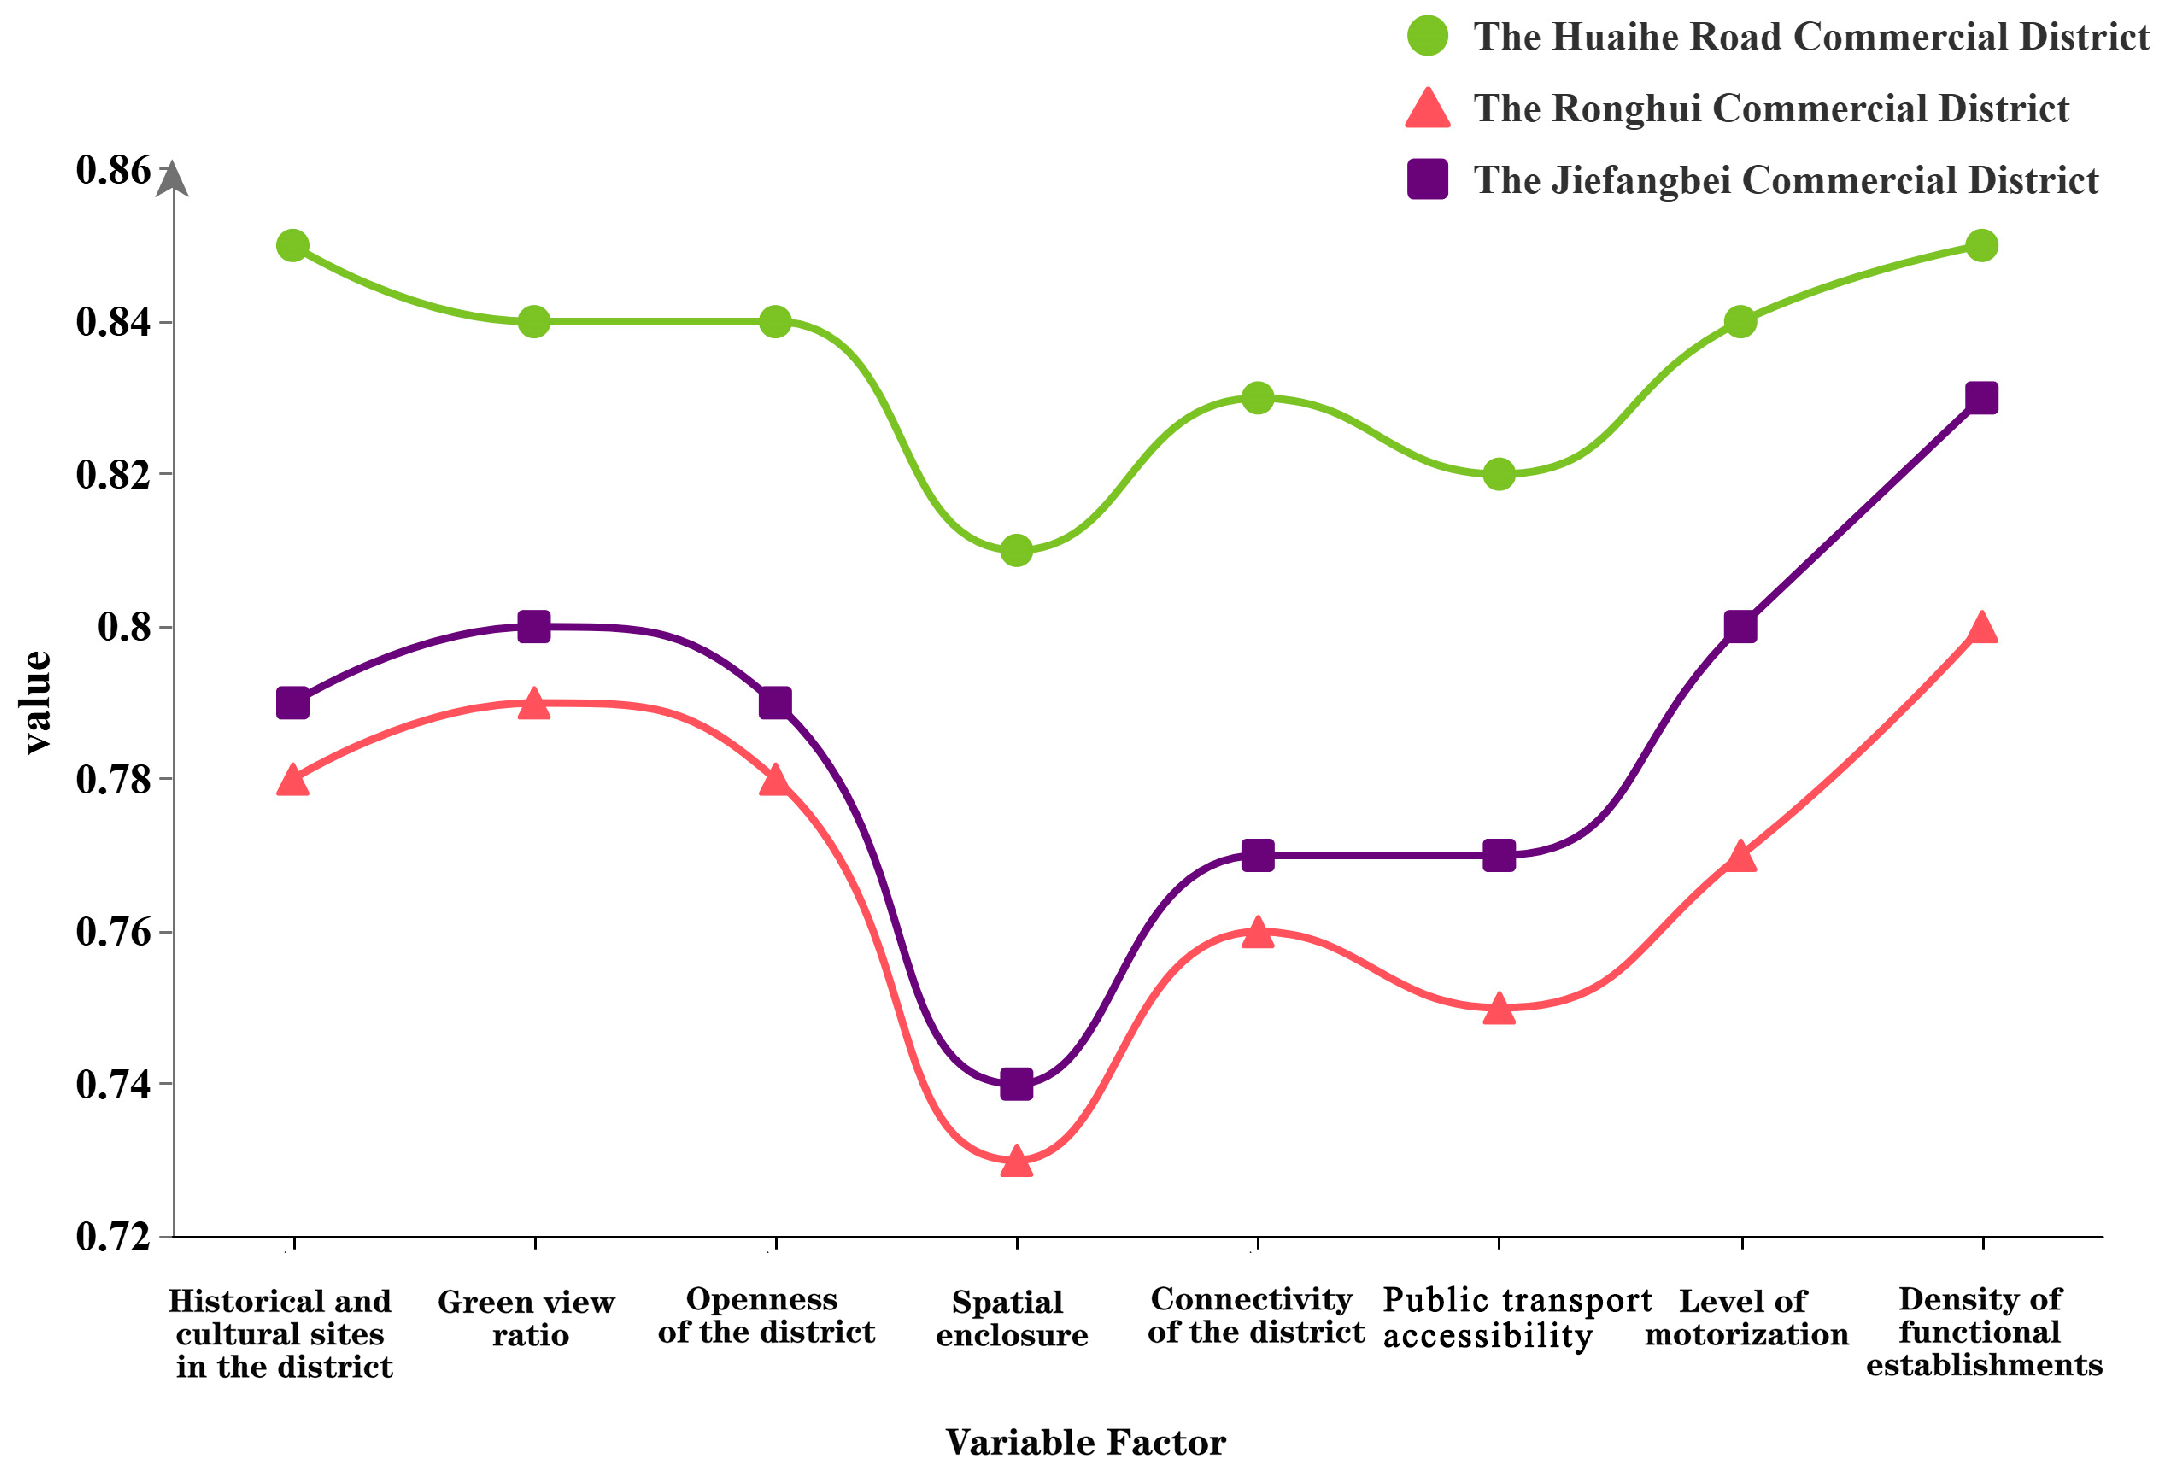
After transforming the processed data into line graphs (see
Figure 9), we observed that, except for the functional format density in the Hefei area—which is slightly lower than its score for historical and cultural attributes, the other two districts demonstrate the highest values for functional format density. This indicates that the density of functional formats exerts a strong positive impact on district vitality. The influence of historical and cultural attributes is particularly significant in the Hefei and Jinan districts, while in the Chongqing district, this attribute is more concentrated and slightly below the average level. Therefore, the role of historical and cultural factors should not be overlooked.
Across all three districts, both street connectivity and spatial enclosure are found to be below the average values, suggesting that higher levels of street connectivity and building enclosure do not necessarily promote district vitality. In terms of the green-view index, openness, motorization level, and public transportation accessibility, these factors are all close to the average, reflecting a moderate degree of correlation with vitality. As such, while they should not be excessively emphasized, neither should they be neglected. It is essential to integrate these various variables with the unique characteristics of each district to foster a vibrant and commercially dynamic urban environment.
5. Strategic Recommendations
In order to enhance the vitality of existing urban commercial districts, the following recommendations are proposed based on the findings of this study:
(1) Diversify Commercial Layouts: For commercial districts exhibiting low vitality, it is crucial to optimize the diversity of internal functional offerings. A reasonable mix of commercial, cultural, and entertainment functions should be achieved, ensuring that shopping and dining establishments make up more than 30% of the total. This will provide consumers with a richer selection of choices. While the historical and cultural background of the district may be challenging to alter, synergistic development of surrounding commercial functions can be pursued, coupled with the display and promotion of cultural heritage. This approach will enhance the district’s attractiveness and prominence, cultivating a unique cultural atmosphere in the commercial environment.
(2) Optimize Spatial Openness and Layout: To improve the spatial openness of the district and prevent clutter or temporary structures from obstructing shop displays, it is recommended to optimize the spatial layout of the area. The openness of major district spaces should ideally be maintained at 40–50%. In relatively open areas, introducing architectural elements that provide a moderate sense of enclosure can enhance spatial transparency and accessibility. However, the overall level of enclosure should not exceed 40%. Additionally, low-growing plants and shrubbery should be introduced into the landscaping at district squares and key road junctions to enhance the ecological environment and visual hierarchy of the district.
(3) Enhance Transportation Organization and Accessibility: In areas where the transportation infrastructure of the district is relatively open, motor vehicle entrances and exits should be reasonably arranged to ensure efficient connection between the internal and external traffic flows. At the same time, the strategic placement of public transportation stops can effectively facilitate pedestrian access to the area, thereby enhancing the vitality of the local commercial district. If conditions are favorable, underground passages or parking lots can be introduced to reduce the space occupied by ground motor vehicles, thereby enhancing pedestrian comfort and safety within the district. This will contribute to the creation of a user-friendly, barrier-free walking environment.
(4) Optimize and Streamline Traffic Flows: In regions where traffic patterns are complex or redundant, measures should be taken to close or reorganize routes, simplifying the internal transportation network of the district. This will optimize the guidance of pedestrian and vehicle movements, enhancing the overall spatial organization and orderliness of the area. Each main street should incorporate 3–5 connection points to facilitate the effective utilization of the district’s roadways. Additionally, for districts with poor accessibility and limited commercial vitality, pedestrian pathways or pedestrian overpasses can be added to improve the accessibility and connectivity of internal areas, thus enhancing the overall vitality of the district.
6. Discussion
6.1. Key Research Findings
Based on the stimulus–organism–response (SOR) theoretical framework, this study developed an analytical model to investigate factors influencing the vitality of commercial districts from multiple dimensions, including spatial morphology, cultural attributes, functional layout, and accessibility. Methods such as space syntax analysis, streetscape semantic segmentation, ArcGIS-based density estimation, and image comparison were applied to quantify how environmental attributes of commercial districts affect people’s behaviors and perceptions, with crowd density serving as a key indicator of district vitality.
The results indicated that cultural and historical significance, along with the density of functional formats, were the most critical determinants of vitality across the three selected commercial districts, significantly enhancing visitors’ willingness to visit and spend time in these areas. In contrast, factors such as the green-view index, openness, motorization control levels, and public transportation accessibility exhibited moderate positive effects on district vitality. Interestingly, the findings also revealed that excessively high street connectivity and spatial enclosure did not necessarily lead to increased vitality; instead, these factors occasionally reduced comfort and accessibility, subsequently hindering crowd aggregation.
Overall, this research emphasizes that district vitality is not only influenced by spatial morphology but also significantly shaped by people’s subjective perceptions and behavioral patterns, thereby reinforcing a human-centered approach to urban renewal and district improvement.
6.2. Directions for Future Research
The SOR-based analytical framework developed in this study provides a robust theoretical foundation and empirical support for exploring urban renewal strategies and optimizing commercial spaces. However, given the dynamic spatiotemporal characteristics of urban vitality, several potential directions can further enhance future research:
(1) Expansion of research regions and samples: Future studies could include comparative analyses across diverse urban contexts and district types (e.g., emerging CBDs, historic districts, and neighborhood commercial streets), improving the generalizability and external validity of the findings.
(2) Incorporation of dynamic temporal data: Integrating time-series data such as pedestrian trajectories and heatmaps during different periods (weekdays versus weekends or daytime versus nighttime) can provide deeper insights into temporal variations and periodic fluctuations in district vitality.
(3) Integration of individual behavioral and perceptual data: Utilizing micro-scale datasets, including questionnaire surveys, mobile app trajectory data, and social media sentiment analysis, would further elucidate the complex interplay between environmental stimuli and individual responses.
(4) Interdisciplinary modeling and intelligent analytics: Future research should leverage advanced analytical methods from machine learning and behavioral economics to precise model and predict the factors influencing district vitality, facilitating the development of intelligent urban spatial assessment systems.
6.3. Research Limitations
Although this study contributes positively to theoretical development and methodological innovation, several limitations should be acknowledged and addressed in subsequent research:
(1) Limited representativeness of case studies: The three selected commercial districts were primarily situated in specific Chinese cities. Given the limited sample size, the findings may not fully represent commercial districts in other urban settings or broader spatial contexts.
(2) Timeliness and completeness of data: Certain datasets, such as streetscape imagery and point-of-interest (POI) data, were subject to issues of delayed updating or insufficient coverage, potentially affecting the precision of spatial identification and variable measurement.
(3) Simplification in variable assumptions: Although we integrated multiple data sources, this study simplified the “organism” dimension of the SOR model by generalizing behavioral and psychological responses, potentially neglecting individual heterogeneity and subtle psychological differences.
(4) Constraints in identifying causal relationships: Despite employing weighted regression analyses and image comparisons, this study did not deeply investigate causal pathways and mechanisms among variables. Future research could utilize structural equation modeling (SEM) or other advanced causal inference methods for more precise and comprehensive modeling.
While these limitations do not fundamentally undermine the validity of the research conclusions, clearly articulating them delineates the boundaries of this research and offers guidance for future studies aimed at broader scales and more complex scenarios.
Author Contributions
Conceptualization, Q.Z. and Y.W.; methodology, Q.Z. and Y.W.; software, Q.Z. and Y.W.; validation, Q.Z. and Y.W.; formal analysis, Q.Z. and Y.W.; investigation, Q.Z. and Y.W.; resources, Q.Z. and Y.W.; data curation, Q.Z. and Y.W.; writing—original draft preparation, Q.Z. and Y.W.; writing—review and editing, Q.Z. and Y.W.; visualization, Q.Z. and Y.W.; supervision, Q.Z. and Y.W.; project administration, Q.Z. and Y.W.; funding acquisition, Q.Z. and Y.W. All authors have read and agreed to the published version of the manuscript.
Funding
This work was supported by the Anhui Provincial Key Project of University Scientific Research [2022AH050254]; and the Major Project of University Humanities and Social Sciences Research, Anhui Provincial Department of Education [2024AH040296].
Data Availability Statement
The original contributions presented in this study are included in the article. Further inquiries can be directed to the corresponding author(s).
Acknowledgments
The authors are grateful to the team members of the Research Center for Urban.
Conflicts of Interest
The authors declare no conflicts of interest.
References
- Xiong, Z.R. Research on the Spatial Vitality Characteristics and Influential Factors of Commercial Districts in Hangzhou: An Empirical Study of the Hubin Commercial District Based on Multi-Source Data. South. Archit. 2024, 3, 11–19. [Google Scholar]
- Huang, G.; Yu, Y.; Lyu, M.; Sun, D.; Dewancker, B.; Gao, W. Impact of Physical Features on Visual Walkability Perception in Urban Commercial Streets by Using Street-View Images and Deep Learning. Buildings 2025, 15, 113. [Google Scholar] [CrossRef]
- Zhang, J.; Zhou, W.; Lian, H.; Hu, R. Research on Optimization Strategy of Commercial Street Spatial Vitality Based on Pedestrian Trajectories. Buildings 2024, 14, 1240. [Google Scholar] [CrossRef]
- Sun, X.; Zao, L. Use of Electroencephalography (EEG) for Comparing Study of the External Space Perception of Traditional and Modern Commercial Districts. J. Asian Archit. Build. Eng. 2021, 6, 840–857. [Google Scholar] [CrossRef]
- Peckham, R. The City of Knowledge: Rethinking the History of Science and Urban Planning. Plan. Perspect. 2009, 24, 521–534. [Google Scholar] [CrossRef]
- Wang, Y.; Xiu, C. Spatial Quality Evaluation of Historical Blocks Based on Street View Image Data: A Case Study of the Fangcheng District. Buildings 2023, 13, 1612. [Google Scholar] [CrossRef]
- Zhou, Q.; Zheng, Y. Evaluation Research on the Spatial Vitality of Huaihe Road Commercial Block in Hefei City Based on Multi-Source Data Correlation. Sustainability 2024, 16, 3372. [Google Scholar] [CrossRef]
- Kong, Z.R.; Xiao, J.Q.; Xuan, W.; Xia, Y.Z. A Study on the Causal Relationship between Spatial Form and Vitality of Characteristic Urban Commercial Districts from the Perspective of Econometrics: A Case Study of Hefei City. J. West. Hum. Settl. 2023, 38, 82–89. [Google Scholar]
- Zhao, M.F.; Wang, Y.; Wang, M.M.; Xue, J.X. The Evolution of Business Formats and Vitality of Commercial Districts Under Self-Media Dissemination: A Case Study of the Yao Village Commercial Street in Xiqing District, Tianjin. Prog. Geogr. Sci. 2023, 42, 1256–1271. [Google Scholar] [CrossRef]
- Zhou, Q.; Zheng, Y. Research on the Spatial Layout Optimization Strategy of Huaihe Road Commercial Block in Hefei City Based on Space Syntax Theory. Front. Comput. Neurosci. 2023, 16, 1084279. [Google Scholar] [CrossRef]
- Li, J.Z. Research on Spatial Vitality Analysis and Optimization Strategies of Commercial Districts Based on Multi-Source Data. Master’s Thesis, Huazhong University of Science and Technology, Wuhan, China, 2023. [Google Scholar] [CrossRef]
- Kong, Y.; Zhen, F.; Zhang, S.Q. Research Progress and Reflections on Urban Space Under the Influence of Intelligent Technology. Prog. Geogr. Sci. 2022, 41, 1068–1081. [Google Scholar] [CrossRef]
- Zhao, J.; Gao, J.Y. The Interactivity of Hosts, Perceived Value, and User Participation Behavior in E-commerce Live Streaming: A Perspective Based on the S-O-R Theory. J. Chongqing Univ. Sci. Technol. (Soc. Sci. Ed.) 2024, 4, 1–18. [Google Scholar]
- Lin, W.P.; Zang, Z.P. Creative Incentives, Ecological Governance, and User Stickiness of Platform-based Media: An Analysis of the Mediating Effect of Affordance Based on the S-O-R Model. Mod. Audio-Vis. 2023, 34–42. [Google Scholar]
- Sengoz, A.; Cavusoglu, M.; Kement, U.; Bayar, S.B. Unveiling the Symphony of Experience: Exploring Flow, Inspiration, and Revisit Intentions among Music Festival Attendees within the SOR Model. J. Retail. Consum. Serv. 2024, 81, 104043. [Google Scholar] [CrossRef]
- Pan, M.F.; Pan, L.F.; Ruan, L.Z.; Gao, C. A Study on the Vitality Characteristics of Streets in Residential Districts Based on Heatmaps: A Case Study of Part of the Jiubao Street District in Hangzhou. J. Zhejiang Sci-Tech Univ. (Soc. Sci.) 2023, 50, 244–252. [Google Scholar]
- Guo, F.; Luo, M.; Zhang, C.; Cai, J.; Zhang, X.; Zhang, H.; Dong, J. The Mechanism of Street Spatial Form on Thermal Comfort from Urban Morphology and Human-Centered Perspectives: A Study Based on Multi-Source Data. Buildings 2024, 14, 3253. [Google Scholar] [CrossRef]
- Song, Y.; Zhang, L.; Zhang, M. Research on the Impact of Public Climate Policy Cognition on Low-carbon Travel Based on SOR Theory—Evidence from China. Energy 2022, 261, 125192. [Google Scholar] [CrossRef]
- Sun, Y.; Wang, Y.W.; Dai, D.H. From Direction to Pathway: Reflections on the Development of Urban Street Vitality in China. Archit. J. 2020, S1, 154–158. [Google Scholar]
- Li, M.Z.; Yin, Y.S.; Lin, Z. A Study on the Walkability Evaluation of External Spaces in Commercial Districts: A Case Study of Beijing Road in Guangzhou. South. Archit. 2024, 7, 36–47. [Google Scholar]
- Xia, P.; Niu, Y.Y.; Meng, B.; Tao, Y.; Huang, Z. Big Geo-data Unveils Influencing Factors on Customer Flow Dynamics within Urban Commercial Districts. Int. J. Appl. Earth Obs. Geoinf. 2024, 134, 104231. [Google Scholar]
- Wu, B.; Liu, C. Impacts of Building Environment and Urban Green Space Features on Urban Air Quality: Focusing on Interaction Effects and Nonlinearity. Buildings 2023, 13, 3111. [Google Scholar] [CrossRef]
- Min, Z.R.; Ding, F. Analysis of the Spatiotemporal Distribution Characteristics of Street Vitality Based on Baidu Heatmaps: A Case Study of the Historic District of Nanchang, Jiangxi Province. Urban Dev. Stud. 2020, 27, 31–36. [Google Scholar]
- Yin, M.Q.; Hu, W.; Li, Z.L.; Hu, Y.Z. Transformation and Development: Ideas for Constructing a National Framework System for Urban Design—Lessons from the UK and Development in China. Planners 2019, 35, 82–88. [Google Scholar]
- Pan, Y.; Hazwani, N.H.N.; Ching, G.H. Public Perception of Cultural Ecosystem Services in Historic Districts Based on Biterm Topic Model. Sci. Rep. 2024, 14, 11717. [Google Scholar] [CrossRef]
- Li, M.; Liu, J.; Lin, Y.; Xiao, L.; Zhou, J. Revitalizing Historic Districts: Identifying Built Environment Predictors for Street Vibrancy Based on Urban Sensor Data. Cities 2021, 117, 103305. [Google Scholar] [CrossRef]
- Sun, H.L. Research on the Distribution Characteristics of Night Vitality Before and After the Pandemic in Beijing and the Influencing Factors of the Built Environment. Master’s Thesis, Tianjin University, Tianjin, China, 2021. [Google Scholar]
| Disclaimer/Publisher’s Note: The statements, opinions and data contained in all publications are solely those of the individual author(s) and contributor(s) and not of MDPI and/or the editor(s). MDPI and/or the editor(s) disclaim responsibility for any injury to people or property resulting from any ideas, methods, instructions or products referred to in the content. |
© 2025 by the authors. Licensee MDPI, Basel, Switzerland. This article is an open access article distributed under the terms and conditions of the Creative Commons Attribution (CC BY) license (https://creativecommons.org/licenses/by/4.0/).


