Article

Research on the Spatial Torsional Effect of Column-Supported Structural Silo Groups Based on Shaking Table Tests

1
School of Civil Engineering, Henan University of Technology (HAUT), Zhengzhou 450001, China
2
Key Laboratory of Grain and Oil Storage Facility & Safety, Henan University of Technology (HAUT), Zhengzhou 450001, China
3
School of Civil Engineering, Henan University of Engineering, Zhengzhou 450001, China
4
Henan University of Technology Design and Research Academy Co., Ltd., Zhengzhou 450001, China
*
Authors to whom correspondence should be addressed.
Buildings 2025, 15(11), 1851; https://doi.org/10.3390/buildings15111851
Submission received: 11 April 2025 / Revised: 14 May 2025 / Accepted: 16 May 2025 / Published: 28 May 2025
(This article belongs to the Section Building Structures)

Abstract

:
Food security is a critical component of national security. Grain silos, as key infrastructure for food storage, must remain structurally resilient under seismic actions to ensure the stability of grain reserves. However, column-supported vertical-group silo structures are prone to spatial torsional effects during earthquakes due to eccentricities between the mass center and the stiffness center after grain loading, which can lead to serious structural damage or collapse. Based on this background, shaking table tests were conducted on a column-supported vertical-group silo structure as the research subject, with a scale ratio of 1/25 and in the 1 row × 3 column combination form. The dynamic response and spatial torsional effect of the structure under different grain storage conditions and seismic intensity effects were studied. To thoroughly analyze the factors influencing the spatial torsion in the structure, finite element–discrete element numerical analysis models of the structure were established based on experiments in Abaqus (6.14) software. The results indicate that in the column-supported vertical-group silo structure, the mass center of the group silo structure deviates from its center of rigidity after grain storage, resulting in significant and irregular spatial torsional effects under earthquake motion. The torsional displacement ratio and inter-story horizontal torsional angle of the structure gradually increased with an increase in the seismic intensity, reaching maximum values of 1.34 and 0.035 rad, respectively, when the peak acceleration input on the table was 0.4 g and under the full–full–empty storage condition. The effects of the void distribution, mass void ratio, and combination form of the group silo structure on the spatial torsional effect of the structure were studied to provide a scientific reference for the seismic design of column-supported silo structures for grain storage.

1. Introduction

Food security is the foundation of national security and is closely associated with sustainable development. In China, government departments and the Food and Agriculture Organization (FAO) attach great importance to food security issues and have established a relatively complete food reserve system [1]. Good food reserves are paramount to ensuring food supply. In this regard, grain depots are important infrastructure for ensuring the safety of national grain reserves, mainly including large warehouses, squat silos, and vertical silos [2,3,4,5].
Based on the combination form, silos can be mainly divided into single and group silos. A group silo is suitable for the selection of a single row of multi-connected or multi-row multi-connected arrangement. Based on the type of support structural component, silos can be divided into column-supported silos, cylinder-supported silos, and a cylinder with column-supported silos [5,
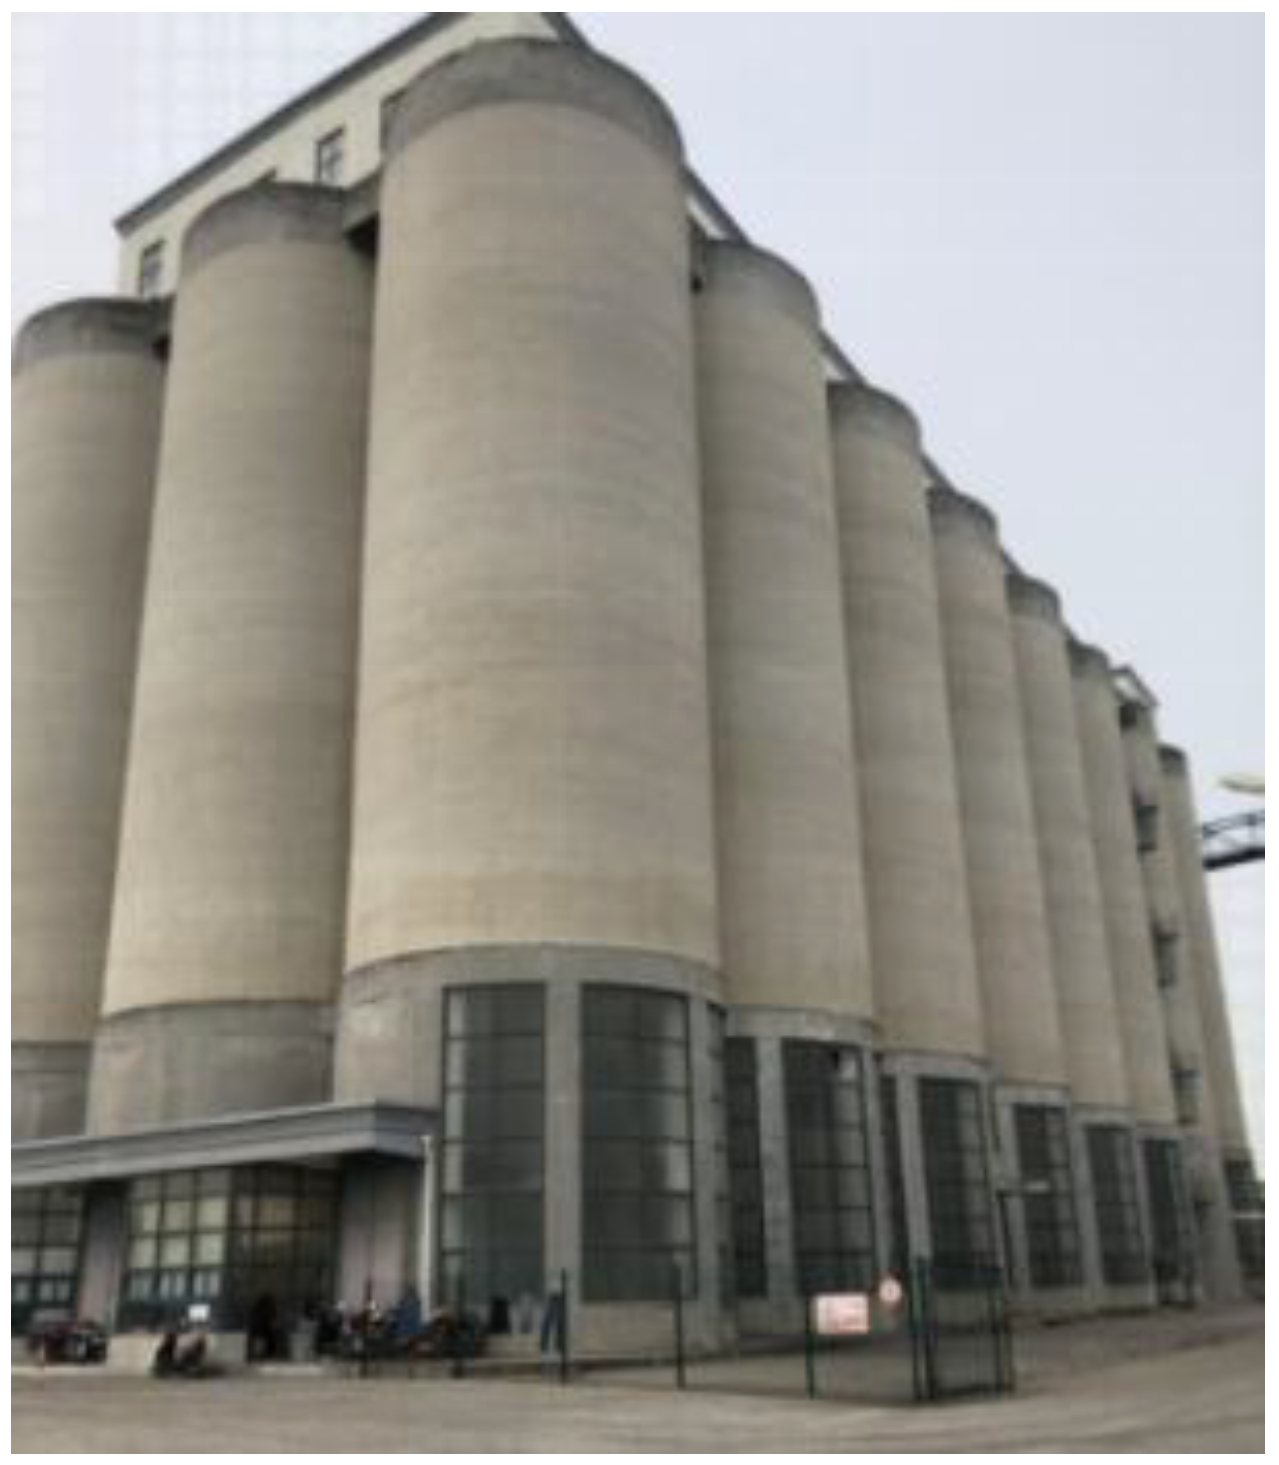
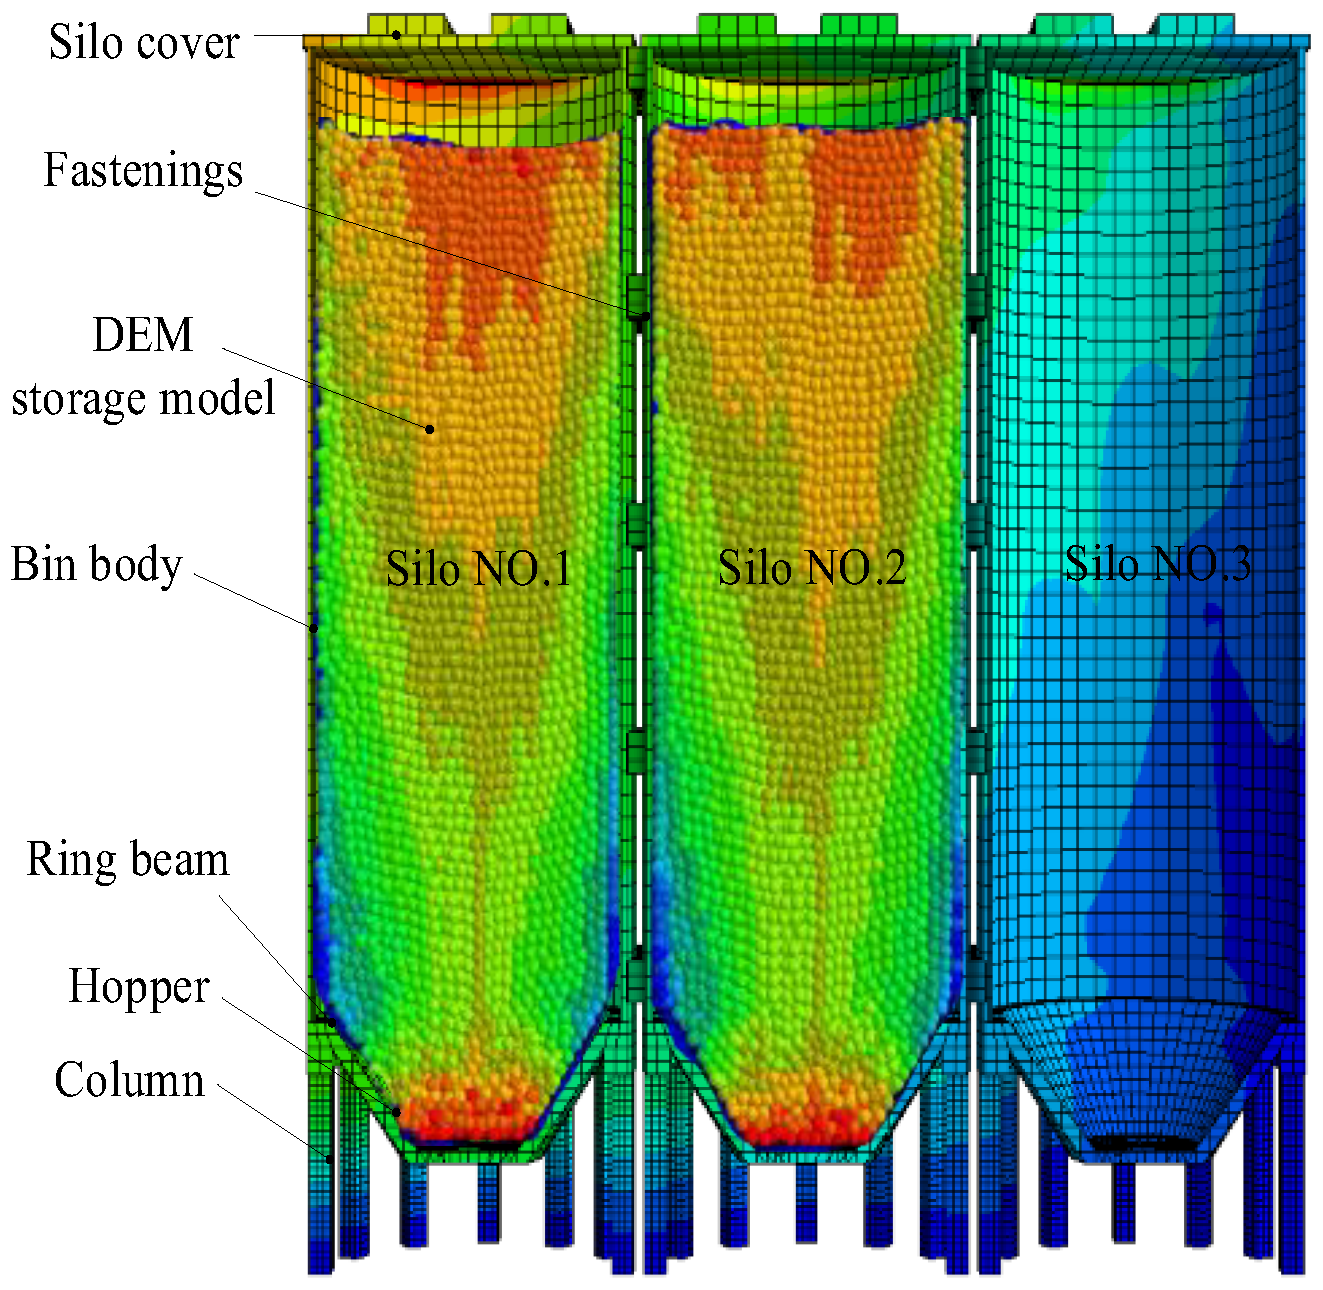
6]. Among them, the column-supported vertical-group silo has advantages, such as a small footprint, high storage capacity, and a high degree of mechanical automation, making it the main type of silo for grain storage and logistics transfer. The column-supported vertical-group silo is mostly constructed with reinforced concrete materials, presenting a unique structure comprising upper storage and lower columns, which allows for a large space and flexible use in the lower part of the structure while meeting the requirements of grain depots to a significant extent. Owing to these advantages, the column-supported vertical-group silo has become one of the main types of silos in the construction of grain depots, as shown in Figure 1.
In the past three decades, column-supported vertical-group silo structures have been widely used in grain depots in China [7,8,9,10,11,12]. However, these structures have seen a large number of ruptures under the action of earthquakes. Earthquake disaster investigations have shown that the probability of loss of use due to damage to column-supported vertical silo structures is much higher than that in the case of general storage structures [13,14,15]. Therefore, it is necessary to perform seismic research on storage structures, particularly silo structures.
Currently, scholars are conducting some research on silo structures. Ding et al. [16] proposed a method for calculating the effective mass coefficient of column-supported silos under earthquake action based on experiments. Shi et al. [17] conducted a shaking table test on a reinforced-concrete circular silo model to simulate earthquake vibrations. Jiang et al. [18] studied the dynamic response of a column-supported circular silo structure under seismic action using actual engineering examples. Through a finite element numerical analysis, it was found that the weak positions in the structure are mainly the intersection between the ring beam top and the silo wall and the connection between the column and the ring beam. The upper silo and lower support exhibited inconsistent motion. Ding et al. [19] conducted experimental research on the dynamic lateral pressure of a column-supported silo wall under seismic action. The research showed that the comprehensive correction factor used in the current code is too low, and the silo wall within the upper third of the silo produces a torsional effect, which enhances the dynamic response of the upper part of the structure. Ma et al. [20] believed that in addition to material storage, structural asymmetry and differences in the silo volume and material density can form and exacerbate eccentric effects, causing torsional effects in column-supported storage structures. Through a finite element modal analysis of column-supported vertical silos and group silos, Zhang [21] found that both single and group silos undergo torsional effects under empty conditions, accompanied by column bending or torsion. When only some of the single silos in a group silo are filled with material, asymmetric loading occurs, resulting in torsional vibration modes in the structure, and the impact of material storage on higher-order vibration modes is significant.
The storage materials in a column-supported vertical-group silo structure often undergo rapid loading and unloading, frequent turnover, and constantly changing quality and distribution due to market fluctuations, emergency material allocation, and other reasons [22,23,24]. The storage quality and distribution of each individual silo constantly vary, often resulting in complex situations, such as the uneven distribution of stored materials and inconsistent storage heights. The structural center of mass and the center of rigidity deviate from each other, and under the action of earthquakes, the silo group, particularly single-row multi-column column-supported vertical silo structures, may experience spatial torsional effects, resulting in structural damage or even collapse, which seriously threatens the safety and stability of grain storage [25,26,27,28,29,30]. Hence, it is necessary to explore the seismic dynamic response laws of column-supported vertical-group silo structures and the spatial torsional effect mechanism of structures under nonuniform storage conditions.
However, there remain several significant gaps in the existing investigations. Most previous studies have concentrated on the dynamic behavior of single silos or symmetrically arranged group silos under uniform loading conditions, often neglecting the irregular torsional responses caused by mass eccentricity in column-supported vertical-group silo structures [31,32,33,34,35,36]. The dynamic response and torsional behavior under nonuniform grain storage conditions have rarely been addressed. Additionally, prior research has seldom examined the influence of different combination forms (e.g., 1 × 3, 2 × 3, 3 × 3) and varying mass distributions on the torsional displacement response [37,38,39,40]. Few studies have combined shaking table tests with FEM–DEM coupled modeling to comprehensively analyze the spatial torsion effects under seismic excitation. This study aims to bridge these gaps by experimentally and numerically investigating the seismic response and torsional characteristics of column-supported group silos under various eccentric mass distributions and structural layouts.

2. Experimental Program

2.1. Specimen Design

A representative part (silo structure with 1 row × 3 columns) of a column-supported vertical-group silo in a grain reserve silo was selected as the prototype in the design process. The seismic fortification intensity was seven degrees (design basic acceleration: 0.1 g), the design earthquake group was the second group, the seismic grade was level 2, and the seismic fortification category was a Class C structure. The prototype structure was a reinforced concrete silo, with a concrete strength grade of C30. The total height of the building was 40 m, the column height was 8 m, and the outer and inner diameters of the silo walls were 12.5 m and 12 m, respectively. Based on the dynamic similarity relationship, considering factors such as the table size (2.0 m × 2.0 m) and the performance parameters of the vibration table, a final experimental model was selected with a scale ratio of 1:25. Table 1 presents the similarity relationship of the model structure.
The total height of the model was 1.60 m, the height of the silo was 1.28 m, the column height was 0.32 m, and the cross-sectional dimensions were 32 mm × 32 mm. The columns were arranged uniformly along the circumference of the circle, and the angle from the center of the two adjacent columns to the center of the circle was 30°. The outer and inner diameters of the silo wall were 0.50 m and 0.48 m, respectively, the thickness of the silo wall was 10 mm, and the cross-sectional dimensions of the ring beam were 20 mm × 20 mm. Figure 2 shows the specific dimensions and arrangement of the structural model.

2.2. Modeling of Specimens

The dynamic response of a column-supported vertical-group silo structure and the torsional effect of the structure caused by the uneven distribution of the storage mass were investigated in this study. To meet the study objectives and facilitate the observation of the dynamic changes in the material stored in the silo, specimens were prepared using Plexiglas. The additional mass of the model was calculated to be 80 kg for each single silo according to the principle of equivalent mass density, and it was distributed at the top of the silo (20 kg) and the silo wall (60 kg) based on the structural dimensions of the model, storage material, and the density of the Plexiglas. Figure 3 shows the distribution of the additional mass. The model structure was connected between the silos by connectors, the support columns at the tangent of the individual compartments were connected by means of screws to form a combined column, and the individual parts were fixed by high-strength bolts with chloroform bonding. Ceramic bead particles were selected to simulate the grain bulk in the experiment considering the storage density requirements, particle uniformity, and single-level distribution. The physico-mechanical index parameters of the plexiglass and ceramic bead particles were obtained through material mechanical property tests, as shown in Figure 4. Table 2 presents the results.

2.3. Loading Program

The site type and seismic intensity of the prototype structure, as well as the dynamic behavior of the structure, were used as references, and three earthquake records were considered: the El-Centro wave (Imperial valley, CA, USA, 18/5/1940), the Wenchuan wave (Wenchuan, China, 12/5/2008), and an artificial wave. To simulate the uneven distribution of the storage mass and different surplus distributions of the column-supported vertical-group silo during the test, six typical filling states of stored material were selected for this test, as shown in Figure 5. These were labeled as follows: empty–empty–empty silo (EEE), half–empty–empty silo (HEE), full–empty–empty silo (FEE), full–half–empty silo (FHE), full–full–empty silo (FFE), and full–full–full silo (FFF). Table 3 presents the loading and storage conditions of the tests. White noise sweeps were used at the beginning of the tests and after each level of earthquake loading to obtain the dynamic characteristics of the modeled structure.

2.4. Measurement Program

The dynamic response of the model varies from silo to silo due to the “mass eccentricity” of the column-bearing silo structure after the material is loaded. Therefore, to measure the acceleration and displacement responses of each layer of the structure, acceleration sensors (A1-1~A3-6) and displacement sensors (D1-1~D3-6) were arranged symmetrically from top to bottom (elevation) at the top of the silo, the top of the column, and the bottom of the column on the north and south sides of silo No. 1, silo No. 2, and silo No. 3 (horizontal plane), respectively, as shown in Figure 6.

3. Experimental Phenomena

The displacement responses of the supporting structure and the silo body deviated significantly during the test as the displacement response of the silo increased with higher peak values of the input acceleration. Consequently, there was a more noticeable relative movement between the silo wall and the top layer storage. The link between the silo body and supporting column was where the displacement reaction in the model structure was primarily concentrated. The top of the column also experienced an abrupt rise in seismic reaction, leading to a maximum absolute displacement. Moreover, the supporting columns near the borders of the silos exhibited the greatest torsional deformation. A progressive amplification of the displacement response of the upper silo body relative to the lower supporting columns occurred with an increase in the peak values of the input acceleration; this caused discernible bending and shaking deformation in some sections of these columns. When subjected to the Wenchuan wave excitation, the overall torsional response of the silo under the FEE storage condition was pronounced, and the empty silo No. 3 had a more significantly delayed response than the others.
During the loading process, the storage material could be seen through the plexiglass to move with the silo; however, there was a slight delay, and when the input was large, the storage material at the top of the silo appeared to exhibit a thrown-up phenomenon. From the beginning to the end of the loading for each storage condition, the storage material was gradually compacted, and the storage material in the silo showed different degrees of sinking. At the end of the test, the storage material level appeared to exhibit a more evident sinking behavior, and the greater the amount of storage material was, the greater the sinking height. In the three silos with a full state (FFF), the height of the decline was slightly different, with a maximum distance of sinking of up to 21 mm, as shown in Figure 7. With the exception of the two symmetric storage states, FFF and EEE, the structure underwent large displacement and torsional reactions during the other storage states. Most of the maximum values of the acceleration and displacement responses of the structural model occurred at the position of silo No. 1, and there was a large difference between silo No. 1 and silo No. 3. With an increase in the peak input acceleration, the transverse displacement difference between the silos gradually increased with an increase in the mass of the stored material. Figure 8 shows the experimental phenomena of each structural model under each storage condition.

4. Analysis of the Test Results

4.1. Dynamic Characteristics

The natural frequency and mode of the model were determined through a transfer function analysis based on the white noise sweeping results; the damping ratio of the structure was determined using the half-power broadband approach. The damping ratio describes the relationship between the damping coefficient and the critical damping coefficient, which illustrates the amount of energy dissipated by the model structure during vibration. Table 4 presents the model structural damping under various storage conditions. The storage of the model structure trembles and tosses with an increase in the peak value of the earthquake acceleration record. Moreover, both the dissipated energy of the structure and the damping ratio increase with the increasing height (mass) of the storage material.

4.1.1. Natural Frequency

Table 5 presents the frequency sweep results of the silo model. Clearly, there is a non-proportional relationship between the mass of the filling stored in the structure before the earthquake and the fundamental natural frequency of the structure in alignment, which gradually decreases with the mass. The natural frequency of the model essentially remains constant when the input wave peak acceleration increases. This suggests that the stiffness of the model did not degrade during testing and that the structure could continue to function elastically even after the input wave reached a peak acceleration of 0.4 g, as shown in Figure 9.

4.1.2. Damping Ratio

The damping ratio describes the relationship between the damping coefficient and the critical damping coefficient, which illustrates the amount of energy dissipated by the model structure during vibration. Table 4 presents the model structural damping under various storage conditions. The storage of the model structure trembles and tosses with the increasing peak value of the earthquake wave acceleration. Moreover, the dissipated energy of the structure and the damping ratio increase with the increasing height (mass) of the storage material. Under the storage conditions HEE and FHE, the increase in the damping ratio of the modeled structure was lower than that under the FFF storage condition.

4.2. Acceleration Response

The acceleration amplification factor β was defined as the ratio of the peak acceleration response of each layer of the modeled structure to the peak input acceleration of the table. Since the dynamic response of the structural model at an input acceleration of 0.4 g was significantly higher than that of the structure at input accelerations ranging from 0.1 g to 0.3 g, the acceleration response of the structure at an input peak acceleration of 0.40 g was selected for silo No. 1 of the column-supported vertical-group silo structure, considering the influence of the storage filling mass and the distribution of the filling space on the structure. Based on the results obtained from the accelerometer tests on the shaking table, the top of the support column and the top of the silo were selected. Figure 10 shows the distribution of the acceleration amplification factor β of the modeled structure under the action of the three earthquake waves.
Figure 10 shows that under the action of the three earthquake waves, the peak acceleration of the supporting column of the No. 1 silo is greater than that of the upper silo body, which is primarily due to the sudden stiffness change in the pillar-supported silo model structure along the height direction.
A comparison of the acceleration peaks of silo No. 1 at different acceleration levels revealed that the acceleration peak of silo No. 1 under the El-Centro earthquake conditions alternated between FFE, FHE, and FEE; the maximum acceleration peak of silo No. 1 under the artificial earthquake conditions alternated between FHE and FEE; the acceleration peak of the maximum peak of silo No. 1 under the Wenchuan earthquake conditions alternated between FHE and FEE. This shows that although different earthquake waves and their spectral characteristics have some influence on the peak acceleration response, FFE, FHE, and FEE may be the most unfavorable storage conditions under the action of the three earthquake waves due to the existence of mass eccentricity. Therefore, in the design of column-supported vertical-group silos, the seismic performance of the unfavorable conditions under the mass eccentricity condition should not only be calculated for the FFF storage condition but also for the other conditions.

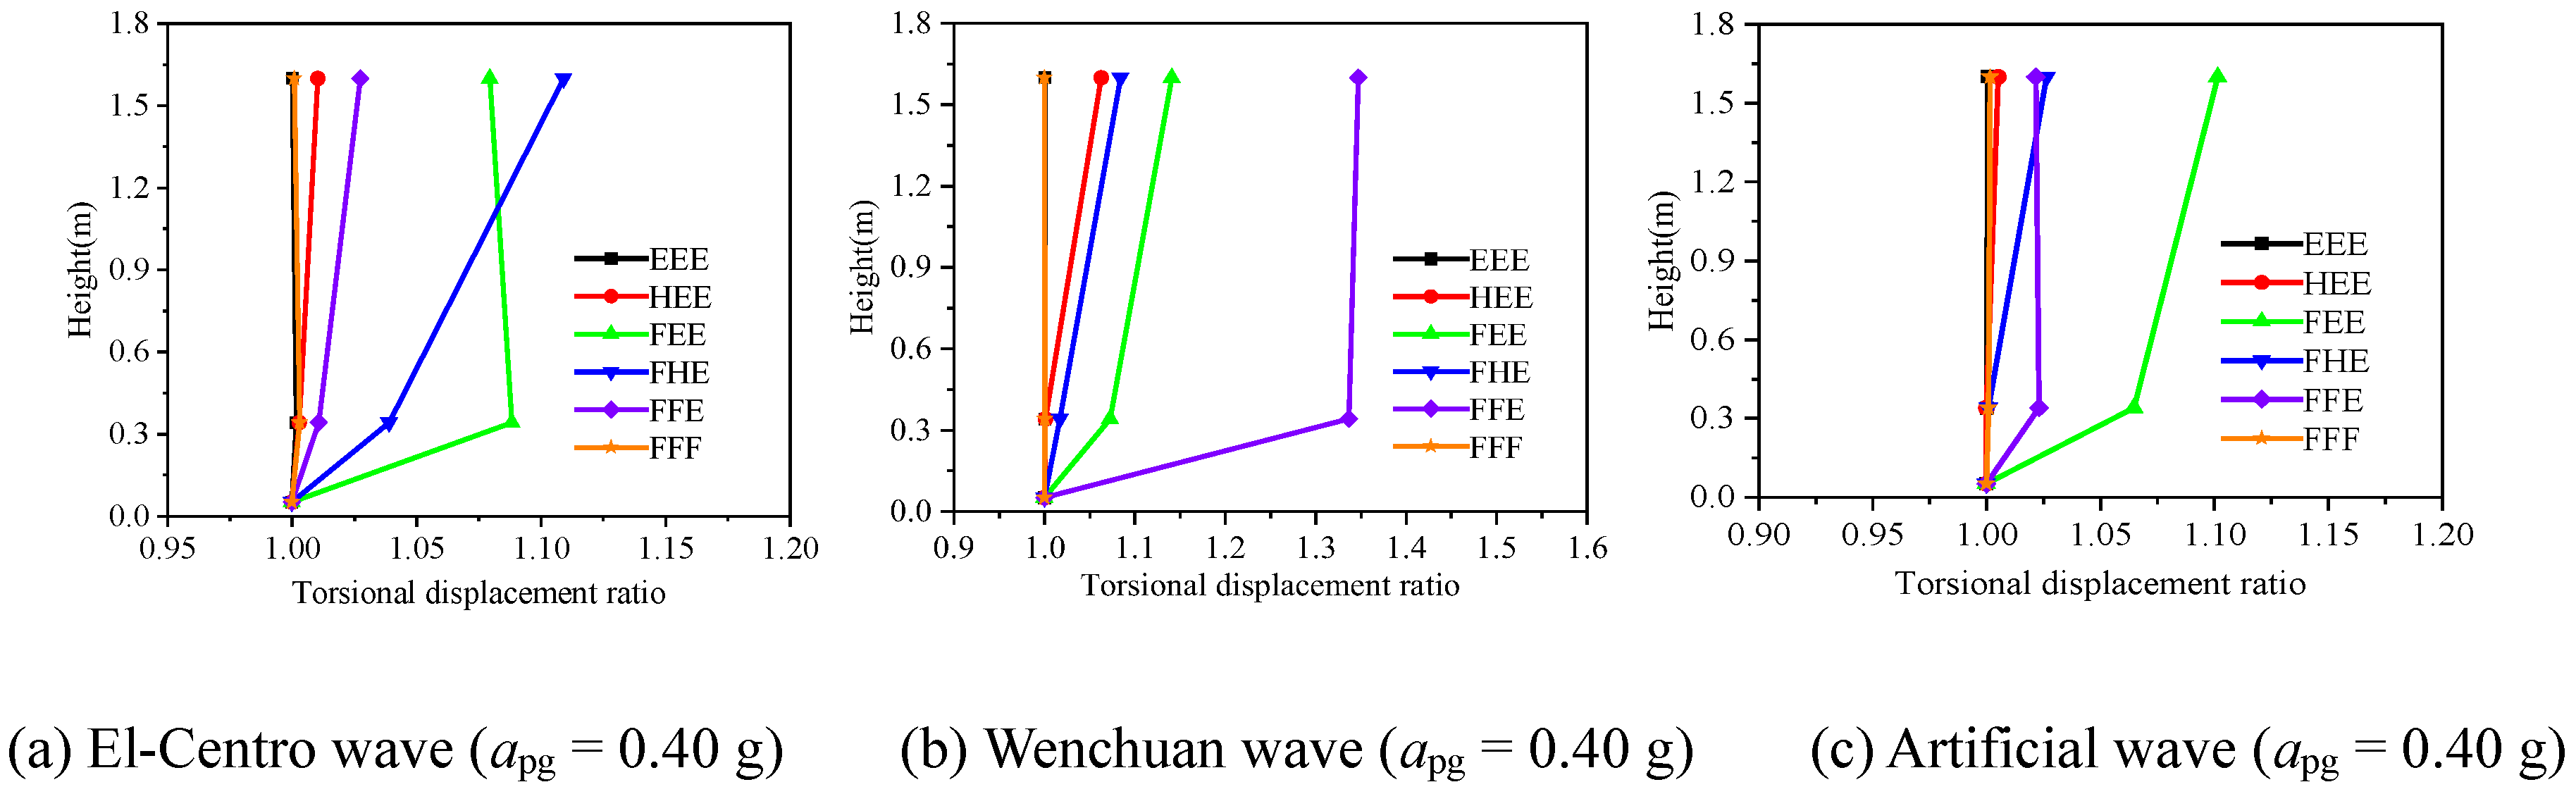
4.3. Displacement Response and the Torsional Displacement Ratio

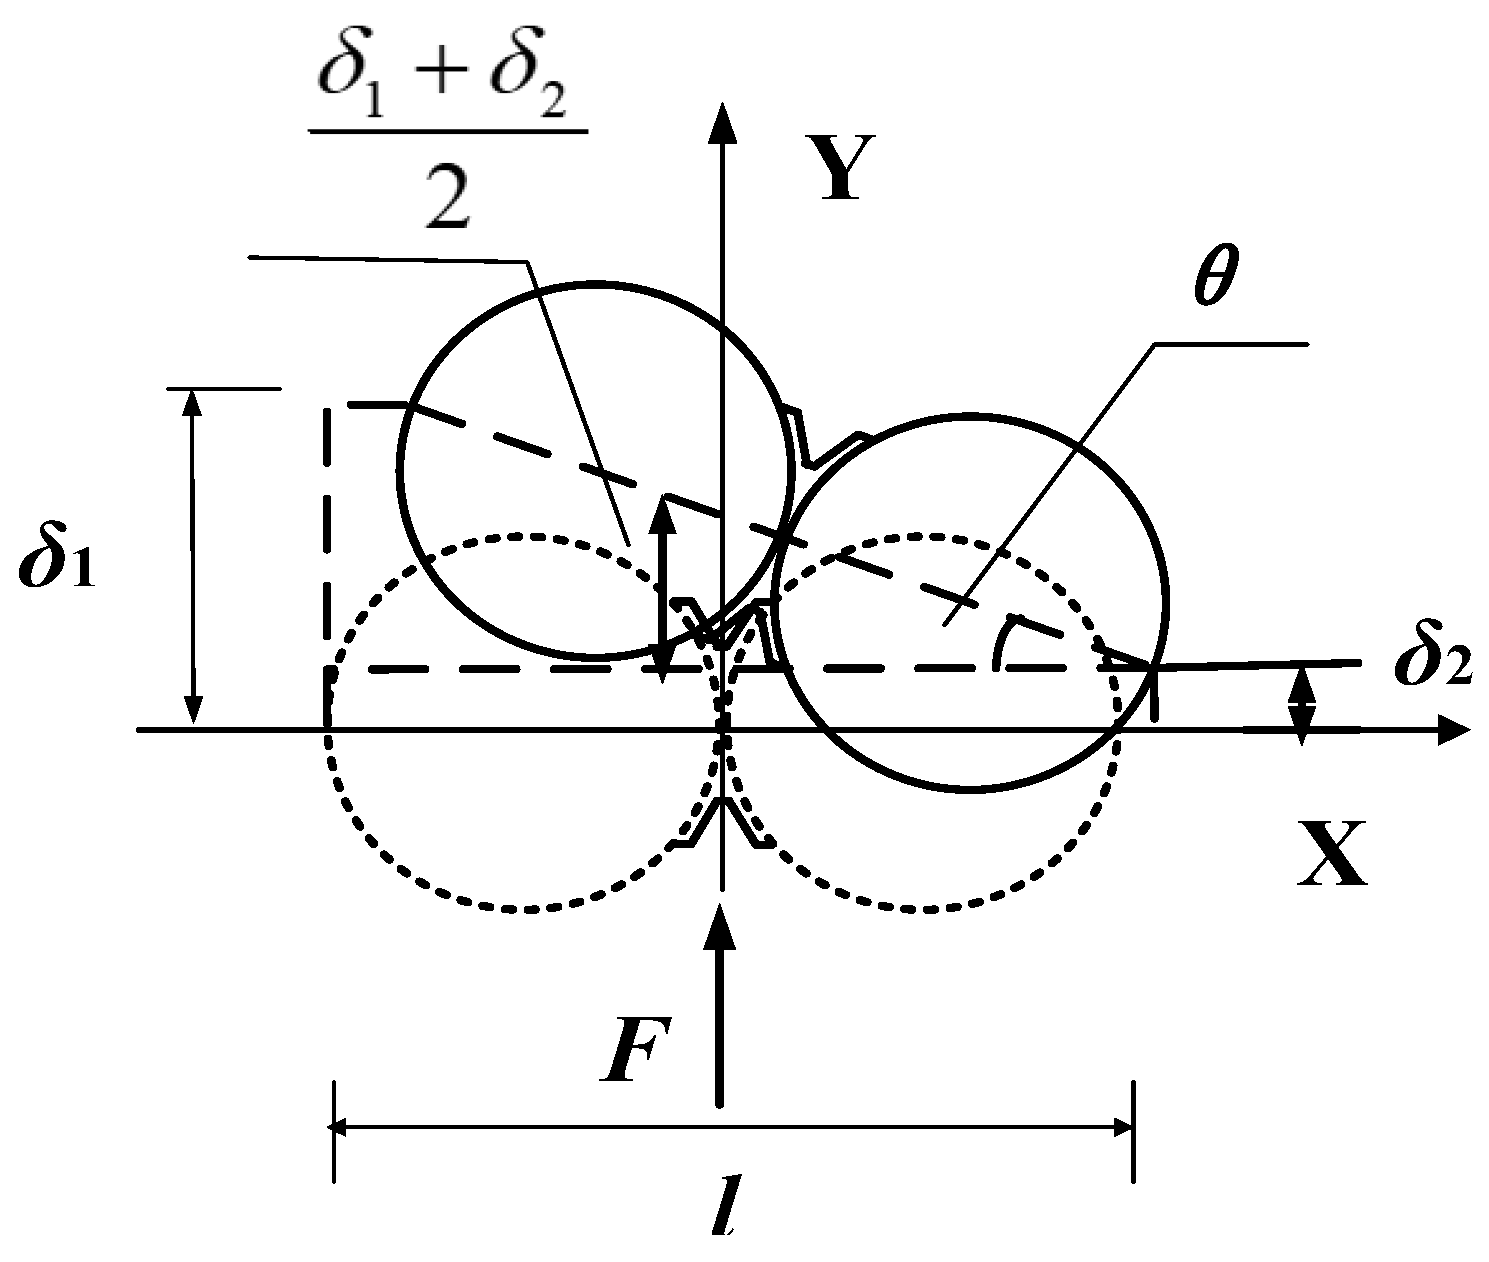
The torsional displacement ratio is the ratio of the maximum and average elastic horizontal displacement of members resisting lateral forces at both ends of the structural layer under the application of eccentric horizontal forces. It is a crucial factor in determining whether a structure exhibits torsional irregularity as well as the degree of irregularity. It is determined using Equation (1), as shown in Figure 11. For the special structural form of the column-supported vertical-group silo, this study analyzed the displacement response of the structure with the torsional displacement ratio as a parameter, taking the torsional displacement ratio of the structure at an input peak acceleration of 0.40 g as an example, as shown in Figure 12.
λ i = δ i 1 δ i 1 + δ i 2 2 = 2 δ i 1 δ i 1 + δ i 2
In Equation (1), λi is the torsional displacement ratio of the ith layer of the row of silos; δi1 and δi2 are the elastic horizontal relative displacements at the two ends of the ith layer of the row of silos in the vertical direction, calculated by subtracting the basal horizontal displacement from the absolute horizontal displacement of the measurement points at the two ends; δi1 is greater than δi2.
The distribution line is bent at the top of the model column, and the distribution of the torsional displacement ratio is bent along the height due to the effect of various earthquake records. Under the same waveform and loading grade, the torsional displacement ratios in the various storage states vary significantly, and the displacement ratio increases with the increasing nonuniform distribution of the storage material. These differences suggest that the storage state is the primary cause of torsion. Under identical storage conditions and loading grades, there is a minor variation in the displacement ratio. This suggests that the variation in the torsional effect is due to the sensitivity of the dispersion in the probability distribution of the seismic response spectrum.
Under the three seismic waves, the torsional displacement ratios of silos No. 2 and No. 3 under the EEE and FFF conditions were in the vicinity of that of silo No. 1, indicating a lack of significant torsional response in the structure when the storage material is symmetrically distributed among the silos within the structure. The maximum torsional displacement ratio of the structure under the El-Centro wave alternated between the FFE and FEE conditions, the maximum torsional displacement ratio under the artificial wave was significantly higher under the FEE condition than under the other conditions, and the maximum torsional displacement ratio under the Wenchuan wave was greater under the FEE condition than under the other conditions. This indicates that different seismic waves and their spectral characteristics have some influence on the peak acceleration response; however, due to the existence of mass eccentricity, the torsional effect is caused by the different distributions of the storage material in each internal silo. FFE and FEE may be considered the most unfavorable storage conditions under the three seismic waves, and the seismic design should focus on the calculation of the mass eccentricity condition.
The torsional displacement ratios of the structure under the El-Centro wave were not greater than 1.2 under any of the loading conditions. The torsional displacement ratios in the FEE displacement case were greater than 1.2 for the artificial wave. Under the action of the Wenchuan wave, the torsional displacement ratios under both the FEE and FFE displacement conditions were greater than 1.2, indicating that the different earthquake records and their spectral characteristics affected the peak acceleration response and that irregular torsional effects occurred in the case of the artificial and Wenchuan waves under different storage conditions.

5. Finite Element–Discrete Element Numerical Analysis

5.1. Finite Element–Discrete Element Model Structure Establishment

Grain particles contained in vertical silos supported by pillars undergo a dynamic coupling reaction between the solid and the particles during an earthquake. This study combined the discrete element method (DEM) and the finite element method (FEM). The modeling and coupling calculation of both these methods were performed simultaneously in ABAQUS, and the output results were accordingly obtained. The primary objective of the model in this work was to partition the grid and determine the solid structure of the silo body using the finite element approach. The storage material was assumed to be composed of multiple relatively independent particles (units) with a specific mass and shape. Time was split into multiple time intervals, and the interaction force between the particles was transferred at each time interval by their particle contact. Newton’s second law was then used to solve for the acceleration, velocity, displacement, and force of the particles at each time step. The finite element program imported the contact force produced by the particles on the structure from the discrete element program to operate on the structural unit, and the associated stress and strain were computed. Simultaneously, the contact force and motion state of the discrete system as well as the stress distribution of the continuous system were obtained. Figure 13 shows the developed FEM–DEM numerical analysis model.

5.2. Validation and Analysis of the FEM–DEM Calculation Results

5.2.1. Comparative Analysis of the Dynamic Characteristics

The natural frequency of the model under various storage conditions was computed and examined using the established FEM–DEM numerical model, as indicated in Table 6.
From Table 6, with an increase in the storage mass, the simulated value of the first-order natural frequency has the same decreasing trend as the experimental value. The simulated value in the EEE state was 11.60% greater than the experimental value, and the numerical simulation value in the HEE state was 2.54% lower than the experimental value. The numerical simulation value in the FEE state was 2.03% lower than the experimental value, and the numerical simulation value in the FHF empty state was 2.43% lower than the experimental value. The numerical simulation value in the FFE state was 1.23% greater than the experimental value, and the numerical simulation value in the FFF state was 4.33% greater than the experimental value. This indicates that the values of the natural frequency of the structure under the different storage conditions were close to the experimental value, thus verifying the reasonableness of the established numerical simulation model.

5.2.2. Comparative Analysis of the Dynamic Response

This study only compared the acceleration and displacement responses of the structure when the input peak acceleration was 0.40 g, as obtained by tests and simulations, because there were numerous loading conditions in the dynamic response analysis of the model.
As shown in Figure 14, the trend in the acceleration amplification factor is the same as that in the peak acceleration. Under the action of the El-Centro wave, the difference between the experimental and simulated values of the velocity method coefficients under the EEE storage condition was 9% at the position of silo No. 1, 6% under the HEE storage condition, 21% under the FEE storage condition, and 20% under the FFF storage condition. The No. 2 silo and silo No. 1 followed the same law, which showed that the difference between the test and simulated value increased gradually with the increase in the amount of storage material, though the trend line of the law was similar. This proves the credibility of the amplification coefficient of the torsional acceleration obtained from the test as well as its law. The displacement responses of the structure when the input peak acceleration was 0.40 g is shown in Figure 15.
When the peak acceleration of the numerical model was 0.4 g, the simulated value under the FEE condition for the El-Centro wave was greater than 1.2. Under the action of the Wenchuan wave, the test and simulated values in the FEE state were greater than 1.2 and the test value in the FFE state was greater than 1.2. Under the action of the artificial wave, the simulated value in the FEE state was greater than 1.2 and the simulated value in the FEE state was close to 1.2. This shows that with an increase in the mass of the storage material, the model presents torsional irregularity with the same law as the test value, and this also verifies the credibility of the numerical simulation model.

6. Parametric Analysis of the Spatial Torsional Effects of the Structure

6.1. Surplus-Space Distribution

In contrast to the standard building structure system, the filling ratio and distribution of the group silo structure primarily influence the separation between the stiffness center and the center of mass. To ascertain the irregularity of the column-supported vertical-group silo structure, the mass and stiffness distributions in the group silo structure system must be first ascertained. Following this, the eccentricity of the structure and its corresponding displacement ratio under various working conditions must be computed. Finally, the eccentricity limit can be ascertained from the displacement ratio limit.
Figure 16 shows how the torsional displacement ratio of each silo structure increases with increasing eccentricity. The fitting formulas for each combination of curves in Figure 16 are shown in Table 7.
If the eccentricity falls between 0 and 150 mm and the torsional displacement ratio of the group silo structure is less than 1.2, every combination structure is considered free of the torsional effect. As the number of silos increases in the single-row direction, the displacement ratio progressively increases, as indicated by the trend lines for the 1 × 2, 1 × 3, 1 × 4, and 1 × 5 combinations. This is because the number of silos increases in the joint direction, shifting the center of rigidity in the joint direction, and increasing the eccentricity.
In summary, each combination form has a different eccentricity and displacement ratio. Thus, the silo-type combination should be used to determine the seismic design. This is because when the storage state distribution in the silo varies, the eccentricity of each combination structure gradually increases, thus increasing the torsional radius and ultimately the torque produced by the same earthquake activity.

6.2. Mass Surplus-to-Space Ratio

The void-to-fill ratio, which is the ratio of the reaction storage mass to the total mass, is the primary factor causing the eccentricity of the silo, as follows:
γ = m M a t e r i a l   s t o r a g e m T o t a l   m a s s
The variation trend chart of the void ratio under various storage conditions is plotted in Figure 17. The fitting formulas for each combination of curves in Figure 17 are shown in Table 8.
The trend lines of the torsional displacement ratio of each silo-type structure, shown in Figure 17, are normally distributed, with the symmetry axis of the positive distribution of the trend lines of each combination structure being the mass void-to-space ratio of 0.5. The displacement ratio increases from 0.25 to 0.5 and decreases from 0.5 to 0.75, suggesting that an increase in the mass somewhat reduces the likelihood of torsion.
According to the analysis, the mass void-to-space ratio and displacement ratio vary for each combination form. They should be determined in the seismic design based on the silo-type combination. Simultaneously, the torsional irregular design is included when the mass void-to-space ratio falls between 0.3 and 0.7, with the most detrimental operating condition occurring at a mass void-to-space ratio of 0.5. This is due to the maximum product of the seismic action and eccentricity generated by the mass. Specifically, the highest additional torque occurs when the mass of the combined structure for storage is half the total.

6.3. Combination Form of Vertical Silos

The “one-full and many-empty row” storage conditions were selected for each combination, i.e., the 1 × 2 combination FE storage condition, the 1 × 3 combination FEE storage condition, the 1 × 4 combination FEEE storage condition, the 1 × 5 combination FEEEE storage condition, the 2 × 3 combination FEE–FEE storage condition, and the 3 × 3 combination FEE–FEE–FEE storage condition. Subsequently, a comparative analysis was made, as shown in Figure 18.
As shown in Figure 18, the torsional displacement ratios under the “one-full and many-empty row” combination forms show a generally increasing trend. The torsional displacement ratio for the 1 × 2 and 1 × 3 combination forms reached 1.2. The ratio for the 1 × 4 and 1 × 5 combination forms was greater than 1.2 and less than 1.5. The ratio for the 2 × 3 and 3 × 3 combination forms was greater than 1.5. These results show that the vertical-group silo structure under the combination form of “one-full and many-empty rows” has a torsional reaction, and there is torsional irregularity.
The combination forms, ranging from the 1 × 2 combination to the 1 × 5 combination, show that the displacement ratio increases gradually with the increase in silo mass in the joint direction. This is due to the fact that when the material stored in the outermost silo is constant, the silo is subjected to a constant seismic action, while the increase in the silo mass in the joint direction causes an increase in the eccentricity between the center of rigidity and the center of mass. In other words, the torsional radius increases, which in turn causes the torque generated by the seismic action to increase, at which time the additional displacement generated by the torque increases, thereby increasing the torsional displacement ratio.
When the silo body and storage state are constant in the joint direction, the torsional displacement ratio increases with an increase in the number of rows. The difference between the single-row and two-row arrangements is significant, and the displacement ratio with the addition of more than two rows is not significantly different. This is evident when comparing the 1 × 3 combination with the 2 × 3 and 3 × 3 combinations. The displacement ratios of the 2 × 3 and 3 × 3 combinations are 1.35 and 1.36 times that of the 1 × 3 combination, respectively. This is because when two rows are compared with one row, an increase in the structural mass can enhance the inertial force more than the resistance effect of increasing the lateral stiffness on the inertial force, whereas the increase in the structural mass and lateral stiffness is typically constant. As a result, in the actual manufacturing process, the condition of having all the storage materials on the same side of the silo should be avoided as much as possible.

7. Discussion

The finite element–discrete element (FEM-DEM) coupled model in this article considers the particle structure interaction and provides a more detailed representation of the torsional effect caused by mass eccentricity. Compared to traditional single methods, this hybrid approach more realistically captures the interactions between stored particulate materials and structural components. In addition, this article presents six different nonuniform storage scenarios, which more accurately reflect real operating conditions. The effectiveness and credibility of the proposed model were verified through comparison with experiments. The research results provide useful guidance for the seismic design and safety assessment of column-supported vertical-group silo structures. Analysis shows that asymmetric storage conditions, especially configurations such as FEE and FFE, significantly increase the torsional response of the structure. These configurations should be carefully considered in design specifications and engineering practices. In addition, the torsional displacement ratio is related to the eccentricity and combination form of the silo group. Therefore, in the layout planning process, designers should avoid placing all the full silos on one side of the structure.
However, the research has some limitations, such as constructing a proportional model using organic glass to study the response of the structure within the elastic range, without considering elastic–plastic changes. In addition, in numerical simulations, although the FEM-DEM coupling method effectively captures the interaction between solid structures and granular media, simplified methods such as uniform particle size and ideal contact behavior are adopted. These may not fully reflect the heterogeneity of actual particulate materials.

8. Conclusions

The dynamic characteristics and seismic response of a column-supported vertical-group silo structure were analyzed by establishing an FEM–DEM numerical model, including the influence of the silo arrangement form, the number of silos, and the distribution and state of the stored materials in each single silo on the seismic response and torsional effect of the silo. The specific conclusions are as follows:
(1)
The acceleration and displacement responses of the model structure of the group silo exhibited a folding trend, and there was a sudden change in the curve at the top of the column. The degree of bending of the folding line strengthened with the increase in the loading level and amount of storage material. The uneven storage mass and different surplus distributions of each single silo in the group silo had a greater influence on the dynamic characteristics and torsional effect of the model structure. Moreover, the degree of its influence increased with the uneven distribution of the storage material, and the torsional effect of the model structure of the group silo was enhanced. With the increase in the storage mass, the natural frequency of the silo model structure decreased, the damping ratio increased, and the storage material had a certain damping effect.
(2)
The experimental model showed little difference in acceleration under the EEE or FFF storage conditions. The peak acceleration difference was greater under different storage heights, and the acceleration of the internal silos gradually increased as the storage state changed from empty to full. This indicates that when the storage material is unevenly distributed, the center of mass of the model will move toward the silo along with the storage material; therefore, the center of mass and the center of rigidity of the model will no longer be coincident, and a torsional response is generated under seismic action, leading to the inconsistent acceleration responses of the silo with and without the storage material. The acceleration response of the silo with the larger mass was higher, and the internal acceleration of the silo with the material was approximately 1.5 times the acceleration of the silo without the material.
(3)
The results indicated that torsional displacement ratios exceeded 1.2, or even 1.5 under FFE and FEE conditions, confirming that these asymmetric storage scenarios are among the most unfavorable for seismic performance. The center of mass shifted away from the stiffness center due to unequal grain distribution, leading to torsional irregularities and differential displacement responses between silos. These findings highlight the inadequacy of current design practices that assume uniform loading or treat silos as independent entities.
In the current specification, it is unreasonable to use the seismic characteristics of independent single silos to replace column-supported vertical-group silos for dynamic calculations and seismic design. The displacement response mechanism of the column-supported group silo structure under seismic action and the differences and intrinsic connections of each silo in the silo group were elaborated in this paper. The findings can provide a reference and experimental basis for the research and engineering seismic design of column-supported vertical-group silos.

Author Contributions

Conceptualization, Y.D.; methodology, X.L.; software, Z.Z.; validation, X.L.; formal analysis, X.L.; investigation, G.R.; resources, Q.X.; data curation, Z.Z.; writing—original draft preparation, H.W.; writing—review and editing, G.R.; visualization, X.L.; supervision, Y.D.; project administration, Q.X.; funding acquisition, Y.D. All authors have read and agreed to the published version of the manuscript.

Funding

This work was financially supported by the Key Science and Technology Program of Henan Province (Grant No. 242102320003, 232102320186), Henan Provincial Natural Science Foundation (Grant No. 252300421535), and the Open Project of Henan Key Laboratory of Grain and Oil Storage Facility and Safety (Grant No. 2024KF06, 2023KF05, 2022KF02).

Data Availability Statement

The data presented in this study are available on request from the corresponding author.

Acknowledgments

We would like to express our gratitude to the Structural Laboratory of Henan University of Technology for providing the venue and experimental equipment support.

Conflicts of Interest

Author Zhiyao Zhou was employed by Henan University of Technology Design and Research Academy Co., Ltd. The remaining authors declare that the research was conducted in the absence of any commercial or financial relationships that could be construed as a potential conflict of interest.

References

  1. Hu, Y.M.; Duan, J.F. Mechanical characteristics and earthquake damage mechanism analysis of grain silos. Mod. Food 2023, 29, 1–3+7. [Google Scholar]
  2. Jin, L.Z.; Cai, J.Q.; Pan, Y.H.; Xie, Z.S. Post-earthquake damage detection and analysis of reinforced concrete group silo structures. Build. Struct. 2020, 50, 896–900. [Google Scholar]
  3. Gu, X.L.; Zhang, B.; Wang, Y.; Wang, X.L. Experimental investigation and numerical simulation on progressive collapse resistance of RC frame structures considering beam flange effects. J. Build. Eng. 2021, 42, 102797. [Google Scholar] [CrossRef]
  4. Jiang, C.Q. Review of seismic damage in reinforced concrete elevated silos. World Earthq. Eng. 1987, 3, 17–23+51. [Google Scholar]
  5. Wang, J.P.; Huang, Y. Present Condition and outlook for earthquake-resistant research on silos in our country. Ind. Constr. 2005, 35, 79–81+90. [Google Scholar]
  6. Holler, S.; Meskouris, K. Granular Material Silos under Dynamic Excitation: Numerical Simulation and Experimental Validation. J. Struct. Eng. 2006, 132, 1573–1579. [Google Scholar] [CrossRef]
  7. EN1998-1/AC-2015; Eurocode 8: Design of Structures for Earthquake Resistance-Part 1: General Rules, Seismic Actions and Rules for Buildings. European Committee for Standardization: Brussels, Belgium, 2015.
  8. Makhinko, N. Stochastic methods of steel constructions’calculation of the silo capacities at the seismic stability. Proc. Natl. Aviat. Univ. 2018, 4, 57–64. [Google Scholar] [CrossRef]
  9. Furinghetti, M.; Mansour, S.; Marra, M.; Silvestri, S.; Lanese, I.; Weber, F.; Pavese, A. Shaking table tests of a full-scale base-isolated flat-bottom steel silo equipped with curved surface slider bearings. Soil. Dyn. Earthq. Eng. 2024, 176, 108321. [Google Scholar] [CrossRef]
  10. Mansour, S.; Pieraccini, L.; Palermo, M.; Foti, D.; Gasparini, G.; Trombetti, T.; Silvestri, S. Comprehensive review on the dynamic and seismic behavior of flat-bottom cylindrical silos filled with granular material. Front. Built Environ. 2022, 7, 805014. [Google Scholar] [CrossRef]
  11. Benkhellat, S.; Kada, O.; Seghir, A.; Kadri, M. Seismic damage assessment of reinforced concrete grain silos. Int. J. Struct. Stab. Dyn. 2022, 22, 2250005. [Google Scholar] [CrossRef]
  12. Hussein, H.A.; Risan, K.H. Seismic Analysis of Reinforced Concrete Silos under Far-Field and Near-Fault Earthquakes. Struct. Durab. Health Monit. 2022, 16, 213–233. [Google Scholar] [CrossRef]
  13. Demir, A.D.; Livaoglu, R. The role of slenderness on the seismic behavior of ground-supported cylindrical silos. Adv. Concr. Constr. 2019, 7, 65. [Google Scholar] [CrossRef]
  14. Chen, J.; Ding, Y.; Xu, Q.; Liu, Q.; Cheng, X. Seismic response of column-supported silos considering granular–structure interaction. Earthq. Eng. Struct. Dyn. 2024, 53, 3983–4005. [Google Scholar] [CrossRef]
  15. Chen, J.; Ding, Y.; Xu, Q.; Cheng, X. Research on seismic response of elevated silo by coupling discrete-finite element method. Soil. Dyn. Earthq. Eng. 2025, 192, 109287. [Google Scholar] [CrossRef]
  16. Chen, J.; Ding, Y.; Xu, Q.; Liu, Q.; Zhou, Y. Evaluation method and experimental study on seismic performance of column-supported group silo. Struct. Eng. Mech. Int. J. 2024, 90, 577–590. [Google Scholar] [CrossRef]
  17. Ding, Y.; Suo, H.; Xu, Q.; Chen, J.; Liu, Q. Study on the Calculation Method of Effective Mass of Column-Supported Silo under Earthquake Action. KSCE J. Civ. Eng. 2024, 28, 5223–5237. [Google Scholar] [CrossRef]
  18. Shi WXZhu, B.L. Experimental study on seismic response of reinforced concrete circular silo. Spec. Struct. 1994, 11, 55–58. [Google Scholar]
  19. Jiang, H.; Xie, H.J.; Guo, P.Y. Seismic response analysis of cylinder reinforced concrete silo supported by columns-cylinder. Sichuan Build. Sci. 2012, 38, 167–171. [Google Scholar]
  20. Ding, Y.G.; Luo, Q.; Xu, Q.K.; Li, X.; Li, Q.; Zhou, Z. Experimental study on lateral pressure of column-supported silo under earthquake. World Earthq. Eng. 2021, 37, 119–128. [Google Scholar]
  21. Ma, Y.R. Torsional effect of silos under earthquake action. Earthq. Resist. Eng. Retrofit. 1981, 32–35+47. [Google Scholar]
  22. Zhang, D.Y. Dynamic Parameters Research for Reinforced Concrete Silos Based on Improved Data-Driven Stochastic Subspace Method. Ph.D. Dissertation, Hefei University of Technology, Hefei, China, 2011. [Google Scholar]
  23. Pan, X.; Li, P.; Yang, J.; Zheng, B.; Jia, L. Seismic responses and vulnerability assessment of column-bearing silos with soil-structure interaction. Soil. Dyn. Earthq. Eng. 2024, 187, 108956. [Google Scholar] [CrossRef]
  24. Yang, J.; Zhang, F.; Li, P.; Jing, H. Seismic performance of column-bearing silo structure with granular materials considering SSI effect. Structures 2023, 47, 595–606. [Google Scholar] [CrossRef]
  25. Yu, J.; Tan, K.H. Structural behavior of RC beam-column subassemblages under a middle column removal scenario. J. Struct. Eng. 2013, 139, 233–250. [Google Scholar] [CrossRef]
  26. Khalil, M.; Ruggieri, S.; Tateo, V.; Butenweg, C.; Nascimbene, R.; Uva, G. Assessment of the seismic overpressure in flat bottom steel silos based on advanced FE modelling approach. Soil. Dyn. Earthq. Eng. 2025, 190, 109149. [Google Scholar] [CrossRef]
  27. Yang, J.; Li, Q.; Zhang, T.; Jia, L.; Li, P. Comparative study on the seismic performance of column-supported silos: Single, row, and group configurations under different storage conditions. Earthq. Eng. Resil. 2024, 3, 637–660. [Google Scholar] [CrossRef]
  28. Benkhellat, S.; Kadri, M.; Seghir, A. Numerical investigation of the effects of soil-structure and granular material-structure interaction on the seismic response of a flat-bottom reinforced concrete silo. Earthq. Eng. Eng. Vib. 2024, 23, 609–623. [Google Scholar] [CrossRef]
  29. Shimanovsky, O.; Makhinko, A.; Makhinko, N.; Vorontsov, O.; Kordun, O. Probabilistic analysis of elevated steel silos for seismic resistance. IOP Conf. Ser. Earth Environ. Sci. 2024, 1376, 012019. [Google Scholar] [CrossRef]
  30. Zhang, D.; Yang, Q.; Wang, S. Research on seismic response and dynamic lateral pressure of the silo model under dynamic interaction between granular materials and the silo wall. Struct. Concr. 2024, 25, 1988–1998. [Google Scholar] [CrossRef]
  31. Durmus, A.D.; Ramazan, L. SSI effects on seismic response of RC flat-bottom circular silos. Structures 2023, 57, 105296. [Google Scholar] [CrossRef]
  32. Yang, J.; Feng, G.; Jing, H.; Zhang, F. Seismic response and theoretical analysis of grain bulk material-steel silo structure under earthquake action. J. Constr. Steel Res. 2023, 211, 108207. [Google Scholar] [CrossRef]
  33. Li, X.; Ding, Y.; Liu, Q.; Xu, Q. Experimental study on horizontal pressure of column-supported concrete group silos under earthquake force. J. Asian Archit. Build. Eng. 2023, 22, 2827–2838. [Google Scholar] [CrossRef]
  34. Li, B.K. Torsion effect of column storage (group) warehouse under horizontal earthquake. J. Xi’an Univ. Archit. Technol. (Nat. Sci. Ed.) 1990, 1, 83–90. [Google Scholar]
  35. Wang, S.; Peng, J.; Kang, S.B. Evaluation of compressive arch action of reinforced concrete beams and development of design method. Eng. Struct. 2019, 191, 479–492. [Google Scholar] [CrossRef]
  36. Deng, X.-F.; Liang, S.-L.; Fu, F.; Qian, K. Effects of high-strength concrete on progressive collapse resistance of reinforced concrete frame. J. Struct. Eng. 2020, 146, 04020078. [Google Scholar] [CrossRef]
  37. Pham, A.T.; Pham, X.D.; Tan, K.H. Slab corner effect on torsional behaviour of perimeter beams under missing column scenario. Mag. Concr. Res. 2019, 71, 611–623. [Google Scholar] [CrossRef]
  38. Khalil, M.; Ruggieri, S.; Tateo, V.; Nascimbene, R.; Uva, G. A numerical procedure to estimate seismic fragility of cylindrical ground-supported steel silos containing granular-like material. Bull. Earthq. Eng. 2023, 21, 5915–5947. [Google Scholar] [CrossRef]
  39. Zhang, G.; Zeng, R. Formula Derivation and Analysis of the Seismic Lateral Pressure of Squat Silos. Sustainability 2023, 15, 5098. [Google Scholar] [CrossRef]
  40. Jing, H.; Wang, X.; Yang, J.; Chen, H. Static and seismic pressure of cylindrical steel silo model with granular materials. J. Constr. Steel Res. 2022, 198, 107515. [Google Scholar] [CrossRef]
Figure 1. Column-supported vertical-group silo structure.
Buildings 15 01851 g001
Figure 2. Dimension diagram of a column-supported vertical-silo group model.
Buildings 15 01851 g002
Figure 3. Counterweight layout of a column-supported silo group test model.
Buildings 15 01851 g003
Figure 4. Material mechanical performance tests of acrylic glass and ceramic bead granules.
Buildings 15 01851 g004
Figure 5. Storage conditions for the silo model: empty–empty–empty silo (EEE), half–empty–empty silo (HEE), full–empty–empty silo (FEE), full–half-empty silo (FHE), full–full-empty silo (FFE), and full–full–full silo (FFF).
Buildings 15 01851 g005
Figure 6. Layout of the acceleration and displacement sensors.
Buildings 15 01851 g006
Figure 7. Sinking of the storage material at the end of the test.
Buildings 15 01851 g007
Figure 8. Test phenomena of the structural model under different storage conditions: empty–empty–empty silo (EEE), half–empty–empty silo (HEE), full–empty–empty silo (FEE), full–half-empty silo (FHE), full–full-empty silo (FFE), and full–full–full silo (FFF).
Buildings 15 01851 g008
Figure 9. Natural frequency of a column-supported group silo structure under different conditions.
Buildings 15 01851 g009
Figure 10. Extreme value distribution of the acceleration response in silo No. 1.
Buildings 15 01851 g010
Figure 11. Sketch of the torsional displacement ratio.
Buildings 15 01851 g011
Figure 12. Torsional displacement ratio of the model.
Buildings 15 01851 g012
Figure 13. FEM–DEM numerical model of a column-supported vertical-group silo structure (1 row × 3 columns).
Buildings 15 01851 g013
Figure 14. Comparison of the acceleration responses between the experimental and numerical models.
Buildings 15 01851 g014
Figure 15. Comparison between the experimental and numerical models in terms of the displacement responses.
Buildings 15 01851 g015
Figure 16. Analysis of the eccentricity impact.
Buildings 15 01851 g016
Figure 17. Analysis of the impact of the quality profit-to-loss ratio.
Buildings 15 01851 g017
Figure 18. Torsional displacement ratio under different combination forms.
Buildings 15 01851 g018
Table 1. Similarity relationship of the test model structure.
ParametersSimilarity RatioPhysical QuantitySimilarity Ratio
Length (l)1:25Modulus of elasticity (E)1:10
Mass (m)1:(1.28 × 10⁻⁴)Stress (σ)1:10
Density (ρ)1:0.5Frequency (f)1:0.59
Period (T)1:5.59Displacement (s)1:25
Stiffness (k)1:250Acceleration (a)1:0.8
Damping (c)1:(7.15 × 10⁻⁵)
Table 2. Acrylic glass performance test results.
Material CategoryMechanical Performance IndexMaterial Category
PlexiglassDensity ρ (kg/m3)Plexiglass
Tensile strength σl (MPa)
Compressive strength σc (MPa)
Torsional strength c (MPa)
Elastic modulus E (MPa)
Shear modulus G (MPa)
Ceramic bead particlesInternal friction angle of ceramic bead particles φ1 (°)Ceramic bead particles
Friction angle between ceramic bead particles and plexiglass surface φ2 (°)
Coefficient of internal friction of ceramic bead particles μ1
Friction coefficient between ceramic bead particles and plexiglass surface μ2
Density of ceramic bead particles ρ (kg/m3)
Table 3. Test loading condition.
Serial NumberSeismic WaveInput Acceleration Peaks Under Different Storage Conditions apg/g
EEEHEEFEEFHEFFEFFF
1White noise0.050.050.050.050.050.05
2El-Centro0.10.10.10.10.10.1
3Wenchuan0.10.10.10.10.10.1
4Artificial wave0.10.10.10.10.10.1
5White noise0.050.050.050.050.050.05
6El-Centro0.20.20.20.20.20.2
7Wenchuan0.20.20.20.20.20.2
8Artificial wave0.20.20.20.20.20.2
9White noise0.050.050.050.050.050.05
10El-Centro0.300.300.300.300.300.30
11Wenchuan0.300.300.300.300.300.30
12Artificial wave0.300.300.300.300.300.30
13White noise0.050.050.050.050.050.05
14El-Centro0.400.400.400.400.400.40
15Wenchuan0.400.400.400.400.400.40
16Artificial wave0.400.400.400.400.400.40
17White noise0.050.050.050.050.050.05
Note: empty–empty–empty silo (EEE), half-empty–empty silo (HEE), full-empty–empty silo (FEE), full–half-empty silo (FHE), full–full-empty silo (FFE), and full–full–full silo (FFF).
Table 4. Damping ratio of the model (ζ/%).
Working ConditionStorage Conditions
EEEHEEFEEFHEFFEFFF
13.223.923.954.035.557.51
53.523.964.13.595.677.75
93.324.153.733.924.977.86
133.314.233.913.795.427.8
173.493.683.763.9367.57
Average3.323.953.893.835.357.72
Table 5. Natural frequency of the silo model (f1/Hz).
Working ConditionStorage Conditions
EEEHEEFEEFHEFFEFFF
111.6211.439.968.28.057.42
511.6111.449.868.188.087.32
911.6211.419.778.28.077.32
1311.6511.439.818.198.087.52
1711.7211.429.778.28.077.32
Average11.6411.439.808.238.057.33
Table 6. Comparison between the experimental and numerical results of the natural frequencies.
First-Order Natural Frequency (Hz)
Test ResultsNumerical Analysis ResultsInaccuracy/%
EEE11.6412.9911.6
HEE11.4311.142.5
FEE9.839.632.0
FHE8.238.432.4
FFE8.078.171.2
FFF7.387.74.3
Note: empty–empty–empty silo (EEE), half–empty–empty silo (HEE), full–empty–empty silo (FEE), full–half-empty silo (FHE), full–full-empty silo (FFE), and full–full–full silo (FFF).
Table 7. The fitting formulas of curves in Figure 16.
CombinationFormulas
1 × 2y = 0.00127x + 0.99792R = 0.97638
1 × 3y = 0.00078x + 0.99691R = 0.89857
1 × 4y = 0.00108x + 0.9987R = 0.98089
1 × 5y = 0.00102x + 0.99042R = 0.92538
2 × 3y = −0.000733x + 0.00001378x2 + 0.99749R = 0.97232
3 × 3y = 0.00219x − 0.0000032587x2 + 1.01742R = 0.30529
Table 8. The fitting formulas of curves in Figure 17.
CombinationFormulas
1 × 2y = −0.42512x + 3.53758x2 − 3.97756x3 + 1.00179R = 0.81126
1 × 3y = −0.49748x + 3.96288x2 − 4.42081x3 + 0.99951R = 0.71097
1 × 4y = −1.01745x + 8.00586x2 − 8.94158x3 + 0.99993R = 0.99565
1 × 5y = 1.75136x−0.61886x2 − 2.31884x3 + 0.99993R = 0.98266
2 × 3y = −0.74238x + 6.29317x2 − 7.28303x3 + 0.99428R = −0.11935
3 × 3y = 0.92596x + 0.52697x2 − 2.01567x3 + 1.01752R = 0.17693
Disclaimer/Publisher’s Note: The statements, opinions and data contained in all publications are solely those of the individual author(s) and contributor(s) and not of MDPI and/or the editor(s). MDPI and/or the editor(s) disclaim responsibility for any injury to people or property resulting from any ideas, methods, instructions or products referred to in the content.

