

Study on Seismic Performance of Frame–Shear Wall Split-Foundation Structures with Shear Walls on Both Grounding Ends

Abstract
1. Introduction
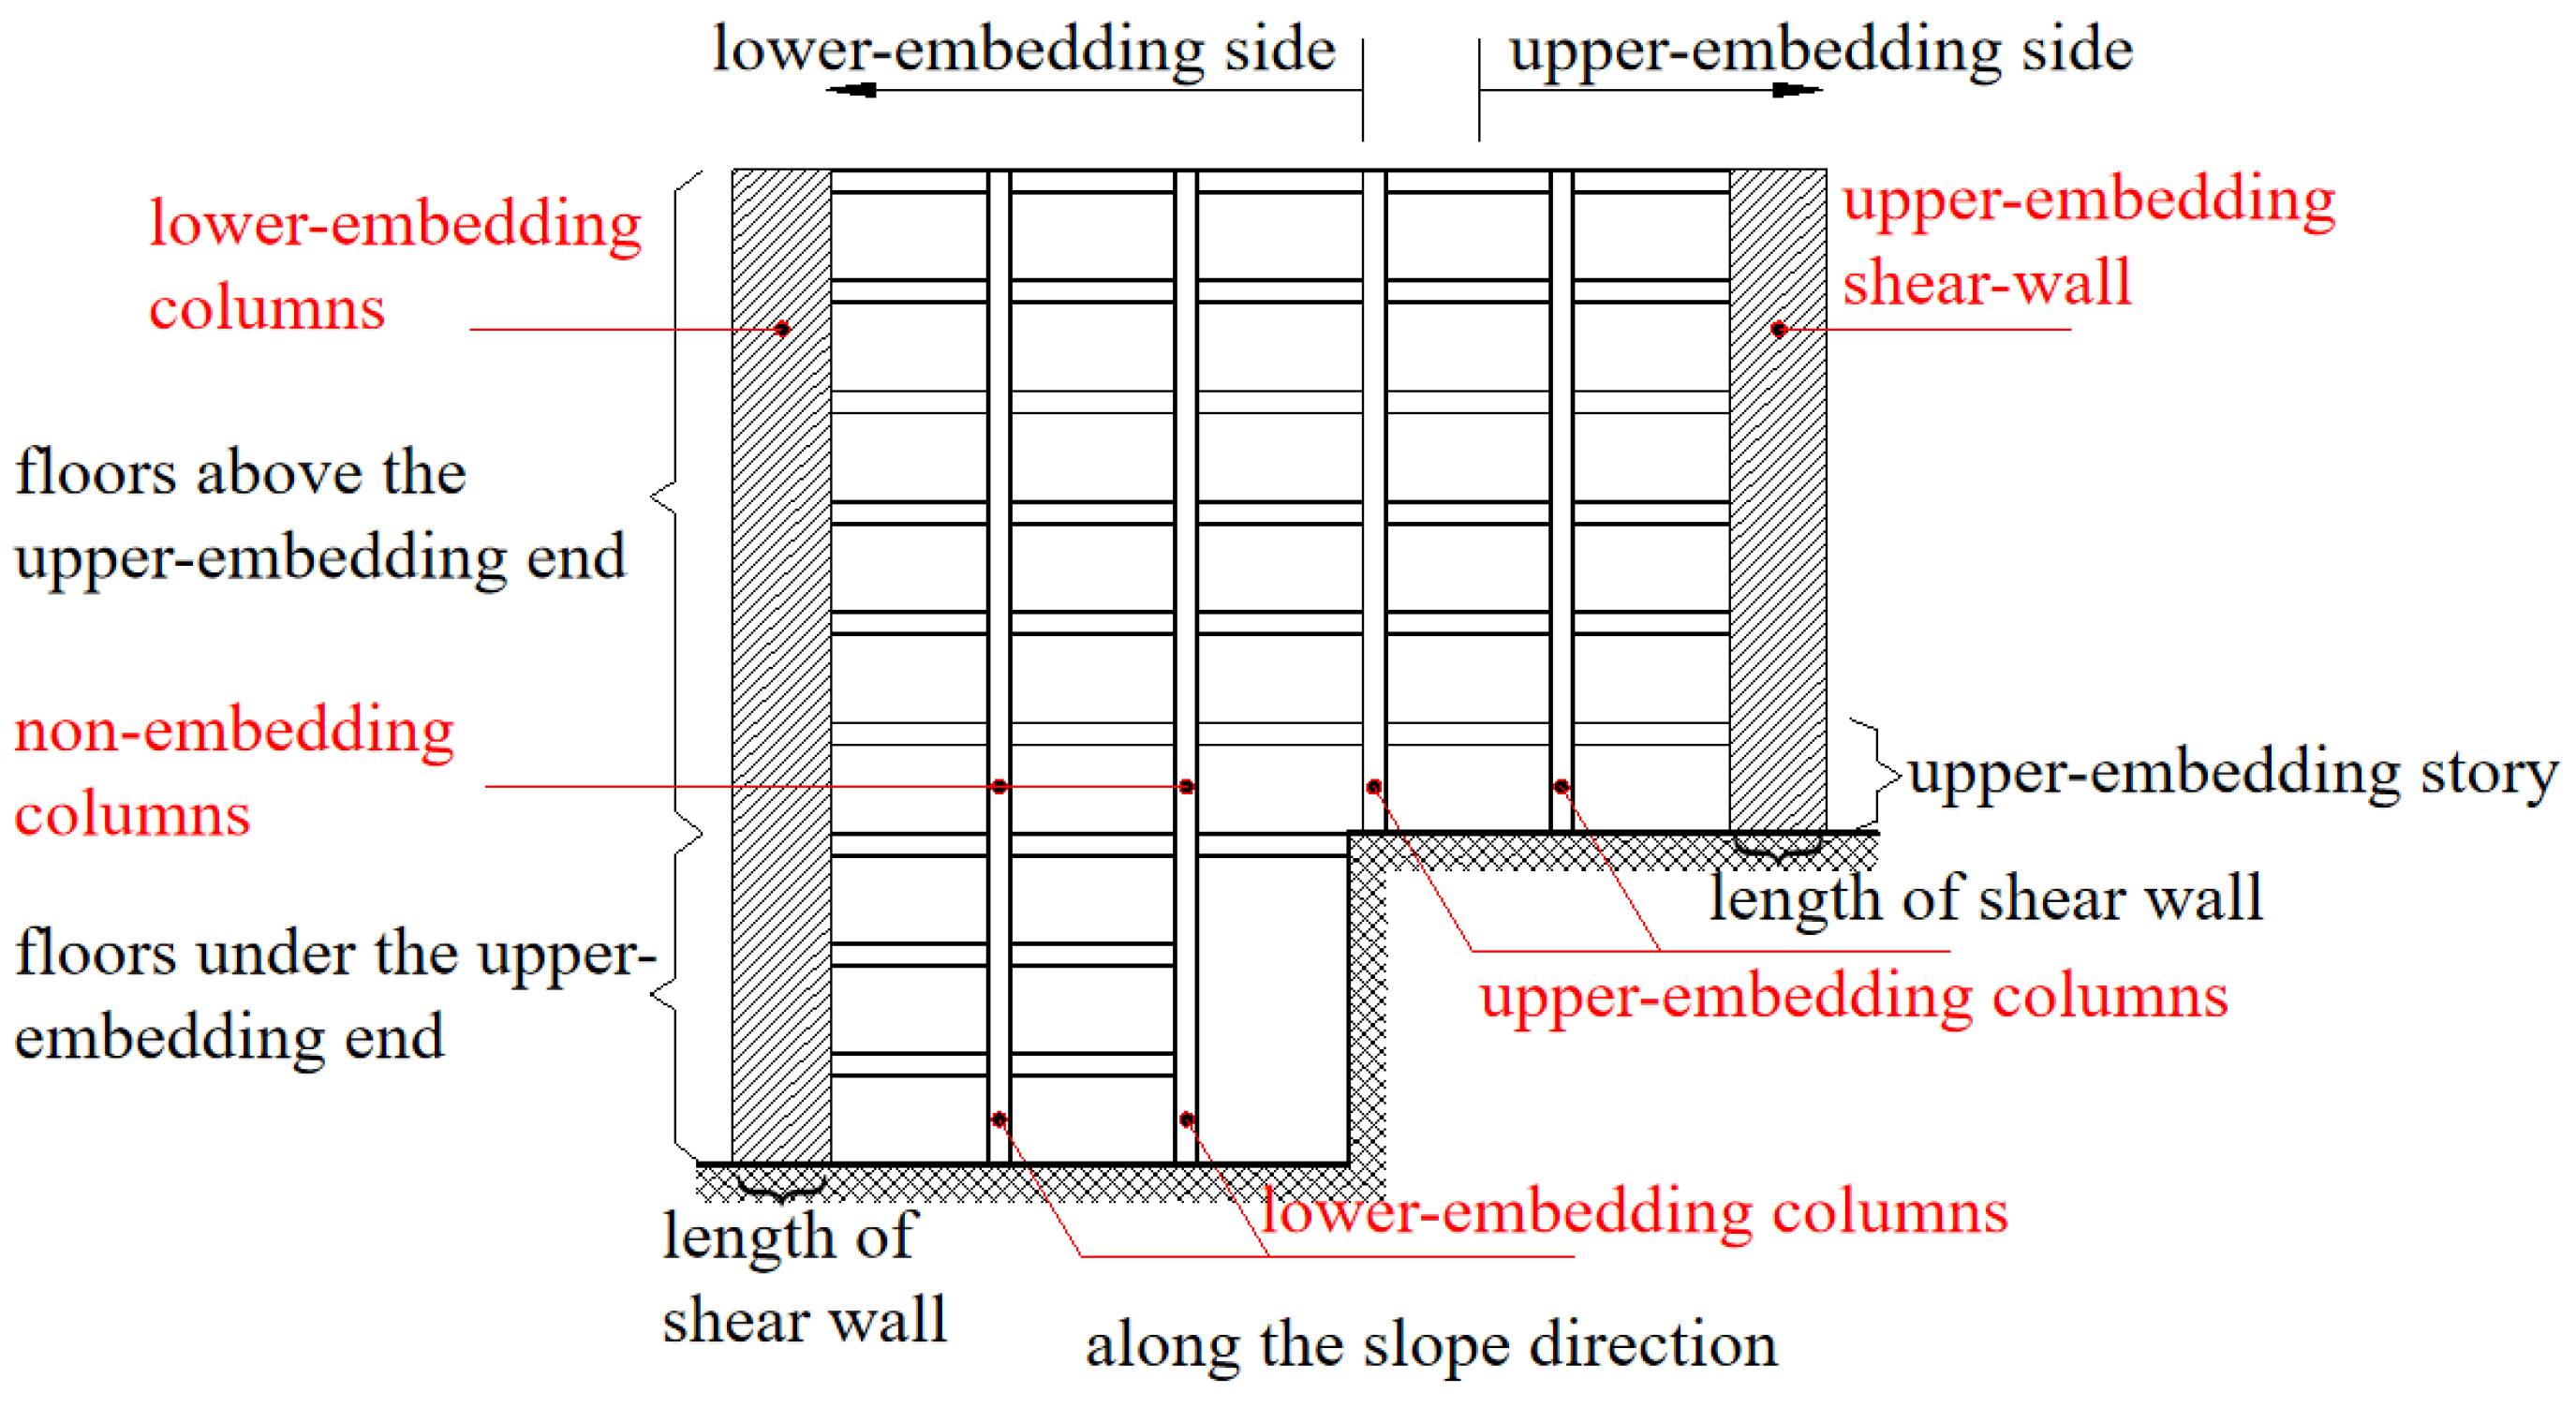
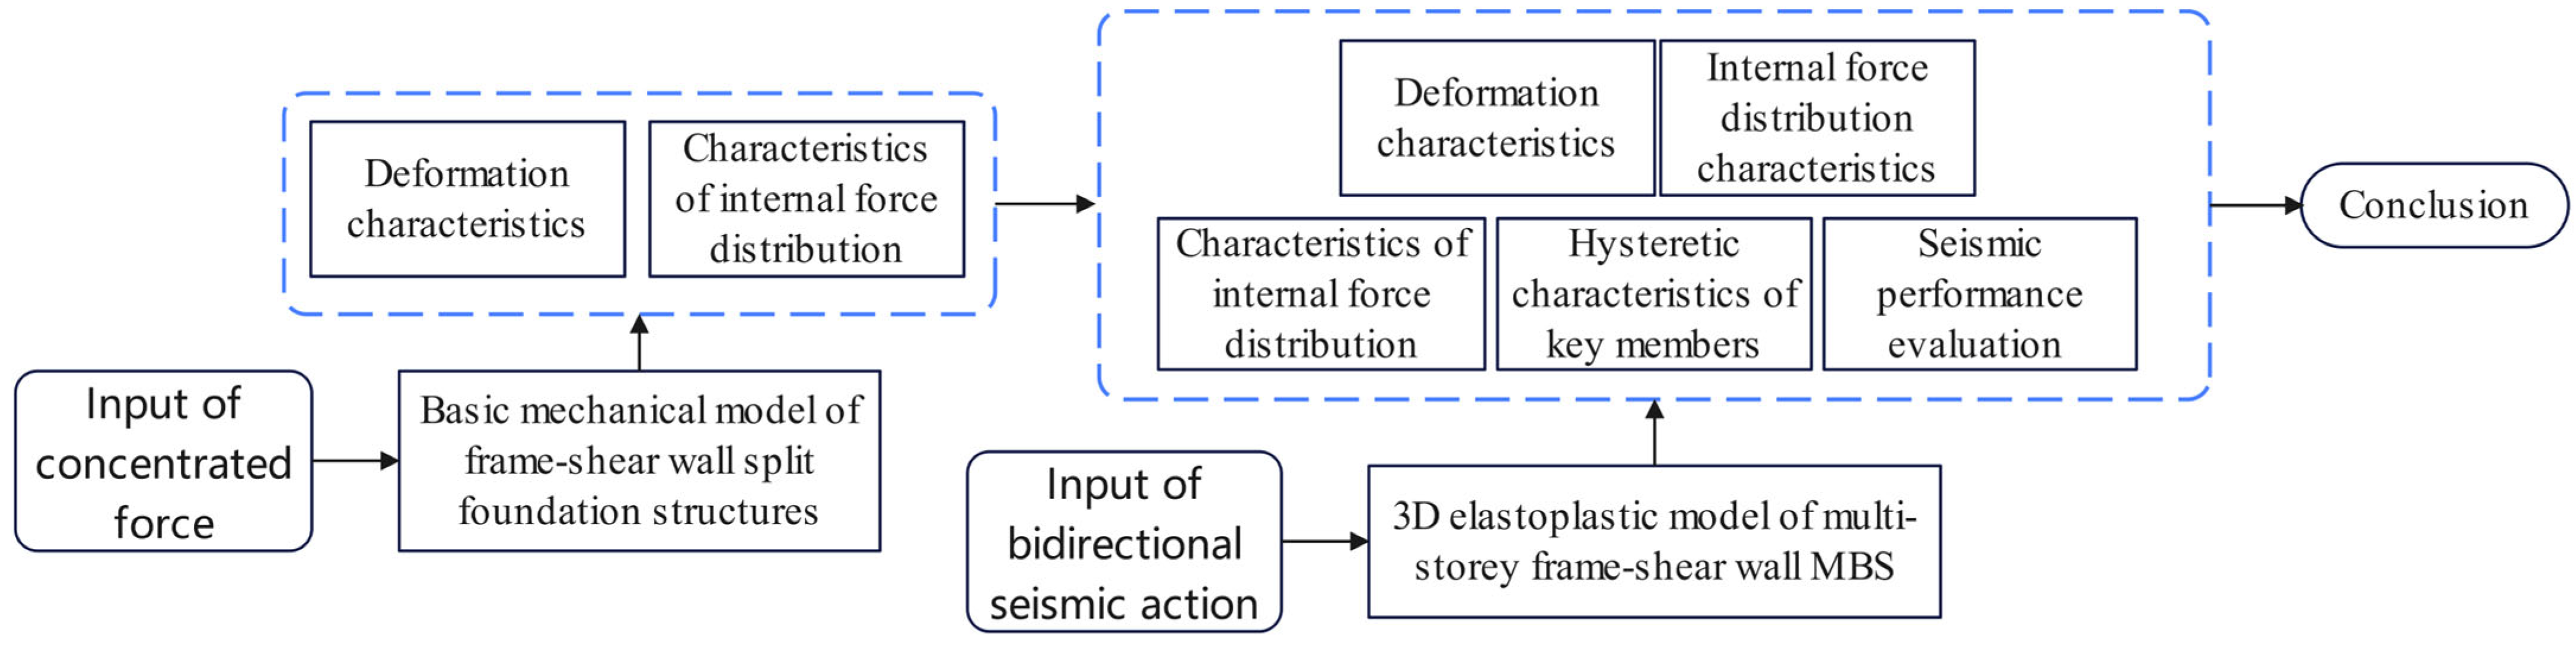
2. Study of the Basic Mechanical Model of Frame–Shear Wall Split-Foundation Structures
2.1. Establishment and Rationality Verification of Basic Mechanical Models of Frame–Shear Wall Split-Foundation Structures
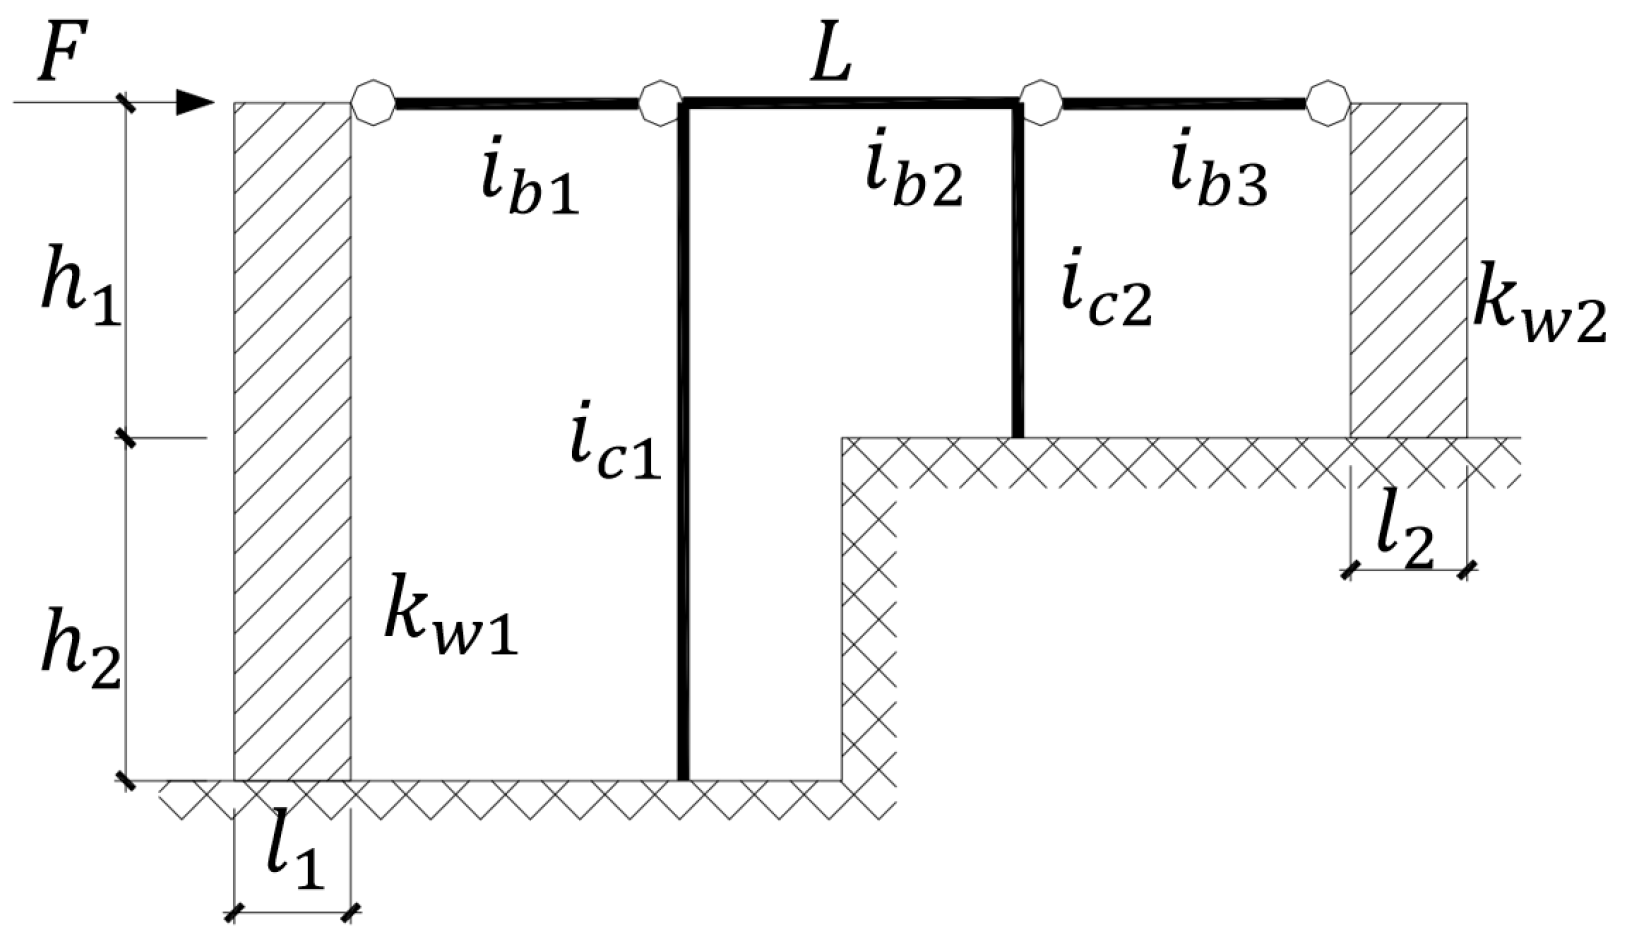
- In this paper, the relative drop-story height (α = h2/h1) was used to characterize the influence of the drop-story height on the overall stiffness of the structure.
- The changes in the in-plane length of the upper embedding shear wall (l2) and the length of the lower embedding shear wall (l1) were used to reflect the influence of the shear wall stiffness on the overall structural stiffness.
- The changes in the linear stiffness of beams and columns (ib and ic) were used to characterize the influence of the frame component stiffness on the overall structural stiffness.
- In the study of planar simplified models of frame–shear wall structures, the two ends of the beam connecting the top of the frame and the top of the shear wall were typically simplified as hinged connections to reduce the total degrees of freedom of the basic mechanical model, thereby simplifying the mathematical expressions describing the stiffness characteristics of frame–shear wall structures. Since the overall stiffness of frame beams is generally lower than that of shear walls and the entire frame under normal conditions, it is reasonable to simplify both ends as hinged connections that only transmit axial forces while ignoring the bending moments transmitted by beams with weaker stiffness. This simplified method of frame–shear wall structure systems is also academically referred to as the hinged frame–shear wall system.
2.2. Study on the Single-Force Response Characteristics of Basic Mechanical Models
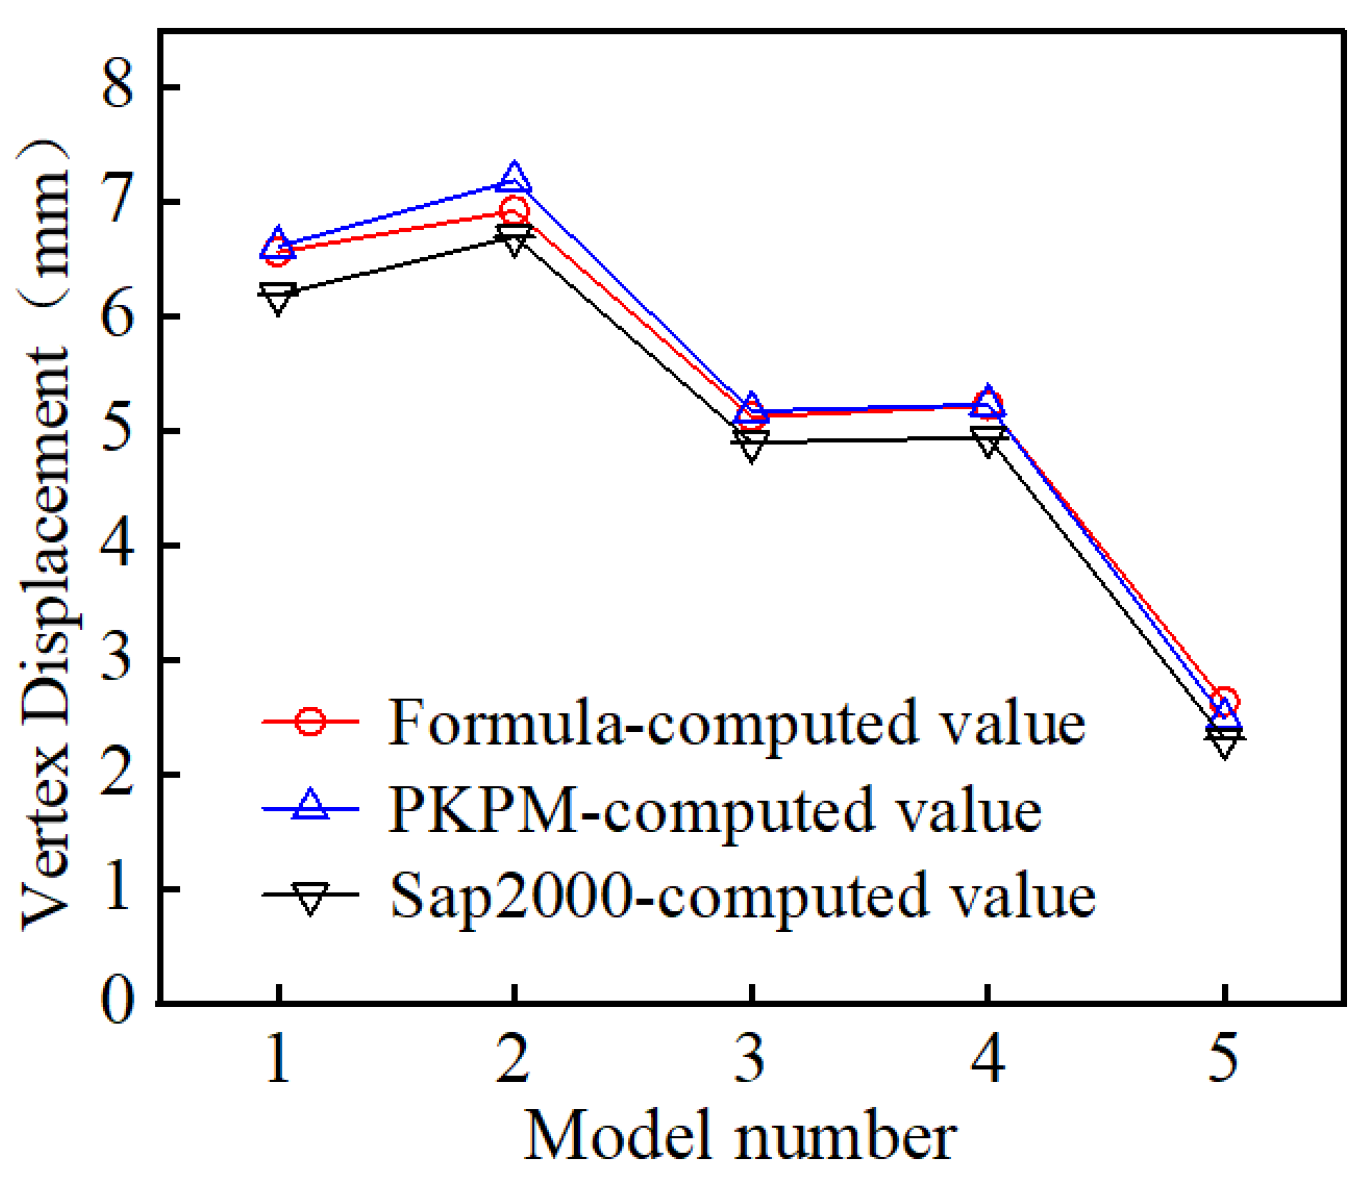
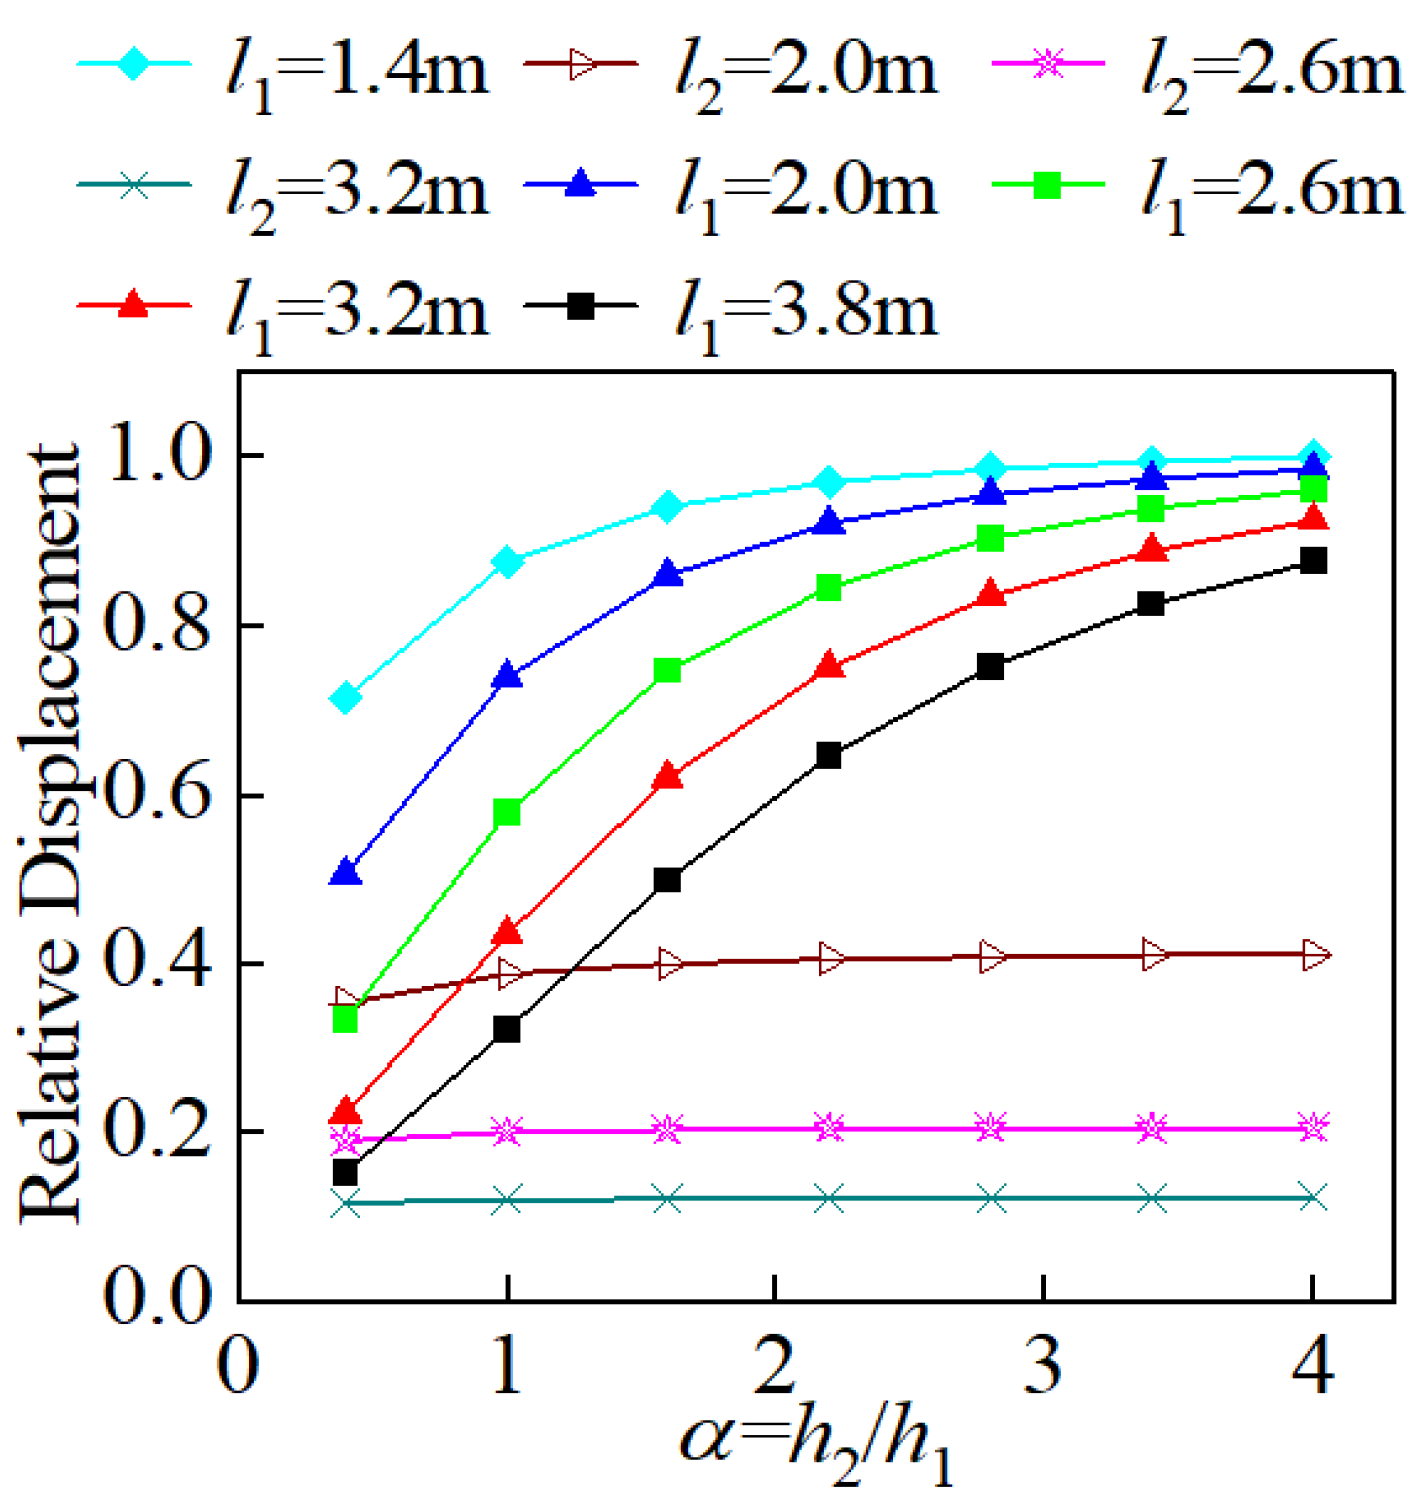
- Through trial calculations, when the value of the relative drop height α exceeded 4, increasing the length of the lower embedding shear wall or the upper embedding shear wall, the relative displacement values at the structure’s top exhibited minimal growth with the increase in α. Additionally, when adjusting the length of the lower grounded shear wall, the vertex displacements of each model showed little difference.
- To maintain consistent intervals between research data points, we took 8 data points starting from 4, which led us to α = 0.4 as the lower limit of the research. When the relative drop-story height α was less than 0.4, it indicated that the drop-story height was relatively small compared to the height above the upper grounding end of the structure; when α equaled 0, it meant no drop-story height existed, and the structure became a typical frame–shear wall structure with only one grounding end. Therefore, data points for α = 0 were not included.
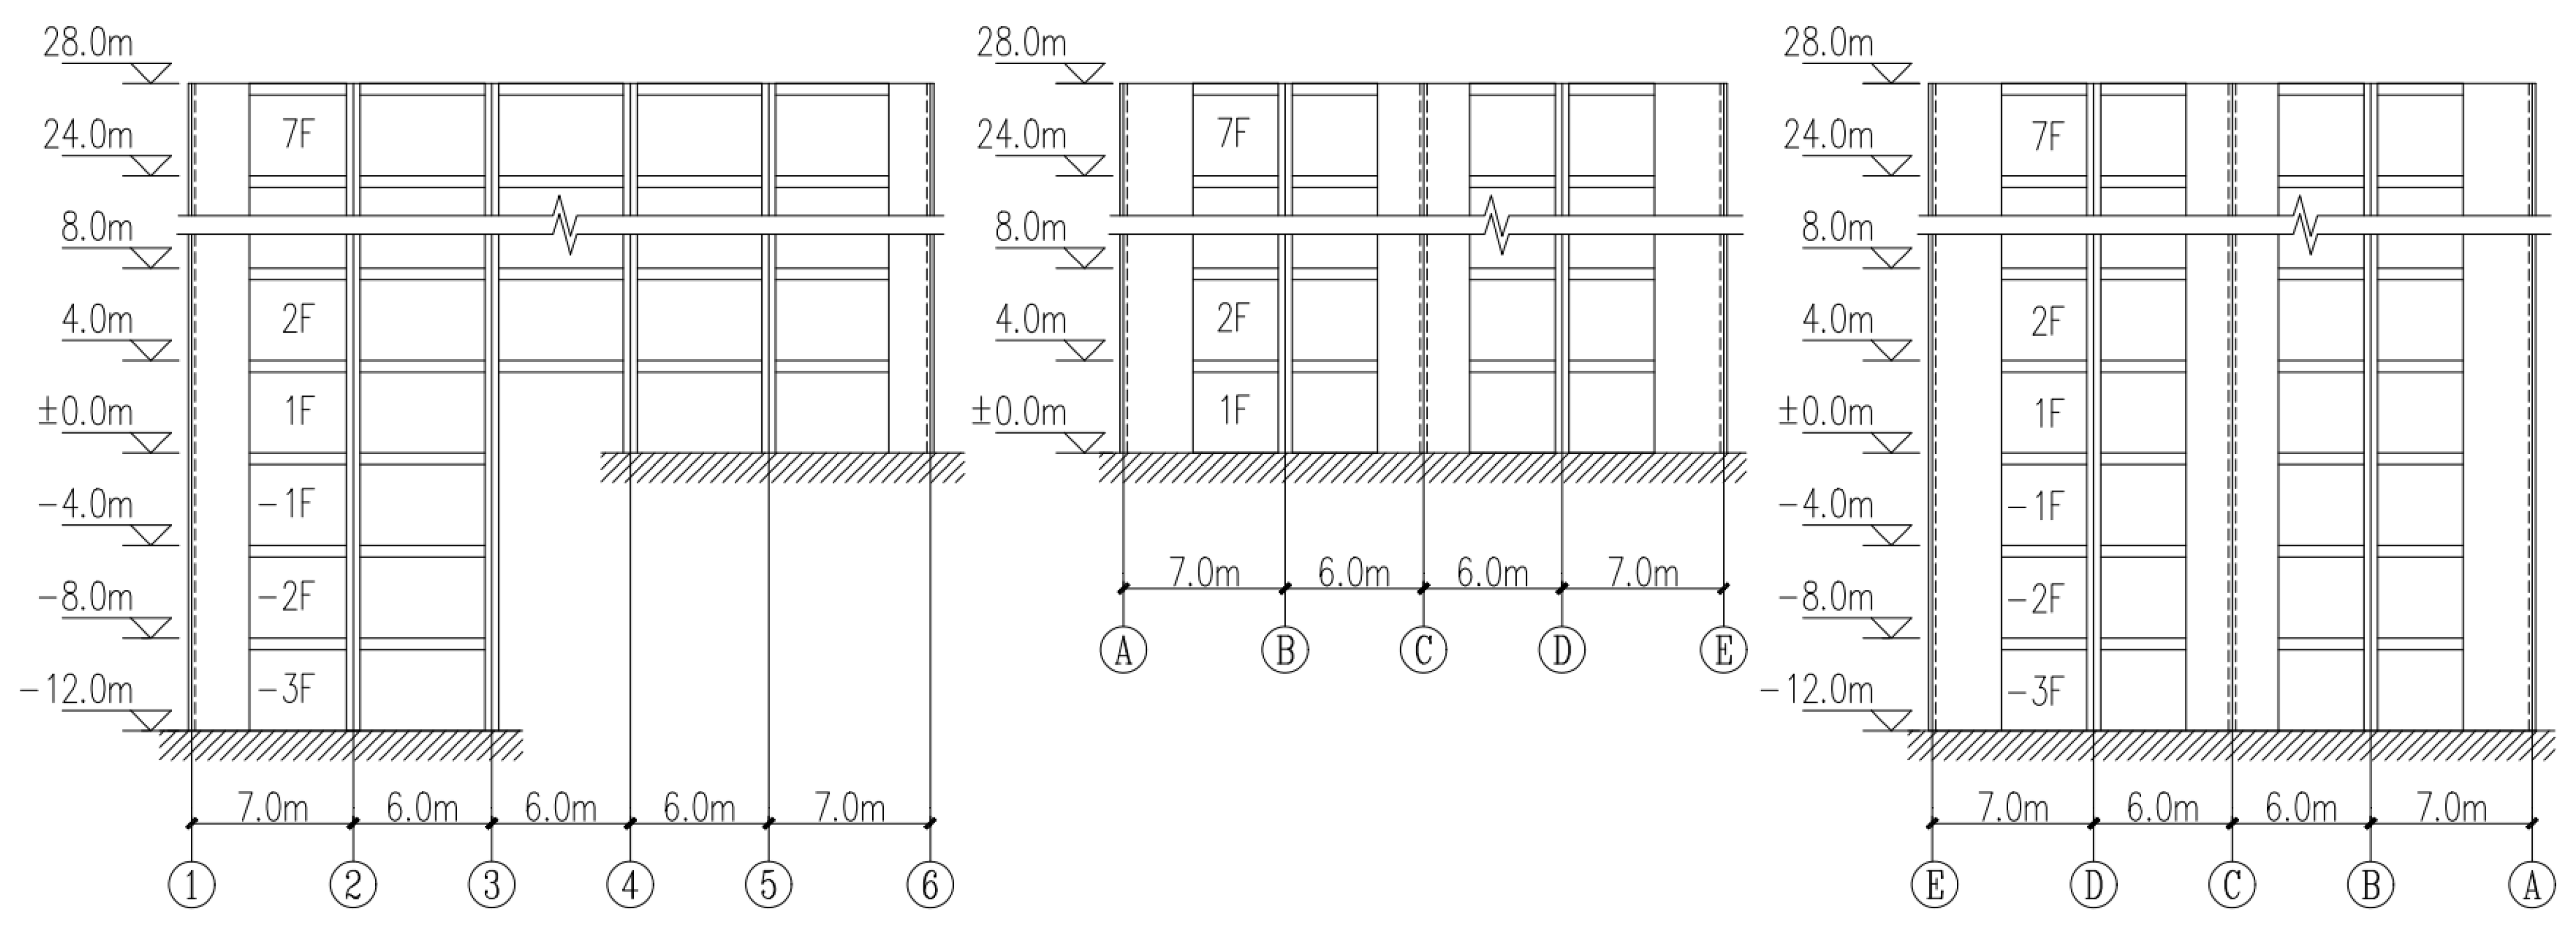
3. Seismic Time History Analysis of 3D Multi-Story Frame–Shear Wall Split-Foundation Structures
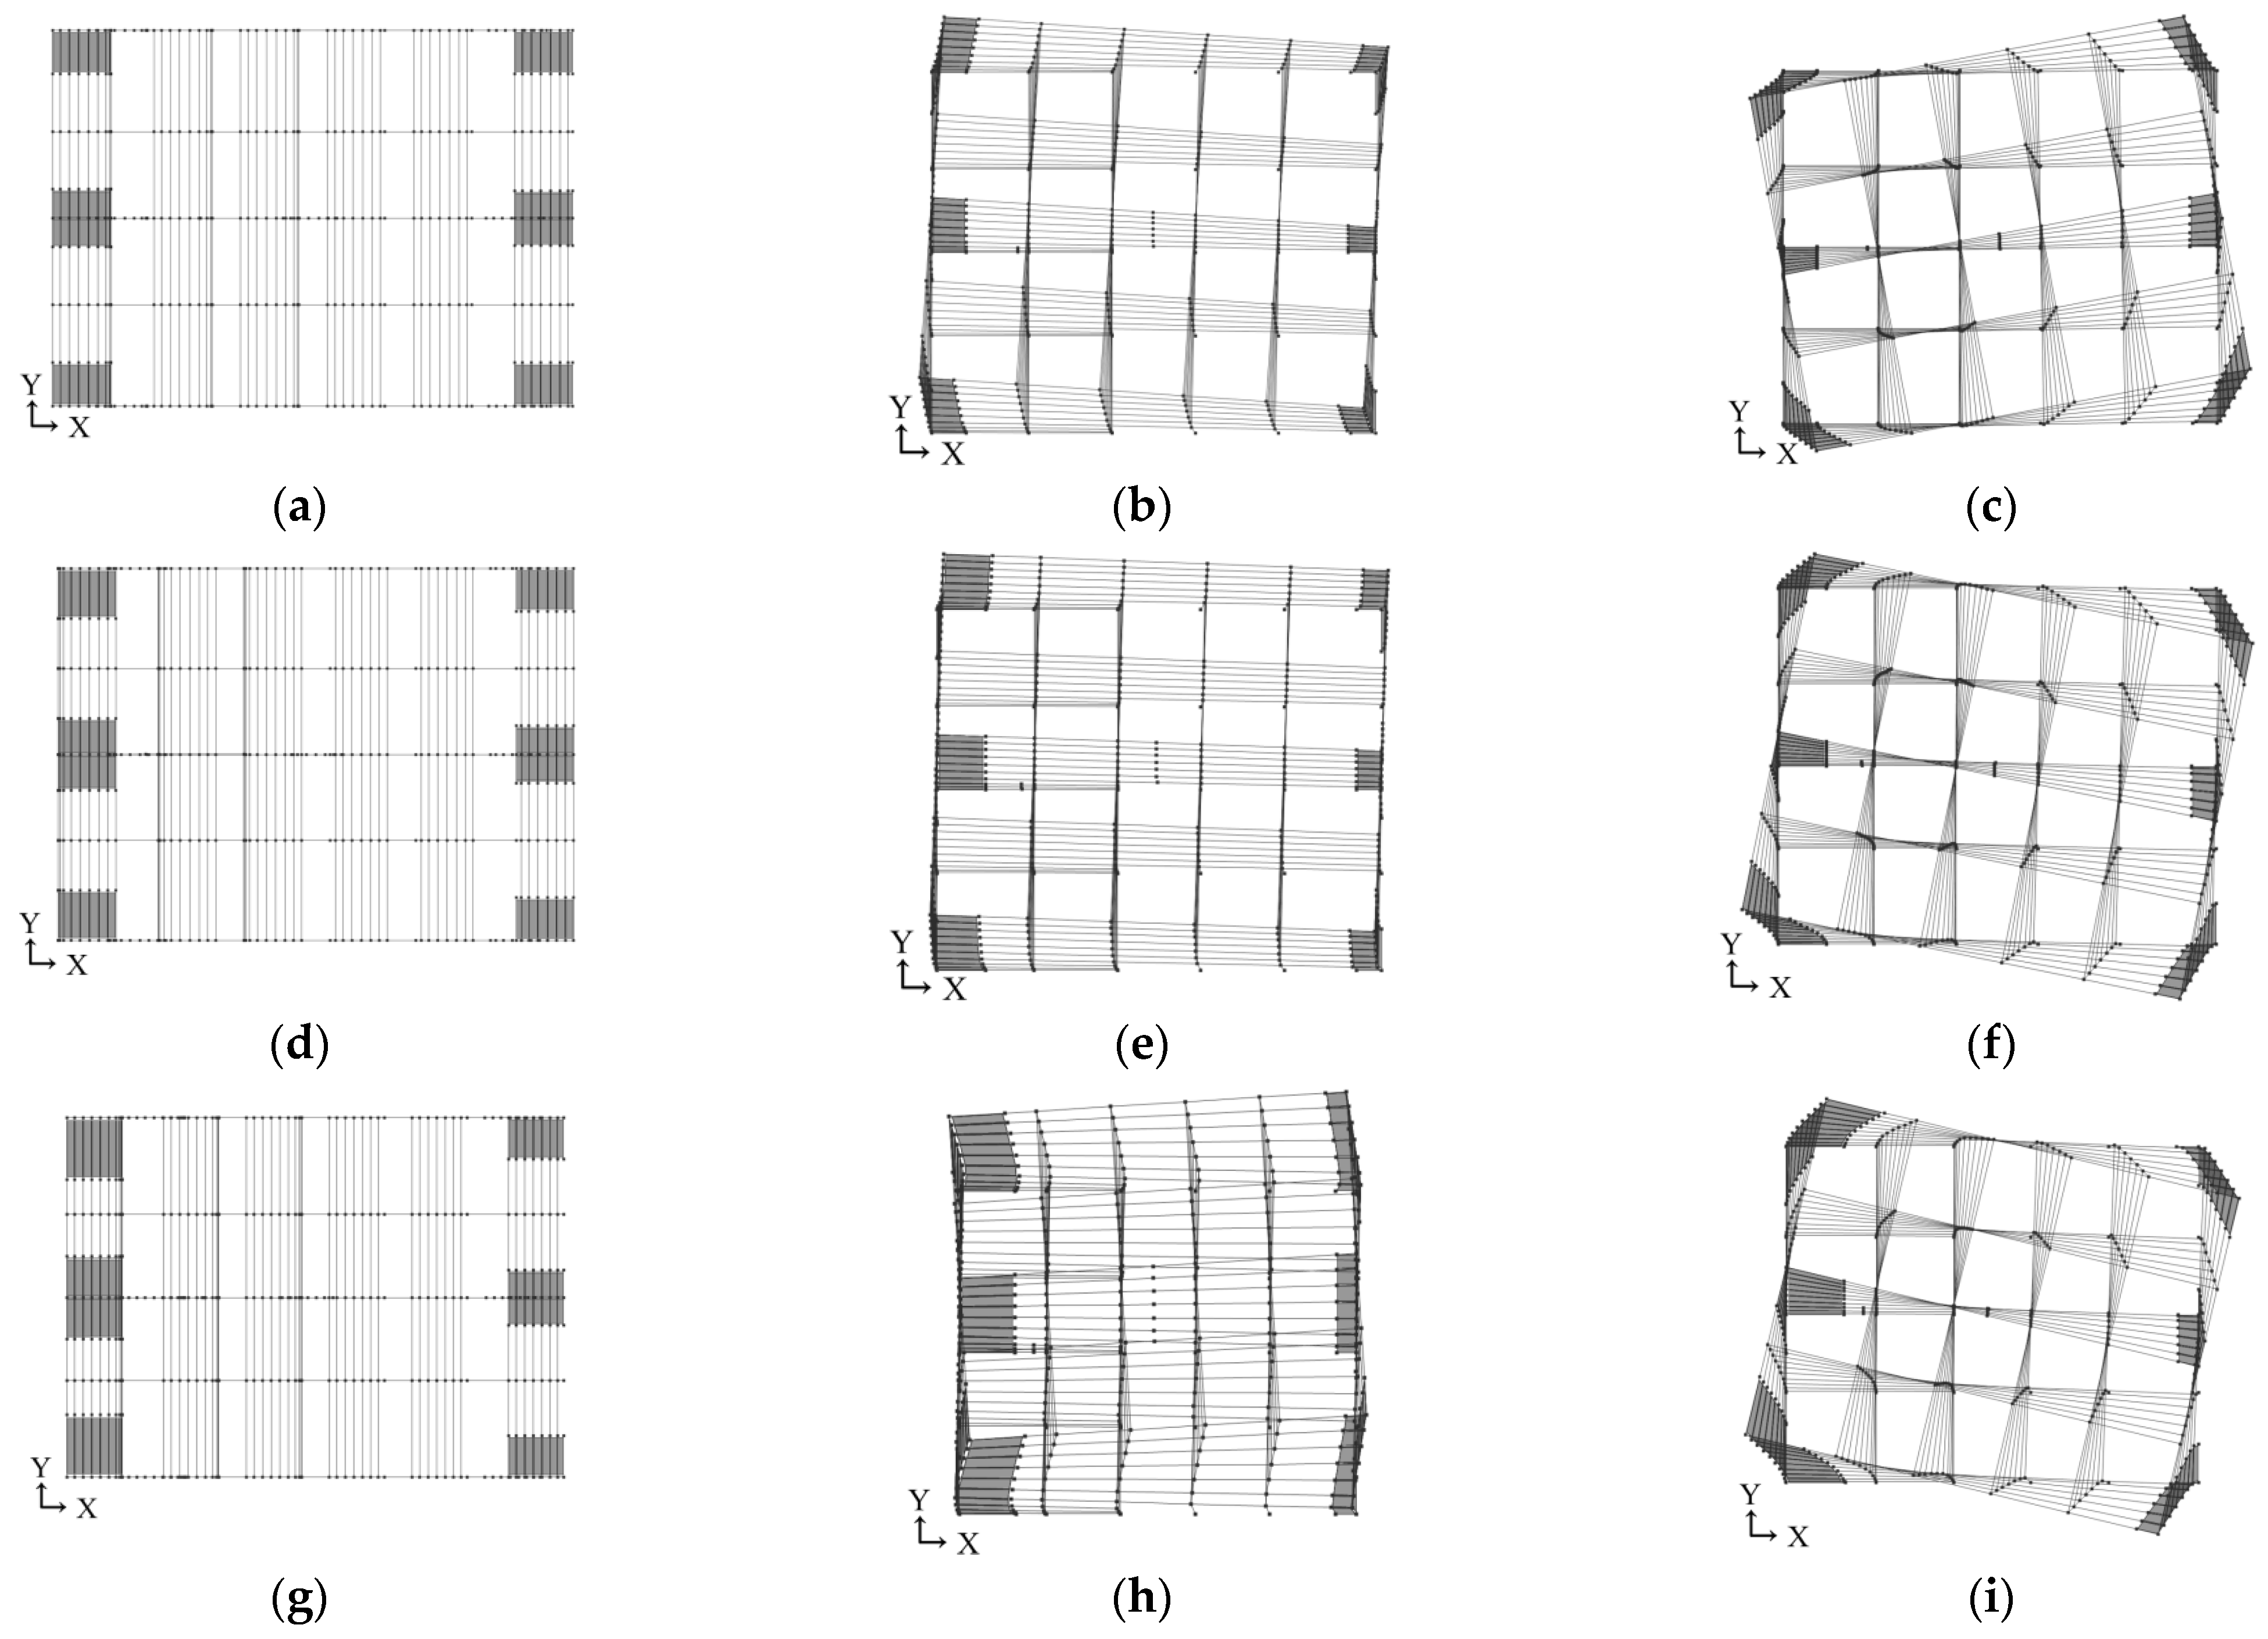
3.1. Development of Analytical Models and Selection of Seismic Waves
3.2. Selection of Seismic Waves and Constitutive Relationships for Structural Elastoplastic Analysis Models
3.3. Bidirectional Seismic Time History Analysis of Typical Multi-Story Frame–Shear Wall Split-Foundation Structures
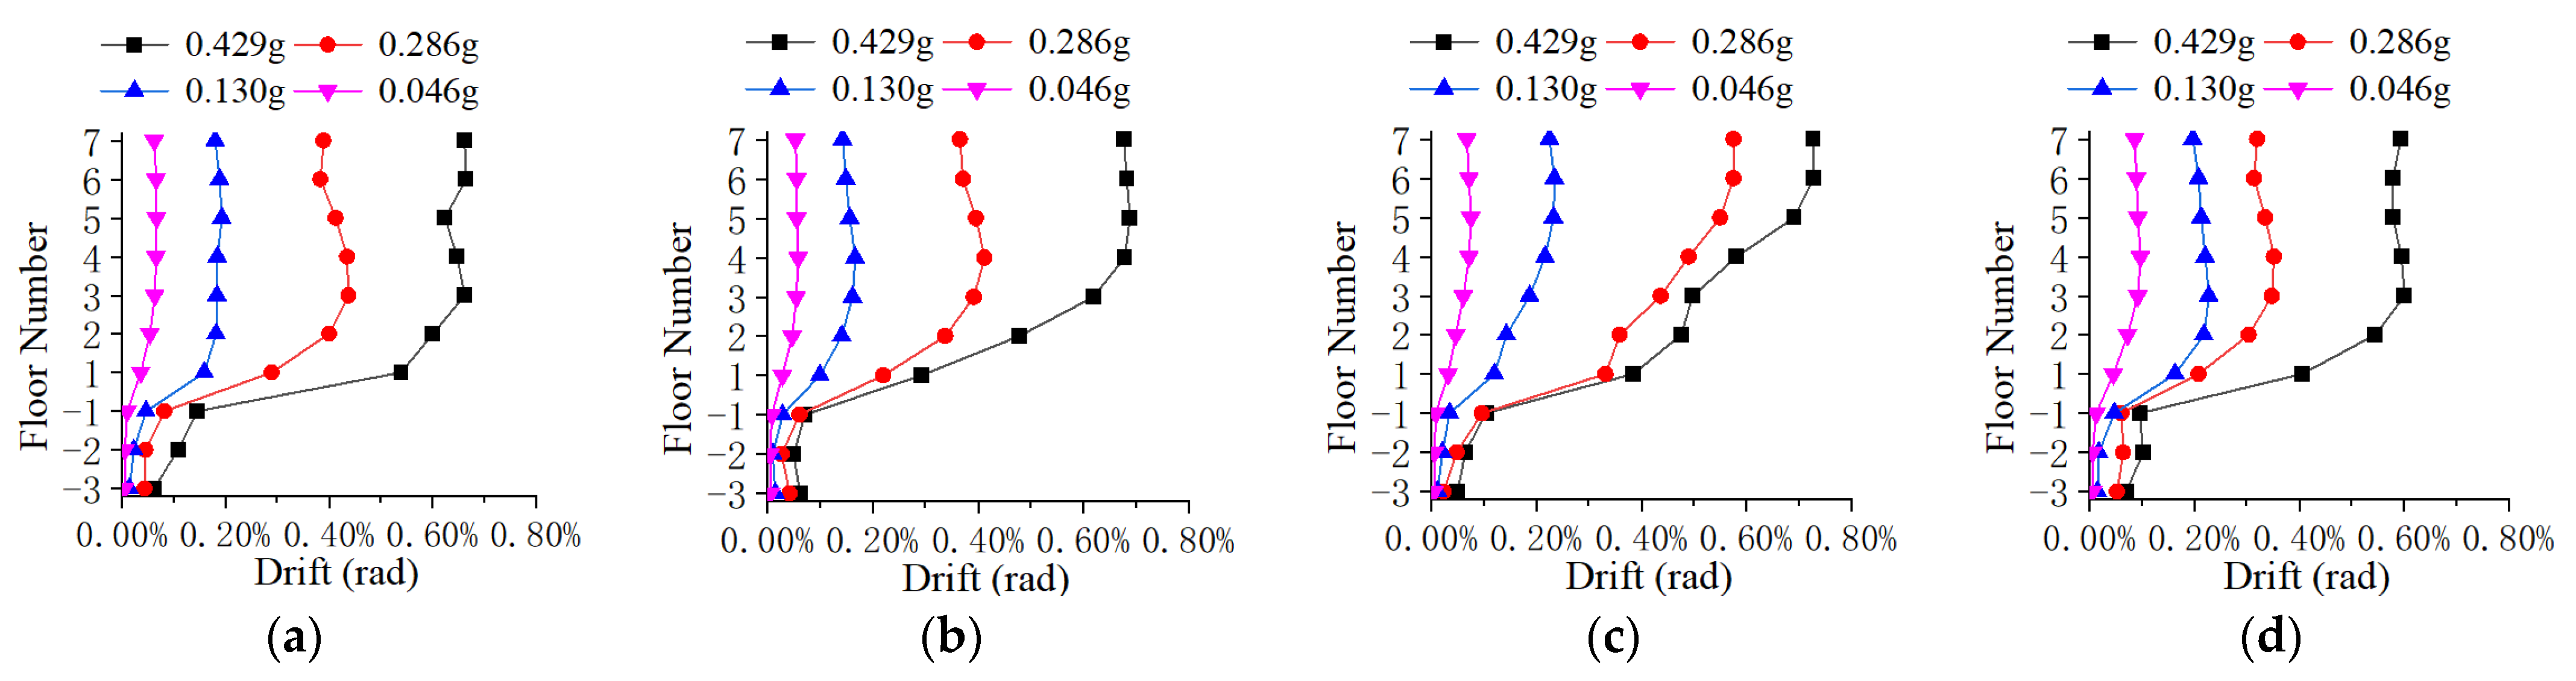
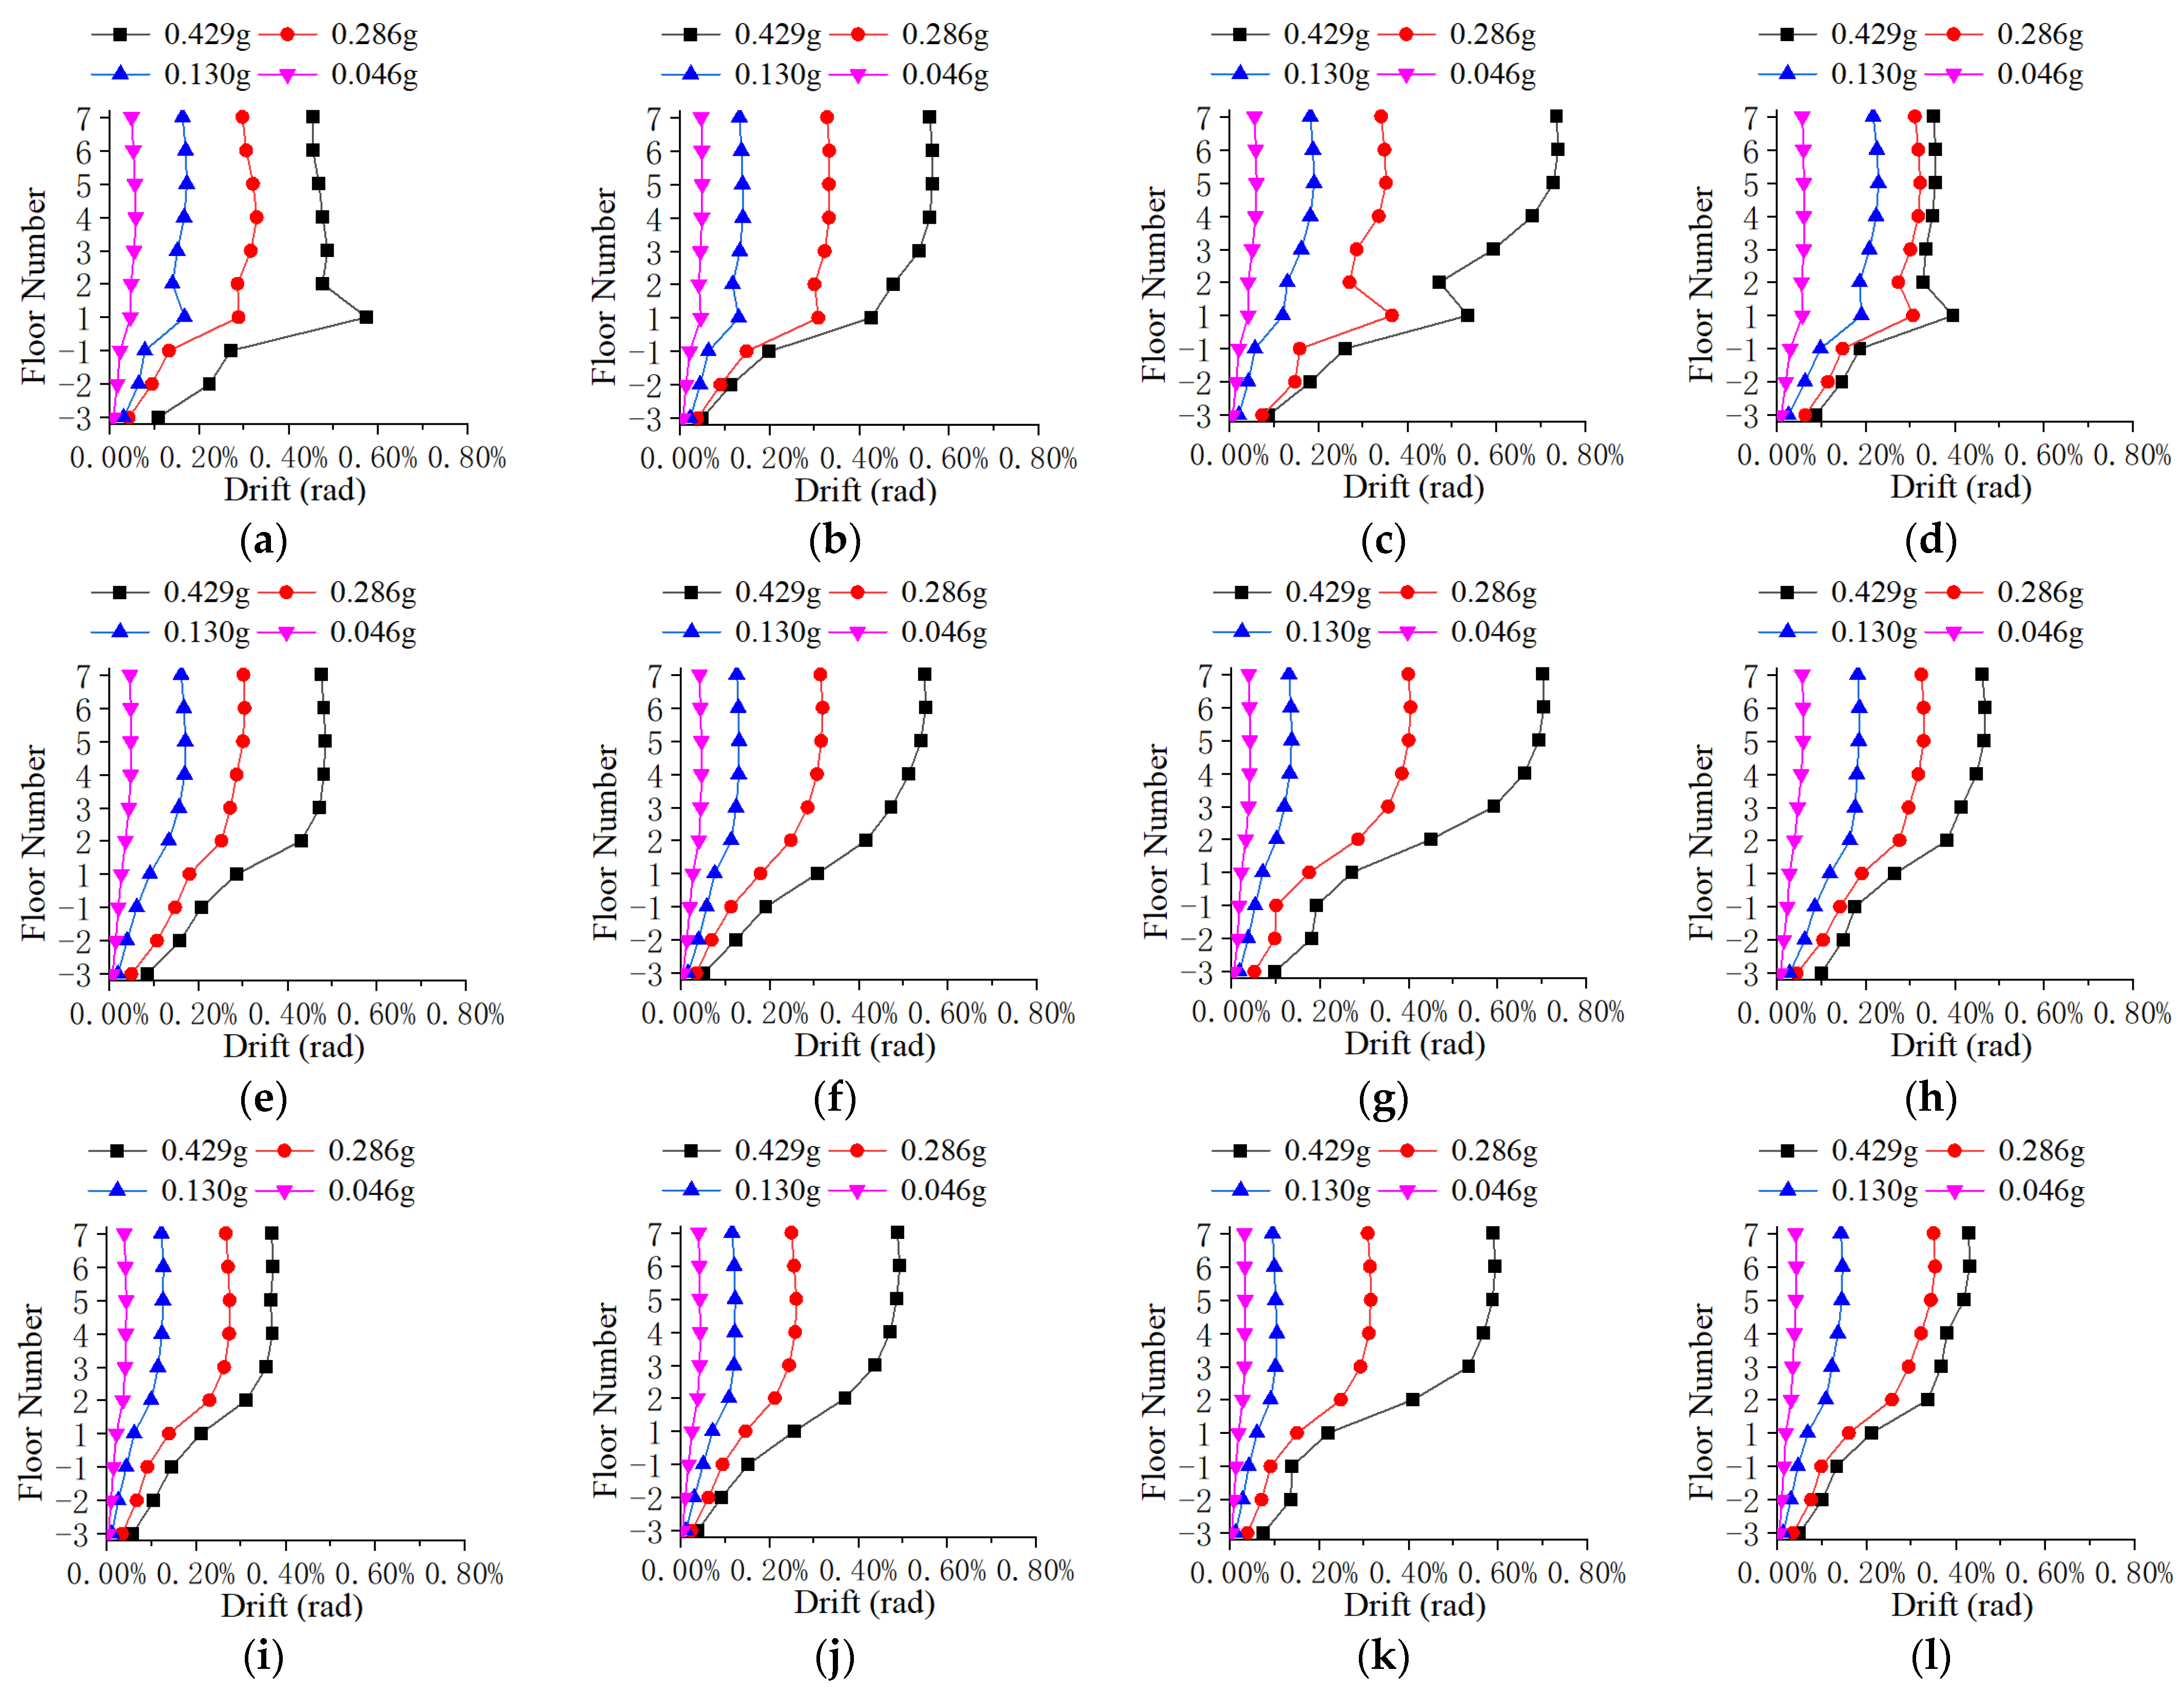
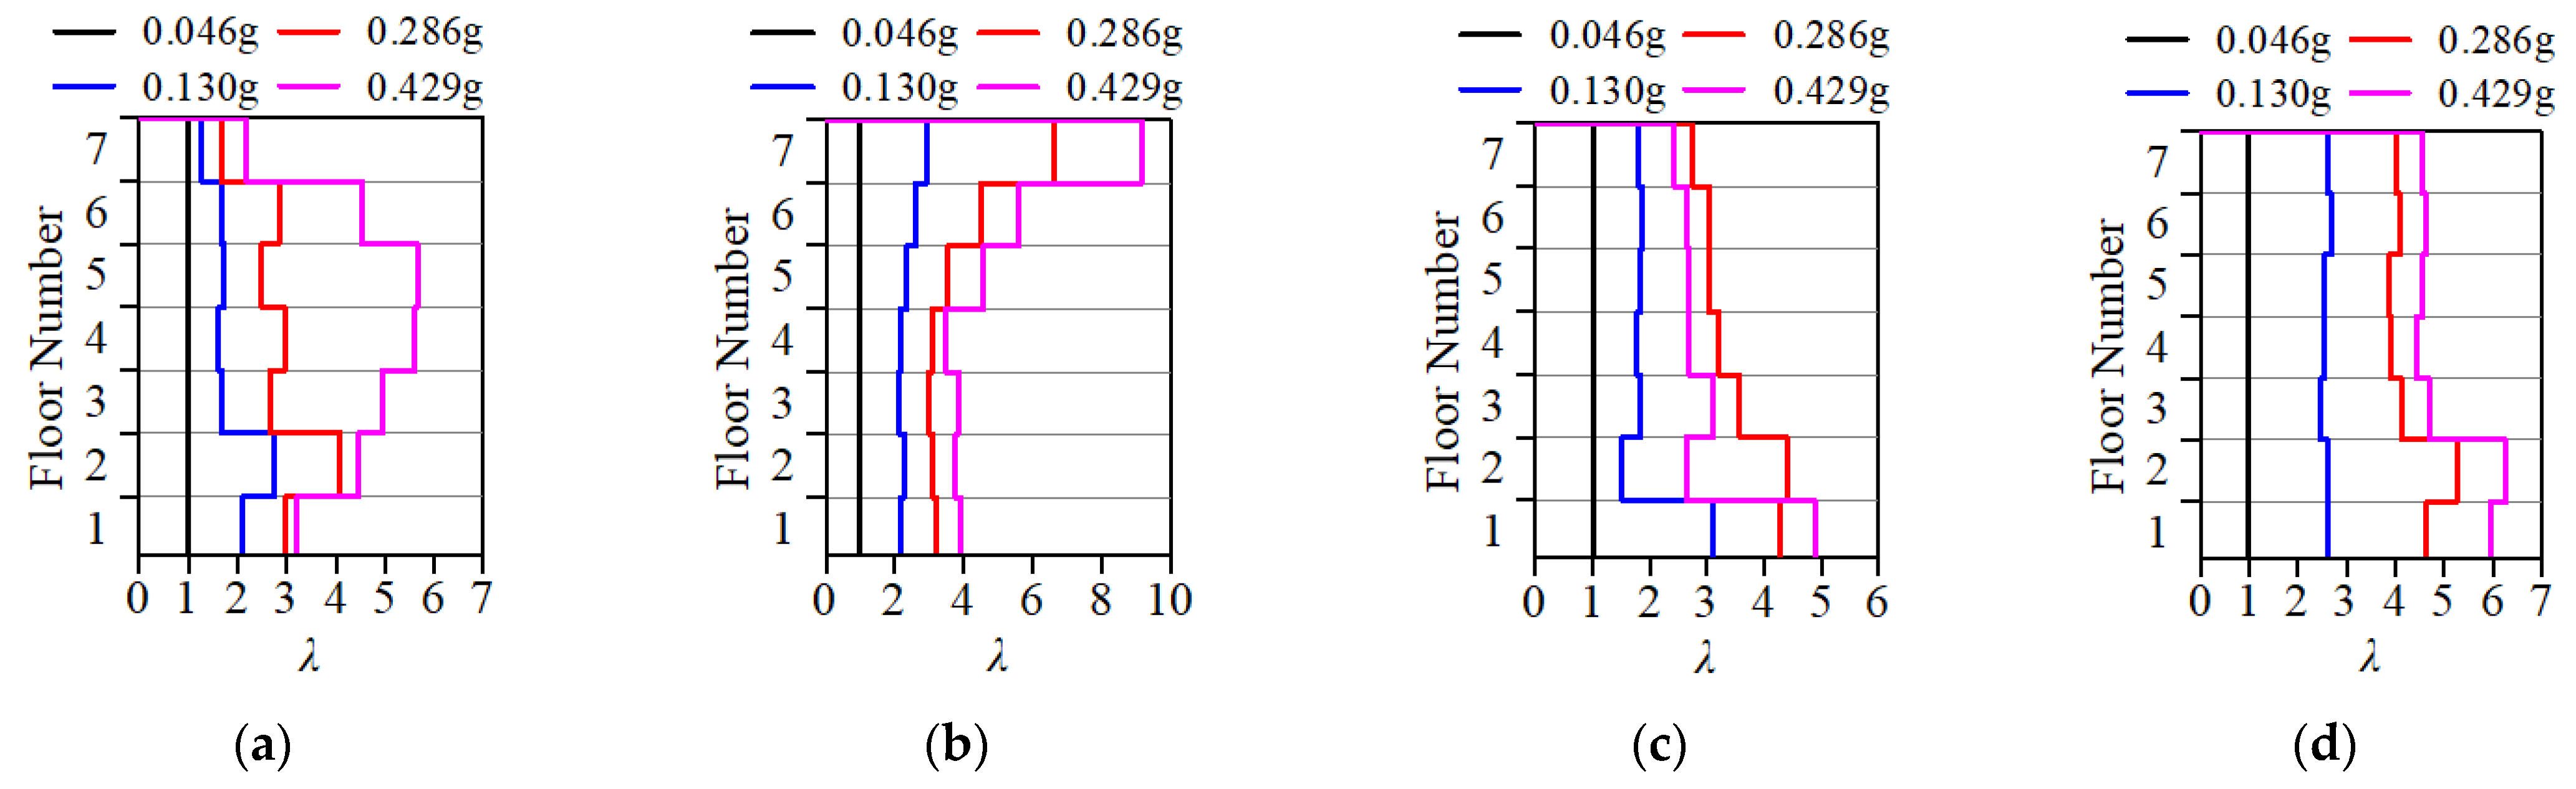
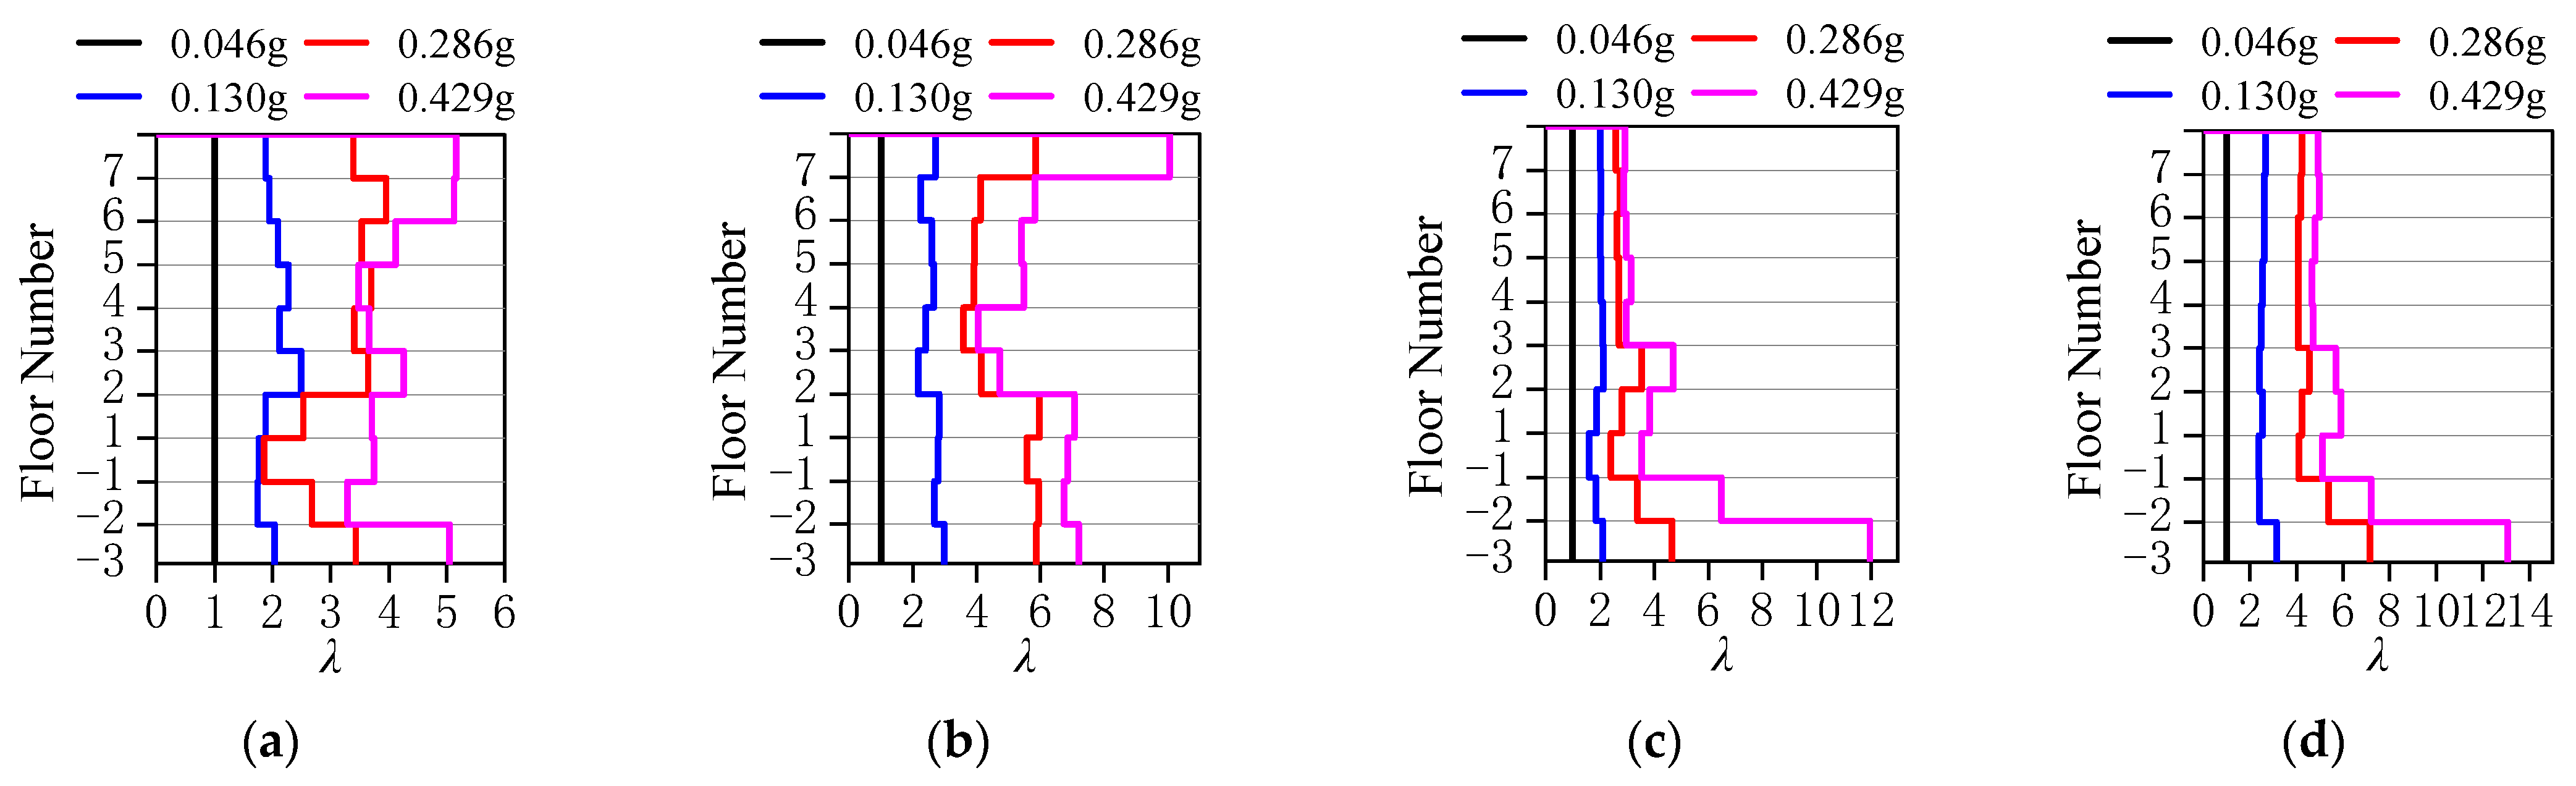
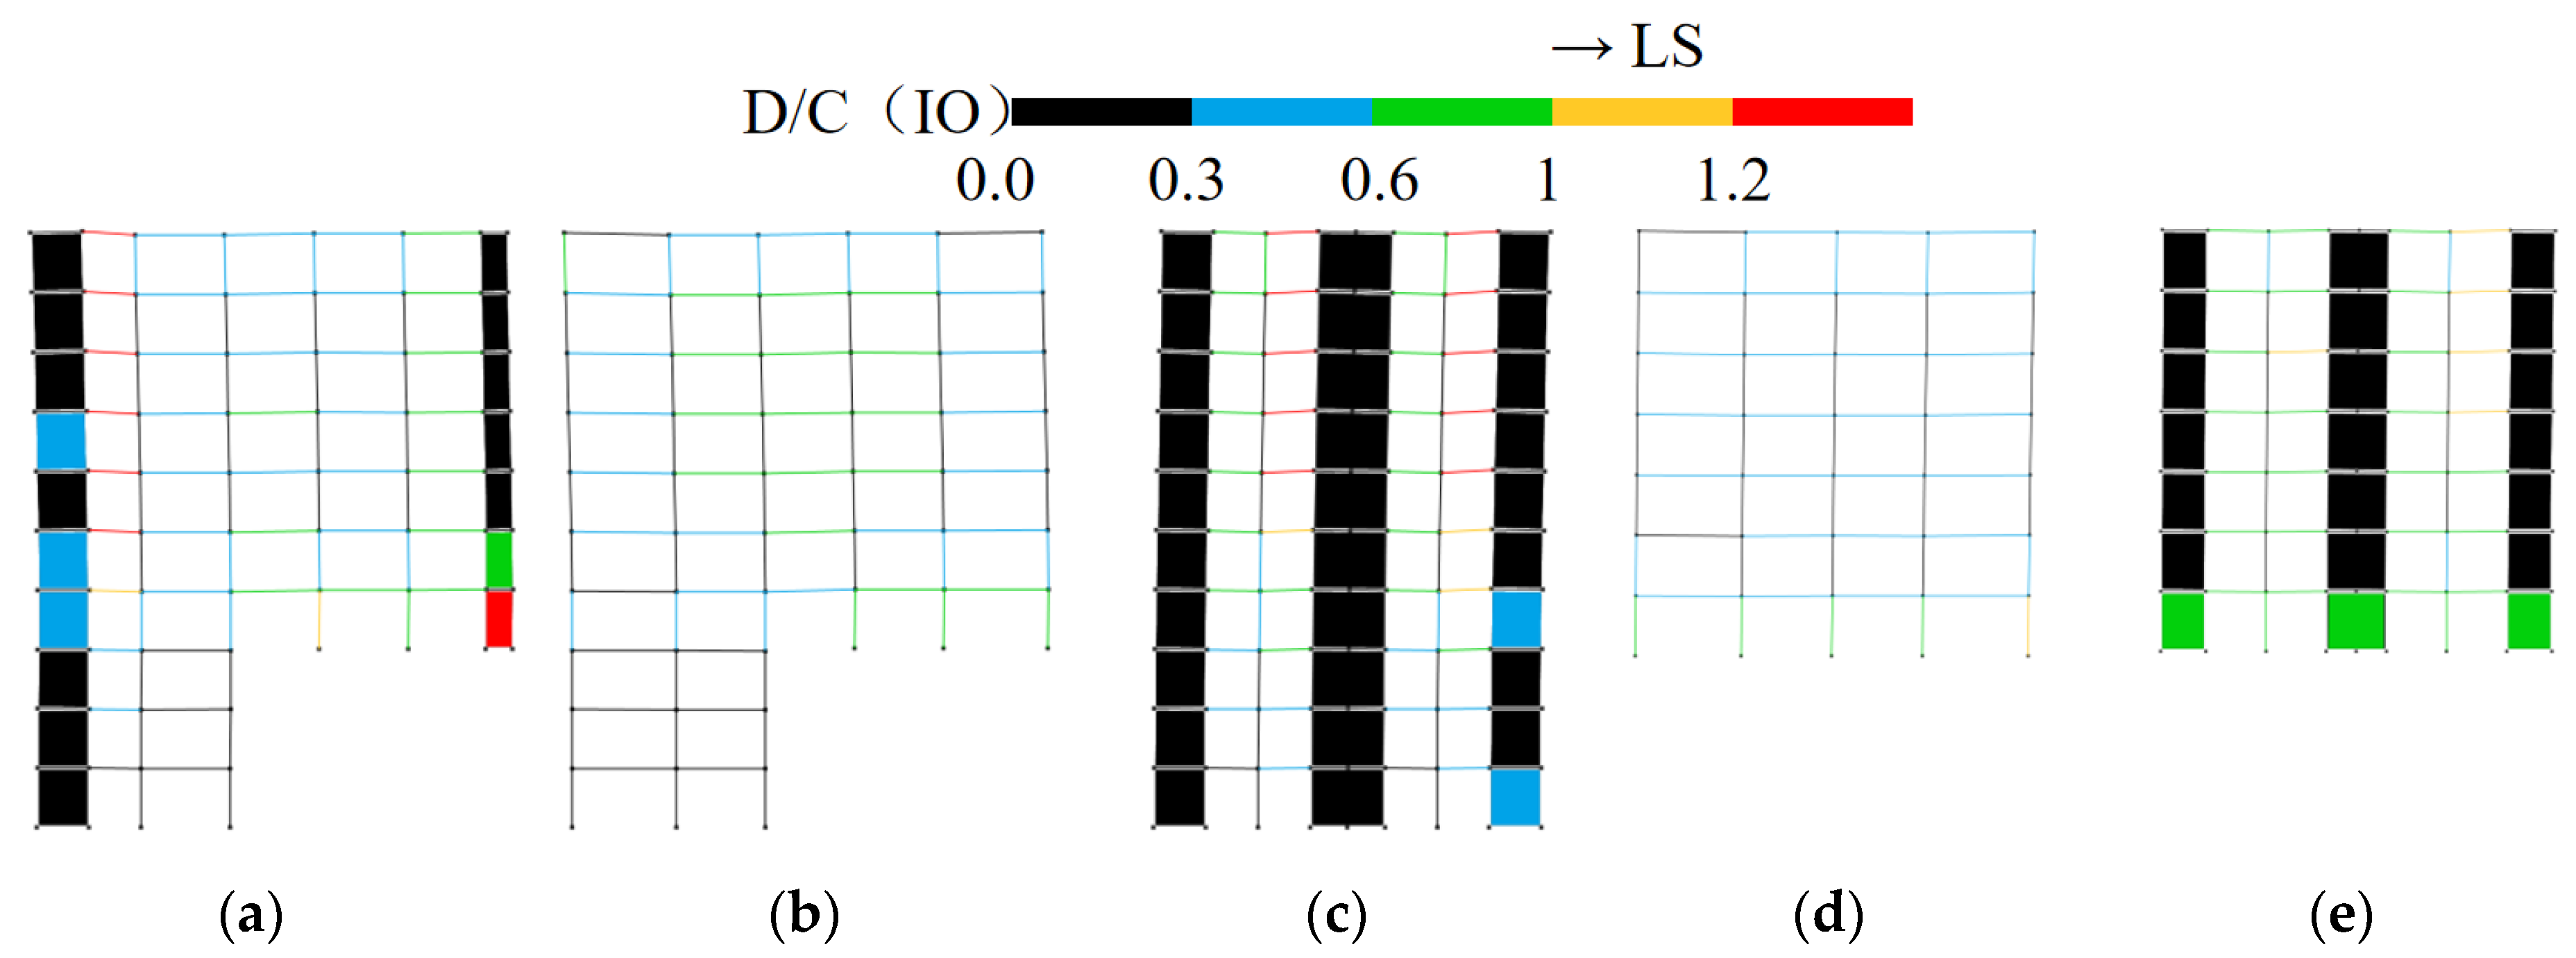
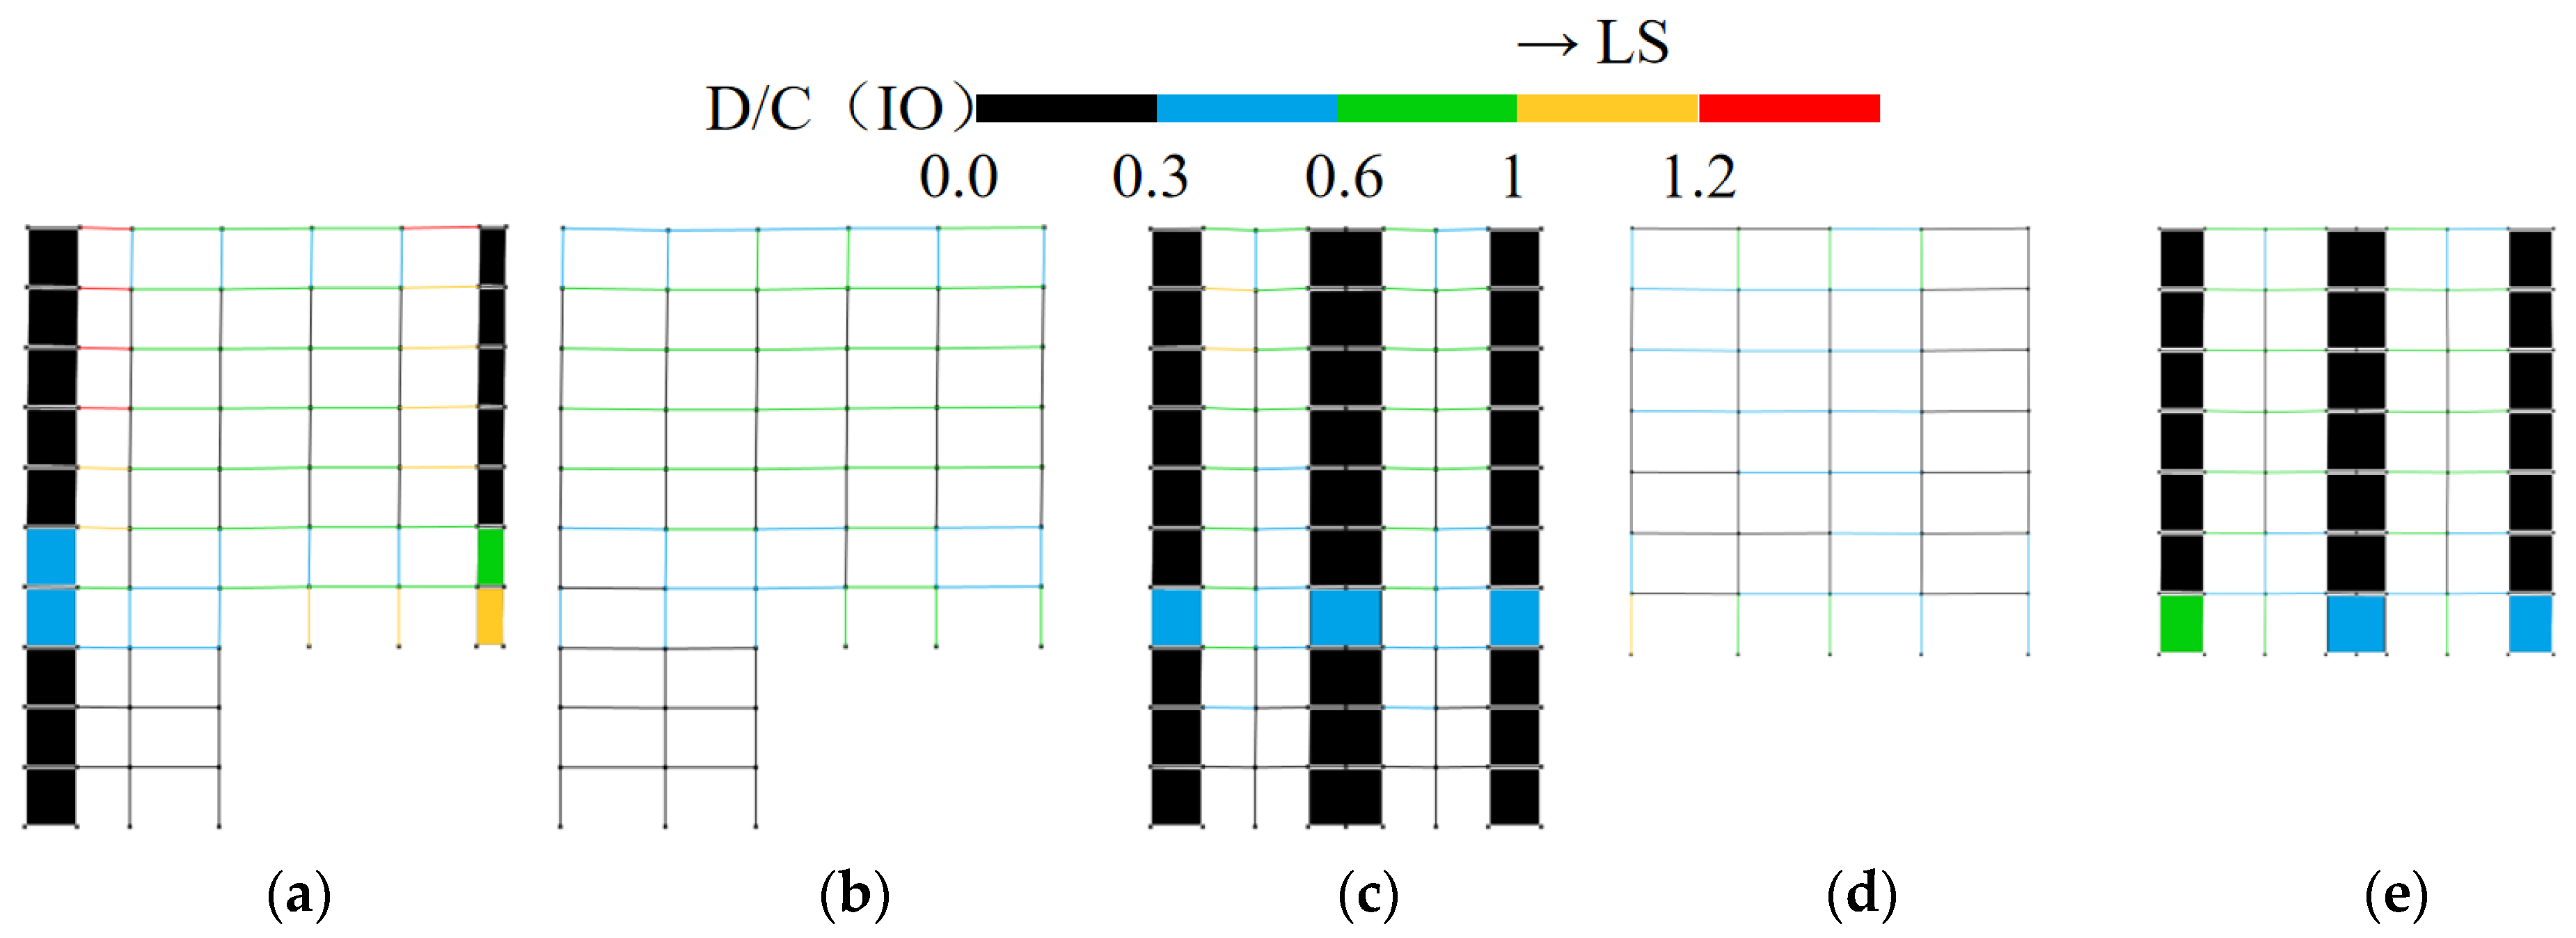
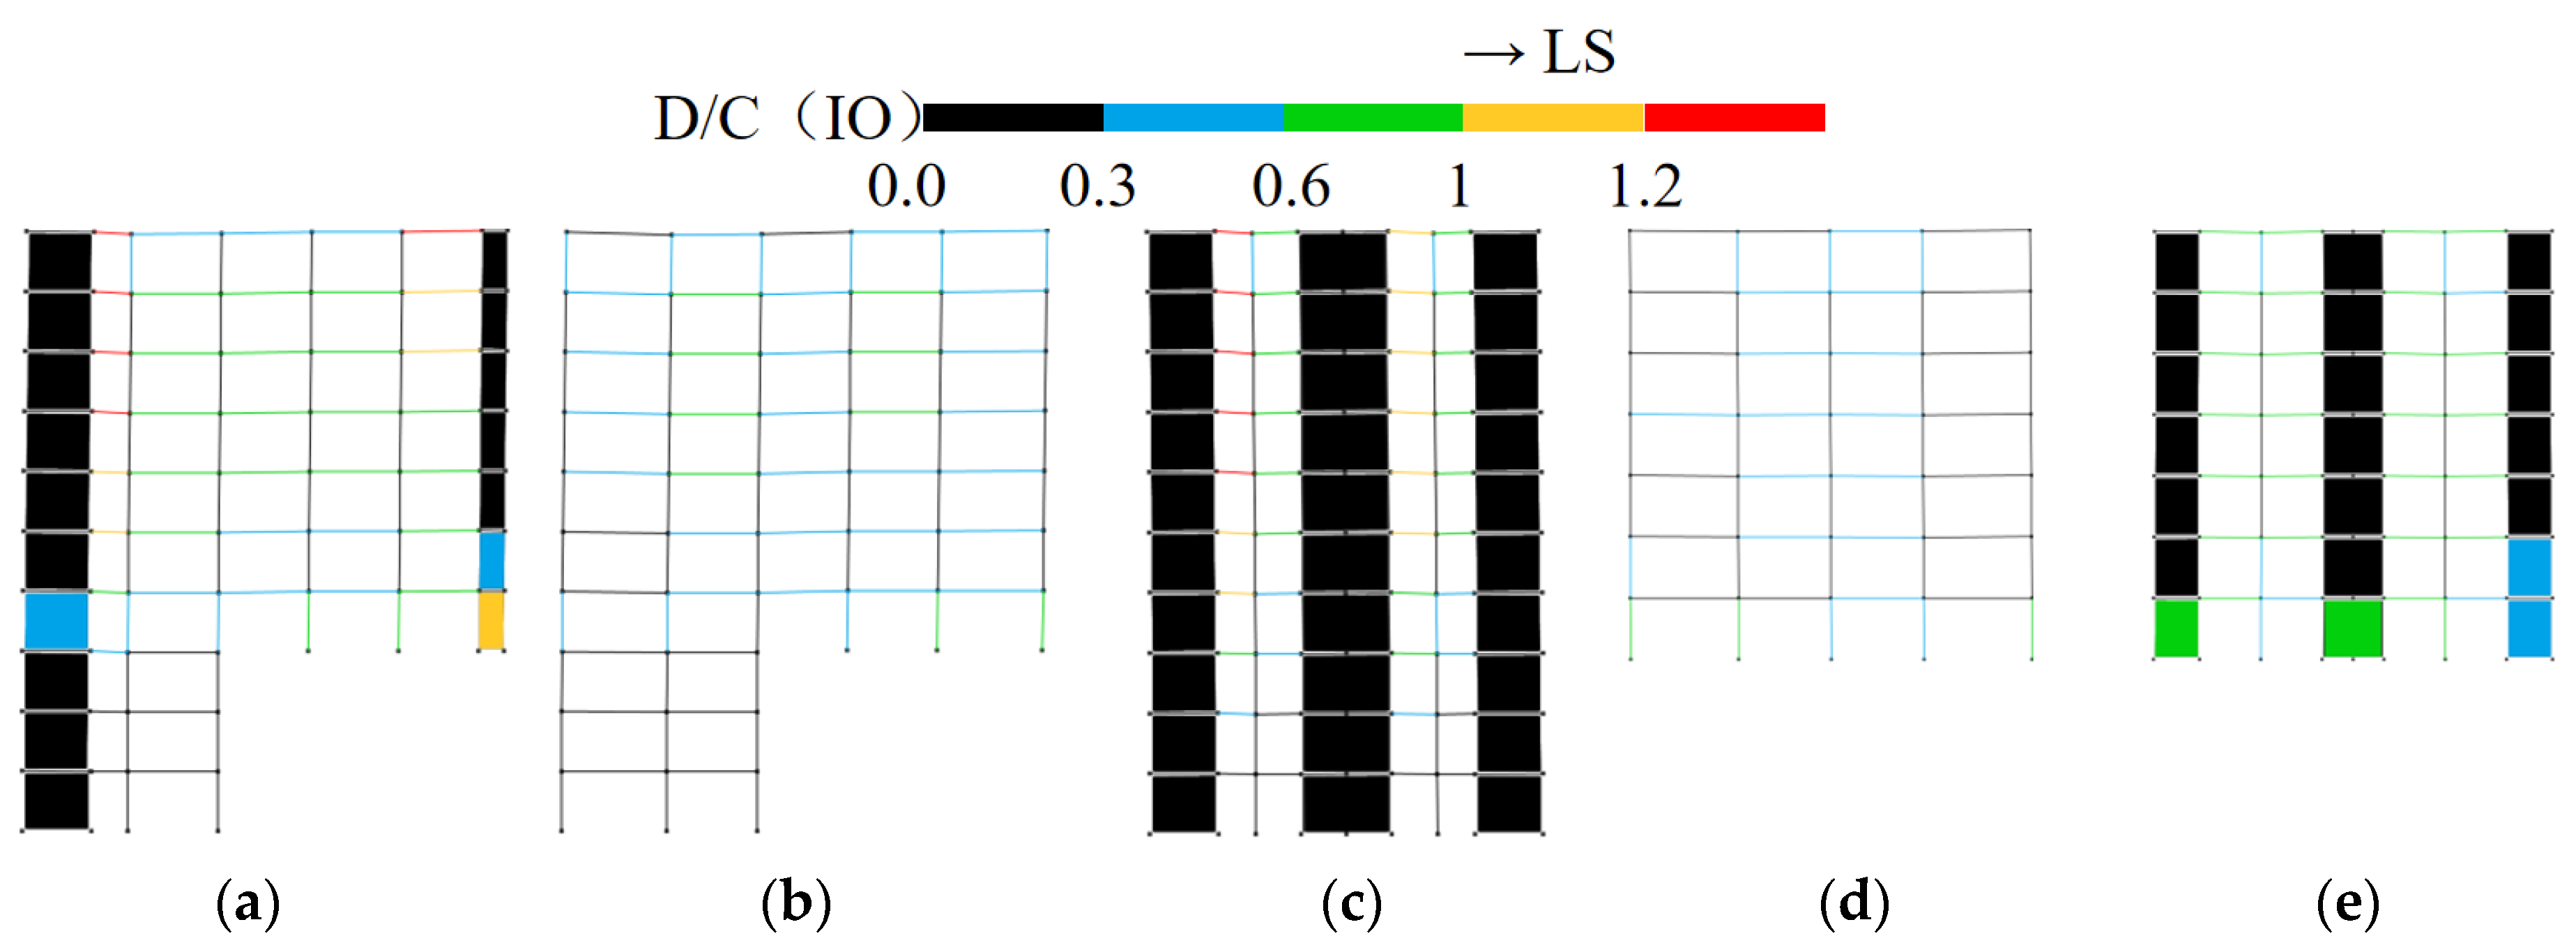
3.3.1. Displacement Angle Distribution Characteristics
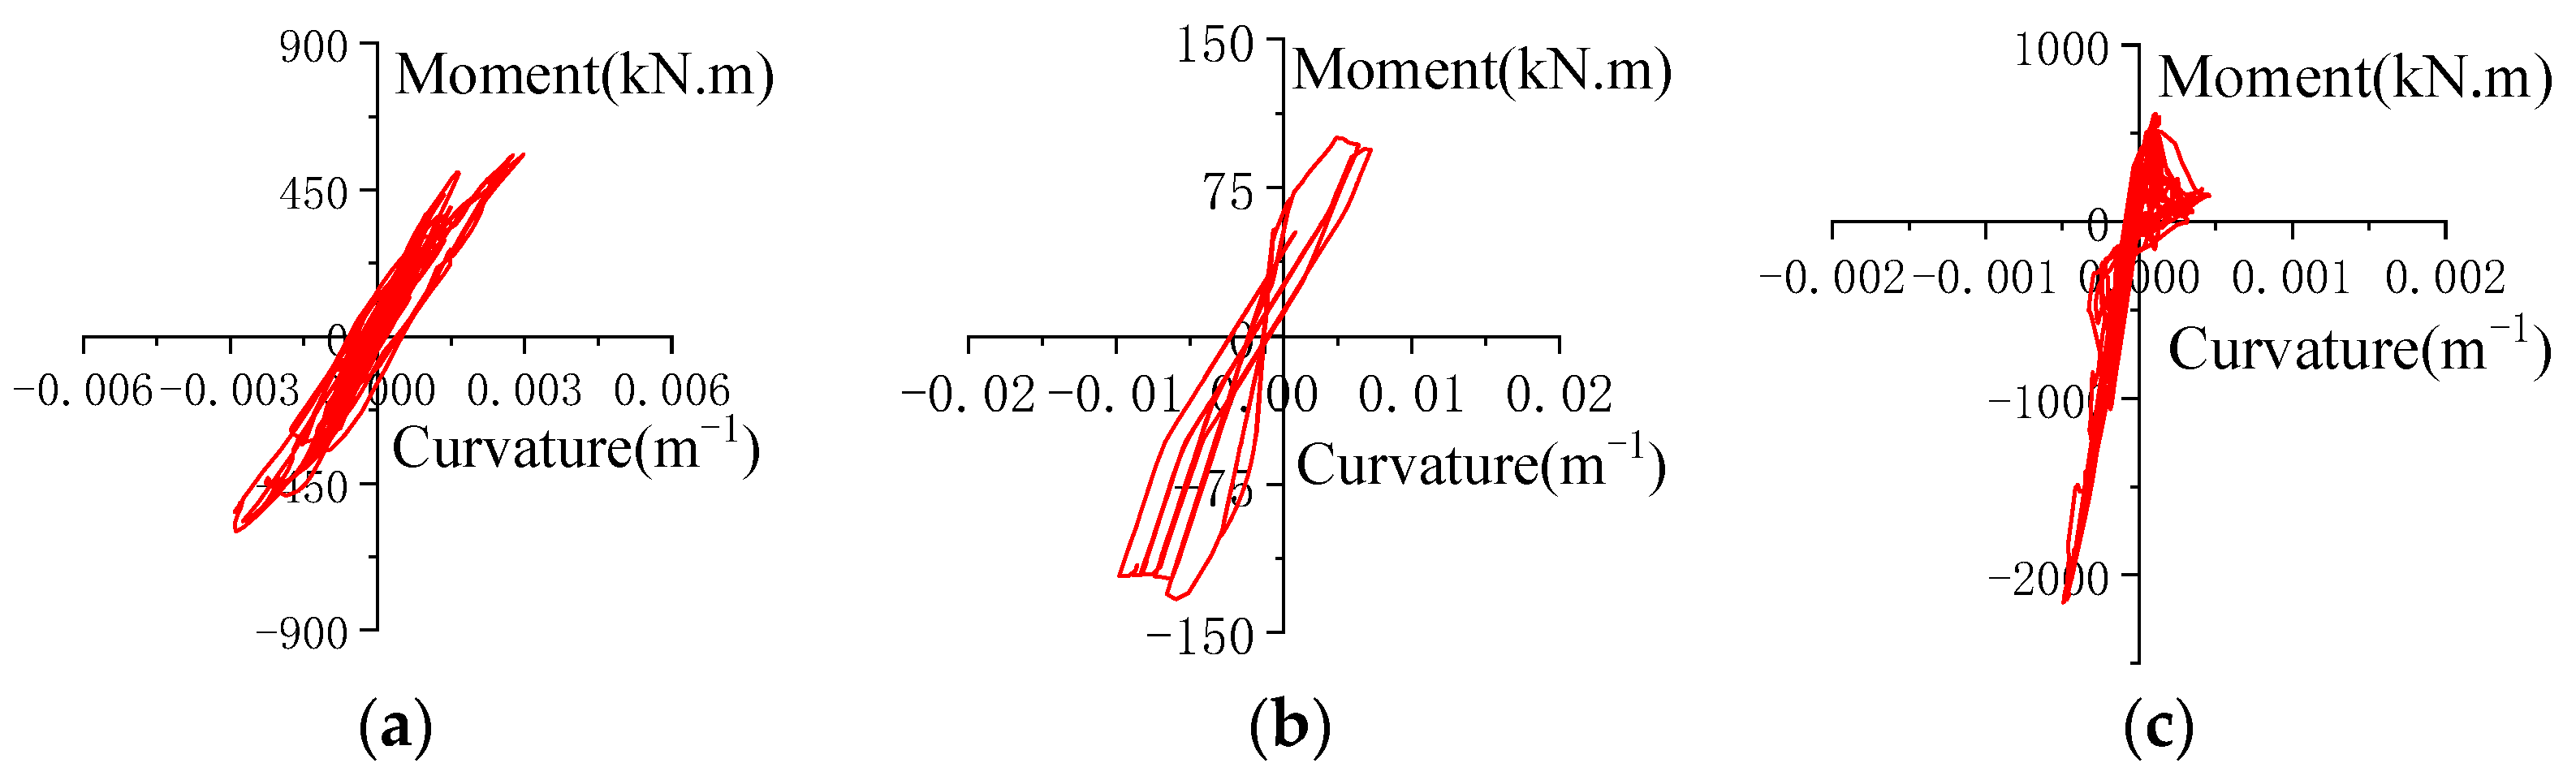
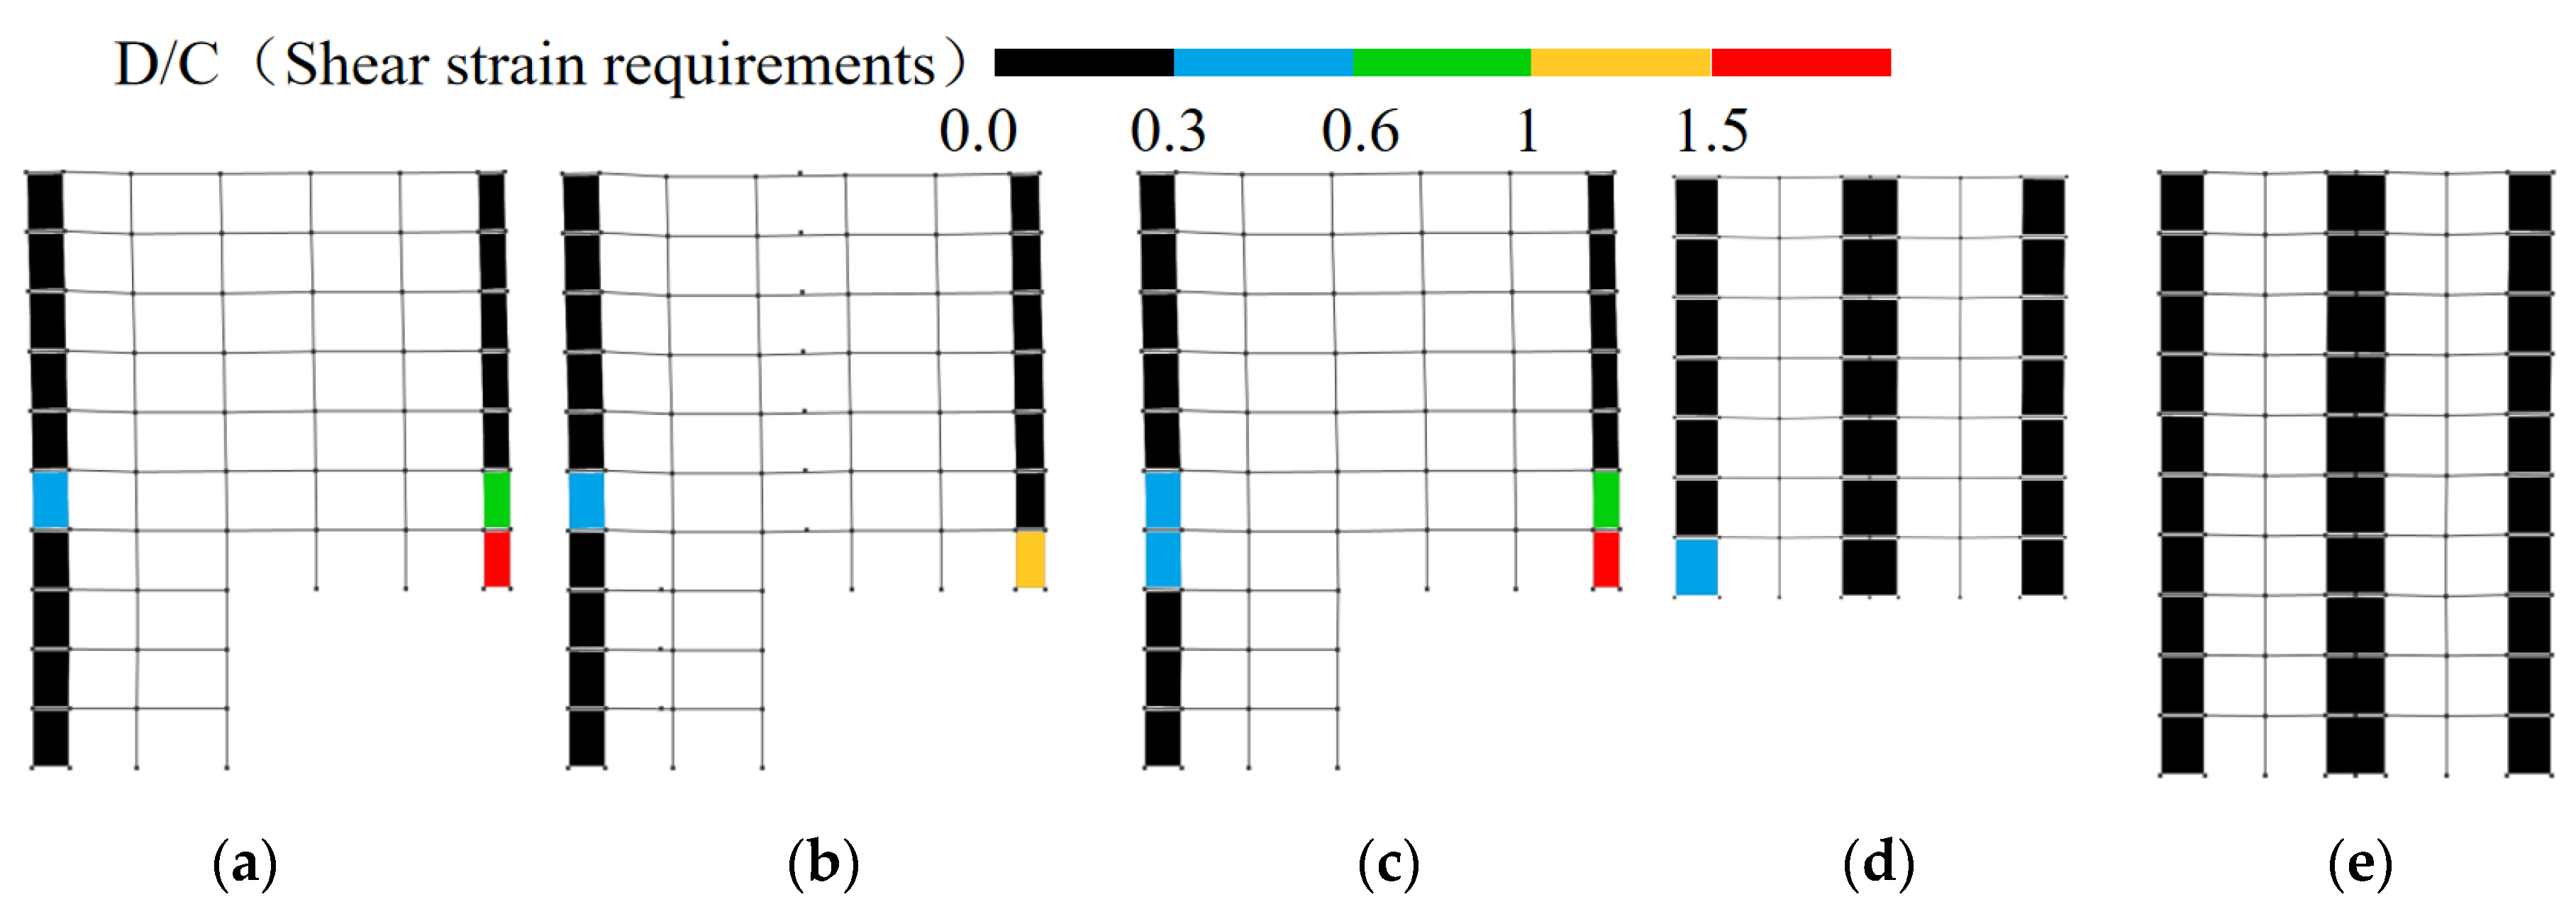
3.3.2. Key Components’ Hysteresis Curves
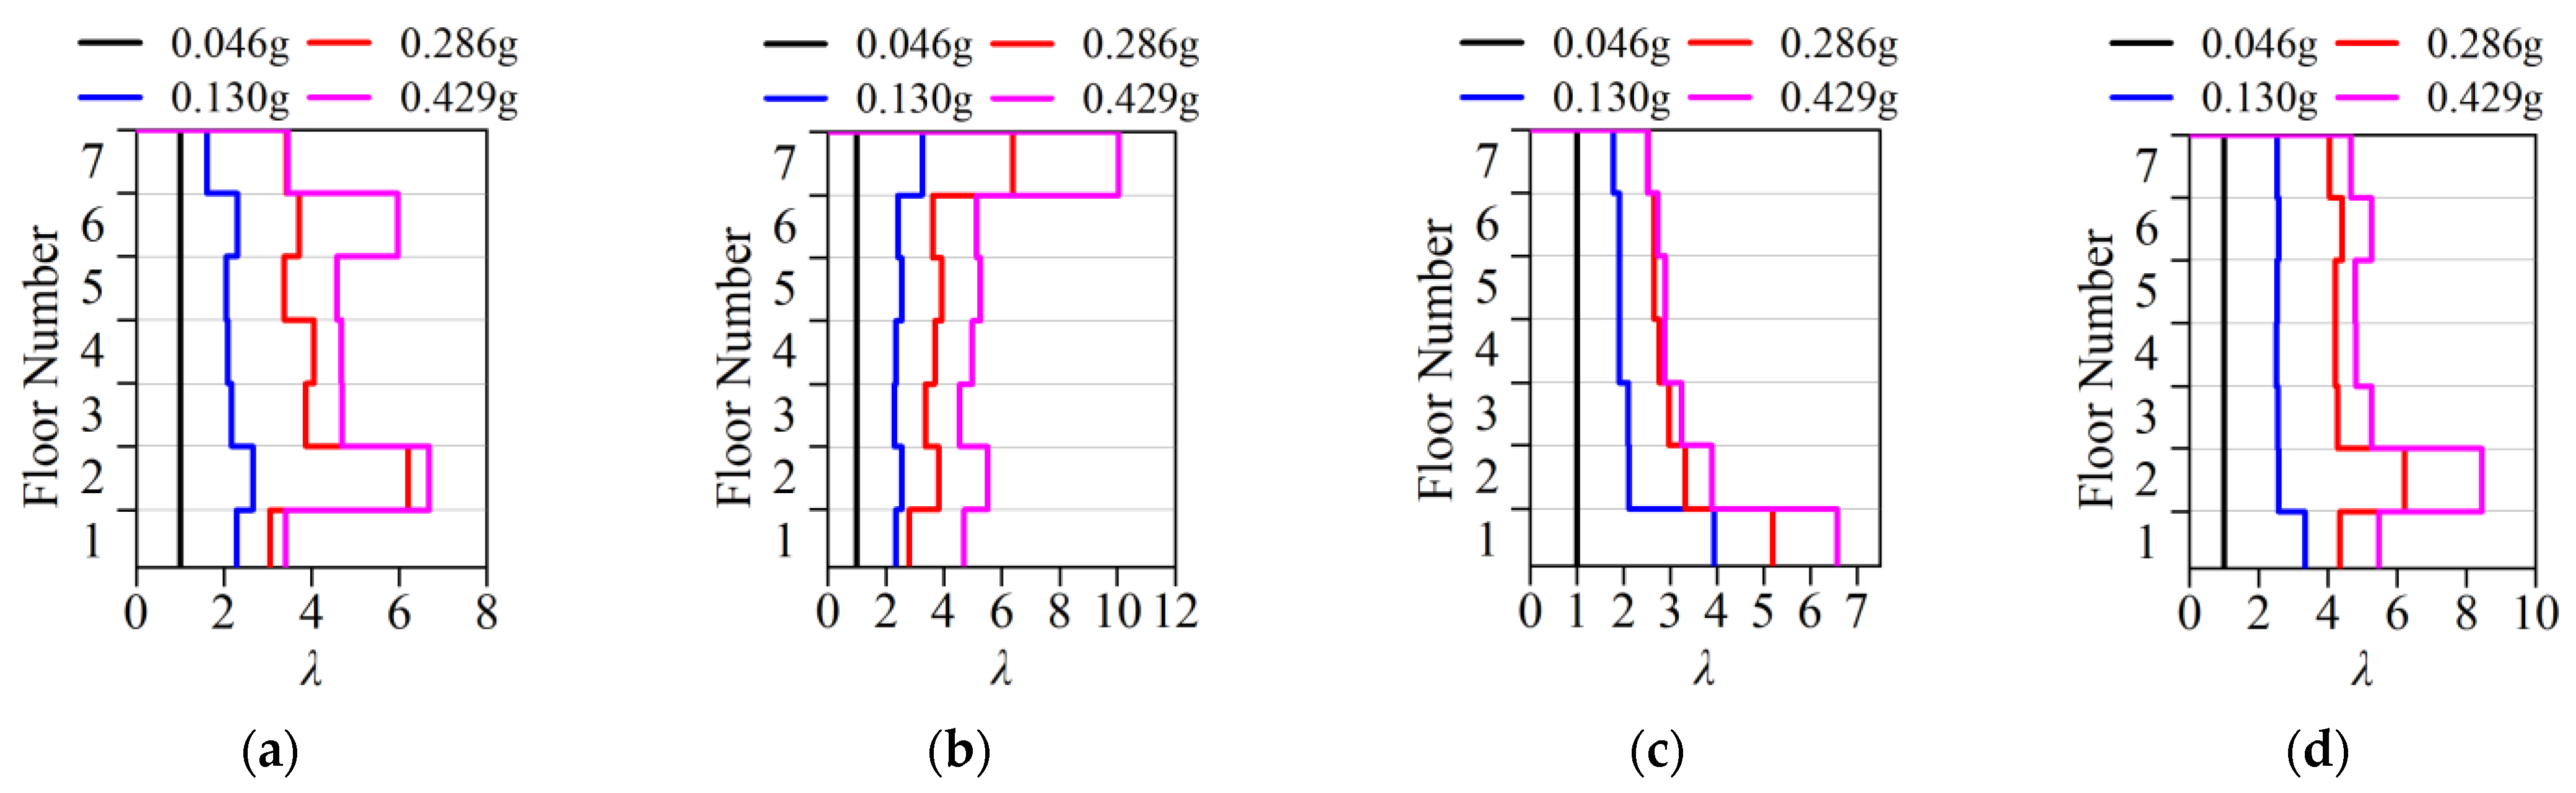
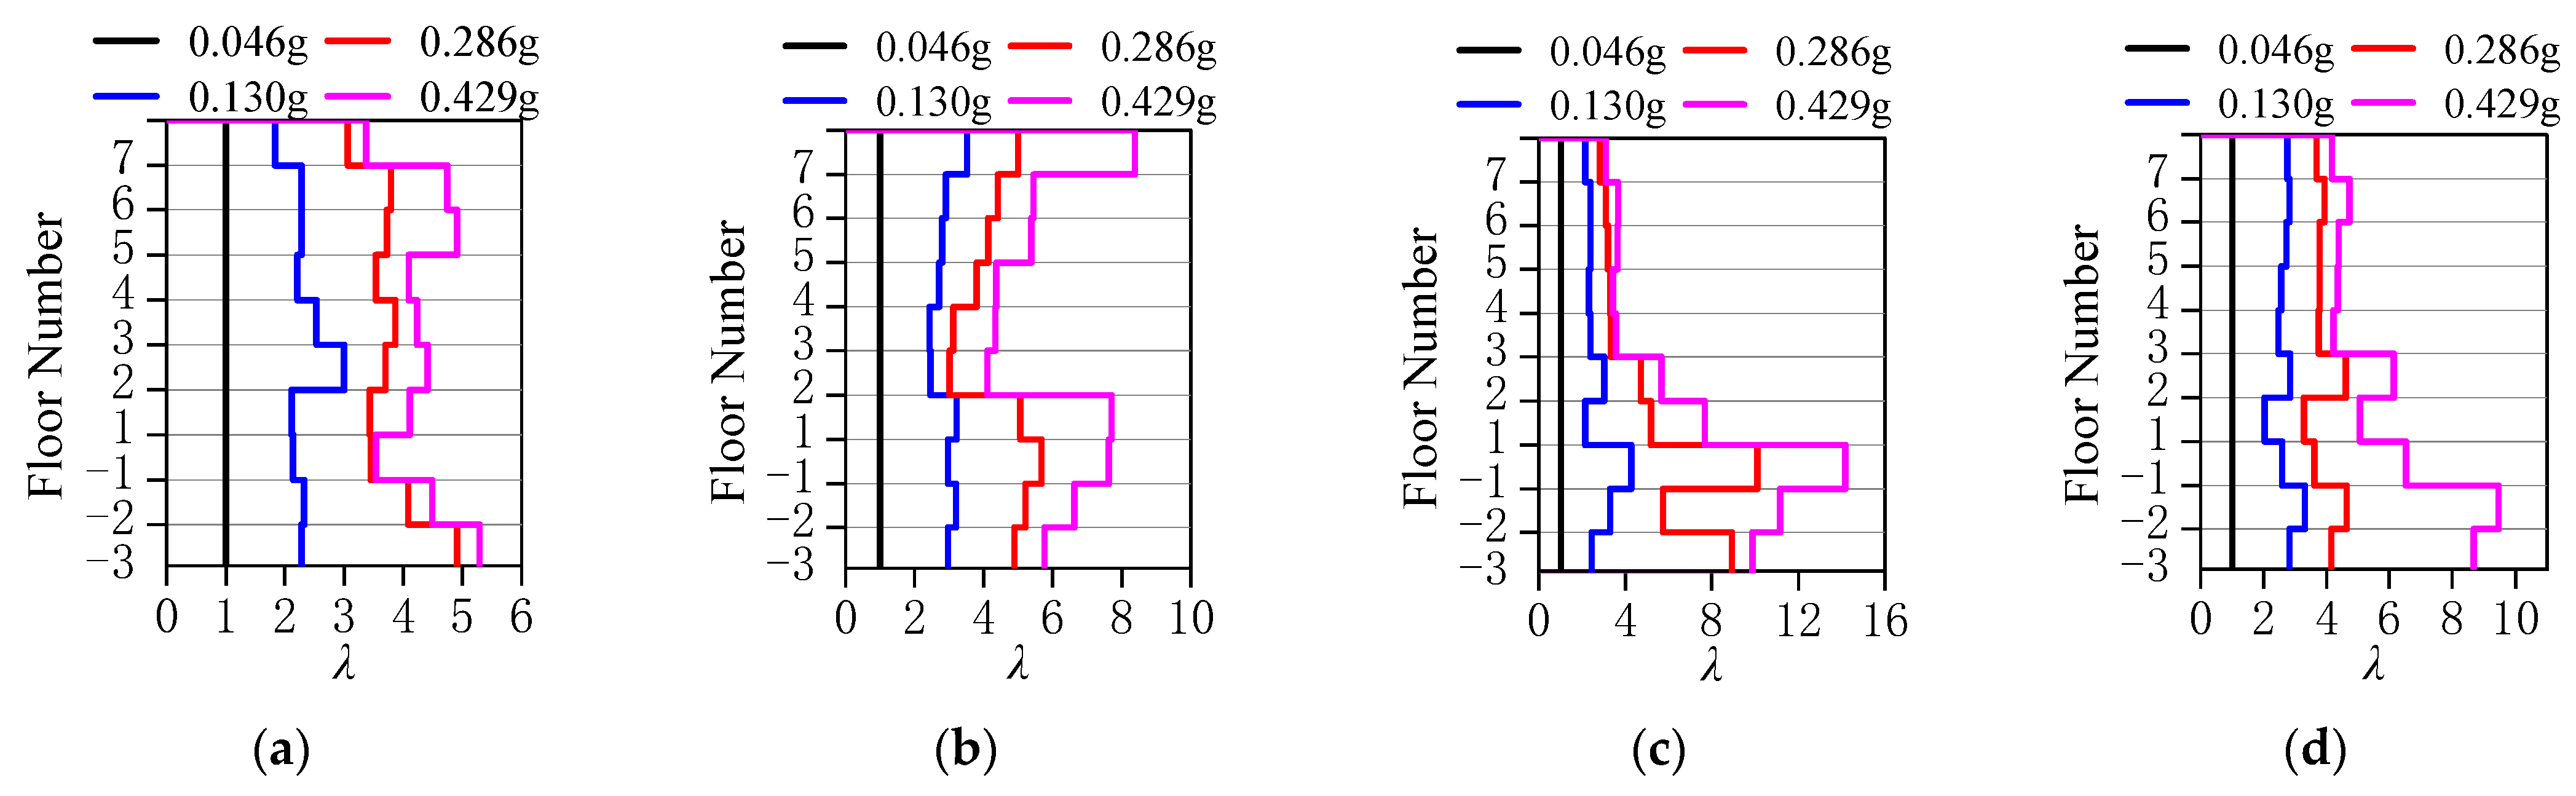
3.3.3. Internal Force Redistribution Analysis
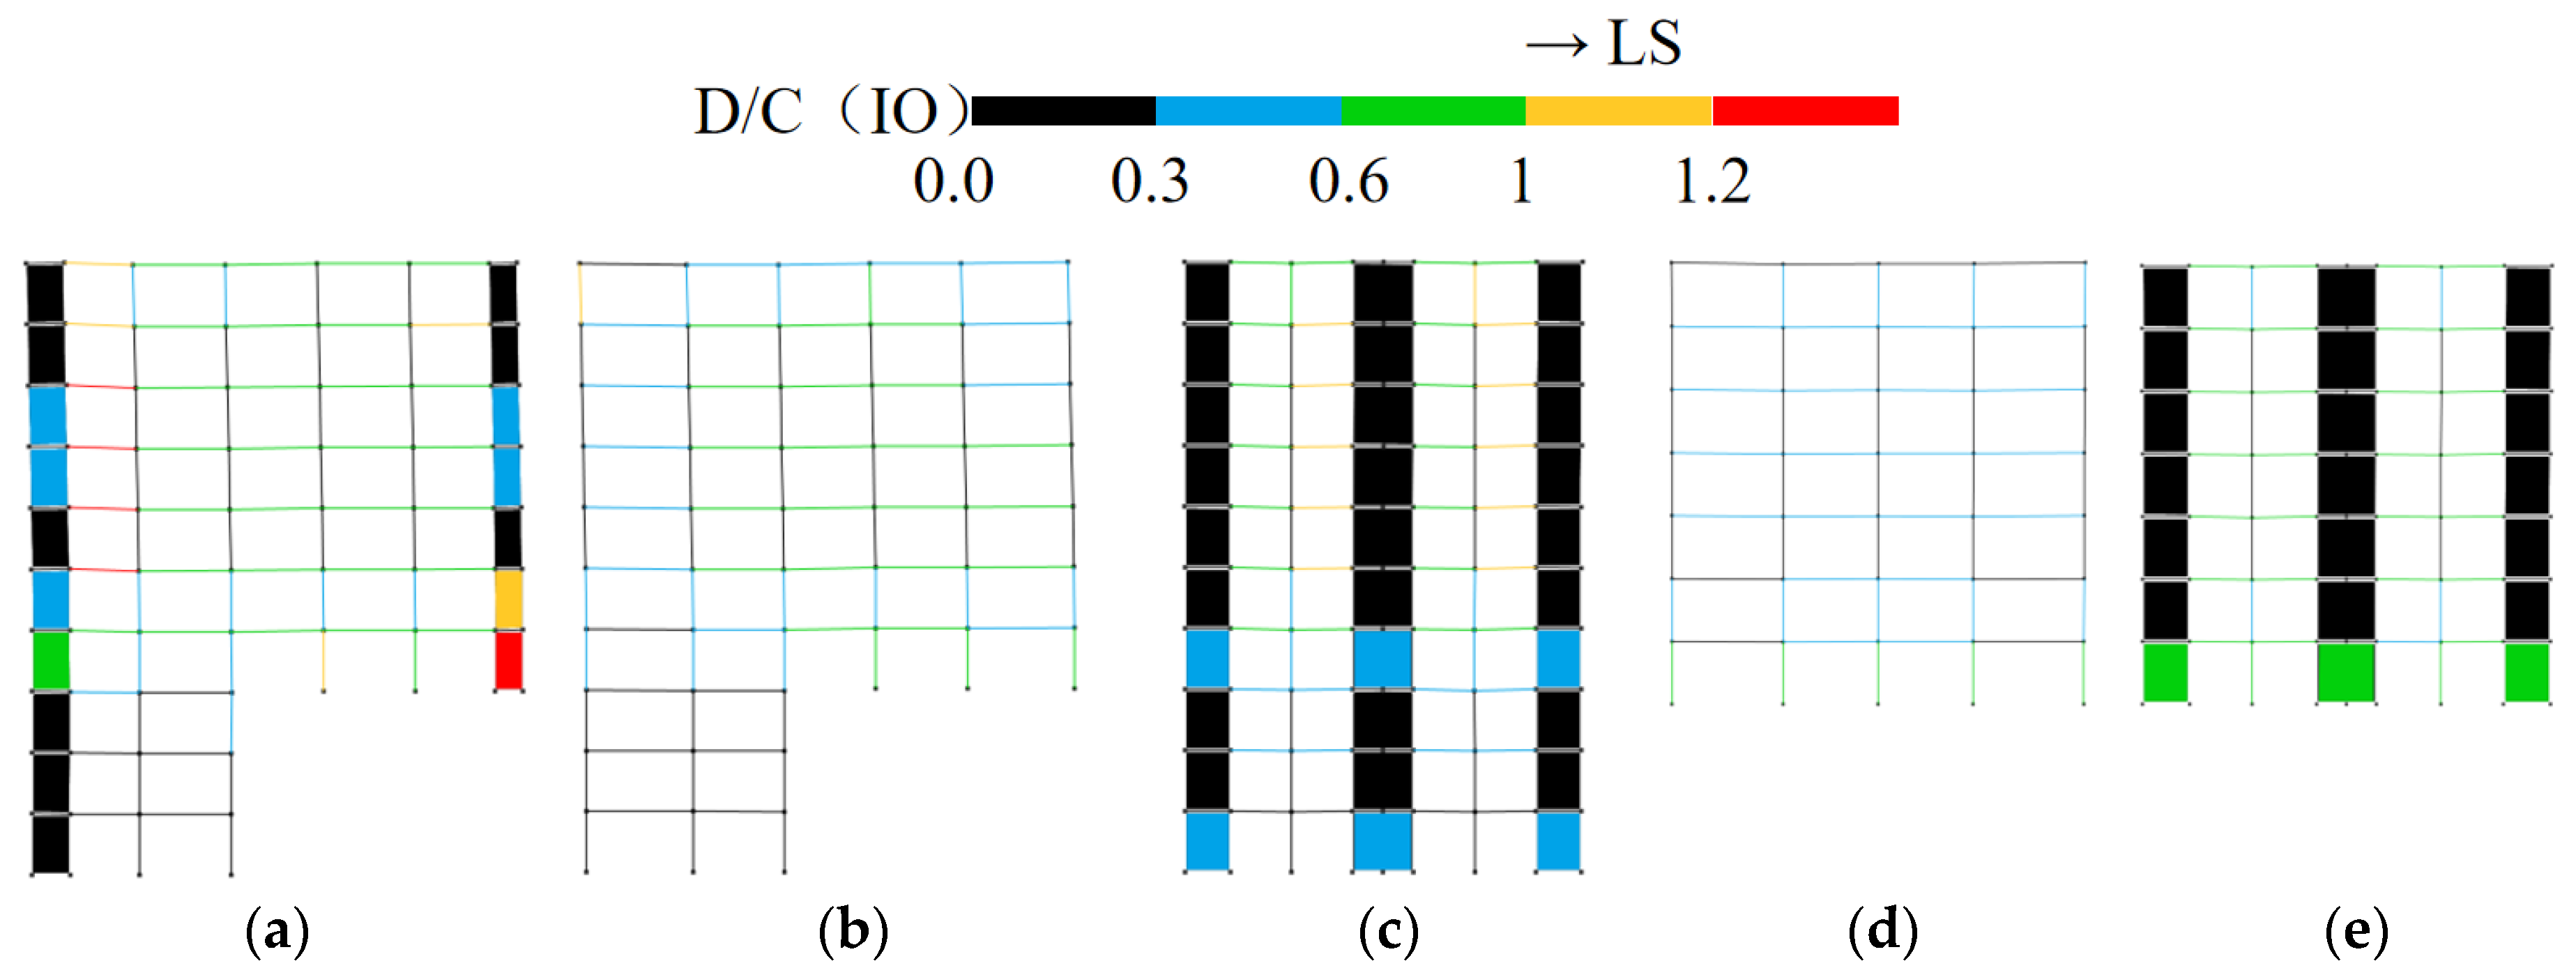
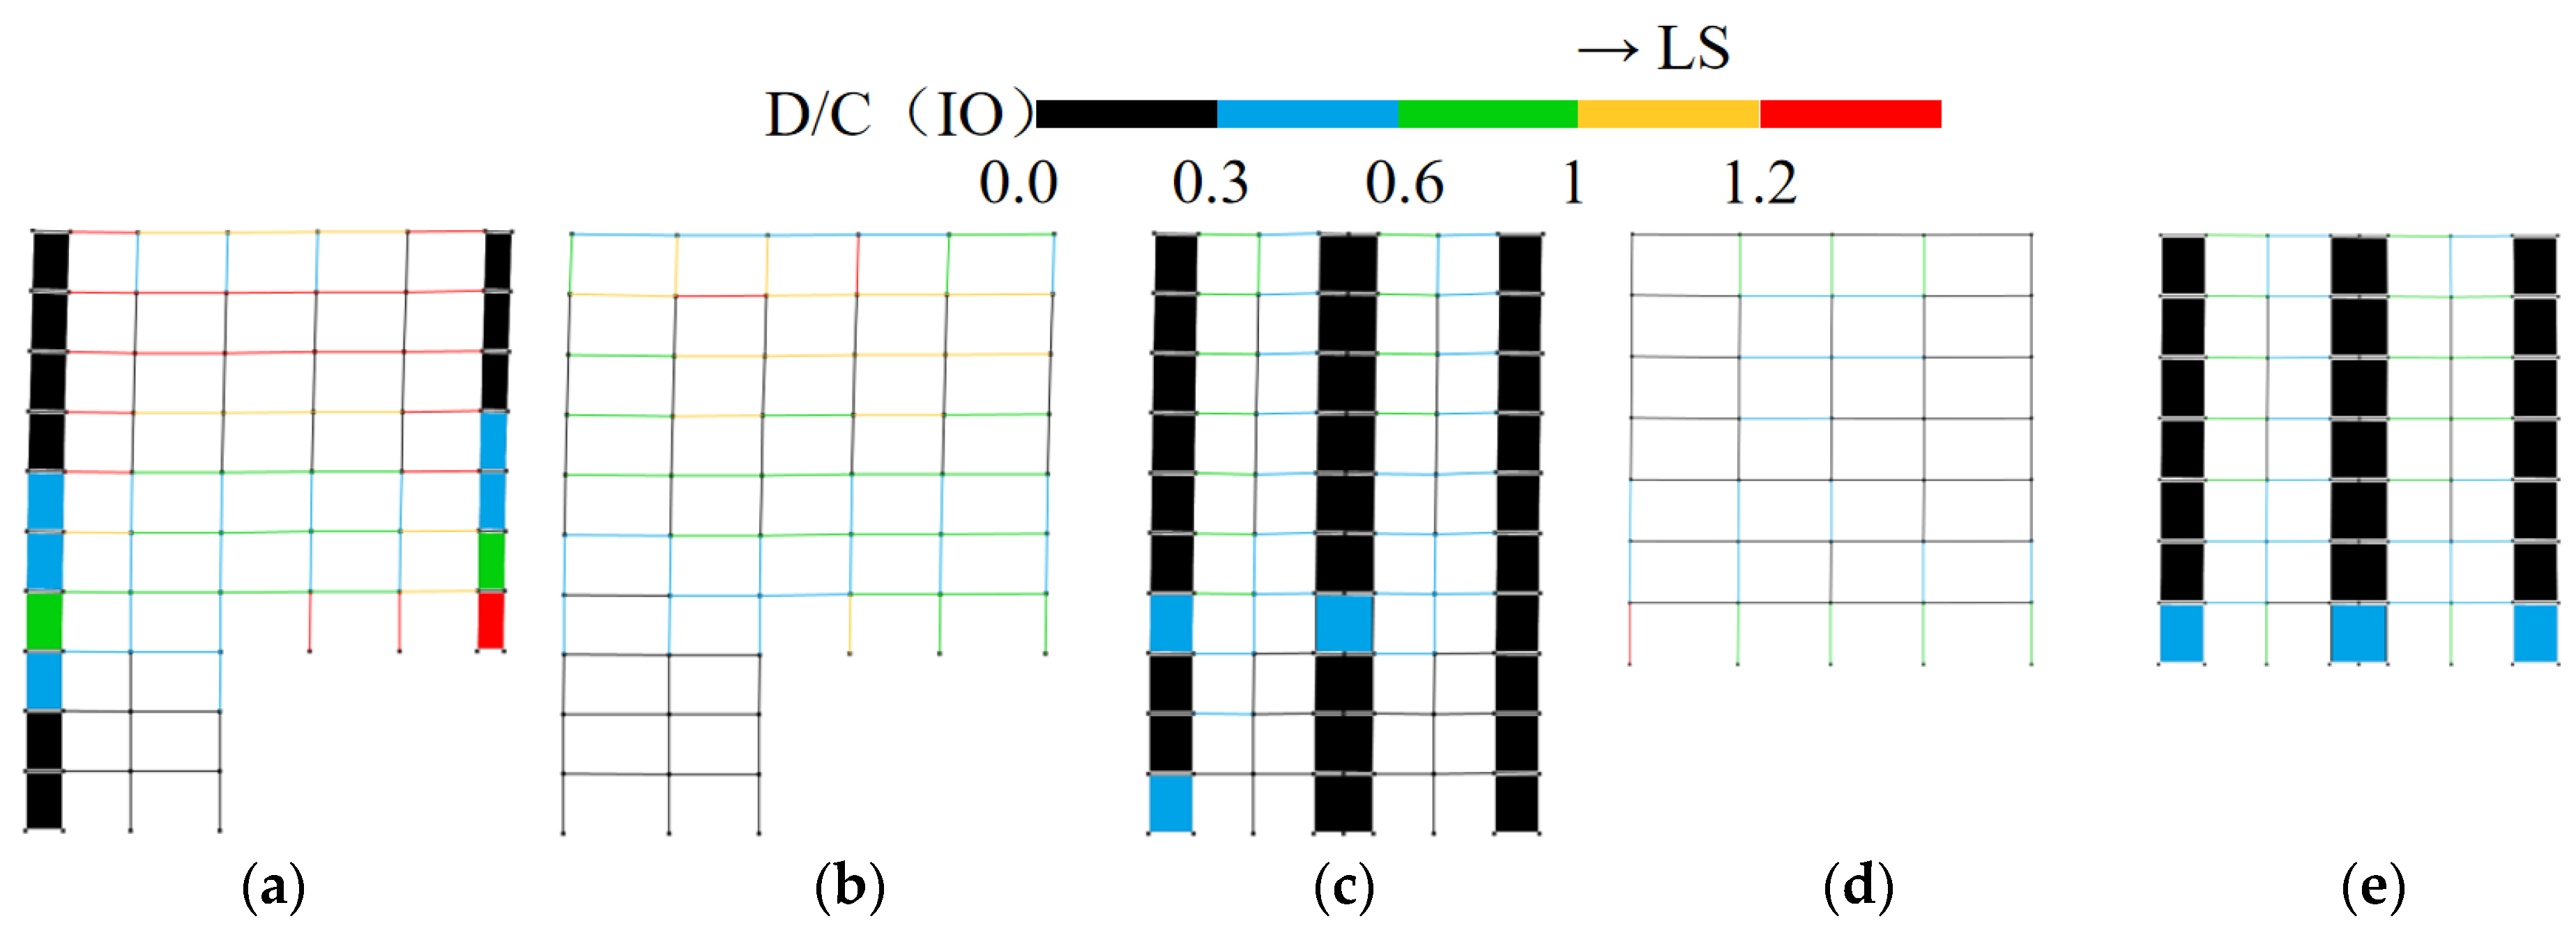
3.3.4. Seismic Performance Evaluation of Structures Under Rare Earthquake Intensity
4. Conclusions
- (a)
- Since bending stiffness of shear walls makes a significant contribution to their overall stiffness, according to Equation (6), as the height of flexural cantilever members increases, the stiffness of the parts corresponding to those farther from the fixed end decreases. Through analysis of the basic mechanical model of frame–shear wall split-foundation structures, it was found that the drop-story height significantly reduces the stiffness contribution to the structure of the lower embedding shear walls. When calculating the stiffness components of frame–shear wall split-foundation structures, it is advisable to apply concentrated loads to the corresponding structural parts to determine their shear-bending stiffness for studying structural behavior.
- (b)
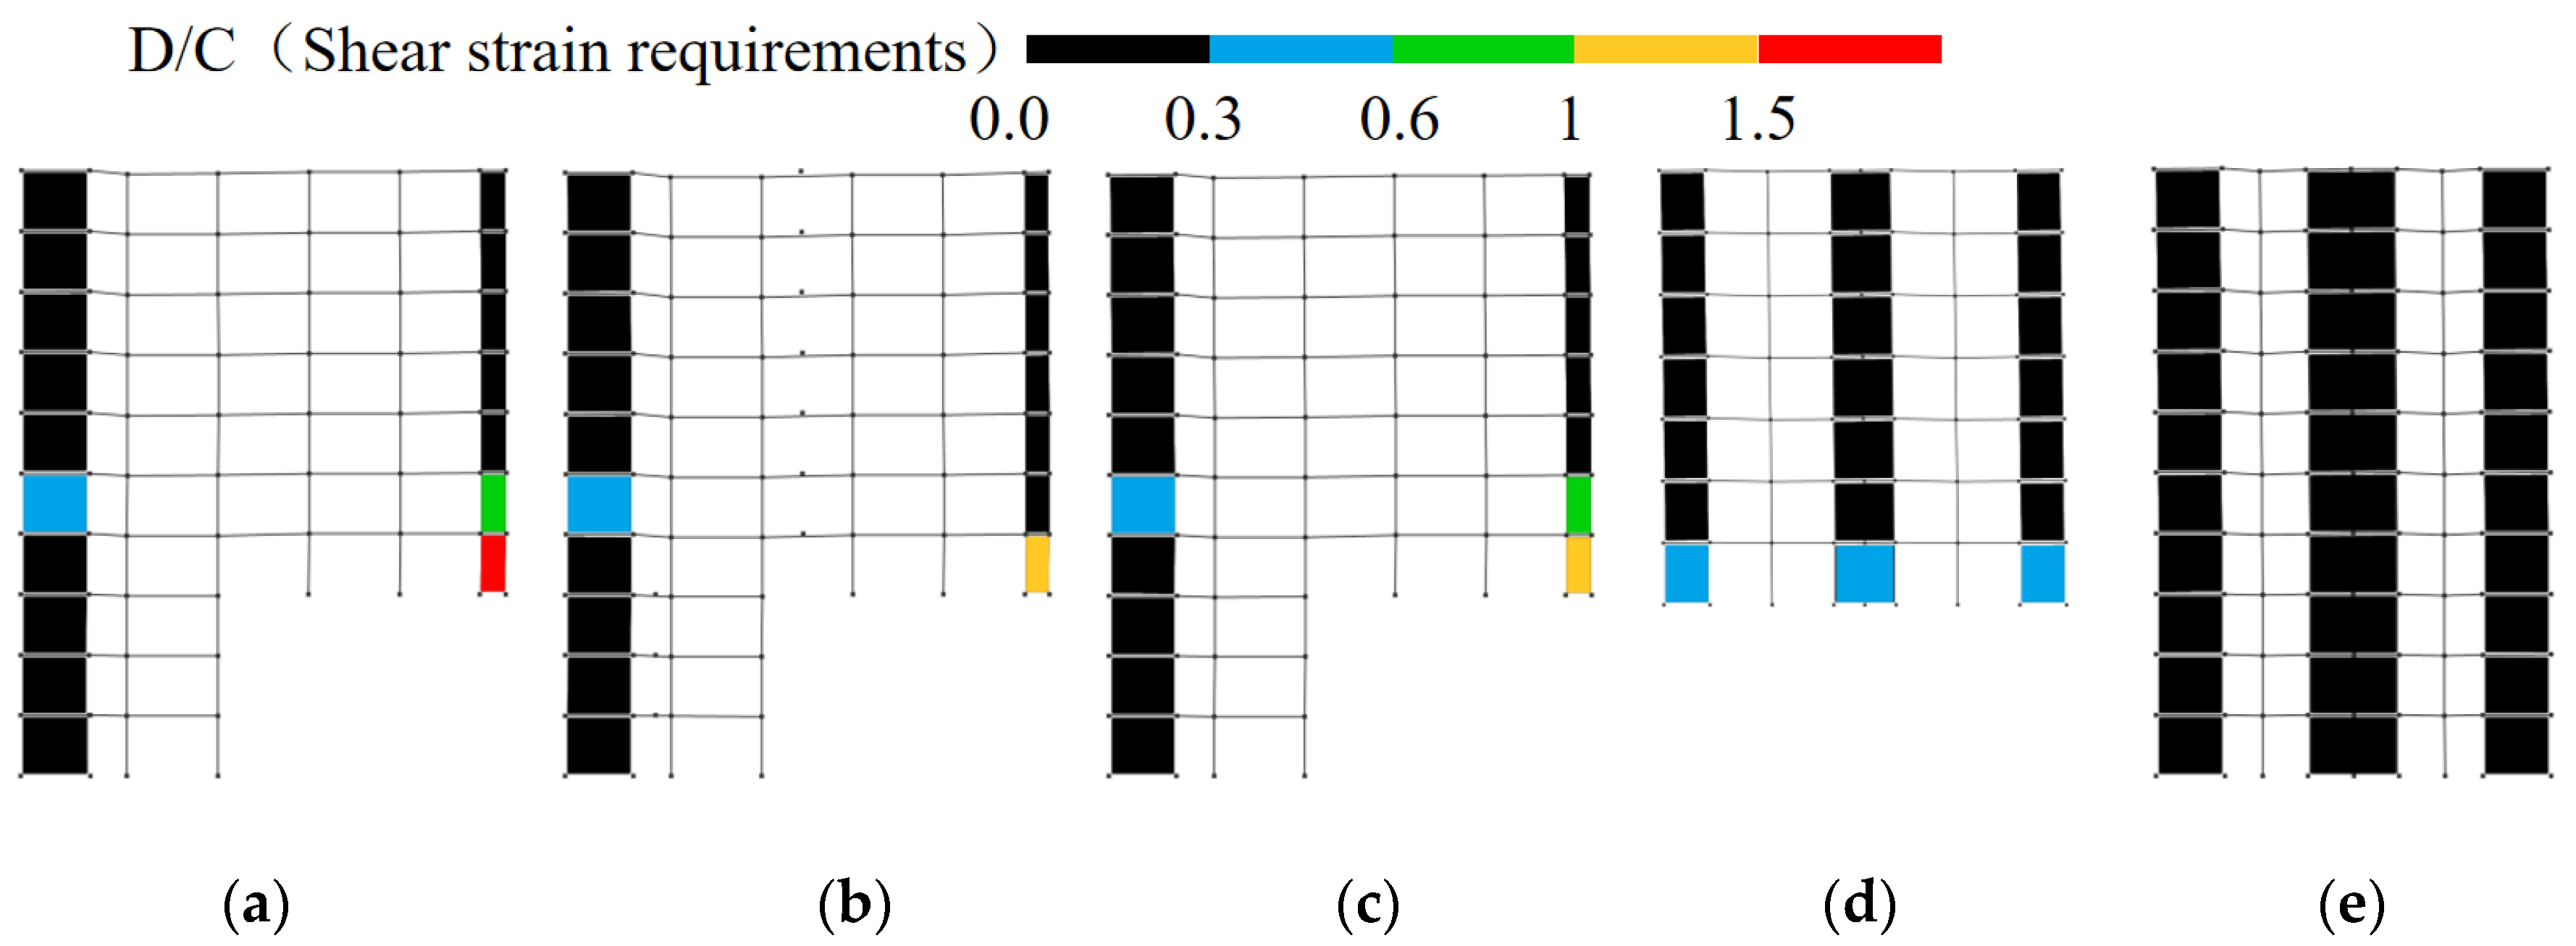
- In frame–shear wall split-foundation structures, upper embedding columns may experience more unfavorable force conditions compared to lower embedding shear walls. Increasing the length of lower embedding shear walls to reduce the intra-story stiffness ratio can alleviate this issue, but it has limited effect on improving the shear resistance of upper embedding shear walls.
- (c)
- Analysis of internal force redistribution in frame–shear wall split-foundation structures reveals distinct patterns between the across-slope and along-slope directions. Significant redistribution occurs in local floor frames, highlighting the need for structural engineers to ensure the effectiveness of secondary defense lines in these areas during design.
- (d)
- Under the same seismic intensity input, seismic responses in the along-slope direction are more unfavorable than the across-slope responses. Therefore, design should prioritize the most critical input direction (along-slope) and incorporate the following measures: enhance the ductility of upper embedding columns and frame beams connected to shear walls and strengthen the load-carrying capacity of upper embedding shear walls, particularly their shear resistance.
Author Contributions
Funding
Data Availability Statement
Conflicts of Interest
Correction Statement
Appendix A

| Parameter | Calculation Method | Definition |
|---|---|---|
| rintra | Equation (9) | The ratio of the lower embedding side’s stiffness of the upper embedding story to the total structural stiffness of the upper embedding story |
| α | α = h1/h2 | The ratio of the drop-story height to the height above the upper grounding end of the structure |
| nm1 | nm1 = Mw1/Mtotal | The ratio of the moment undertaken by the lower embedding shear wall to the total moment of all structural components |
| nm2 | nm2 = Mw2/Mtotal | The ratio of the moment undertaken by the lower embedding shear wall to the total moment of all structural components |
| nV1 | nV1 = Vw1/Vtotal | The ratio of the shear force undertaken by the lower embedding shear wall to the total shear force of all structural components |
| nV2 | nV2 = Vw2/Vtotal | The ratio of the shear force undertaken by the lower embedding shear wall to the total shear force of all structural components |
| Mw1/Mf2 | - | The ratio of the moment undertaken by the lower embedding shear wall to that undertaken by the upper embedding frame column |
| Vw1/Vf2 | - | The ratio of the shear force undertaken by the lower embedding shear wall to that undertaken by the upper embedding frame column |
References
- Li, Y.; Liu, L.; Han, J. Basic Concepts and Performance of Mountainous Building Structures; Science Press: Beijing, China, 2016. [Google Scholar]
- Aggarwal, Y.; Saha, S.K. Seismic performance assessment of reinforced concrete hilly buildings with open story. Structures 2021, 34, 224–238. [Google Scholar] [CrossRef]
- Narayanan, A.V.; Goswami, R.; Murty, C. Performance of RC Buildings Along Hill Slopes of Himalayas During 2011 Sikkim Earthquake. In Proceedings of the 15th World Conference of Earthquake Engineering, Lisboa, Portugal, 24–28 September 2012. [Google Scholar]
- Tang, Y.; Li, Y.; Jiang, B.; Wang, L.; Ji, S. Study on redistribution of internal force and plastic hinge development of mountainous building structures with foundations at two different elevations. Buildings 2023, 13, 909. [Google Scholar] [CrossRef]
- Tang, Y.; Jiang, B.; Li, Y.; Ji, S. Study on the influence of base shear distribution on the seismic response of base-isolated split-foundation structures. J. Asian Archit. Build. Eng. Build. 2024, 24, 1221–1234. [Google Scholar] [CrossRef]
- Jiang, B.; Li, Y.; Tang, Y.; Ji, S.; Liu, L. Shaking table test of a split-foundation RC frame structure with one lower story compared with a conventional RC frame structure. Int. J. Struct. Stab. Dyn. 2023, 23, 2340025. [Google Scholar] [CrossRef]
- Xu, G.; Li, A. Seismic performance and improvements of stepback steel frames. J. Earthq. Eng. 2021, 25, 163–187. [Google Scholar] [CrossRef]
- Xu, G.; Zhang, R.; Li, A. Seismic performance and improvements of split-foundation buildings in across-slope direction. Adv. Struct. Eng. 2020, 23, 749–763. [Google Scholar] [CrossRef]
- Singh, Y.; Gade, P.; Lang, D.H.; Erduran, E. Seismic behavior of buildings located on slopes-An analytical study and some observations from Sikkim Earthquake of September 18, 2011. In Proceedings of the 15th World Conference of Earthquake Engineering 2012, Lisbon, Portugal, 24–28 September 2012. [Google Scholar]
- Xu, J.; Ji, S.Y.; Li, Y.M.; Liu, L.P.; Wang, X.W.; Wang, G.J. Seismic failure modes identification of split-foundation RC frame structures. In Proceedings of the 17th World Conference on Earthquake Engineering, Sendai, Japan, 27 September 2021. [Google Scholar]
- Pawar, S.; Pise, D.C.; Pawar, Y.; Shelar, N.K. Effect of positioning of RC shear walls of different shapes on seismic performance of building resting on sloping ground. Int. J. Civ. Eng. 2016, 7, 373–384. [Google Scholar]
- Xu, L. Seismic Fragility Analysis of the Frame-shear Wall Structure on Steep Slopes. Master Thesis, Chongqing University, Chongqing, China, 2019. [Google Scholar]
- Li, D. The Elastic-plastic Mechanical Behavior and Seismic Performance of Frame-shear wall Structure on Slope. Master Thesis, Chongqing University, Chongqing, China, 2012. [Google Scholar]
- Wu, G. Influence Research on Force Characteristics and Seismic Performance of Step-terrace Frame Shear wall Structure with Different Shear-Wall Arrangement. Master Thesis, Chongqing University, Chongqing, China, 2017. [Google Scholar]
- Jian, F. Shaking Table Test on Seismic Performance of Frame Shear Wall Structures Supported by Foundations with Different Elevations. Master Thesis, Chongqing University, Chongqing, China, 2020. [Google Scholar]
- China Academy of Building Research Co., Ltd.; Beijing Gouli Technology Co., Ltd. Technical Manual for Structural Analysis and Design Software of Multi-Story and High-Rise Buildings for PKPM; Beijing, China. 2023. Available online: https://product.pkpm.cn/productDetails?type=common&from=common&key=1&productId=8 (accessed on 22 April 2025).
- Beijing Jin Tumu Software Technology Co., Ltd. China Institute of Building Standard Design and Research. In SAP2000 Chinese Version of User Guide, 2nd ed.; China Communications Press: Beijing, China, 2012. [Google Scholar]
- JGJ/T 472-2020; Standard for Design of Building Structures on Slopes. China Architecture & Building Press: Beijing, China, 2020.
- GB/T 50011-2010; Code for Seismic Design of Buildings. China Architecture & Building Press: Beijing, China, 2010.
- Ministry of Housing and Urban-Rural Development of the People’s Republic of China. General Code for Engineering Structures; China Construction Industry Press: Beijing, China, 2022. [Google Scholar]
- Computers and Structures, Inc. Nonlinear Analysis and Performance Assessment for 3D Structures; Computers and Structures, Inc.: Berkeley, CA, USA, 2006. [Google Scholar]
- Computers and Structures, Inc. Components and Elements for PERFORM-3D; Computers and Structures, Inc.: Berkeley, CA, USA, 2006. [Google Scholar]
- Menegotto, M.; Pinto, P. Method of analyses of cyclically loaded RC plane frames including changes in geometry and non-elastic behavior of elements under normal force and bending. Prelim. Rep. IABSE 1973, 15–20. [Google Scholar] [CrossRef]
- Mander, J.B.; Priestley, M.J.; Park, R. Theoretical stress-strain model for confined concrete. J. Struct. Eng. 1988, 114, 1804–1826. [Google Scholar] [CrossRef]
- Cui, J. PERFORM-3D Theory and Tutorials; China Construction Industry Press: Beijing, China, 2017. [Google Scholar]
- ASCE 41-17; Seismic Evaluation and Retrofit of Existing Buildings. American Society of Civil Engineers: Reston, VA, USA, 2017.
- Chuan2020G145-TY; Sichuan Province Technical Drawings for Seismic Design of Tall Buildings Beyond Code Limits. Southwest Jiaotong University Press: Chengdu, China, 2020.
- Feng, Y.; Liu, Y.; Xiao, K. Experience the Wenchuan Earthquake—Structural Engineers’ Point and View; China Architecture & Building Press: Beijing, China, 2009. [Google Scholar]
- Miao, L.; Chen, F.; Jin, L.; Du, X. Experimental study on seismic behavior and corresponding size effect of reinforced concrete shear walls. J. Build. Struct. 2024, 45, 107–116. [Google Scholar]
- JGJ 3-2010; Technical Specification for Concrete Structures of Tall Buildings. China Architecture & Building Press: Beijing, China, 2010.


| Number | h 1 (m) | h 2 (m) | L (m) | Beam Size (mm) | Column size (mm) | Length of Wall 1 (m) | Length of Wall 2 (m) |
|---|---|---|---|---|---|---|---|
| 1 | 5 | 5 | 6 | 300 × 500 | 500 × 500 | 2 | 2 |
| 2 | 5 | 7 | 6 | 300 × 500 | 500 × 500 | 2 | 2 |
| 3 | 5 | 5 | 6 | 300 × 800 | 800 × 800 | 2 | 2 |
| 4 | 5 | 5 | 6 | 300 × 500 | 500 × 500 | 3 | 2 |
| 5 | 5 | 5 | 6 | 300 × 500 | 500 × 500 | 2 | 3 |
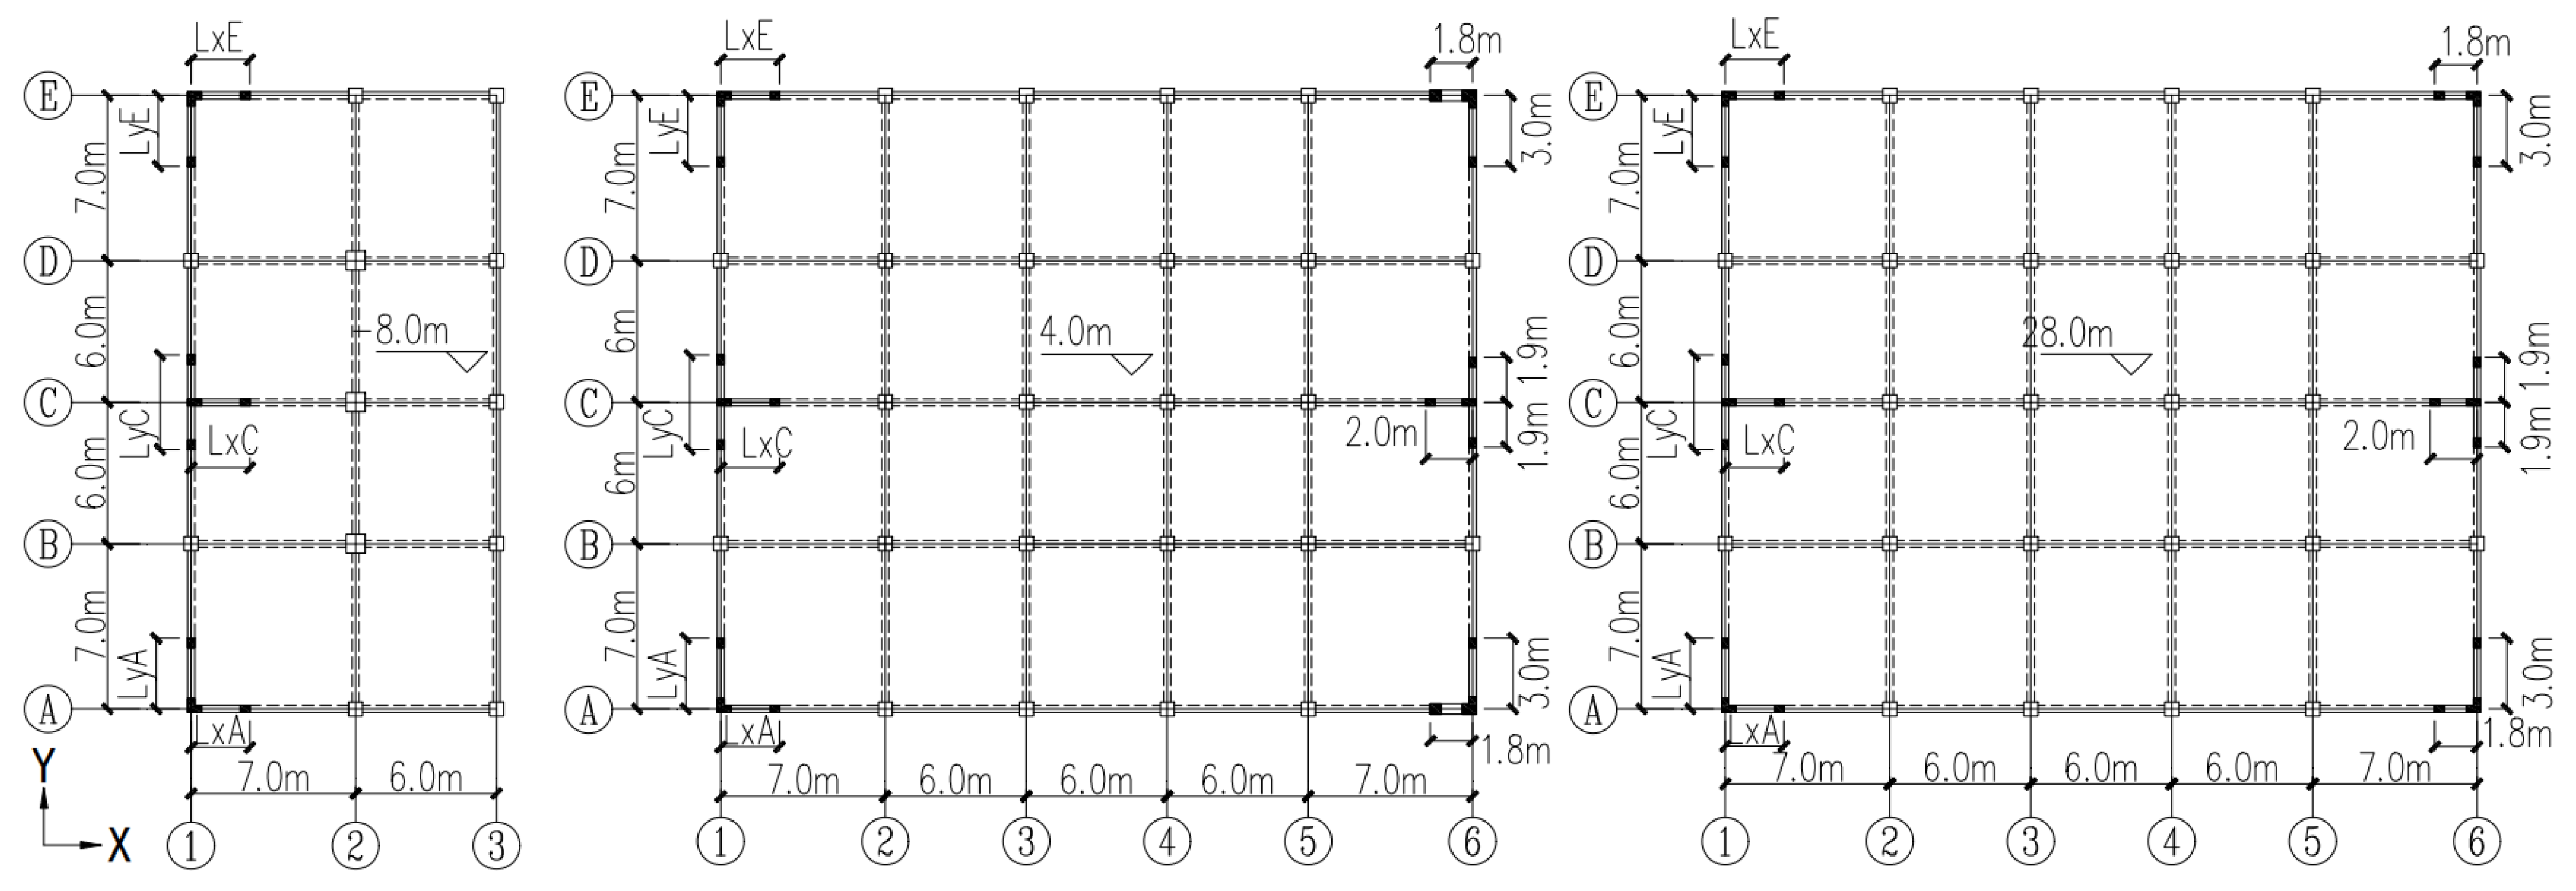
| Model Number | Parameter | C1 | C2 | C3 |
|---|---|---|---|---|
| Along the slope | LxA | 2500 mm | 3500 mm | 4500 mm |
| LxC | 2500 mm | 3500 mm | 4500 mm | |
| LxE | 2500 mm | 3500 mm | 4500 mm | |
| Across the slope | LyA | 3000 mm | 3500 mm | 4500 mm |
| LyC | 4000 mm | 5000 mm | 6000 mm | |
| LyE | 3000 mm | 3500 mm | 4500 mm |
| rintra | C1 | C2 | C3 |
|---|---|---|---|
| Along the slope | 0.92 | 0.87 | 0.81 |
| Across the slope | 0.94 | 0.92 | 0.88 |
Disclaimer/Publisher’s Note: The statements, opinions and data contained in all publications are solely those of the individual author(s) and contributor(s) and not of MDPI and/or the editor(s). MDPI and/or the editor(s) disclaim responsibility for any injury to people or property resulting from any ideas, methods, instructions or products referred to in the content. |
© 2025 by the authors. Licensee MDPI, Basel, Switzerland. This article is an open access article distributed under the terms and conditions of the Creative Commons Attribution (CC BY) license (https://creativecommons.org/licenses/by/4.0/).
Share and Cite
Wang, W.; Jiang, B.; Li, Y.; Tang, Y.; Ji, S. Study on Seismic Performance of Frame–Shear Wall Split-Foundation Structures with Shear Walls on Both Grounding Ends. Buildings 2025, 15, 1852. https://doi.org/10.3390/buildings15111852
Wang W, Jiang B, Li Y, Tang Y, Ji S. Study on Seismic Performance of Frame–Shear Wall Split-Foundation Structures with Shear Walls on Both Grounding Ends. Buildings. 2025; 15(11):1852. https://doi.org/10.3390/buildings15111852
Chicago/Turabian StyleWang, Wusu, Baolong Jiang, Yingmin Li, Yangyang Tang, and Shuyan Ji. 2025. "Study on Seismic Performance of Frame–Shear Wall Split-Foundation Structures with Shear Walls on Both Grounding Ends" Buildings 15, no. 11: 1852. https://doi.org/10.3390/buildings15111852
APA StyleWang, W., Jiang, B., Li, Y., Tang, Y., & Ji, S. (2025). Study on Seismic Performance of Frame–Shear Wall Split-Foundation Structures with Shear Walls on Both Grounding Ends. Buildings, 15(11), 1852. https://doi.org/10.3390/buildings15111852