
Achieving Maximum Smart Readiness Indicator Scores: A Financial Analysis with an In-Depth Feasibility Study in Non-Ideal Market Conditions


Abstract
1. Introduction
2. Methods
2.1. Financial and Technical Evaluation Assumptions
2.2. Energy Price Assumptions
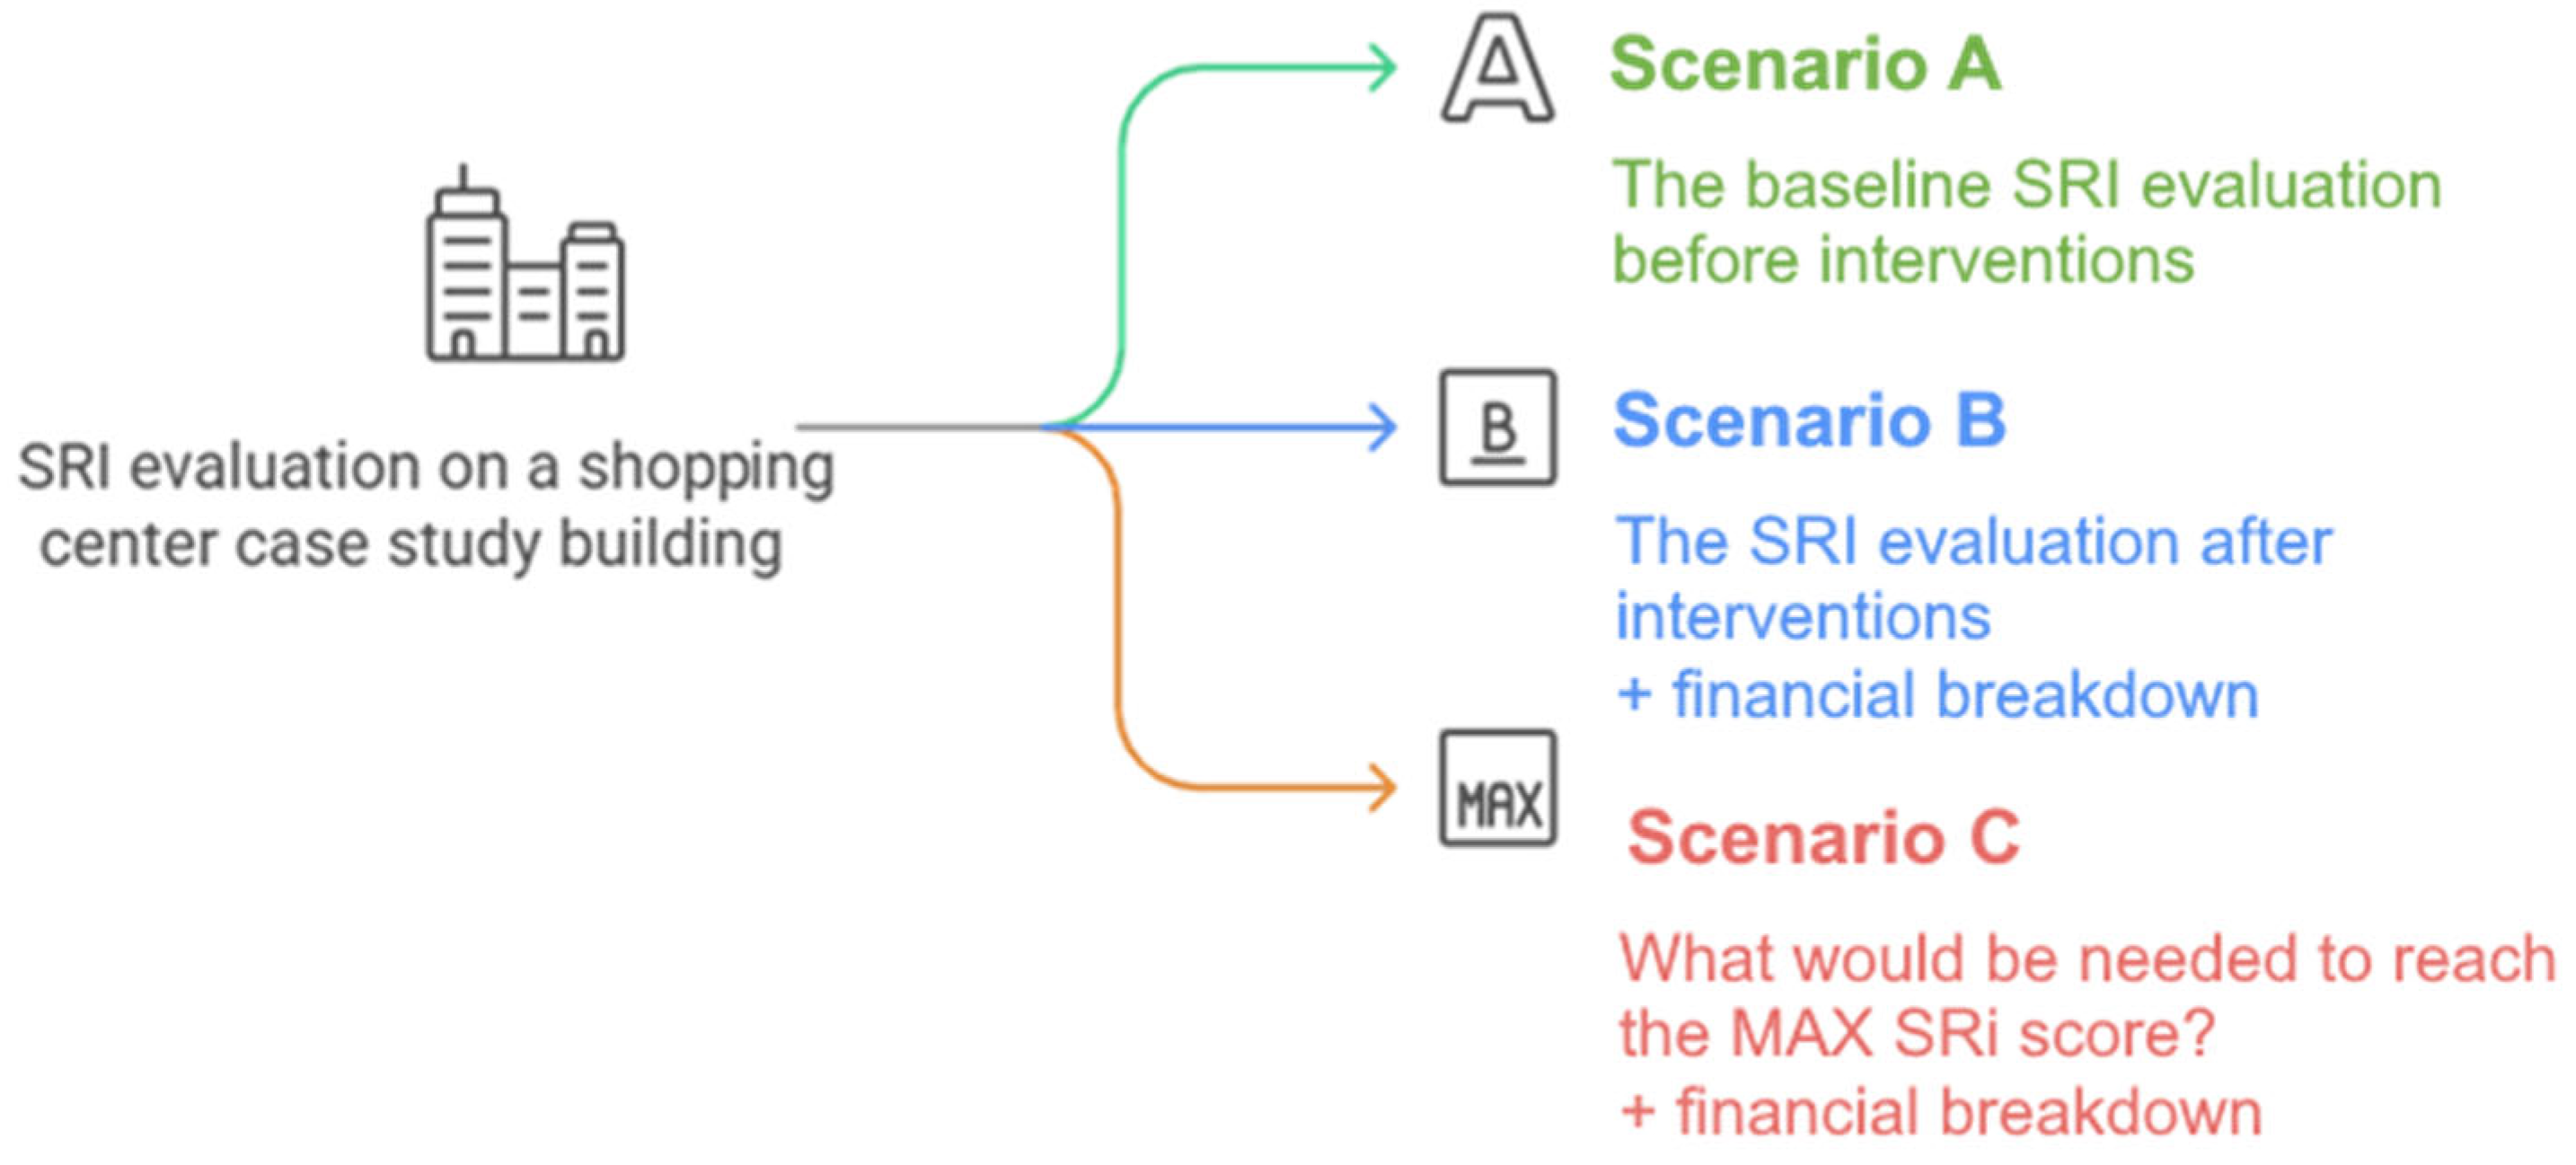
2.3. Research Design
- the total SRI value of the building (expressed as a percentage),
- domain scores (expressed as a percentage),
- impact scores (expressed as a percentage).
2.4. Case Study Building
3. Results
3.1. Triage Procedure for the Baseline Scenario—Scenario A
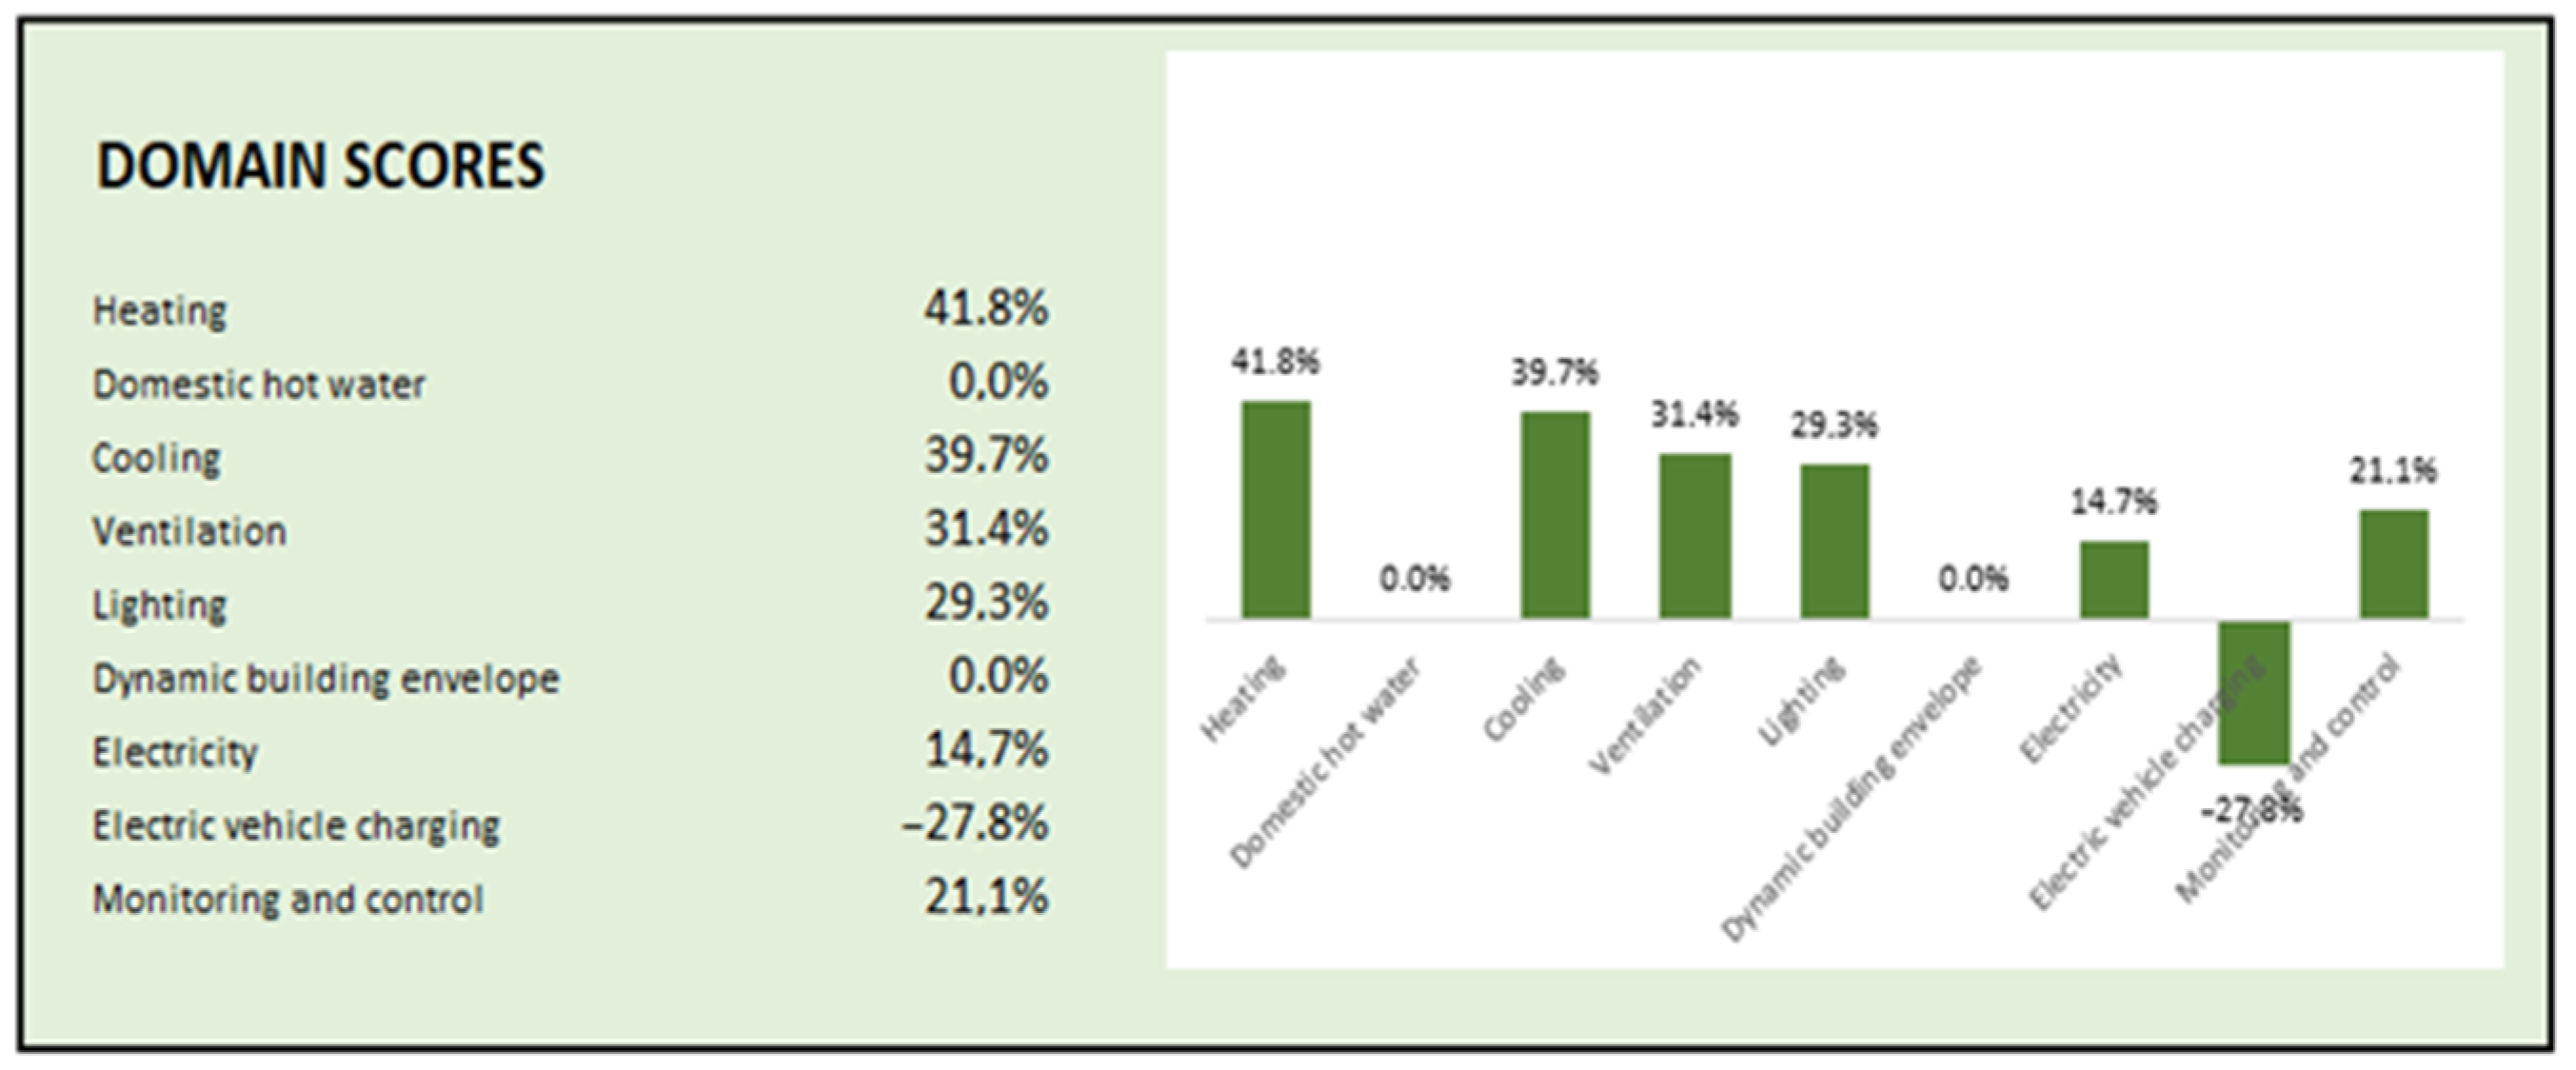
3.1.1. Domain Scores
3.1.2. Impact Factors
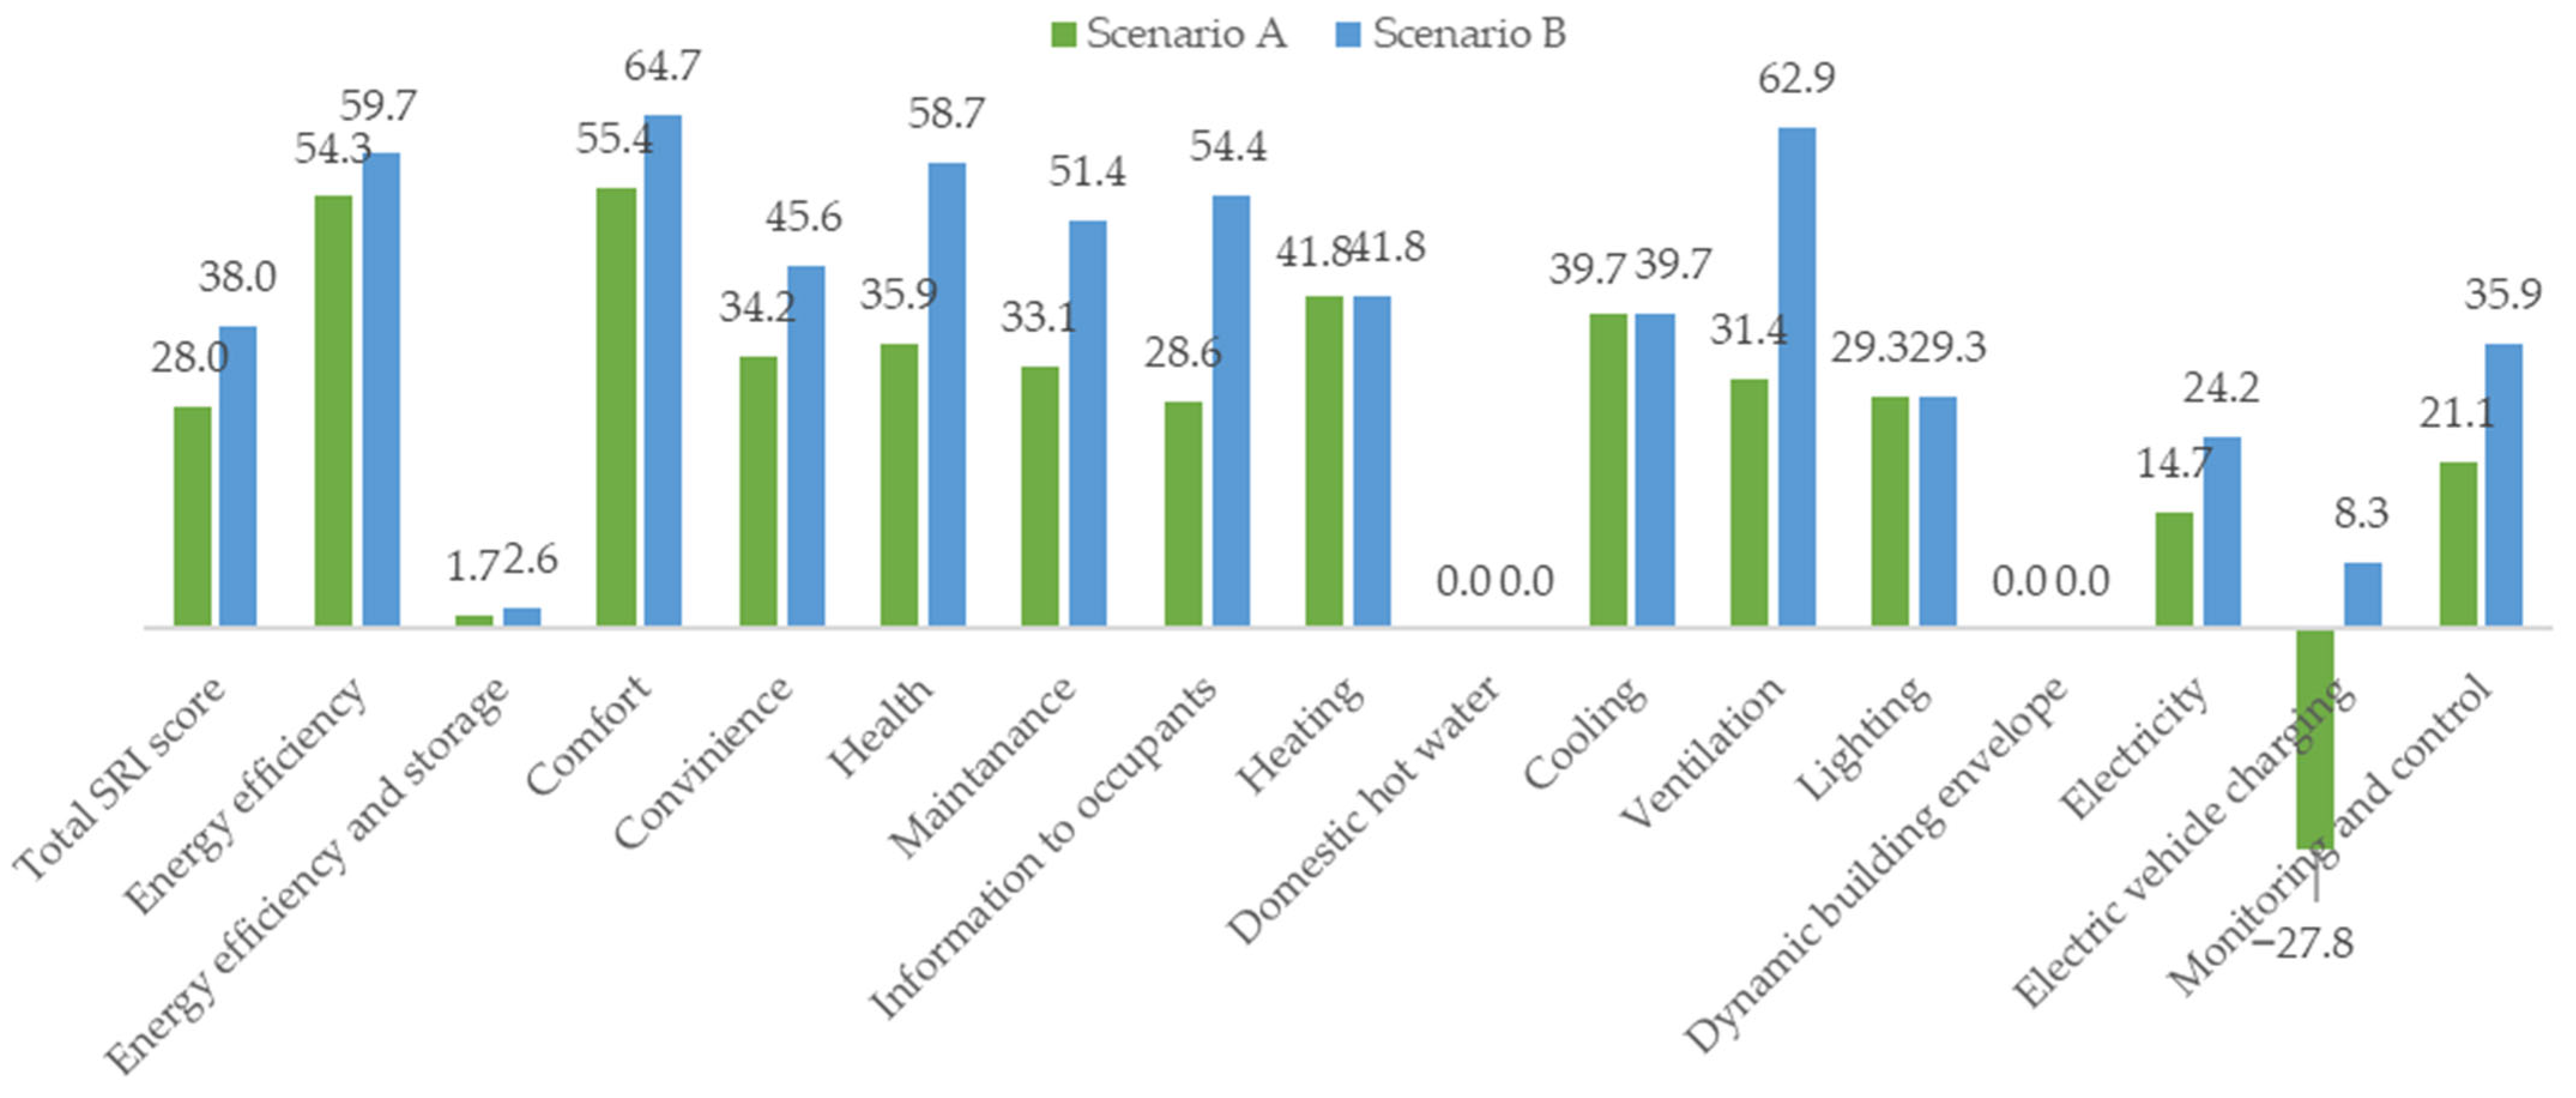
3.2. Triage Procedure—Scenario B
3.2.1. Domain Scores
3.2.2. Impact Factors
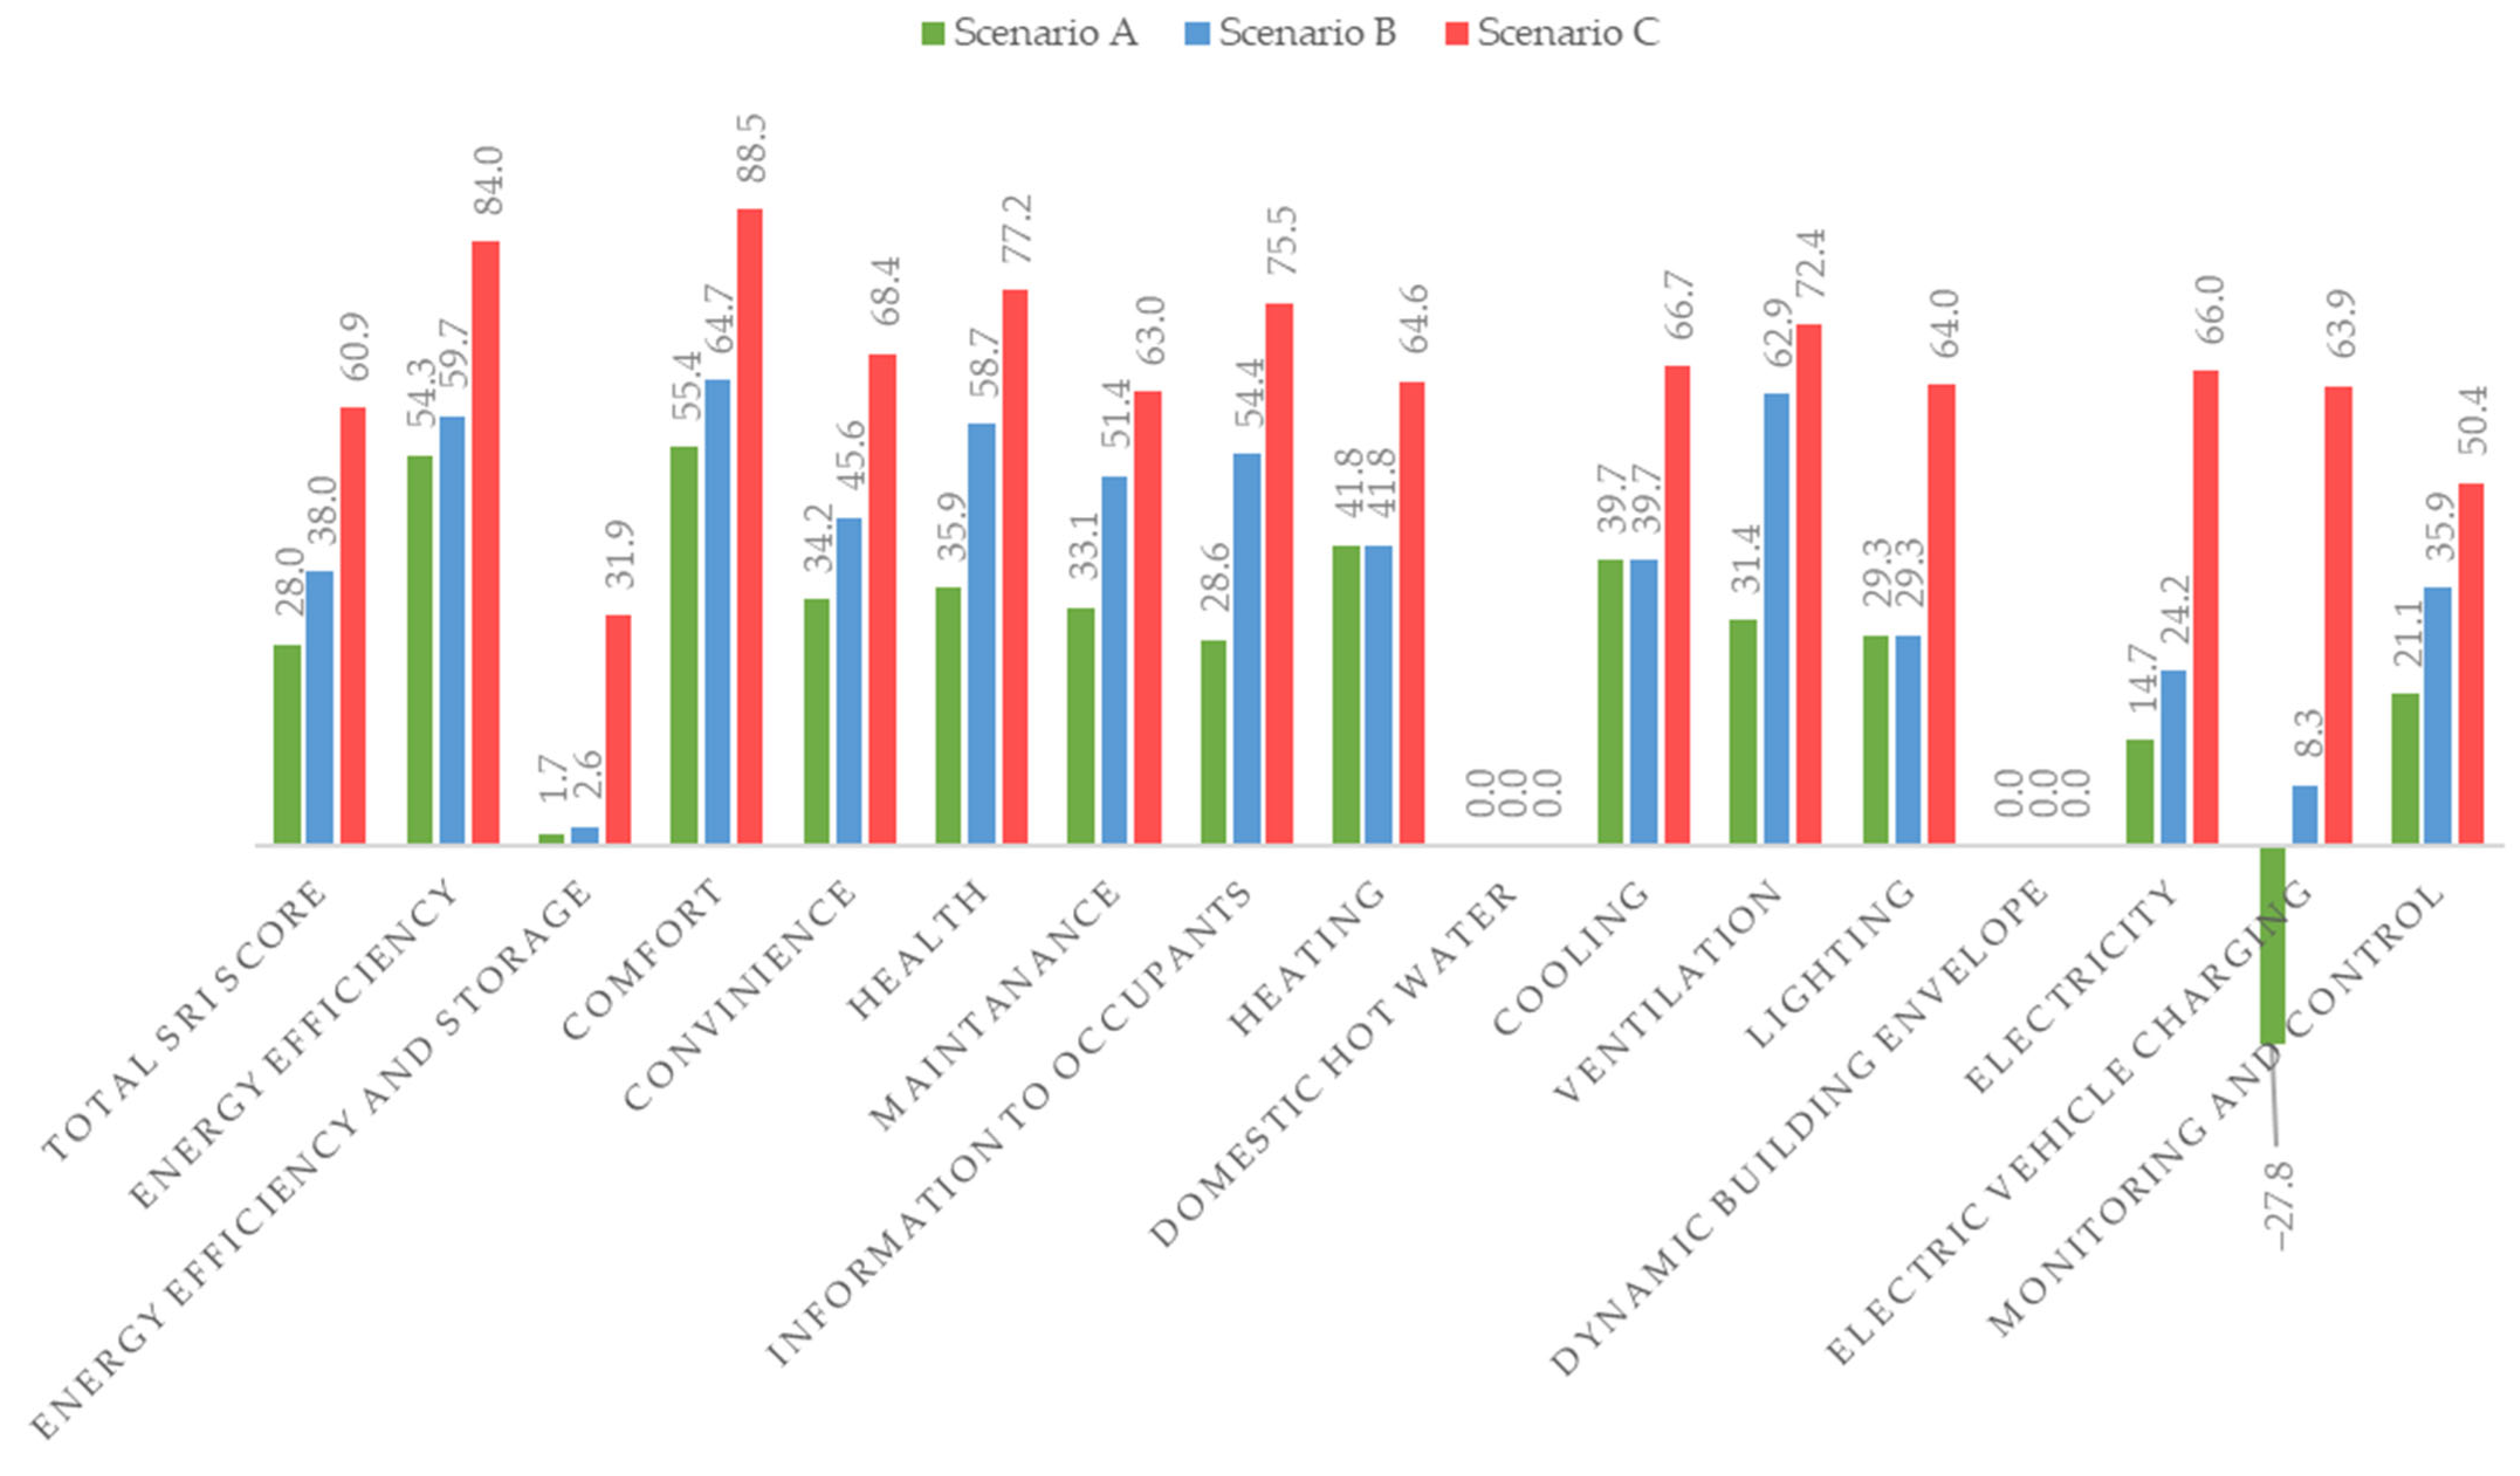
3.3. Interventions Needed to Achieve the Maximum Score—Scenario C
3.3.1. Heating
3.3.2. Domestic Hot Water
3.3.3. Cooling
3.3.4. Air Flow
3.3.5. Lighting
3.3.6. Window Control
3.3.7. Electricity
3.3.8. EV Charging
3.3.9. Monitoring and Control
3.4. Achieved SRI Scores—Scenario C
3.5. Financial Analysis
3.5.1. Financial Breakdown for Scenario B
3.5.2. ROI and Payback Period for Scenario B
3.5.3. Sensitivity Analysis for Scenario B
3.5.4. What-If Analysis for Scenario B
- -
- The electricity purchase price increased by 24%, rising from 0.21 €/kWh to 0.26 €/kWh;
- -
- The electricity feed-in tariff dropped from 0.29 €/kWh to 0.22 €/kWh;
- -
- The equipment cost increased by 20%, simulating inflationary pressure on materials and technologies.
3.5.5. Financial Breakdown for Scenario C
3.5.6. ROI and Payback Period for Scenario C
3.5.7. Sensitivity Analysis for Scenario C
3.5.8. What-If Analysis for Scenario C
4. Discussion
4.1. Defining the Concept of Maximum Feasibility in the SRI Assessment
4.2. Evaluating the SRI Score; Relevance, Regional Constraints, Occupants, and Infrastructure
4.3. Comparison of the Results with Other Studies
4.4. The Role of Education and Awareness in the SRI Adoption
5. Conclusions
Author Contributions
Funding
Data Availability Statement
Acknowledgments
Conflicts of Interest
Abbreviations
| AHU | Air handling unit |
| BACS | Building automation and control system |
| CHP | Combined heat and power plant production |
| COP | Coefficient of performance |
| DSM | Demand-side management |
| EPBD | Energy Performance of Buildings Directive |
| NEPN | National Energy Plan for Slovenia |
| SRI | Smart readiness indicator |
| TABS | Thermally activated building systems |
| VAV | Variable air volume |
Appendix A. ROI and Return of Investment Calculations for Scenario B

| Input Data | ||
|---|---|---|
| Shopping area | 40,000 | m2 |
| Average electricity consumption (B) | 150 | kWh/m2 |
| Baseline heating consumption of the center (district heating) | 1,500,000 | kWh/year |
| Electricity cost per kWh | 0.21 | €/kWh (Eurostat, for year 2024, including taxes and all fees) [44] |
| Electricity feed-in tariff | 0.29 | €/kWh (Eurostat, for year 2024, including taxes and all fees) [44] |
| District heating costs per kWh (E) | 0.8 | €/kWh (Eurostat, for year 2024, including taxes and all fees) [44] |
| Power of the PV plant | 842 | kW |
| Specific yield for the location in Slovenia (Y) | 1150 | kWh/kWp/year |
Appendix B
| Code | Service Group | Selected Functionality Level | Maximal Feasible Functionality Level | Scenario C Score | Smart Technology— Maximum Obtainable Score |
|---|---|---|---|---|---|
| Heating-1a | Heat emission control | Individual room control with communication between controllers and BACS | Individual room control with communication and occupancy detection | 75% | 100% |
| Heating-1b | Emission control for TABS (heating mode) | Not available in the building | Not available in the building | - | - |
| Heating-1c | Control of the distribution fluid temperature (supply or return air flow or water flow)—similar function can be applied to the control of direct electric heating networks | Demand-based | Demand-based | 100% | 100% |
| Heating-1d | Control of distribution pumps in networks | Variable-speed pump control (pump unit (internal) estimations) | Variable-speed pump control (external demand signal) | 75% | 100% |
| Heating-1f | Thermal energy storage (TES) for building heating (excluding TABS) | Time-scheduled storage operation | Heat storage capable of flexible control through grid signals (e.g., DSM) | 25% | 100% |
| Heating-2a | Heat generator control (all except heat pumps) | Variable temperature control depending on the outdoor temperature | Variable temperature control depending on the load (e.g., depending on the supply water temperature setpoint) | 50% | 100% |
| Heating-2b | Heat generator control (for heat pumps) | Not available in the building | Not available in the building | - | - |
| Heating-2d | Sequencing in case of different heat generators | Not available in the building | Not available in the building | - | - |
| Heating-3 | Reporting information regarding heating system performance | Central or remote reporting of current performance KPIs and historical data | Central or remote reporting of performance evaluation, including forecasting and/or benchmarking; also including predictive management and fault detection | 50% | 75% |
| Heating-4 | Flexibility and grid interaction | Scheduled operation of heating system | Optimized control of the heating system based on local predictions and grid signals (e.g., through model predictive control) | 25% | 100% |
| Code | Service Group | Selected Functionality Level | Maximum Feasible Functionality Level | Scenario C Score | Smart Technology— Maximum Obtainable Score |
|---|---|---|---|---|---|
| Cooling C-1a | Cooling emission control | Individual room control with communication between controllers and BACS | Individual room control with communication and occupancy detection | 75% | 100% |
| Cooling C-1b | Emission control for TABS (cooling mode) | Not available in the building | Not available in the building | - | - |
| Cooling C-1c | Control of distribution network’s chilled water temperature (supply or return) | Demand-based control | Demand-based control | 100% | 100% |
| Cooling C-1d | Control of distribution pumps in networks | Variable-speed pump control (pump unit (internal) estimations) | Variable-speed pump control (external demand signal) | 75% | 100% |
| Cooling C-1f | Interlock: avoiding simultaneous heating and cooling in the same room | Total interlock (control system ensures no simultaneous heating and cooling can take place) | Total interlock (control system ensures no simultaneous heating and cooling can take place) | 100% | 100% |
| Cooling C-1g | Control of the thermal energy storage (TES) operation | Time-scheduled storage operation | Cold storage capable of flexible control through grid signals (e.g., DSM) | 25% | 100% |
| Cooling C-2a | Generator control for cooling | On/off control of cooling production | Variable control of cooling production capacity depending on the load and external signals from grid | 0% | 50% |
| Cooling C-2b | Sequencing of different cooling generators | Fixed sequencing based on loads only: e.g., depending on the generators’ characteristics, such as absorption chiller vs. centrifugal chiller | Sequencing based on a dynamic priority list, including external signals from the grid | 25% | 100% |
| Cooling C-3 | Reporting information regarding the cooling system performance | Central or remote reporting of the current performance KPIs and historical data | Central or remote reporting of performance evaluation, including forecasting and/or benchmarking; also including predictive management and fault detection | 50% | 100% |
| Cooling C-4 | Flexibility and grid interaction | Scheduled operation of the cooling system | Optimized control of the cooling system based on local predictions and grid signals (e.g., through model predictive control) | 25% | 100% |
| Code | Service Group | Selected Functionality Level | Maximum Feasible Functionality Level | Scenario C Score | Smart Technology— Maximum Obtainable Score |
|---|---|---|---|---|---|
| Air flow V-1a | Supply air flow control at the room level | Clock control | Local demand control based on air quality sensors (CO2, VOC, etc.) with local flow from/to the zone regulated by dampers | 75% | 100% |
| Air flow V-1c | Air flow or pressure control at the air handler level | On/off time control: continuously supplies air flow for the maximum load of all rooms during nominal occupancy time | Automatic flow or pressure control with pressure reset: load-dependent supplies of air flow for the demand of all the connected rooms (for variable air volume systems with VFD) | - | - |
| Air flow V-2c | Heat recovery control: prevention of overheating | Modulate or bypass heat recovery based on sensors in the air exhaust | Modulate or bypass heat recovery based on multiple room temperature sensors or predictive control | 100% | 100% |
| Air flow V-2d | Supply air temperature control at the air handling unit level | Variable setpoint with outdoor temperature compensation | Variable setpoint with load-dependent compensation. A control loop enables controlling the supply air temperature. The setpoint is defined as a function of the loads in the room | 75% | 100% |
| Air flow V-3 | Free cooling with mechanical ventilation system | Free cooling: air flows modulated during all periods of time to minimize the amount of mechanical cooling | H,x-directed control: the amounts of outside air and recirculation air are modulated at all periods of time to minimize the amount of mechanical cooling. Calculation is performed on the basis of temperature and humidity enthalpy | 75% | 100% |
| Air flow V-6 | Reporting information regarding IAQ | Air quality sensors (e.g., CO2) and real-time autonomous monitoring | Real-time monitoring and historical information of IAQ available to occupants + warning on maintenance needs or occupant actions (e.g., window opening) | 25% | 100% |
| Code | Service Group | Selected Functionality Level | Maximum Feasible Functionality Level | Scenario C Score | Smart Technology— Maximum Obtainable Score |
|---|---|---|---|---|---|
| Lighting L-1a | Occupancy control for indoor lighting | Manual on/off switch + additional sweeping extinction signal | Automatic detection (manual on/dimmed or auto off) | 33% | 100% |
| Lighting 2 | Control of the artificial lighting power based on daylight levels | Manual (per room/zone) | Automatic dimming including scene-based light control (during time intervals, dynamic and adapted lighting scenes are set, for example, in terms of illuminance level, different correlated color temperature (CCT), and the possibility to change the light distribution within the space according to, e.g., design, human needs, visual tasks) | 25% | 100% |
| Code | Service Group | Selected Functionality Level | Maximum Feasible Functionality Level | Scenario C Score | Smart Technology— Maximum Obtainable Score |
|---|---|---|---|---|---|
| Electricity E-2 | Reporting information regarding local electricity generation | Actual values and historical data | Performance evaluation, including forecasting and/or benchmarking; also including predictive management and fault detection | 50% | 100% |
| Electricity E-3 | Storage of (locally generated) electricity | None | On-site storage of energy (e.g., electric battery or thermal storage) with the controller optimizing the use of locally generated electricity and possibility to feed back into the grid | 0% | 100% |
| Electricity E-4 | Optimizing self-consumption of locally generated electricity | None | Automated management of local electricity consumption based on the current and predicted energy needs and renewable energy availability | 0% | 100% |
| Electricity E-5 | Control of the combined heat and power plant (CHP) | Not available in the building | Not available in the building | - | - |
| Electricity E-8 | Support of (micro)grid operation modes | None | Automated management of (building-level) electricity consumption and supply, with potential to continue limited off-grid operation (island mode) | 0% | 100% |
| Electricity E-11 | Reporting information regarding energy storage | Not available in the building | Performance evaluation, including forecasting and/or benchmarking; also including predictive management and fault detection | 0% | 100% |
| Electricity E-12 | Reporting information regarding electricity consumption | Real-time feedback or benchmarking on The appliance level | Real-time feedback or benchmarking on the appliance level with automated personalized recommendations | 75% | 100% |
| Code | Service Group | Selected Functionality Level | Maximum Feasible Functionality Level | Scenario C Score | Smart Technology— Maximum Obtainable Score |
|---|---|---|---|---|---|
| EV charging EV-15 | EV charging capacity | 0–9% of parking spaces with recharging points | >50% of parking spaces have recharging points | 50% | 100% |
| EV charging EV-16 | EV charging grid balancing | Not present (uncontrolled charging) | Two-way controlled charging (e.g., including the desired departure time and grid signals for optimization) | 0% | 100% |
| EV charging EV-17 | EV charging information and connectivity | Reporting information on the EV charging status for occupants and automatic identification and authorization of the driver to the charging station (compliant with ISO 15118) | Reporting information on the EV charging status for occupants and automatic identification and authorization of the driver to the charging station (compliant with ISO 15118) | 0% | 100% |
| Code | Service Group | Selected Functionality Level | Maximum Feasible Functionality Level | Scenario C Score | Smart Technology— Maximum Obtainable Score |
|---|---|---|---|---|---|
| Monitoring and control MC-3 | Runtime management of HVAC systems | Runtime setting of heating and cooling plants following a predefined time schedule | Heating and cooling plant on/off control based on predictive control or grid signals | 33% | 100% |
| Monitoring and control MC-4 | Detecting faults of technical building systems and providing support to the diagnosis of these faults | Not present (uncontrolled charging) | Two-way controlled charging (e.g., including the desired departure time and grid signals for optimization) | 0% | 100% |
| Monitoring and control MC-9 | Occupancy detection: connected services | Centralized occupant detection, which feeds in to several TBS, such as lighting and heating | Centralized occupant detection, which feeds in to several TBS, such as lighting and heating | 100% | 100% |
| Monitoring and control MC-13 | Central reporting of TBS performance and energy use | Central or remote reporting of real-time energy use per energy carrier, combining TBS of at least 2 domains in one interface | Central or remote reporting of real-time energy use per energy carrier, combining TBS of all main domains in one interface | 100% | 100% |
| Monitoring and control MC-25 | Smart grid integration | None—no harmonization between the grid and TBS; the building is operated independently from the grid load | Coordinated demand-side management of multiple TBS | 0% | 100% |
| Monitoring and control MC-28 | Reporting information regarding demand-side management performance and operation | None | Reporting information on the current historical and predicted DSM status, including managed energy flows | 0% | 100% |
| 1Monitoring and control MC-29 | EV charging information and connectivity | No DSM control | Scheduled override of DSM control and reactivation with optimized control | 0% | 100% |
| Monitoring and control MC-30 | EV charging information and connectivity | Single platform that allows manual control of multiple TBS | Single platform that allows automated control and coordination between TBS + optimization of energy flows based on occupancy, weather, and grid signals | 66% | 100% |
References
- IEA. Perspectives for Clean Energy Transition. The Critical Role of Buildings; International Energy Agency: Paris, France, 2019; p. 117.
- Silva, B.N.; Khan, M.; Han, K. Towards sustainable smart cities: A review of trends, architectures, components, and open challenges in smart cities. Sustain. Cities Soc. 2018, 38, 697–713. [Google Scholar] [CrossRef]
- The European parliament and the council of the European Union. Directive (eu) 2018/844 of the European Parliament and of the Council of 30 May 2018 amending directive 2010/31/EU on the Energy Performance Of Buildings and Directive 2012/27/eu on Energy Efficiency. Off. J. Eur. Union 2018, 2018, 75–91. [Google Scholar]
- European Parliament and of the Council. Regulation (EU) 2018/1999 of the European Parliament and of the Council of 11 December 2018 on the Governance of the Energy Union and Climate Action, amending Regulations (EC) No 663/2009 and (EC) No 715/2009 of the European Parliament and of the Council. Off. J. Eur. Union 2018, 2018, 77. [Google Scholar]
- The European parliament and the council of the European Union. Directive (EU) 2024/1275 of the European parlament and of the council (24 April 2024) on the Energy performance of buildings (EPBD). Off. J. Eur. Union 2024, 1275, 1–68. [Google Scholar]
- European Commission. Commission recommendation (EU) 2019/1019 of 7th of June 2019 on the modernisation of buildings. Off. J. Eur. Union 2019, 165, 70–128. [Google Scholar]
- Becchio, C.; Corgnati, S.P.; Crespi, G.; Pinto, M.C.; Viazzo, S. Exploitation of dynamic simulation to investigate the effectiveness of the Smart Readiness Indicator: Application to the Energy Center building of Turin. Sci. Technol. Built Environ. 2021, 27, 1127–1143. [Google Scholar] [CrossRef]
- Fejr, M. Smart Readiness Indicator and Indoor Environmental Quality: Two Case Studies in Italy and Portugal; Politecnico di Torino: Torino, Italy, 2019. [Google Scholar]
- Verbeke, S.; Aerts, D.; Reynders, G.; Ma, Y.; Waide, P. Final Report on the Technical Support to the Development of a Smart Readiness Indicator for Buildings-Shorter Version; Publications Office of the European Union: Luxembourg, 2020; ISBN 9789276191971. [Google Scholar]
- Surmeli-Anac, N.; Hermelink, A.H. The Smart Readiness Indicator: A Potential, Forward-Looking Energy Performance Certificate Complement? ECOFYS—A Navigant Company: Utrecht, The Netherlands, 2018. [Google Scholar] [CrossRef]
- Pinto Maria Cristina. Towards Smart Buildings. Is the Smart Readiness Indicator an Effective Tool? The Energy Center Building of Turin as Case Study. Master’s Thesis, Polytechnic University of Turin, Torino, Italy, 2020.
- Commission, E.; Environment, D.G. Level(s), What’s in It for Building Renovations? Publications Office of the European Union: Luxembourg, 2023. [Google Scholar]
- Toth, Z.; Volt, J.; Zuhaib, S.; Broer, R. Building Logbook; European Commission, BUILD UP Initiative: Brussels, Belgium, 2021.
- Engelsgaard, S.; Alexandersen, E.K.; Dallaire, J.; Jradi, M. IBACSA: An interactive tool for building automation and control systems auditing and smartness evaluation. Build. Environ. 2020, 184, 107240. [Google Scholar] [CrossRef]
- Van Ark, B.; O’Mahony, M.; Timmer, M.P. The productivity gap between Europe and the United States: Trends and causes. J. Econ. Perspect. 2008, 22, 25–44. [Google Scholar] [CrossRef]
- de Soyres, F.; Herrero, J.G.C.; Goernemann, N.; Jeon, S.; Lofstrom, G.; Moore, D. Why is the U.S. GDP Recovering Faster than Other Advanced Economies? Federal Reserve Board: Washington, DC, USA, 2024. Available online: https://www.federalreserve.gov/econres/notes/feds-notes/why-is-the-u-s-gdp-recovering-faster-than-other-advanced-economies-20240517.html?utm_source=substack&utm_medium=email (accessed on 13 May 2025).
- Cortes, G.S.; Gao, G.P.; Silva, F.B.G.; Song, Z. Unconventional monetary policy and disaster risk: Evidence from the subprime and COVID-19 crises. J. Int. Money Financ. 2022, 122, 102543. [Google Scholar] [CrossRef]
- Dedola, L.; Georgiadis, G.; Gräb, J.; Mehl, A. Does a Big Bazooka Matter? Quantitative easing policies and exchange rates. J. Monet. Econ. 2021, 117, 489–506. [Google Scholar] [CrossRef]
- Govindarajan, V.; Ilyas, H.; Silva, F.B.; Srivastava, A.; Enache, L. How Companies Can Prepare for a Long Run of High Inflation. Harv. Bus. Rev. 2022, 2. Available online: https://hbr.org/2022/05/how-companies-can-prepare-for-a-long-run-of-high-inflation (accessed on 17 May 2025).
- Sriraj, W.I.G.; Christo-pher, M.; Lena, T.; Chun, X.B. Handbook Building Energy Management in Large Shopping Malls and Medium-Sized Hotels; Wuppertal Institute: Wuppertal, Germany, 2017. [Google Scholar]
- Verbeke, S.; Waide, P.; Bettgenhäuser, K.; Bogaert, U.M. Support for Setting Up a Smart Readiness Indicator for Buildings Executive Summary of Final Report; Publications Office of the European Union: Luxembourg, 2018; p. 22. [Google Scholar]
- Van Thillo, L.; Verbeke, S.; Audenaert, A. The potential of building automation and control systems to lower the energy demand in residential buildings: A review of their performance and influencing parameters. Renew. Sustain. Energy Rev. 2022, 158, 112099. [Google Scholar] [CrossRef]
- EN 15232-1:2017; Energy Performance of Buildings—Part 1: Impact of Building Automation, Controls and Building Management—Modules M10-4,5,6,7,8,9,10. European Committee for Standardization (CEN): Brussels, Belgium, 2017.
- Bointner, R.; Toleikyte, A.; Bogdan, A.; Woods, R. Shopping Malls Features in EU-28 and Norway. Report Elaborated under the FP7 Project CommONEnergy: Re-Conceptualising Shopping Malls from Consumerism to Energy Conservation; ResearchGate: Berlin, Germany, 2014. [Google Scholar]
- Janhunen, E.; Leskinen, N.; Junnila, S. The Economic Viability of a Progressive Smart Building System with Power Storage. Sustainability 2020, 12, 5998. [Google Scholar] [CrossRef]
- Janhunen, E.; Vimpari, J.; Junnila, S. Evaluation of the financial benefits of a ground-source heat pump pool with demand side management: Is smart profitable for real estate? Sustain. Cities Soc. 2022, 78, 103604. [Google Scholar] [CrossRef]
- Bisello, A.; Antoniucci, V.; Marella, G. Measuring the price premium of energy efficiency: A two-step analysis in the Italian housing market. Energy Build. 2020, 208, 109670. [Google Scholar] [CrossRef]
- Apostolopoulos, V.; Giourka, P.; Martinopoulos, G.; Angelakoglou, K.; Kourtzanidis, K.; Nikolopoulos, N. Smart readiness indicator evaluation and cost estimation of smart retrofitting scenarios—A comparative case-study in European residential buildings. Sustain. Cities Soc. 2022, 82, 103921. [Google Scholar] [CrossRef]
- Canale, L.; De Monaco, M.; Di Pietra, B.; Puglisi, G.; Ficco, G.; Bertini, I.; Dell’isola, M. Estimating the smart readiness indicator in the italian residential building stock in different scenarios. Energies 2021, 14, 6442. [Google Scholar] [CrossRef]
- Galal, A.; Elariane, S. A Tool for Measuring the Smart Readiness of Existing Buildings and Cities in Egypt–Focusing on Energy Sector: Towards Smart Ready Checklist. HBRC J. 2022, 18, 141–155. [Google Scholar] [CrossRef]
- Plienaitis, G.; Daukšys, M.; Demetriou, E.; Ioannou, B.; Fokaides, P.A.; Seduikyte, L. Evaluation of the Smart Readiness Indicator for Educational Buildings. Buildings 2023, 13, 888. [Google Scholar] [CrossRef]
- Fokaides, P.A.; Panteli, C.; Panayidou, A. How are the smart readiness indicators expected to affect the energy performance of buildings: First evidence and perspectives. Sustainability 2020, 12, 9496. [Google Scholar] [CrossRef]
- Autio, P.; Borgentorp, E.; Pulkka, L.; Junnila, S. Smart Readiness Indicator: Ready for Business? Evidence from a Northern EU Country. Buildings 2024, 14, 3638. [Google Scholar] [CrossRef]
- Verbeke, S.; Ma, Y.; Van Tichelen, P.; Bogaert, S.; Oñate, V.G.; Waide, P.; Bettgenhäuser, K.; Ashok, J.; Hermelink, A.; Offermann, M.; et al. Support for Setting up a Smart Readiness Indicator for Buildings and Related Impact Assessment Second Progress Report; Publications Office of the European Union: Luxembourg, 2018; pp. 1–288. [Google Scholar]
- Ye, Y.; Ramallo-González, A.P.; Tomat, V.; Valverde, J.S.; Skarmeta-Gómez, A. SmartWatcher©: A Solution to Automatically Assess the Smartness of Buildings. Computers 2023, 12, 76. [Google Scholar] [CrossRef]
- Verbeke, S.; Aerts, D.; Reynders, G.; Ma, Y.; Waide, P. Final Report on the Technical Support to the Development of a Smart Readiness Indicator for Buildings; Publications Office of the European Union: Luxembourg, 2020; ISBN 9789276191971. [Google Scholar]
- European Commission. Eurostat, Electricity Price Statistics. 2025. Available online: https://ec.europa.eu/eurostat/en/ (accessed on 17 May 2025).
- Bao, K.; Valev, H.; Wagner, M.; Schmeck, H. A threat analysis of the vehicle-to-grid charging protocol ISO. Comput. Sci.-Res. Dev. 2018, 33, 3–12. [Google Scholar] [CrossRef]
- Tirunagari, S.; Gu, M.; Meegahapola, L. Reaping the Benefits of Smart Electric Vehicle Charging and Vehicle-to-Grid Technologies: Regulatory, Policy and Technical Aspects. IEEE Access 2022, 10, 114657–114672. [Google Scholar] [CrossRef]
- Guerrero, M.; Sánchez, J.; Álvarez, S.; Tenorio, J.A.; Cabeza, L.F.; Bartolomé, C.; Pavón, M. Evaluation of the behavior of an innovative thermally activated building system (TABS) with PCM for an efficient design. E3S Web Conf. 2019, 111, 03043. [Google Scholar] [CrossRef]
- Burre, J.; Bongartz, D.; Brée, L.; Roh, K.; Mitsos, A. Power-to-X: Between Electricity Storage, e-Production, and Demand Side Management. Chemie-Ingenieur-Technik 2020, 92, 74–84. [Google Scholar] [CrossRef]
- Ministry of Infrastructure. NEPN—Comprehensive National Energy and Climate Plan of the Republic of Slovenia. Mzi 2020, 5, 233. [Google Scholar]
- ISO 15118; Road Vehicles—Vehicle to Grid Communication Interface. International Organization for Standardization (ISO): Geneva, Switzerland, 2022. Available online: https://www.iso.org/standard/77845.html (accessed on 17 May 2025).
- Eurostat, Prices of Electricity in 2024. Available online: https://ec.europa.eu/eurostat/statistics-explained/index.php?title=Electricity_price_statistics (accessed on 18 May 2025).
- Canale, L.; Bongiorno, S.; De Monaco, M.; Pietra, B.D.; Notte, L.L.; Badan, N.; Ficco, G.; Puglisi, G.; Dell’Isola, M. Preliminary results of the deployment of the Smart Readiness Indicator in Italy. J. Phys. Conf. Ser. 2024, 2893, 012042. [Google Scholar] [CrossRef]
- Lončar, A. Every Fourth Application for the Connection of a Solar Power Plant is Rejected. Forbes Slovenia. 2024. Available online: https://forbes.n1info.si/zeleni-prehod/vsaka-cetrta-vloga-za-priklop-soncne-elektrarne-zavrnjena/ (accessed on 23 March 2025).
- Ma, A. An Investment of €5.15 Billion Will Be Needed in the Transmission and Distribution Power Grid by 2034. RTV SLO. 2025. Available online: https://www.rtvslo.si/gospodarstvo/za-zeleni-prehod-bo-potrebnih-pet-milijard-evrov-vlaganj-v-elektroenergetsko-omrezje-v-10-letih/743794 (accessed on 17 May 2025).
- Zamanidou, A.; Carnero Melero, P.; Martinez Garcia, L.; Novakova, A.; Vladimir Litiu, A.; Olschewski, D.; Tzanev, D.; Fokaides, P.A. Enhancing smart readiness of buildings: Bridging the knowledge gap to European citizens. Int. J. Sustain. Energy 2024, 43, 2385632. [Google Scholar] [CrossRef]
- EU Commission. Decisions (EU) 2022/2481 of the European Parliament and of the Council of 14 December 2022 establishing the Digital Decade Policy Programme 2030. Off. J. Eur. Union 2022, 2022, 4–26. [Google Scholar]
- Executive Report on the Performance of BUILD UP and Options for the Way Forward. Assessment of BUILD UP Platform Executive Report; European Commission: Brussels, Belgium, 2020.
- IEA. Empowering End-Users for Flexibility: Insights from the IEA’s Digital Demand-Driven Electricity Networks (3DEN) Initiative; International Energy Agency: Paris, France, 2024; p. 96.
- European Commission. Strategy for Greening Education and Research Infrastructure in Slovenia. 2023. Available online: https://commission.europa.eu/projects/strategy-greening-education-and-research-infrastructure-slovenia_en?utm_source=chatgpt.com (accessed on 17 May 2025).
- European Commission. A Renovation Wave for Europe—Greening our Buildings, Creating Jobs, Improving Lives; European Commission: Brussels, Belgium, 2020; pp. 1–28.
- European Commission. European Green Deal Investment Plan; European Commission: Brussels, Belgium, 2019; Volume 35, pp. 44–67.
- European Commission. Digitalising the energy system - EU action plan. Off. J. Eur. Union 2022, 33, 1–12. [Google Scholar]
- European Commission. European Innovation Scoreboard 2024: Slovenia—Country Profile; European Commission: Brussels, Belgium, 2024; p. 2.
- Andrijauskiene, M.; Ioannidis, D.; Dumciuviene, D.; Dimara, A.; Bezas, N.; Papaioannou, A.; Krinidis, S. European Union Innovation Efficiency Assessment Based on Data Envelopment Analysis. Economies 2023, 11, 163. [Google Scholar] [CrossRef]
- Kalapouti, K.; Petridis, K.; Malesios, C.; Dey, P.K. Measuring efficiency of innovation using combined Data Envelopment Analysis and Structural Equation Modeling: Empirical study in EU regions. Ann. Oper. Res. 2020, 294, 297–320. [Google Scholar] [CrossRef]


| Component | Energy Prices (EUR/kWh) | Maintenance Cost (%/Year) | Lifespan (Years) | Legislation Framework |
|---|---|---|---|---|
| Electricity (general) | 0.21 | N/A | N/A | N/A |
| District heating | 0.08 | N/A | N/A | N/A |
| BMS | N/A | 1.5% | 15 | Hardware and software lifecycle assessments |
| PV system | N/A | 1% | 25 | EU Renewable Energy Directive (2018/2001) |
| HVAC systems | N/A | 2% | 20 | Manufacturers’ guidelines |
| EV charging infrastructure | N/A | 1.2% | 10 | Manufacturers’ warranties and field data from similar installations in the EU |
| Scenario A | Scenario B | Scenario C |
|---|---|---|
| Baseline scenario (before interventions) | After interventions (new AHUs, new PV plant, upgrade of BMS, etc.) | Examination of needed interventions to reach the maximum obtainable scores according to the SRI methodology |
| Category | Description |
|---|---|
| Building type | Shopping center |
| Total area/area for shops | 156,000 m2/40,000 m2 |
| Year of construction | 2000 |
| Number of shops Number of parking spots | 120 2600 |
| Heating | District heating |
| Domestic hot water heating | No central hot water heating |
| Ventilation system | 21 air handling units after the upgrade. The devices have CO2 detection where necessary, recuperation (plate heat recovery or a recovery wheel) |
| Cooling | Central cooling, 5 chillers |
| Dynamic building envelope | Not available |
| Electricity production | Yes, after the upgrade, a photovoltaic power plant with 842 kW of power. Yearly production is planned for around 978 MWh. |
| Charging for electric vehicles | Yes, 5 chargers before the upgrade; after the upgrade, 15 chargers connected to an online portal (gremonaelektriko.si) |
| Central management | Yes, a building management system (BMS) with an energy monitoring system (EMS) |
| Domain Scores | Heating | DHW | Cooling | Ventilation | Lighting | Dynamic Building Envelope | Electricity | Electric Vehicle Charging | Monitoring and Control |
| 41.8% | 0.0% | 39.7% | 31.4% | 29.3% | 0.0% | 14.7% | −27.8% | 21.1% | |
| Impact factor scores | Energy efficiency | Energy flexibility and storage | Comfort | Convenience | Health, well-being, and accessibility | Maintenance and prediction | Information for occupants | ||
| 54.3% | 1.7% | 55.4% | 34.2% | 35.9% | 33.1% | 28.6% | |||
| Domain Scores | Heating | DHW | Cooling | Ventilation | Lighting | Dynamic Building envelope | Electricity | Electric Vehicle Charging | Monitoring and Control |
| 64.6% | 0.0% | 66.7% | 72.4% | 64.0% | 0.0% | 66.0% | 63.9% | 50.4% | |
| Impact factor scores | Energy efficiency | Energy flexibility and storage | Comfort | Convenience | Health, well-being, and accessibility | Maintenance and prediction | Information for occupants | ||
| 84.0% | 31.9% | 88.5% | 68.4% | 77.2% | 63.0% | 75.5% | |||
| Scenario A | Scenario B | Scenario C | |
|---|---|---|---|
| Domains | |||
| Heating | 41.8% | 41.8% | 64.6% |
| Domestic hot water | 0% | 0% | 0% |
| Cooling | 39.7% | 39.7% | 66.7% |
| Ventilation | 31.4% | 62.9% | 72.4% |
| Lighting | 29.3% | 29.3% | 64.0% |
| Dynamic building envelope | 0% | 0% | 0% |
| Electricity | 14.7% | 24.2% | 66.0% |
| EV charging | −27.8% | 8.3% | 63.9% |
| Monitoring and control | 21.1% | 35.9% | 50.4% |
| Impact factors | |||
| Energy efficiency | 54.3% | 59.7% | 84.0% |
| Energy flexibility and storage | 1.7% | 2.6% | 31.9% |
| Comfort | 55.4% | 64.7% | 88.8% |
| Convenience | 34.2% | 45.6% | 68.4% |
| Health | 35.9% | 58.7% | 77.2% |
| Maintenance | 33.1 | 51.4 | 63.0 |
| Information for occupants | 28.6 | 54.4 | 75.5 |
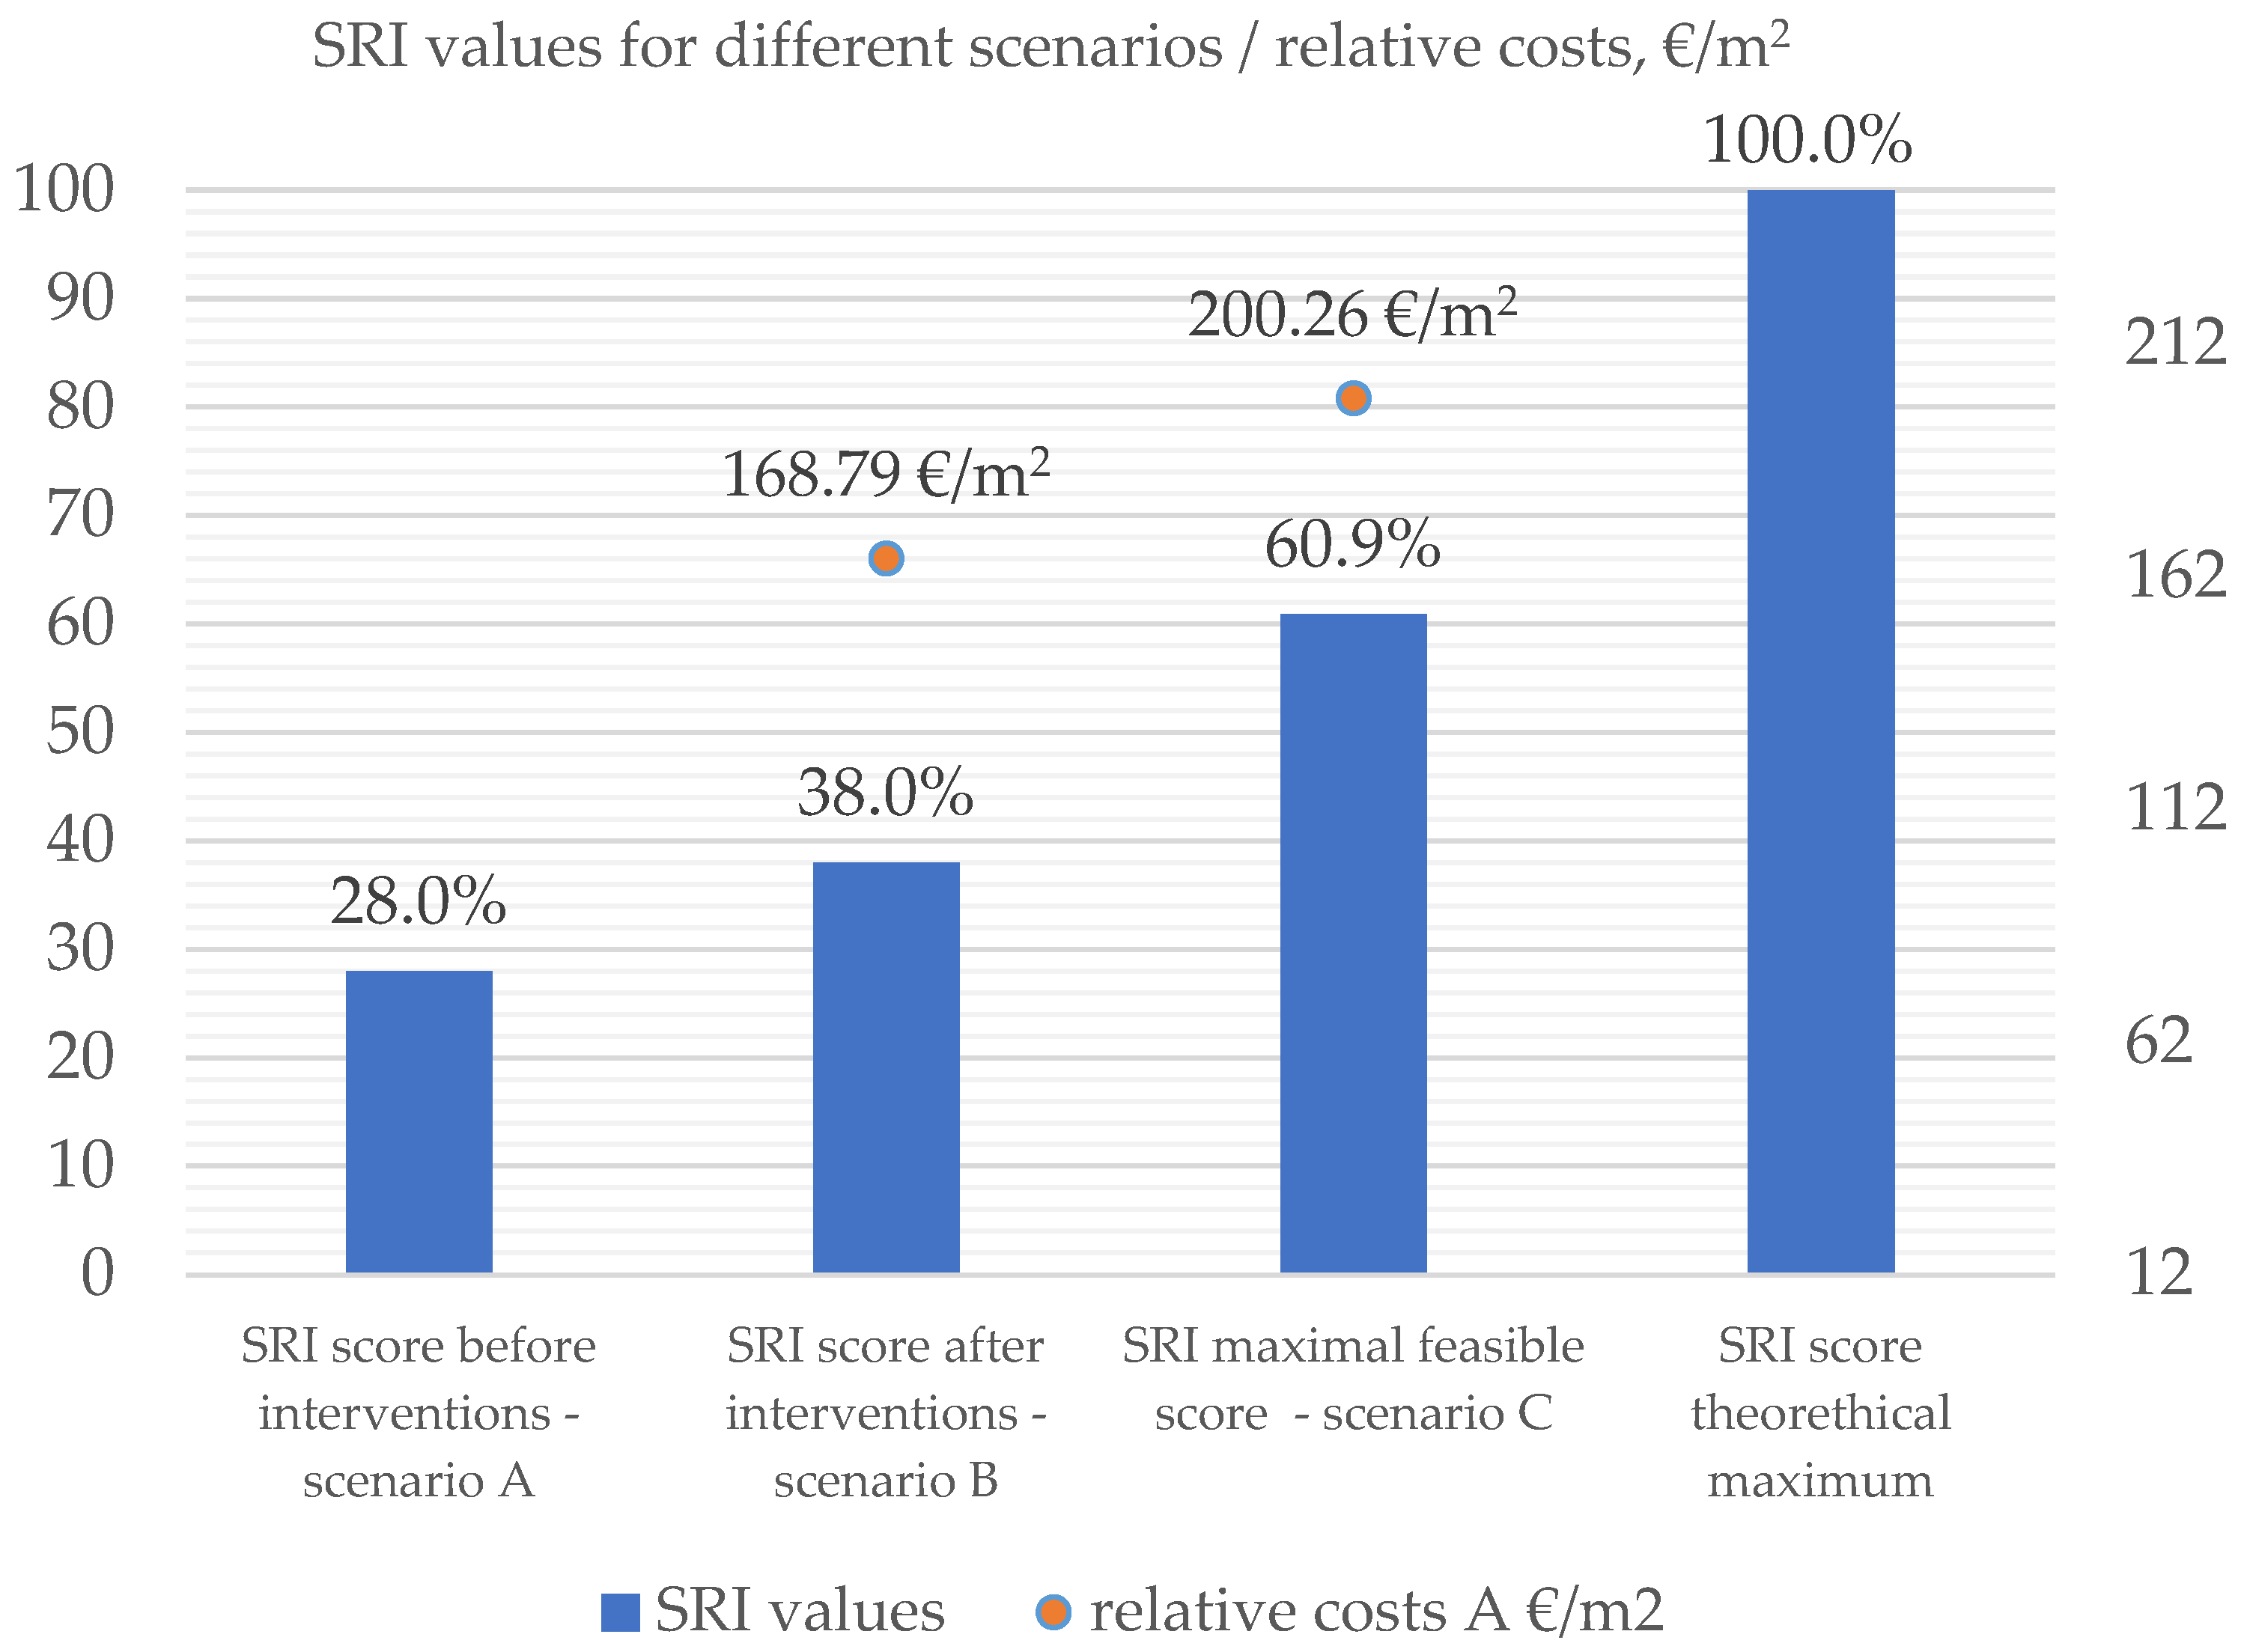
| Total SRI score | 28.0 | 38.0 | 60.9 |
| Scenario A | Scenario B | Scenario C |
|---|---|---|
| Total SRI score: 28.0% | Total SRI score: 38.0% | Maximum feasible SRI score: 60.9% |
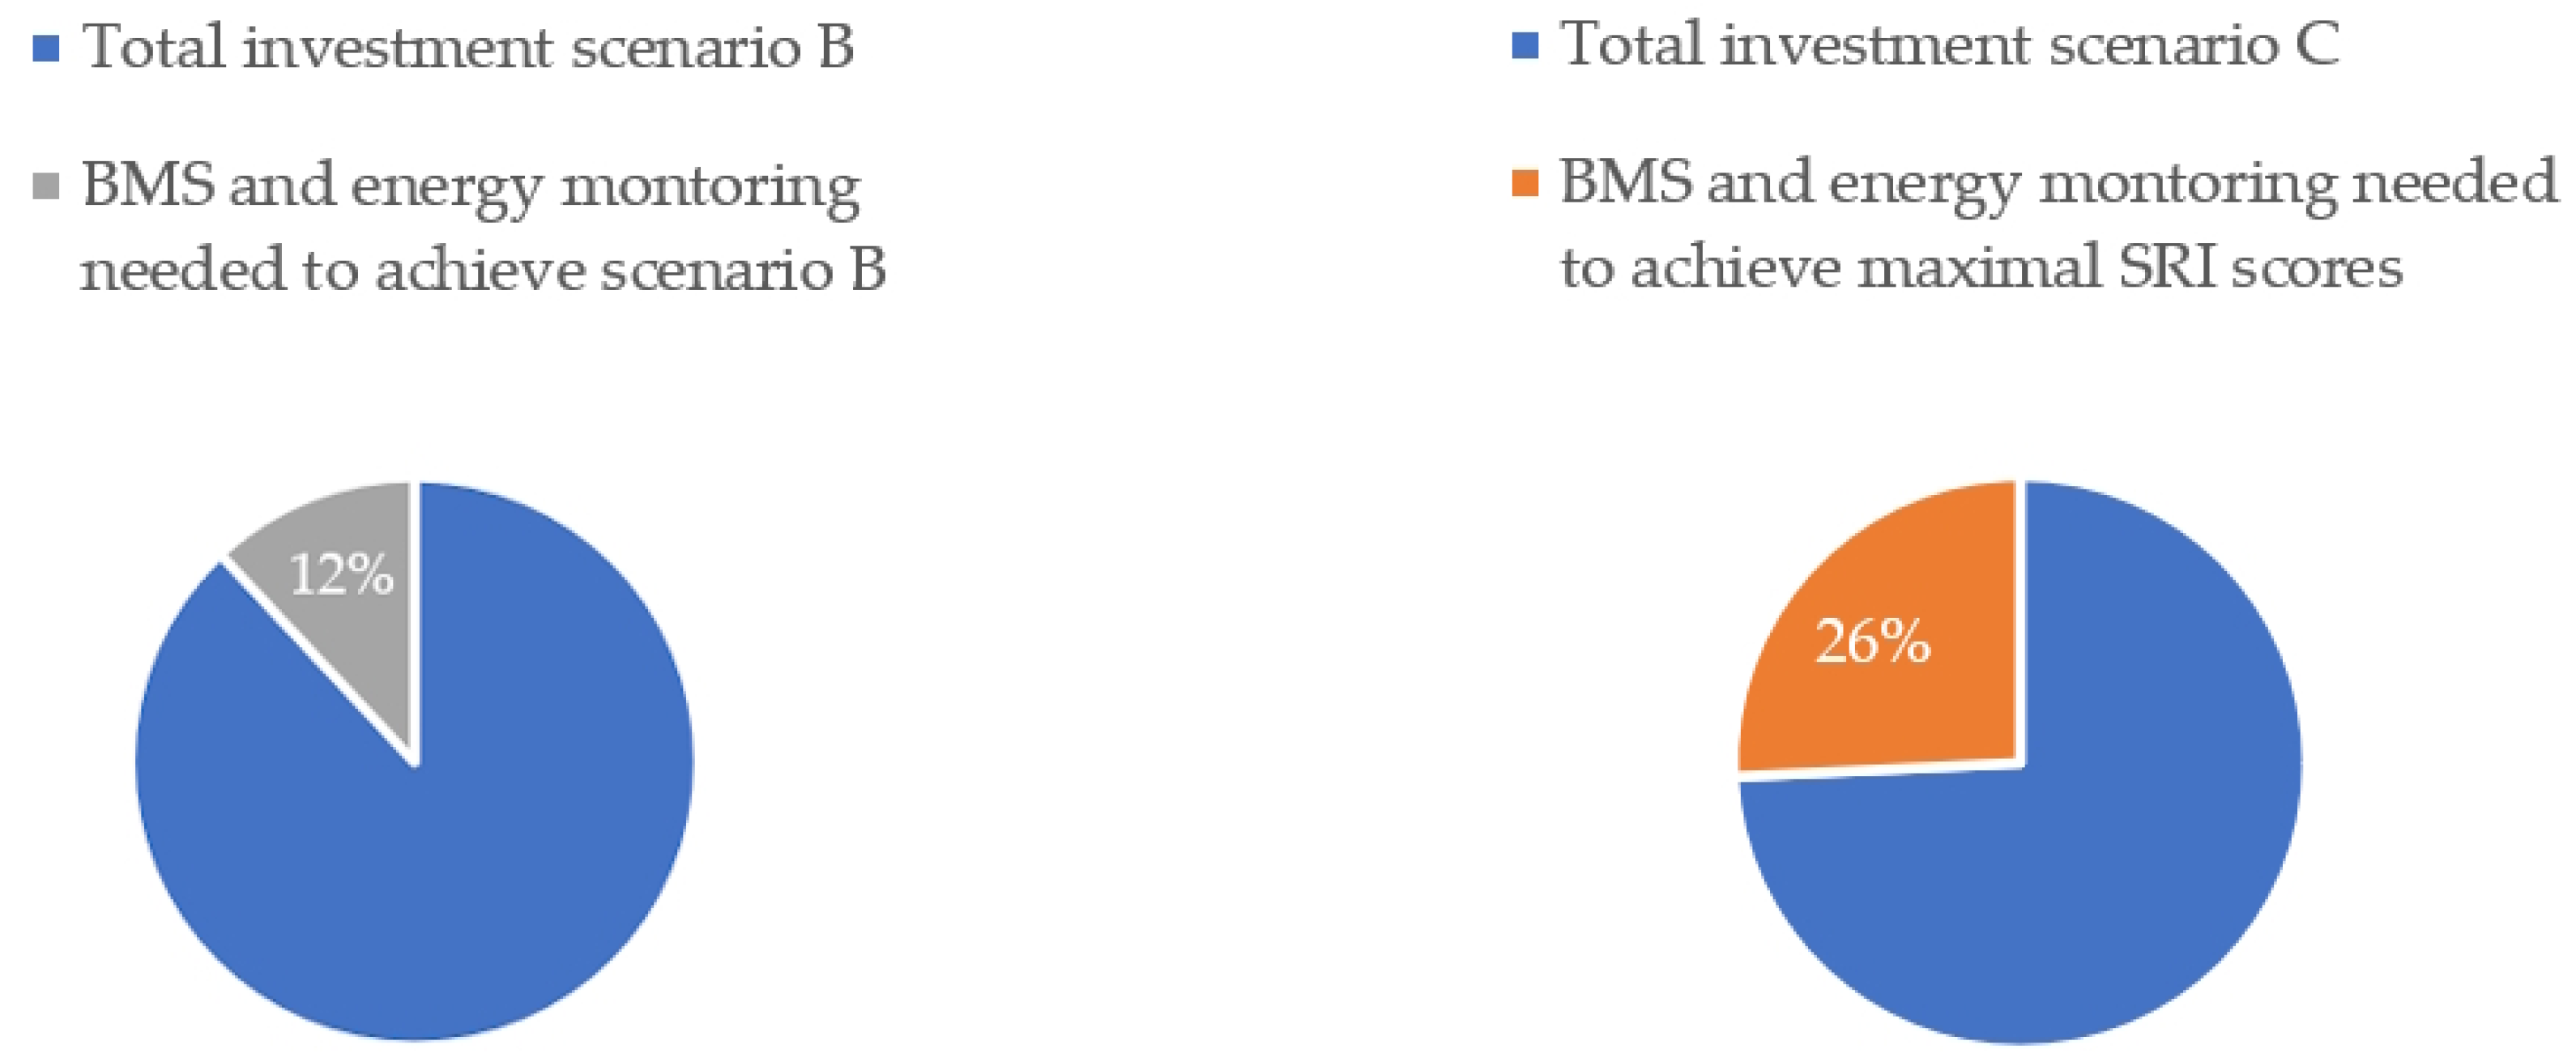
| Baseline scenario | An investment of 6.6 million EUR was needed to reach Scenario B. Amount of the subsidy—168,428 EUR for the PV plant from the Republic of Slovenia and the European Union from the Cohesion Fund | Additional 1.38 million EUR would be needed to reach Scenario C |
| N/A | The ratio between the investment and the usable area of 40,000 m2: 165.79 €/m2 | The ratio between the investment and the usable area of 40,000 m2: 200.26 €/m2 |
| Input Data | ||
|---|---|---|
| Shopping area | 40,000 | m2 |
| Average electricity consumption (B) | 150 | kWh/m2 |
| Baseline heating consumption of the center (district heating) | 1,500,000 | kWh/year |
| Electricity cost per kWh | 0.21 | €/kWh (Eurostat, for year 2024, including taxes and all fees) [44] |
| Electricity feed-in tariff | 0.29 | €/kWh (Eurostat, for year 2024, including taxes and all fees) [44] |
| District heating costs per kWh (E) | 0.8 | €/kWh (Eurostat, for year 2024, including taxes and all fees) [44] |
| Power of the PV plant | 842 | kW |
| Specific yield for the location in Slovenia (Y) | 1150 | kWh/kWp/year |
| Without Subsidies | IRR | ROI | Payback Period |
| 6% | 7% | 14.2 years | |
| With subsidies | |||
| 7% | 8% | 12.3 years |
| Without Subsidies | IRR | ROI | Payback Period |
| 5% | 7% | 15.2 years | |
| With subsidies | |||
| 6% | 8% | 13.2 years |
| Without subsidies | IRR | ROI | Payback period |
| 5% | 6% | 17.6 years | |
| With subsidies | |||
| 5% | 6% | 15.6 years |
| Without subsidies | IRR | ROI | Payback period |
| 5% | 6% | 16 years | |
| With subsidies | |||
| 6% | 7% | 13.6 years |
| Without subsidies | IRR | ROI | Payback period |
| 5% | 7% | 15 years | |
| With subsidies | |||
| 7% | 8% | 12.7 years |
| Without subsidies | IRR | ROI | Payback period |
| 3% | 5% | 19.7 years | |
| With subsidies | |||
| 4% | 6% | 16.7 years |
| Aspect | Maximum Obtainable SRI Score | Maximum Feasible SRI Score |
|---|---|---|
| Definition | Theoretical upper limit achievable with full deployment of all the advanced functions | The highest SRI performance realistically attainable under the current constraints |
| Context sensitivity | Generic and idealized; assumes perfect technical conditions | Context-sensitive; reflects the local infrastructure, policy, and financial limits |
| Assumptions | Assumes full availability of predictive control, DSM, and grid interaction | Assumes current market maturity and partial deployment of smart systems |
| Technical preconditions | Full automation and integration with smart grids | Limited to available smart automation and DSM readiness |
| Infrastructure requirements | Assumes that the infrastructure is fully modernized and interoperable | Based on the observed grid and building system capabilities |
| Financial viability | Does not account for cost or market constraints | Must be financially viable within the current investment climate |
| Purpose in the study | Represents the methodological ceiling as defined in the SRI framework | Used as a diagnostic tool to prioritize realistic, high-impact upgrades |
| Supporting literature | Verbeke et al. (2020) [36] | Canale et al. (2024) [45] |
Disclaimer/Publisher’s Note: The statements, opinions and data contained in all publications are solely those of the individual author(s) and contributor(s) and not of MDPI and/or the editor(s). MDPI and/or the editor(s) disclaim responsibility for any injury to people or property resulting from any ideas, methods, instructions or products referred to in the content. |
© 2025 by the authors. Licensee MDPI, Basel, Switzerland. This article is an open access article distributed under the terms and conditions of the Creative Commons Attribution (CC BY) license (https://creativecommons.org/licenses/by/4.0/).
Share and Cite
Beras, M.; Stępień, K.; Kovačič, M.; Župerl, U. Achieving Maximum Smart Readiness Indicator Scores: A Financial Analysis with an In-Depth Feasibility Study in Non-Ideal Market Conditions. Buildings 2025, 15, 1839. https://doi.org/10.3390/buildings15111839
Beras M, Stępień K, Kovačič M, Župerl U. Achieving Maximum Smart Readiness Indicator Scores: A Financial Analysis with an In-Depth Feasibility Study in Non-Ideal Market Conditions. Buildings. 2025; 15(11):1839. https://doi.org/10.3390/buildings15111839
Chicago/Turabian StyleBeras, Mitja, Krzysztof Stępień, Miha Kovačič, and Uroš Župerl. 2025. "Achieving Maximum Smart Readiness Indicator Scores: A Financial Analysis with an In-Depth Feasibility Study in Non-Ideal Market Conditions" Buildings 15, no. 11: 1839. https://doi.org/10.3390/buildings15111839
APA StyleBeras, M., Stępień, K., Kovačič, M., & Župerl, U. (2025). Achieving Maximum Smart Readiness Indicator Scores: A Financial Analysis with an In-Depth Feasibility Study in Non-Ideal Market Conditions. Buildings, 15(11), 1839. https://doi.org/10.3390/buildings15111839