Article

Performance Evaluation of Education Infrastructure Public–Private Partnership Projects in the Operation Stage Based on Limited Cloud Model and Combination Weighting Method

School of Management Engineering, Shandong Jianzhu University, Jinan 250101, China
*
Author to whom correspondence should be addressed.
Buildings 2025, 15(11), 1833; https://doi.org/10.3390/buildings15111833
Submission received: 25 April 2025 / Revised: 16 May 2025 / Accepted: 19 May 2025 / Published: 27 May 2025
(This article belongs to the Section Construction Management, and Computers & Digitization)

Abstract

Due to inappropriate operational strategies, the operational outcomes of education PPP projects often fail to meet expected goals, posing challenges to the sustainable operation of these projects. Through an operational performance evaluation, deviations between operational outcomes and intended goals and the underlying causes of these deviations can be identified, thereby supporting the adjustment of operational strategies. Therefore, this study proposed a performance evaluation model based on the Limited Cloud Model for education PPP projects. Firstly, this study refined the evaluation dimensions of the Balanced Scorecard based on the stakeholder needs and the Asset-Classified Operation characteristics of education PPPs, and an indicators system for the operational stage was developed. Secondly, a performance evaluation model was constructed using the COWA-Critic-Game Theory weighting method and the Finite Cloud Model. Finally, the performance evaluation model was applied to a newly operated university PPP project in Yantai, China, to conduct a case study. The evaluation results demonstrated the practicality and superiority of the proposed model in addressing the complex performance management challenges of education PPPs. This model assisted Special Purpose Vehicles (SPVs) in identifying issues within operational strategies and making necessary adjustments.

1. Introduction

The Public–Private Partnership (PPP) model plays a significant role in infrastructure development and the provision of public services, as government departments collaborate with private sector entities to achieve long-term shared goals [1]. Applying the PPP model to educational infrastructure projects effectively alleviates the government’s funding shortfalls for infrastructure, facilitates risk transfer [2], and provides high-efficiency and high-quality educational support services during the operation stage [3].
Reasonable preliminary planning and efficient construction management are the foundation for the success of PPP projects, while effective operational management is the crucial factor determining their ultimate success [4]. However, case studies [5,6,7] show that many education PPP operations have failed to meet expected targets due to inappropriate operational strategies, resulting in issues such as poor facility maintenance quality and low user satisfaction, which threaten the sustainability of project operations. This issue highlights the urgent need for effective operation performance evaluation methods to enhance operational management. Operation performance evaluation, as a method for assessing the effectiveness of operational work, can identify the deviations between actual outcomes and intended goals and uncover the underlying causes of those deviations [8]. In practice, a well-designed performance evaluation enables timely identification of issues during operations and provides systematic feedback to operators, guiding the improvement and optimization of subsequent operational strategies. However, performance evaluation for education PPP projects during the operation stage has several limitations: (1) In the context of PPP, SPV in education projects must meet multiple stakeholders’ performance goals during the operational stage [9]. Existing performance evaluation indicator systems primarily focus on facility maintenance conditions and the project’s financial status, while lacking a multi-stakeholder perspective in assessing project performance. As a result, SPVs cannot promptly adjust their operational strategies in response to stakeholder needs. (2) Due to the “asset classification operation” characteristic, education PPP projects’ infrastructure is categorized into core and non-core assets based on the nature of the services. The educational institution manages core assets (e.g., classrooms and laboratories), with the SPV providing property management services for a fee. The SPV operates non-core assets (e.g., cafeterias, dormitories) for revenue. In addition to maintenance tasks, the SPV needs to implement differentiated operational strategies based on asset characteristics. However, existing evaluation models for PPP projects are unable to effectively process the complex data generated by these operational activities, resulting in a discrepancy between the evaluation outcomes and the actual operational performance of education PPPs, thereby limiting their ability to support operational decision-making effectively.
To address these gaps, this study aims to develop an operational performance evaluation model for education PPP projects from a multi-stakeholder perspective, considering the characteristics of asset classification operations. This model will assist SPVs in identifying and meeting various stakeholder needs, solving operational management problems, and improving project performance. The main contributions are as follows: (1) From a multi-stakeholder perspective, and in light of the asset-classified operation characteristic of education PPP projects, this study refined the evaluation dimensions of the basic BSC framework. Based on existing literature, a performance evaluation indicator system for the operational stage was developed within the refined BSC framework. This improvement helps the SPV understand the diverse needs of various stakeholders, implement differentiated operational strategies, and enrich the performance evaluation dimensions in existing research. (2) This study introduced a novel methodological integration: a hybrid weighting mechanism combining COWA, CRITIC, and Game Theory to reconcile subjective and objective indicators’ weights, followed by applying a Limited Cloud Model to handle qualitative and quantitative data. This approach enhanced the accuracy and robustness of the evaluation results compared to existing evaluation methods. (3) A case study used the constructed performance evaluation model. The model’s effectiveness was verified based on the evaluation results, and the issues in the SPV’s current operational strategies were analyzed. (4) Based on the evaluation results, utilizing comprehensive discussions, and taking into account the new operational environment following the COVID-19 pandemic, four management insights were proposed for operators of education PPP projects. In conclusion, this study theoretically addresses the limitations of existing performance research in integrating multi-stakeholder perspectives and modeling the characteristics of asset-classified operations. Practically, it provides tool-based support for improving operational strategies, contributing to the sustainable operation and development of education PPPs—an area of growing significance globally, especially in the wake of increasing reliance on blended public–private mechanisms in social infrastructure delivery [3].
The remainder of this study is structured as follows: Section 2 includes a literature review of relevant research findings. Section 3 constructs a performance evaluation system for the operation stage of Education PPP projects and introduces the combination weighting method and the Limited Cloud Model. Section 4 presents a case study based on the PPP project at the Yantai Campus of Shandong Jianzhu University in China to validate the evaluation model. Section 5 and Section 6 include the discussion and conclusion of the study.

2. Literature Review

2.1. Application of the PPP Model in Educational Infrastructure Projects

Based on existing research and practice, the PPP model has been recognized as a practical approach to addressing education infrastructure needs. Stafford A. [10], Fabre Anais et al. [3] and Kusumasari B. et al. [11] argued that applying the PPP model to educational infrastructure projects helps alleviate fiscal pressure, distribute project risks, and improve education quality. Rana Khallaf et al. [1] analyzed data from 45 PPP projects at higher education institutions in the United States, concluding that the PPP model has become an attractive project delivery method for these institutions. Overall, the research of these scholars supports the feasibility of applying the PPP model to educational infrastructure projects.
Implementing education PPP projects has shown that private sectors can engage in projects focusing on hard infrastructure, such as sports fields and libraries. Examples include universities in Virginia and Ohio State University in the USA [1] and the PPP primary school program in Punjab, Pakistan [12]. PPP models can also be applied to soft infrastructure, such as logistics services, research collaboration, and educational training. For example, the H-JUMP School program in South Korea, funded by Hyundai and in partnership with local education departments, provides education to low-income children at local learning centers [13]. For new or renovated education infrastructure projects, collaboration between the public and private sectors can address both hard and soft infrastructure needs, with the private sector operating the facilities during the concession period. Research and practice have demonstrated that the PPP model can be applied to educational infrastructure projects. However, there is a lack of studies focusing on the operational stage after project completion, particularly on the characteristics of asset categorization during operations.

2.2. Performance Evaluation Indicator System for PPP Projects

Performance indicators provide a quantitative basis for setting, executing, monitoring, and evaluating project goals, facilitating the smooth implementation of projects in line with predetermined objectives. Researchers have developed mature performance indicator frameworks for project operators to establish a comprehensive performance evaluation indicator system.
The Value-for-Money theory, one of the earliest performance management theories introduced in the PPP field, posits that PPP projects should pursue three core objectives: economy, efficiency, and effectiveness [14]. This theory is widely applied in the performance management of PPP projects [15,16]. However, VFM primarily focuses on the decision-making aspect of PPP project feasibility analysis, lacking evaluation from an operational perspective. To address these issues, scholars have introduced multi-dimensional models such as the Performance Prism and the Balanced Scorecard (BSC) into the performance evaluation of PPP projects, aiming to cover the operational and management aspects of PPP comprehensively. The BSC theory was originally a tool for internal performance management within companies. It encompasses four key aspects: financial, internal business processes, customer, and learning and growth [17]. The theory systematically covers various dimensions of performance evaluation and is widely applied in project and strategic performance assessments in construction companies [18,19]. However, researchers have found certain limitations when applying the BSC in practice. Some BSC indicators are relatively broad; for instance, the “customer” dimension does not suit the evaluation of projects involving multiple stakeholders. To address this, scholars have adapted the basic BSC framework to better align with the specific characteristics of PPP projects in various fields. For example, Juan Du et al. [20] modified the “customer” dimension to reflect the satisfaction of transportation PPP project stakeholders, including investors, government agencies, and the public. They replaced the “learning and growth” dimension with project sustainability. This adaptation helped establish a performance evaluation system tailored for the operation of transportation PPP projects.
However, due to the differences in operational tasks among various types of PPP projects—for instance, education projects involve the management of cafeterias and dormitories, while transportation projects focus on road maintenance and traffic volume management—the same BSC framework is difficult to apply across different project types. Therefore, it is necessary to design a suitable BSC framework based on the operational characteristics of education PPPs, considering their asset-classified operations, to ensure that the performance evaluation results accurately reflect the actual state of project operations.

2.3. Performance Evaluation Models for PPP Projects

After establishing a performance evaluation system, it is crucial to employ suitable methods to assess project operations comprehensively. Existing evaluation methods are mainly categorized into three main types: exact evaluation, fuzzy evaluation and exact-fuzzy combination.
Early evaluations of projects often employed precise methods such as Key Performance Indicators (KPI) [21], statistical analysis [22], and the Analytic Hierarchy Process (AHP) [23], which ensured objectivity and repeatability. However, these methods proved time-consuming and struggled with unquantifiable factors in complex, multi-dimensional evaluation works. To address these limitations, fuzzy theory (e.g., the fuzzy comprehensive evaluation method) was introduced. This approach quantifies qualitative factors through expert scoring and simplifies assessments using membership functions, proving effective in applications such as risk assessment [24] and project plan selection [25]. However, this fuzzy evaluation method relies entirely on expert subjective scoring, which can lead to evaluation results that significantly diverge from the actual project conditions due to the strong influence of subjectivity in practical applications.
To address the limitations of the above two types of methods, evaluation approaches that integrate both precision and fuzziness—represented by the Cloud Model [26] and the matter-element method [27]—have emerged. These methods are capable of handling complex qualitative and quantitative data to provide a comprehensive evaluation of the overall project. Among them, the Cloud Model has become a widely adopted evaluation approach. In the comprehensive evaluation process of PPP projects, the Cloud Model enables the bidirectional transformation between qualitative concepts (e.g., “satisfactory”, “moderate”) and quantitative data through a triplet consisting of Expectation (Ex), Entropy (En), and Hyper Entropy (He). This quantifies fuzzy linguistic descriptions, while the resulting quantitative outputs retain interpretable linguistic meanings [26]. Through its “cloud drop” generation mechanism, the Cloud Model can reveal the typicality and distribution pattern of a specific evaluation grade, effectively mitigating extreme bias caused by subjective judgment and thereby enhancing the stability and reliability of the evaluation system [28]. For example, Jiao H. et al. [28] combined the Cloud Model with the OWA (Ordered Weighted Averaging) operator in a performance evaluation study on the operation of water environment governance PPP projects. This approach effectively handled complex operational data such as water quality monitoring data, facility performance evaluations, and user satisfaction assessments. Similarly, Zhang Y. et al. [29] applied an AHP method improved by Pythagorean Fuzzy Sets (PFS) to determine the weights of risk indicators in water environment governance PPP projects. Based on this, they used a Limited Cloud Model to evaluate the project’s risk status, effectively addressing the fuzziness and randomness of the indicator sets and linguistic evaluation sets in traditional risk assessment.
However, there are still two limitations in the application of the Cloud Model: First, since different evaluation indicators have varying degrees of influence on the overall project, it is necessary to assign weights to each indicator when conducting a comprehensive evaluation using the Cloud Model. However, a single weighting method often fails to accurately reflect the actual impact of each indicator on the project. Second, because the standard Cloud Model transforms uncertain information using a Gaussian distribution [30]. When indicator values fall within the intervals (−∞, Ymin) or (Ymax, +∞), the standard Cloud Model may produce evaluation results that do not accurately reflect the indicator’s actual performance in project operations.

3. Methods and Materials

The methodological framework of this study is divided into three parts, as shown in Figure 1. First, taking the SPV as the evaluation subject, adopting BSC as the basic framework of the performance evaluation system, and initially identifying the operational performance indicators through the literature review. Then, the Relative Importance Index (RII) method is used to screen the indicators and achieve the final performance evaluation system. Second, using the COWA method for subjective weighting, while objective weighting is conducted using the Critic method, based on the actual data of various indicators during project operation. Game theory is introduced to combine subjective and objective weights, yielding composite weights for each level of indicators. Finally, a Limited Cloud Model calculates the cloud parameters for quantitative and qualitative indicators, and the overall project performance score is obtained through the comprehensive cloud calculation.

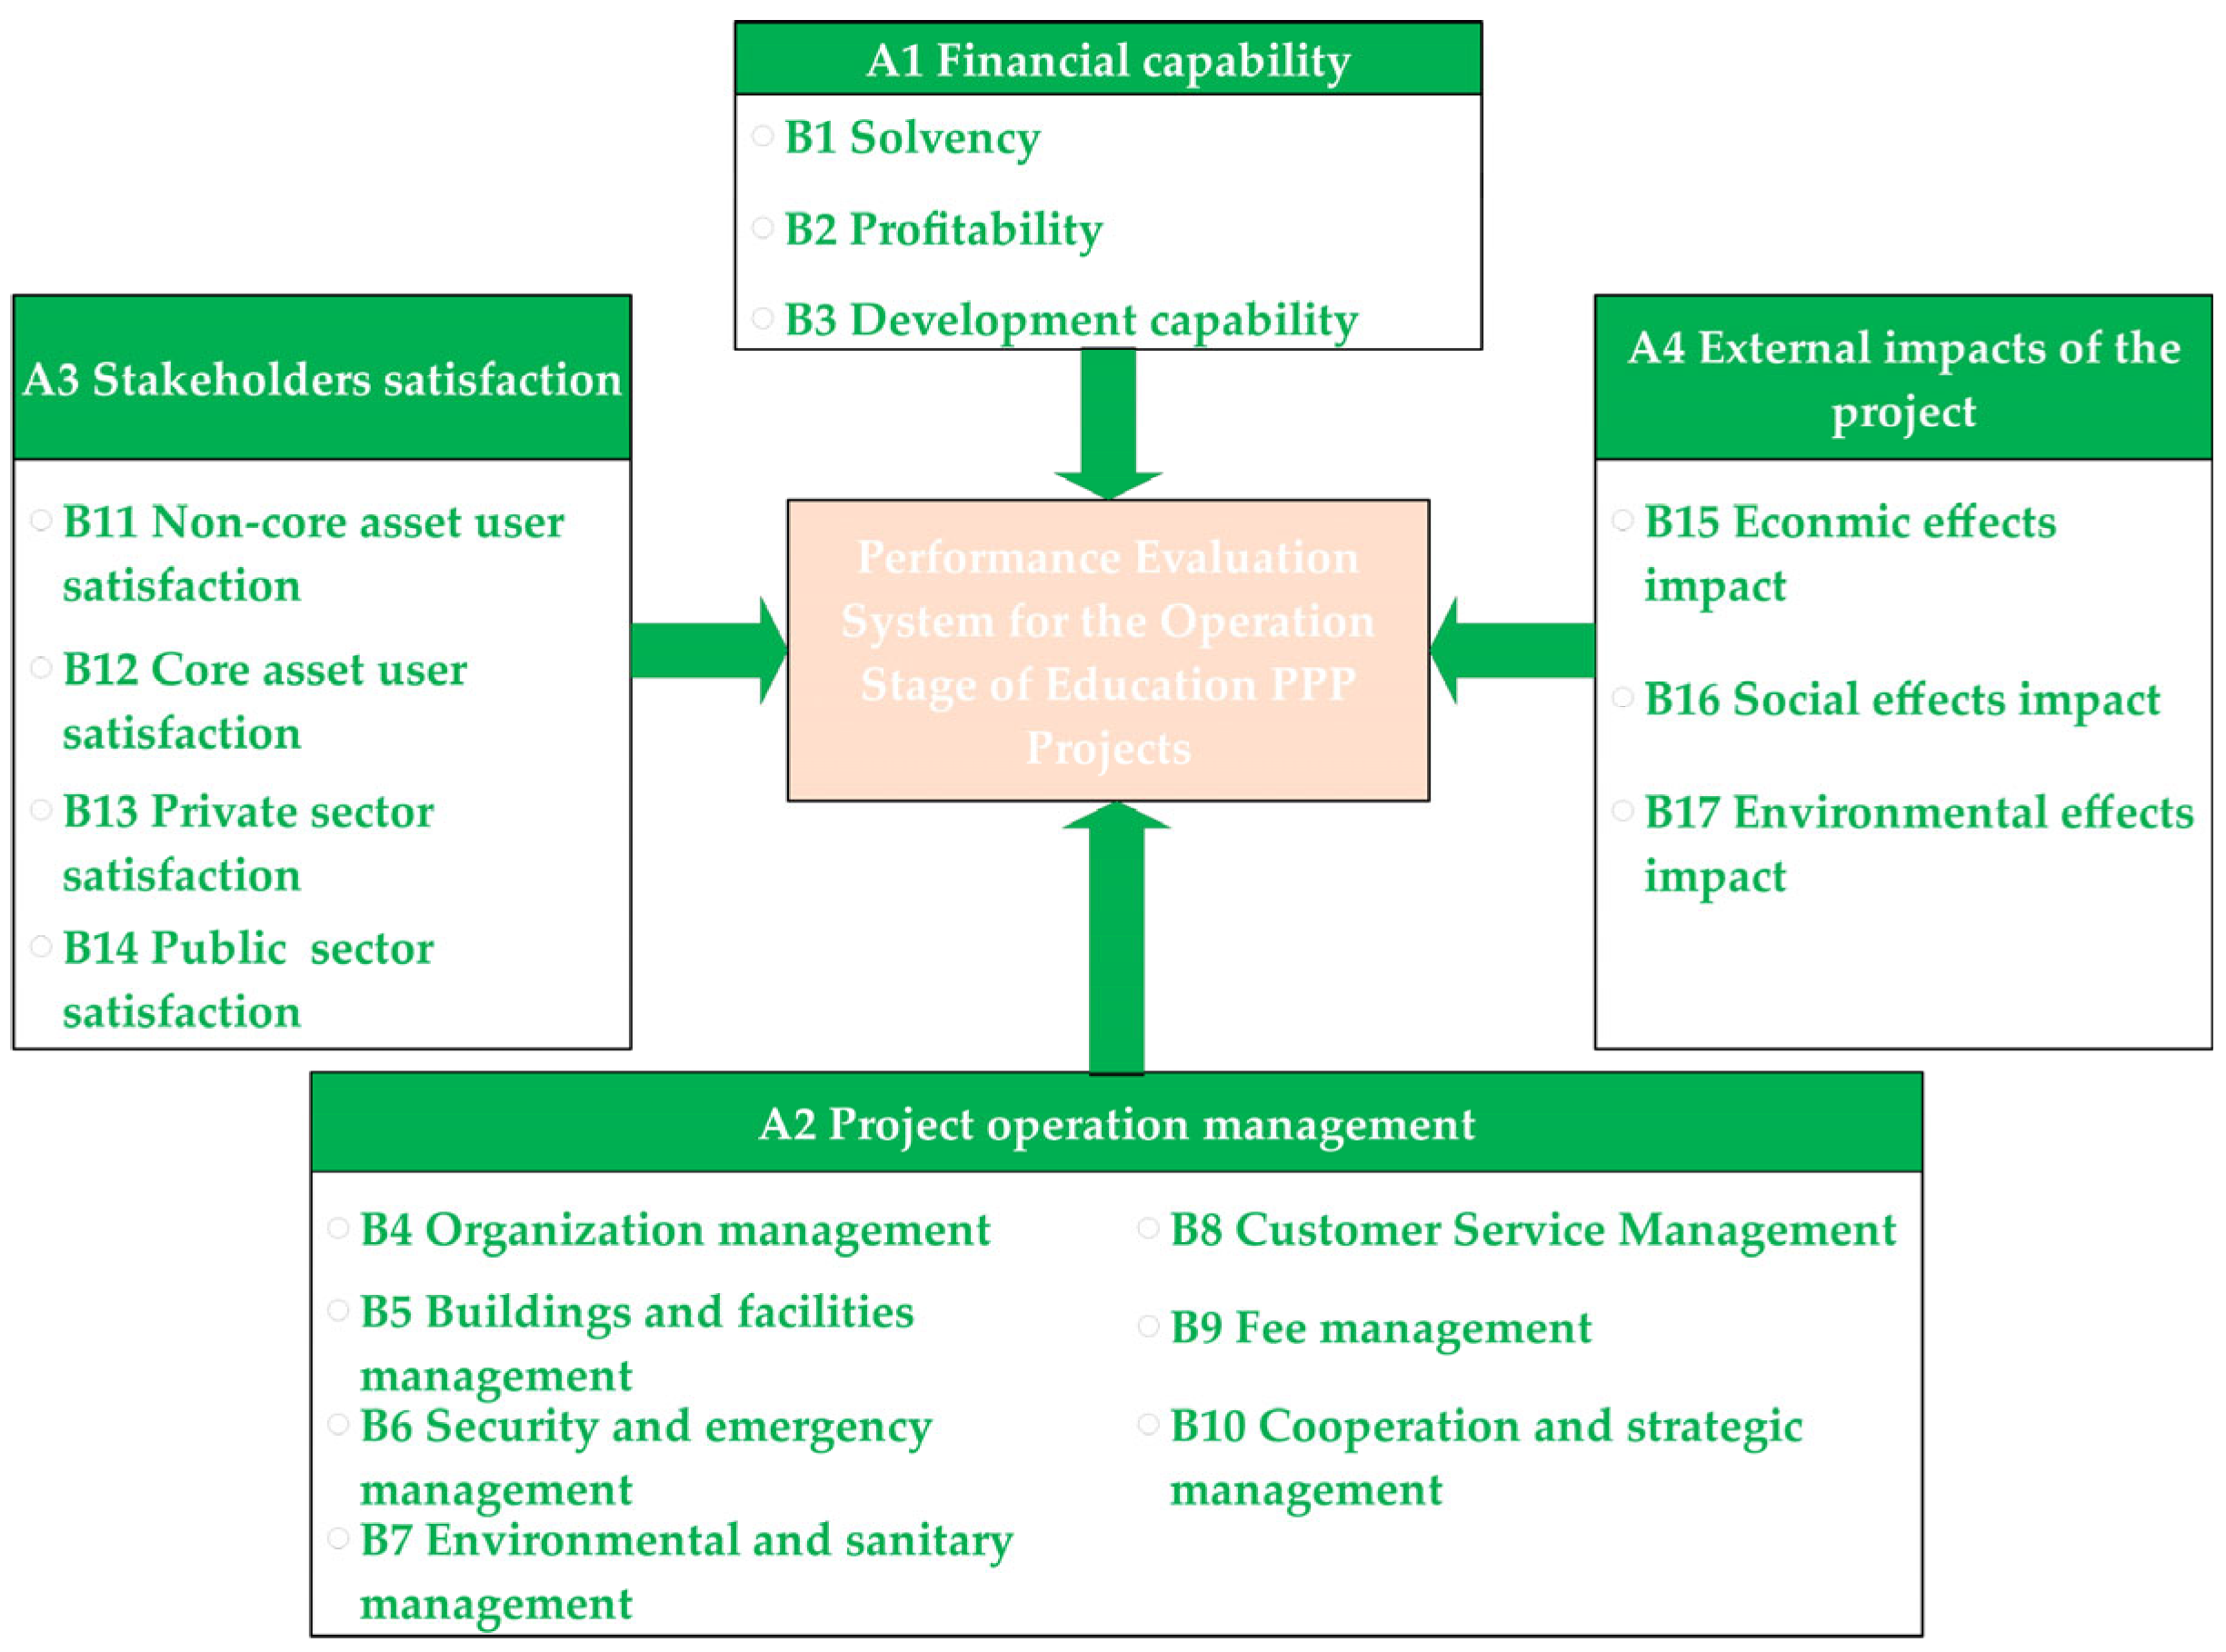
3.1. Performance Evaluation Indicator System for the Operation Stage of Education PPP Projects

3.1.1. Identifying the Subject of Performance Evaluation

Although the regulations for PPP projects vary from country to country, there is a general emphasis that the SPV is the responsible entity during the operation stage [28,31]. This study selects the SPV as the subject of performance evaluation, assessing the quality and efficiency of the service management provided during the operation phase of education PPP projects. According to existing research, the demands of different stakeholders regarding the SPV are not entirely consistent [9]. For education PPP projects, the private sector focuses on construction quality, cost, and risk sharing [11], the public sector focuses on the infrastructure services and social benefits delivered through project operations [32], while on-campus users are primarily concerned with the quality and cost of services provided by the SPV. Additionally, due to the characteristics of asset classification operations, core asset users within the campus focus on property services for core assets, whereas non-core asset users emphasize the living services provided by the SPV. These differences in demands on the SPV are the fundamental source of complexity in performance management for education projects.

3.1.2. Designing the Performance Evaluation Indicator System

This section uses the BSC as the foundational framework for building the evaluation system. And makes the following changes to the basic BSC to address the characteristics of education PPP projects: (1) Retaining the financial performance evaluation indicator and replacing internal business process management with project operation management to evaluate the SPV’s internal organization management and external operation, maintenance, and service management during the operation stage. (2) Replacing “customer” with “stakeholder satisfaction”, to evaluate stakeholder satisfaction with the SPV’s performance from the perspective of asset classification operation. (3) Building on the principles of Environmental, Social, and Governance (ESG), this study introduces an innovative approach by integrating the external effects of the project into the BSC framework, thereby reflecting the economic, social, and environmental impacts [33] resulting from project operations.
In summary, this study has established a performance evaluation framework based on four dimensions: financial capability, project operation and management, stakeholder satisfaction, and external effects of the project. Subsequently, performance evaluation indicators at second and third levels were identified through the perspectives of stakeholders and existing literature, resulting in a preliminary set of 4 First-Level, 17 Second-Level, and 55 Third-Level performance evaluation indicators, as shown in Table 1. Due to the subjective nature of indicator identification, these preliminary indicators were reviewed and revised by experienced experts in the PPP fields.

3.1.3. Questionnaire Survey

The questionnaire was structured using the Likert scale, with response options ranging from “very important”, “important”, “moderately important”, “slightly important”, to “not important at all”. The full questionnaire can be found in Supplementary Material File. Participants were asked to evaluate the indicators based on this scale. The questionnaire comprised four parts: Part one provided background information on education PPP projects and the survey’s purpose. Part two gathered basic information about the survey participants. Part three involved participants assessing the importance of 55 third-level indicators. In part four, respondents were invited to share their opinions or suggestions, identify any omissions in the indicators, and address necessary gaps. The survey respondents included personnel from public departments, SPV employees, university teachers, and experts. The questionnaire distribution started on 1 December 2023 and ended on 29 December 2023. A total of 50 questionnaires were distributed, with 37 valid responses collected, resulting in a response rate of 74%. Given the current limited number of operational education PPP projects and considering that indicator screening in PPP projects is generally based on small-sample surveys [20,28], this sample size is deemed acceptable. Figure 2 illustrates the characteristics of the questionnaire sample data obtained through statistical analysis, including the number of PPP projects the respondents have participated in, their years of experience in the PPP field, and the types of industries they belong to. The figure shows that the respondents have substantial experience in PPP projects and cover a broad range of industries relevant to PPP project operations, ensuring the survey results’ reliability.

3.1.4. Determination of the Performance Evaluation Indicator System

Using the Relative Importance Index (RII) method for indicator screening, with the calculation equation shown below:
R I I x = 100 × Q x 1 × 1 + Q x 2 × 2 + Q x 3 × 3 + Q x 4 × 4 + Q x 5 × 5 5 × Q
where RIIx represents the Relative Importance Index (RII) value for indicator X; Q denotes the total number of questionnaires; and Qxi indicates the number of respondents who rated indicator X with a score of i (where i = 1, 2, 3, 4, 5).
A higher RIIx value signifies greater importance of the indicator and implies that it should be retained. According to existing performance evaluation studies [28], this study uses 80 points as a reference threshold and removes indicators scoring below 80. As shown in Equation (2), this study introduces the coefficient of variation to assess the degree of data dispersion. The indicator with an O greater than 0.3 is excluded [28]. The distribution of the scoring data is detailed in Table S1, and the overall data approximately follow a normal distribution.
O = P q
where P represents the standard deviation of the dataset, q is the mean.
According to Table S1, the importance scores of indicators C6-3, C8-3, C8-5, and C12-2 are below 80, and the coefficient of variation for C12-2 exceeds 0.3. Therefore, these indicators are excluded. From the perspective of actual operations, based on expert feedback and pilot data analysis, first, these indicators showed significant functional overlaps with others, leading to redundancy within the evaluation system. This redundancy could negatively affect weight distribution and evaluation efficiency. For example, the content of indicators C8-3 and C4-4 overlaps, so C8-3 was removed. In addition, during data collection, C6-3 had a high rate of missing data, which could potentially distort the overall evaluation results and undermine the stability and reliability of the model.
To address concerns regarding the impact of indicator removal on the comprehensiveness of the evaluation, this study invited the previously consulted experts to conduct a dimensional coverage assessment of the final indicator system. This process ensured that the remaining indicators still represent the core content of each original dimension and do not result in structural information loss. The final performance evaluation framework is illustrated in Figure 3. The detailed explanations of each indicator can be found in the Table S4.

3.2. COWA-Critic-Game Theory Combination Weighting Method

In the evaluation process, indicators differ in their impact on evaluation objectives, requiring appropriate weight determination. The evaluation indicator system developed in this study for education PPPs contains complex fuzziness, making it difficult for a single subjective or objective weighting method to accurately reflect the true importance of each indicator. Therefore, a combined weighting approach is adopted, utilizing the COWA method to calculate subjective weights and the CRITIC method to determine objective weights. In addition, existing research on combined weighting methods has revealed [61] that there can be significant discrepancies between the results of subjective and objective weighting approaches. To address this issue, this study introduces the Game Theory combined weighting method, which seeks to minimize the squared deviation between the two sets of weights. This approach determines the optimal coefficient solution for the integration of both weight sets, ensuring that the combined weights accurately reflect the importance of each indicator.

3.2.1. COWA Method

The COWA method is derived from the Ordered Weighted Averaging (OWA) method. It includes reordering expert scoring sequences and assigning weights according to their positions to reduce the influence of subjective factors present in expert opinions on weight calculations. This approach enhances the precision and impartiality of the outcomes [62]. The detailed steps are as follows:
Step 1: Invite n experts to rate the importance of indicators at the same level using a Likert five-point scale. The raw score dataset from the n experts for each indicator is denoted as (a1, a2, …, an). Organize the raw data, sort it in descending order, and number them sequentially starting from 0. This yields: b0 ≥ b1 ≥ b2 ≥ …≥ bn−1.
Step 2: Let the weight of the sorted raw data b j be θ j + 1 . The weights are assigned using combinatorial numbers, calculated as follows:
θ j + 1 = c n 1 j j = 0 n 1 c n 1 j = c n 1 j 2 n 1   ( j = 0 ,   1 ,   2 ,   ,   n 1 )
where j = 0 n 1 θ j + 1 = 1 , c n 1 j represents the combination of j elements selected from n−1 elements.
Step 3: Assign weights to each sorted data point b j to obtain the absolute weight value w i - for each indicator factor:
w i - = j = 0 n 1 θ j + 1 b   ( j = 0 ,   1 ,   2 ,   ,   n 1 ;   i   =   1 ,   2 ,   ,   m )
Step 4: Calculate the relative weight w i for each indicator factor:
w i = w i - i = 1 m w i

3.2.2. CRITIC Method

The CRITIC is an improvement of the entropy method, measuring the degree of variation within the same indicator through standard deviation and reflecting the correlation between indicators using the correlation coefficient [63].
  • Step 1: Calculate the standard deviation of each indicator.
  • Step 2: Calculate the correlation coefficient between each pair of indicators.
  • Step 3: Calculate the objective weights of each level of indicators.

3.2.3. Game Theory-Based Combined Weighting

Combination weighting based on game theory uses Nash equilibrium as the synergy goal, seeking similarities to obtain the average weight of each indicator [61].
Step 1: Let the combined weight W of the indicator, expressed as a linear combination of W 1 and W 2 , as:
W = λ 1 w 11 + λ 2 w 21 λ 1 w 12 + λ 2 w 22 λ 1 w 1 n + λ 2 w 2 n = w 11 w 21 w 12 w 22 w 1 n w 2 n λ 1 λ 2 = λ 1 W 1 + λ 2 W 2
where λ 1 and λ 2 are the linear regression coefficients.
Step 2: Based on game theory, establish the objective function to minimize the sum of deviations between the combined weight W and W 1 and W 2 . Seek the optimal linear combination coefficients λ 1 * and λ 2 * , where the combined weight W is the optimal combined weight W *.
Step 3: According to the principle of differentiation, the above model must satisfy the first-order derivative condition to achieve the minimum value:
λ 1 W 1 W 1 T + λ 2 W 1 W 2 T = W 1 W 1 T λ 1 W 2 W 1 T + λ 2 W 2 W 2 T = W 2 W 2 T
Step 4: Standardize the obtained linear regression coefficients λ 1 and λ 2 , and calculate the combined weights of the evaluation indicators:
W * = λ 1 * W 1 + λ 2 * W 2

3.3. Limited Cloud Model

This study identifies evaluation indicators based on stakeholders’ perspectives and asset classification operations. The data for these indicators are obtained through expert assessments, operational data, and user satisfaction surveys. However, the data obtained from these three methods exhibit significant differences in dimensions and standards, making direct performance evaluation impossible. To address this, the Limited Cloud mode was utilized. It calculated the quantitative indicator evaluation scores through uncertainty reasoning and assessed the qualitative indicators using the forward and backward generators of the cloud. The evaluation scores were combined using the cloud parameters: expectation (Ex), entropy (En), and hyper-entropy (He). Furthermore, when an indicator’s actual value significantly deviates from the expected value, it follows a uniform distribution with a certainty of 1 [30]. The process of converting the evaluation set into cloud parameters is shown in Equations (9)–(11). The transformation of indicator data into cloud parameters was implemented using MATLAB R2020b software, with the specific code provided in Supplementary Materials.
E x t = C m a x t + C m i n t 2
E n t = C m a x t C m i n t 6
H e t = λ E n t
where C m i n t and C m a x t represent the upper and lower bounds of the evaluation set, respectively. λ is an empirical value, typically set to 0.01 [30].

3.3.1. Cloud Uncertainty Reasoning

Based on the performance evaluation system for education PPP projects, let the set of First-Level indicators be B = {B1, B2,…, Bm}, and the set of Second-Level indicators be C = {Ci−1, Ci−2,…, Ci−j} (i = 1, 2,…, m; j = 1, 2,…, n). The specific steps for determining quantitative performance evaluation indicator values based on cloud uncertainty reasoning are as follows:
Step 1: Compilation of comments based on quantitative performance evaluation indicators for education PPP projects.
Dt denotes the evaluation comments on quantitative indicators for education PPP projects, represented as D = {D1, D2,…, Dt}.
Step 2: Establish Cloud Model for quantitative performance evaluation indicator comments.
Define the evaluation ranges for each set of quantitative indicator comments and generate the cloud model characteristics G D = ( E x i j D , E n i j D , H e i j D ).
Step 3: Determine the comments for quantitative performance evaluation indicators of education PPP projects.
Let the attribute value of quantitative evaluation indicators be denoted as xij. Use the forward cloud generator to calculate the membership degree δij to   M D = ( E x i j D , E n i j D , H e i j D ). The calculation process is shown in Equation (12), where membership degrees less than 0.001 are simplified to 0. According to the Maximum Membership Principle, If δ i j < δ i j D e , the comment corresponding to this quantitative indicator is denoted as De.
μ x = e ( x E x ) 2 2 E n 2
Step 4: Establish a qualitative comment set for the scores of quantitative performance evaluation indicators and generate the corresponding cloud model.
Let F denote the evaluation set of scores for quantitative performance indicators, represented as F = {F1, F2,…, Fk}. The corresponding numerical characteristics of the cloud model are denoted as H F = ( E x i j F , E n i j F , H e i j F ).
Step 5: Determine the value vij for the quantitative performance evaluation indicators of education PPP projects.
Determine the quantitative performance evaluation indicator values for education PPP projects based on cloud uncertainty. The form is: if v i j M t   , then the result is v i j H k .

3.3.2. Forward and Backward Generators

Compile the expert and satisfaction questionnaire scores and import them into MATLAB software. Utilize the backward cloud generator to analyze the cloud parameters and then use the forward cloud generator to generate additional cloud droplets and capture a comprehensive cloud image. After making necessary adjustments, derive the final cloud parameters (Ex, En, He), where the term “Ex” in the cloud parameters denotes the evaluation value.

3.3.3. Calculation of the Comprehensive Cloud
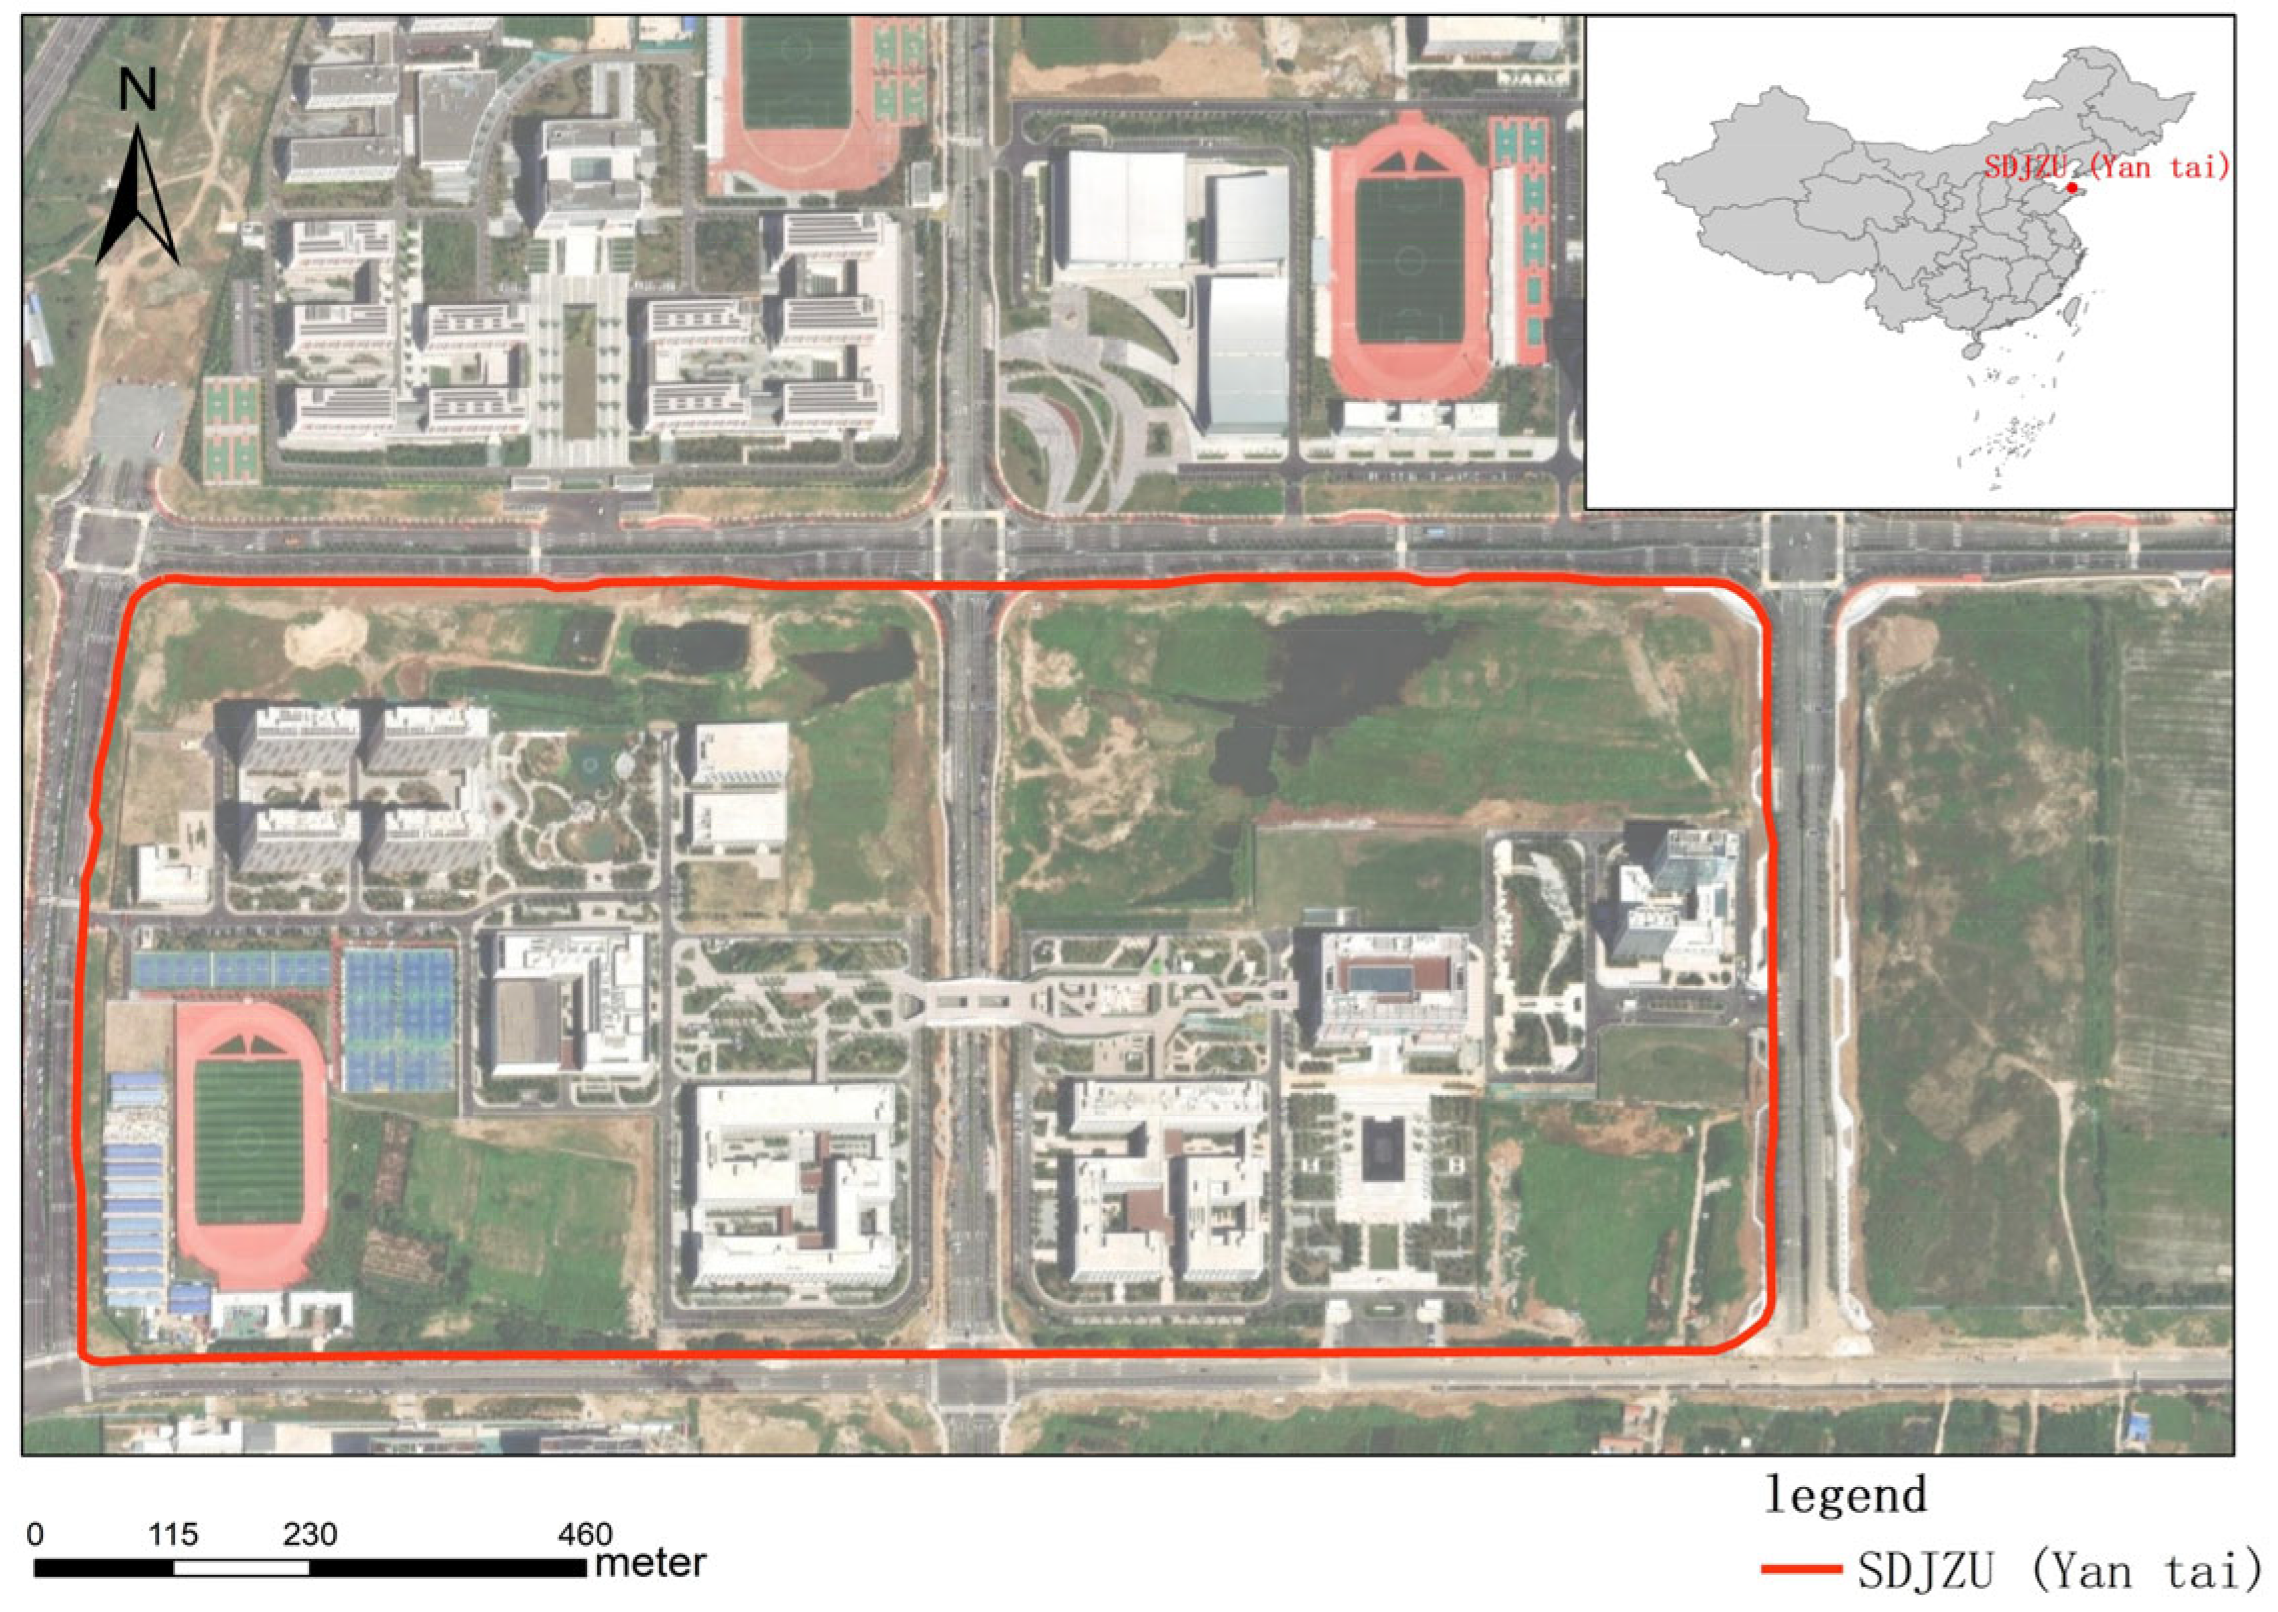
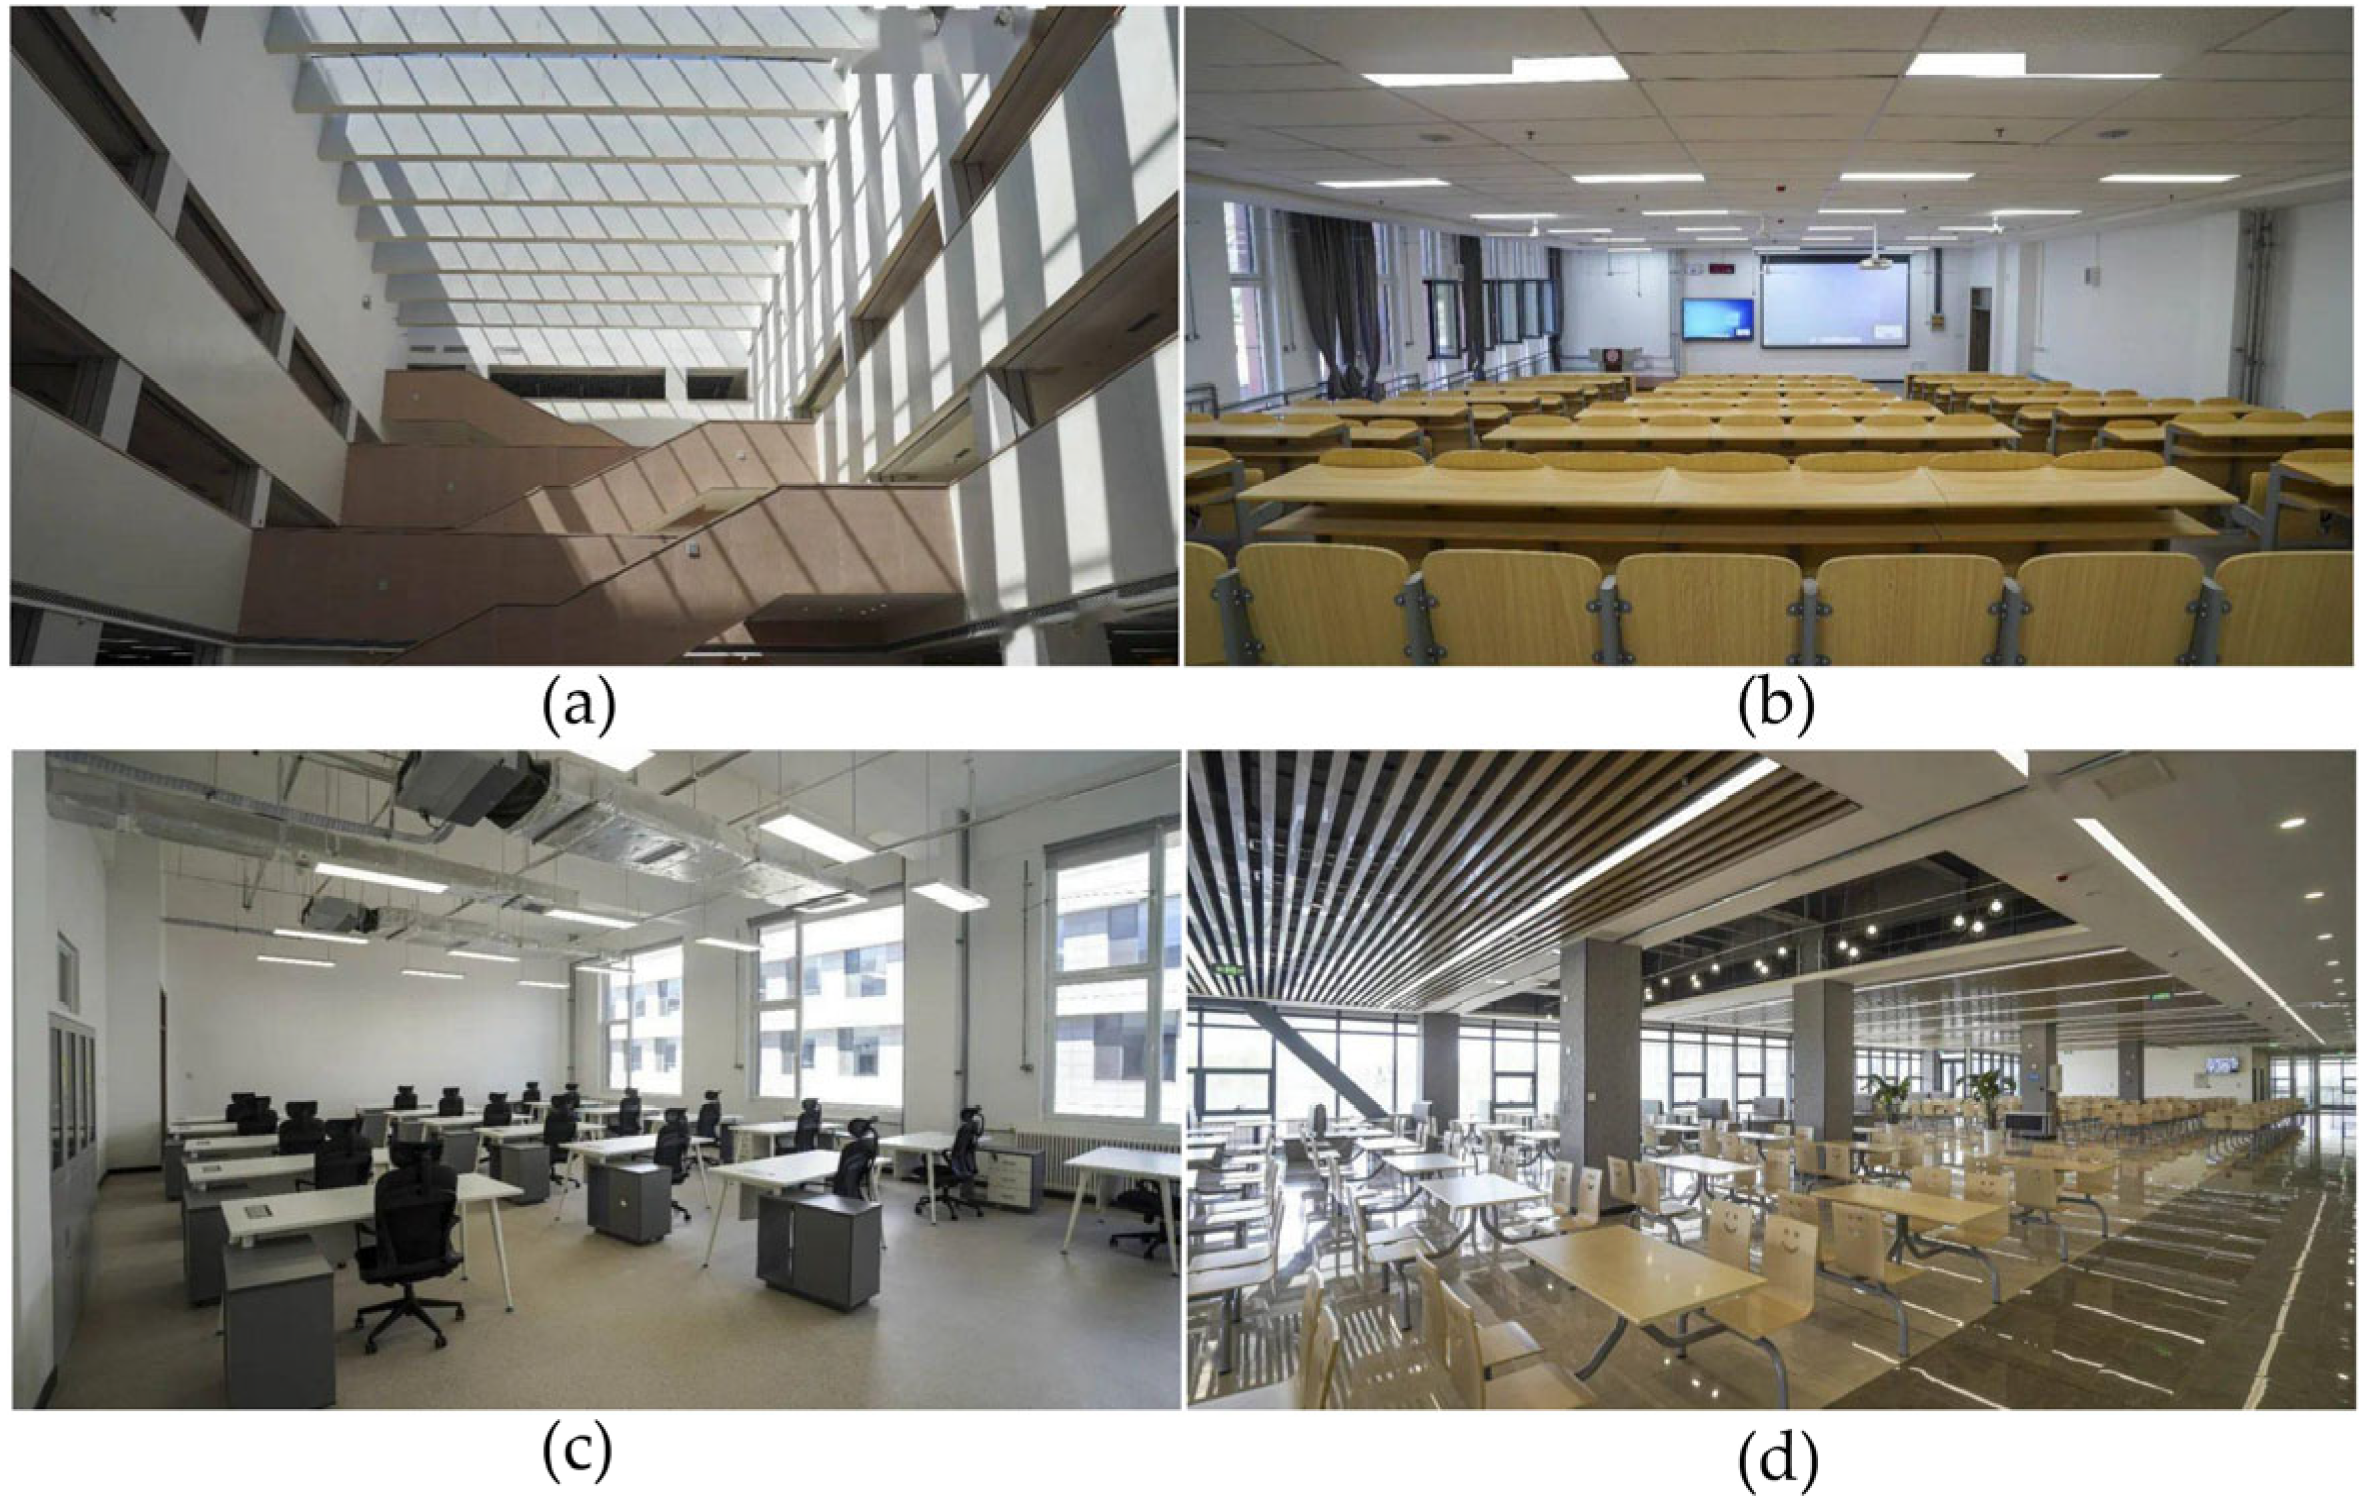
After determining the cloud parameters for each third-level indicator, conduct comprehensive calculations on these parameters sequentially to obtain the parameters of the comprehensive cloud model and the ultimate performance evaluation results [64]. The calculation process is shown in Equations (13)–(15).
E x = j = 1 n E x j w j
E n = j = 1 n E n j 2 w j
H e = j = 1 n H e j w j
where w j represents the weight of each level indicator determined by the COWA-CRITIC combined weighting method.

4. Case Study

4.1. Case Description

This study uses the PPP project of the new campus of Shandong Jianzhu University in Yantai, China, to demonstrate the effectiveness of the proposed performance evaluation model. As the first undergraduate institution in Shandong Province designated as a national demonstration site for industry-education integration, the university leverages this project to foster innovation in the local industrial chain and train professionals in fields such as coastal engineering and intelligent manufacturing, addressing regional talent gaps. The project fully adopts a user-pay model, making it a representative case of education PPP implementation.
As shown in Figure 4, located in Fushan District, Yantai City, the project is jointly led by the Yantai Economic Development Zone Government and Shandong Jianzhu University, with China Construction Fifth Engineering Division Co., Ltd. participating in investment and construction. With a total investment of 1.36 billion CNY and a construction area of 240,768.96 m2, the project includes twelve key facilities (such as classrooms and labs) as shown in Figure 5. Construction began in October 2021, and the first phase was operational by August 2023. Implemented under a BOT model with a 2-year construction and 15-year operation period, the project employs an asset classification operation approach: the university oversees teaching and administration, while the SPV handles infrastructure maintenance and non-core service operations to generate user-fee income.

4.2. Data Sources and Processing

4.2.1. Data Sources

The evaluation period for the case study is the first semester of 2023–2024, and the evaluation data sources are divided into three parts:
The first part consists of expert evaluation data, including qualitative indicators such as the maintenance status of campus buildings and facilities. Experts from relevant fields such as architecture, electrical engineering, landscaping, finance, and law are invited to score these indicators to obtain evaluation data.
The second part consists of project operation data, such as the current ratio of project operations, the timely rate of campus repairs, and the user complaint resolution rate. These data are obtained from the SPV’s operational records.
The third part is stakeholder satisfaction. This evaluation data are obtained by inviting various stakeholders to respond to questionnaires.

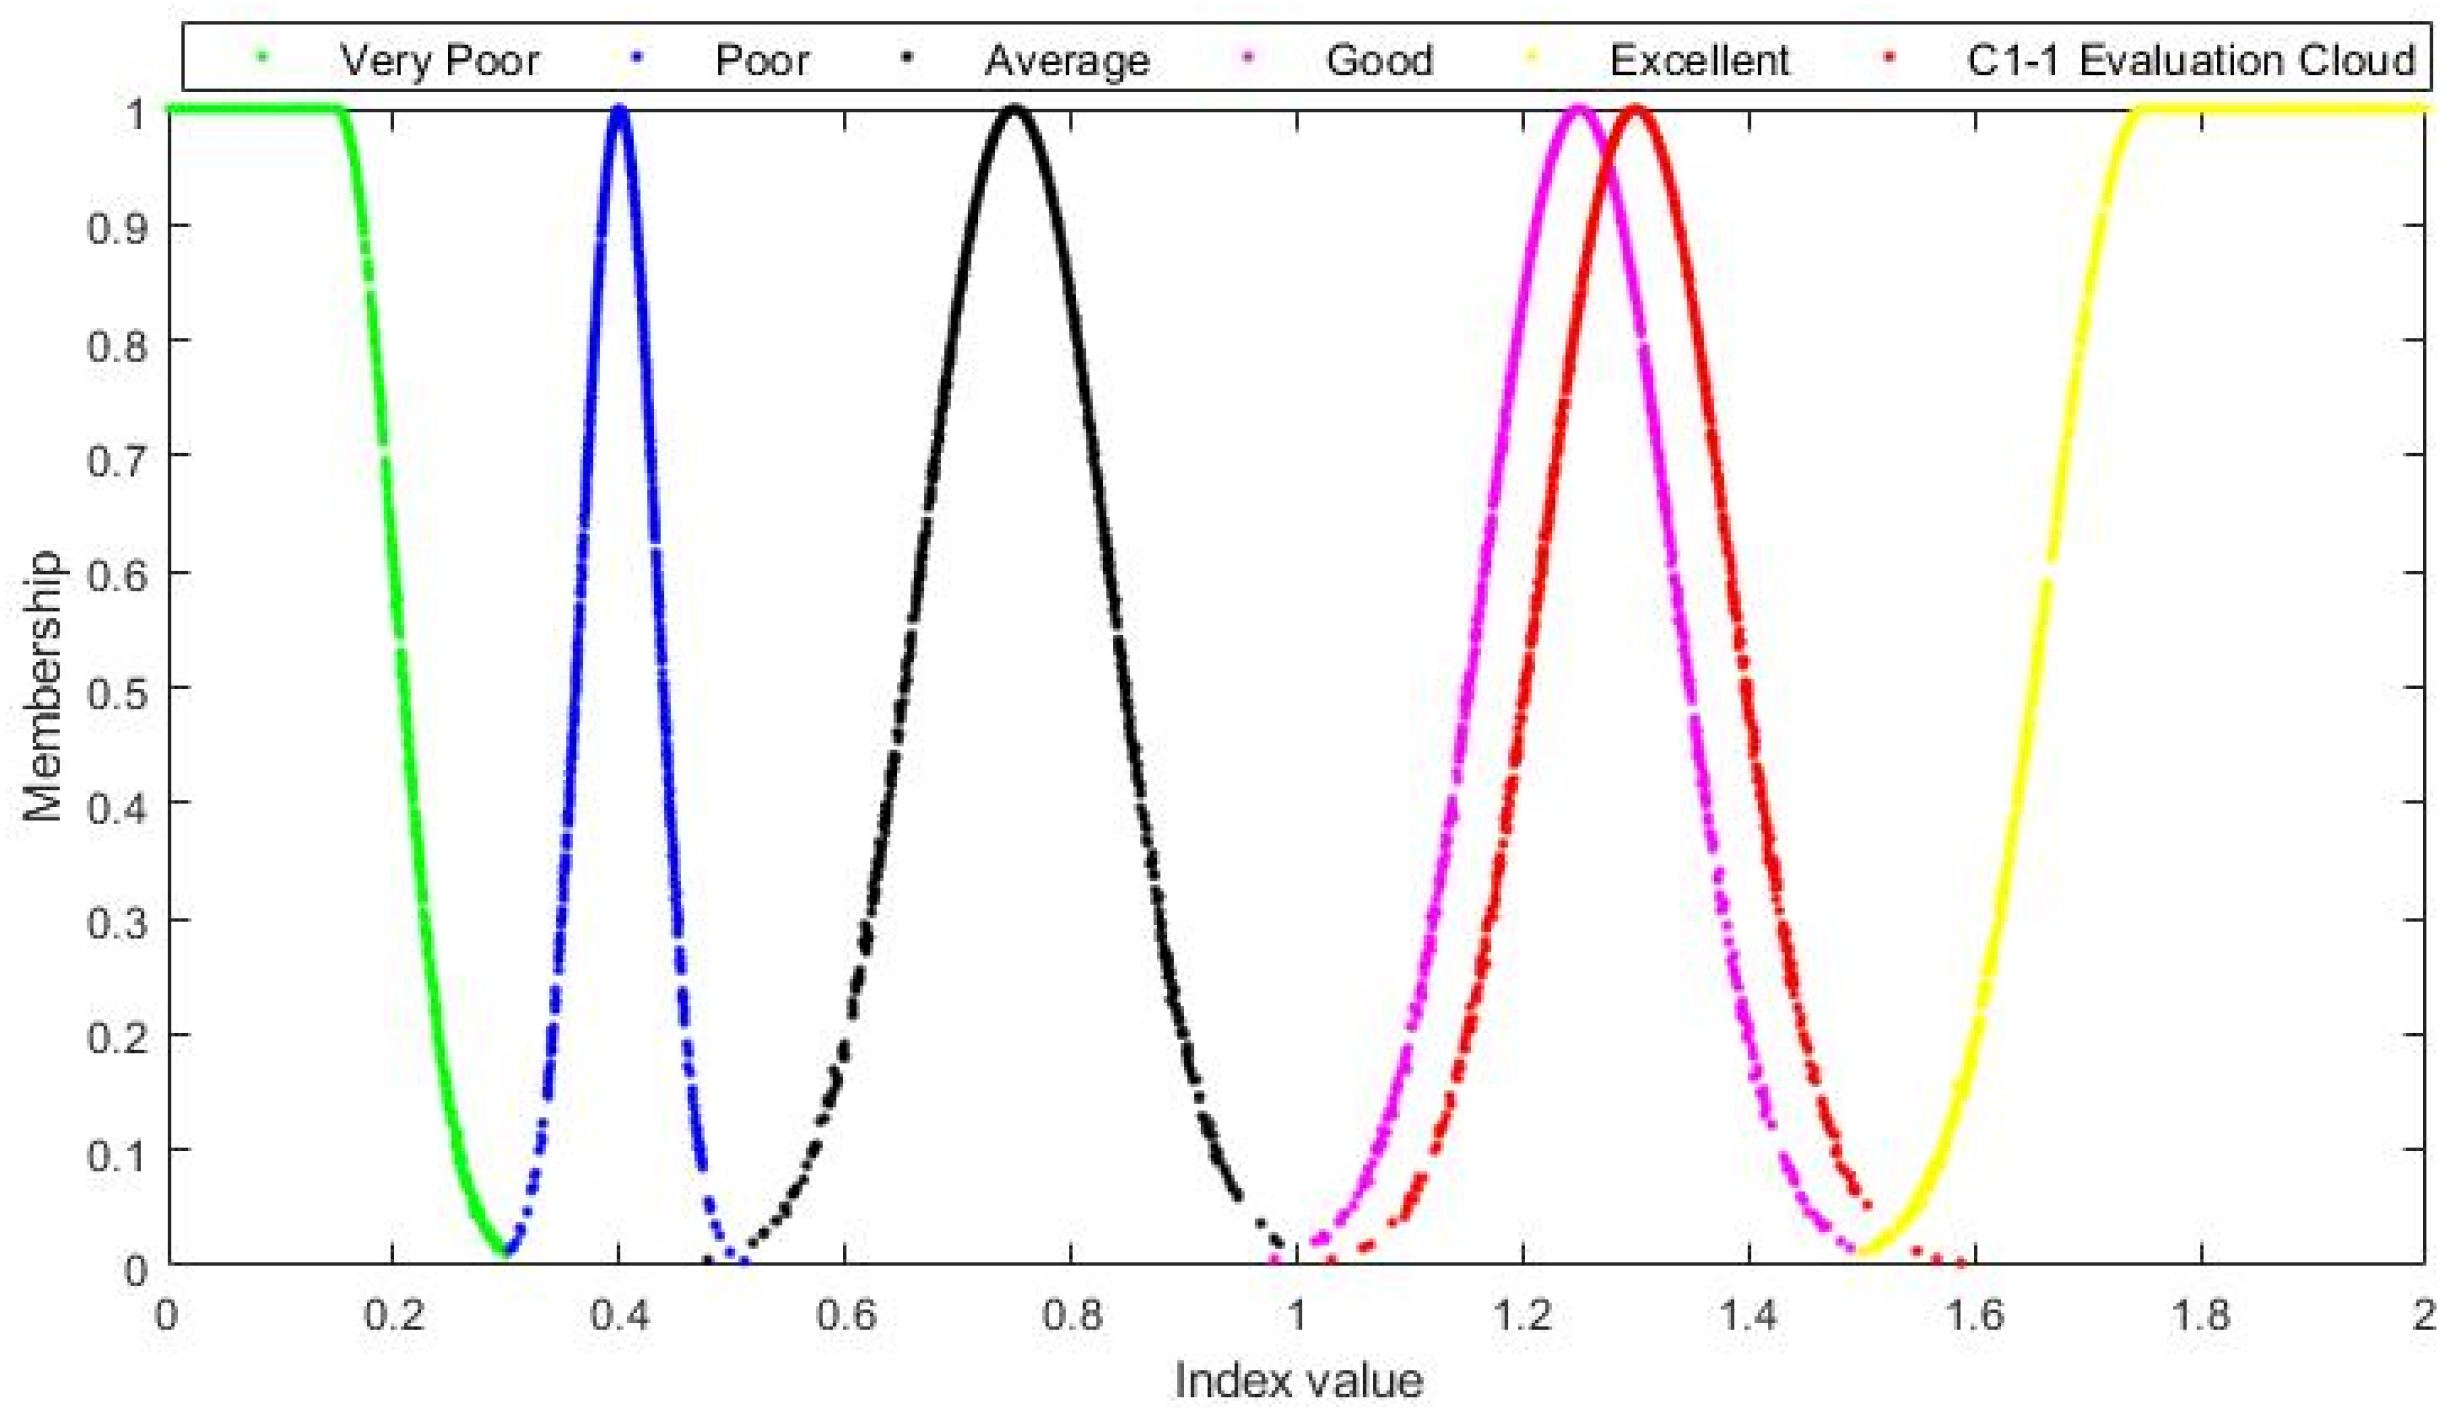
4.2.2. Performance Evaluation Data Processing Based on the Limited Cloud Model

(1) Determination of Quantitative Performance Evaluation Indicator Scores Based on Cloud Uncertainty Reasoning.
The quantitative evaluation set and cloud model parameters are determined based on expert experience, various norms, and standards. For instance, the indicator value for the “Current Ratio C1-1” is 1.3. The evaluation set for this quantitative indicator includes {Excellent, Good, Average, Poor, Very Poor}, and the corresponding cloud parameters for the current ratio indicator evaluation set are as follows: (1.75, 0.083, 0.0008), (1.25, 0.083, 0.0008), (0.75, 0.083, 0.0008), (0.4, 0.033, 0.0003), (0.15, 0.05, 0.0005). The evaluation standard cloud for indicator C1-1 is generated as shown in Figure 6.
Through the use of Matlab software, more cloud droplets were generated, resulting in the red evaluated cloud in Figure 7. As shown in Figure 7, the performance level of this indicator reaches the “Good” category, indicating that the SPV’s current debt repayment capability is strong and should be maintained.
The qualitative evaluation set corresponding to the quantitative indicator scores is {Extremely High, High, Medium, Low, Extremely Low}, with the matching cloud parameter characteristics as follows: (90, 3.3, 0.03), (70, 3.3, 0.03), (50, 3.3, 0.03), (30, 3.3, 0.03), (10, 3.3, 0.03). Table 2 below shows the reasoning relationship between the quantitative evaluation set and the qualitative evaluations.
According to Equation (12), the membership degrees of the C1-1 indicator value to each quantitative evaluation set are [0, 0.8341, 0, 0, 0]. Based on the principle of maximum membership, the quantitative evaluation of the C1-1 indicator value is classified as “Good” (1.25, 0.083, 0.0008), with the corresponding qualitative evaluation being “High” (70, 3.3, 0.03). Using uncertainty reasoning through the cloud model, the quantitative evaluation value is converted into a dimensionally consistent qualitative evaluation value according to Equation (16). The resulting qualitative performance evaluation value is x = 72, with cloud parameters of (72, 3.3, 0.03).
μ x = e ( x 70 ) 2 2 3.3 2 = 0.8341
Repeat the above steps to obtain evaluation scores for each quantitative project indicator.
(2) Calculation of Qualitative Performance Evaluation Scores Based on Forward and Reverse Cloud Generators.
In this study, the qualitative indicators were divided into project operation and satisfaction indicators. The evaluation scores for these qualitative indicators were calculated using the Delphi method and forward and reverse cloud generators. To ensure the statistical significance of the number of respondents in the Delphi method, there were specific differences in the selection principles and the number of respondents for these two categories of indicators.
For the indicators under “Project operation management A2”, the principles for selecting experts included having extensive practical experience in PPP projects, having directly or indirectly participated in the management and operation of education PPP projects, and having researched the performance evaluation of education PPP projects. The number of experts should not be too large to facilitate the statistical analysis of the scoring results. Considering these factors, this study selected 15 experts in relevant fields to score the qualitative indicators under “Project operation management A2”.
For satisfaction indicators of “Multi-stakeholders’ satisfaction A3”, the study ensured that the survey sample sizes were statistically significant. This involved selecting 102 current students from different grades as non-core asset users, 15 school management staff as core asset users, 15 representatives from the private sector, and 10 representatives from public departments. Satisfaction scores for each stakeholder group were recorded on a percentage scale. The distribution of the questionnaire started on 15 January 2024 and ended on 30 January 2024, All participants were informed of the purpose of the survey and provided their consent before participating.
“Power Supply System Management C5-4” is an example of the project operation management indicators. Let the qualitative evaluation be set as {Extremely High: (90, 3.3, 0.03) High: (70, 3.3, 0.03) Medium: (50, 3.3, 0.03) Low: (30, 3.3, 0.03) Extremely Low: (10, 3.3, 0.03)}, The corresponding standard cloud is generated based on these parameters.
The evaluation results from 15 experts on the operation and maintenance conditions of various power supply facilities on campus (including the integrity of the power supply equipment and daily maintenance records) were organized and input into Matlab software for the trial calculation of the indicator’s cloud parameters. After several adjustments, the cloud parameters for the “Power Supply System Management C5-4” indicator were determined to be (81.7, 2.744, 0.393) and generated the red evaluation cloud as shown in Figure 8. The cloud diagram indicates that the performance evaluation level is “Extremely High”, demonstrating that the SPV is performing exceptionally well in maintaining the power supply equipment and ensuring the regular operation of the campus electrical system. It is recommended that the SPV maintain high-quality maintenance practices in the future.
The satisfaction indicator’s performance evaluation scores are exemplified by “Cafeteria Service Satisfaction C11-1”. According to existing research on satisfaction surveys in project management [28], a satisfaction score below 60 indicates that project objectives have not been met. Therefore, this study sets 60 as the passing threshold for the satisfaction evaluation set. The evaluation set is defined as {Extremely High: (95, 1.67, 0.02) High: (85, 1.67, 0.02) Medium: (75, 1.67, 0.02) Low: (65, 1.67, 0.02) Extremely Low: (30, 10, 0.1)}, the corresponding standard cloud is generated based on these parameters. Due to the randomness of students, the performance evaluation indicator values are determined through a single round of scoring. After verifying the reliability of the survey results, the data were imported into Matlab. Using the forward and reverse cloud generators, the cloud parameters for the indicator were calculated as (78.84, 9.39, 2.53), producing the cloud diagram shown in Figure 9. The cloud diagram indicates that the performance only reaches the “Medium” level, suggesting that the SPV’s cafeteria services are problematic and need improvement.
Repeat the above steps to obtain the performance evaluation indicator score for each qualitative indicator of the project.

4.3. Performance Evaluation Results

The COWA method is used to determine the subjective weights of each indicator. Ten experienced experts from the importance scoring stage in Section 3.1 were invited to provide scores. All of these experts have over five years of experience in PPP project work or research, and among them, five have directly participated in the operation of education PPPs, ensuring the reliability of the scoring. Taking indicator B11 as an example. The scores for C11-1 are sorted in descending order to form the dataset: {5, 5, 4, 4, 4, 4, 4, 3, 3, 3}. This dataset was then input into Equation (3), yielding a weighted vector of {0.0020, 0.0176, 0.0703, 0.1641, 0.2461, 0.2461, 0.1641, 0.0703, 0.0176, 0.0020}. Using this weighted vector along with the dataset in Equation (4), the absolute weight of the C11-1 indicator was calculated to be 3.9297. Similarly, the absolute weights for C11-2 to C11-4 were {4.0879, 3.4842, 3.4842}. Finally, by applying Equation (5), the subjective weights for each indicator were calculated as {0.2623, 0.2728, 0.2324, 0.2324}. Using the Critic method to determine the objective weights of each indicator, evaluation data for C11-1, C11-2, C11-3, and C11-4 were imported into Matlab, resulting in objective weights of {0.2146, 0.2409, 0.2325, 0.3120}. Applying game theory methods to calculate combined weights yielded {0.2281, 0.2499, 0.2324, 0.2894}. The detailed data and calculation process of the COWA method, the Critic method, and the Game Theory-based Combined Weighting Method can be found in Tables S2 and S3. Repeating the above steps, the combined weights of the indicators were calculated. Finally, the weights and scores of the Third-Level indicators are shown in Table 3.
Let the evaluation grade set for the comprehensive cloud be defined as {Extremely High (90, 3.3, 0.03), High (70, 3.3, 0.03), Medium (50, 3.3, 0.03), Low (30, 3.3, 0.03), Extremely Low (10, 3.3, 0.03)}. Based on the comprehensive cloud computing Equations (13)–(15), the performance evaluation scores of the Second-Level and First-Level indicators were calculated. The results are shown in Figure 10. The SPV’s final operational performance evaluation score is 73.14, which falls into the “High” performance level, indicating room for improvement.
According to Table 3 and Figure 10, the scores for the SPV’s development capability B3, non-core asset user satisfaction B11, corporate culture C4-5, and user complaint management C8-2 are relatively low, with performance levels lying on the boundary between “Medium” and “High”. This indicates issues in management and service in these areas, necessitating adjustments to the related operational strategies.
Based on the actual operational conditions, the SPV’s lack of experience managing educational projects led to several issues on campus. For instance, problems arose in the campus cafeteria, including insufficient food, limited food variety, high prices, and unauthorized price increases. Additionally, the dormitories had unpleasant odors, and the limited number of campus shuttle buses caused commuting difficulties. These issues led to widespread dissatisfaction among students, resulting in a performance evaluation score only 62.92 for the “Non-Core Asset User Satisfaction B11” indicator. Worse yet, these problems led to ongoing complaints from students, which caused the “User complaint management C8-2” indicator to have a rating of only 62.7. Moreover, the project is in its early operation stage, with fewer than 1000 students on campus, falling short of the expected scale of 7200 students. This shortfall in student numbers has led to insufficient revenue, resulting in lower evaluation scores for “Profitability B2” and “Development Capability B3”.
In summary, the performance evaluation results of this study are consistent with the actual operational conditions of the project. Combined with the case analysis process from existing PPP project performance evaluation research [20,28], the applicability and effectiveness of the evaluation model can be acknowledged.

5. Discussion

5.1. Discussion of the Evaluation Model

5.1.1. Discussion on the Reliability of Data Processing

When using the Cloud Model for comprehensive evaluation of the operations and management dimensions, it can be observed that the average score for facility maintenance indicators is higher than that of other types of operational indicators (as shown in Figure 10b). This trend can be attributed, in part, to the fact that the facilities in the case study project have only recently been put into operation and are performing well. On the other hand, to obtain evaluation data for the facility maintenance indicators, experts need to be invited to conduct multiple rounds of scoring until the results can generate a clear cloud diagram, as shown in Figure 8. During this process, experts may take the early-stage operational conditions of the project into account and tend to perceive the facility maintenance situation as good, which could influence the score of facility operation to some extent. Considering the actual situation of the project and the application of the existing Cloud Model [28,29], this study deems such a trend acceptable, as the evaluation results can reflect the actual state of the project’s operation.

5.1.2. Comparative Analysis

To validate the effectiveness and superiority of the proposed method, this section compares existing performance evaluation methods with the proposed method. The matter-element method and the Fuzzy Comprehensive Evaluation method are used to conduct a comprehensive performance evaluation of the same case. The evaluation sets of these two methods are shown in Table 4.
Table 5 shows that the performance levels obtained using the methods above are identical, demonstrating the effectiveness of the method proposed in this study. In terms of advantages, compared with the Fuzzy Comprehensive Evaluation method, the Cloud Model can handle both qualitative and quantitative data, enhancing the objectivity of the evaluation results. Compared with the matter-element method, the Cloud Model offers superior data processing capabilities by effectively managing complex and fuzzy operational data, thereby improving the robustness of the results. In terms of evaluation output, the Cloud Model generates “cloud diagrams” that visually display the typicality and distribution of an indicator within a given grade, making the evaluation results highly interpretable.

5.1.3. Innovations and Contributions to the Evaluation Model

The methodological framework proposed in this study effectively addresses the unique operational challenges faced by educational PPP projects: (1) This study innovatively incorporates a multi-stakeholder perspective and the asset-classified operational characteristics of education PPPs into the performance evaluation indicator system, addressing the limitations of existing systems that have not adequately accounted for the unique operational features of education PPPs. This enables SPVs to adopt differentiated operational strategies based on asset types, thereby meeting the diverse needs of stakeholders. (2) This study effectively reconciles the differences between the subjective weights derived from COWA and the objective weights obtained through CRITIC using Game theory, ensuring that the combined weights accurately reflect the true importance of each indicator. The empirical findings from the case study further validate that this integrated approach improves the model’s ability to distinguish and diagnose performance issues, enabling the identification of weak links in operations. (3) Compared with other types of PPP projects, such as rail transit [8], the operation of education PPPs involves facility maintenance and various student life services, which generate complex operational data. By integrating the Limited Cloud Model with the combined weighting method, these complex data were effectively processed, enabling a comprehensive evaluation of the project’s performance level. This approach enhances the objectivity and robustness of performance evaluation results and provides reliable data support for SPV’s operational decision-making and strategy adjustment.

5.2. Comprehensive Discussion

Although the case analysis focuses on an education PPP project in Shandong Province, China, the operational challenges observed are commonly encountered in PPP projects globally. Therefore, the findings can inform education PPPs in other provinces of China and countries that adopt comparable public service delivery models. Nonetheless, the extent of generalizability may vary depending on regional policy environments, institutional capacities, and socioeconomic conditions.

5.2.1. The Relationship Between Operational Revenue and User Scale

The weights of the First-levels indicators are shown in Figure 11. “Financial Capability (A1)” holds the highest weight at 0.2655, ranking first. This finding is consistent with the performance evaluation studies of rail transit projects by Wang, Y. [8] and transportation infrastructure projects by Du, J. [20], reflecting the characteristics of user-pay-type projects. Under the A1 indicator, “Profitability (B2)” carries the highest weight, as it directly reflects the project’s revenue performance. Due to the “asset-classified operation” model, the majority of the SPV’s revenue comes from the operation of non-core assets, with these operational earnings derived from user payments made by on-campus students and external visitors. However, after the COVID-19 pandemic in 2019, schools worldwide began to close or shift to online teaching [65], making the operational revenue of education projects highly dependent on the number of on-campus students. In the case study, the project was in the early stages of operation, and the number of on-campus students had yet to reach the expected scale, directly leading to insufficient operational revenue. Compared to other types of projects (such as HSR PPP [66]), users of education projects tend to stabilize once the expected scale is reached, and there are relatively few negative factors affecting the user base. However, these projects are still directly influenced by external policies (such as enrollment regulations and the duration of compulsory education) and demographic structures (the number and distribution of school-age children).
Despite differences in admission policies across countries, most educational institutions adopt a quota-based enrollment system under the PPP framework. Therefore, during long-term operations, the SPV should pay close attention to fluctuations in the on-campus student population. In the early stages, when student numbers are low, it is recommended to coordinate with the school to organize activities such as study tours and campus visits—while ensuring normal teaching operations—to attract off-campus visitors and increase operation revenue. Once the student population reaches its upper limit, the SPV should remain alert to changes in external factors such as education policies and demographic trends and proactively develop strategies to address potential shifts in student numbers, thereby ensuring stable project profitability.

5.2.2. Operational Experience in Education Projects

Within the A2 indicator, as shown in Figure 12, “Building and Facility Management (B5)” carries the highest weight, indicating the critical importance of daily maintenance of buildings and facilities for the regular operation of the project. This finding is consistent with the research about Australian education PPP by Geng, L. [32], who emphasized that the daily maintenance of on-campus buildings and facilities is the foundation for providing quality services and a guarantee of the project’s deliverability. Building on this, the case study in this research reveals that the SPV must also possess professional knowledge and experience in the education sector during the operation process to ensure reliable service quality. This finding is highly generalizable, Egypt’s education reform project provides an excellent example: Egypt’s education reform incorporated the PPP model and invited experienced American education groups to collaborate with local educational departments for vocational training at Egyptian universities, contributing to the success of the education reform [67]. In the case study, the SPV’s team was primarily composed of members from construction enterprises who had extensive experience in building maintenance, resulting in an “Extremely High” performance for the indicator “Building and facilities management (B5)”. However, due to a lack of experience in operating and servicing educational projects, multiple user service issues emerged on campus, lowering the overall performance level. In addition, the health issues on campus during the COVID-19 pandemic have posed new challenges for global operators. Before the pandemic, educational institutions in countries mainly focused on food safety for on-campus students, taking precautions against outbreaks of foodborne illnesses such as mass food poisoning [68], cholera, and norovirus [69]. Measures for preventing epidemic diseases were relatively limited. During the pandemic, influenza viruses, particularly COVID-19, caused significant damage in educational institutions, especially in areas with high concentrations of students with weaker immune systems, such as kindergartens and primary schools [65].
In summary, the successful operation of education PPPs relies not only on the management of buildings and facilities but also on the SPV’s expertise and extensive experience in educational services. To enhance service quality, SPVs should continuously learn from advanced educational management practices and cultivate or recruit management teams with rich experience in educational projects. In response to the health-related challenges that have emerged in the post-COVID-19 era, project companies should update on-campus health management plans—such as establishing close ties with local hospitals to promptly assess on-campus health conditions and implement appropriate prevention and control measures during an outbreak. These efforts are essential to prevent epidemics and ensure the project’s sustainability.

5.2.3. Contract and Relationship Governance

As shown in Figure 12, the weight of “Collaboration and Strategic Management B10” ranks third within its group, indicating its significant importance to project performance. This aligns with the findings of Li, J. et al. [49], who discovered that contractual governance and relational governance positively impact the sustainability of PPPs, with contractual governance having a more substantial influence. In the case of the cafeteria issue, a comprehensive contract modification mechanism and good collaborative relationships enabled the school and the SPV to negotiate and modify the contract successfully. In April 2024, the SPV transferred the cafeteria operation rights to the school, resolving the previous issues and significantly improving user satisfaction within the campus. Due to private investors’ opportunistic and profit-driven nature, their involvement in PPP projects aims to achieve the expected investment return rates and generate revenue for their enterprises. In contrast, the primary goal of education PPP projects is to build quality infrastructure and provide excellent educational support services, ensuring more students have access to quality education, thereby narrowing the education gap and promoting educational equity [12]. This fundamental difference is commonly observed in education PPPs across various countries (e.g., USA [1], UK [10], and South Africa [11]) and often results in unavoidable conflicts during project operation.
Therefore, the SPV should strengthen contractual and relational governance to address potential conflicts among multiple stakeholders during project operation. This includes formulating clear contractual terms, establishing formal procedures for contract amendments, and creating effective communication and negotiation mechanisms to promote cooperation and achieve mutual benefits among all parties.

5.2.4. Differences in Stakeholder Needs During Project Operation

Li et al. [9] argued that stakeholders in PPP projects have varying perceptions of project success, leading to differing demands during project operation. The evaluation results under “Stakeholders Satisfaction (A3)” support this view. As shown in Figure 10, the satisfaction score of the private sector reached 69.19, which corresponds to a “High” level. Private sectors expressed satisfaction with the current operation, noting in articles published at the end of 2023 that the SPV had provided high-quality educational facilities and excellent operational services, achieving the strategic goal of transitioning from a construction enterprise to an urban operation enterprise. The satisfaction scores for the public sector and core asset users were 69.54 and 67.88, respectively—both reaching the “High” level, acknowledging that the SPV had provided comprehensive facilities for students and staff, creating a favorable teaching, research, and learning environment. However, campus users were dissatisfied with the SPV’s service issues, negatively impacting overall project performance. In addition, the case analysis further demonstrates that under the asset-classified operation model, the SPV needs to implement differentiated operational strategies. According to the suggestions provided in the satisfaction survey, the school authorities primarily recommend that the SPV enhance property services in the core asset areas, such as “improving the cleanliness of classrooms and office buildings” and “timely completion of repair services for offices and laboratories”. In contrast, students focus on the quality of various life services the SPV provides on campus, such as “promptly clearing trash from drinking water dispensers in the dormitories” and “establishing more diverse shops in the campus commercial area”.
Additionally, stakeholders may have particular needs during specific periods. The demand for online education surged during the COVID-19 pandemic [65]. This shift in demand led to a significant reduction or even a complete loss of revenue from offline user fees, placing tremendous financial pressure on the operators of education PPP projects. Although the pandemic has ended, some international schools or branch campuses continue to maintain online teaching models to address issues such as teacher shortages and the challenges of educational costs. These new demands have also brought new opportunities. For example, the need for online experimental teaching has opened up new directions for operators to provide educational support services. During the pandemic, the National Taipei University of China successfully conducted online experimental teaching for gynecology courses using VR technology [70]. Education PPP projects are often new campus developments, which require the provision of subject-specific experimental facilities and ongoing maintenance of these facilities during operations. After adopting online teaching, the operator only needs to provide remote connection equipment based on the existing laboratories in the old campus, enabling students in the new campus to complete experimental learning and operations through online platforms. This approach can significantly reduce laboratory maintenance costs and improve the operational efficiency of the project. The demand for online teaching has also accelerated the digitalization and intelligent transformation of schools’ office work, teaching, and management. In the future, operators of education PPP projects can further deepen the application of digital management technologies, using big data analysis and digital twin technology to monitor campus operations in real time. This approach will enhance management efficiency and effectively reduce operational costs.
In conclusion, during the operation stage of education PPPs, the SPV should fully take into account the varying needs of different stakeholders and formulate differentiated operational strategies accordingly. In the post-COVID-19 era, the SPV should seize the opportunities presented by digital teaching and management—while exploring online teaching support services, it should also promote the digitalization and intelligent transformation of various operational services to reduce operational costs and enhance management efficiency.

5.3. Limitations and Future Research

This study has several limitations. First, the evaluation model does not account for the internal relationships among evaluation factors, which may restrict the SPV’s ability to make targeted operational decision adjustments. Second, the selected indicators and data reflect only historical performance, limiting the applicability of the evaluation results and derived strategies to the specific operational context of that time. In reality, project operations are subject to dynamic variability. Facility conditions, the operational environment, and user demands can shift across different stages, as evidenced by school closures during the COVID-19 pandemic. Moreover, operational tasks may change due to amendments in concession agreements—such as the reassignment of cafeteria management observed in the case study—further complicating strategy development. These uncertainties may reduce the effectiveness of strategies based on static performance evaluations.
Future research on the performance of education PPP projects should focus on exploring the internal relationships among indicators and integrating forecasting or simulation technologies to better address the dynamic nature of project operations. This would provide more robust support for the formulation and adaptation of operational strategies. During the operational stage, a cyclical operational performance management approach should be established, including feedforward-operation strategy simulation, concurrent-operation quality monitoring, and feedback-operation performance evaluation, as shown in Figure 13. This approach will help the project operator continuously improve the operational management level and project performance throughout the entire operational stage.

6. Conclusions

This study developed a performance evaluation model for the operational stage of education PPP projects based on the Limited Cloud model and validated its effectiveness through a real case application. The main contributions are as follows: this study integrated the diverse needs of stakeholders in education PPP projects and the characteristics of “asset-classified operations” to refine the basic BSC framework. Based on this refined framework, it develops an operation performance evaluation indicator system specifically for education PPP projects. This system filled a gap in existing research and supported SPVs in implementing differentiated operational strategies. The performance evaluation model was constructed using the COWA-Critic-Game integrated weighting method and the Limited Cloud Model. Compared with existing evaluation models, this approach ensured that the combined weights accurately reflect the true importance of each indicator while effectively handling complex data. These advantages enabled the model to objectively evaluate the project’s operational performance and provided robust data support for the SPV’s operational decision-making. The model’s validity was verified through a case study, and four managerial insights were summarized based on the performance evaluation results through comprehensive discussion. Future research should explore the internal relationships among performance indicators and consider the dynamic nature of operations, thereby enabling simulation and real-time monitoring of operational strategies for educational PPP projects.

Supplementary Materials

The following supporting information can be downloaded at https://www.mdpi.com/article/10.3390/buildings15111833/s1, Table S1: RII Method’s Data; Table S2: COWA Method’s Data (After Sorting); Table S3: Critic Method’s Data; Table S4: Indicator Explanation.

Author Contributions

Conceptualization: J.M. and X.L.; Data curation: J.M.; Formal analysis: J.M.; Funding acquisition: X.L.; Investigation: J.M. and X.L.; Methodology: J.M.; Project administration: X.L.; Resources: X.L.; Software: J.M.; Supervision: X.L.; Validation: J.M.; Visualization: J.M.; Writing—original draft preparation: J.M.; Writing—review and editing: X.L. All authors have read and agreed to the published version of the manuscript.

Funding

This research received no external funding.

Institutional Review Board Statement

Ethics approval was not required for this study because it did not involve direct interaction with human participants, the collection of sensitive personal data, or any interventions that could pose a risk to individuals. Additionally, all participants were informed of the purpose of the survey and provided their consent before participation. The study relied exclusively on publicly available, anonymized data or observational data that did not require ethical review as per the guidelines of Shandong Jianzhu University.

Informed Consent Statement

Informed consent was obtained from all subjects involved in the study.

Data Availability Statement

The original contributions presented in this study are included in the article and Supplementary Materials. Further inquiries can be directed to the corresponding author.

Conflicts of Interest

The authors declare no conflicts of interest.

Abbreviations

The following abbreviations are used in this manuscript:
PPPPublic–private partnership
SPVSpecial purpose vehicle
RIIRelative Importance Indicator
COWACombined ordered weighted averaging
CRITICIntercriteria correlation

References

  1. Khallaf, R.; Kang, K.; Hastak, M.; Othman, K. Public–Private Partnerships for Higher Education Institutions in the United States. Buildings 2022, 12, 1888. [Google Scholar] [CrossRef]
  2. Caves, K.; Oswald-Egg, M.E. The Networked Role of Intermediaries in Education Governance and Public-Private Partnership. J. Educ. Policy 2024, 39, 40–63. [Google Scholar] [CrossRef]
  3. Fabre, A.; Straub, S. The Impact of Public–Private Partnerships (PPPs) in Infrastructure, Health, and Education. J. Econ. Lit. 2023, 61, 655–715. [Google Scholar] [CrossRef]
  4. Jiang, W.; Jiang, J.; Martek, I.; Jiang, W. Critical Risk Management Strategies for the Operation of Public–Private Partnerships: A Vulnerability Perspective of Infrastructure Projects. ECAM 2024. [Google Scholar] [CrossRef]
  5. The World Bank. Available online: https://Ppp.Worldbank.Org/ (accessed on 5 January 2025).
  6. Available online: https://saiindia.gov.in/en (accessed on 15 May 2025).
  7. Public Private Partnerships in Educational Governance: A Case Study of Bogota’s Concession Schools. Available online: https://www.Academia.Edu/24476781/Public_Private_Partnerships_in_Educational_GOVERNANCE_a_Case_Study_of_Bogotas_Concession_Schools (accessed on 15 May 2025).
  8. Wang, Y.; Liang, Y.; Li, C.; Zhang, X. Operation Performance Evaluation of Urban Rail Transit PPP Projects: Based on Best Worst Method and Large-Scale Group Evaluation Technology. Adv. Civ. Eng. 2021, 2021, 4318869. [Google Scholar] [CrossRef]
  9. Li, Z.; Wang, H. Exploring Risk Factors Affecting Sustainable Outcomes of Global Public–Private Partnership (PPP) Projects: A Stakeholder Perspective. Buildings 2023, 13, 2140. [Google Scholar] [CrossRef]
  10. Stafford, A.; Stapleton, P. The Impact of Hybridity on PPP Governance and Related Accountability Mechanisms: The Case of UK Education PPPs. AAAJ 2022, 35, 950–980. [Google Scholar] [CrossRef]
  11. Sajida; Kusumasari, B. Critical Success Factors of Public-Private Partnerships in the Education Sector. PAP 2023, 26, 309–320. [Google Scholar] [CrossRef]
  12. Ansari, A.H. Bridging the Gap? Evaluating the Effectiveness of Punjab’s Public–Private Partnership Programmes in Education. Int. J. Educ. Res. 2024, 125, 102325. [Google Scholar] [CrossRef]
  13. Hong, S.; Kim, T.K. Public–Private Partnership Meets Corporate Social Responsibility—The Case of H-JUMP School. Public Money Manag. 2018, 38, 297–304. [Google Scholar] [CrossRef]
  14. Vecchi, V.; Cusumano, N.; Casalini, F. Investigating the Performance of PPP in Major Healthcare Infrastructure Projects: The Role of Policy, Institutions, and Contracts. Oxf. Rev. Econ. Policy 2022, 38, 385–401. [Google Scholar] [CrossRef]
  15. Guo, Y.; Chen, C.; Luo, X.; Martek, I. Determining Concessionary Items for “Availability Payment Only” PPP Projects: A Holistic Framework Integrating Value-For-Money and Social Values. J. Civ. Eng. Manag. 2024, 30, 149–167. [Google Scholar] [CrossRef]
  16. Liu, B.; Ji, J.; Chen, J.; Qi, M.; Li, S.; Tang, L.; Zhang, K. Quantitative VfM Evaluation of Urban Rail Transit PPP Projects Considering Social Benefit. Res. Transp. Bus. Manag. 2023, 49, 101015. [Google Scholar] [CrossRef]
  17. Lagzi, M.D.; Sajadi, S.M.; Taghizadeh-Yazdi, M. A Hybrid Stochastic Data Envelopment Analysis and Decision Tree for Performance Prediction in Retail Industry. J. Retail. Consum. Serv. 2024, 80, 103908. [Google Scholar] [CrossRef]
  18. Sadeghi, M.; Mahmoudi, A.; Deng, X.; Luo, M. A Novel Performance Measurement of Innovation and R&D Projects for Driving Digital Transformation in Construction Using Ordinal Priority Approach. KSCE J. Civ. Eng. 2024, 28, 5427–5440. [Google Scholar]
  19. Carnero, M.C.; Martínez-Corral, A.; Cárcel-Carrasco, J. Fuzzy Multicriteria Evaluation and Trends of Asset Management Performance: A Case Study of Spanish Buildings. Case Stud. Constr. Mater. 2023, 19, e02660. [Google Scholar] [CrossRef]
  20. Du, J.; Wang, W.; Gao, X.; Hu, M.; Jiang, H. Sustainable operations: A systematic operational performance evaluation framework for public–private partnership transportation infrastructure projects. Sustainability 2023, 15, 7951. [Google Scholar] [CrossRef]
  21. Anjomshoa, E. Key Performance Indicators of Construction Companies in Branding Products and Construction Projects for Success in a Competitive Environment in Iran. ECAM 2024, 31, 2151–2175. [Google Scholar] [CrossRef]
  22. Assaf, G.; Assaad, R.H. Developing a Scoring Framework to Assess the Feasibility of the Design–Build Project Delivery Method for Bundled Projects. J. Manag. Eng. 2024, 40, 04024058. [Google Scholar] [CrossRef]
  23. Tabejamaat, S.; Ahmadi, H.; Barmayehvar, B. Boosting Large-scale Construction Project Risk Management: Application of the Impact of Building Information Modeling, Knowledge Management, and Sustainable Practices for Optimal Productivity. Energy Sci. Eng. 2024, 12, 2284–2296. [Google Scholar] [CrossRef]
  24. Jiang, F.; Lyu, Y.; Zhang, Y.; Guo, Y. Research on the Differences between Risk-Factor Attention and Risk Losses in PPP Projects. J. Constr. Eng. Manag. 2023, 149, 04023090. [Google Scholar] [CrossRef]
  25. Lu, Y.; Nie, C.; Zhou, D.; Shi, L. Research on Programmatic Multi-Attribute Decision-Making Problem: An Example of Bridge Pile Foundation Project in Karst Area. PLoS ONE 2023, 18, e0295296. [Google Scholar] [CrossRef] [PubMed]
  26. Xu, J.; Zhang, X. Risk Assessment Method and Application of Urban River Ecological Governance Project Based on Cloud Model Improvement. Adv. Civ. Eng. 2023, 2023, 8797522. [Google Scholar] [CrossRef]
  27. Xu, Z.; Wang, X.; Xiao, Y.; Yuan, J. Modeling and Performance Evaluation of PPP Projects Utilizing IFC Extension and Enhanced Matter-Element Method. ECAM 2020, 27, 1763–1794. [Google Scholar] [CrossRef]
  28. Jiao, H.; Cao, Y.; Li, H. Performance Evaluation of Urban Water Environment Treatment PPP Projects Based on Cloud Model and OWA Operator. Buildings 2023, 13, 417. [Google Scholar] [CrossRef]
  29. Zhang, Y.; He, N.; Li, Y.; Chen, Y.; Wang, L.; Ran, Y. Risk Assessment of Water Environment Treatment PPP Projects Based on a Cloud Model. Discret. Dyn. Nat. Soc. 2021, 2021, 1–15. [Google Scholar] [CrossRef]
  30. Wu, M.; Liu, Y.; Ye, Y.; Luo, B. Assessment of Clean Production Level in Phosphate Mining Enterprises: Based on the Fusion Group Decision Weight and Limited Interval Cloud Model. J. Clean. Prod. 2024, 456, 142398. [Google Scholar] [CrossRef]
  31. Zhang, J.; Feng, J.; Zhang, K.; Han, X. Research on the Value Improvement Model of Private Parties as “Investor–Builder” Dual-Role Entity in Major River Green Public–Private Partnership Projects. Buildings 2023, 13, 2881. [Google Scholar] [CrossRef]
  32. Geng, L.; Herath, N.; Hui, F.K.P.; Liu, X.; Duffield, C.; Zhang, L. Evaluating Uncertainties to Deliver Enhanced Service Performance in Education PPPs: A Hierarchical Reliability Framework. ECAM 2023, 30, 4464–4485. [Google Scholar] [CrossRef]
  33. Zhang, Q.; Iqbal, S.; Shahzad, F. Role of Environmental, Social, and Governance (ESG) Investment and Natural Capital Stocks in Achieving Net-Zero Carbon Emission. J. Clean. Prod. 2024, 478, 143919. [Google Scholar] [CrossRef]
  34. Akomea-Frimpong, I.; Jin, X.; Osei-Kyei, R. A Holistic Review of Research Studies on Financial Risk Management in Public–Private Partnership Projects. ECAM 2021, 28, 2549–2569. [Google Scholar] [CrossRef]
  35. Ghorbany, S.; Noorzai, E.; Yousefi, S. BIM-Based Solution to Enhance the Performance of Public-Private Partnership Construction Projects Using Copula Bayesian Network. Expert Syst. Appl. 2023, 216, 119501. [Google Scholar] [CrossRef]
  36. Zhang, H.; Shi, S.; Zhao, F.; Ye, X.; Qi, H. A Study on the Impact of Team Interdependence on Cooperative Performance in Public–Private Partnership Projects: The Moderating Effect of Government Equity Participation. Sustainability 2023, 15, 12684. [Google Scholar] [CrossRef]
  37. Gunduz, M.; Naji, K.K.; Maki, O. Evaluating the Performance of Campus Facility Management through Structural Equation Modeling Based on Key Performance Indicators. J. Manag. Eng. 2024, 40, 04023056. [Google Scholar] [CrossRef]
  38. Menichelli, F.; Bullock, K.; Garland, J.; Allen, J. The Organisation and Operation of Policing on University Campuses: A Case Study. Criminol. Crim. Justice 2024, 17488958241254444. [Google Scholar] [CrossRef]
  39. Yuan, J.; Ji, W.; Guo, J.; Skibniewski, M.J. Simulation-Based Dynamic Adjustments of Prices and Subsidies for Transportation PPP Projects Based on Stakeholders’ Satisfaction. Transportation 2019, 46, 2309–2345. [Google Scholar] [CrossRef]
  40. Liu, W.; Wang, X.; Jiang, S. Decision Analysis of PPP Project’s Parties Based on Deep Consumer Participation. PLoS ONE 2024, 19, e0299842. [Google Scholar] [CrossRef]
  41. Hou, W.; Wang, L. Research on the Refinancing Capital Structure of Highway PPP Projects Based on Dynamic Capital Demand. ECAM 2022, 29, 2047–2072. [Google Scholar] [CrossRef]
  42. Li, X.; Liu, Y.; Li, M.; Jim, C.Y. A Performance Evaluation System for PPP Sewage Treatment Plants at the Operation-Maintenance Stage. KSCE J. Civ. Eng. 2023, 27, 1423–1440. [Google Scholar] [CrossRef]
  43. Flores-Salgado, B.; Gonzalez-Ambriz, S.-J.; Martínez-García-Moreno, C.-A.; Beltrán, J. IoT-Based System for Campus Community Security. Internet Things 2024, 26, 101179. [Google Scholar] [CrossRef]
  44. Pan, H.; Pan, Y.; Liu, X. Identifying the Critical Factors Affecting the Operational Performance of Characteristic Healthcare Town PPP Projects: Evidence from China. J. Infrastruct. Syst. 2023, 29, 05023007. [Google Scholar] [CrossRef]
  45. He, M.; Hu, Y.; Wen, Y.; Wang, X.; Wei, Y.; Sheng, G.; Wang, G. The Impacts of Forest Therapy on the Physical and Mental Health of College Students: A Review. Forests 2024, 15, 682. [Google Scholar] [CrossRef]
  46. Seva, R.R.; Tangsoc, J.C.; Madria, W.F. Determinants of University Students’ Safety Behavior during a Pandemic. Int. J. Disaster Risk Reduct. 2024, 106, 104441. [Google Scholar] [CrossRef]
  47. Guo, Y.; Su, Y.; Chen, C.; Martek, I. Inclusion of “Managing Flexibility” Valuations in the Pricing of PPP Projects: A Multi-Objective Decision-Making Method. ECAM 2024, 31, 4562–4584. [Google Scholar] [CrossRef]
  48. Nose, M. Evaluating Fiscal Supports on the Public–Private Partnerships: A Hidden Risk for Contract Survival. Oxf. Econ. Pap. 2025, gpaf001. [Google Scholar] [CrossRef]
  49. Li, J.; Liu, B.; Wang, D.; Casady, C.B. The Effects of Contractual and 15Relational Governance on Public-private Partnership Sustainability. Public Adm. 2024, 102, 1418–1449. [Google Scholar] [CrossRef]
  50. Wang, J.; Luo, L.; Sa, R.; Zhou, W.; Yu, Z. A Quantitative Analysis of Decision-Making Risk Factors for Mega Infrastructure Projects in China. Sustainability 2023, 15, 15301. [Google Scholar] [CrossRef]
  51. Abdul Nabi, M.; Assaad, R.H.; El-adaway, I.H. Modeling and Understanding Dispute Causation in the US Public–Private Partnership Projects. J. Infrastruct. Syst. 2024, 30, 04023035. [Google Scholar] [CrossRef]
  52. Nemati, M.A.; Rastaghi, Z. Quality Assessment of On-Campus Student Housing Facilities through a Holistic Post-Occupancy Evaluation (A Case Study of Iran). Archit. Eng. Des. Manag. 2024, 20, 719–740. [Google Scholar] [CrossRef]
  53. Yoon, B.; Jun, K. Effects of Campus Dining Sustainable Practices on Consumers’ Perception and Behavioral Intention in the United States. Nutr. Res. Pract. 2023, 17, 1019. [Google Scholar] [CrossRef]
  54. Li, J.; Zhang, C.; Cai, X.; Peng, Y.; Liu, S.; Lai, W.; Chang, Y.; Liu, Y.; Yu, L. The Relation between Barrier-Free Environment Perception and Campus Commuting Satisfaction. Front. Public Health 2023, 11, 1294360. [Google Scholar] [CrossRef] [PubMed]
  55. Sampson, C.S.; Maberry, M.D.; Stilley, J.A. Football Saturday: Are Collegiate Football Stadiums Adequately Prepared to Handle Spectator Emergencies? J. Sports Med. Phys. Fit. 2023, 64, 73–77. [Google Scholar] [CrossRef] [PubMed]
  56. Michalski, L.; Low, R.K.Y. Determinants of Corporate Credit Ratings: Does ESG Matter? Int. Rev. Financ. Anal. 2024, 94, 103228. [Google Scholar] [CrossRef]
  57. Spohr, J.; Wikström, K.; Ronikonmäki, N.-M.; Lepech, M.; In, S.Y. Are Private Investors Overcompensated in Infrastructure Projects? Transp. Policy 2024, 152, 1–8. [Google Scholar] [CrossRef]
  58. Xiahou, X.; Tang, L.; Yuan, J.; Zuo, J.; Li, Q. Exploring Social Impacts of Urban Rail Transit PPP Projects: Towards Dynamic Social Change from the Stakeholder Perspective. Environ. Impact Assess. Rev. 2022, 93, 106700. [Google Scholar] [CrossRef]
  59. Bu, Z.; Liu, J.; Zhang, X. Collaborative Government-Public Efforts in Driving Green Technology Innovation for Environmental Governance in PPP Projects: A Study Based on Prospect Theory. Kybernetes 2025, 54, 1684–1715. [Google Scholar] [CrossRef]
  60. Park, S.; Cho, K.; Choi, M. A Sustainability Evaluation of Buildings: A Review on Sustainability Factors to Move towards a Greener City Environment. Buildings 2024, 14, 446. [Google Scholar] [CrossRef]
  61. Li, W.-W.; Gu, X.-B.; Yang, C.; Zhao, C. Level Evaluation of Concrete Dam Fractures Based on Game Theory Combination Weighting-Normal Cloud Model. Front. Mater. 2024, 11, 1344760. [Google Scholar] [CrossRef]
  62. Huang, L.; Lv, W.; Huang, Q.; Zhang, H.; Jin, S.; Chen, T.; Shen, B. Transforming Medical Equipment Management in Digital Public Health: A Decision-Making Model for Medical Equipment Replacement. Front. Med. 2024, 10, 1239795. [Google Scholar] [CrossRef]
  63. Das, U.; Behera, B. Geospatial Assessment of Ecological Vulnerability of Fragile Eastern Duars Forest Integrating GIS-Based AHP, CRITIC and AHP-TOPSIS Models. Geomat. Nat. Hazards Risk 2024, 15, 2330529. [Google Scholar] [CrossRef]
  64. Liu, Y.; Zhang, B.; Qin, J.; Zhu, Q.; Lyu, S. Integrated Performance Assessment of Prefabricated Component Suppliers Based on a Hybrid Method Using Analytic Hierarchy Process–Entropy Weight and Cloud Model. Buildings 2024, 14, 3872. [Google Scholar] [CrossRef]
  65. Viner, R.M.; Russell, S.J.; Croker, H.; Packer, J.; Ward, J.; Stansfield, C.; Mytton, O.; Bonell, C.; Booy, R. School Closure and Management Practices during Coronavirus Outbreaks Including COVID-19: A Rapid Systematic Review. Lancet Child Adolesc. Health 2020, 4, 397–404. [Google Scholar] [CrossRef] [PubMed]
  66. Bugalia, N.; Maemura, Y.; Dasari, R.; Patidar, M. A system dynamics model for effective management strategies of High-Speed Railway (HSR) projects involving private sector participation. Transp. Res. Part A Policy Pract. 2023, 175, 103779. [Google Scholar] [CrossRef]
  67. Helmy, R.; Khourshed, N.; Wahba, M.; Bary, A.A.E. Exploring Critical Success Factors for Public Private Partnership Case Study: The Educational Sector in Egypt. J. Open Innov. Technol. Mark. Complex. 2020, 6, 142. [Google Scholar] [CrossRef]
  68. Ramu, P.; Osman, M.; Abdul Mutalib, N.A.; Aljaberi, M.A.; Lee, K.-H.; Lin, C.-Y.; Hamat, R.A. Validity and Reliability of a Questionnaire on the Knowledge, Attitudes, Perceptions and Practices toward Food Poisoning among Malaysian Secondary School Students: A Pilot Study. Healthcare 2023, 11, 853. [Google Scholar] [CrossRef]
  69. Reyes, G.A.; Zagorsky, J.; Lin, Y.; Prescott, M.P.; Stasiewicz, M.J. Quantitative Modeling of School Cafeteria Share Tables Predicts Reduced Food Waste and Manageable Norovirus-Related Food Safety Risk. Microb. Risk Anal. 2022, 22, 100229. [Google Scholar] [CrossRef]
  70. Chang, C.-Y.; Panjaburee, P.; Chang, S.-C. Effects of Integrating Maternity VR-Based Situated Learning into Professional Training on Students’ Learning Performances. Interact. Learn. Environ. 2022, 32, 2121–2135. [Google Scholar] [CrossRef]
Figure 1. The framework of the research method.
Buildings 15 01833 g001
Figure 2. Characteristics of the questionnaire sample data.
Buildings 15 01833 g002
Figure 3. Performance evaluation indicator system for the operation stage of education PPP projects.
Buildings 15 01833 g003
Figure 4. Location and project scope of SDJZU (Yantai).
Buildings 15 01833 g004
Figure 5. Campus facilities: (a) library; (b) classroom; (c) laboratory; (d) cafeteria.
Buildings 15 01833 g005
Figure 6. Evaluation standard cloud.
Buildings 15 01833 g006
Figure 7. Current ratio indicator score.
Buildings 15 01833 g007
Figure 8. Power distribution system management indicator score.
Buildings 15 01833 g008
Figure 9. Cafeteria service satisfaction indicator score.
Buildings 15 01833 g009
Figure 10. Second-Level and First-Level indicator scores.
Buildings 15 01833 g010
Figure 11. First-Level indicator weight.
Buildings 15 01833 g011
Figure 12. The Second-Level indicator weight in A2.
Buildings 15 01833 g012
Figure 13. Operation performance management roadmap for PPP projects.
Buildings 15 01833 g013
Table 1. Preliminary performance evaluation indicator system.
First-Level ASecond-Level BThird-Level CSource
Financial
capability A1
Solvency B1Current ratio C1-1[20,34,35]
Assets–liability ratio C1-2
Profitability B2Total assets turnover C2-1
Input–output ratio C2-2
Development capability B3Capital accumulation ratio C3-1
Revenue growth ratio C3-2
Project operation
management A2
Organization management
B4
Institutional framework C4-1[3,8,36,37,38]
Management system C4-2
Information management C4-3
Human resource management C4-4
Corporate culture C4-5
Buildings and facilities
management B5
Civil structure management C5-1[19,20,39,40]
Public facility management C5-2
Equipment room management C5-3
Power supply system management C5-4
Weak current system management C5-5
Elevator system management C5-6
Water supply and drainage system
management C5-7
HVAC system management C5-8
Fire protection system management C5-9
Security and emergency
management B6
Access and monitoring management C6-1[37,41,42,43]
Inspection management C6-2
Parking management C6-3
Emergency plan C6-4
Emergency drill C6-5
Environmental and sanitary management B7Cleaning management C7-1[39,44,45,46]
Garbage disposal C7-2
Landscape maintenance C7-3
Disinfection management C7-4
Health management C7-5
Customer service management B8Service system digitization rate C8-1[9,32,37]
User complaint management C8-2
Employee service quality C8-3
Timeliness of service C8-4
Campus activities management C8-5
Fee management B9Integrity of the pricing mechanism C9-1[39,47]
Flexibility of the price adjustment
mechanism C9-2
Cooperation and strategic
management B10
Relational governance C10-1[41,44,48,49,50,51]
Contractual governance C10-2
Integrity of conflict resolution
mechanism C10-3
Integrity of refinancing strategy C10-4
Stakeholders’
satisfaction A3
Non-core asset user
satisfaction B11
Cafeteria service satisfaction C11-1[32,52,53,54,55]
Dormitory service satisfaction C11-2
Commercial areas service satisfaction C11-3
Commuting satisfaction C11-4
Core asset user satisfaction
B12
Property service charges satisfaction C12-1[37,55]
Special times service satisfaction C12-2
Property service quality satisfaction C12-3
Private sector satisfaction
B13
Comprehensive benefits for the SPV C13-1[56,57]
Realization of strategic plan C13-2
Public sector satisfaction
B14
Achievement of social benefits C14-1[58,59]
Contract fulfillment C14-2
External impacts
of the project A4
Economic effects impact B15Promote economic development C15-1[53,56,60]
Social effects impact B16Offer employment opportunities C16-1
Environmental effects Energy conservation and emission
impact B17reduction C17-1
Table 2. Reasoning relationship of the quantitative evaluation set.
Quantitative Evaluation SetQualitative Comments
Excellent (1.75, 0.083, 0.0008)Extremely High (90, 3.3, 0.03)
Good (1.25, 0.083, 0.0008)High (70, 3.3, 0.03)
Average (0.75, 0.083, 0.0008)Medium (50, 3.3, 0.03)
Poor (0.4, 0.033, 0.0003)Low (30, 3.3, 0.03)
Very Poor (0.15, 0.05, 0.0005)Extremely Low (10, 3.3, 0.03)
Table 3. The weights and scores of the Third-Level indicators.
IndicatorIndicator ScoreWeightIndicatorIndicator ScoreWeight
C1-1720.4955C8-1850.3355
C1-269.300.5045C8-262.70.3506
C2-176.200.5142C8-379.40.3139
C2-267.800.4858C9-165.40.4879
C3-165.100.5098C9-265.30.5121
C3-2~0.4902C10-177.650.2085
C4-171.50.2477C10-275.850.2798
C4-272.10.1919C10-3770.25
C4-371.70.2204C10-476.10.2618
C4-472.750.2371C11-157.60.2281
C4-560.000.1956C11-266.920.2499
C5-1810.1094C11-363.60.2324
C5-2800.1225C11-463.20.2894
C5-380.80.1067C12-167.980.4688
C5-481.70.0991C12-267.800.5312
C5-580.650.0951C13-169.30.5069
C5-681.450.1312C13-269.080.4931
C5-781.250.0902C14-168.80.4909
C5-880.60.116C14-270.270.5091
C5-9810.1296C15-1820.3368
C6-180.850.3111C16-1800.3278
C6-2720.2315C17-176.40.3354
C6-371.90.3223
C6-41000.2466
C7-168.650.1604
C7-279.250.1826
C7-371.950.1797
C7-4720.2545
C7-579.250.223
Table 4. Evaluation sets of matter-element method and fuzzy comprehensive evaluation.
Performance Evaluation MethodsEvaluation Set
Matter-Element Method{Extremely High, High, Medium, Low, Extremely Low}
Fuzzy Comprehensive Evaluation{Extremely High (80–100), High (60–80), Medium (40–60), Low (20–40), Extremely Low (0–20)}
Table 5. Evaluation results.
Performance Evaluation MethodsScore/MembershipPerformance Level
Matter-Element Method{−0.124, 0.038, −0.353, −0.566, −0.679}High
Fuzzy Comprehensive Evaluation78.84High
The Proposed Method73.14High
Disclaimer/Publisher’s Note: The statements, opinions and data contained in all publications are solely those of the individual author(s) and contributor(s) and not of MDPI and/or the editor(s). MDPI and/or the editor(s) disclaim responsibility for any injury to people or property resulting from any ideas, methods, instructions or products referred to in the content.

