
A Model Based on Neural Network to Predict Surface Settlement During Subway Station Construction: A Case Study of the Dongba-Zhongjie Station in Beijing, China


Abstract
1. Introduction
2. Project Review
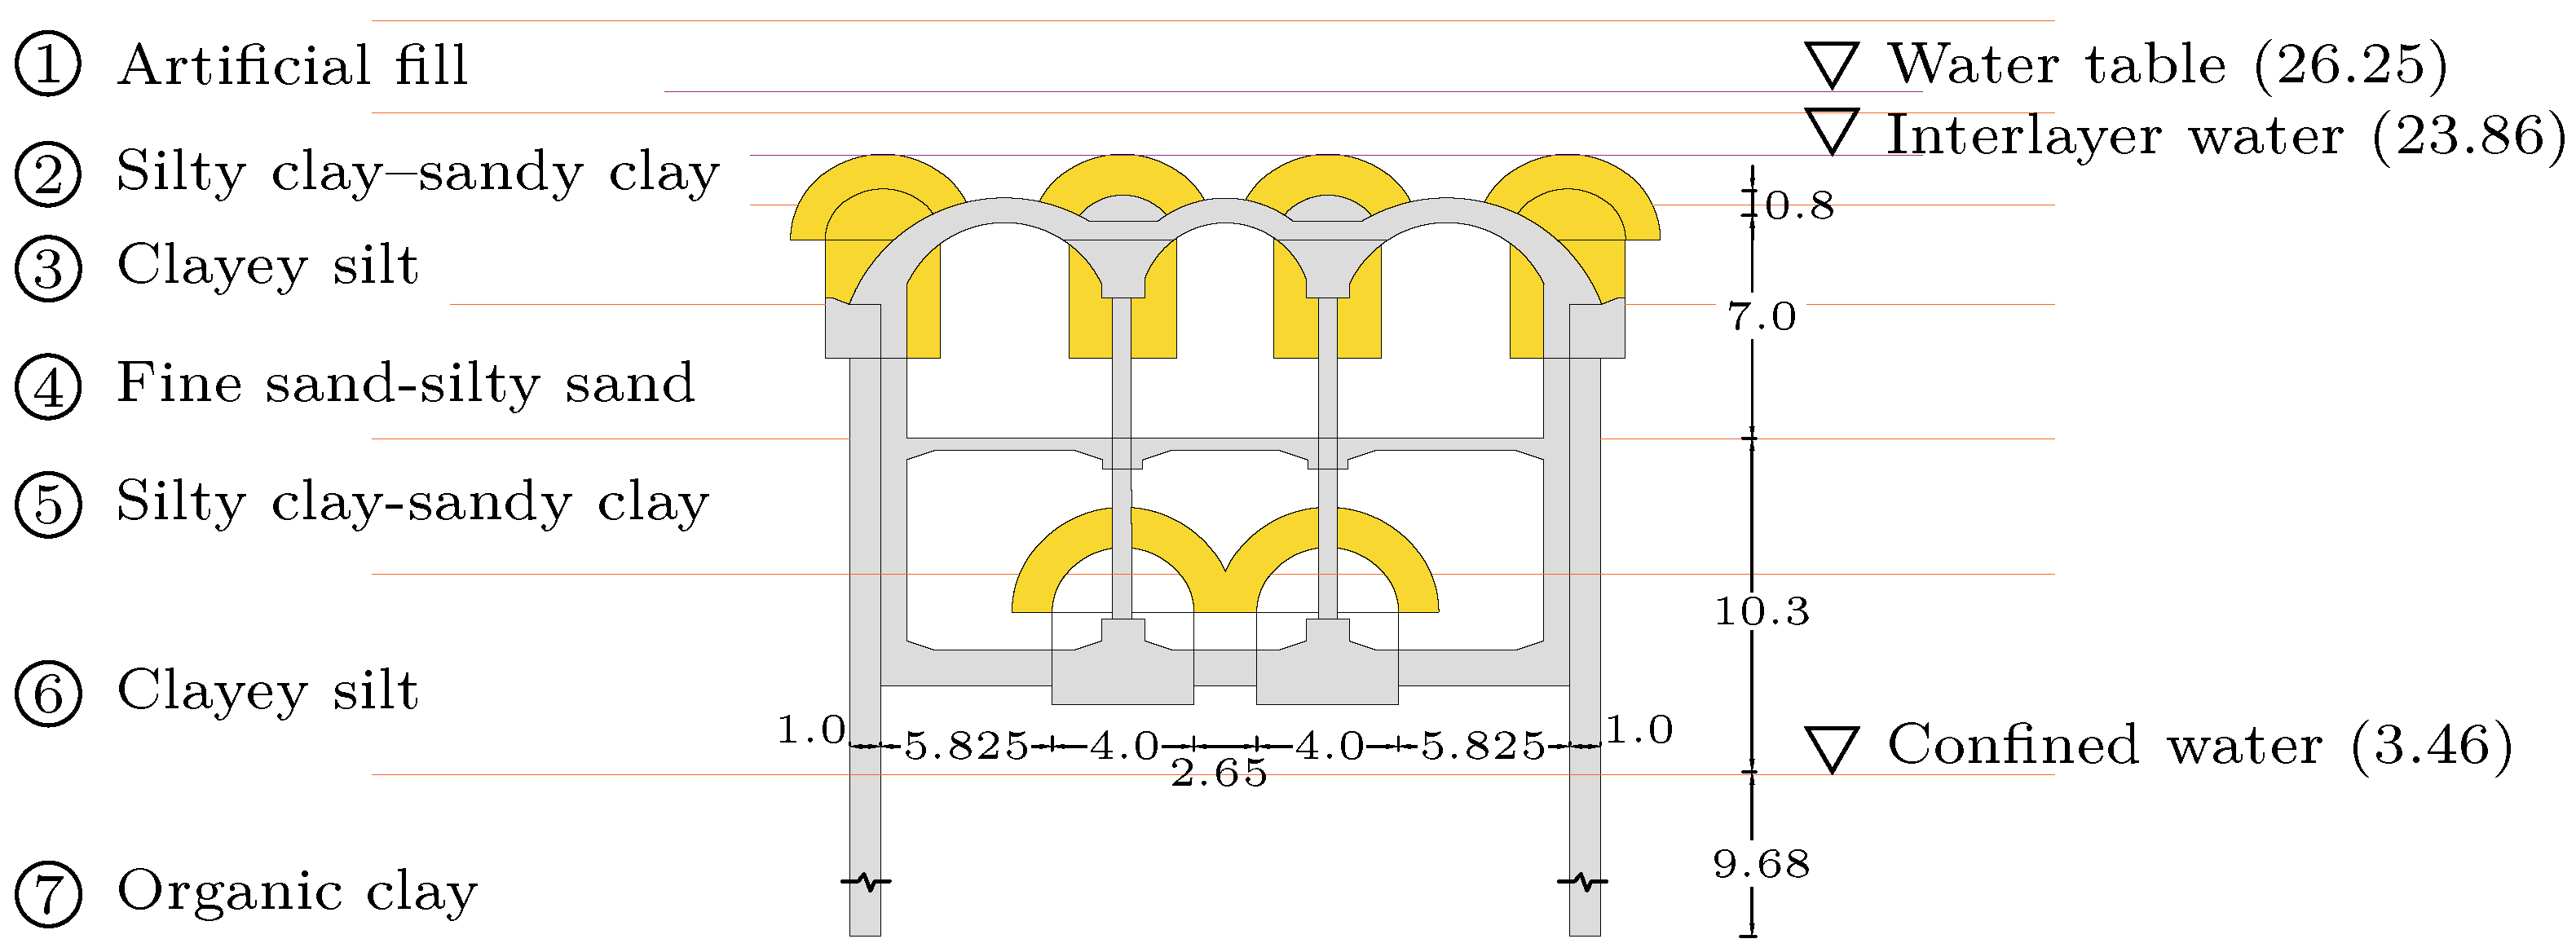
2.1. Station Design
2.2. Engineering and Hydrogeological Conditions
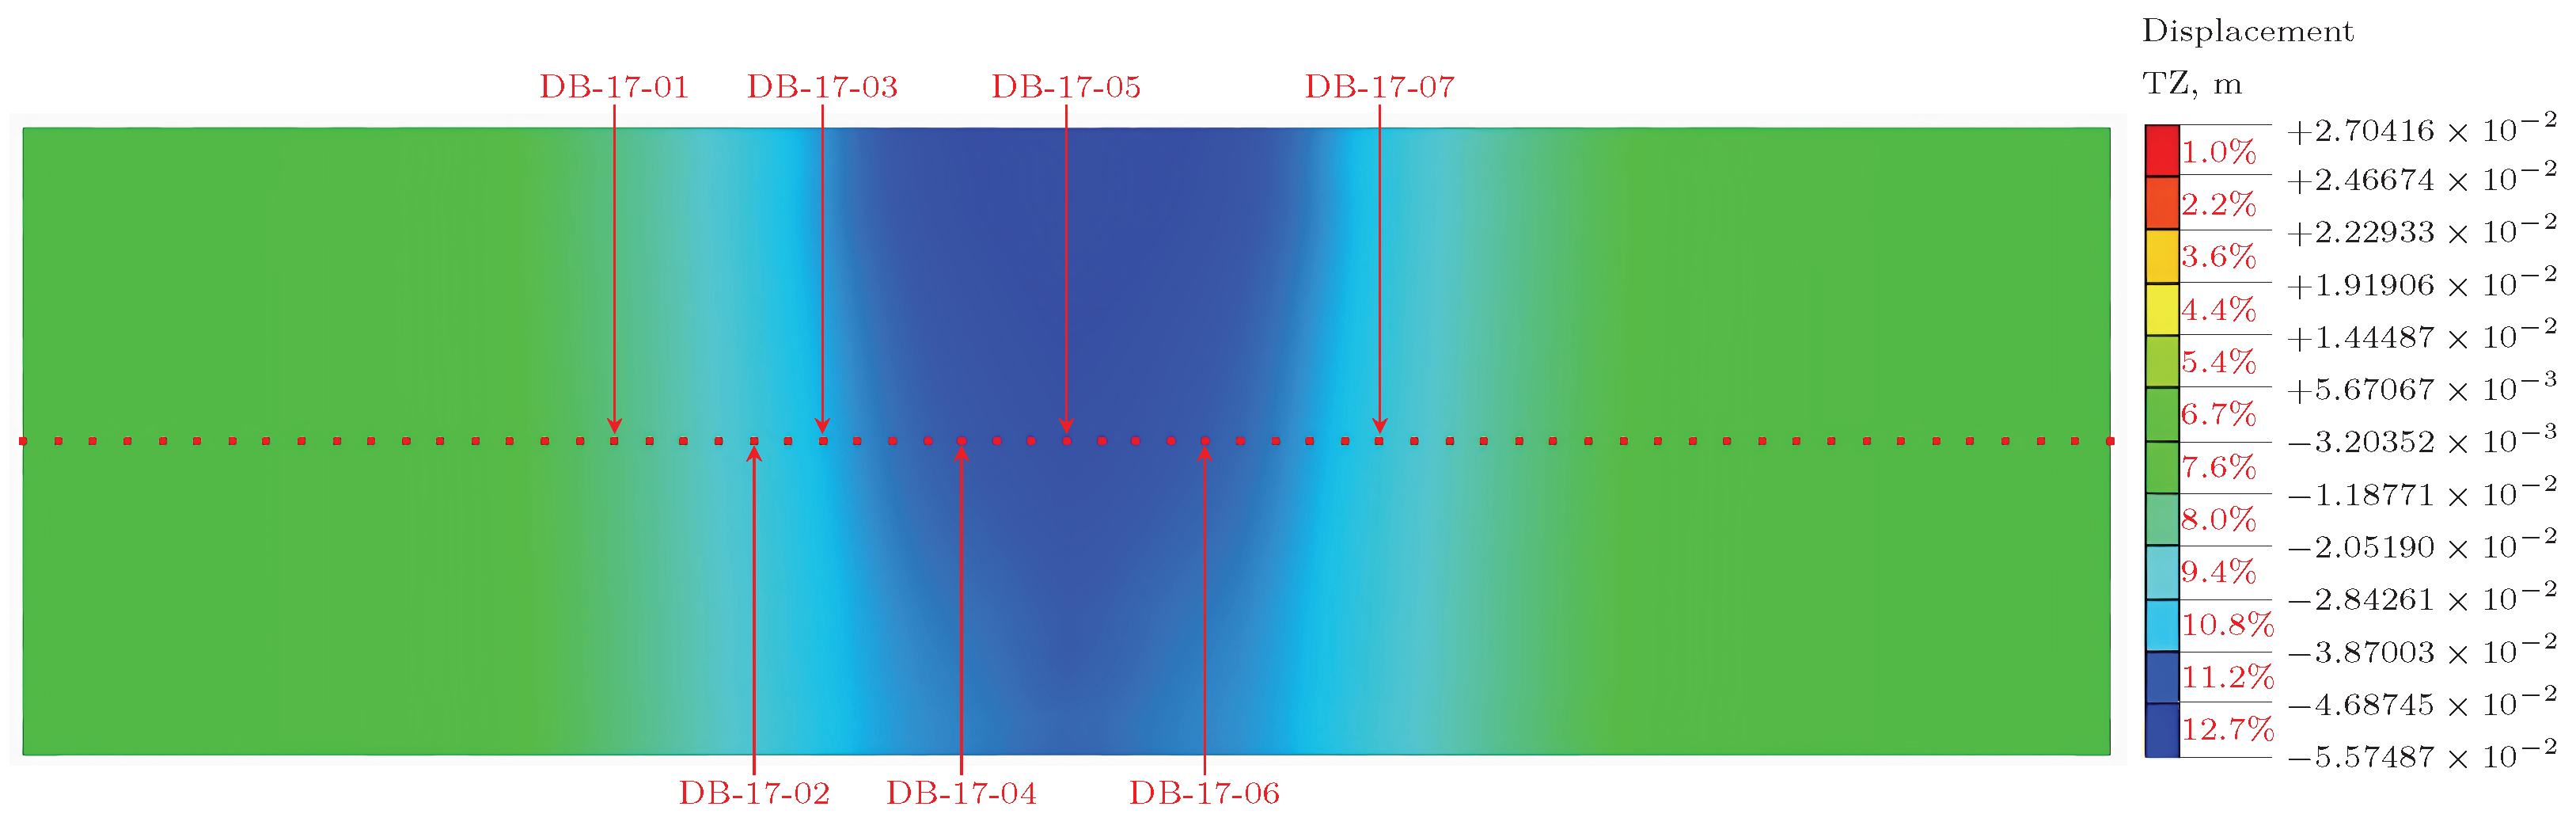
2.3. Surface Settlement Layout
3. Settlement Prediction in the Construction Process
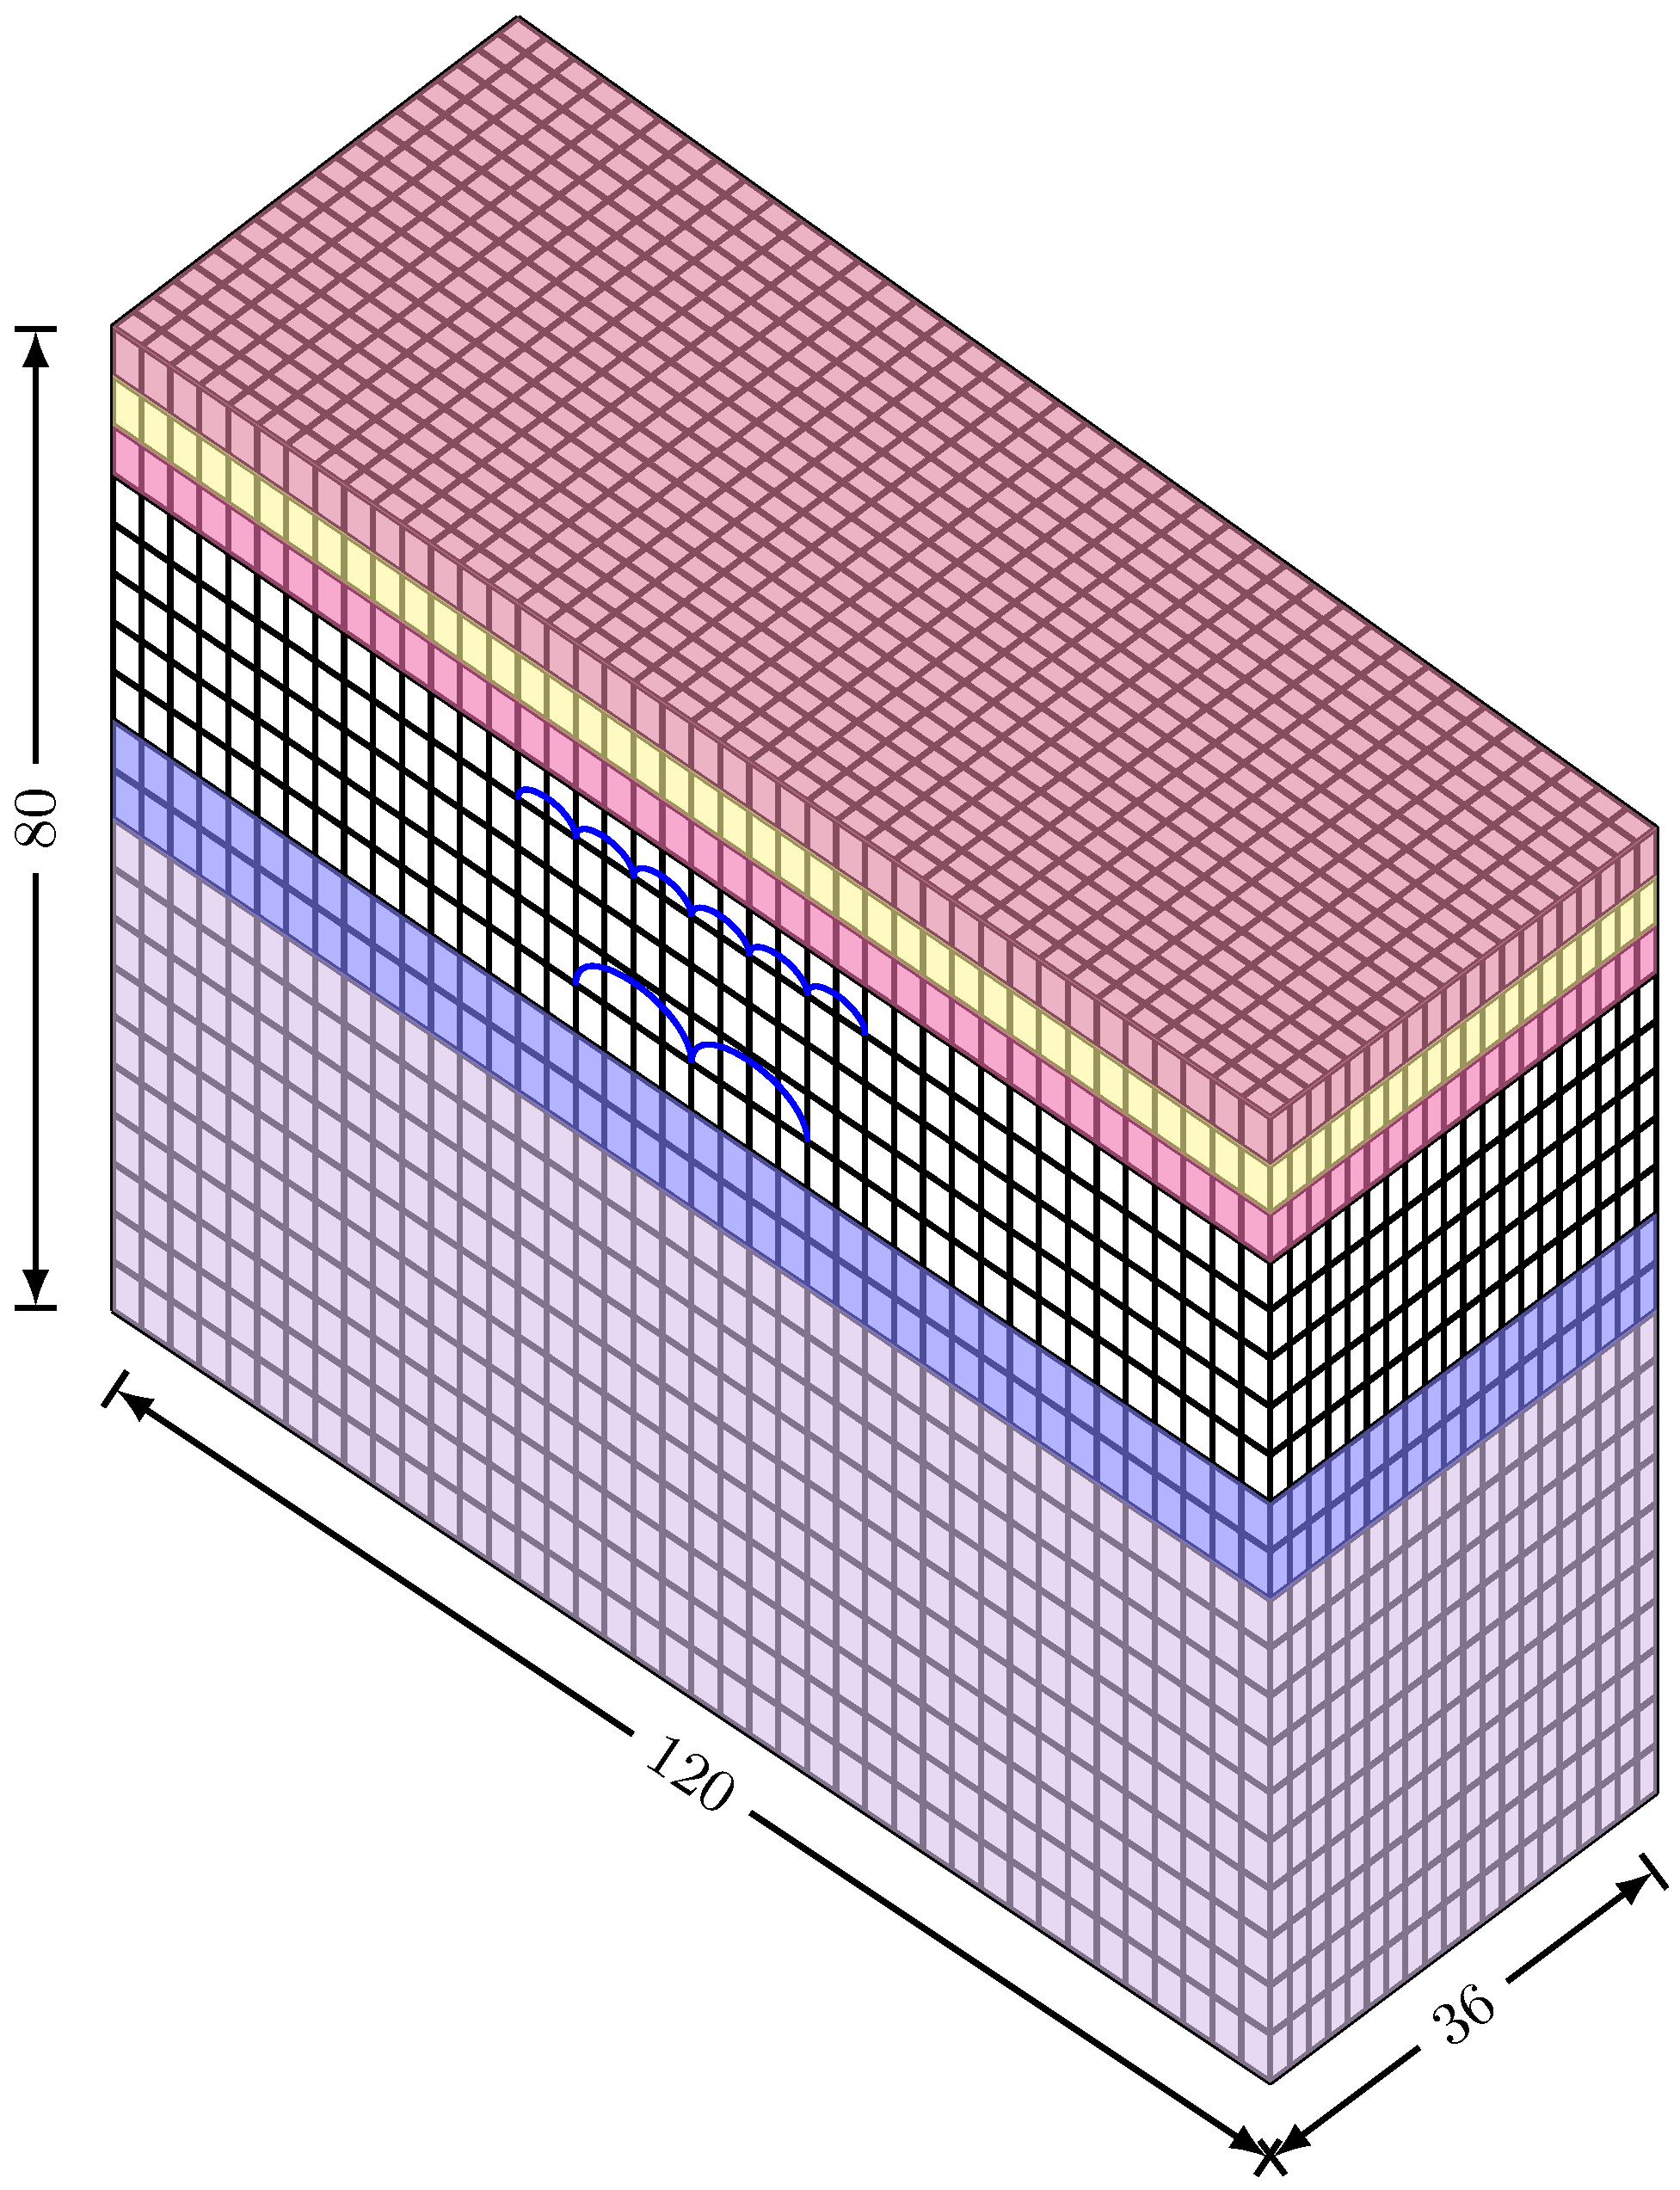
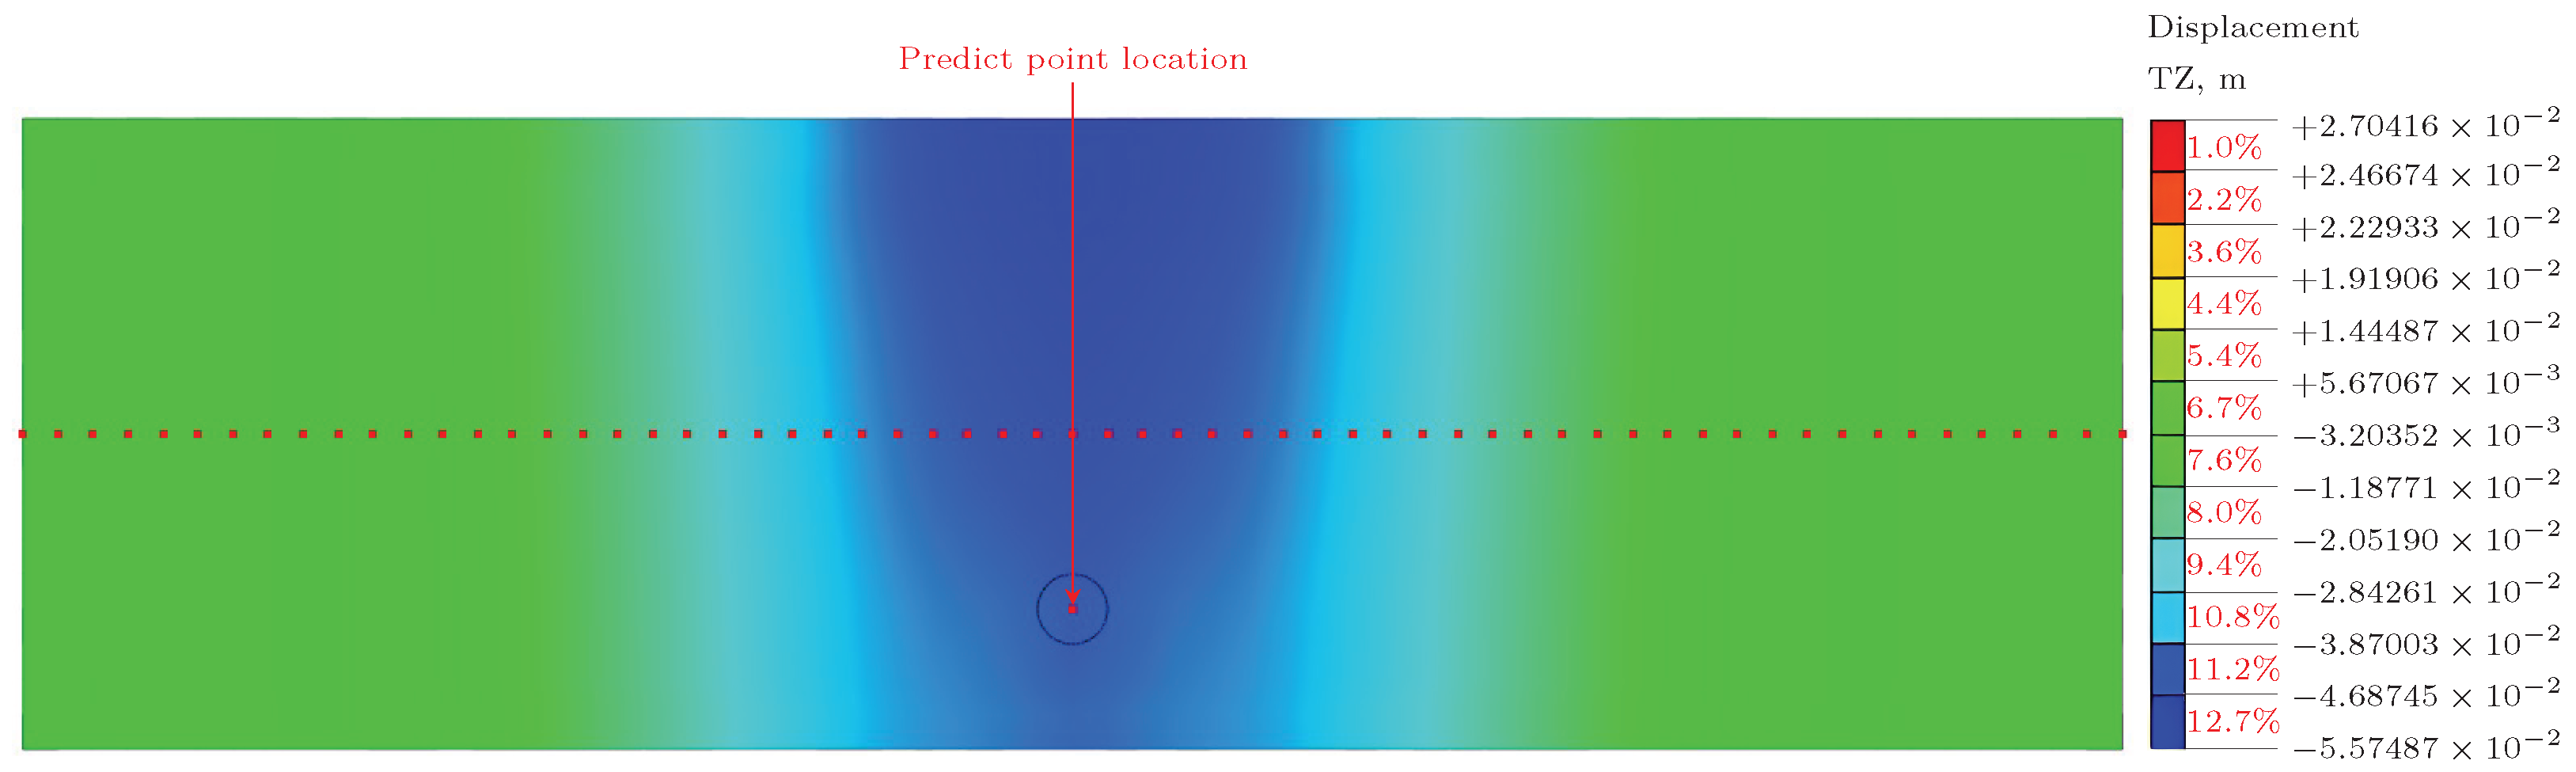
3.1. Finite Element Modeling
3.2. Neural Network Prediction Model with Equal Time Intervals
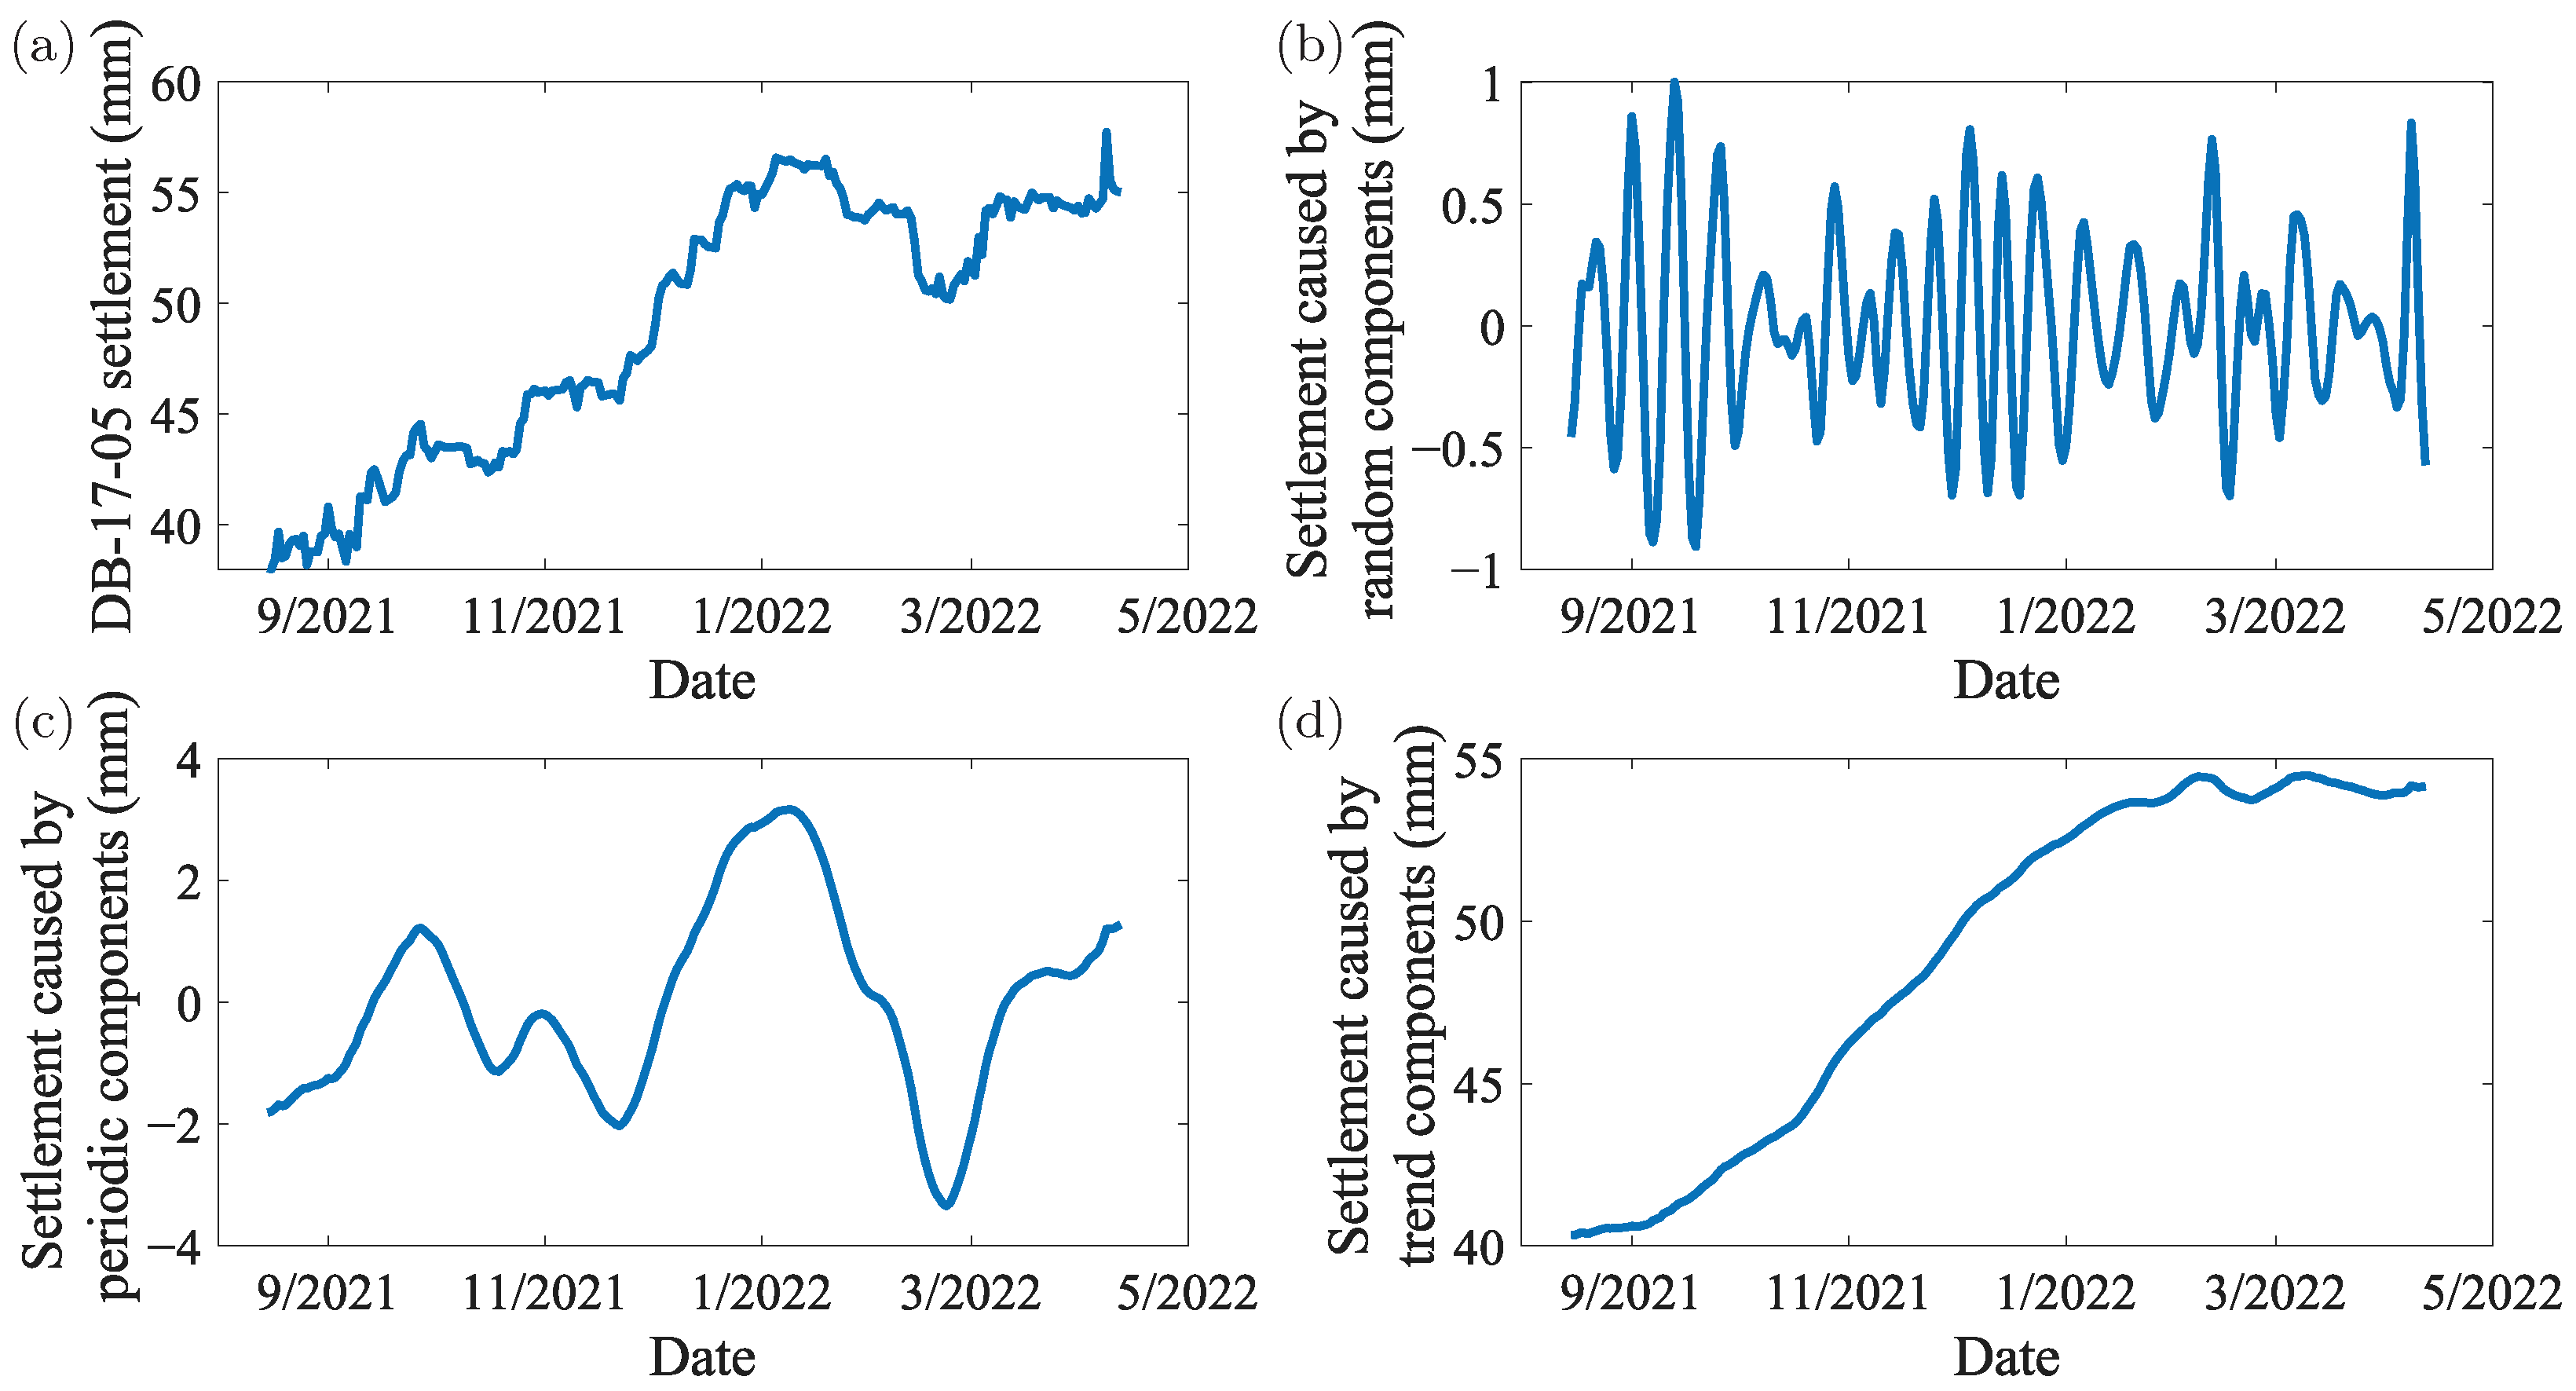
3.3. VMD Decomposition Model
- (1)
- Formulation of the Variational ProblemThe objective is to decompose the signal into k modes , where each mode has a center frequency and the narrowest possible bandwidth. The corresponding optimization problem is defined as follows:where the corresponding constraint condition is:where represents the kth modal component in the time domain; is the center frequency of the kth mode; denotes the time derivative; is the Dirac delta function; j is the imaginary unit; ∗ represents convolution; denotes the Hilbert transform of to obtain an analytical signal; and represents the demodulation of the analyzed signal to base band by shifting its center frequency to zero.
- (2)
- Expansion of the Lagrangian FunctionTo construct an augmented Lagrangian function , a Lagrange multiplier and a quadratic penalty term are introduced:where is the regularization parameter that balances the trade-off between the bandwidth term and the reconstruction error. is the Lagrange multiplier in the time domain, which enforces the constraint conditions more strictly. represents the inner product operation, i.e., .
- (3)
- Alternating Direction Method of Multipliers (ADMM)Variables are updated using frequency domain transformation and alternating optimization:
- (a)
- Updating the Mode :In the frequency domain, with and fixed, the following problem is solved:where , , and are the Fourier transforms of , , and , respectively, where represents the strength of the bandwidth constraint.
- (b)
- Update the Center Frequency :The centroid of the spectrum is calculated as follows:This refers to using the spectral energy centroid of the mode as the new center frequency.
- (c)
- Update the Lagrange Multiplier :where is the multiplier update step size, typically chosen such that .
- (4)
- Convergence ConditionsIterate until the following condition is met:where is the preset tolerance.
4. Prediction of Settlement for Random Feature Points in the Construction Process
5. Conclusions
- (1)
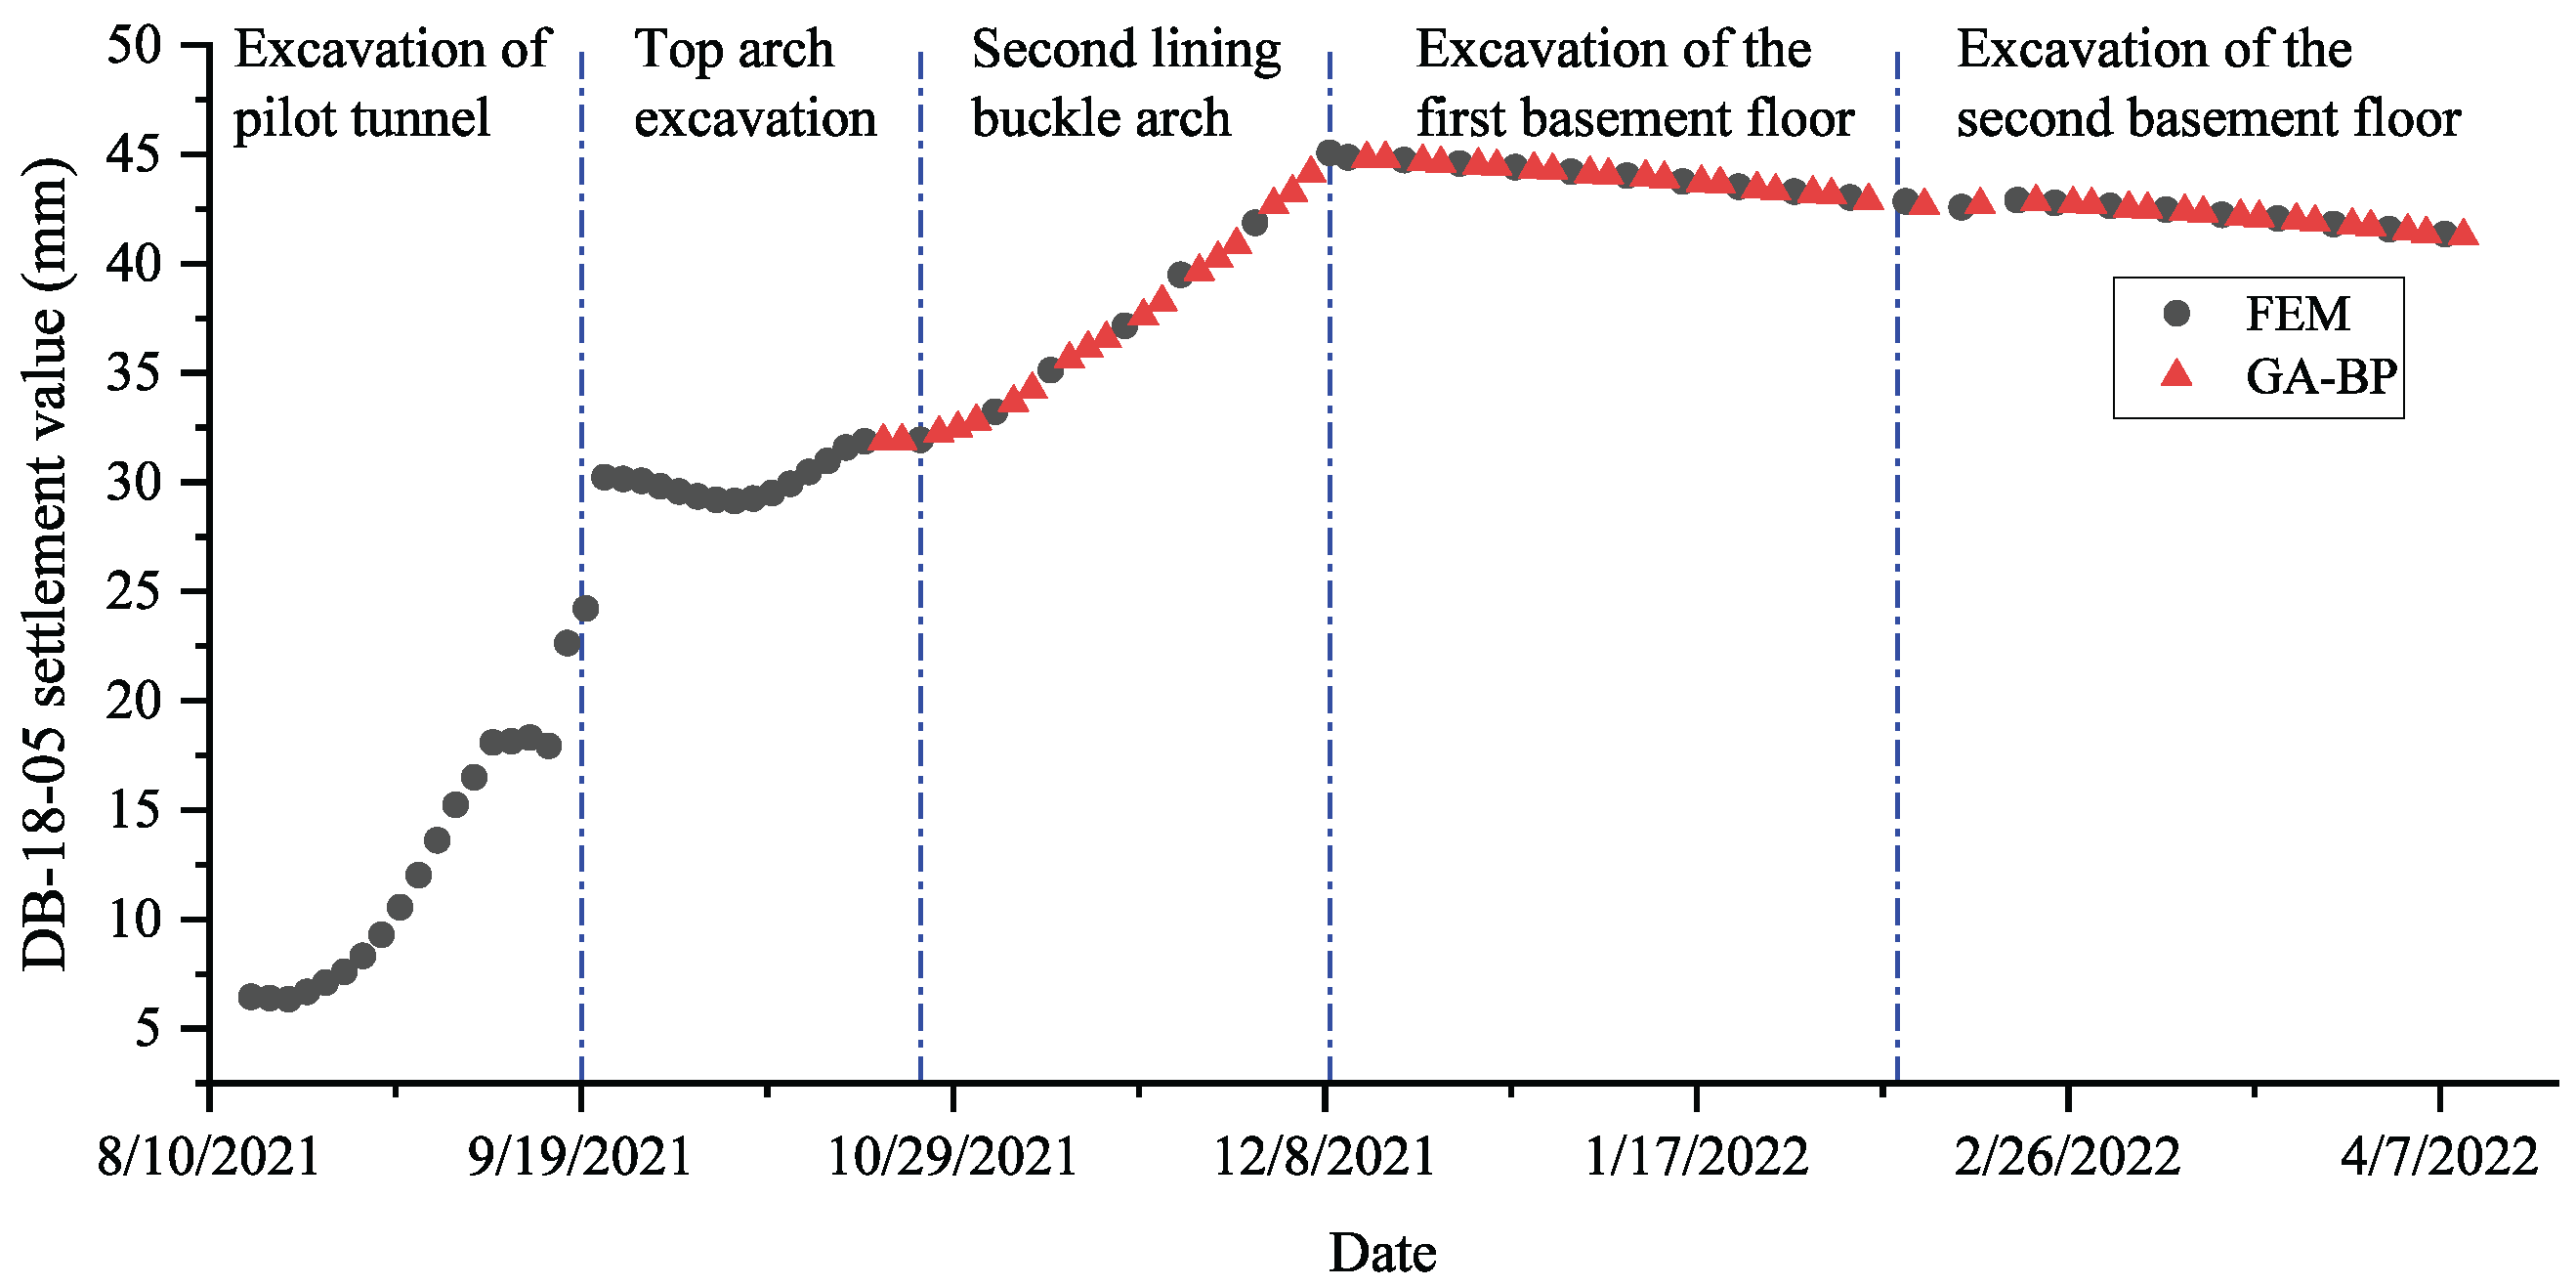
- The average error of the finite element simulation is 15.77%, and the correlation coefficient (R) of the neural network reaches , demonstrating the strong predictive capability of the present model.
- (2)
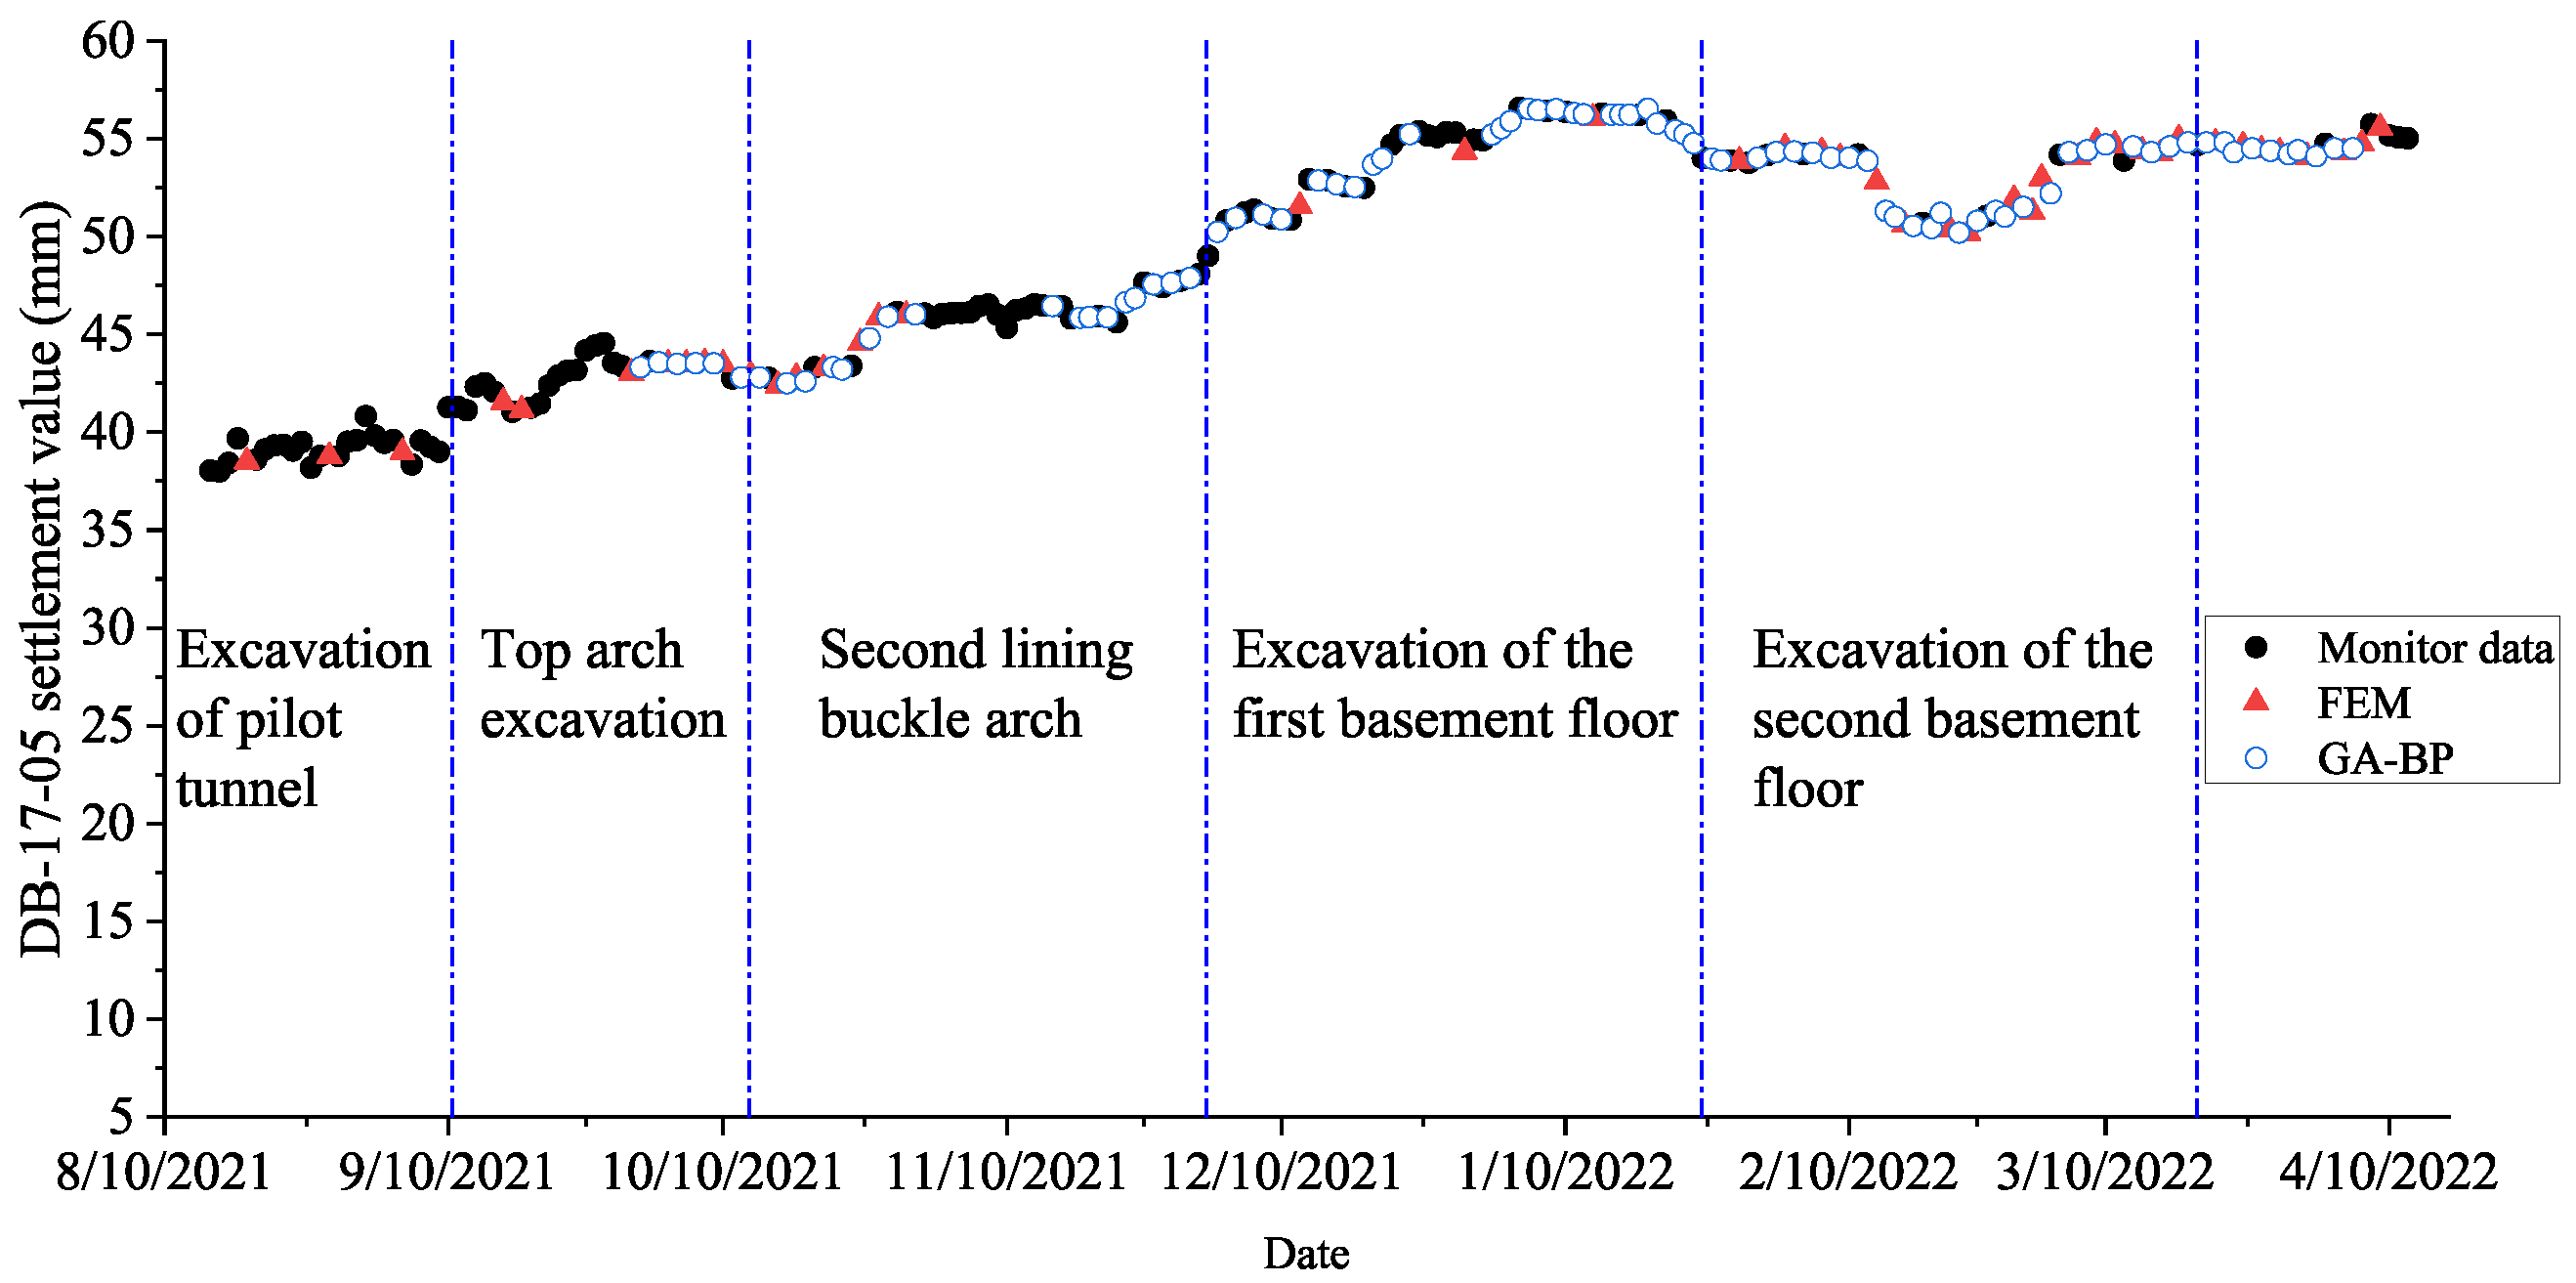
- During the construction of Dongba-zhongjie Station, surface settlement is primarily caused by the excavation of the pilot tunnel and the arch closure of the secondary lining, which together account for more than 70% and 10%, respectively, of the total settlement. As excavation progresses through the first basement floor and the middle slab, the structure begins to stabilize. Upon excavation of the second basement floor and the bottom slab, settlement at the maximum settlement point begins to rebound. At this stage, the comprehensive utility tunnel above the station can be constructed simultaneously.
- (3)
- The prediction method proposed in this article effectively addresses the issues of insufficient in situ monitoring points and discontinuous monitoring data over time. It not only supplements nodes with on-site monitoring data but also predicts random feature points, which facilitates the analysis of surface subsidence patterns caused by similar projects.
Author Contributions
Funding
Data Availability Statement
Acknowledgments
Conflicts of Interest
References
- Peck, R. Deep Excavation and tunnelling in soft ground. In Proceedings of the 7th International Conference on Soil Mechanics and Foundation Engineering (Mexico), Mexico City, Mexico, 29 August 1969. [Google Scholar]
- Fu, Q. The Time-Space Evolution Mechanism of Stratum Deformation and Control Measures During Subway Station Construction by PBA. Ph.D. Thesis, China University of Mining and Technology (Beijing), Beijing, China, 2021. [Google Scholar]
- Wang, S.; Liu, G.; Song, Z.; Yang, K.; Li, M.; Chen, Y.; Wang, M. Three-Dimensional Deformation Prediction Based on the Improved Segmented Knothe–Dynamic Probabilistic Integral–Interferometric Synthetic Aperture Radar Model. Remote Sens. 2025, 17, 261. [Google Scholar] [CrossRef]
- Tao, L.; Yu, Z.; Dong, L. Supporting effect of ultra-shallow burial cover method in subway station construction. J. Heilongjiang Univ. Sci. Technol. 2020, 30, 279–283. [Google Scholar]
- Wang, Z.J.; Ren, J.X.; Chi-gan, X.M.; Zhang, L.; Zhang, Y. Numerical Simulation Analysis on Construction Process of Pile Method Pilot Tunnel of a Subway Station in Xi’an. In Proceedings of the 8th International Conference on Hydraulic and Civil Engineering: Deep Space Intelligent Development and Utilization Forum, ICHCE, Xi’an, China, 25–27 November 2022; pp. 664–667. [Google Scholar]
- Guo, Y.; Zhang, S. Application of GA-BP in Displacement Force Inverse Analysis and Mechanical Parameter Inversion of Deep Foundation Pits. Eur. J. Comput. Mech. 2023, 32, 53–84. [Google Scholar]
- Yuan, Z.; Gao, L.; Chen, H.; Song, S. Study on Settlement of Self-Compacting Solidified Soil in Foundation Pit Backfilling Based on GA-BP Neural Network Model. Buildings 2023, 13, 2014. [Google Scholar] [CrossRef]
- Yuan, D.; Yan, R.; Zhang, L.; Zhang, L.; Geng, C. Application of Improved Residual Correction DGM (1,1) Model in Predicting Coal Mine Surface Settlement. Beijing Surv. Mapp. 2023, 37, 120–125. [Google Scholar]
- Cheng, F.; Zhang, Y.; Wan, Y.; Wang, H. Using Gompertz model to predict surface settlement around deep foundation pits. J. Undergr. Space Eng. 2013, 9, 7. [Google Scholar]
- Chen, N.; Zhu, N. Research on Optimization Algorithm for Surface Movement Prediction Parameters. Surv. Mapp. 2014, 37, 4. [Google Scholar]
- Cui, X.; Che, Y.; Malinowska, A.; Zhao, Y.; Li, P.; Hu, Q.; Kang, X.; Bai, Z. Prediction method and analysis of existing problems in the entire process of mining induced surface subsidence. China Coal Soc. 2022, 47, 2170–2181. [Google Scholar] [CrossRef]
- Jiang, Q.; Tang, Z.; Meng, Q.; Lin, F. Pile foundation settlement analysis based on finite element and neural network methods. J. Nanhua Univ. (Natural Sci. Ed.) 2009, 23, 107–110. [Google Scholar]
- Zhang, G.; Ai, C. Research on the Prediction Model and Method of Foundation Settlement. Coal Geol. Explor. 2007, 46, 44–46+50. [Google Scholar]
- Rumelhart, D.E.; Hinton, G.E.; Williams, R.J. Learning representations by back-propagating errors. Nature 1986, 323, 533–536. [Google Scholar] [CrossRef]
- Li, W.; Law, K.L.E. Deep Learning Models for Time Series Forecasting: A Review. IEEE Access 2024, 12, 92306–92327. [Google Scholar] [CrossRef]
- Ren, X.; Zhang, F.; Ding, W.; Liu, Y.; Xu, T. Prediction of surface settlement and optimization of excavation parameters for slurry shield tunneling based on neural network. Sci. Technol. Eng. 2025, 25, 2090–2099. [Google Scholar]
- Zhang, M.; Qin, S.; Li, P.; Zhang, C.; Yang, Y.; Xie, Z. Deep foundation pit deformation prediction method based on fusion attention mechanism BP neural network. J. Beijing Jiaotong Univ. 2025, 1–13. Available online: http://kns.cnki.net/kcms/detail/11.5258.U.20250106.1014.002.html (accessed on 22 May 2025).
- Yaghoubi, E.; Yaghoubi, E.; Khamees, A.; Razmi, D.; Lu, T. A systematic review and meta-analysis of machine learning, deep learning, and ensemble learning approaches in predicting EV charging behavior. Eng. Appl. Artif. Intell. 2024, 135, 108789. [Google Scholar] [CrossRef]
- Yu, W.; Liu, S.; Xiao, X. Prediction Study of CNN-LSTM Model Enhanced by TimeGAN in Ground Settlement during Shield Tunneling. Tunn. Constr. (Chin. Engl.) 2024, 44, 2223–2232. [Google Scholar]
- Lv, Z. Robust estimation algorithm for roadbed settlement prediction based on AR model. Sci. Surv. Mapp. 2024, 49, 22–29. [Google Scholar] [CrossRef]
- Dragomiretskiy, K.; Zosso, D. Variational Mode Decomposition. IEEE Trans. Signal Process. 2014, 62, 531–544. [Google Scholar] [CrossRef]
- Wahab, A.; Khan, U.S.; Nawaz, T.; Hussain Shah, S.T.; Izhar, U.; Zeb, A. An optimized Impulse Factor-based VMD-EMD approach to improve SSVEP accuracy for BCI Systems. Results Eng. 2025, 25, 104203. [Google Scholar] [CrossRef]
- Aswanuwath, L.; Pannakkong, W.; Buddhakulsomsiri, J.; Karnjana, J.; Huynh, V.N. A Hybrid Model of VMD-EMD-FFT, Similar Days Selection Method, Stepwise Regression, and Artificial Neural Network for Daily Electricity Peak Load Forecasting. Energies 2023, 16, 1860. [Google Scholar] [CrossRef]
- Ashraf, H.; Shafiq, U.; Sajjad, Q.; Waris, A.; Gilani, O.; Boutaayamou, M.; Brüls, O. Variational mode decomposition for surface and intramuscular EMG signal denoising. Biomed. Signal Process. Control 2023, 82, 104560. [Google Scholar] [CrossRef]
- Wang, Y.; Markert, R. Filter bank property of variational mode decomposition and its applications. Signal Process. 2016, 120, 509–521. [Google Scholar] [CrossRef]
- Lu, T.; He, J.; He, X.; Tao, R. Parameter Optimization Variational Mode Decomposition for GNSS Coordinate Time Series Denoising Method. J. Wuhan Univ. (Information Sci. Ed.) 2024, 49, 1856–1866. [Google Scholar] [CrossRef]
- Shen, L.; Lv, W. Mine Surface Settlement Prediction Based on Optimized VMD and Multi-Model Combination. Processes 2023, 11, 3309. [Google Scholar] [CrossRef]
- Jones, A.C.; Wilcox, R.K. Finite element analysis of the spine: Towards a framework of verification, validation and sensitivity analysis. Med. Eng. Phys. 2008, 30, 1287–1304. [Google Scholar] [CrossRef]
- Shi, X. PBAconstruction Method of Dongba Zhongjie Station of Beijing Metro Line 3 Study on Construction Surface Settlement Control. Master’s Thesis, China University of Geosciences (Beijing), Beijing, China, 2021. [Google Scholar]
- Liu, Y. Study on the Settlement Rule of Subway Station and Its Influence on Rainwater Tank Culvert by Hole Pile Method. Master’s Thesis, China University of Geosciences (Beijing), Beijing, China, 2020. [Google Scholar]
- Wang, X. Study of the Influence of PBAconstruction on the Settlement of Existing Pipeline in Beijing Subway STATION. Master’s Thesis, China University of Geosciences (Beijing), Beijing, China, 2023. [Google Scholar]
- Guo, X.P.; Jiang, A.N.; Wang, S.Y. Study on the Applicability of an Improved Pile-Beam-Arch Method of Metro Station Construction in the Upper-Soft and Lower-Hard Stratum. Adv. Civ. Eng. 2021, 6615016. [Google Scholar] [CrossRef]
- Guo, X.Y.; Wang, Z.Z.; Geng, P.; Chen, C.; Zhang, J. Ground surface settlement response to subway station construction activities using pile-beam-arch method. Tunn. Undergr. Space Technol. 2021, 108, 103729. [Google Scholar] [CrossRef]
- Yu, L.; Zhang, D.L.; Fang, Q.; Cao, L.; Xu, T.; Li, Q. Surface settlement of subway station construction using pile-beam-arch approach. Tunn. Undergr. Space Technol. 2019, 90, 340–356. [Google Scholar] [CrossRef]


| Soils | Secant Modulus (MPa) | Cohesion (kPa) | Poisson’s Ratio | Unit Weight (kN·m−3) | Frictional Angle (°) | Distributed Depth (m) |
|---|---|---|---|---|---|---|
| AF | 7 | 0 | 0.32 | 17.5 | 10 | 0∼3 |
| SCC | 15 | 25 | 0.3 | 19.5 | 9.2 | 3 ∼6 |
| CS | 33.3 | 21 | 0.25 | 21 | 31.9 | 6∼8.9 |
| FSS | 49.8 | 25 | 0.22 | 20.9 | 23.3 | 8.9∼15.6 |
| SCC | 30.6 | 41.5 | 0.22 | 20 | 45 | 15.6∼24.11 |
| CS | 36.3 | 60 | 0.23 | 18.6 | 16.2 | 24.11∼28.5 |
| OC | 55 | 0 | 0.25 | 20.5 | 33 | 28.5∼80 |
| Structures | Natural Gravity (kN·m−3) | Elastic Modulus (MPa) | Poisson’s Ratio | Element Type |
|---|---|---|---|---|
| PL | 27 | 25,500 | 0.20 | 2D plate |
| SL | 25 | 32,500 | 0.21 | 3D solid |
| CTB | 25.5 | 33,500 | 0.25 | 3D solid |
| GR | 22 | 80 | 0.25 | 3D solid |
| BC | 23.5 | 20,000 | 0.20 | 3D solid |
| SP | 25 | 27,000 | 0.24 | 1D beam |
| SPC | 33 | 41,500 | 0.23 | 1D beam |
| Excavation & Support of Pilot Tunnels | Construction of Pile Beam System | Second Lining Buckle Arch | Excavation of Main Structure | Average Error % | |
|---|---|---|---|---|---|
| DB-17-01 | 48.11 | 32.04 | 12.58 | 17.65 | 27.59 |
| DB-17-02 | 10.01 | 18.50 | 20.56 | 11.16 | 15.06 |
| DB-17-03 | 20.39 | 8.78 | 10.85 | 8.06 | 12.02 |
| DB-17-04 | 18.73 | 7.24 | 3.72 | 9.16 | 9.71 |
| DB-17-05 | 6.42 | 6.84 | 3.14 | 8.33 | 6.18 |
| DB-17-06 | 33.74 | 16.50 | 20.94 | 13.42 | 21.15 |
| DB-17-07 | 13.19 | 26.60 | 20.34 | 14.51 | 18.66 |
| Average error % | 21.51 | 16.64 | 13.16 | 11.75 | 15.77 |
| Serial Number | Training Samples | Target Value | ||||
|---|---|---|---|---|---|---|
| 1 | ⋯ | |||||
| 2 | ⋯ | |||||
| 3 | ⋯ | |||||
| ⋮ | ⋮ | ⋮ | ⋮ | ⋮ | ⋮ | ⋮ |
| ⋯ | ||||||
| Date | Monitor Value (mm) | Fitted Value (mm) | Absolute Error % | Relative Error % |
|---|---|---|---|---|
| 4/6/2020 | −8.8 | - | - | - |
| 4/7/2020 | −8.65 | - | - | - |
| 4/8/2020 | −8.81 | - | - | - |
| 4/9/2020 | −9.44 | - | - | - |
| 4/10/2020 | −9.46 | −9.581579660 | 0.121579660 | 1.285197253 |
| 4/11/2020 | −10.1 | −9.718163306 | 0.381836694 | 3.780561327 |
| 4/12/2020 | −9.52 | −9.948770254 | 0.428770254 | 4.503889227 |
| ⋮ | ⋮ | ⋮ | ⋮ | ⋮ |
| 5/5/2020 | −21.91 | −21.89414359 | 0.015856407 | 0.072370641 |
| 5/6/2020 | −21.85 | −21.87490701 | 0.024907005 | 0.113990871 |
| 5/7/2020 | −22.26 | −22.29903578 | 0.039035778 | 0.175362883 |
| Construction Stage | Surface Subsidence (mm) | Accumulated Surface Subsidence (mm) | Incr./Total | Cumulative Proportion |
|---|---|---|---|---|
| EPT | 40.87 | 40.87 | 75.47% | 75.47% |
| TAE | 2.44 | 43.31 | 4.51% | 79.98% |
| SLBA | 6.32 | 49.63 | 11.68% | 91.66% |
| EFBF | 3.99 | 53.62 | 7.36% | 99.02% |
| ESBF | 0.53 | 54.15 | 0.98% | 100% |
| Construction Stage | Surface Settlement (mm) | Accumulated Surface Settlement (mm) | Incr./Total | Cumulative Proportion |
|---|---|---|---|---|
| EPT | 30.22 | 30.22 | 73.27% | 73.27% |
| TAE | 1.70 | 31.92 | 4.12% | 77.39% |
| SLBA | 13.14 | 45.06 | 31.86% | 109.25% |
| EFBF | −2.17 | 42.89 | −5.25% | 104% |
| ESBF | −1.65 | 41.24 | 4% | 100% |
Disclaimer/Publisher’s Note: The statements, opinions and data contained in all publications are solely those of the individual author(s) and contributor(s) and not of MDPI and/or the editor(s). MDPI and/or the editor(s) disclaim responsibility for any injury to people or property resulting from any ideas, methods, instructions or products referred to in the content. |
© 2025 by the authors. Licensee MDPI, Basel, Switzerland. This article is an open access article distributed under the terms and conditions of the Creative Commons Attribution (CC BY) license (https://creativecommons.org/licenses/by/4.0/).
Share and Cite
Zhang, J.; Jiang, H.; Wang, J.; Feng, J. A Model Based on Neural Network to Predict Surface Settlement During Subway Station Construction: A Case Study of the Dongba-Zhongjie Station in Beijing, China. Buildings 2025, 15, 1823. https://doi.org/10.3390/buildings15111823
Zhang J, Jiang H, Wang J, Feng J. A Model Based on Neural Network to Predict Surface Settlement During Subway Station Construction: A Case Study of the Dongba-Zhongjie Station in Beijing, China. Buildings. 2025; 15(11):1823. https://doi.org/10.3390/buildings15111823
Chicago/Turabian StyleZhang, Jiaqi, Hua Jiang, Jinsen Wang, and Jili Feng. 2025. "A Model Based on Neural Network to Predict Surface Settlement During Subway Station Construction: A Case Study of the Dongba-Zhongjie Station in Beijing, China" Buildings 15, no. 11: 1823. https://doi.org/10.3390/buildings15111823
APA StyleZhang, J., Jiang, H., Wang, J., & Feng, J. (2025). A Model Based on Neural Network to Predict Surface Settlement During Subway Station Construction: A Case Study of the Dongba-Zhongjie Station in Beijing, China. Buildings, 15(11), 1823. https://doi.org/10.3390/buildings15111823