Article

Quantitative Evaluation of Water Vapor Permeability Coefficients of Earth Materials Under the Influence of Density and Particle Size Distribution

1
School of Architecture and Urban Planning, Beijing University of Civil Engineering and Architecture, Beijing 100044, China
2
Beijing Key Laboratory of Green Building and Energy-Efficiency Technology, Beijing 100044, China
3
Beijing Energy Conservation & Sustainable Urban and Rural Development Provincial and Ministry Co-Construction Collaboration Innovation Center, Beijing 100044, China
4
School of Architecture and Urban Planning, Kunming University of Science and Technology, Kunming 650500, China
*
Author to whom correspondence should be addressed.
Buildings 2025, 15(11), 1821; https://doi.org/10.3390/buildings15111821
Submission received: 31 March 2025 / Revised: 17 May 2025 / Accepted: 22 May 2025 / Published: 26 May 2025
(This article belongs to the Section Building Materials, and Repair & Renovation)

Abstract

Earth materials are commonly utilized due to their excellent wet properties and environmental friendliness. However, previous research has primarily focused on the impact of additives on the water vapor permeability of earth materials, neglecting the influence of particle size distribution. This has also hindered the quantitative assessment of the water vapor permeability of earth materials. To advance the use of earth materials in building energy conservation, this study develops a mathematical model for the water vapor permeability coefficient of earth materials. This model is derived from experiments that measure the water vapor permeability coefficient of earth materials with varying densities and earth-to-sand ratios, employing both experimental measurements and theoretical analyses. After being adjusted by a quadratic function of error rate and density, the average error rate of the mathematical model decreased from 5.73% to 1.3%, indicating its accuracy. Furthermore, by utilizing this model, the impacts of density, clay, sand, and gravel on the water vapor permeability coefficient of earth materials were quantitatively examined. The results indicate a negative correlation between the water vapor permeability coefficient of earth materials and density. When the clay–sand–gravel ratio was 3.8:5.0:1.2, the vapor permeability of the earth materials was the worst, whereas when the gradation ratio was 4.6:3.4:2.0, the vapor permeability was relatively optimal. The findings of this research can provide a reference for the scientific quantification of the thermo-physical property indices of earth materials in green building design systems.

1. Introduction

1.1. Background

The increasing focus on sustainable development has raised awareness of energy consumption in the building sector. Buildings account for over 30% of global energy usage and contribute more than 25% of the world’s greenhouse gas emissions. With the projected doubling of global floor space by 2050 due to population growth, the building sector’s energy consumption may soar to 50% [1]. Given the prevailing high levels of energy consumption and carbon emissions in the construction industry, implementing energy-saving measures is imperative. As a traditional building material with a long history, earth materials are widely used because of their excellent thermal properties. Earth materials, due to their on-site excavation, processing, and recyclability, possess significant potential for reducing building energy consumption and carbon emissions. Compared to concrete and sintered bricks, respectively, earth materials yield carbon emission reductions of 2–15% and 4–8% in manufacturing and construction [2]. In addition to their ecological benefits, earth materials exhibit robust capabilities in moisture absorption and heat storage. Within traditional earth buildings, earth walls effectively regulate room humidity through the absorption and release of water vapor [3]. Simultaneously, enclosures built with earth materials serve as a barrier between indoor and outdoor environments, thereby mitigating the indoor–outdoor humidity differential and enhancing indoor comfort. The evaporation of water vapor from earth buildings in hot regions induces a cooling effect, consequently reducing indoor temperatures [4,5]. In summary, earth buildings, by leveraging their excellent thermal properties, can achieve over 50% reductions in energy consumption over their lifecycle [6].

1.2. Problem

Extensive research on modern earth construction has improved mechanical properties and optimized structural node designs, enabling earth materials to meet diverse building types, thereby increasing their utilization in public and residential constructions. The porous nature of earth materials and their heat and moisture transfer processes, which involve gas phase and liquid phase conversions, influence heat transfer, with water vapor permeability being a crucial parameter that affects energy consumption and indoor thermal comfort in buildings.
Hall et al. examined the hygrothermal and wet buffering characteristics of rammed earth walls, proposing that the porosity of earth materials influences both their water vapor permeability coefficient and specific heat capacity. Consequently, the thermal and wet characteristics of earth materials can be anticipated and tailored based on their particle distribution and bulk density [7,8]. McGregor et al. performed dynamic and static experiments on clay blocks to assess their water vapor permeability and wet buffering capacity. The findings revealed that unfired clay bricks exhibit superior wet buffering capacity, thereby enhancing room health. Moreover, soil particle size distribution notably impacts the wet buffering capacity of clay blocks [9,10].
Existing research has predominantly concentrated on the influence of fibrous materials and additives on the moisture permeability of earth materials. Galán-Marín et al. increased the compressive strength of earth blocks, reduced shrinkage cracks, and improved thermal insulation properties by adding alginate and wool fibers. Furthermore, they demonstrated that the inclusion of these additives impacts the equilibrium moisture content and dynamic moisture buffering properties of earth blocks [11,12]. Hibouche et al. conducted experiments in which the addition of flax fibers, 3% lime, and 8% cement to earth materials resulted in significantly enhanced water vapor permeability compared to conventional concrete [13]. Adam and Jones [14], along with Sylvere Azakine Sindanne [15], demonstrated that incorporating cement and lime into earth bricks enhances their compressive strength and thermal conductivity while reducing water absorption. Dondi et al. demonstrated a positive correlation between the water vapor permeability of unprocessed clay bricks and the average pore size and pore rate, while showing a negative correlation with bulk density and specific surface area. They also developed an initial predictive model for the water vapor permeability coefficient using porosity, pore size, and specific surface area through multiple regression analysis [16]. Fabbri et al. concluded that material proportioning and particle size distribution exert a more significant impact on the wet buffering properties of earth materials than density and preparation method [17]. In summary, while cement and lime enhance the mechanical properties of earth materials, they concurrently elevate thermal conductivity, diminish wet cushioning properties, and compromise material recyclability. We need to identify the right particle size distribution and gradation to enhance the water vapor permeability properties of earth materials.
Moreover, the water vapor permeability of earth materials exhibits substantial regional variability. Consequently, these findings cannot serve as direct references for engineering design. Although numerous scholars have conducted fundamental experimental studies on the water vapor permeability of modified earth materials, relatively few have explored the effects of particle distribution and density on water vapor permeability. This limitation contributes to significant variability in the water vapor permeability coefficients of earth materials.

1.3. Focus and Research Questions

The primary aim of this study is to investigate the impact of particle distribution and density on the water vapor permeability coefficient of earth materials and to quantify the observed patterns of change. Various proportions of gravels and sands were added to the earth material without the use of chemical modifiers to enhance the particle size distribution and proportion, resulting in a composition of multiple aggregates that resembles concrete. Additionally, a series of control experiments were conducted concurrently. Nine sets of earth materials with varying particle size distributions and five different densities were chosen for analysis. The experimental results were used to investigate the impact of particle size distribution and density on the moisture permeability of earth materials. Subsequently, a predictive model for the water vapor permeability coefficient of earth materials with different gradations and densities was developed. This model serves as a valuable reference for guiding the selection of earth gradation in practical projects.
The initial phase of this study involved analyzing the physical and chemical characteristics of the selected earth materials, including density, particle size distribution, and chemical composition. The optimization of the particle size distribution of the earth materials was accomplished using the orthogonal experimental design method, resulting in nine representative particle size distributions. In the subsequent phase, the porosity and pore size distribution of the earth materials were assessed utilizing the mercury intrusion porosimetry technique. In the final stage, a mathematical model for the water vapor permeability coefficient of earth materials was formulated. Additionally, the calculation error arising from variations in particle size distribution was rectified based on the experimentally determined water vapor permeability coefficient. Finally, the interrelation between the water vapor permeability coefficient of earth materials and variations in particle size distribution and density was examined.

2. Materials and Methods

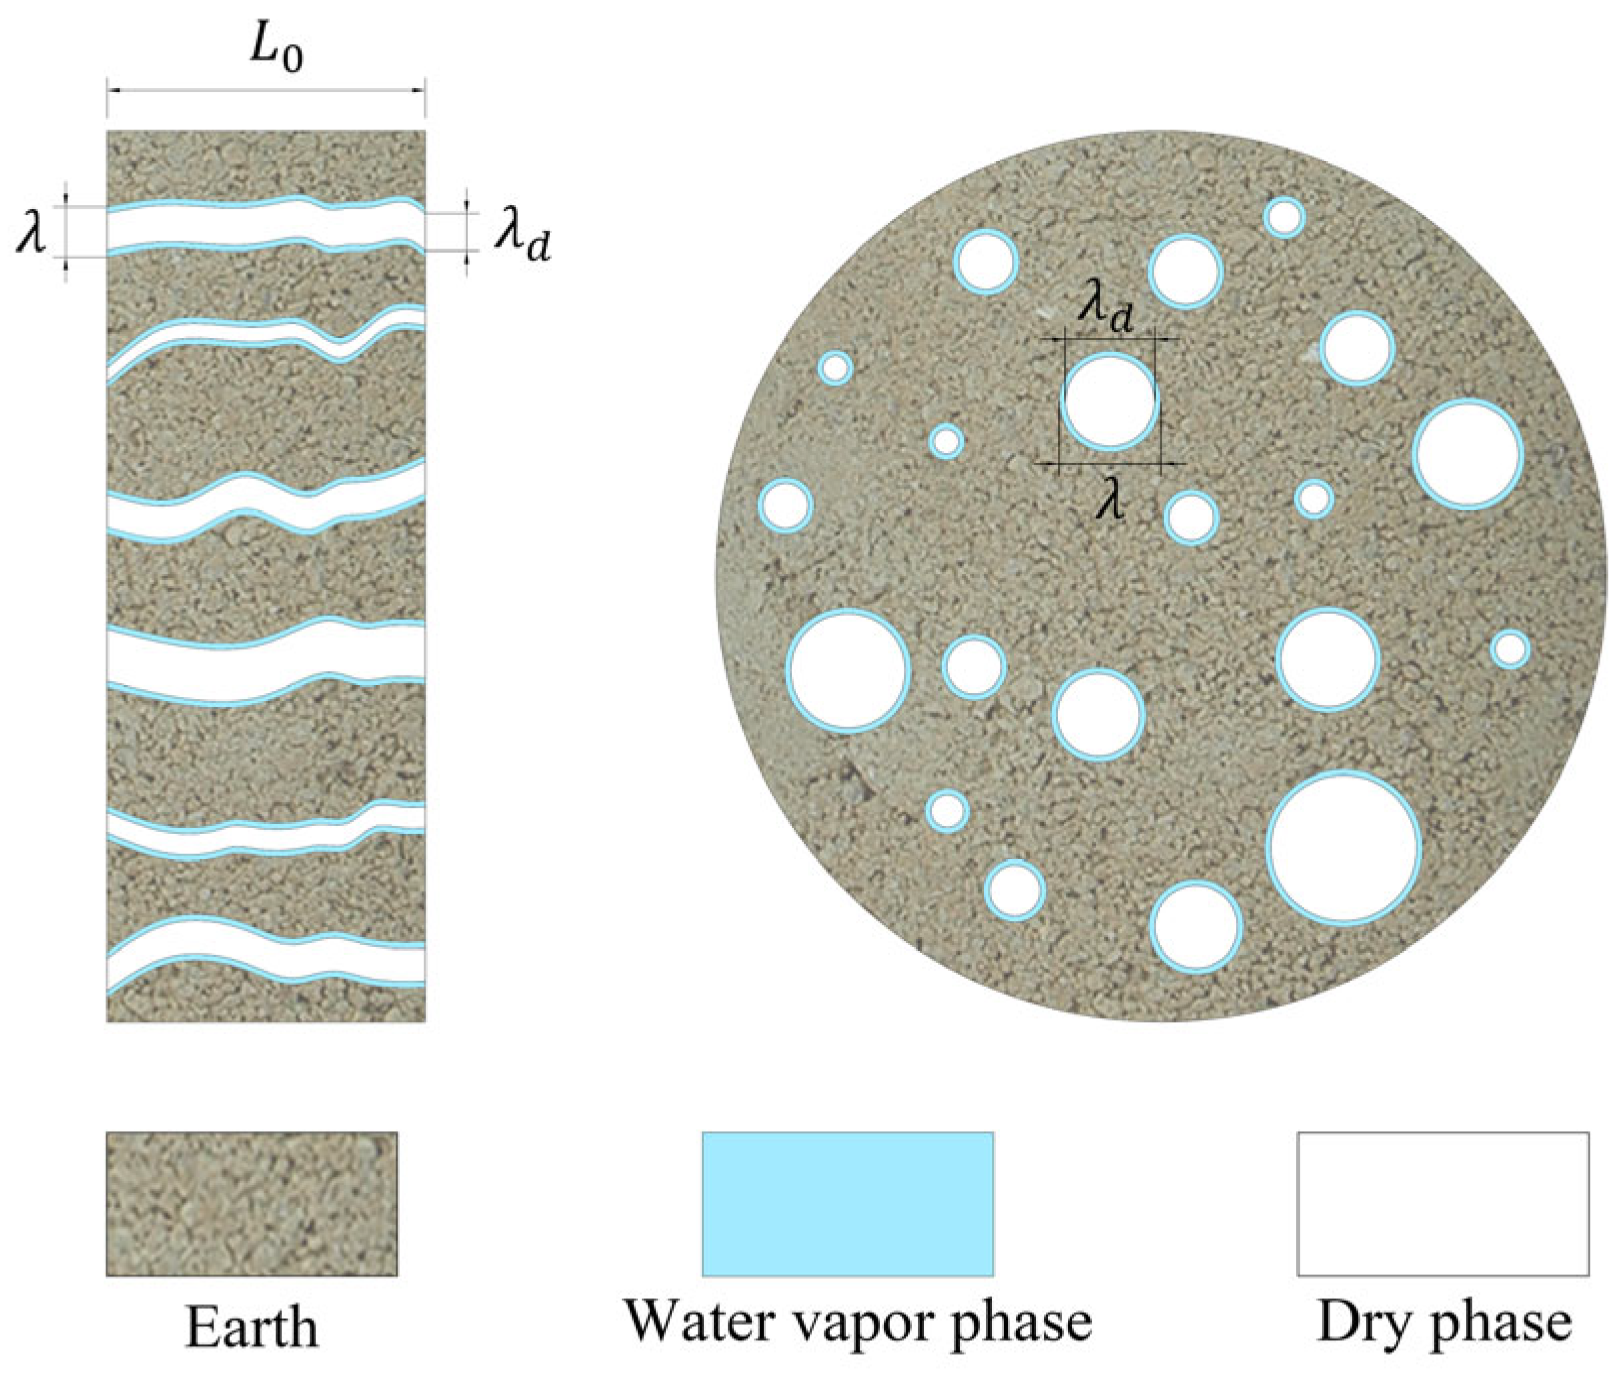
2.1. Experimental Principle

The experimental method employed in this study is based on the Chinese national standard GB/T 17146-2015 [18], which outlines test methods for the water vapor transmission properties of building materials and products. The test method encompasses two variants: the dry method and the wet method. For this experiment, the desiccant method (dry method) was utilized. Initially, the earth test block was sealed atop the opening of an experimental cup containing calcium chloride. Subsequently, the entire assembly was inserted into a predetermined sealed chamber with controlled temperature and humidity conditions. Owing to the varying partial pressures of water vapor between the experimental cup and the sealed chamber, water vapor diffuses through the test block due to the pressure differential. By monitoring the weight change of the test block over time, the water vapor permeability coefficient can be calculated.

2.2. Test Block Preparation

2.2.1. Earth Materials

The materials utilized for producing the test block include clay, sand, and gravel. In China, Gansu and Yunnan contribute to over 60% of the traditional earth construction in the country. Consequently, the earth selected for this study was soil from Luhai Village in Yunnan. The earth was sieved according to the NF EN ISO 17892-4 scheme and analyzed using an Olympus Vanta Vel-Sdd handheld XRF analyzer [19]. The particle size composition of the soil is 66.85% clay, 24.91% silt, and 7.59% sand (see Table 1). The physical properties of the soil are shown in Table 2. The results indicate that the strength of the soil is minimally affected by changes in water content. Consequently, the soil exhibits good physical properties and can meet the requirements of engineering in earth building.
Test blocks were prepared by combining sands with grain sizes ranging from 0.5 to 2 mm and gravel with grain sizes of 6–9 mm. Subsequently, the chemical elemental compositions of these components (clay, sand, and gravel) were analyzed using X-ray fluorescence (XRF) spectroscopy, with the results depicted in Figure 1, The main chemical composition reveals that commonly utilized construction sands and gravels in China predominantly comprise SiO2, Al2O3, and Fe2O3 components. Therefore, other researchers can replicate the experiment using materials with similar chemical compositions. Using XRF analysis can reduce the potential impact on the permeability performance caused by differences in chemical properties.

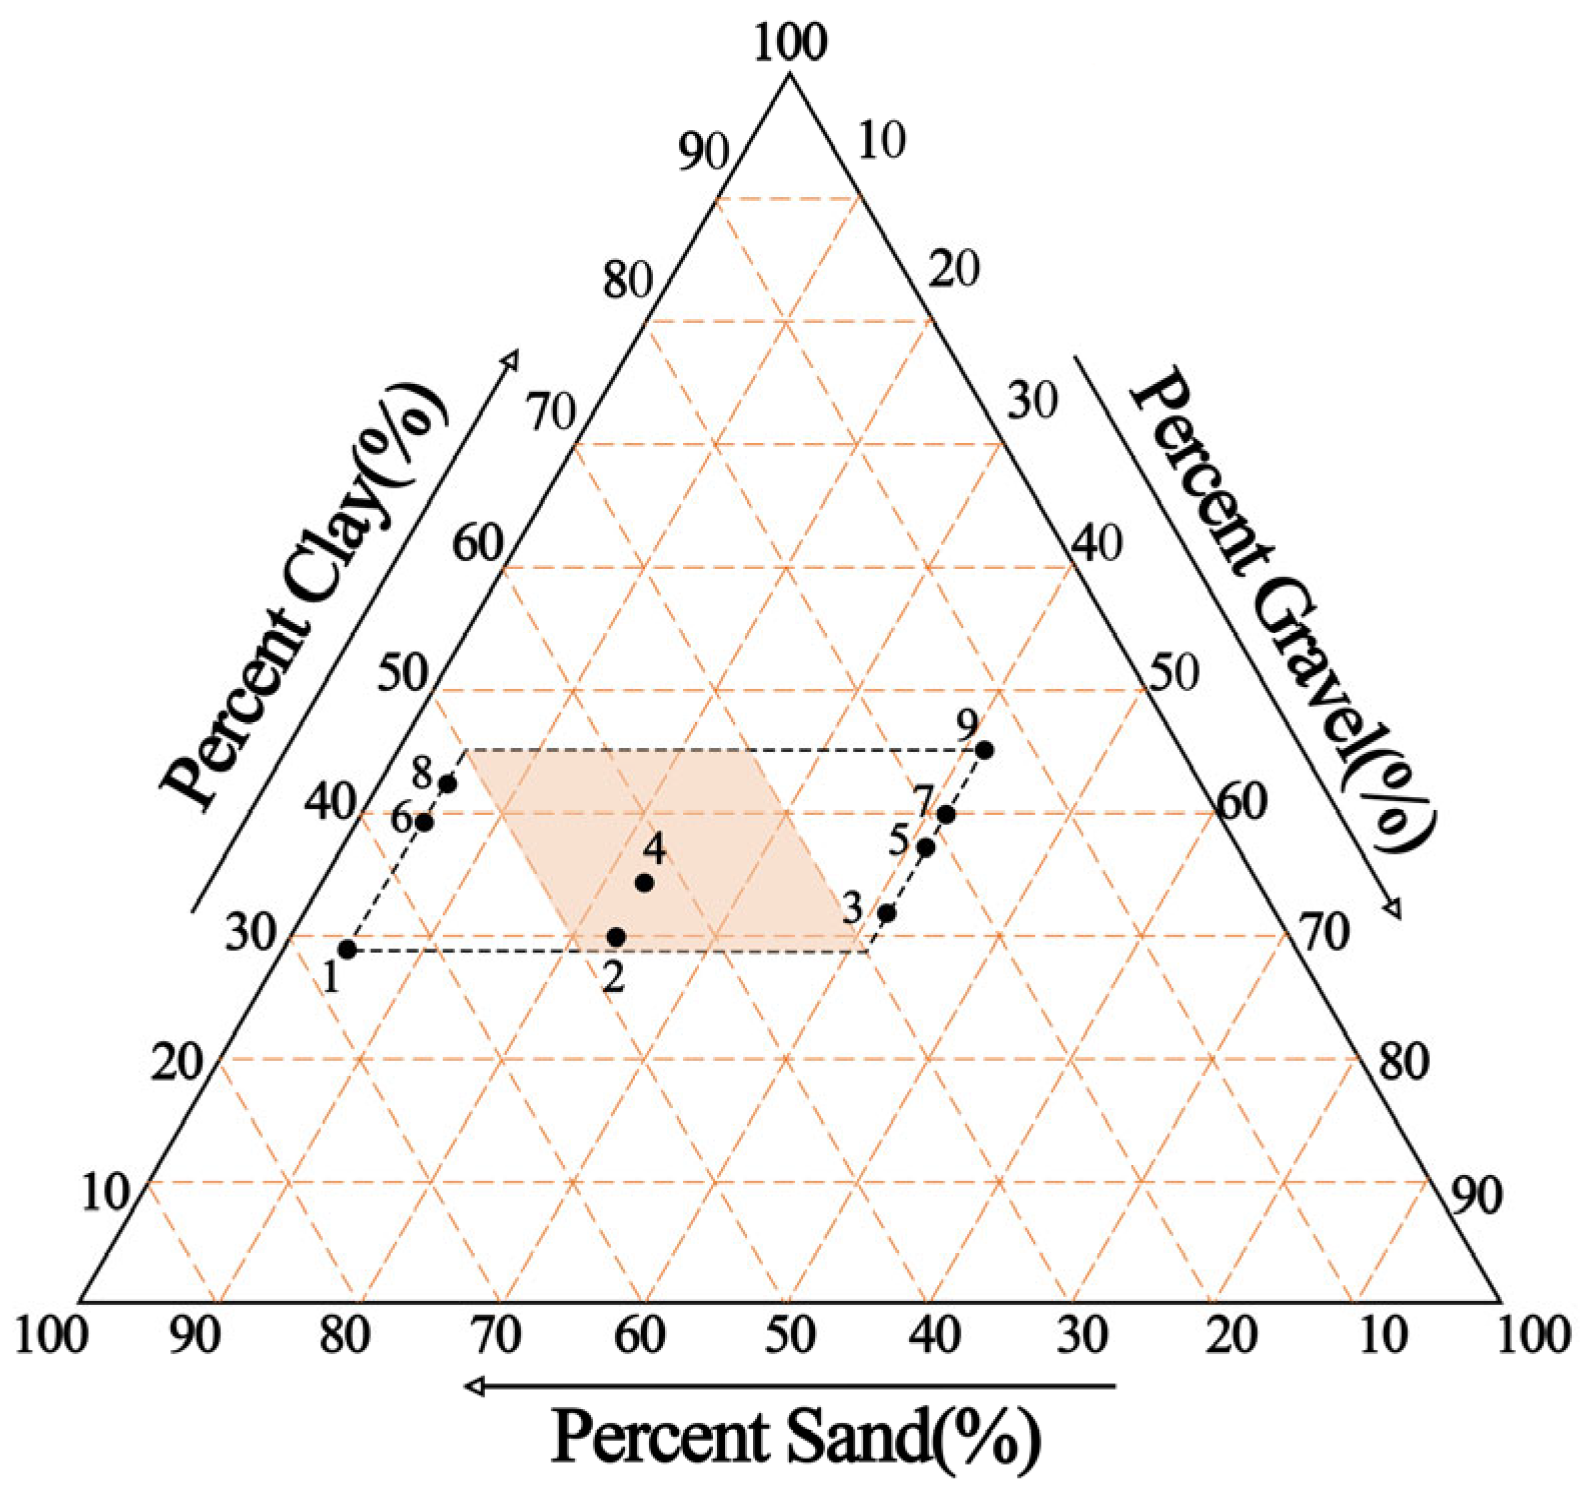
2.2.2. Test Block Gradation

The International Center for Civil Engineering and Construction suggests that incorporating gravel and sand into earth, followed by mechanical compaction, produces a compacted soil wall with a density ranging from 1800 to 2200 kg/m3 and a compressive strength of up to 5.0 MPa [20]. The actual engineering gradation and density of the earth material underpin this study. The significant number of test blocks required to cover the impact of the three variables and density is substantial. Consequently, we simplified the gradation by employing the orthogonal experimental method. Only nine gradations are necessary to analyze the influence of clay, sand, and gravel on the water vapor permeability coefficient. The gradations within the black dotted line in Figure 2 were determined by the Building Cultures and Sustainable Development (CRAterre) and our practical research on earth buildings projects in China. Additionally, the final nine gradations were determined using an orthogonal experimental method, as shown in Figure 2. In addition, we selected five density gradients ranging from 1800 kg/m3 to 2200 kg/m3 for the test blocks. Table 3 presents the particle size ratios for nine groups of these blocks.

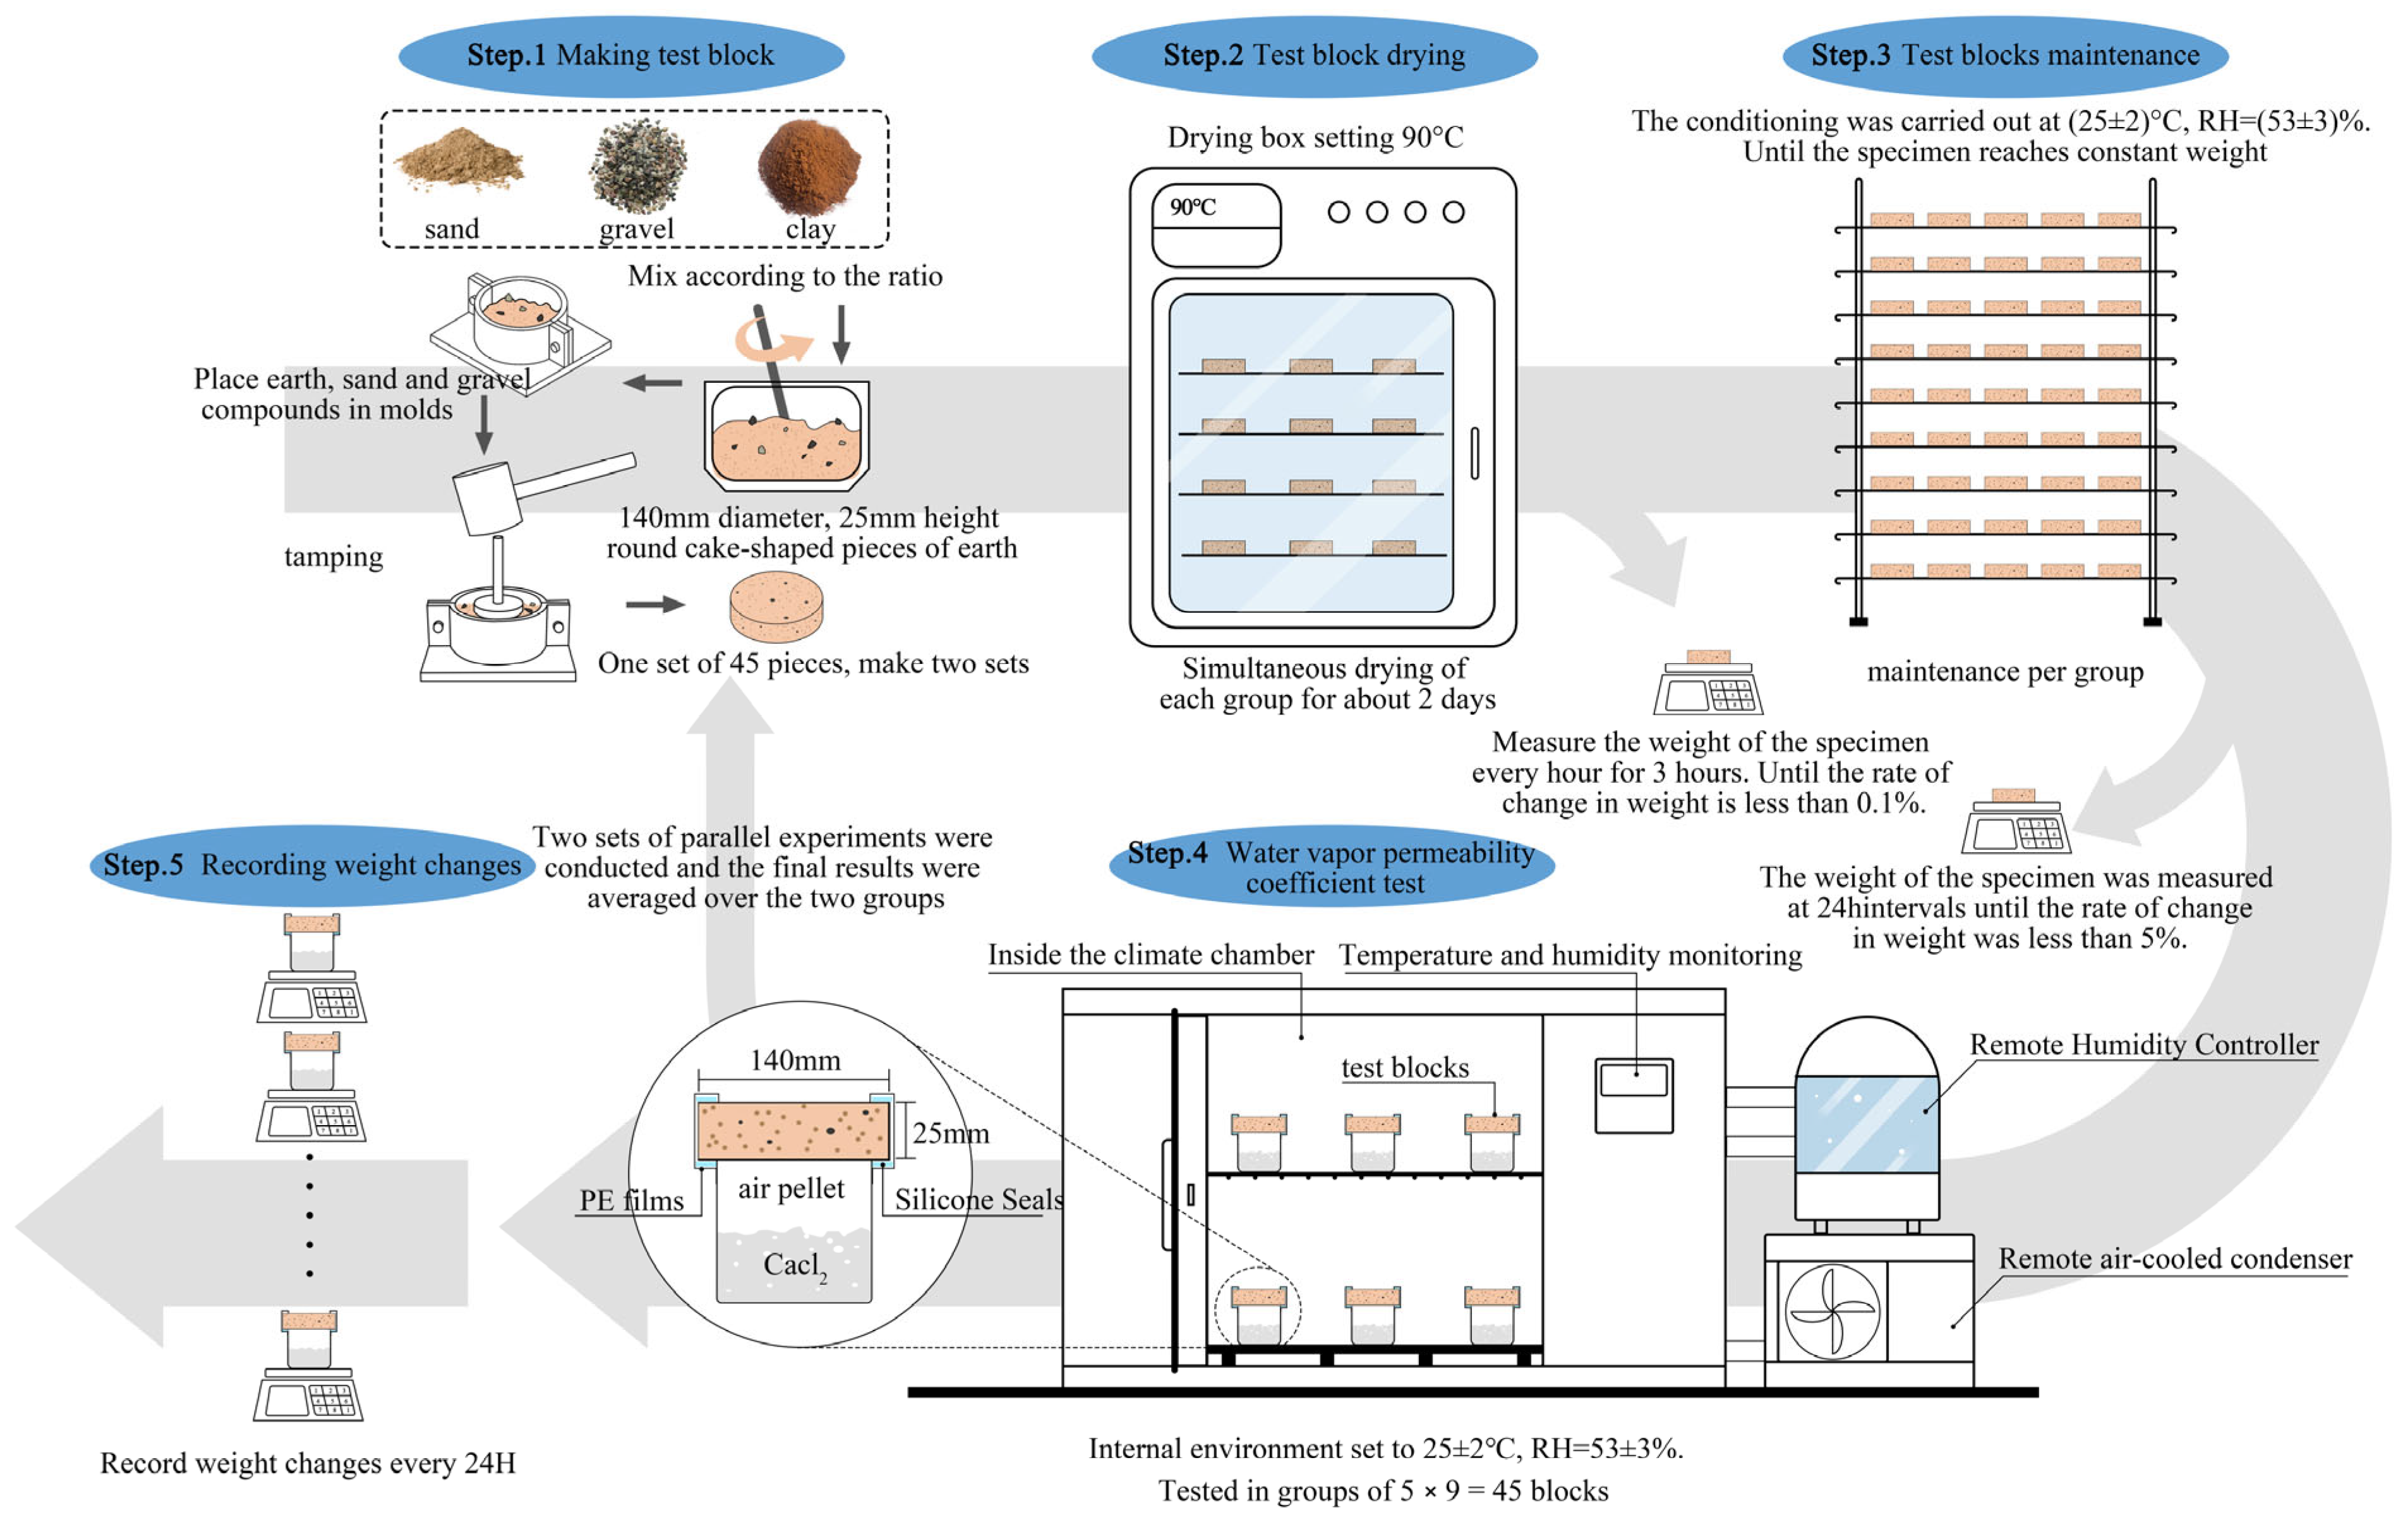
2.3. Making the Test Blocks

The process of creating test blocks commences with the sieving of soil to eliminate impurities and retain particles smaller than 0.008 mm. In this way, the clay required for the test blocks is obtained. To prevent moisture from affecting the grading of the test blocks, the sieved earth undergoes drying in an oven at 105 °C for 24 h, allowing it to reach sufficient dryness before batching. Test blocks with different densities are prepared by varying the weight of the earth material while keeping the volume constant. In order to mitigate density variations in the vertical direction that result from uneven forces during test block production, the mold dimensions are established to resemble a disc measuring 14 cm in diameter and 2.5 cm in height. By adopting this configuration, the lateral extent of the test specimen exceeds five times its thickness. The circular surface, with a 14 cm diameter, serves as the loading surface during pressurization, effectively eliminating the influence of non-uniform density distribution on the determination of the water vapor permeability coefficient. Subsequently, a precise mixture of clay, sand, gravel, and water is placed in a metal mold and compacted into a Φ 140 mm × 25 mm circular cake through manual tamping. While natural drying of earth buildings takes 2–4 weeks, for efficiency, the test blocks in this study are dried in an oven and considered completely dry when a mass change of less than 0.1% is observed within an hour. The dried blocks should be stored in an environment with a temperature of (25 ± 2) °C and a relative humidity of (53 ± 3)% for preservation. Additionally, every 24 h during testing, if the block’s mass change falls within 5%, it is deemed to have reached constant weight.

2.4. Experimental Methods

The climate chamber was set to a temperature of (25 ± 2) °C and a relative humidity of (53 ± 3)%. Anhydrous calcium chloride (150 g) was placed into a glass container, followed by the encapsulation of the test pieces using a silicone sealing ring and PE film. The encapsulated test pieces, arranged in groups of 45, were evenly distributed within the climate chamber. The mass of each group was weighed every 24 h, and the measurements were conducted continuously for ten days. The experimental procedure is illustrated in Figure 3.
To ensure data objectivity, the second set of test blocks was prepared and maintained identically. Two sets of parallel experiments were conducted, and the final results were averaged from both groups. Then the water vapor permeability coefficient of the earth materials can be calculated by Equation (1).
δ = G Δ p L = G p s R H 1 R H 2 L
In Equation (1), δ is the water vapor permeability coefficient in g / ( m · s · P a ) ; G is the wet flow rate; Δ p is the difference in water vapor pressure across the blocks; ps is the saturated vapor pressure at the experimental temperature; R H 1 is the relative humidity on the high-water vapor pressure side, expressed as a fraction; and R H 2 is the relative humidity on the low water vapor pressure side, expressed as a fraction.

3. Mathematical Model of the Water Vapor Permeability Coefficient

3.1. Fractal Theory

The conventional steady-state method for determining the water vapor permeability coefficient of materials is time-consuming. Consequently, numerous researchers have devised several models rooted in fractal theory to forecast water vapor permeability and other moisture transfer properties. These models have found applications in various porous materials, including porous fabrics and steam-pressurized concrete [21]. Examination under a microscope, as depicted in Figure 4, reveals a resemblance in the microstructures of various typical soil particles. Although the pore structures of earth materials exhibit fractal characteristics, fractal theory has not been extensively applied in forecasting water vapor transport in such materials [20].
In summary, water vapor permeability in porous building materials is correlated with both porosity and relative humidity. This paper establishes the fractal model of water vapor permeability in earth materials with varying porosity by determining the curvature fractal dimension based on porosity and pore diameter, building upon the existing fractal model of moisture permeability in unsaturated porous media.

3.2. Mathematical Model Building

Sierpinski carpet or Sierpinski gasket can be used as a model for water infiltration in porous media. The pore area fractal dimension, D f , can be calculated using the following equation [22,23]:
D f = d ln ε ln λ m i n λ m a x
In Equation (2), d represents the Euclidean dimension, where (d = 2) in the two-dimensional fractal model; thus, 1 < D f < 2. ε represents the porosity of the earth material, while λ m a x and λ m i n indicate the maximum and minimum pore sizes, respectively, in the earth material.
The porosity of the test blocks in this experiment was determined using the mercury intrusion method, and the typical pore size distribution in these test blocks was subsequently obtained. Utilizing the results of pore size characterization, the maximum pore size and the ratio λ m i n / λ m a x were calculated for all levels of test blocks. The fractal dimension of the pore area for these test blocks was calculated using Equation (2).
The earth materials with porous structures can be regarded as bi-dispersed self-similar porous media [24]. We assume that the water vapor permeation path in the test block comprises multiple bundles of capillaries with varying cross-sectional areas (Figure 5). Within each capillary, it is assumed that both the wetting and dry phases are consistently filled [25]. λ represents the pore size (diameter) of each capillary, λ d denotes the size of the non−wetting phase (dry) that occupies the cross−section of the capillary, and λ w denotes the size of the wetting phase in the cross-section of the capillary, where λ w = λ λ d .
In Figure 5, L 0 represents the characteristic length. Due to the zigzag configuration of the capillary, the actual length is L t L 0 . According to the theory proposed by Wheatcraft and Tyler [26] we can derive the following equations:
L 0 = [ 1 ε ε π D f λ m a x 2 4 ( 2 D f ) ] 1 2
L t ( λ ) = F ( λ ) 1 D T L 0 D T
Here, F ( λ ) represents the length of unquantized cells on L t ; D T represents the fractal dimension of tortuosity, ranging between 1 and 2, indicating the level of complexity in the capillary path traversed by the fluid. When D T = 1, it denotes a straight capillary path, while higher D T values signify increased tortuosity in the capillary route.
D T = 1 + ln τ ¯ ln L 0 λ ¯
Here, τ ¯ represents the average curvature, which is calculable using Equation (6), and L 0 λ ¯ can be deduced from Equation (7) [27].
τ ¯ = 1 2 1 + 1 2 1 ε + 1 ε 1 1 ε 1 2 + 1 4 1 1 ε
L 0 λ ¯ = D f 1 D f 1 / 2 1 ε ε π 4 ( 2 D f ) 1 / 2 λ m a x λ m i n
The fractal dimensions of the pore areas and the tortuosities of the diverse earth grades were determined using physical data from the corresponding blocks, as recorded in Table 6 and the preceding equations. Refer to Table 4 for details. The total volumetric flow rate through an individual aperture equals the sum of the wetting phase, Q w , and the non-wetting phase, Q d . By integrating the flow rates across apertures from the smallest to the largest, the total volumetric flow rate through the entire cross-section can be determined [28]. Additionally, a crucial assumption is made: λ m a x λ m i n [29]. Consequently, λ m i n λ m a x D f 0 , which implies λ m i n , w λ m a x , w D f , w 0 . Therefore, according to the Hagen Poiseulle equation, the following equations are derived:
Q w = π 128 Δ P w μ w A L 0 L 0 1 D T A D f , w 3 + D T D f , w λ m a x , w 3 + D T
D f , w = d + ln S w ε ln L = d ln S w ε ln λ m i n λ m a x
The area fractal dimension of the wetted phase is denoted as D f , w , μ w is the water vapor viscosity, Δ p is the pressure gradient, and A is the cross-sectional area. The water vapor saturation, s w , which is linked to relative humidity, is ascertainable from an isothermal hygroscopic curve [30,31]. λ m a x , w represents the maximum diameter of the water vapor phase and is ascertainable using the following equation:
λ m a x , w = λ m a x S w
Finally, in accordance with Darcy’s law of linear percolation, the water vapor permeability of the earth materials can be computed using the following equation once all aforementioned values have been acquired:
δ w = π 128 L 0 1 D T A D f . w 3 + D T D f , w λ m a x . w 3 + D T

3.3. Calculation

The porosity and pore size distribution of the earth materials at various grades were determined using the mercury intrusion porosimetry method, and the date are shown in Table 4. The fractal dimensions of pore area D f and curvature D T were calculated using Formulas (2) and (5), respectively. The corresponding data can be found in Table 5. The mathematical water vapor permeability coefficients for the test blocks of different grades were calculated using Formulas (2)–(11), and the results are presented in Table 6.

4. Results and Discussion

This section examines the fundamental physical parameters and test data of earth materials, contrasting the water vapor permeability of earth materials optimized with fiber and cement. The experimental findings indicate that properly graded earth materials exhibit superior porosity and water vapor permeability. Furthermore, the distribution pattern of the water vapor permeability coefficient was investigated, utilizing both measured values and a mathematical calculation model, to explore correlations between the earth material’s water vapor permeability coefficient and the particle size composition.

4.1. Porosity Analysis of Earth Materials

The porosity of the test blocks with various densities and ratios is presented in Table 6. The porosity of the earth material varies between 20.98% and 30.33%. To enhance data visualization, the relationship between porosity and density was fitted using MATLAB 2020, despite the lack of a pronounced relationship between porosity and clay content. It can be seen in Figure 6 that as the density decreases from 2200 kg/m3 to 1800 kg/m3, the porosity of the test blocks increases. Furthermore, as seen in Table 6, sample 8 (4.25:5.25:0.50) exhibits the highest porosity. This could be attributed to the high proportion of sand in the gradation of this sample. The particle size of sand, which ranges from 0.08 to 2 mm, results in the presence of numerous voids between the sand particles. In contrast, in gradation No. 3 (3.30:2.50:4.20), the porosity of the test blocks is the lowest. This is because of the lower proportion of sand and higher proportion of gravel. Gravel particles are 400–2000 times larger than clay particles, but they do not form effective voids between them. Instead, they tend to be enveloped by the smaller clay particles, reducing the overall porosity.
Zhang Lei et al. demonstrated that the inclusion of cement enhances the strength and thermal insulation of earth materials, albeit altering its pore structure, thereby compromising the original connected pore space and reducing water vapor transmission [31]. The comparison of porosity between a cement-modified earth wall with an apparent density of 1900 kg/m3 and test blocks of all grades with the same apparent density is depicted in Figure 7. As the cement content increased from 3% to 11%, the porosity of the earth wall decreased from 23.67% to 21.01%. In comparison to the test blocks with optimized gradation determined using an orthogonal experimental method, the porosity, on average, decreased by 3.6%.

4.2. Analysis of Water Vapor Permeability Coefficient of Earth Materials

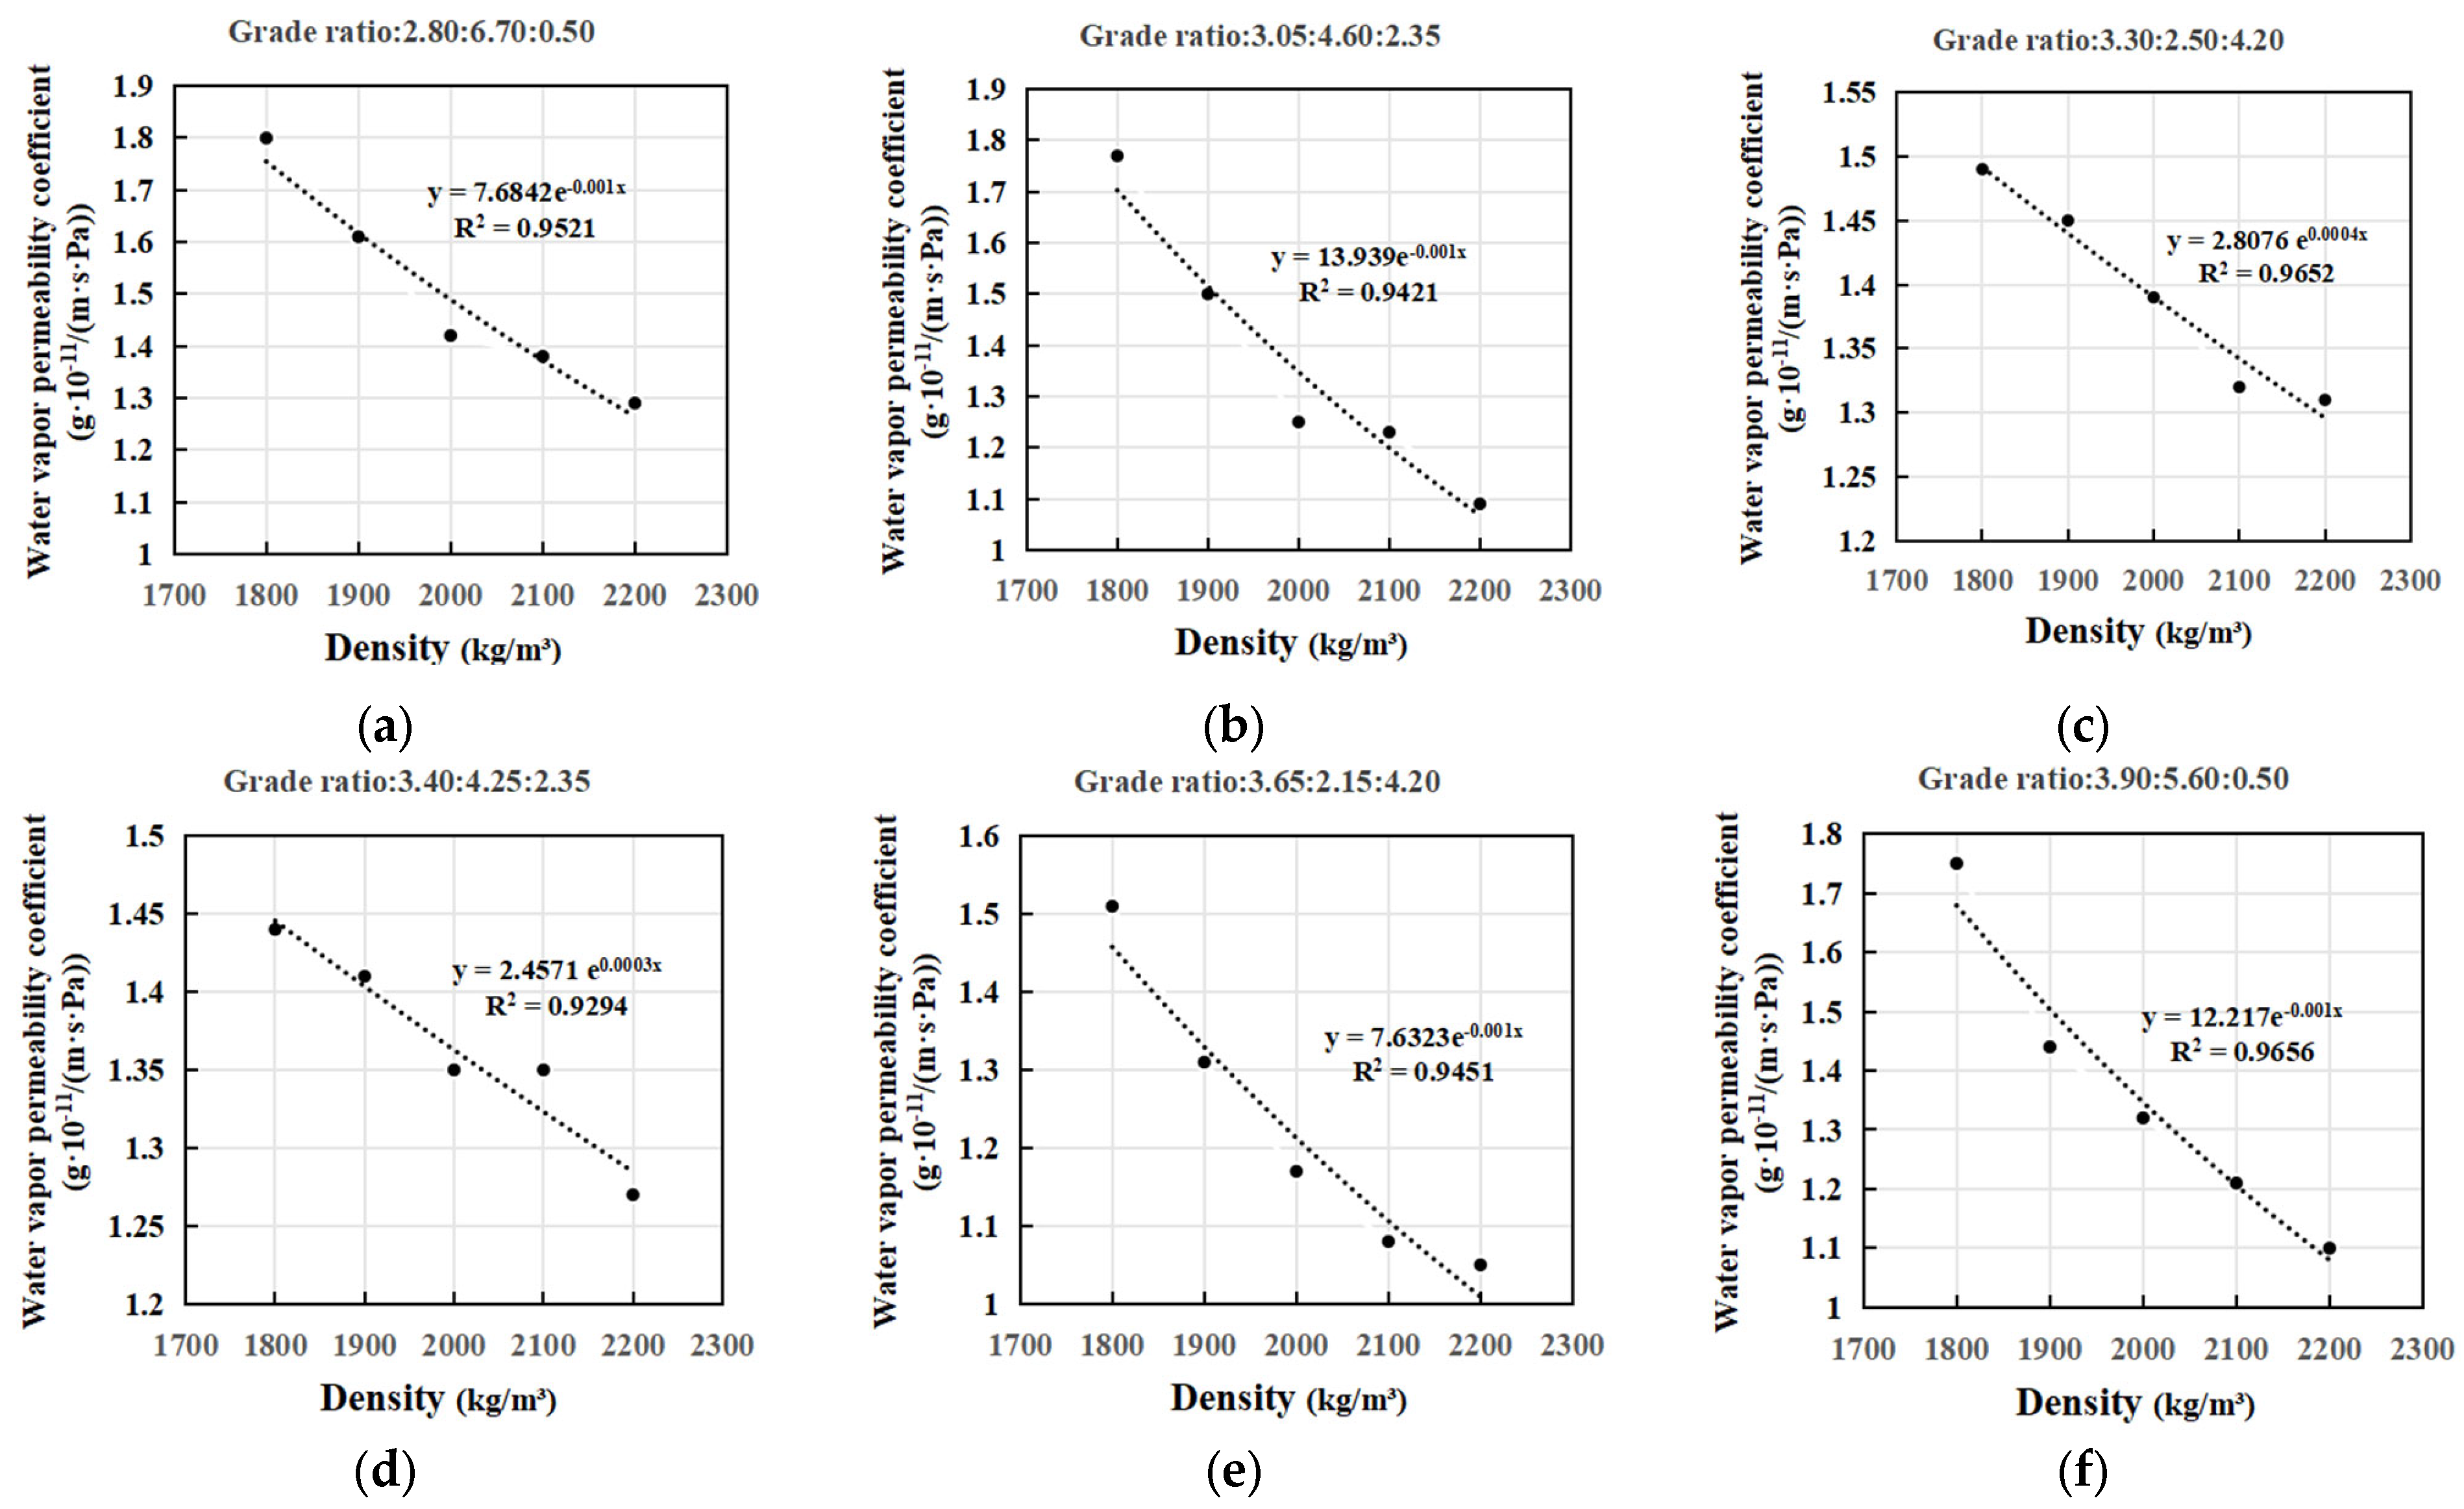
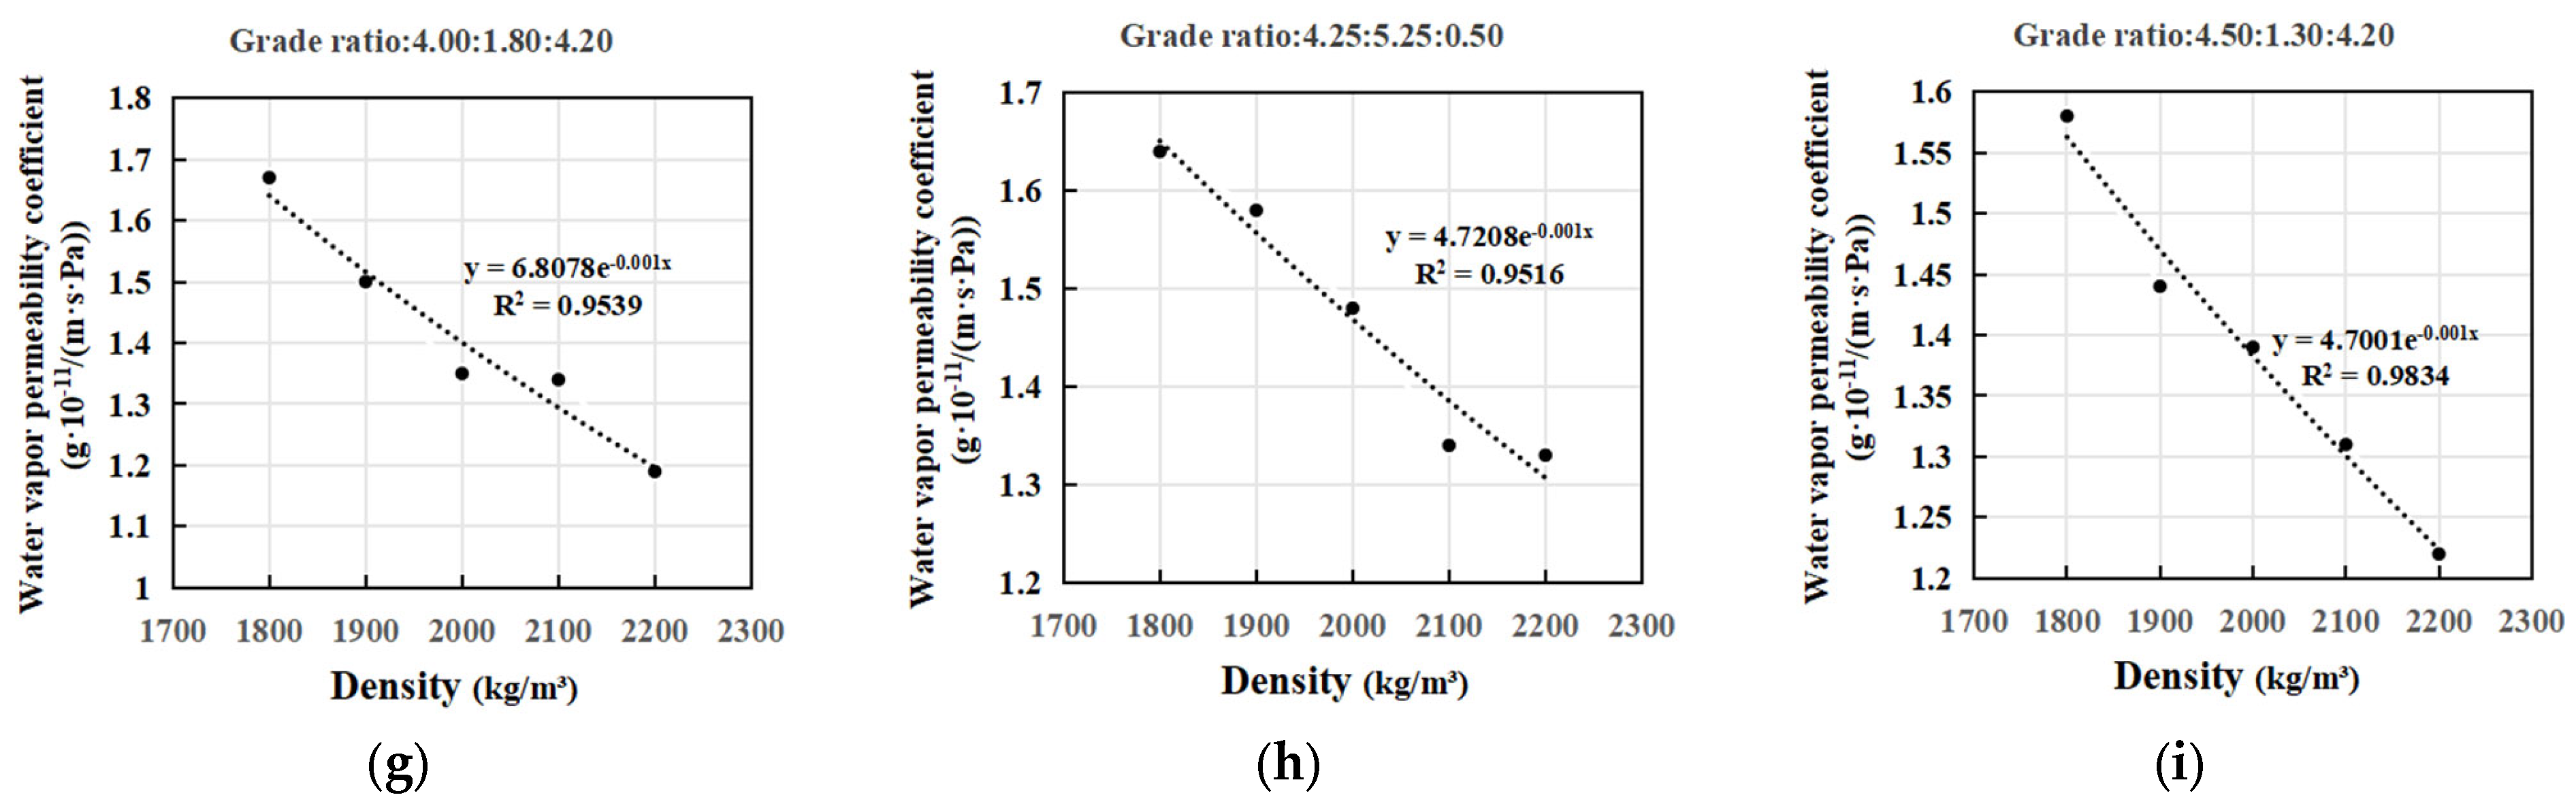
4.2.1. Water Vapor Permeability Coefficient Experimental Results

The vapor permeability coefficients of earth materials with varying clay and sand contents at different densities are presented in Table 7. These experimental results were fitted to a power function relationship, as illustrated in Figure 8. It is evident that the water vapor permeability coefficient of the earth material decreases with increasing density. The overall trend aligns well with the power function relationship, with an average correlation coefficient ranging between 0.925 and 0.983. Specifically, the water vapor permeability coefficient exhibits a decrease as the density of earth specimens increases from 1800 kg/m3 to 2000 kg/m3, followed by a gradual slowing of this decrease as the density rises from 2000 kg/m3 to 2200 kg/m3. On average, the decrease in the water vapor permeability coefficient of earth material is 25.14% when the density increases from 1800 kg/m3 to 2200 kg/m3.

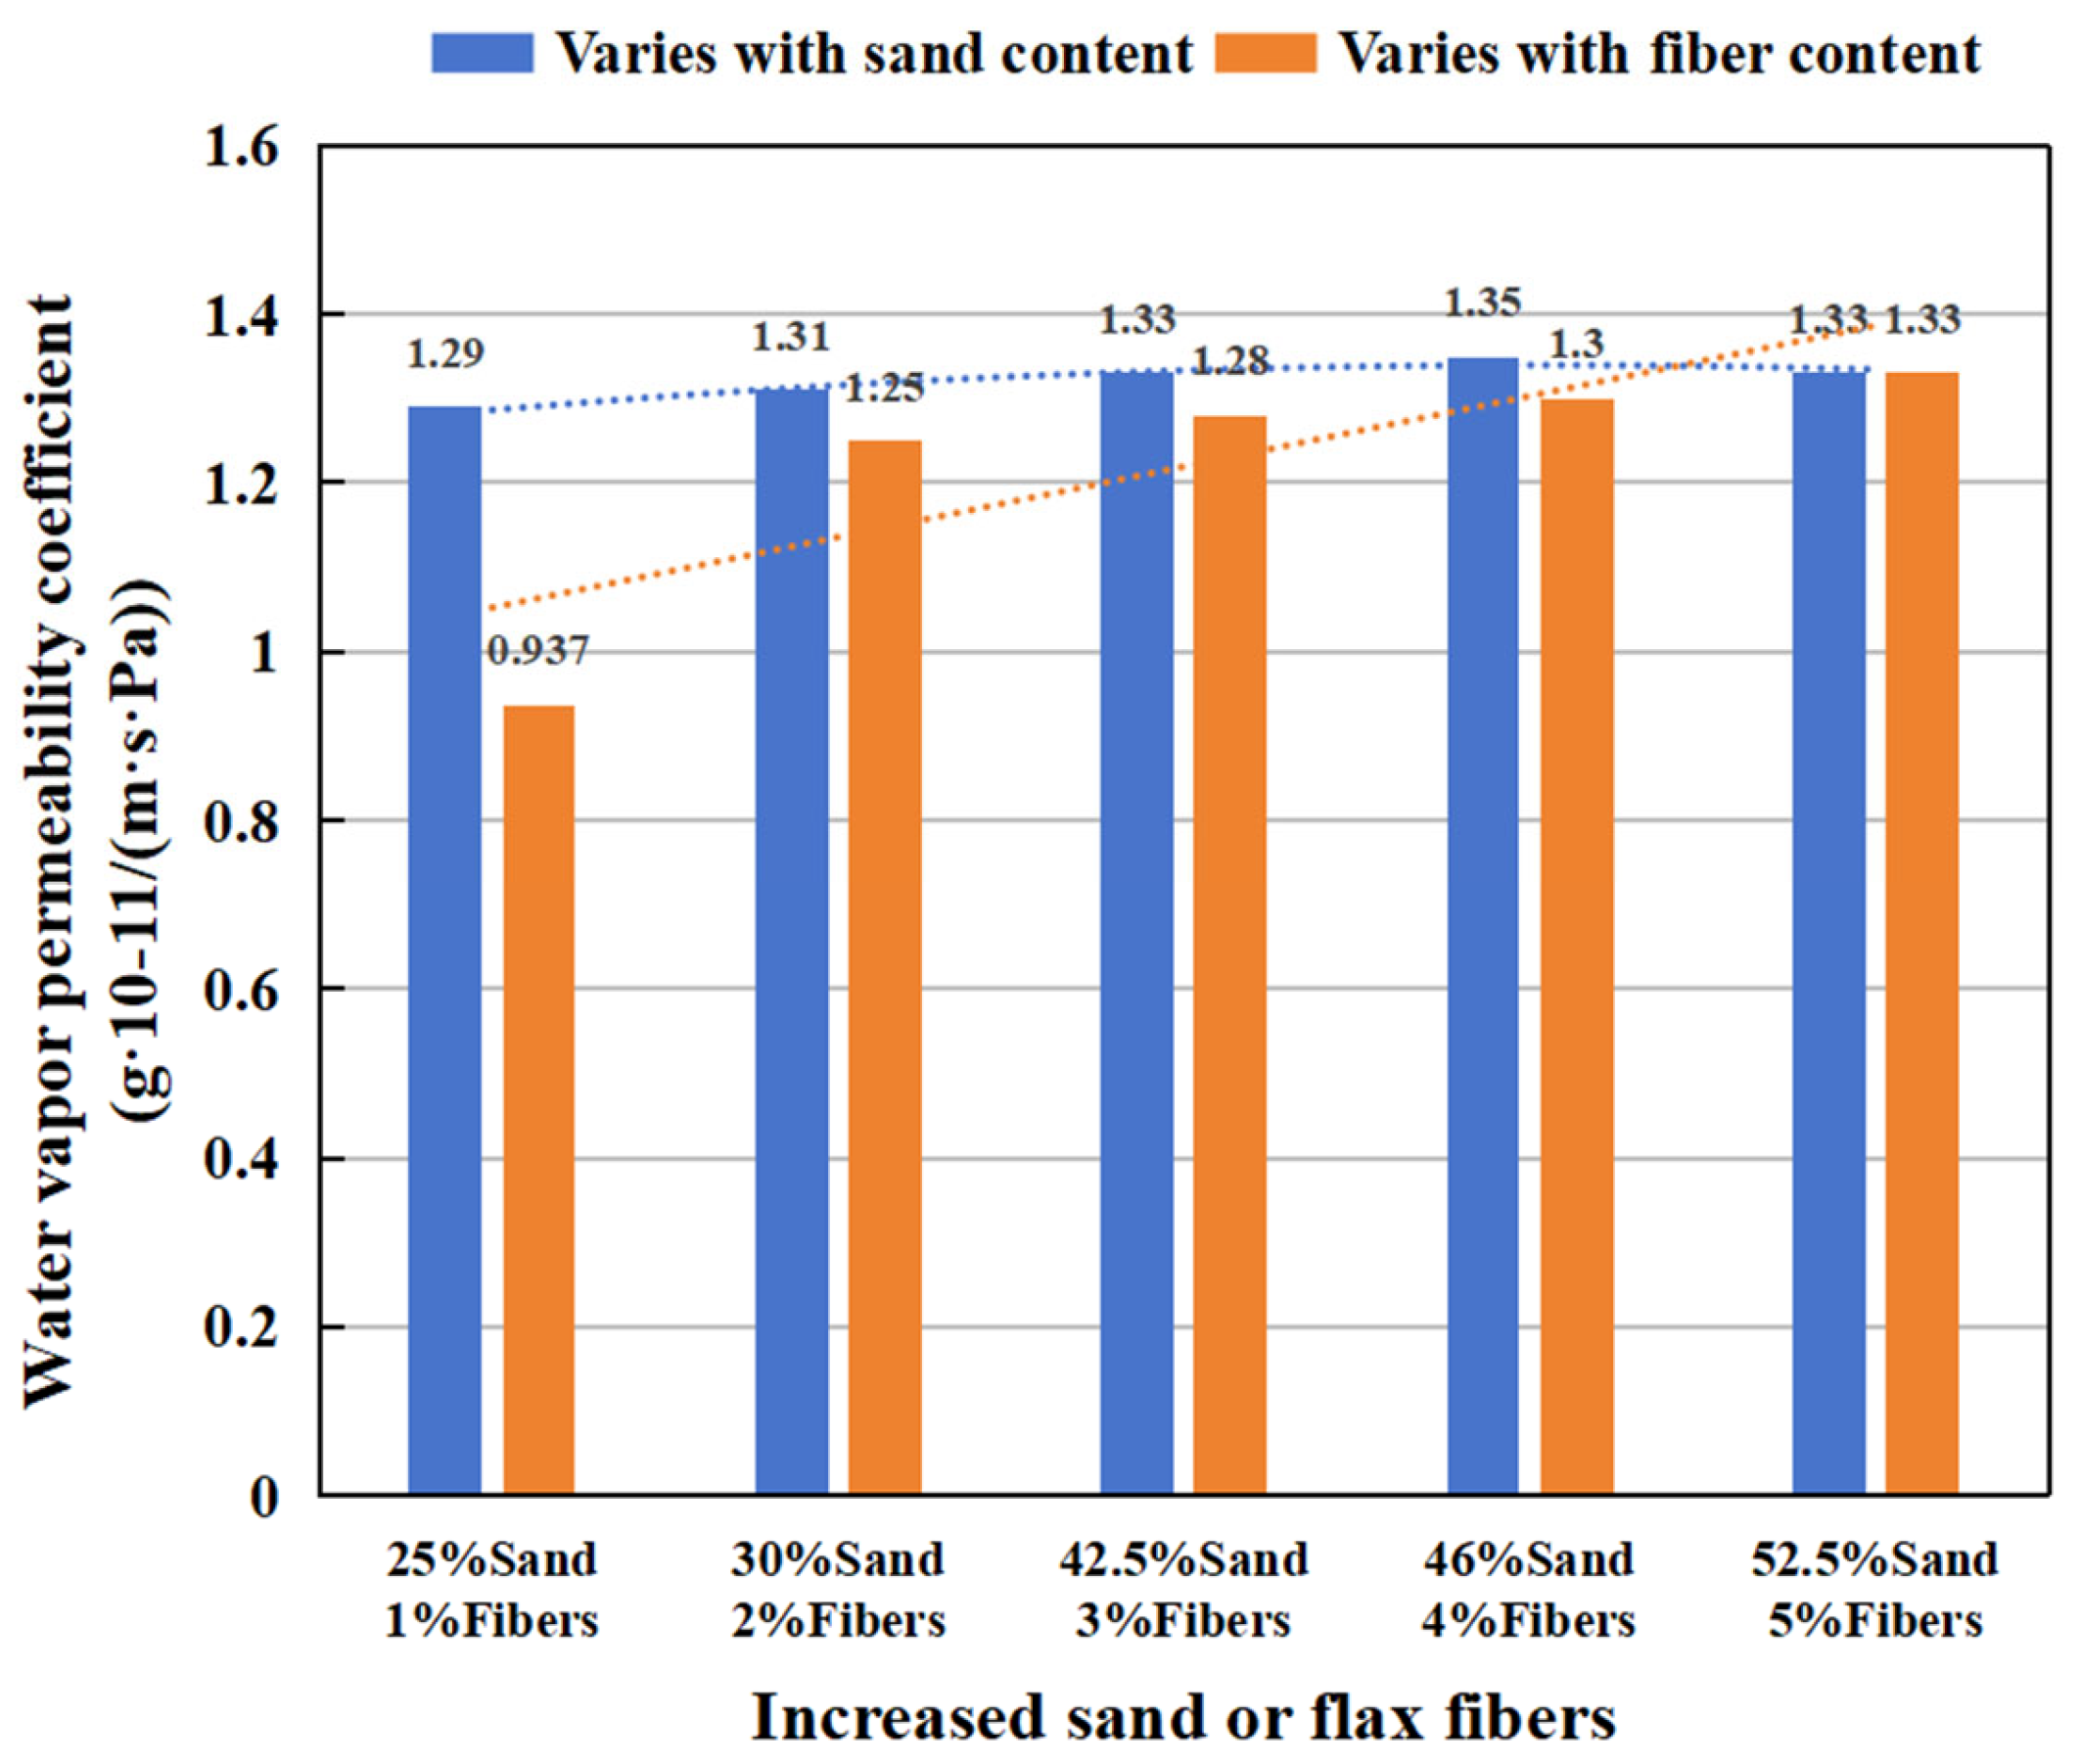
4.2.2. Comparison of Earth Materials with Flax Fibers

Hamrouni and colleagues demonstrated that incorporating flax fibers perpendicular to the water vapor transmission direction enhances the water vapor transmission capacity of earth materials. Earth materials sourced from Normandy, France, were combined with flax fibers to produce test blocks spanning apparent densities of 1652 to 2277 kg/m3. The densities of the test blocks decreased as the flax fiber content increased [32]. Consequently, control group test blocks were prepared using earth with an apparent density of 2000 kg/m3, which comprised 39% clay and a sand content ranging from 25% to 56%. Figure 9 illustrates that the water vapor permeability coefficient of the control group surpassed that of the flax fiber group when the flax fiber content was below 5%. Conversely, with flax fiber percentages exceeding 5%, the water vapor permeability coefficient of the control group fell below that of the flax fiber-enhanced earth material. These results corroborate Hamrouni et al.’s findings and suggest that optimizing earth material based solely on gradation can also improve water vapor permeability.
Furthermore, these findings support previous findings demonstrating that adjusting the clay–sand–gravel ratio alone, without chemical additives, can enhance the porosity and water vapor permeability of earth materials.

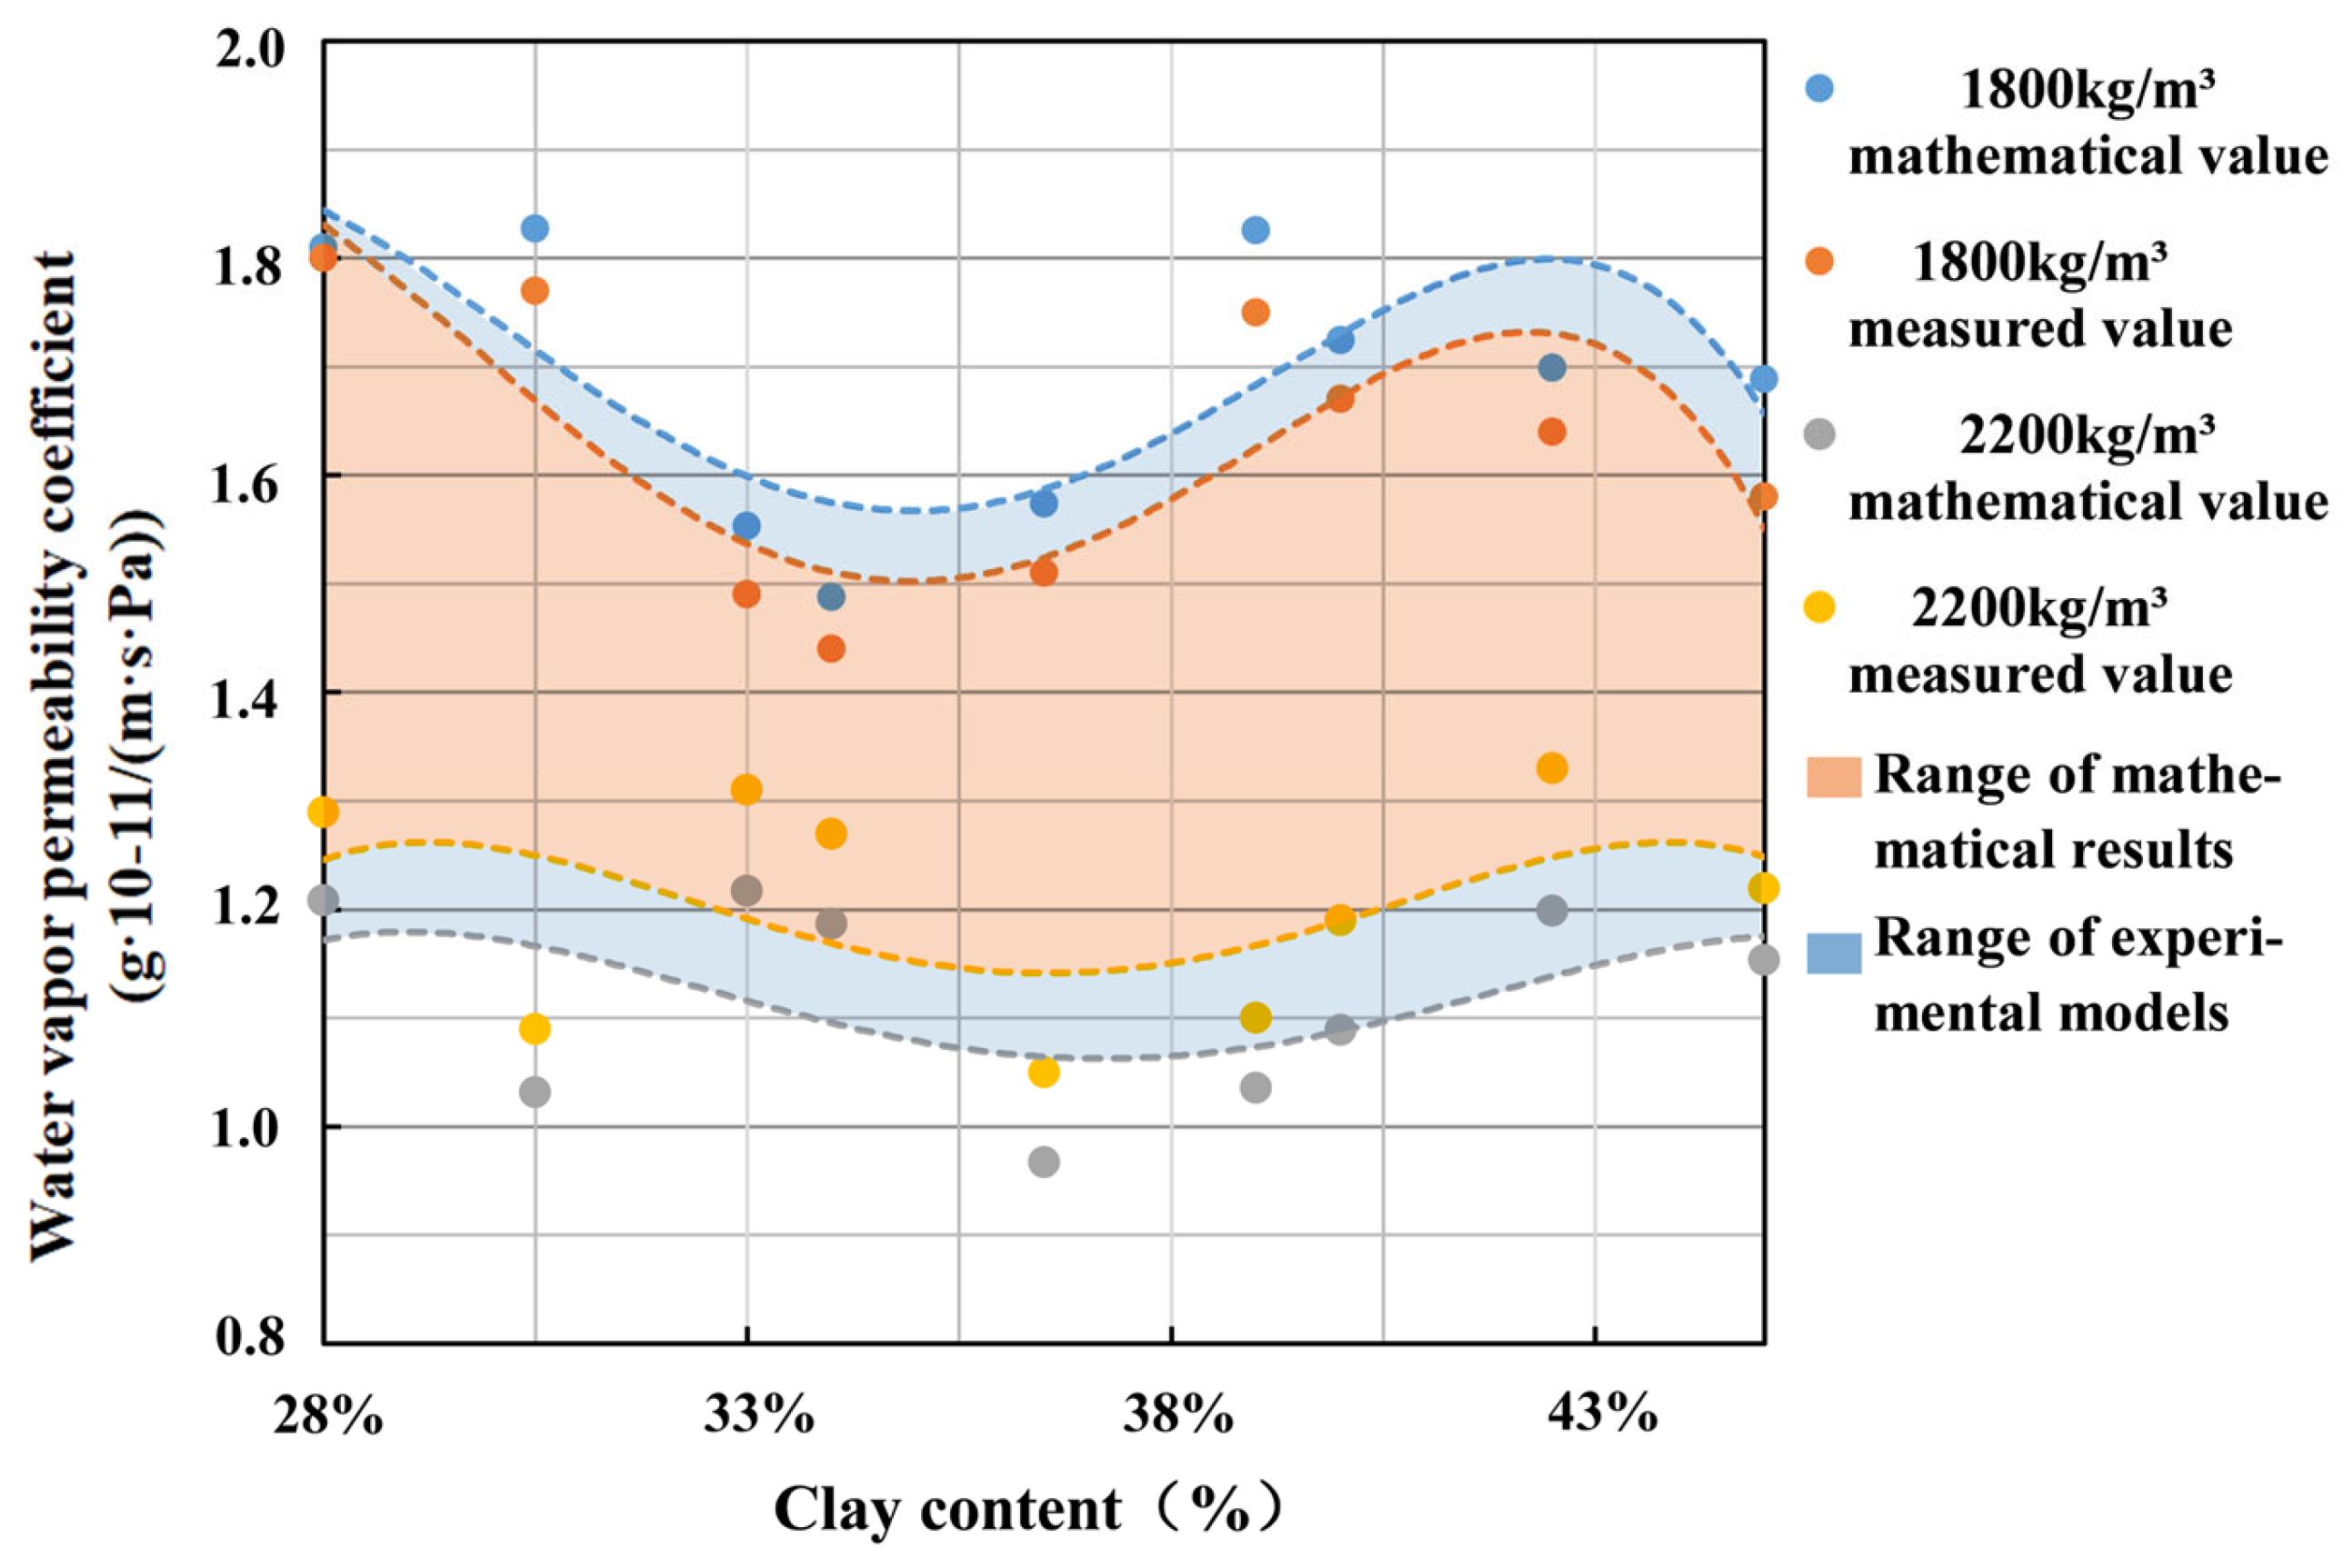
4.3. Validation of the Mathematical Model

4.3.1. Error Analysis of the Mathematical Results and Experimental Results

The water vapor permeability coefficients of earth materials of different gradations were calculated using mathematical modeling and compared with the experimental results. The percentage error between the two datasets was calculated and expressed. Table 8 demonstrates the close agreement between the mathematical results and the experimental results regarding the vapor permeability coefficients of earth materials. The maximum error is 8.99%, with an average error of 5.73% across the nine gradation conditions. The experimental and mathematical values at densities of 1800 kg/m3 and 2200 kg/m3 exhibit higher errors, with an average error reaching 6.99% among the five densities. Possible reasons for the error include the lack of consideration for air interlayer resistance in calculating the experimental results. Another reason is the deviations of the mathematical model from the actual pore structure at higher or lower densities, resulting in larger errors in the mathematical model.
Figure 10 illustrates that the mathematical water vapor permeability coefficient of earth material is higher than that of the experimental results at lower densities but lower than that of the experimental results at higher densities. The water vapor permeability coefficient model for earth material assumes a uniform pore size distribution within the material, and the fractal dimension of the pore area is linked to λ m i n / λ m i n . At a density of 1800 kg/m3, the maximum pore diameter of the earth material exceeds the average pore diameter, resulting in more large pores and a larger pore area fractal dimension, leading to mathematical results that exceed the experimental results. Conversely, at higher densities, the gap between the maximum and average pore diameters decreases, resulting in more small pores and a smaller pore area fractal dimension, contributing to smaller mathematical results.
Table 8 demonstrates a high degree of agreement between the mathematical results and the experimental results regarding clay content in the range of 30.5% to 40%. However, when the clay content is too low or too high, the agreement diminishes, possibly due to differences between the actual pore situation and the assumptions of fractal theory, resulting in mathematical result deviation. The mathematical results align well with the experimental results when the clay content is 42.5% and the sand content ranges from 21% to 56%; however, deviations increase when the sand content falls below 21.5%, possibly due to greater gravel content disrupting the continuous pore structure, resulting in larger mathematical results errors.

4.3.2. Correction of the Mathematical Model

The error rates of the mathematical results and experimental results were fitted using MATLAB, as depicted in Figure 11. The error rate of the mathematical model for the water vapor permeability coefficient, dependent on density, can be fitted as a quadratic function: R2 = 0.8365. Consequently, the mathematical model can be adjusted as follows:
δ c = 7.891 × 10 7 ρ 2 + 3.406 × 10 3 ρ 3.608 π 128 L 0 1 D T A D f . w 3 + D T D f , w λ m a x . w 3 + D T
Here, δ c represents the calculated results of the adjusted mathematical model, while ρ represents the density of the earth material. The earth materials with varying densities are computed using Equation (12), and the discrepancy between the adjusted mathematical results and the experimental results is presented in Table 9. By comparing the adjusted results with the experimental results, the average error decreases from 5.73% to 1.3%. Based on the aforementioned findings, the mathematical model utilized in this study can more precisely forecast the water vapor permeability of earth materials across densities and gradations.

4.4. Effects of Density and Gradation on the Water Vapor Permeability Coefficient

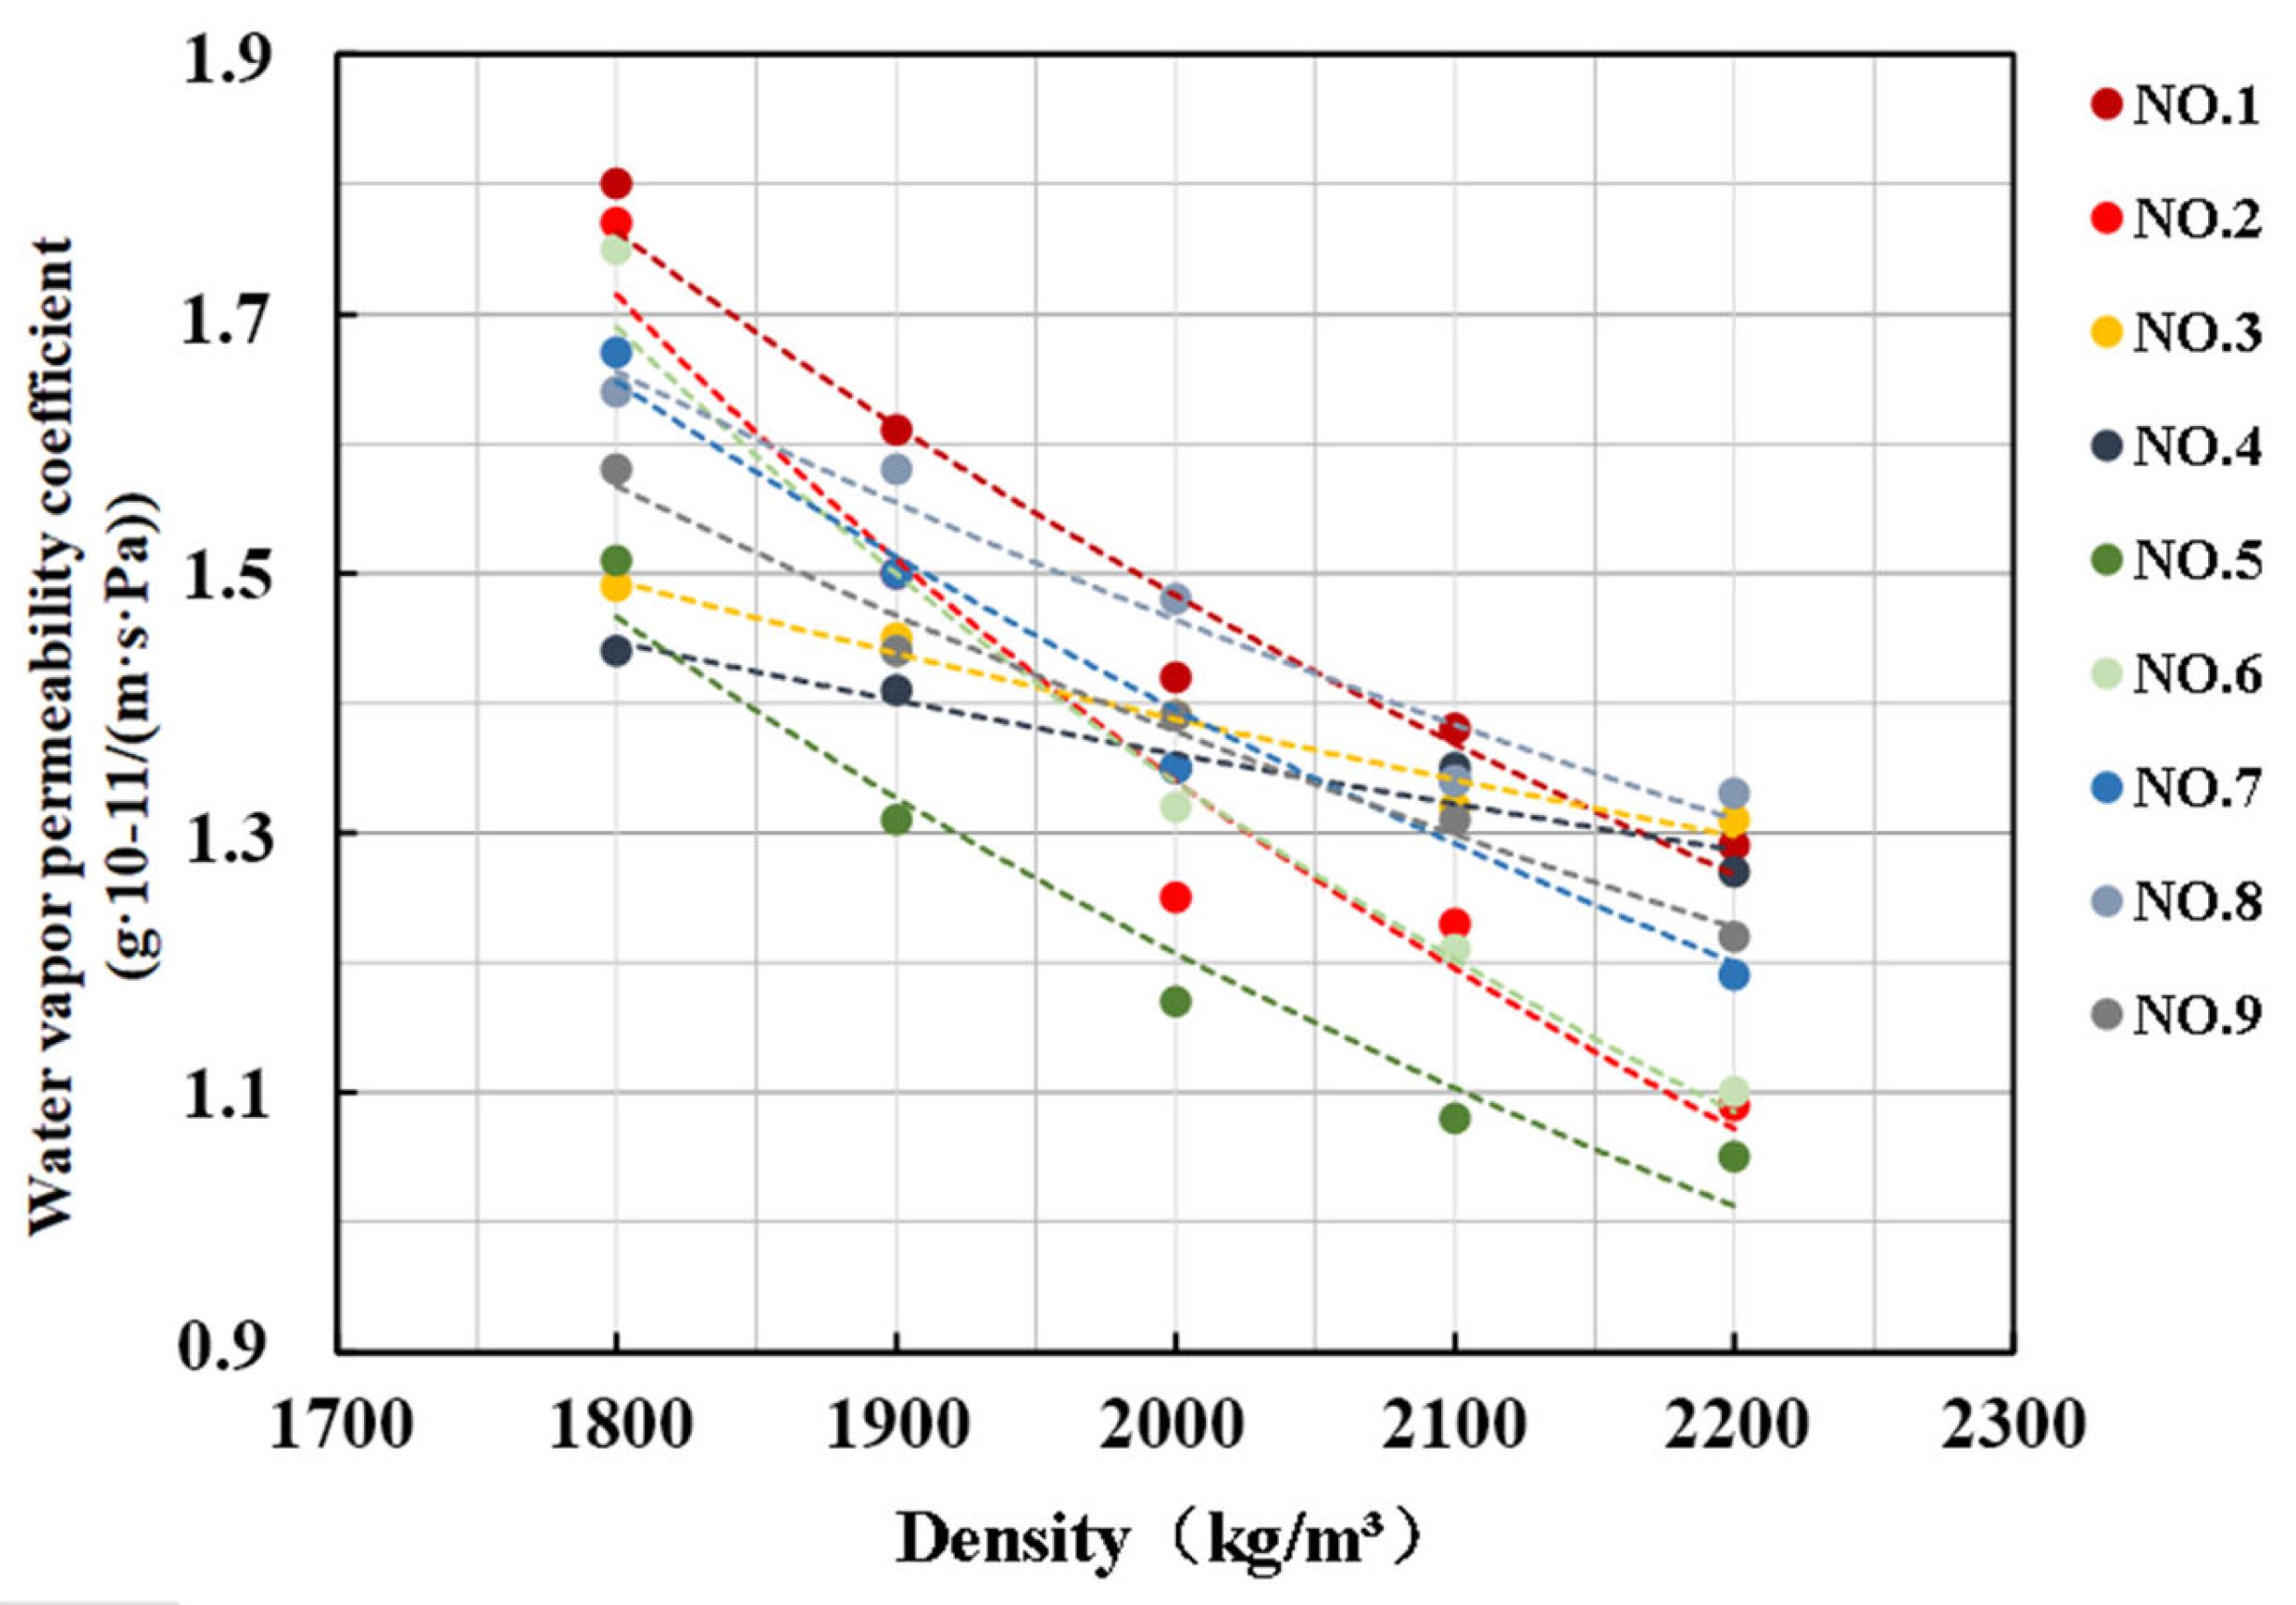
4.4.1. Effect of Density

The variation in the water vapor permeability coefficient related to the density of earth materials was analyzed using MATLAB, as depicted in Figure 12. The fitted curves indicate a power function relationship between the water vapor permeability coefficient and density. As the density increases from 1800 kg/m3 to 2200 kg/m3, there is a concurrent decrease in porosity and the water vapor permeability coefficient of the earth material. This decrease can be attributed to the reduction in porosity and average pore diameter as the density increases, impeding water vapor transmission within the material.
However, the rate of change in the water vapor permeability coefficient varies among different gradations. Notably, the decrease in the water vapor permeability coefficient is more pronounced when the density increases from 1800 kg/m3 to 2000 kg/m3, indicating a higher degree of destruction of the connectivity pore structure within this density range. The decrease in the water vapor permeability coefficient starts to become slower as the density increases from 2000 kg/m3 to 2200 kg/m3. This phenomenon can be attributed to the nearing of the density limit within the test block. The water vapor permeability coefficients of all grades of earth materials remained within the range of 1.80 × 10⁻¹¹~1.05 × 10⁻¹¹ g/(Pa s m2).

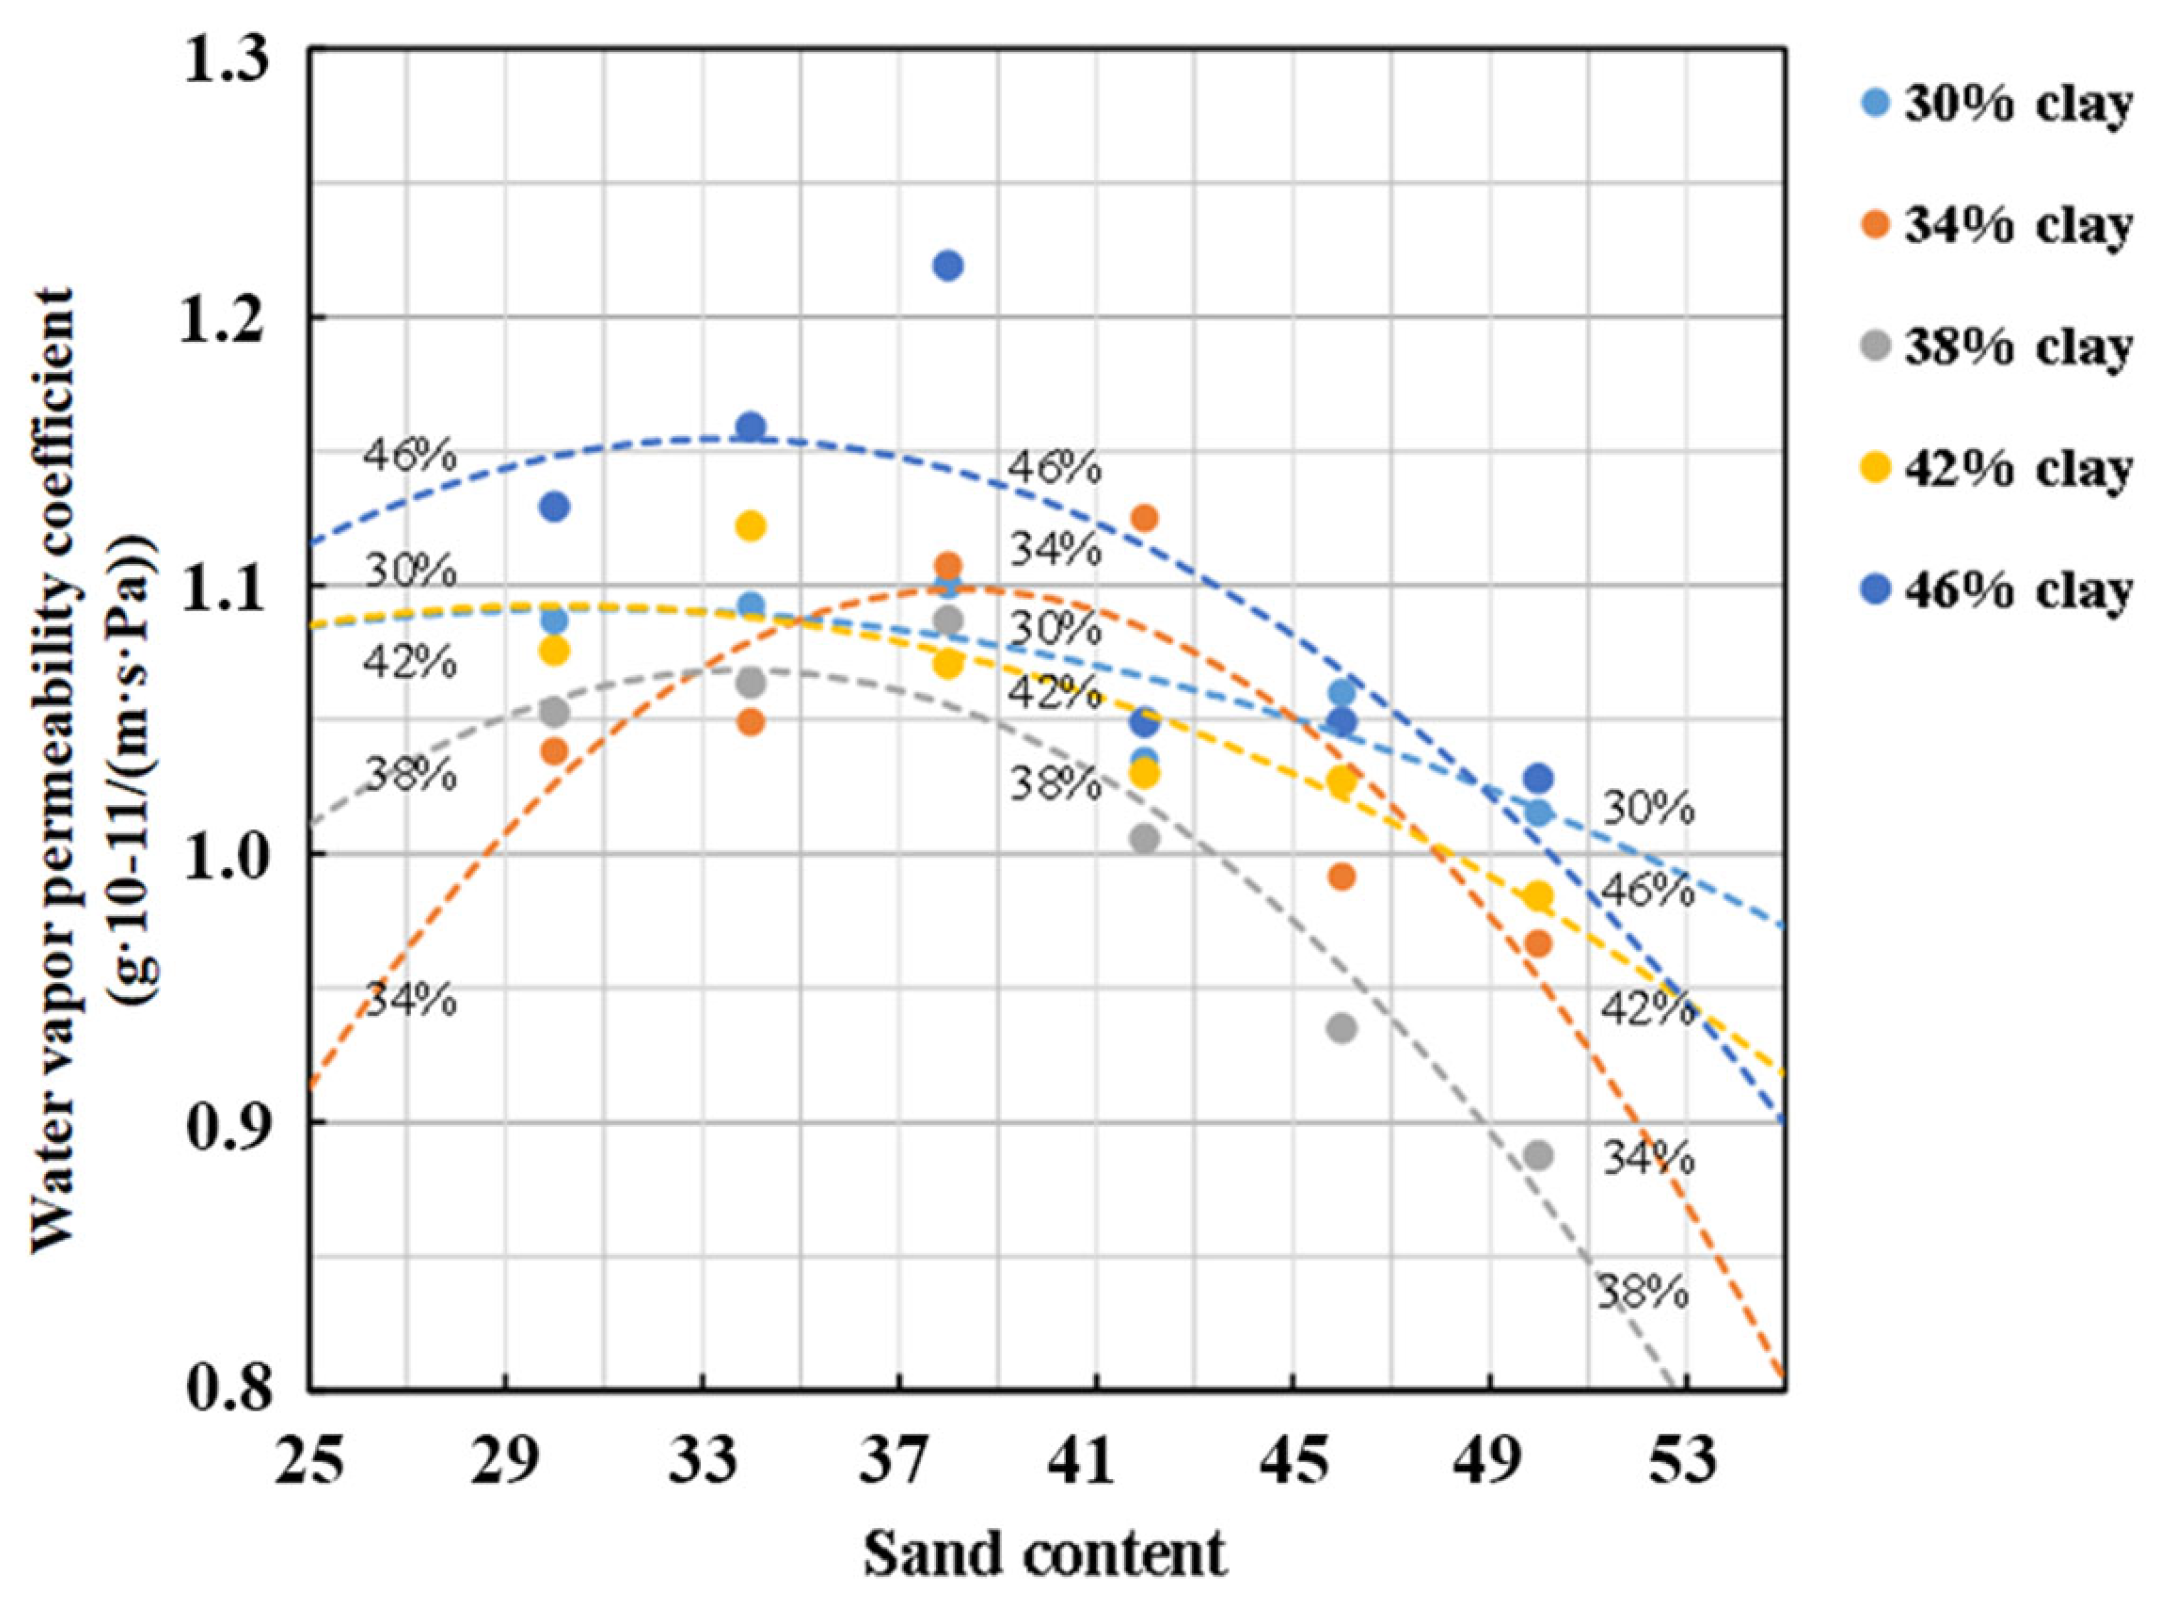
4.4.2. Effect of Gradation

Figure 1 illustrates the similar power function trends in the variation of water vapor permeability coefficients across different densities of earth materials, thus warranting the selection of earth materials with a density of 2000 kg/m3 for further investigation. Subsequently, the water vapor permeability coefficients of earth materials with various gradients were calculated using the mathematical model described above, and the results are presented in Table 10. Additionally, trends in the water vapor permeability coefficients related to clay–sand content were analyzed, revealing an approximate quadratic relationship, as depicted in Figure 13 and Figure 14.
It can be observed in Figure 13 and Figure 14 that the water vapor permeability coefficient of the earth material undergoes significant changes as the proportion of clay and sand varies. With a constant proportion of sand, as the clay content in the earth material increases from 30% to 38%, the water vapor permeability coefficient decreases continuously. However, as the clay content further increases from 38% to 46%, the water vapor permeability coefficient starts to increase. Additionally, it is evident that when the sand proportion is within the range of 30% to 38%, the water vapor permeability coefficient increases with the increase in sand proportion. Conversely, when the sand proportion exceeds 42%, the water vapor permeability coefficient decreases with the increase in sand proportion.
Consequently, it can be inferred that earth material exhibits the poorest water vapor permeability when the clay content is approximately 38% and the sand content is around 50%, and it achieves optimal water vapor permeability at 46% clay and 34% sand. Based on the analysis, the relevant findings can provide some insights into the optimization of vapor permeability properties of earth materials.

5. Conclusions

This study aims to quantitatively analyze how density and material gradation in earth materials affect their water vapor permeability coefficients. Initially, the fundamental physical parameters of Yunnan red clay utilized in the experiment were determined, followed by an analysis of its porosity. Subsequently, multiple experiments were conducted to determine the water vapor permeability coefficients of test blocks under varying density and clay–sand gradation conditions. Additionally, based on fractal theory, a mathematical model for predicting the water vapor permeability coefficients of earth materials was proposed. The mathematical results were then compared with the experimental results. Ultimately, the accuracy of the mathematical model was optimized. Subsequently, the water vapor permeability coefficient of earth materials was quantitatively analyzed in relation to density and clay–sand gradation. The main findings of the article are as follows:
  • The water vapor permeability coefficient of earth materials is influenced by both density and clay–sand gradation.
  • Utilizing fractal theory, a model was developed to predict the water vapor permeability coefficient of earth materials. By comparing and analyzing the experimental data with the calculated data, the model was further refined, and the final average prediction error was approximately 1.3%.
  • The impacts of clay, sand, and gravel contents on the water vapor permeability coefficient of earth materials were analyzed. The results indicate that as the clay content increases from 30% to 38%, the water vapor permeability continuously decreases. However, when the clay content increases from 38% to 46%, the water vapor permeability begins to increase. For sand content ranging from 30% to 38%, the water vapor permeability increases as the sand content increases. Nevertheless, when the sand content exceeds 42%, the water vapor permeability decreases with the increase in sand content.
Cement, lime, and other gelling materials were intentionally not added to the test blocks in this study. The inclusion of these gelling materials could alter the pore structure and influence the water vapor permeability coefficient of the earth materials. Additionally, the impact of internal moisture content on the water vapor permeability coefficient was not accounted for in this study. Hence, future studies could investigate three key aspects: firstly, the influence of varying quantities of cement or lime on the water vapor permeability coefficient of earth materials; secondly, the impact of earth moisture on water vapor transmission; and thirdly, factors affecting the water vapor permeability coefficient measurement of earthen materials, such as surface effects, air gap thickness, and air flow rate. These investigations could offer a more robust foundation for the energy-efficient design of earth materials.

Author Contributions

Conceptualization, S.Y.; methodology, J.M.; software, S.Y.; validation, J.M., S.Y.; formal analysis, S.Y.; investigation, S.Y.; resources, J.M.; data curation, S.Y.; writing—original draft preparation, S.Y.; writing—review and editing, S.Y.; visualization, S.Y.; supervision, J.M.; project administration, S.Y. and J.M.; funding acquisition, J.M. All authors have read and agreed to the published version of the manuscript.

Funding

This research was funded by the National Natural Science Foundation of China under grant number 52378003 and sponsored by the Beijing Nova Program under grant number 20230484271.

Data Availability Statement

The raw data supporting the conclusions of this article will be made available by the authors upon request.

Conflicts of Interest

The authors declare no conflicts of interest. The funders had no role in the design of the study; the collection, analysis, or interpretation of data; the writing of the manuscript; or the decision to publish the results.

References

  1. Loli, A.; Bertolin, C. Towards Zero-Emission Refurbishment of Historic Buildings: A Literature Review. Buildings 2018, 8, 22. [Google Scholar] [CrossRef]
  2. Schroeder, H. Structures Built of Earth Building Materials—Impacts, Structural Damage and Preservation; Springer: Berlin/Heidelberg, Germany, 2016; pp. 393–503. [Google Scholar] [CrossRef]
  3. Champire, F.; Fabbri, A.; Morel, J.C.; Wong, H.; McGregor, F. Impact of Relative Humidity on The Mechanical Behavior of Compacted Earth as a Building Material. Constr. Build. Mater. 2016, 110, 70–78. [Google Scholar] [CrossRef]
  4. Cagnon, H.; Aubert, J.E.; Coutand, M.; Magniont, C. Hygrothermal Properties of Earth Bricks. Energy Build. 2014, 80, 208–217. [Google Scholar] [CrossRef]
  5. Allinson, D.; Hall, M. Hygrothermal Analysis of a Stabilised Rammed Earth Test Building in the UK. Energy Build. 2010, 42, 845–852. [Google Scholar] [CrossRef]
  6. Ávila, F.; Puertas, E.; Gallego, R. Characterization of the Mechanical and Physical Properties of Unstabilized Rammed Earth: A Review. Constr. Build. Mater. 2020, 270, 121435. [Google Scholar] [CrossRef]
  7. Hall, M.; Allinson, D. Assessing the Effects of Soil Grading on the Moisture Content-Dependent Thermal Conductivity of Stabilised Rammed Earth Materials. Appl. Therm. Eng. 2009, 29, 740–747. [Google Scholar] [CrossRef]
  8. Hall, M.; Allinson, D. Analysis of the Hygrothermal Functional Properties of Stabilised Rammed Earth Materials. Build. Environ. 2009, 44, 1935–1942. [Google Scholar] [CrossRef]
  9. McGregor, F.; Heath, A.; Shea, A.; Lawrence, M. The Moisture Buffering Capacity of Unfired Clay Masonry. Build. Environ. 2014, 82, 599–607. [Google Scholar] [CrossRef]
  10. Minke, G. Building with Earth: Design and Technology of a Sustainable Architecture; Birkhäuser: Basel, Switzerland, 2013. [Google Scholar]
  11. Allinson, D.; Hall, M. Humidity Buffering Using Stabilised Rammed Earth Materials. Proc. Inst. Civ. Eng.-Constr. Mater. 2012, 165, 335–344. [Google Scholar] [CrossRef]
  12. Galán-Marín, C.; Rivera-Gómez, C.; Petric, J. Clay-Based Composite Stabilized with Natural Polymer and Fibre. Constr. Build. Mater. 2010, 24, 1462–1468. [Google Scholar] [CrossRef]
  13. Hibouche, A. Sol Traités Aux Liants: Performances Hydro-Mécaniques et Hygro-Thermiques: Application en BTP. Ph.D. Thesis, 2013. Available online: http://www.theses.fr/2013LEHA0023 (accessed on 5 November 2023).
  14. Adam, E.A.; Jones, P.J. Thermophysical Properties of Stabilised Soil Building Blocks. Build. Environ. 1995, 30, 245–253. [Google Scholar] [CrossRef]
  15. Sindanne, S.A.; Ntamack, G.E.; Sanga, R.P.L.; Moubeke, C.A.; Sallaboui, E.S.K.; Bouabid, H.; Mansouri, K.; D’ouazzane, S.C. Thermophysical Characterization of Earth Blocks Stabilized by Cement, Sawdust and Lime. J. Build. Mater. Struct. 2014, 1, 58–64. [Google Scholar] [CrossRef]
  16. Dondi, M.; Principi, P.; Raimondo, M.; Zanarini, G. Water Vapour Permeability of Clay Bricks. Constr. Build. Mater. 2003, 17, 253–258. [Google Scholar] [CrossRef]
  17. Fabbri, A.; Soudani, L.; McGregor, F.; Morel, J.-C. Analysis of the Water Absorption Test to Assess the Intrinsic Permeability of Earthen Materials. Constr. Build. Mater. 2019, 199, 154–162. [Google Scholar] [CrossRef]
  18. Chinese National Standard GB/T 21650.1-2008; Determination of Pore Size Distribution and Porosity of Solid Materials by Mercury Intrusion and Gas Adsorption—Part 1: Mercury Intrusion Method. Standards Press of China: Beijing, China, 2008.
  19. CEN/ISO. NF EN ISO 5167-4; Measurement of Fluid Flow by Means of Pressure Differential Devices Inserted in Circular Cross-section Conduits Running Full—Part 4: Criteria for Practice. European Committee for Standardization: Brussels, Belgium, 2022.
  20. Musa, H.H.; Hussein, A.M.; Hanoon, A.N.; Hason, M.M.; Abdulhameed, A.A. Phases of Urban Development Impact on the Assessment of Thermal Comfort: A Comparative Environmental Study. Civ. Eng. J. 2022, 8, 951–966. [Google Scholar] [CrossRef]
  21. Houben, H.; Guillard, H. Earth Construction; Intermediate Technology Publications: Rugby, UK, 1989. [Google Scholar] [CrossRef]
  22. Bourlieu, C.; Guillard, V.; Vallès-Pamiès, B.; Guilbert, S.; Gontard, N. Edible Moisture Barriers: How to Assess of Their Potential and Limits in Food Products Shelf-Life Extension? Crit. Rev. Food Sci. Nutr. 2009, 49, 474–499. [Google Scholar] [CrossRef]
  23. Yu, B.; Lee, L.J.; Cao, H. Factal Characters of Pore Microstructures of Textile Fabrics. Fractals 2001, 09, 155–163. [Google Scholar] [CrossRef]
  24. Xu, P.; Qiu, S.; Yu, B.; Jiang, Z. Prediction of Relative Permeability in Unsaturated Porous Media with a Fractal Approach. Int. J. Heat Mass Transf. 2013, 64, 829–837. [Google Scholar] [CrossRef]
  25. Yu, B.; Li, J.; Li, Z.; Zou, M. Permeabilities of Unsaturated Fractal Porous Media. Int. J. Multiph. Flow 2003, 29, 1625–1642. [Google Scholar] [CrossRef]
  26. Wheatcraft, S.W.; Tyler, S.W. An Explanation of Scale-Dependent Dispersivity in Heterogeneous Aquifers Using Concepts of Fractal Geometry. Water Resour. Res. 1988, 24, 566–578. [Google Scholar] [CrossRef]
  27. Yu, B.; Li, J. A Geometry Model for Tortuosity of Flow Path in Porous Media. Chin. Phys. Lett. 2004, 21, 1569–1571. [Google Scholar] [CrossRef]
  28. Yu, B.; Li, J. Some Fractal Characters of Porous. Media 2001, 09, 365–372. [Google Scholar] [CrossRef]
  29. Denn, M.M. Polymer Melt Processing; Cambridge University Press: Cambridge, UK, 2008. [Google Scholar]
  30. Tian, S.-Q.; Wang, K.; Fan, L.-W.; Yu, Z.-T.; Ge, J. Effects of Sample Length on the Transient Measurement Results of Water Vapor Diffusion Coefficient of Porous Building Materials: A Case Study of Autoclave Aerated Concrete (AAC) with Various Porosities. Int. J. Heat Mass Transf. 2019, 135, 209–219. [Google Scholar] [CrossRef]
  31. Zhang, L.; Sang, G.C.; Cui, X.L.; Han, W.X.; Guo, X.N. Hygrothermal Properties of Cement Stabilized Earth Material and Both Temperature and Relative Humidity Distribution of Wall under Periodic Boundary Conditions. J. Xi’an Univ. Technol. 2022, 38, 1. [Google Scholar] [CrossRef]
  32. Hamrouni, I.; Ouahbi, T.; El Hajjar, A.; Taibi, S.; Jamei, M.; Zenzri, H. Water Vapor Permeability of Flax Fibers Reinforced Raw Earth: Experimental and Micro-Macro Modeling. Eur. J. Environ. Civ. Eng. 2022, 27, 3020–3039. [Google Scholar] [CrossRef]
Figure 1. The main chemical components of clay, sand, and gravel.
Buildings 15 01821 g001
Figure 2. Grading of soil materials.(The numbers in the figure represent different gradations).
Buildings 15 01821 g002
Figure 3. Experimental processes.
Buildings 15 01821 g003
Figure 4. Microstructure of typical soil clay particles under the microscope (Image sources: The Mineralogical Society of Great Britain & Ireland and The Clay Minerals Society).
Buildings 15 01821 g004
Figure 5. Schematic representation of the capillary bundle fractal model.
Buildings 15 01821 g005
Figure 6. Relationship between porosity and clay content with different densities.
Buildings 15 01821 g006
Figure 7. Comparison of porosity between grade optimization and cement modification.
Buildings 15 01821 g007
Figure 8. Experimental results of the vapor permeability coefficient of earth materials. (ai) Plots of water vapor permeability coefficients corresponding to the nine gradation configurations.
Buildings 15 01821 g008aBuildings 15 01821 g008b
Figure 9. Comparison between optimized gradation of earth materials and flax fiber modification.
Buildings 15 01821 g009
Figure 10. Comparison of mathematical calculated values and measured values.
Buildings 15 01821 g010
Figure 11. Fitted curve of error rate.
Buildings 15 01821 g011
Figure 12. Relationship between density and the water vapor permeability coefficient.
Buildings 15 01821 g012
Figure 13. Effect of clay content on the vapor permeability coefficient.
Buildings 15 01821 g013
Figure 14. Effect of sand content on the vapor permeability coefficient.
Buildings 15 01821 g014
Table 1. Physical performance indicators of soil.
Particle Size Range (mm)Clay
≤0.005
Silt
0.005~0.08
Sand
0.08~2
Gravel
2~10
Percentage (%)66.8524.917.590.65
Table 2. Technical requirement of soil.
Sample AddressLiquidity IndexLiquid Limit (%)Plastic Limit (%)Plastic IndexClassification
Ruhei Village<0.2570.145.124.6High liquid Mit (MHR)
Table 3. Test block gradation combination.
NO.Grade Ratio (a:b:c)Mass Ratios (a:b:c)
1800 (kg/m3)1900 (kg/m3)2000 (kg/m3)2100 (kg/m3)2200 (kg/m3)
12.80:6.70:0.501.13:2.71:0.201.20:2.86:0.211.20:2.86:0.211.20:2.86:0.211.20:2.86:0.21
23.05:4.60:2.351.24:1.86:0.951.30:1.97:1.001.30:1.97:1.001.30:1.97:1.001.30:1.97:1.00
33.30:2.50:4.201.34:1.01:1.701.41:1.07:1.801.41:1.07:1.801.41:1.07:1.801.41:1.07:1.80
43.40:4.25:2.351.38:1.72:0.951.45:1.82:1.001.45:1.82:1.001.45:1.82:1.001.45:1.82:1.00
53.65:2.15:4.201.48:0.87:1.701.56:0.92:1.801.56:0.92:1.801.56:0.92:1.801.56:0.92:1.80
63.90:5.60:0.501.58:2.27:0.201.67:2.39:0.211.67:2.39:0.211.67:2.39:0.211.67:2.39:0.21
74.00:1.80:4.201.62:0.73:1.701.71:0.77:1.801.71:0.77:1.801.71:0.77:1.801.71:0.77:1.80
84.25:5.25:0.501.72:2.13:0.201.82:2.24:0.211.82:2.24:0.211.82:2.24:0.211.82:2.24:0.21
94.50:1.30:4.201.82:0.53:1.701.92:0.56:1.801.92:0.56:1.801.92:0.56:1.801.92:0.56:1.80
Note: a, b, and c are the mass of clay, sand, and gravel respectively.
Table 4. Porosity (%) of test blocks with different particle sizes.
Bulk Density (kg/m3)Porosity (%)
NO.123456789
1800 (kg/m3)28.1326.4326.2525.9426.6730.3327.2828.8127.05
1900 (kg/m3)27.0925.7124.7225.5825.9426.4025.3828.4026.79
2000 (kg/m3)23.8823.5721.8524.5425.3822.4723.8626.2624.95
2100 (kg/m3)23.3022.3821.4723.6424.6922.4523.0724.6823.79
2200 (kg/m3)21.5422.2820.9821.9923.6422.1022.2122.4522.37
Table 5. Data on different gradations of test blocks.
NO.Density
(kg/m3)
Porosityd λ m a x (mm) λ m i n λ m a x D f D t S w
1200023.88%2~0.6660.011.79621.12010.0545
2200023.57%2~0.6640.011.79071.12140.0555
3200021.85%2~0.6590.011.77981.12950.0562
4200024.54%2~0.06710.011.79661.11720.0542
5200025.38%2~0.6770.011.80141.11370.0505
6200022.47%2~0.6550.011.78381.12650.055
7200023.86%2~0.6660.011.79251.12010.0538
8200026.26%2~0.6830.011.80641.11020.0529
9200024.95%2~0.6740.011.79901.11550.052
Table 6. Mathematical calculations of water vapor permeability coefficients of test blocks.
NO.Grade Ratio (a:b:c)Water Vapor Transmission Rate ( g / ( m · s · P a ) )
1800 (kg/m3)1900 (kg/m3)2000 (kg/m3)2100 (kg/m3)2200 (kg/m3)
12.80:6.70:0.501.810 × 10−111.555 × 10−111.340 × 10−111.304 × 10−111.208 × 10⁻¹¹
23.05:4.60:2.351.827 × 10−111.437 × 10−111.204 × 10−111.173 × 10−111.031 × 10⁻¹¹
33.30:2.50:4.201.554 × 10−111.401 × 10−111.330 × 10−111.249 × 10−111.217 × 10⁻¹¹
43.40:4.25:2.351.488 × 10−111.360 × 10−111.307 × 10−111.262 × 10−111.187 × 10⁻¹¹
53.65:2.15:4.201.574 × 10−111.274 × 10−111.115 × 10−111.014 × 10−119.673 × 10⁻¹²
63.90:5.60:0.501.825 × 10−111.469 × 10−111.279 × 10−111.146 × 10−111.036 × 10⁻¹¹
74.00:1.80:4.201.725 × 10−111.437 × 10−111.291 × 10−111.258 × 10−111.089 × 10⁻¹¹
84.25:5.25:0.501.699 × 10−111.534 × 10−111.432 × 10−111.260 × 10−111.199 × 10⁻¹¹
94.50:1.30:4.201.689 × 10−111.394 × 10−111.364 × 10−111.213 × 10−111.153 × 10⁻¹¹
Table 7. Water vapor permeability coefficients of test blocks.
NO.Grade Ratio (a:b:c)Water Vapor Transmission Rate ( g / ( m · s · P a ) )
1800 (Kg/m3)1900 (Kg/m3)2000 (Kg/m3)2100 (Kg/m3)2200 (Kg/m3)
12.80:6.70:0.501.80 × 10−111.61 × 10−111.42 × 10−111.38 × 10−111.29 × 10⁻¹¹
23.05:4.60:2.351.77 × 10−111.50 × 10−111.25 × 10−111.23 × 10−111.09 × 10⁻¹¹
33.30:2.50:4.201.49 × 10−111.45 × 10−111.39 × 10−111.32 × 10−111.31 × 10⁻¹¹
43.40:4.25:2.351.44 × 10−111.41 × 10−111.35 × 10−111.35 × 10−111.27 × 10⁻¹¹
53.65:2.15:4.201.51 × 10−111.31 × 10−111.17 × 10−111.08 × 10−111.05 × 10⁻¹¹
63.90:5.60:0.501.75 × 10−111.44 × 10−111.32 × 10−111.21 × 10−111.10 × 10⁻¹¹
74.00:1.80:4.201.67 × 10−111.50 × 10−111.35 × 10−111.34 × 10−111.19 × 10⁻¹¹
84.25:5.25:0.501.64 × 10−111.58 × 10−111.48 × 10−111.34 × 10−111.33 × 10⁻¹¹
94.50:1.30:4.201.58 × 10−111.44 × 10−111.39 × 10−111.31 × 10−111.22 × 10⁻¹¹
Note: a, b, and c are the mass of clay, sand, and gravel, respectively.
Table 8. Error rates of mathematical model.
Bulk Density (kg/m3)Deviation
NO.123456789
1800 (kg/m3)6.55%3.22%4.27%3.34%4.24%4.30%5.28%3.60%8.99%
1900 (kg/m3)3.40%4.17%3.42%3.38%2.78%1.99%4.19%2.89%3.22%
2000 (kg/m3)5.58%3.63%7.26%3.18%4.70%3.07%4.37%3.22%5.58%
2100 (kg/m3)5.49%4.61%5.34%6.55%6.12%5.30%6.13%5.99%7.44%
2200 (kg/m3)6.33%5.37%7.10%6.52%7.87%5.86%8.48%9.88%5.46%
Table 9. Error rates of the corrected mathematical model.
Bulk Density (kg/m3)Deviation
NO.123456789
1800 (kg/m3)2.76%0.18%−0.84%0.06%−0.81%−0.87%0.12%−0.20%−3.35%
1900 (kg/m3)1.96%2.75%1.99%1.94%1.34%−3.51%2.76%1.44%1.78%
2000 (kg/m3)0.87%−1.17%−0.51%−1.65%−0.05%−1.76%−0.40%−1.61%−3.07%
2100 (kg/m3)−1.03%−1.97%−1.19%0.10%−0.36%−1.24%−0.35%−0.50%1.04%
2200 (kg/m3)−0.27%−1.30%0.55%−0.07%1.37%−0.78%2.02%3.52%−1.21%
Table 10. Water vapor transmission rate of different graded earth materials.
NO. Sand (%)
303438424650
Clay (%)301.09 × 10−111.09 × 10−111.10 × 10−111.03 × 10−111.06 × 10−111.02 × 10⁻¹¹
341.04 × 10−111.05 × 10−111.11 × 10−111.12 × 10−119.92 × 10−129.67 × 10⁻¹²
381.05 × 10−111.06 × 10−111.09 × 10−111.01 × 10−119.35 × 10−128.88 × 10⁻¹²
421.08 × 10−111.12 × 10−111.07 × 10−111.03 × 10−111.03 × 10−119.84 × 10⁻¹²
461.13 × 10−111.16 × 10−111.22 × 10−111.05 × 10−111.05 × 10−111.03 × 10⁻¹¹
Disclaimer/Publisher’s Note: The statements, opinions and data contained in all publications are solely those of the individual author(s) and contributor(s) and not of MDPI and/or the editor(s). MDPI and/or the editor(s) disclaim responsibility for any injury to people or property resulting from any ideas, methods, instructions or products referred to in the content.

