1. Introduction
Rock-socketed piles are widely used in important structures due to their high bearing capacity and excellent seismic resistance. In engineering practice, artificial digging or mechanical rotary drilling often results in roughness on the inner wall of the pile hole. The roughness of the pile shaft significantly influences the bearing characteristics, axial force distribution, and resistance mobilization of rock-socketed piles.
Domestic and international scholars have extensively researched pile shaft roughness and load transfer mechanisms, achieving abundant results. Liu Y N, et al. [
1] represented the pile roughness as a series of isosceles triangles of the same size. Based on the energy principle and introducing a roughness degradation coefficient, the vertical load transfer formula considering the roughness was derived. Zhao M H, et al. [
2,
3,
4] simplified the pile–rock interface into regular triangular sawtooth joints and simulated the exertion of side resistance at the pile–rock interface by indoor large-sized straight shear model tests. Xing H F, et al. [
5] suggested that the shear mechanism of the pile–rock interface should also consider the cementation effect between the pile and rock. They derived a load transfer equation accounting for cementation failure and thoroughly discussed the distribution patterns of side resistance and axial force. Liu J et al. [
6] introduced a roughness factor based on the Horvath and Monash models, proposing an analytical solution for pile side resistance that considers wall roughness. Tehrani F S et al. [
7] studied the effect of pile roughness and soil density on the soil response during model pile loading and concluded that the affected zone around the pile expands with increasing pile roughness and soil density. Dai G, et al. [
8] simulated pile–rock interface roughness using sinusoidal undulations and studied the effects of sidewall roughness and base stiffness on the load response of rock-socketed piles in weak artificial rock. Gutiérrez-Ch J G et al. [
9,
10] investigated and quantified the effect of roughness on the shear mechanism of rock-socketed piles by loading aluminum alloy model piles with varying roughness in a centrifuge. Liu et al. [
11] established a fitted relationship between shear strength and roughness of the concrete–sand interface based on the monotonic and cyclic shear test results. Murali A K et al. [
12] investigated the micromechanics of the pile–rock interface bearing mechanism using the discrete element method and found that the rock roughness greatly determines its failure mode. Kim G et al. [
13,
14] demonstrated that pile shaft roughness can effectively enhance the ultimate bearing capacity. Wang Q Y, et al. [
15] used a mixture of sand and mortar to simulate bedrock and Plexiglas rods to simulate piles, respectively, and found that the load–settlement curve grows gently with the increase in the pile surface roughness, and that the greater the ultimate capacity, the lower the percentage of the pile tip resistance and the greater the shaft resistance.
Existing studies have revealed the shear mechanism and load transfer behavior at the localized rock–concrete rough interface, demonstrating that the side resistance and end bearing of piles work synergistically to support the upper loads. However, in stratified rock formations, the influence of pile shaft roughness (RF) on load transfer in rock-socketed piles remains unclear. Current design codes for calculating the ultimate bearing capacity of rock-socketed piles do not account for the effect of shaft roughness, leading to overly conservative designs for piles in karst formations to ensure structural safety, which results in significant material waste. In this study, Horvath’s definition of roughness [
16] is adopted, and other influencing factors are controlled to investigate the effects of RF on the bearing behavior and load transfer of rock-socketed piles in stratified rock layers through model load tests. This research aims to enhance the scientific understanding of the bearing mechanisms of pile foundations in complex karst formations and refine the theoretical framework for foundation design. The findings hold significant scientific value and societal benefits, contributing to the advancement of infrastructural construction, economic development, and green construction practices in China’s karst regions.
2. Introduction of Model Test
2.1. Model Test Scheme Design
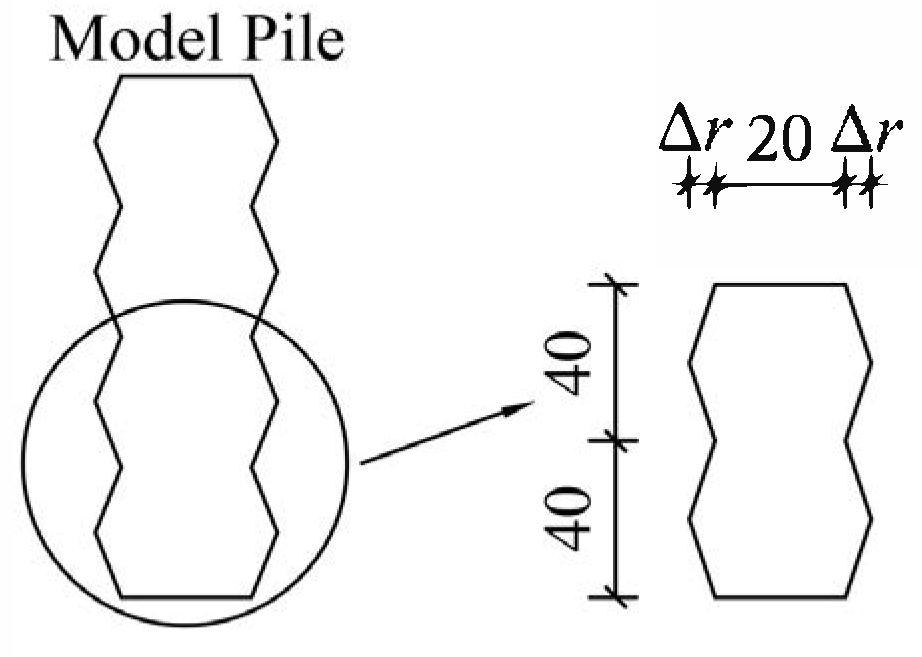
2.1.1. Rough Morphology Design of Pile Body
The formula for calculating the roughness factor (
RF) proposed by Horvath is shown in Equation (1).
In the formula, represents the average radial expansion length of the borehole wall protrusions, rs denotes the average radius of the borehole wall, Lt is the total length of the borehole profile curve along the depth direction, Ls refers to the actual drilling depth, indicates the relative protrusion length of the borehole wall, reflecting radial variations in the borehole geometry, and characterizes the axial variation in the borehole wall, describing its longitudinal shape irregularity.
The roughness morphology of the test pile is designed as a regular and continuous concave–convex triangle. Different values are designed to represent different roughnesses of the test pile. As shown in
Figure 1, the design scheme of the model pile is set out in
Table 1.
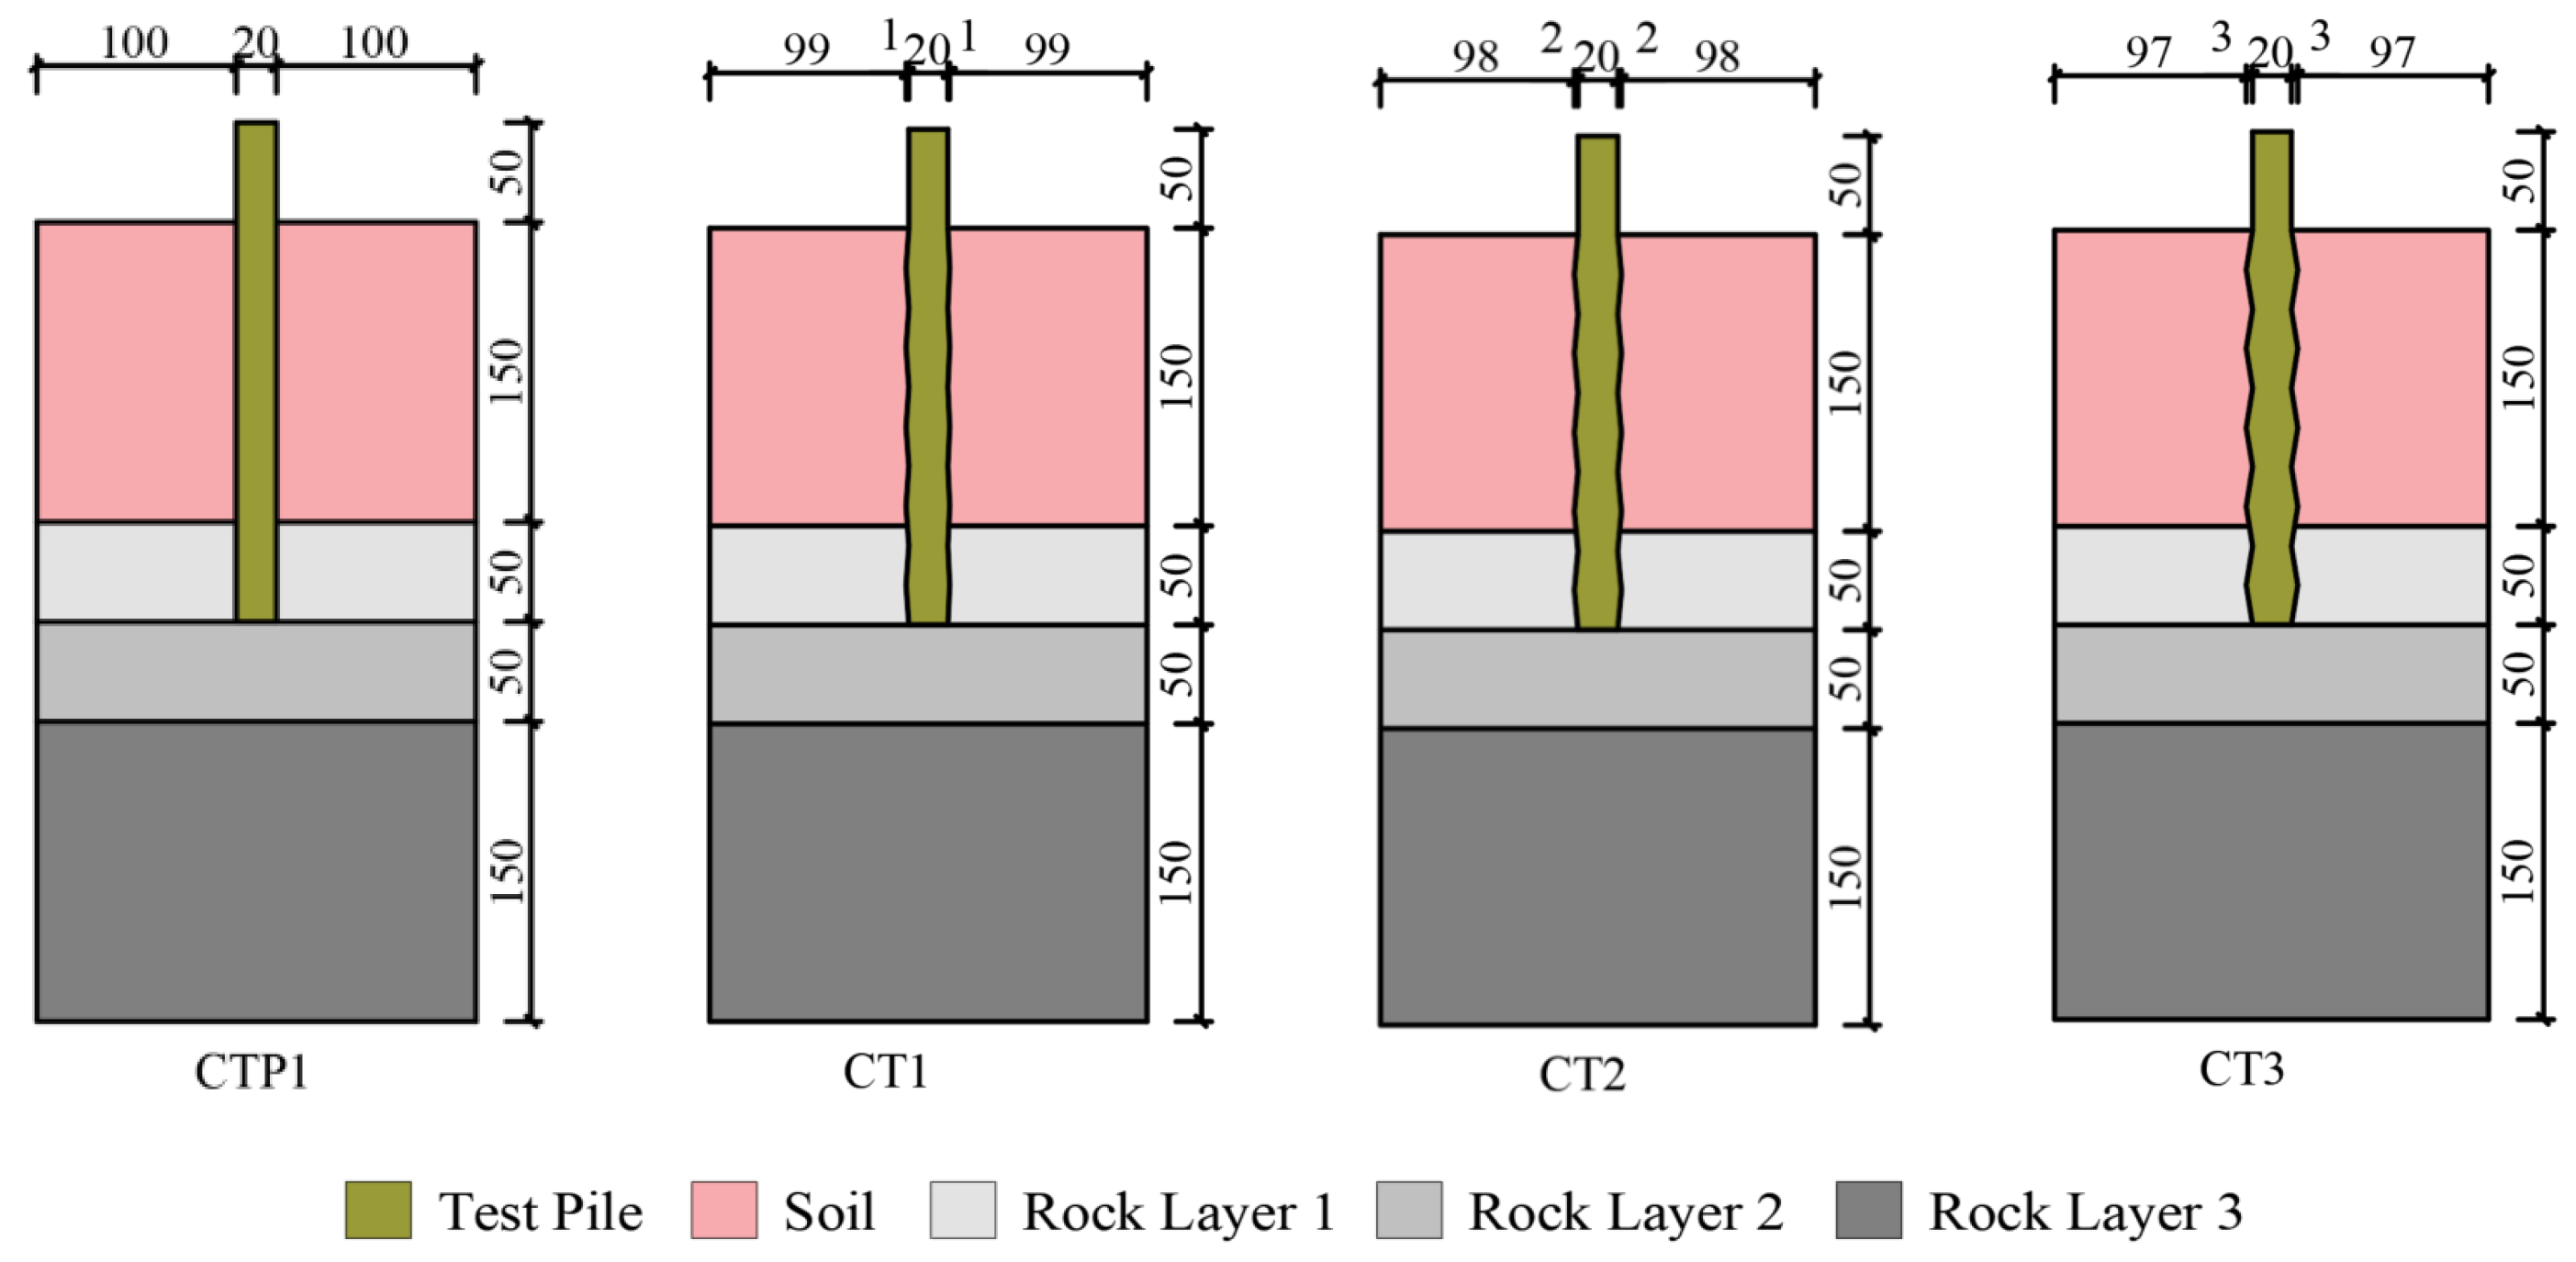
2.1.2. Model Test Design
The model scale is 220 mm × 220 mm × 400 mm, the diameter of the test pile is 20 mm, the length of the pile is 250 mm, the embedded depth is 2.5D (D is the diameter of the test pile), and the pile head is 50 mm. A total of four test piles were set up, in which the test pile with RF = 0.0 was used as the control group, and the specific test scheme is shown in
Figure 2.
2.2. Test Pile and Model Materials
The test piles were made of high-strength cement mortar material with components in the following proportions: cement: silica fume powder: steel slag micro-powder: quartz sand: water: water-reducing agent = 1:0.525:0.2:0.25:0.5:0.017 [
17]. The simulated rock was prepared using a mixture of sand, cement, and water in different ratios with a certain amount of rapid hardener. The design compressive strengths of the simulated bedrock were 5 MPa, 10 MPa, and 15 MPa in descending order. The actual compressive strength of the simulated bedrock is shown in
Table 2.
2.3. Model Test Procedure
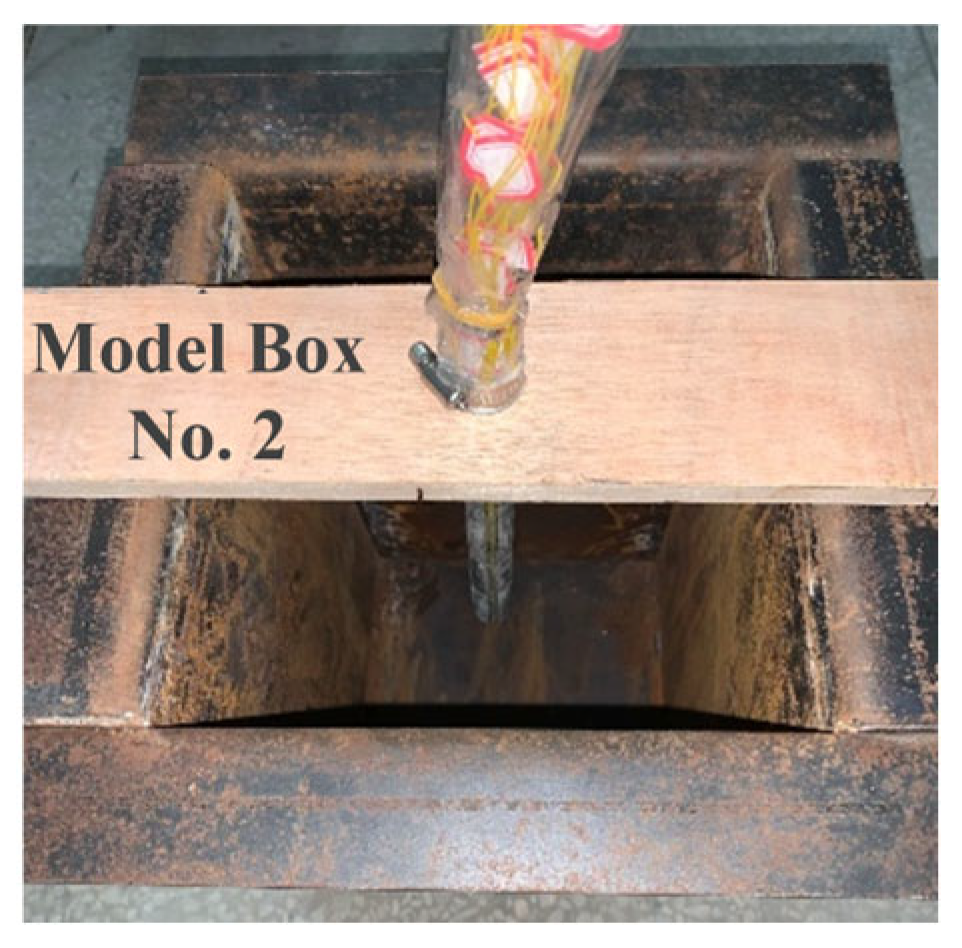
- (1)
The 3D printing method was used to make an ABS membrane tool for the test pile, 4 mm wide and 3 mm deep convex strips were set up in the four directions inside the membrane tool to reserve the grooves for the deployment of strain gauges, and the reinforcing cage was added to increase the bending strength of the test pile.
- (2)
After the test pile maintenance was completed, and strain gauges were pasted on the pile body. and strain gauges were pasted on the pile body. The placement of these strain gauges is shown in
Figure 3.
- (3)
After fixing the position of the test pile, fill the cement mortar in layers and vibrate it densely, maintain the rock layer in the initial solidification state, and then pour the next rock layer, as shown in
Figure 4.
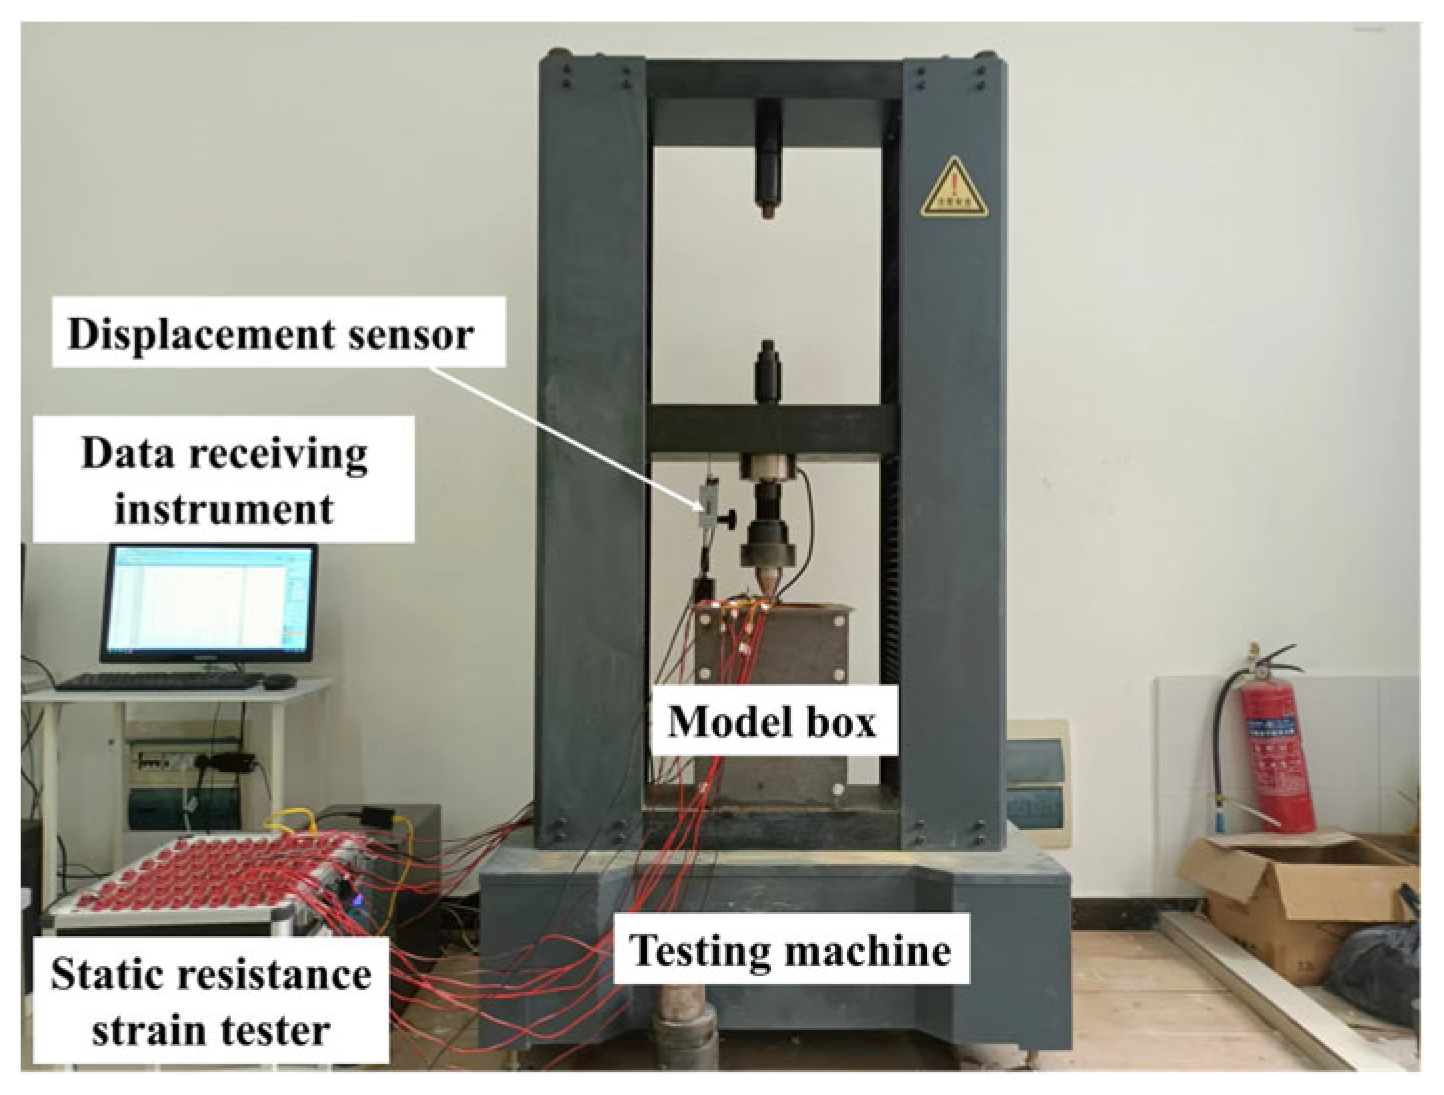
- (4)
The model is placed on the pressurized platform of the testing machine, and the measuring element is connected to the resistance strain gauge to open the control software and debug the instrument. The deployment of the data acquisition system is shown in
Figure 5.
- (5)
The loading method adopts an equal-penetration-rate loading method, where the loading rate is 1 mm/min, loading until there is test pile damage or simulated bedrock damage.
- (6)
Observe the failure mode and organize test data.
3. Test Results and Analysis
The load–displacement curve of the test pile was obtained by an XS(082)F universal testing machine (This instrument is manufactured by Shanghai Xusai Instrument Co., Ltd. in Shanghai, China), and the load at the displacement of 10% pile diameter (0.1D = 2 mm) [
18] was taken as the ultimate load value. Through the calculation and processing of strain gauge strain data, the load transfer law of the pile body was obtained.
3.1. Failure Mode
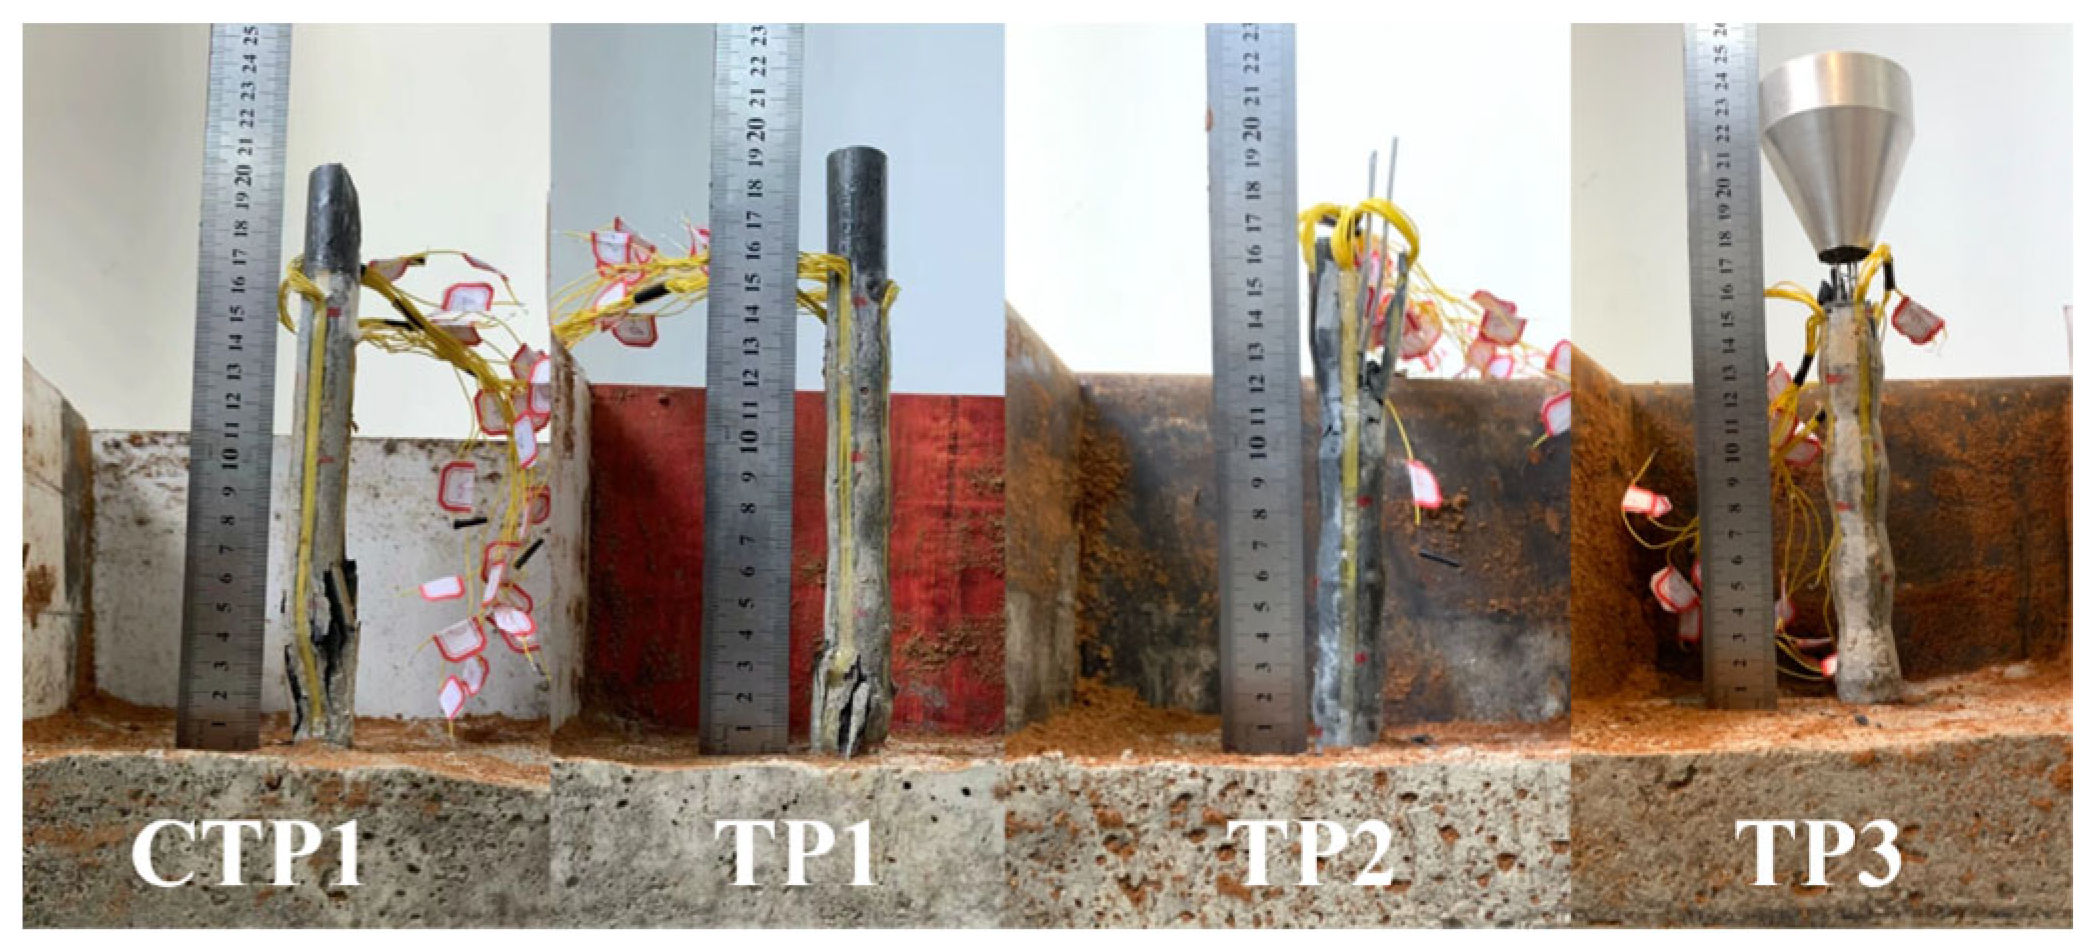
The model piles all showed the characteristics of rock-socketed end-bearing piles, and the test piles underwent compression-splitting failure before the rock layer, as shown in
Figure 6. The loads and displacements of test pile failure are shown in
Table 3. The maximum load values of the test piles are relatively close to each other, which is mainly determined by the nature of the pile body material.
3.2. Load–Displacement Curve
The load–displacement curves of each test pile are shown in
Figure 7. The overall trend of the load–displacement curves is of a slow-varying type, and the displacement of the pile body increases with the increase in the pile top load, but the slope of the curve changes in the range of displacement of 1.5–1.8 mm. The pile head displacement consists of two components: pile shaft compression deformation and pile tip settlement, with the latter being relatively minor. During the initial loading stage, the pile shaft undergoes elastic deformation, and the load-displacement curve exhibits a linear variation. As the load increases, the pile deformation transitions into the plastic stage, accompanied by a gradual reduction in deformation rate. Consequently, the load–displacement curves progressively evolve, exhibiting an upward concave trend.
The ultimate bearing capacity of each test pile is shown in
Table 4.
As shown in
Table 4, the ultimate bearing capacity of test piles TP1, TP2, and TP3 increased by 44.9%, 203.7%, and 176.4%, respectively, compared with that of test pile CTP1, which indicates that the presence of concave and convex bodies can greatly increase the ultimate bearing capacity of the pile foundation. The ultimate bearing capacity of the test pile increases gradually with RFs from 0.0 to 0.3, which shows a trend of increasing and then decreasing. The ultimate bearing capacity of the test pile TP2 is the largest when RF is 0.2, which indicates that the roughness factor is not the larger, the better; there is an optimal roughness factor, and the optimal RF is 0.2 in this test.
3.3. Axial Force
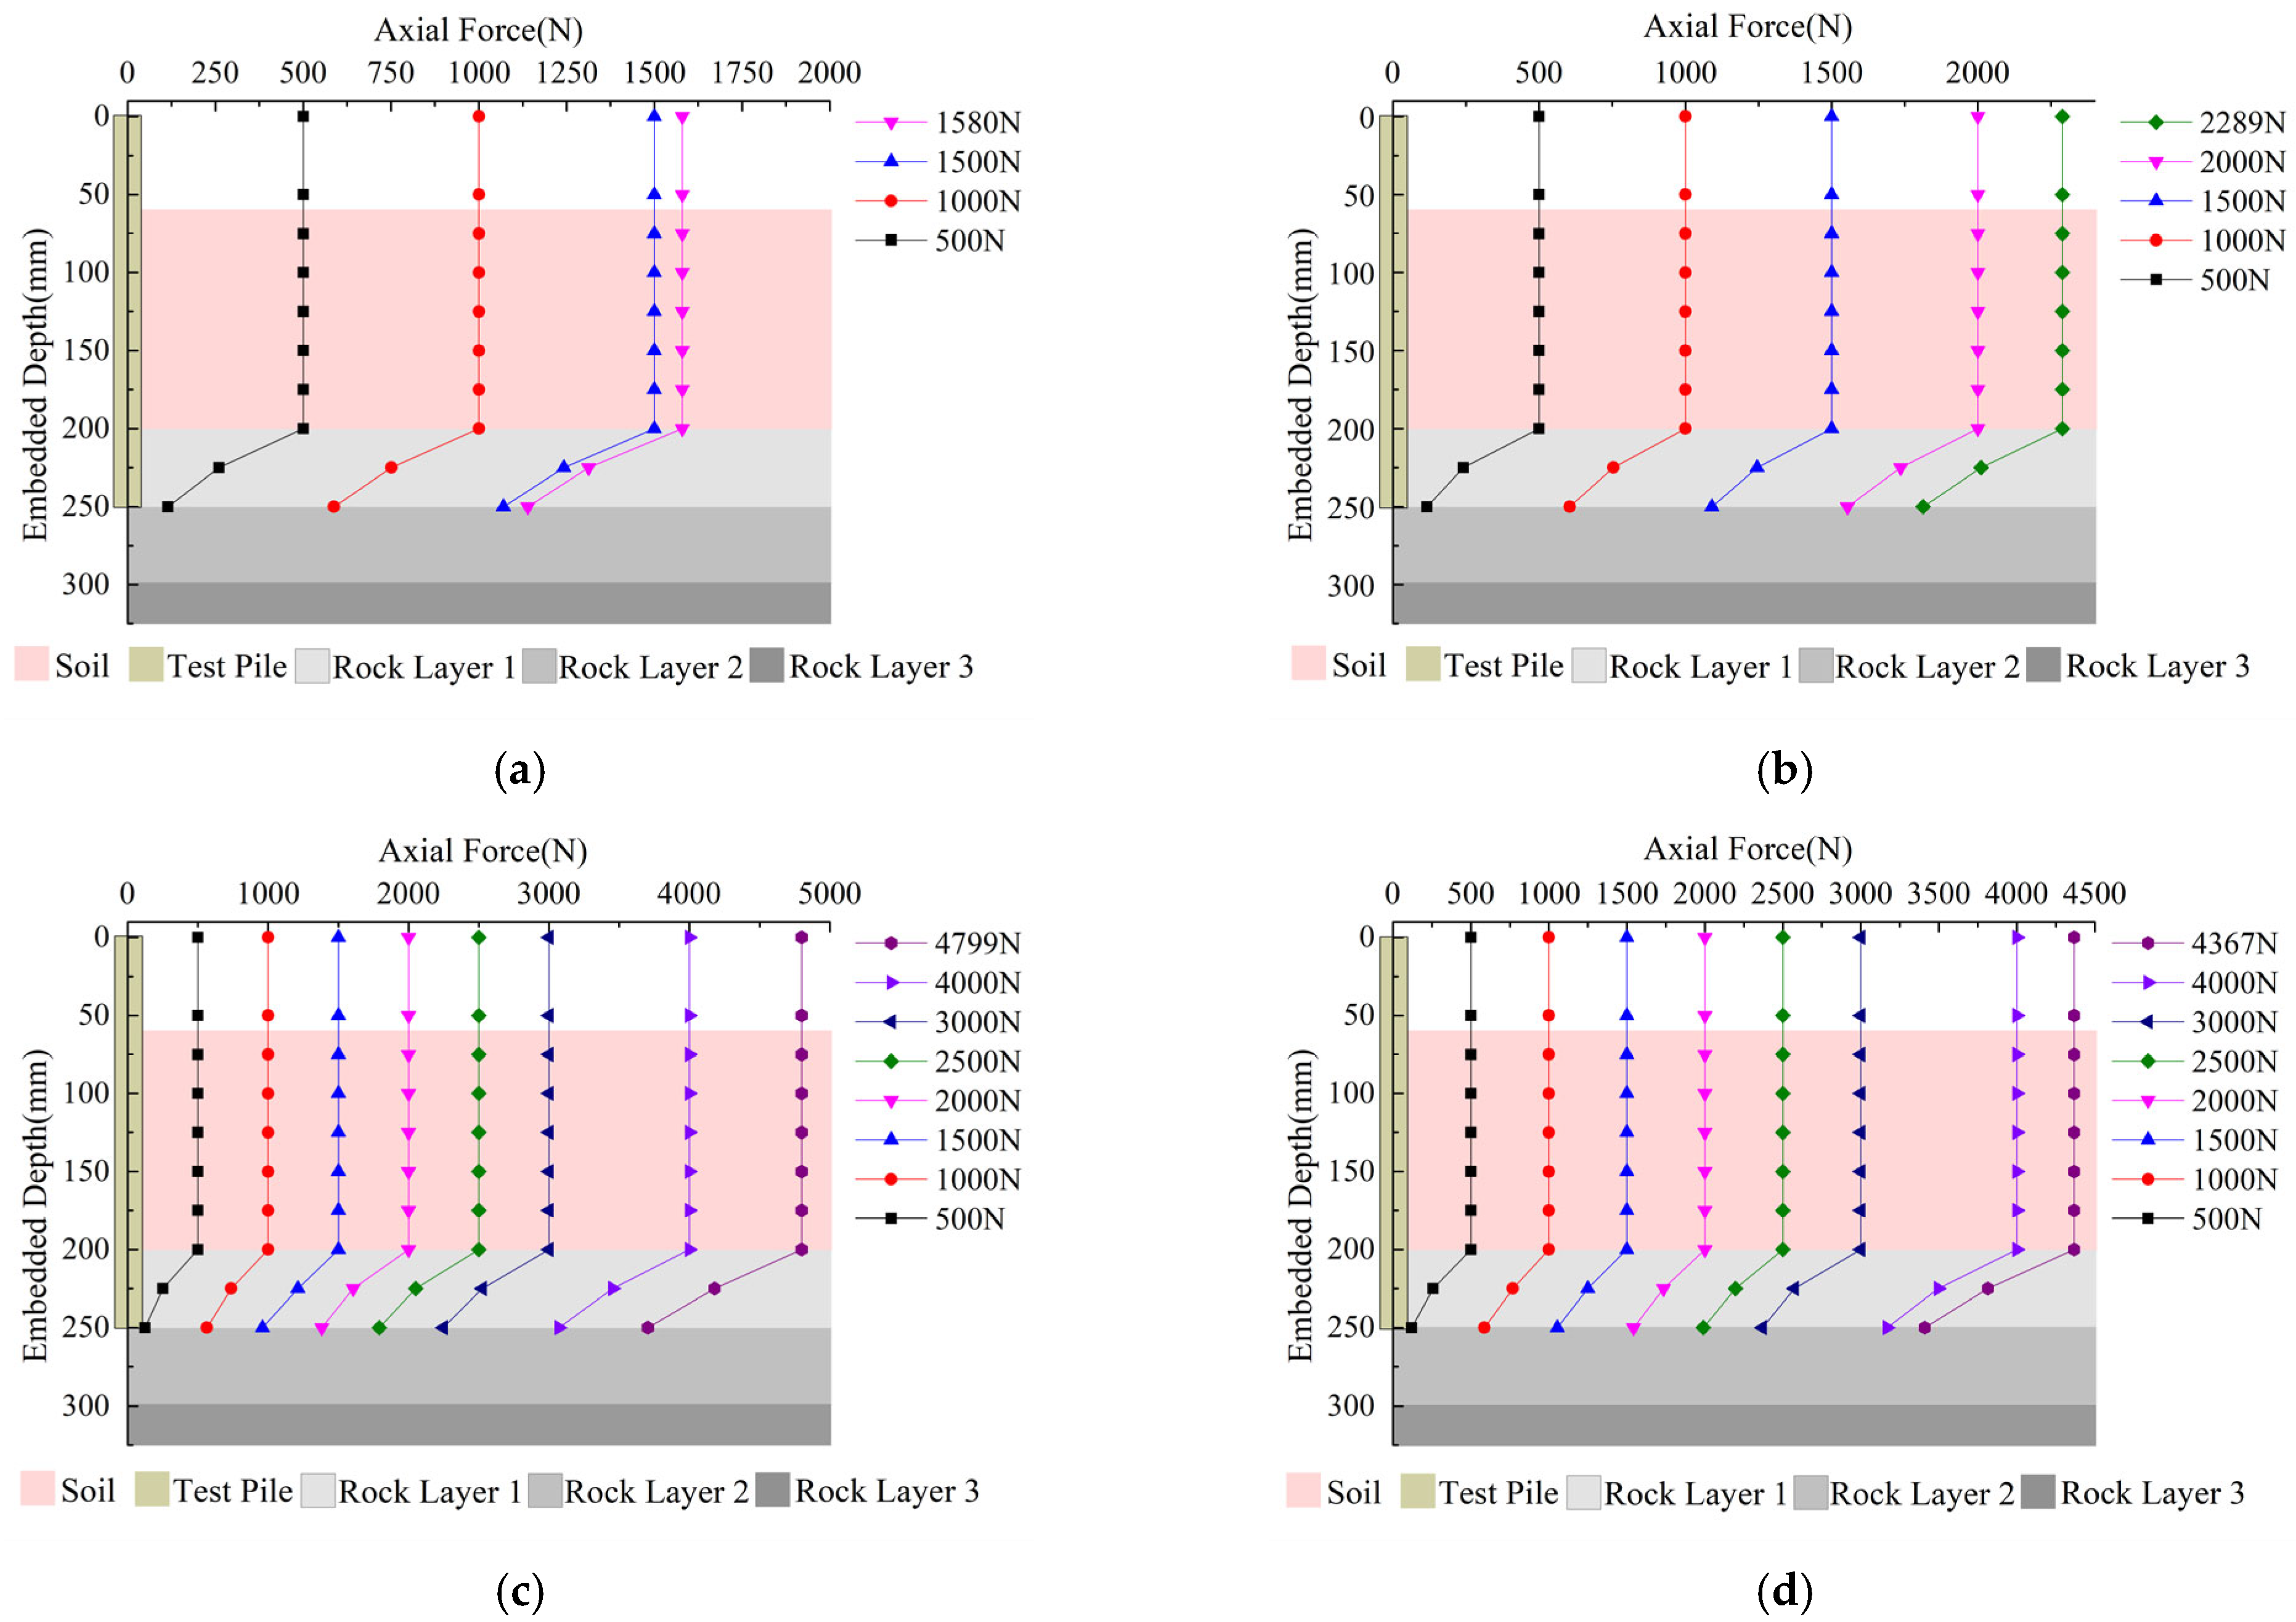
The axial force distribution of the test pile under various loads is shown in
Figure 8. With the gradual increase in load, the axial force also increases. When the depth of the pile body is in the range of 0–200 mm, the influence on the transmission of axial force is small or even negligible because the pile head and the buried soil part of the test pile are not embedded in the bedrock. When the pile depth exceeds 200 mm, the pile axial force decreases with the increase in pile depth. Under the first stage of 500 N load, the load transferred to the pile end is relatively small due to the small load at the top of the pile and the full play of the pile side resistance in the rock layer part; under all levels of loading, the axial force curve of the pile changes nearly linearly, and the slope of the curve increases with the increase in the pile depth; with the increase in load, the slope of the curve decreases, the load decay rate accelerates, and the pile side resistance in the rock layer is more and more fully exerted.
Taking the test pile TP2 as an example, with the stepwise increase in pile top load, the slope of the axial force curve of the pile in the rock layer part decreases gradually, and the decay rate of the axial force accelerates, growing from 248.09 N/25 mm and 127.28 N/25 mm to 618.77 N/25 mm and 476.29 N/25 mm, respectively. The pile side resistance gradually plays a role. However, with the increase in depth, the decay rate of axial force decreases. Under the ultimate bearing capacity of 4799 N, the decay rate decreases from 618.77 N/25 mm to 476.29 N/25 mm, which indicates that pile side resistance has played a role, and it slowly changes to pile tip resistance to bear the loading effect. The pile tip load accounts for 77.18% of the ultimate load, and the test piles show the characteristics of end-bearing piles; the load is mainly borne by pile tip resistance, and the ratio of pile tip is 72.12% for CTP1, 74.08% for TP1, 77.18% for TP2, and 79.22% for TP3.
3.4. Side Resistance of Piles
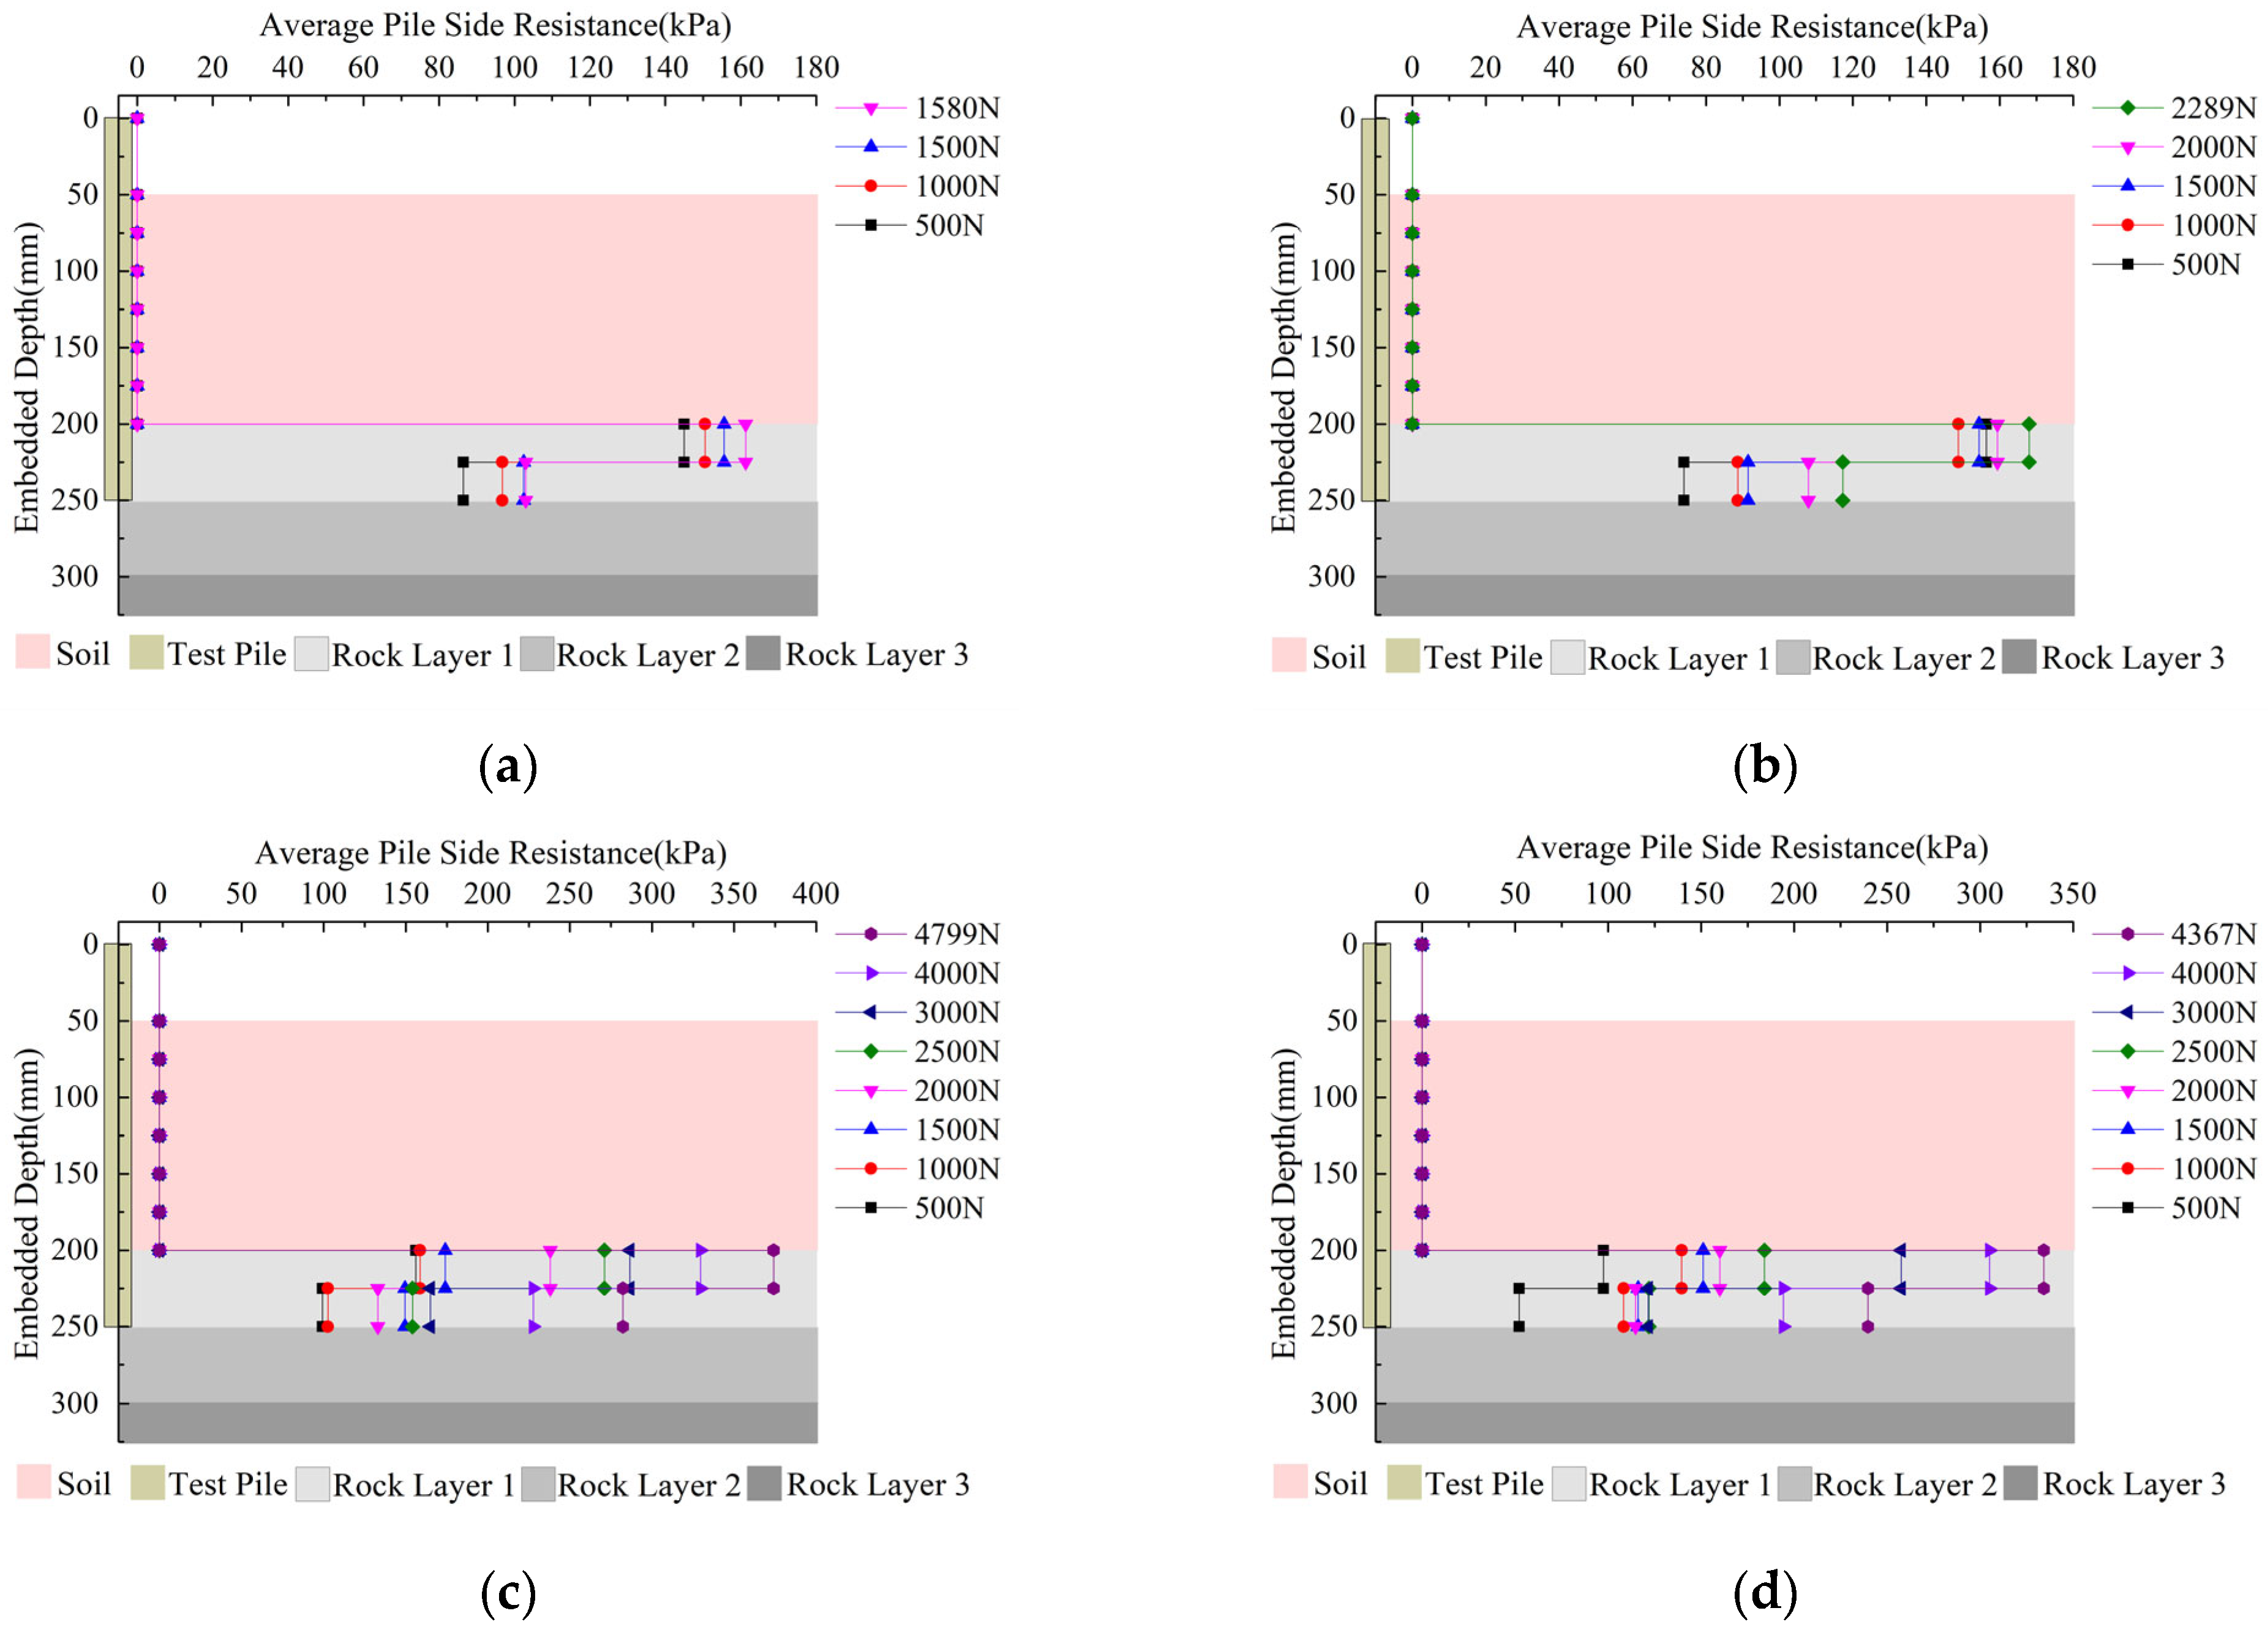
The average side-resistance distribution of the test pile under various loads is shown in
Figure 9. As can be seen, there is no obvious change in the axial force within 200 mm depth of the pile, and the corresponding average side resistance is very small. After the pile is embedded in the rock layer, the pile side resistance increases sharply, but it decreases slightly with the increase in depth, and the peak point is within 25 mm below the soil–rock interface.
4. Theoretical Calculation
The pile load transfer process of the rock-socketed piles is influenced by the pile–soil–rock coupling, and its bearing characteristics are mainly divided into pile–soil side resistance, pile–rock side resistance, and pile tip resistance. In this paper, the load transfer regulation of the test pile is obtained through the indoor test, and the load transfer model considering the relative displacement of pile–soil and pile–rock shear dilation effect is further established to analyze its load transfer characteristics.
4.1. Pile Side-Resistance Calculation Model
4.1.1. Mechanism Analysis of Pile–Soil Side-Resistance Exertion
According to Duncan-Chang’s hyperbolic model [
19], the relationship between pile-side resistance
and pile–soil relative displacement
is expressed as follows:
The initial conditions of the hyperbolic model: , .
When substituting into Equation (1), the following can be obtained:
where
is the initial stiffness coefficient;
is the ultimate side resistance of soil,
;
is the vertical effective stress on the pile side at depth
;
is the horizontal earth pressure coefficient; and
is the friction angle at the pile–soil interface.
4.1.2. Mechanism Analysis of Pile–Rock Side-Resistance Exertion
Since the surrounding rock has a certain stiffness, under the action of a load, the rock mass will generate radial force to resist the radial expansion of the test pile. At the same time, the side friction resistance will be generated between the pile and the rock due to the resulting radial stress. With the increase in load, the pile–rock interface continuously slips, and when the shear stress generated by the relative slip of the pile–rock exceeds the shear strength of the rock mass, the rock mass is sheared, and a new pile–rock sliding surface is generated. The following is assumed:
- (1)
The structural plane of the pile is a regular triangular concave–convex surface.
- (2)
During the loading process of the test pile, the rock mass is in an elastic state and does not produce damage and normal fissures, which satisfies the constant normal stiffness condition.
- (3)
The bearing capacity of rock-socketed piles in a hard rock layer usually depends on the pile material strength. The location of pile failure is the pile–rock structural plane, and the failure interface is a plane parallel to the displacement of the pile.
In the piling process, the contact surface between the pile side surface and the rock mass is concave and convex. There are two mechanisms of sliding dilatancy and shear slip in the shear process of the pile–rock contact surface. As the load increases, the pile–rock contact surface misaligns, resulting in relative displacement , and the radial expansion of the hole wall occurs, resulting in a radial stress increment and shear stress .
- (1)
Sliding dilatancy stage
During the application of the load, pile–rock relative displacement
occurs. It is assumed that the surrounding rock is in an elastic state and its radial expansion is
where
is the angle of dilatancy.
According to the theory of thick-walled cylinders, the radial stress increment A is
where
is the elastic modulus of the rock layer;
is Poisson’s ratio;
is the radius of the test pile; and
is the normal stiffness of the surrounding rock.
where
is the dilatancy limit displacement.
According to Patton, the shear strength of regular rough and unfilled rock discontinuities is
where
is the friction angle of the pile–rock structural plane.
Combining Equations (6) and (7), when the relative displacement
of pile–rock is generated at depth
, the shear stress is
The ultimate shear strength of the rock mass is
where
is the internal friction angle of the rock layer, and
is the cohesion of the rock layer.
When the normal stress reaches a certain value, the shear stress generated by the relative slip of the pile–rock exceeds the shear strength of the rock mass, and the rock mass is sheared. The critical stress is
- (2)
Shearing slip stage
When the relative displacement of pile–rock is
, the concave–convex body is sheared, resulting in a new sliding surface of the pile–rock. At this time, the interface friction angle is the residual friction angle
of the rock layer, and its shear stress is expressed as
According to the above formula, the complete lateral resistance expression of the pile–rock structural plane can be obtained:
4.1.3. Pile Load Transfer Calculation
According to the theory of pile load transfer, for any position of the pile–rock part, there are
where
and
are the elastic modulus and the cross-sectional area of the pile, respectively, and
is the diameter of the test pile.
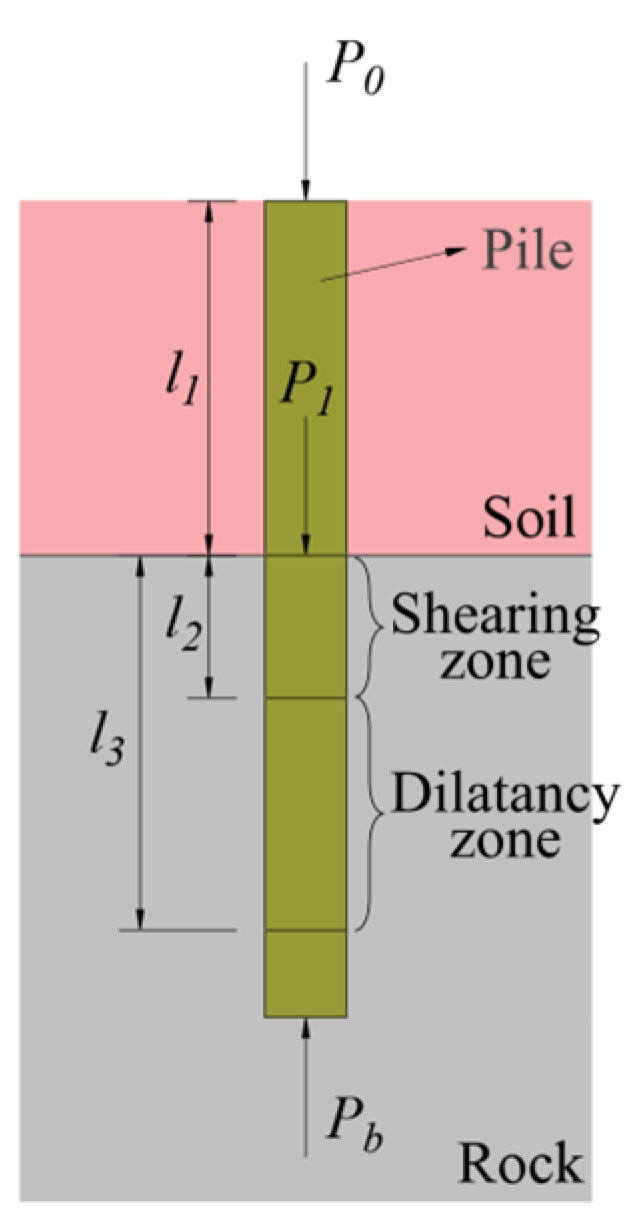
Figure 10 shows that the pile top load is
. After the pile–soil part has come into play, the load acting on the rock–soil parting surface is
, and the corresponding displacement is
.
- (1)
Shearing zone
From the boundary conditions,
The expressions of pile–rock relative slip and pile axial force in the shearing zone are
The displacement continuity condition is satisfied at the boundary between the shear and dilatancy zones at depth
:
have to
- (2)
Dilatancy zone
Substitution of Equation (13) into Equation (14),
in which
Under the axial force continuous condition,
where
The test pile axial force is transmitted continuously, and it can be seen that
The pile–rock side resistance is
The axial force of the test pile is
Under the action of pile top load, when the pile–rock part is in the dilatancy stage, , , and , the corresponding axial force and side-resistance distributions of the test pile can be obtained according to the above theoretical equations.
4.2. Pile Tip Load Calculation Model
There is no penetration failure at the pile tip, and the pile end load calculation model can be expressed as [
20]
where
is the pile tip resistance;
is the pile tip displacement;
is the compression modulus;
is the shear modulus of the rock mass at the pile end; and
is Poisson’s ratio of the rock mass at the pile end.
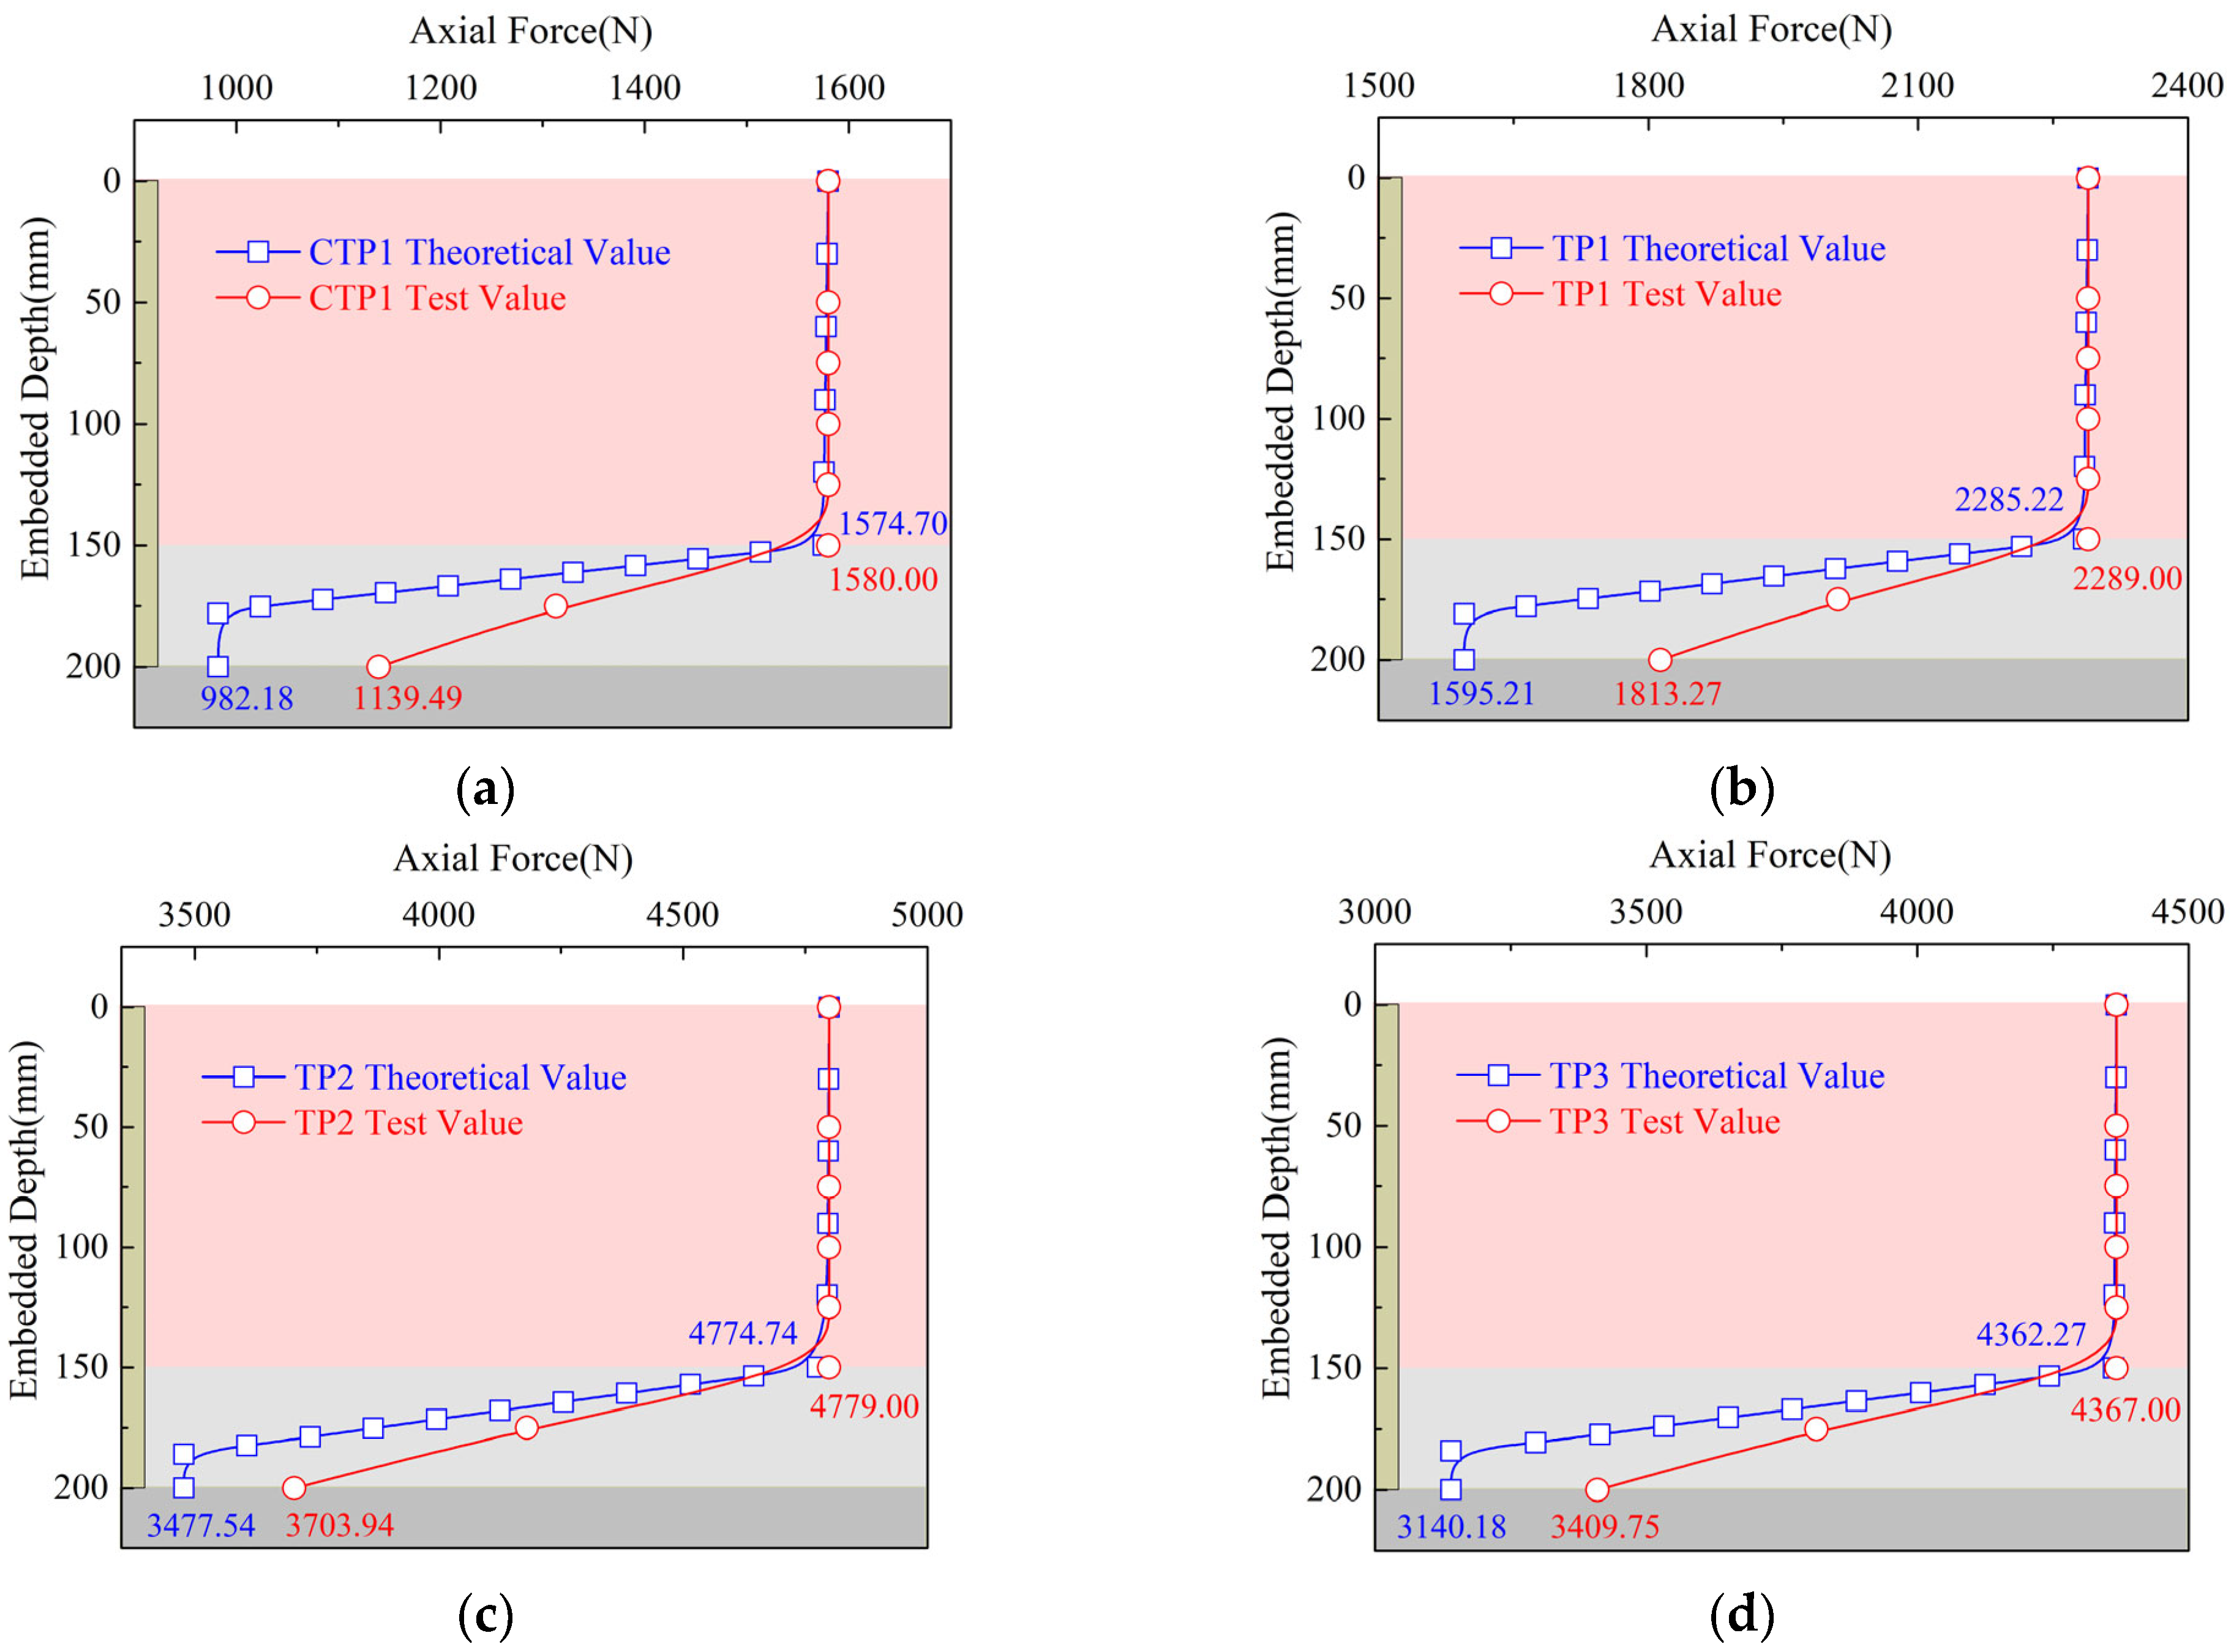
4.3. Comparison of Theoretical Calculations and Model Test Results
In this paper, the length of the test pile is 25 cm, the diameter of the pile is 2 cm, the embedded soil layer is 15 cm, the rock-socketed depth is 5 cm, the elastic modulus of the rock layer is,
GPa and
GPa, respectively, the test pile is only embedded in rock layer one, the internal friction angle is
, the cohesion is
kPa, the pile–rock interface friction angle is
, the dilatancy angle is
, the residual friction angle is
, and Poisson’s ratio is
. The test value is compared with the theoretical value, and the pile top displacement is 2.0 mm. The comparison results are shown in
Figure 11.
As can be seen from
Figure 11, in the soil layer, the decay value of the axial force of the theoretical curve is nearly 5 N, which can be considered negligible. In the rock layer, the difference between the attenuation rate of the theoretical curve and the test curve of the pile axial force is small when the pile depth is 150 mm–175 mm; the slope of the test curve of the pile axial force increases when the pile depth is 175 mm–200 mm, and due to the limitation of the number of strain gauges of the test piles, the axial force curve obtained from the indoor test is different compared with the theoretical curve.
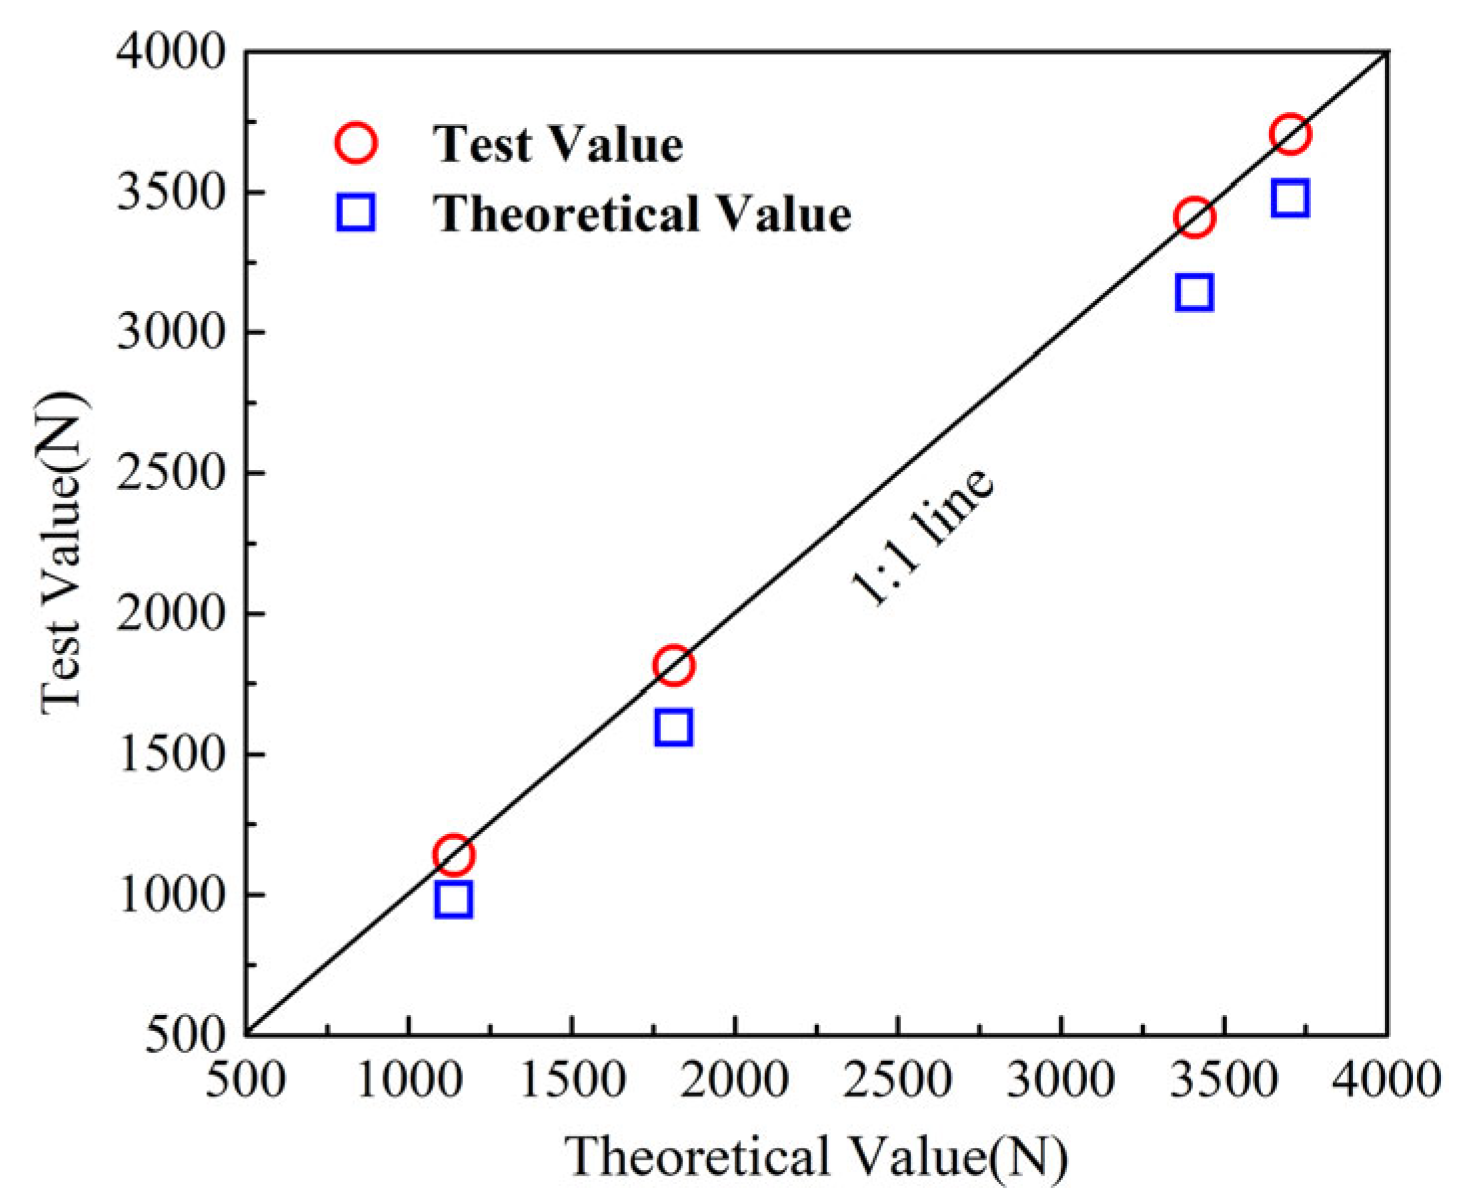
The comparison and error between the theoretical values and the test values of pile tip loads are shown in
Figure 12 and
Table 5. As shown in
Table 5, at the soil–rock interface, the error between the theoretical calculation method and the experimental method for pile axial force ranges from 0.09% to 0.34%, indicating a minor discrepancy. The errors between the theoretical values and the test values of pile tip loads range from 6.11% to 13.80%, with an average error of 9.96%.
In general, the theoretical curve matches well with the test curve, and the theoretical curve is closer to the test curve in the initial stage of axial force change. Through the theoretical calculation formula of this paper, the mechanism of load transfer of a pile foundation can be better reflected.
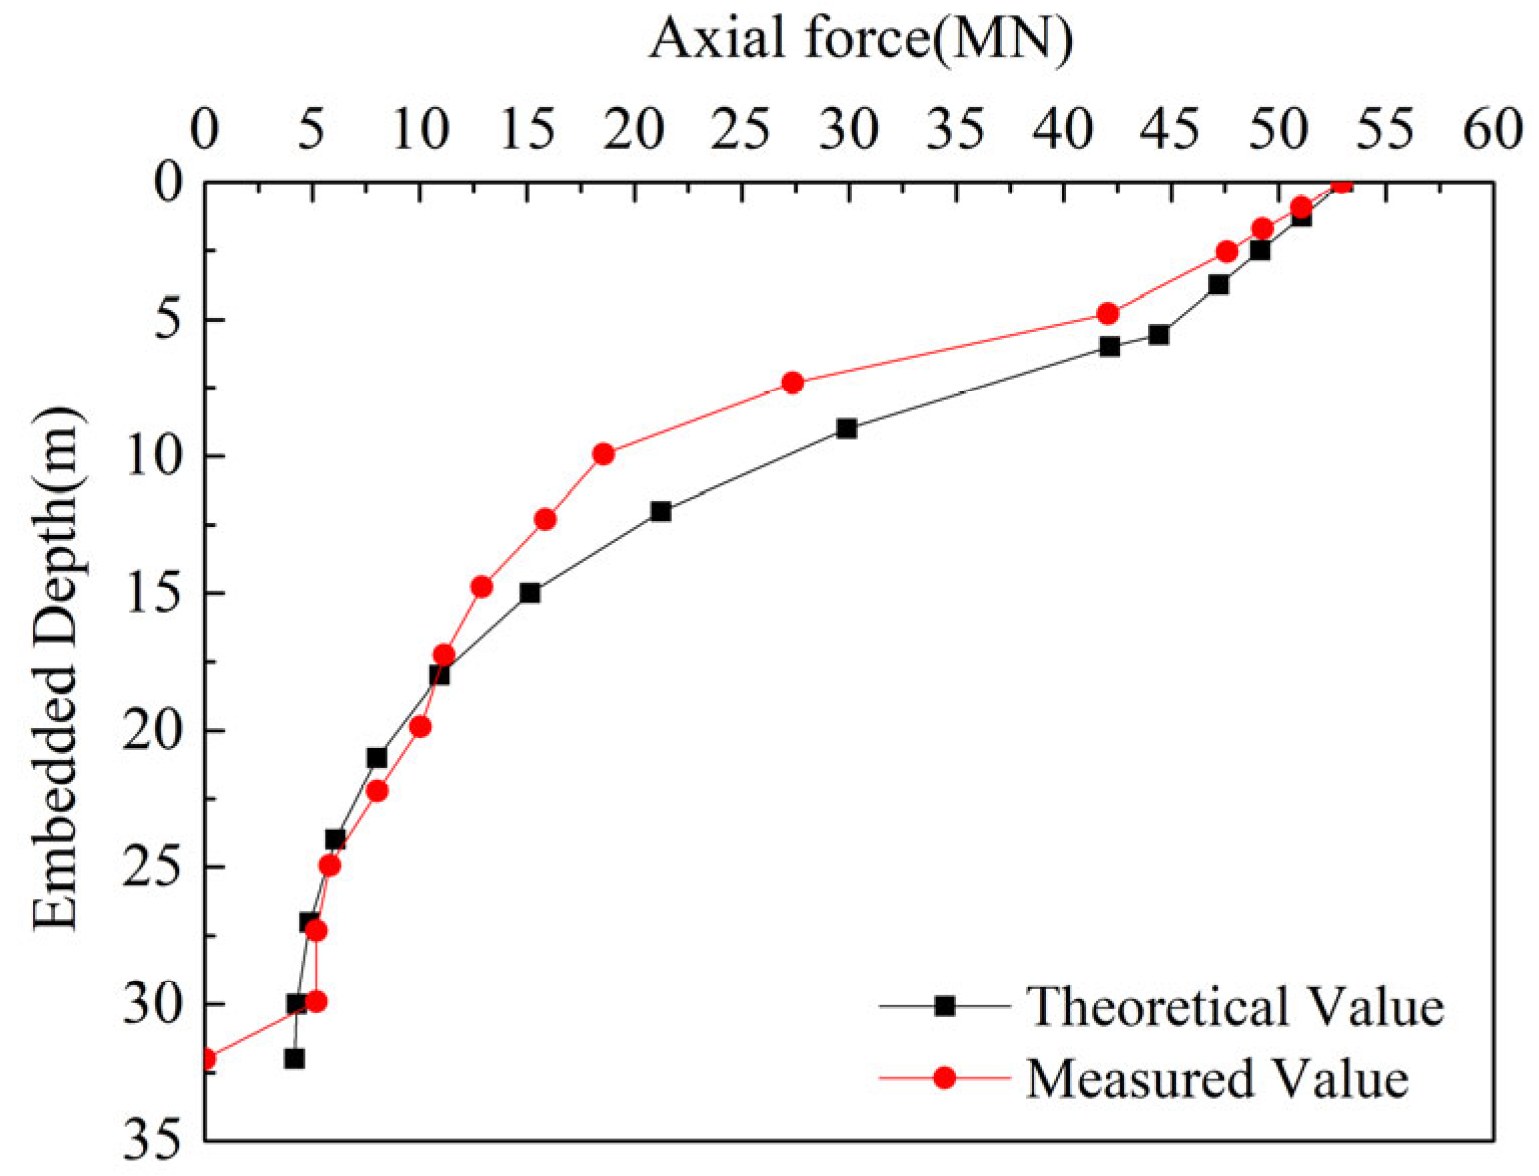
4.4. Comparison of Actual Engineering Results
The axial force of the rock-socketed pile in Reference [
21] is calculated by the method proposed in this paper and compared with the field test results. The basic working conditions of the rock-socketed pile in Reference [
21] are as follows: the length of the pile is 32 m, the diameter of the pile is 2.5 m, the average elastic modulus of the rock layer is
GPa, the internal friction angle is
, the cohesion is
kPa, the friction angle of the pile–rock interface is
, the dilatancy angle is
, the residual friction angle is
, and Poisson’s ratio is
. The elastic modulus of the pile is
GPa. The comparison results are shown in
Figure 13.
As shown in
Figure 13, when a load of 53 MN is applied to the pile head, the theoretical calculation indicates that the load at the pile tip decreases to 4.18 MN with increasing pile depth. However, in the actual engineering measurement, the load at the pile tip is recorded as 0. The theoretical results agree well with the measured axial force distribution curve along the pile shaft, demonstrating that the proposed theoretical calculation method can effectively analyze the load transfer mechanism of rock-socketed piles.
5. Discussion
The proposed theoretical calculation method effectively captures the load transfer mechanism along the pile depth during loading. The theoretical results were compared with both model pile load test results and field measurement data. In the pile–soil interaction zone, the theoretical model predicts an average axial force attenuation of 5 N, while the model test suggests no significant variation in axial force. The discrepancy between theoretical and experimental values is minimal. In the pile–rock interaction zone, the theoretical calculations align well with the experimental and field-measured axial force distribution trends, accurately reflecting the load transfer mechanism and providing axial force values at different depths. The average error between theoretical and experimental pile tip loads is 9.96%. However, in the actual engineering case, the theoretical calculation yields a pile tip load of 4.18 MN, whereas the measured value is 0. The proposed theoretical method provides a solid theoretical foundation for engineering practice, despite some deviations in absolute values.
6. Conclusions
This study conducted model pile load tests with different roughness factor (RF) values (0.0, 0.1, 0.2, and 0.3) to investigate the influence of pile shaft roughness on the bearing capacity, axial force distribution, and resistance mobilization behavior of test piles. Based on the load transfer mechanism observed in the tests, a load transfer model was established that accounts for both pile–soil relative displacement and pile–rock dilatancy effects, through which the load transfer characteristics were analyzed. The following conclusions were drawn.
The test piles are all rock-socketed end-bearing piles, and the failure modes are all splitting failure of the test pile body. The nature of the test pile material determines that the maximum load of the test pile is relatively close; the load–displacement curve of the test pile is upward concave and slowly changing; the top load of the test pile is mainly borne by the pile side resistance and the pile tip resistance; with the increase in the top load, the pile tip resistance is gradually exerted; when the ultimate load is reached, the pile tip resistance bears the upper load by 72.12%~79.22%; and the pile side resistance is mainly borne by the rock-socketed section. After the test pile is embedded in the rock layer, the pile side resistance increases sharply but decreases slightly with the increase in depth. The peak point of the side resistance is located in the range of 1.25 D below the soil–rock interface.
Increasing the roughness of the pile can greatly improve the ultimate bearing capacity of the pile foundation. In this study, the ultimate bearing capacity of the test pile shows a trend of increasing and then decreasing with the gradual increase in RF from 0.0 to 0.3, and the ultimate bearing capacity of the test pile is the largest when the RF is 0.2, which indicates that the optimum RF of the pile body is 0.2.
The pile resistance of a rock-socketed pile is divided into pile–soil side resistance, pile–rock side resistance, and pile tip resistance, in which the pile–rock side resistance is divided into two stages: sliding dilatancy and shear slip.
Although this study reveals the influence of pile surface roughness (RF = 0.0~0.3) on the bearing behavior of rock-socketed piles, certain limitations remain: The experiments were only conducted on a specific pile material (splitting failure mode) and did not consider higher roughness levels (RF > 0.3) or dynamic loading effects. Future research should expand the investigation to a broader roughness range and cyclic loading conditions, integrating numerical simulations and field tests to develop a generalized model that couples pile–rock interfacial slip and dilatancy effects. Additionally, economic feasibility and construction techniques for roughness design should be optimized to enhance the practical applicability of the theory.
Author Contributions
Conceptualization, T.X. and B.Y.; methodology, Z.W.; software, Q.S.; validation, Z.T.; formal analysis, T.X.; investigation, Z.W.; resources, Z.T.; data curation, Z.W.; writing—original draft preparation, Q.S.; writing—review and editing, H.L. and B.Y.; visualization, B.Y.; supervision, T.X.; project administration, H.L.; funding acquisition, X.H. and B.Y. All authors have read and agreed to the published version of the manuscript.
Funding
This research was funded by the Guangxi Key Research and Development Program (grant numbers Guike AB25069410, Guike AB24010144) and the Chongzuo City Scientific Research and Technology Development Plan Project (grant number Chongke 2023ZY0504).
Data Availability Statement
Data are contained within the paper.
Conflicts of Interest
Authors Zhilin Wang and Tao Xiao were employed by the company China Railway Guangzhou Engineering Bureau Group Co., Ltd. Authors Hongming Li and Zhihao Tang were employed by the company Guangxi Transportation Science and Technology Group Co., Ltd. The remaining authors declare that the research was conducted in the absence of any commercial or financial relationships that could be construed as a potential conflict of interest.
References
- Liu, Y.N.; Zhao, H.; Zhao, M.H.; Peng, W.Z. Vertical Load Transfer Behavior of Cast-in-place Piles Considering Hole Wall Asperity Degradations. Chin. J. Hunan Univ. (Nat. Sci.) 2021, 48, 160–165. [Google Scholar]
- Zhao, M.H.; Xia, B.Y.; Zhao, H. Laboratory Testing Study on Concrete-rock Interface with Sawtooth Joint. Chin. J. Hunan Univ. (Nat. Sci.) 2020, 47, 123–129. [Google Scholar]
- Zhao, M.H.; Xia, R.Y.; Yin, P.B.; Yang, C.W.; Xu, Z.J. Load transfer mechanism of socketed piles considering shear dilation effects of soft rock. Chin. J. Geotech. Eng. 2014, 36, 1005–1011. [Google Scholar]
- Zhao, M.H.; Lei, Y.; Liu, X.M. Analysis of Load Transfer of Rock-socketed Piles Based on Characteristics of Pile-Rock Structural Plane. Chin. J. Rock Mech. Eng. 2009, 28, 103–110. [Google Scholar]
- Xing, H.F.; Meng, M.H.; He, W.Y.; Ye, G.B.; Liu, Z.K. Distribution of shaft resistance of rock-socketed piles based on mechanical properties of pile-rock interface. Chin. J. Geotech. Eng. 2012, 34, 2220–2227. [Google Scholar]
- Liu, J.; Li, Z.W.; Dai, G.L.; Gong, W.M. Field Measurement and Theoretical Analysis of Sidewall Roughness on Shaft Resistance of Rock-Socketed Piles. J. Mar. Sci. Eng. 2023, 11, 1622. [Google Scholar] [CrossRef]
- Tehrani, F.S.; Han, F.; Salgado, R.; Prezzi, M.; Tovar, R.D.; Castro, A.G. Effect of surface roughness on the shaft resistance of non-displacement piles embedded in sand. J. Géotechnique 2016, 66, 386–400. [Google Scholar] [CrossRef]
- Dai, G.L.; Salgado, R.; Gong, W.M.; Zhu, M.X. The effect of sidewall roughness on the shaft resistance of rock-socketed piles. J. Acta Geotech. 2017, 12, 429–440. [Google Scholar] [CrossRef]
- Gutiérrez-Ch, J.G.; Senent, S.; Melentijevic, S.; Jimenez, R. A DEM-based factor to design rock-socketed piles considering socket roughness. J. Rock Mech. Rock Eng. 2021, 54, 3409–3421. [Google Scholar] [CrossRef]
- Gutiérrez-Ch, J.G.; Song, G.; Heron, C.M.; Marshall, A.; Jimenez, R. Centrifuge tests on rock-socketed piles: Effect of socket roughness on shaft resistance. J. Geotech. Geoenviron. Eng. 2021, 147, 04021125. [Google Scholar] [CrossRef]
- Liu, S.W.; Zhang, Q.Q.; Ma, B.; Li, Z.B.; Yin, W.P.; Lou, Q.G. Study on surface roughness effect on shear behavior of concrete-soil interface. J. Eng. Fail. Anal. 2023, 145, 107050. [Google Scholar] [CrossRef]
- Murali, A.K.; Tran, K.M.; Haque, A.; Bui, H.H. Experimental and numerical investigation of the load-bearing mechanisms of piles socketed in soft rocks. J. Rock Mech. Rock Eng. 2022, 55, 5555–5576. [Google Scholar] [CrossRef]
- Kim, G.; Ham, K.; Lee, J. Effects of surface roughness on lateral load–carrying capacities of piles embedded in sand. J. Geotech. Geoenviron. Eng. 2020, 146, 04020064. [Google Scholar] [CrossRef]
- El Haffar, I.; Blanc, M.; Thorel, L. Impact of pile roughness on shaft resistance in sand. J. Proc. Inst. Civ. Eng.-Geotech. Eng. 2020, 173, 81–91. [Google Scholar] [CrossRef]
- Wang, Q.Y.; Gao, R.; Zeng, W.Y. Model Test of Roughness’ Influence on Bearing Mechanism in Rock-Socketed Pile. J. Adv. Mater. Res. 2011, 243–249, 3072–3077. [Google Scholar] [CrossRef]
- Horvath, R.G.; Kenney, T.C.; Kozicki, P. Methods of improving the performance of drilled piers in weak rock: Reply. J. Can. Geotech. 2011, 20, 758–772. [Google Scholar] [CrossRef]
- Tang, X.; He, B.; Yang, B.; Chen, J. Experimental Study on Axial Stress–Strain Behavior of Steel Fibre-Reinforced Steel Slag Micropowder UHPC. J. Appl. Sci. 2023, 13, 8807. [Google Scholar] [CrossRef]
- Weltman, A.J. Pile load testing procedures. In R. Directorate of Civil Engineering Services, Property Services Agency; Department of the Environment: London, UK, 1980. [Google Scholar]
- Duncan, J.M.; Chang, C.Y. Nonlinear analysis of stress and strain in soils. J. Soil Mech. Found. Div. 1996, 96, 1629–1653. [Google Scholar] [CrossRef]
- Zhang, Q.Q.; Zhang, Z.M. Complete load transfer behavior of base-grouted bored piles. J. Cent. South Univ. 2012, 19, 2037–2046. [Google Scholar] [CrossRef]
- Zhou, T.; Wang, X.H.; Cao, W.L. Supporting capacity behavior of large diameter rock-socketed piles. Hunan Commun. Sci. Technol. 2006, 4, 85–87. [Google Scholar]
| Disclaimer/Publisher’s Note: The statements, opinions and data contained in all publications are solely those of the individual author(s) and contributor(s) and not of MDPI and/or the editor(s). MDPI and/or the editor(s) disclaim responsibility for any injury to people or property resulting from any ideas, methods, instructions or products referred to in the content. |
© 2025 by the authors. Licensee MDPI, Basel, Switzerland. This article is an open access article distributed under the terms and conditions of the Creative Commons Attribution (CC BY) license (https://creativecommons.org/licenses/by/4.0/).


