Article

Measurement and Simulation Optimization of the Light Environment of Traditional Residential Houses in the Patio Style: A Case Study of the Architectural Culture of Shanggantang Village, Xiangnan, China

School of Architecture, Changsha University of Science and Technology, Changsha 410015, China
*
Author to whom correspondence should be addressed.
Buildings 2025, 15(11), 1786; https://doi.org/10.3390/buildings15111786
Submission received: 27 April 2025 / Revised: 20 May 2025 / Accepted: 20 May 2025 / Published: 23 May 2025
(This article belongs to the Section Building Energy, Physics, Environment, and Systems)

Abstract

In southern Hunan province, a vital element of China’s architectural cultural legacy, the quality of the indoor lighting environment influences physical performance and the transmission of spatial culture. The province encounters minor environmental disparities and diminishing liveability attributed to evolving construction practices and cultural standards. The three varieties of traditional residences in Shanggantang Village are employed to assess the daylight factor (DF), illumination uniformity (U0), daylight autonomy (DA), and useful daylight illumination (UDI). We subsequently integrate field measurements with static and dynamic numerical simulations to create a multi-dimensional analytical framework termed “measured-static-dynamic”. This method enables the examination of the influence of floor plan layout on light, as well as the relationship between window size, building configuration, and natural illumination. The lighting factor (DF) of the core area of the central patio-type residence reaches 27.7% and the illumination uniformity (U0) is 0.62, but the DF of the transition area plummets to 1.6%; the composite patio type enhances the DF of the transition area to 1.2% through the alleyway-assisted lighting, which is a 24-fold improvement over the offset patio type. Parameter optimization showed that the percentage of all-natural daylighting time (DA) in the edge zone of the central patio type increased from 21.4% to 58.3% when the window height was adjusted to 90%. The results of the study provide a quantitative basis for the optimization of the light environment and low-carbon renewal of traditional residential buildings.

1. Introduction

Traditional dwellings record the production and lifestyle of local people, embody patriarchal concepts and traditional construction techniques [1], and present rich architectural styles and distinctive local characteristics. Located in the southern part of Hunan (hereinafter referred to as Xiangnan), which mainly includes Hengyang City, Chenzhou City, and Yongzhou City, there are a large number of traditional houses in the region, and their preservation status is relatively good. Under the dual influence of the Central Plains and Lingnan cultures, the traditional dwellings in the southern Hunan region show the characteristics of the integration of the north and the south. On the one hand, the layout of traditional houses is based on mountains and rivers, integrating the concept of feng shui and the essence of clan culture [2], with the dual characteristics of settlement and livability [3]; on the other hand, the design features of Huizhou and Hakka architecture are borrowed, and the patio is used as the core functional layout, which constitutes the spatial form of the patio courtyard style [4]. For a long time, although the traditional residential courtyard type has realized natural lighting by virtue of the small-scale openings at the top, the light environment system of traditional residential houses is still in a non-equilibrium state under the influence of construction techniques and regional culture, facing the double crises of “livability degradation” and “dissipation of cultural symbolism of patio space”. In the context of the rural revitalization strategy, by enhancing the quality of the light environment of traditional dwellings, systematically improving the indoor physical environment and spatial experience, and promoting the sustainable development of traditional village habitats [5], thereby realizing the innovative transformation of traditional architectural wisdom, it is conducive to the implementation of the “Five-Year Action Plan for Improving and Enhancing the Rural Habitat (2021–2025)” [6], and it provides the advancement of the construction of a beautiful countryside that is pleasant to live in and work in technical support and cultural demonstration [7], and realize the organic unity of traditional architectural heritage protection and modern life quality improvement.
At present, scholars at home and abroad have carried out corresponding studies on the environment of traditional residential houses of the patio courtyard type, and most of them have explored the spatial layout [1,8,9], cultural connotation [10], climatic adaptation [11,12,13], and ecological adaptation [14], while some scholars have conducted in-depth analyses of the indoor wind environment [11,14,15], thermal environment [16,17,18], and light environment [16,19,20], and so on for in-depth analysis. The light environment is not only the core element of traditional residential habitat creation but also an important carrier of intangible cultural inheritance, which has attracted the attention of scholars, and the main studies are as follows: First, the research content primarily analyzes the factors that influence the light environment, including the quantitative analysis of natural lighting [21], the geometric morphology of courtyards [22], and the visual comfort of the patio [23]. However, the majority of these studies focus on the ontological factors of the patio, particularly the quantitative analysis of the lighting performance index. At the same time, scholars pay attention to the comparison of the light environment between patio-style residential houses and modern residential houses [14,20] and different lighting areas inside the same residential house [24] to analyze the core elements of the lighting design of patio courtyard-style traditional residential houses. Secondly, in terms of research methodology, field measurements [14], computer simulation [14,19,25], and other methods are used to quantitatively analyze the light environment, but most of them are explored by using static and single-fixed simulation software such as Ecotect 2011 [14,19,26] and Radiance v5.3 [25]. Third, in terms of research perspectives, scholars have either combined psychological perspectives to compare the natural light inflow and spatial impression of the living space of traditional houses in China, Japan, and South Korea [27]; or studied the spatial ambience of the light-focused environment and the spiritual needs of light in architecture based on the perspective of light and shadow changes and aesthetics [28]; or analyzed the response of traditional houses after relocation to other places in different climatic conditions from the perspective of climatic variability to analyze its performance changes (including light environment) and causes of architectural diseases [29]. In addition to Chinese courtyard houses, courtyard buildings in the Mediterranean and the Middle East (e.g., Spain ‘Patio’, Iran’s ‘Hayāt’) similarly regulate the light and heat environment through top openings [30,31], suggesting that traditional architectural wisdom has common technical strategies across the globe.
The Xiangnan region lies in the transitional area between hot summer and cold winter, as well as hot summer and mild winter thermal zones, and is classified under China’s photoclimatic IV zone, characterized by abundant photoclimatic conditions. For studying the lighting conditions of patios, most existing research on traditional houses in this area mainly looks at the natural light of one patio at a time, with few comparisons between different patio designs and even fewer studies on how building layouts affect light and their roles in natural lighting. The current literature primarily employs a singular study methodology, depending on static lighting simulation software for analysis. This work examines the traditional buildings in Shanggantang Village, Yongzhou, South Hunan region, and develops a simulation approach grounded in the measured analysis of the existing conditions of these houses, utilizing static lighting simulation software. Radiance and the dynamic lighting simulation software DesignBuilder v6.1 are utilized to simulate and analyze the lighting characteristics of traditional patio dwellings in the South Hunan region, as well as to examine the performance of three patio plan configurations: central, offset, and composite. The study examines the impact of various characteristics of three patio design types on lighting, simulates the natural light conditions of patio dwellings, and evaluates and modifies window dimensions to provide valuable design recommendations for future renovations aimed at improving lighting. The study is important for keeping the “real light environment” in traditional buildings, measuring how light changes indoors over time, helping to control natural light when people are present, and offering information for looking into visual comfort and how lighting works.

2. Methods

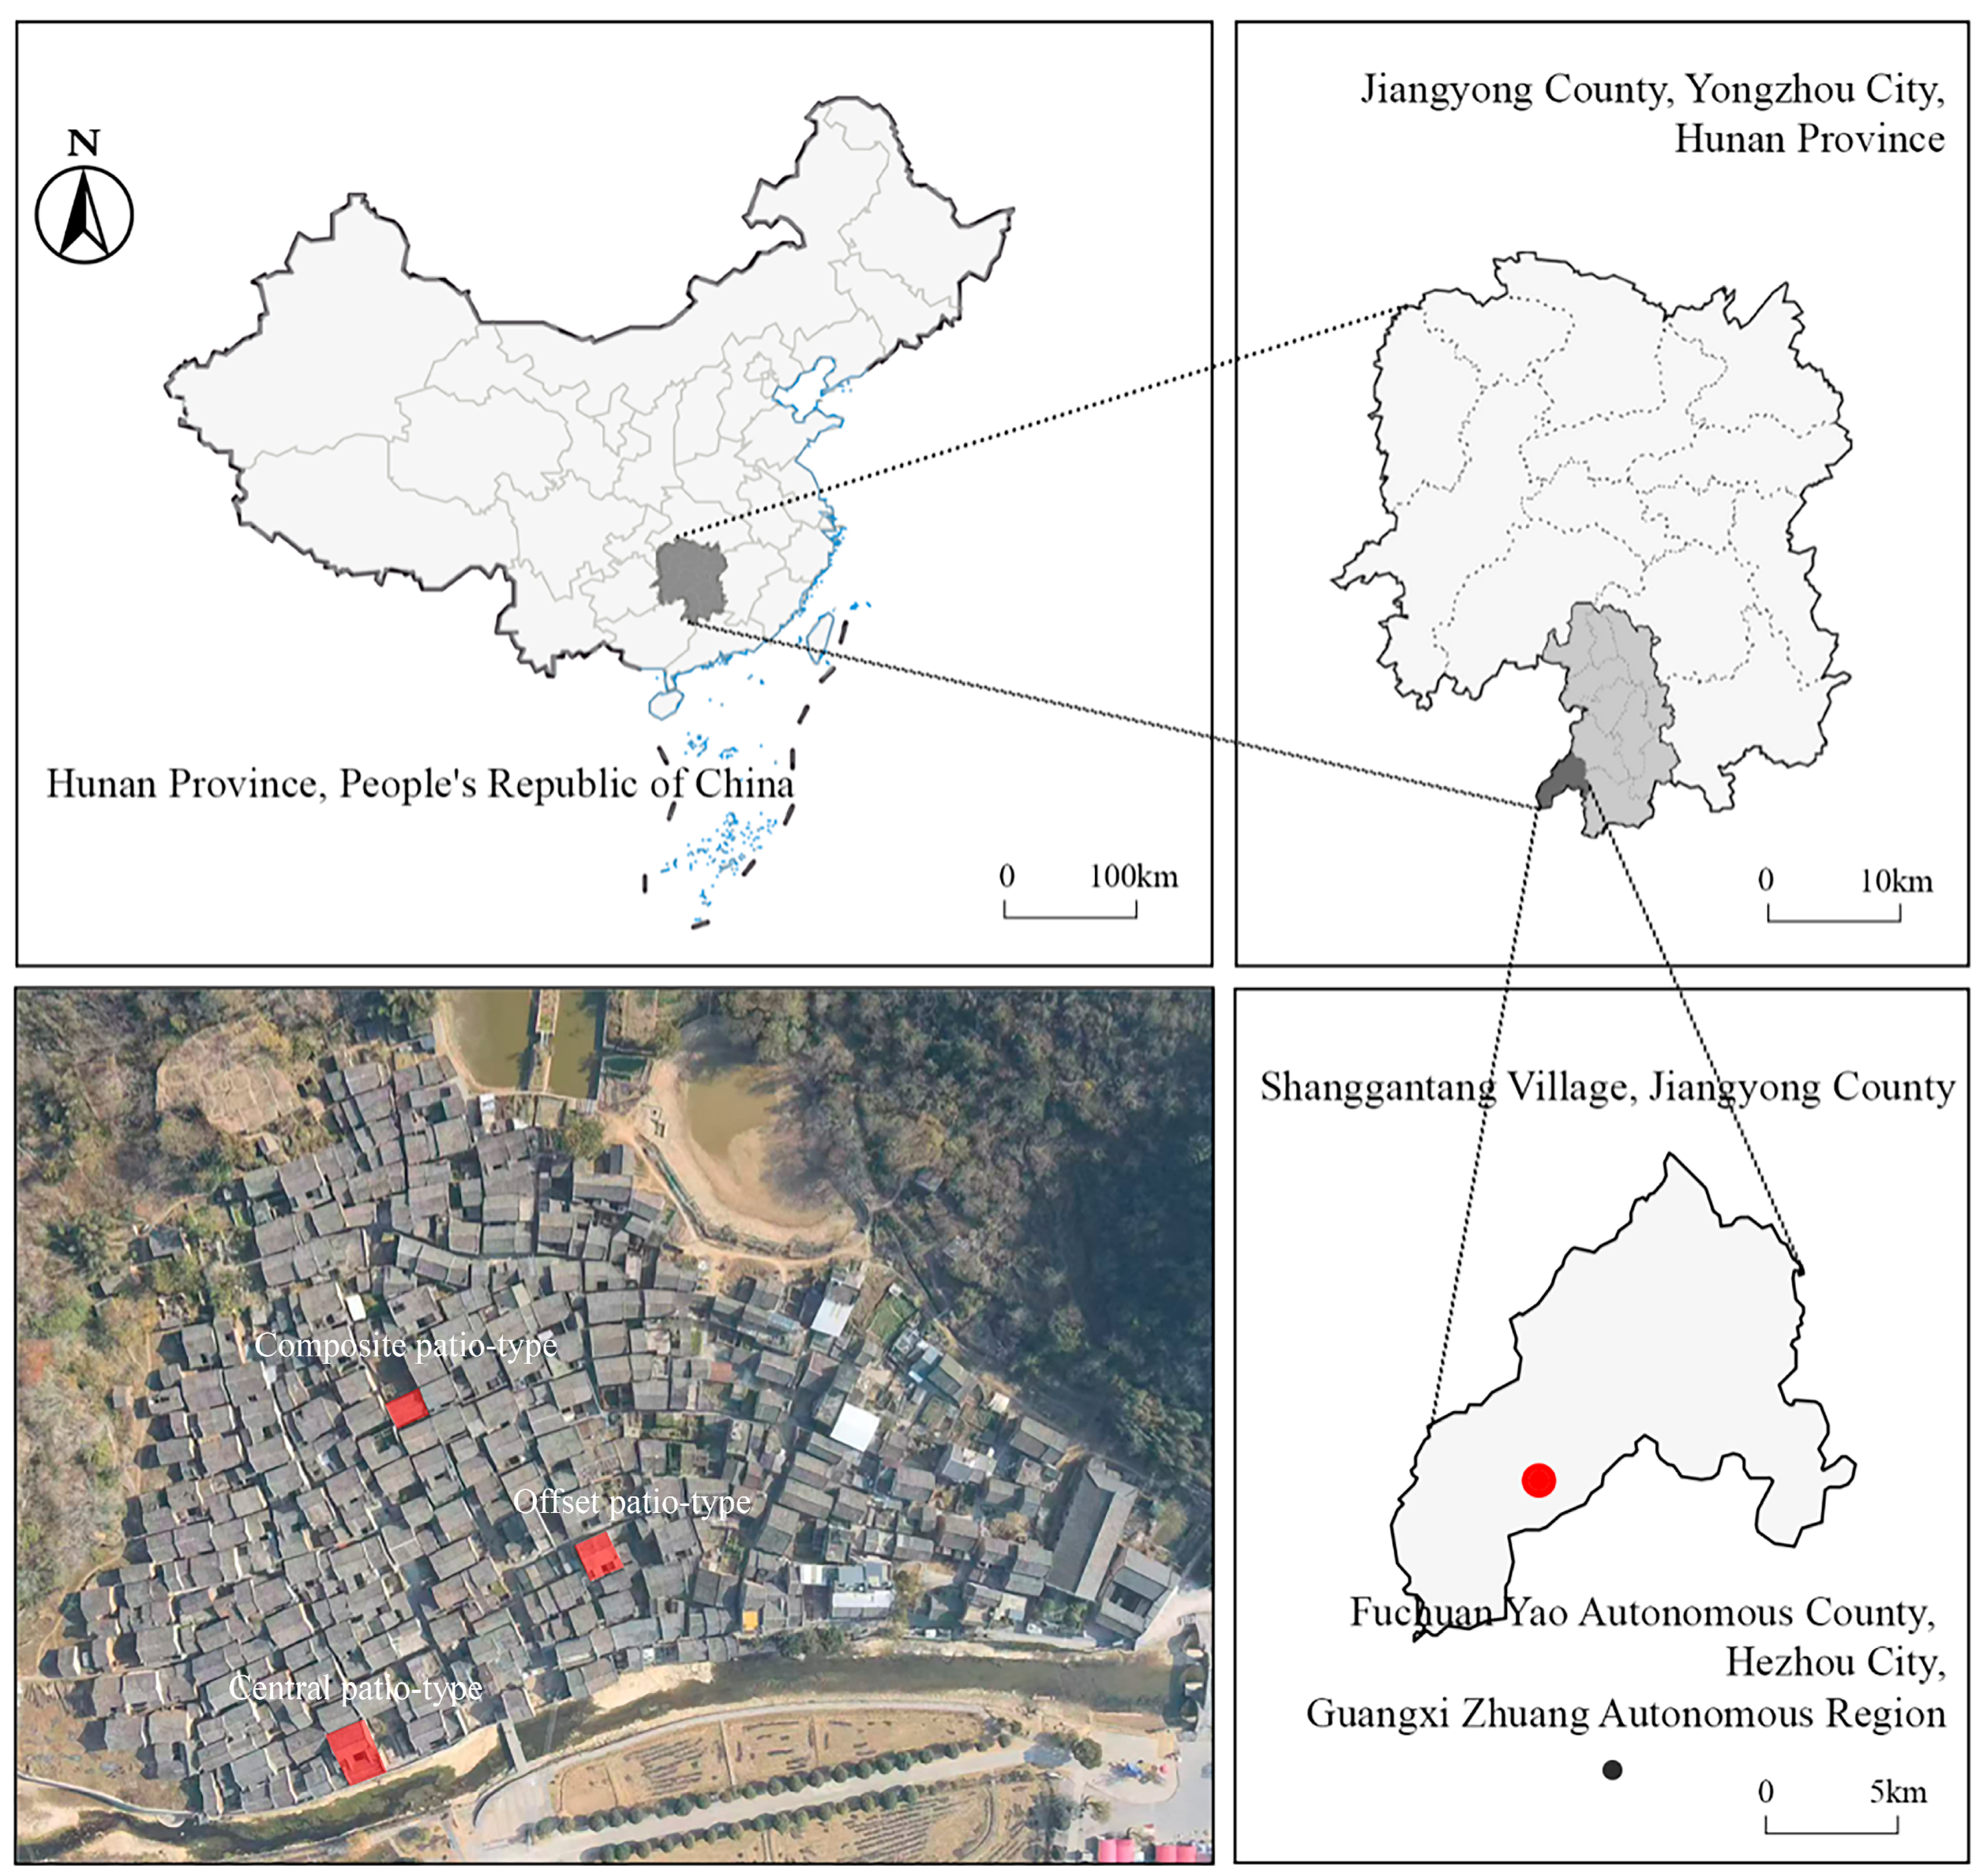
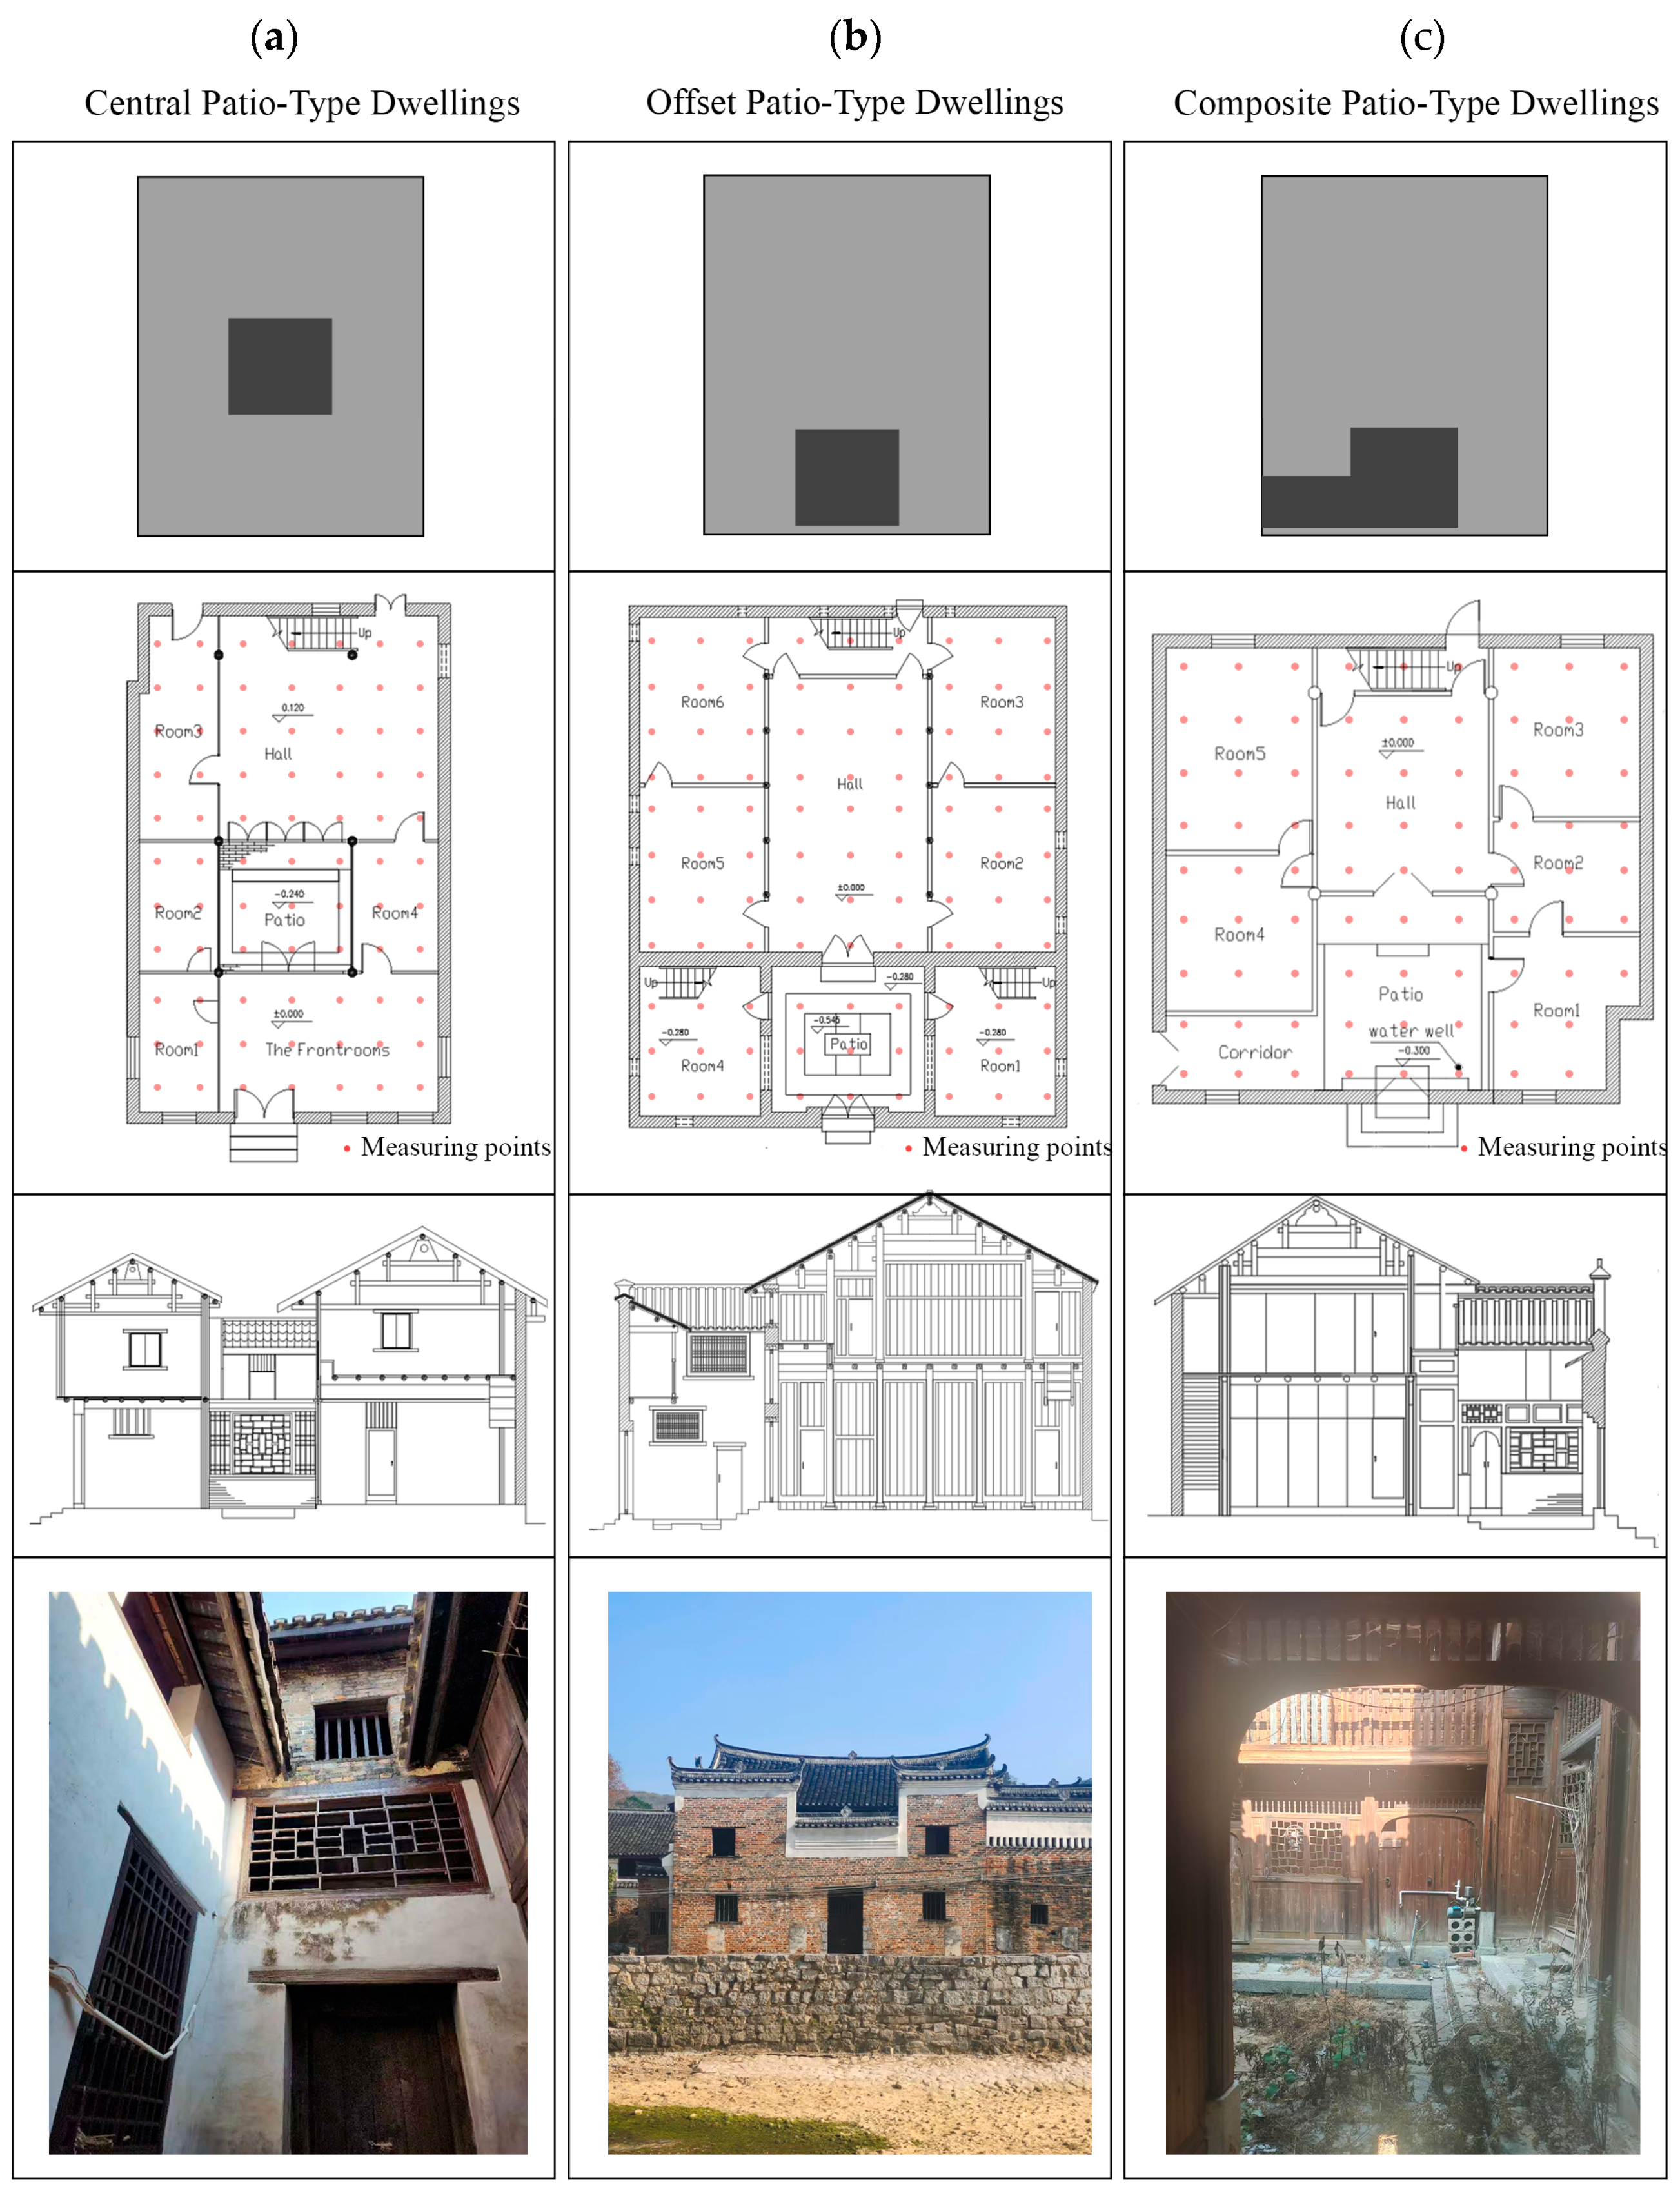
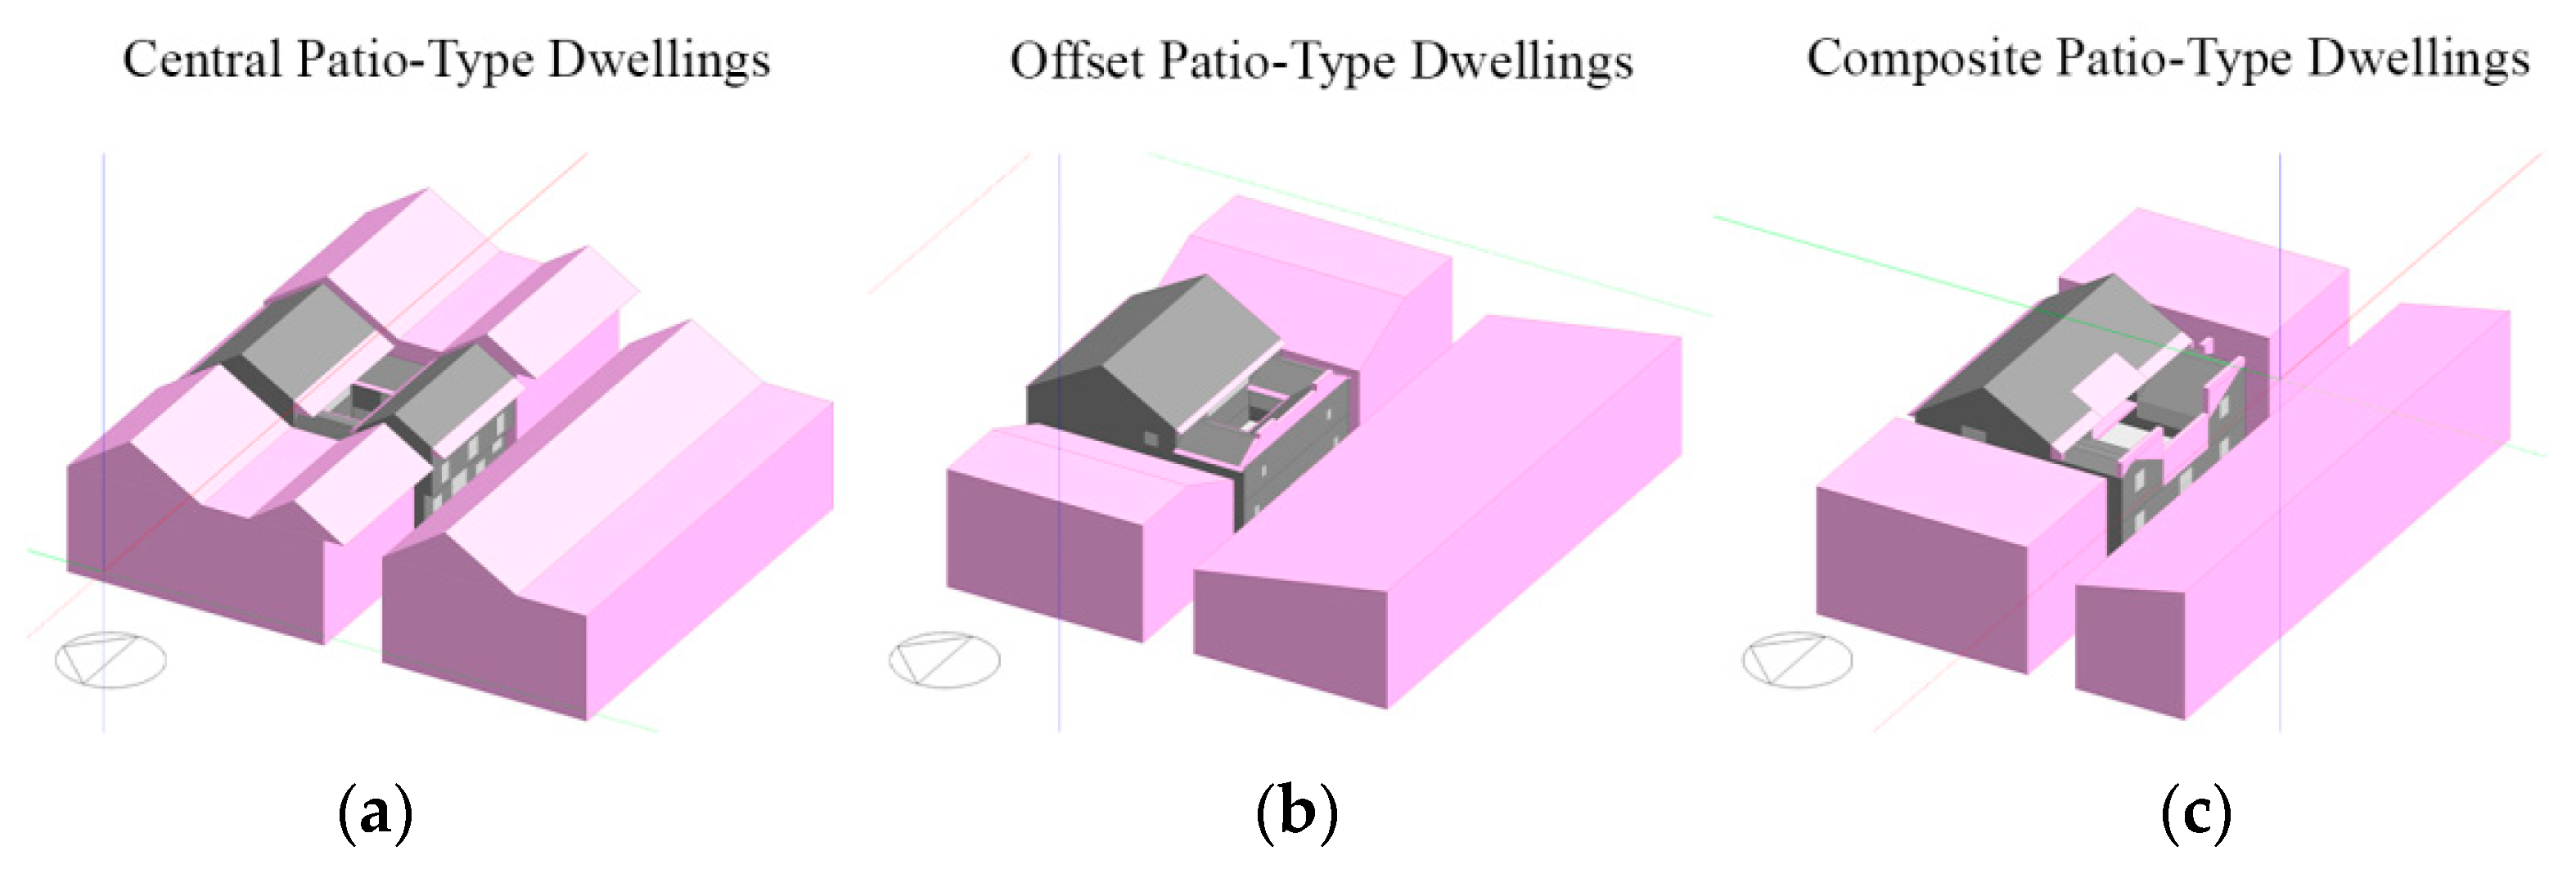
2.1. Study Area and Object

Summer in southern Hunan is marked by elevated temperatures and humidity, along with extended hours of sunlight, and winter is defined by cold and damp conditions with comparatively less sunlight duration. Situated at 25.09° N latitude and 111.11° E longitude, Shanggantang Village is a meticulously preserved, extensive traditional architectural complex from the Ming and Qing eras, exemplifying the distinctive features of southern Hunan (Figure 1). The Zhou family has thrived here for generations, and the configuration of the traditional houses is unique, adhering to the spatial design of “three rooms, two compartments, and a patio”. The residences are two-story wooden edifices featuring three rooms per level, with the western aspect of the upper floor’s main room extended by a wooden balustrade, creating a distinctive sunroof that overlooks the patio. This design fulfills the requirements for illumination and ventilation while exemplifying the fusion of aesthetic appeal and practicality inherent in traditional architecture. The conventional residences in Shanggantang Village incorporate several effective natural lighting strategies; nonetheless, the dense configuration and spatial constraints of the structures result in inadequate internal natural illumination.
The spatial characteristics of traditional dwellings in Shanggantang Village, together with the integration of patio courtyards, are categorized into three types: “central patio-type”, “offset patio-type” [1] and “composite patio-type”, which incorporates both patio and alleyway. Figure 2 illustrates these three categories. The initial variant of the “central patio type” is illustrated by Zhou Yuanfang’s dwelling (Figure 2a). The dwelling is a three-room wooden structure featuring inserted beams, comprising a foyer and bedroom at the front, a central patio, and a hall (living room) at the rear. It boasts a flexible and expansive layout, characterized by undulating elevations resulting from varying functional heights. The second category is the “offset patio type”, as illustrated by the residence of Zhou Moshun (Figure 2b). In the “offset patio type”, the patio is adjacent to the building’s outside wall, with the hall serving as the focal point and the patio positioned in front of the hall. The third type of “composite patio-type” is exemplified by the Zhou Dynasty Mou Residence (Figure 2c). The property adeptly integrates the features of both patio and alleyway types, with the semi-enclosed patio accessible via a long, narrow alleyway, showcasing diverse spatial dimensions, a systematic arrangement of elevations, and multiple intricate functional rooms.

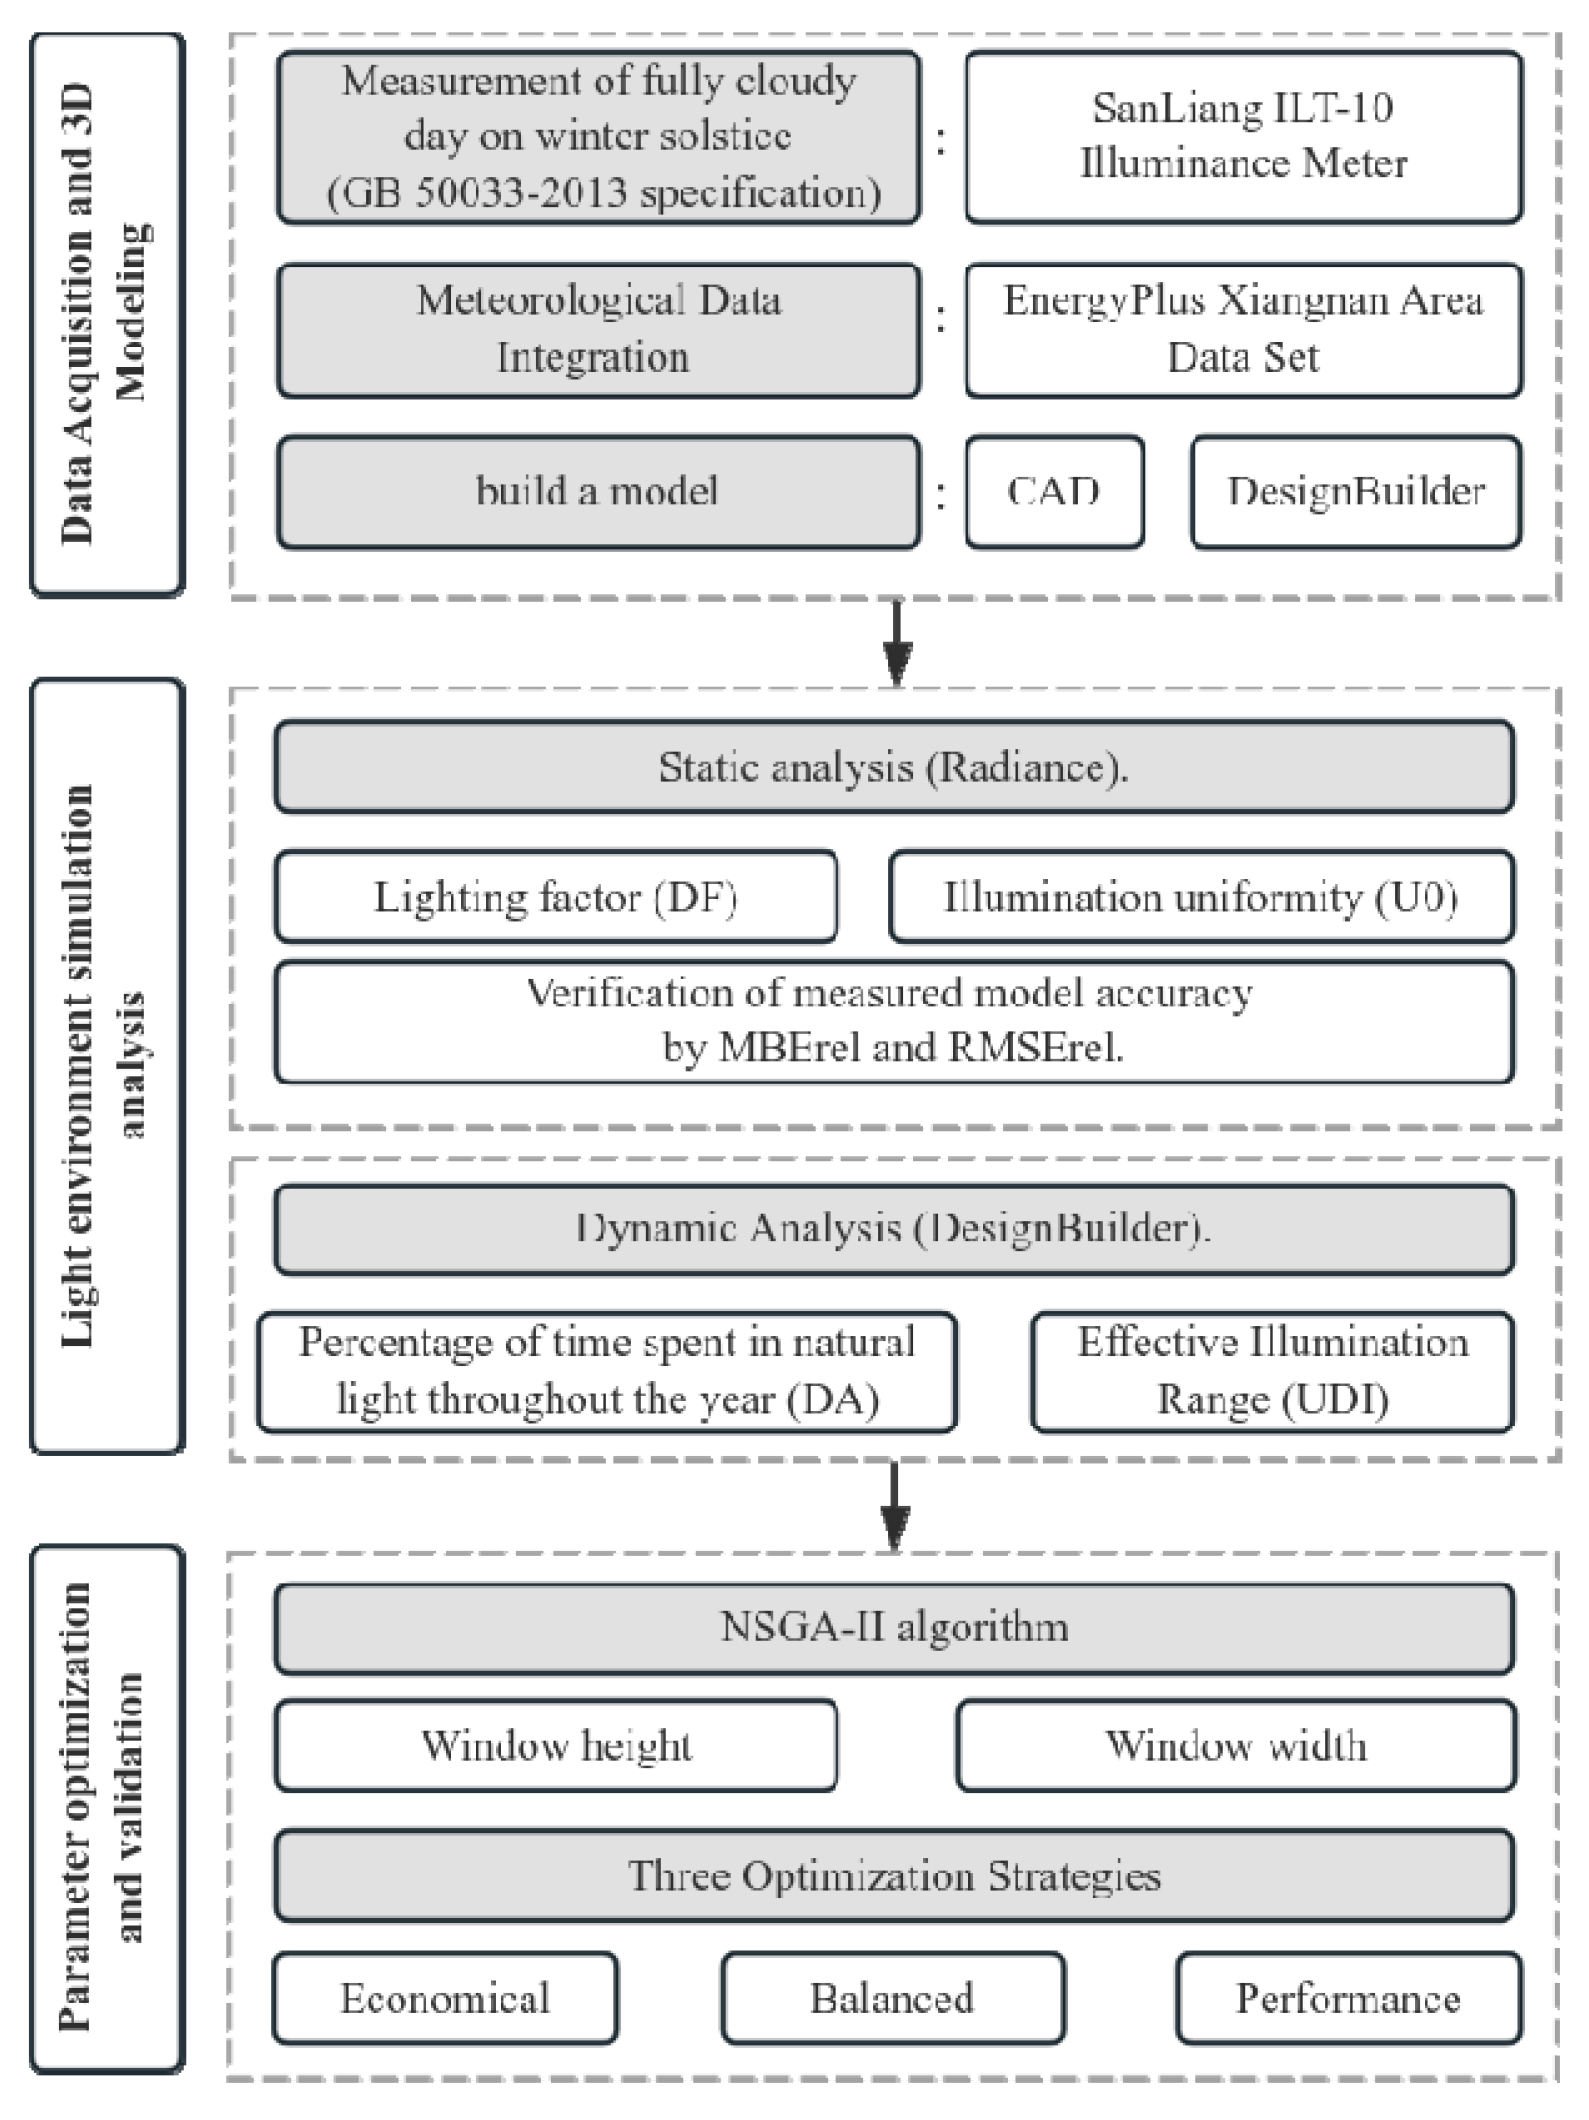
2.2. Research Methodology

The examination of the light environment can be categorized into visual and non-visual dimensions. This analysis primarily focuses on the visual aspect, integrating formulaic calculations [32], field measurements [33], and simulation analyses to assess the light environment of traditional residential houses. The specific steps are outlined as follows:
The initial phase involved field research and on-site cartography. Three representative residences were surveyed on-site for subsequent software simulation modeling. The research team performed precise illuminance measurements at various uniformly dispersed test places throughout the patio houses, adhering to the criteria of architectural lighting design rules. All measurements adhered to the architectural daylighting design standard (GB50033-2013) [32], with three sets of light illuminance measurements conducted at each test location, and the average value computed to ensure data accuracy and minimize measurement error.
The subsequent phase involves 3D spatial modeling. Meteorological data for Shanggantang Village were obtained from the EnergyPlus website, combined with information from field studies, used to make a 2D drawing of traditional homes with CAD, and then turned into a 3D model using DesignBuilder (Figure 3).
Ultimately, the investigation of the indoor lighting situation used software modeling. The light environment simulation software is primarily categorized into two types: static and dynamic. The frequently utilized light environment simulation software and its respective application areas are presented in Table 1. The study uses both fixed and changing evaluation methods to measure and improve the current state of traditional home lighting, using the indicators listed in Table 2 for assessment. The dynamic simulation software DesignBuilder is employed to simulate two dynamic evaluation indices: the percentage of all-natural lighting time and the effective natural light illuminance. At the same time, the static simulation software Radiance is used to check two fixed evaluation measures, the light-harvesting coefficient and the evenness of light levels, to ensure that the recorded static evaluation data makes sense.
The study adopted the widely accepted relative mean bias error (MBErel) and relative root mean square error (RMSErel) to quantify the deviations between simulated and measured illuminance values. These metrics are standard in daylighting performance studies for heritage buildings [22,25] and are defined as:
M B E r e l = i = 1 n ( E s i m u l a t i o n , i E m e a , i ) i = 1 n E m e a , i × 100 % ,
R M S E r e l = 1 n i = 1 n ( E s i m u l a t i o n , i E m e a , i ) 2 1 n i = 1 n E m e a , i × 100 % ,
where “Esimulation, i” denotes the simulated horizontal illuminance at point i, “Emea, i ” denotes the measured horizontal illuminance at point i, and “Emea ” denotes the average horizontal illuminance measured at all selected points.
Specifically, MBErel evaluates systematic bias in simulation accuracy, while RMSErel captures overall error magnitude. The 20% threshold aligns with the Chinese daylighting design standard (GB50033-2013 [32]) and precedents in vernacular architecture research, such as Hao et al. (2024) [22] who applied MBErel <15% to validate Tujia wooden dwellings’ lighting models, and Wang et al. (2022) [25] achieving RMSErel ≤12% in Shanggantang Village simulations.

2.3. Data Collection

This study involved field measurements on 21 December 2024, the winter solstice, characterized by the lowest solar altitude angle and shortest day length in the Northern Hemisphere, thereby accurately representing the actual light levels in traditional houses under severely adverse natural lighting conditions. The raw illuminance data (unit: lux) are shown in Appendix A (due to space limitation, the appendix only shows the representative measurement point data, the complete raw data can be obtained by contacting the corresponding author), the data collection covers the winter solstice from 9:00 to 18:00, a total of 9 time periods, and 3 consecutive measurements are taken at each measurement point to obtain the average value. The weather conditions throughout the measurement period precisely adhere to the “full cloudy day” criterion outlined in the “Building Lighting Design Standard” (GB 50033-2013) to eliminate the influence of direct sunlight on the diffuse lighting simulation. It should be made clear, however, that the current data do not cover other seasons such as the equinoxes and solstices due to the study cycle and resource constraints due to the following practical considerations: (1) the study prioritizes capturing key challenges in low-light environments to prioritize the assessment of worst-case scenarios for natural lighting performance, which is consistent with the research objectives; (2) field access to the Heritage Village was limited to specific times of the year to minimize disruption to residents and to protect the integrity of the site; and (3) resource constraints (e.g., equipment availability and funding) made it necessary to focus the data collection window. This limitation is discussed further in Section 4, Discussion.
The SanLiang ILT-10 digital illuminance meter is employed for instrument selection and calibration, with a measurement accuracy of ±3% and a resolution of 1 lux, verified by the China Academy of Metrology and Science. Before measurement, the instrument is calibrated to a zero point and adjusted for ambient temperature (operating temperature range 0–40 °C) to guarantee data dependability. The functional rooms on the first floor (bedroom, living room, kitchen) serve as the measurement subjects regarding point layout and error control (Figure 2a–c). The points are arranged utilizing the even grid method, with a grid interval of approximately 1 m and a working plane height of 0.75 m, adhering to the standard definition of “conventional working surface”. Each measurement point was assessed three times sequentially, and the mean value was calculated after excluding the outliers.

2.4. Research Process

Figure 4 shows the three main research components. In this study, we constructed a ‘measured-static-dynamic’ multidimensional analysis framework (Figure 2), firstly obtaining basic data through field measurements under extreme light conditions on the winter solstice and establishing a refined 3D model based on CAD and DesignBuilder. Subsequently, Radiance software was used for the quantitative analysis of static daylighting factor (DF) and illuminance uniformity (U0), while DesignBuilder was used to simulate the year-round dynamic indicators (DA/UDI). Finally, the NSGA-II algorithm is combined to optimize the parameters of the window openings and propose a graded retrofit strategy. This framework not only reveals the light regulation mechanism of the patio shape but also provides a scientific and culturally adaptive solution for the low-carbon renewal of traditional houses.

3. Results

3.1. Comparative Analysis of the Illuminance Measurement of the Light Environment

The east–west measurement points are designated from west to east as A to G (or extended to I), resulting in a total of 7 or 9 points; the north–south measurement points are designated from south to north as 1 to 9 (or extended to 11), resulting in a total of 9 or 11 points. A three-dimensional surface map of illuminance distribution was created (Figure 5). The restricted measurement duration makes it challenging to analyze the two dynamic evaluation indices—the percentage of all-natural lighting time and effective natural light intensity—using the collected data. Consequently, this study emphasizes the two static indices, daylight coefficient and illuminance uniformity, to derive conclusions. Furthermore, this study aims to investigate the relationship between building shape, window dimensions, and natural illumination while simultaneously analyzing and comparing the lighting effectiveness of windows with varying orientations and the light conditions in certain places.

3.1.1. Analysis of Static Daylight Factor (DF)

This study gathered measured illuminance data from three traditional houses in overcast conditions, adhering to the Daylight Factor (DF) specification in the Building Lighting Design Standard (GB 50033-2013), with the outdoor reference illuminance established at 5000 lux, as presented in Table 3. The quantitative study elucidates the geographical distribution characteristics of the lighting factor (DF), with a detailed examination of the core and transition areas to investigate the disparities in their lighting attributes.
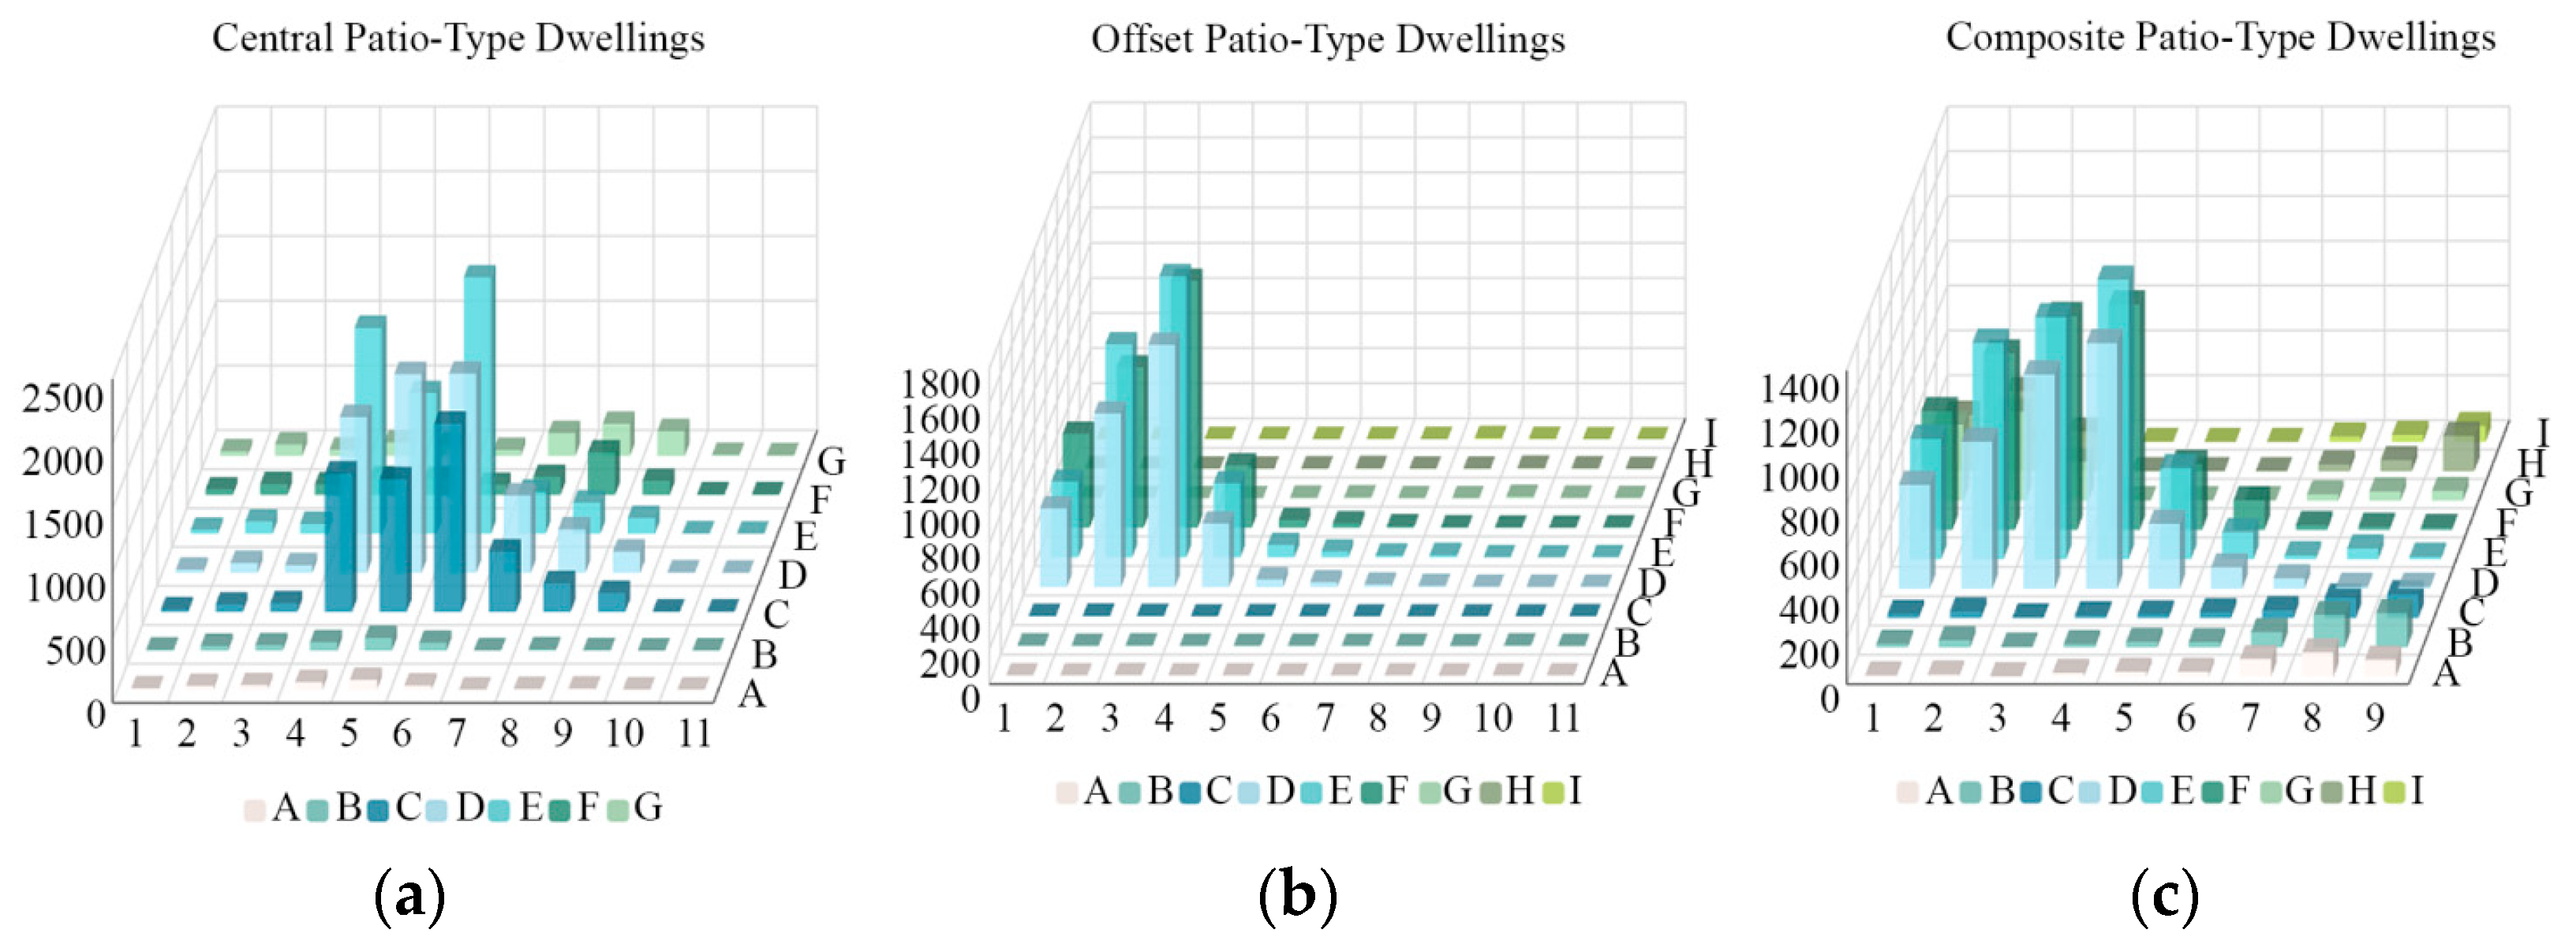
  • Central patio-type dwellings rely on central lighting to maintain the brightness of functional spaces. The core area (columns C–E, rows 4–6) of the central patio-type dwellings exhibits optimal lighting performance, demonstrating the best lighting performance with an average illuminance of 1,385.6 lux, which corresponds to a daylighting factor (DF value) of 27.7%. Since the patio is located in the geometric center of the dwelling, the opening area accounts for 21.3% of the core area (extrapolated from the data in rows 4–6), forming a radial lighting pattern, with direct light directed vertically into the core area through the opening. However, the DF value of the transition area of the central patio-type dwelling plummets to 1.6%, highlighting the limitations of a single patio lighting pattern.
  • The structural imbalance significantly reduces the light efficiency of the offset patio-type dwellings. The DF of the core area (columns D–F, rows 1–3) of the offset patio-type houses is 19.8%, and the average illuminance is 991.5 lux, which is 28.5% lower than that of the central patio-type houses. This statistic is directly related to the loss of lighting efficiency triggered by its asymmetrical patio location. The DF value of the transition area is only 0.05%. This significant difference in lighting (with an illuminance ratio of 430:1 between the core and transition areas) highlights optical deficiencies in offset patio-type house layouts. The offset of the patio creates a “light funnel” effect, resulting in more than 85% of the direct light being concentrated in the core area, while the transition areas are permanently under-illuminated due to the shading of the building mass (92% of the areas with illuminance below 10 lux).
  • The composite patio-type residence achieves an equilibrium of light environment via multi-level lighting. The composite patio-type residence mitigates the aforementioned deficiencies by utilizing multi-directional lighting paths, achieving a daylight factor (DF) value of 17.1% in the core area (columns D–F, rows 1–4) and an average illuminance of 856.5 lux. Despite the DF value being 38.2% lower than that of the positive patio type, the integration of the alleyway and patio broadens the lighting source from a singular focal point to a linear expanse. The predicted illuminance is 287 lux in comparison to the pure patio model, while the transition zone exhibits a DF value of 1.2% (average illuminance of 61.9 lux), representing a 24-fold improvement relative to the partial patio type. The DF value of the transition zone is 1.2% (average illuminance 61.9 lux); in comparison to the offset patio-type dwelling, this represents a 24-fold improvement, indicating that the alleyway serves as an effective auxiliary lighting channel to enhance the light environment at the space junction.

3.1.2. Analysis of Static Illuminance Uniformity(U0)

In this study, illuminance uniformity was introduced as an evaluation index of the quality of the light environment in order to deeply explore the light distribution of three different kinds of dwellings, and the data results were counted (see Table 4). The data show that the illumination uniformity of the three types of patios does not meet the standard, but there are obvious differences between them:
  • Central patio-type dwellings achieve high uniformity in the core area through geometric symmetry, but their transition area is prone to systematic dark areas. In the core area of the central patio type, the illuminance uniformity reaches 0.62 (the minimum illuminance is 861 lux, and the average illuminance is 1385.6 lux), and the annular diffuse reflection produced by the symmetrical patio makes the coefficient of variation in the illuminance (variance/mean) only 0.18, which is in line with the optimal illuminance uniformity of 0.4–0.6 as stipulated in the Standard for the Lighting Design of Buildings (GB/T 50034-2024) interval. However, in the central patio-type transition area, the illuminance uniformity plummets to 0.03 (the minimum illuminance is 2.2 lux, and the average illuminance is 79.8 lux), and the dispersion of the data surges to 1.87, with the illuminance of 92% of the measurement points being less than 30 lux, which reflects that there is a serious problem with dark corners in the edge area.
  • Offset patio-style residences exhibit pronounced illuminance gradients in the central region due to optical path distortions, resulting in the coexistence of illuminated spots and shadowed sections. The illuminance uniformity in the offset patio-type core area is 0.11, with a minimum illuminance of 109 lux and an average illuminance of 991.5 lux. The asymmetric light path in the offset patio-type core area results in an illuminance disparity of 1911 lux, with a maximum illuminance of 1920 lux and a standard deviation of 423.7. The illuminance uniformity in the offset patio-type transition region is markedly low, with a minimum of 0.03 lux and 98% of measurement spots receiving less than 1 lux of illumination.
  • Composite patio-style residences enhance homogeneity in the core area to a degree comparable to that of central patio-style structures and markedly diminish the variability of low illuminance in the transition zone by integrating numerous light sources. The central region of the composite patio-type exhibits an illuminance uniformity of 0.38 (minimum illuminance at 8.03 lux, average illuminance at 856.5 lux), with a standard deviation decreased to 214.5. This improvement is due to the multi-directional lighting enhancing uniformity, while the addition of lateral light from the alleyway reduces the proportion of areas with illuminance below 100 lux to 1.2%. In the composite patio-type transition zone, the illuminance uniformity was 0.003 (minimum illuminance of 0.012 lux, average illuminance of 61.9 lux), a low value yet improved by two orders of magnitude compared to the offset patio type, demonstrating the alleyway’s mitigating effect on light blindness.

3.1.3. Lighting Efficiency of Windows in Different Orientations

Various orientations of windows exhibit distinct lighting coefficients, with residential layouts oriented south and north establishing the south as the primary lighting surface and the east–west orientation as the secondary lighting surface. This investigation elucidates the disparities in lighting efficacy across various orientations, predicated on the peculiarities of axial illuminance distribution in residential structures. By analyzing the data from the southernmost and northernmost measurement points, as well as the easternmost and westernmost measurement points, and extracting the data from the extreme measurement points of the three categories of residential buildings in the north–south direction (columns A–G) and the east–west direction (rows 1–11), an axial illuminance attenuation model is developed (refer to Figure 6, Figure 7 and Figure 8), which elucidates the mechanism by which orientation affects the light environment. The model curves indicate that the regulation of illumination efficiency through building orientation has a pronounced spatial gradient:
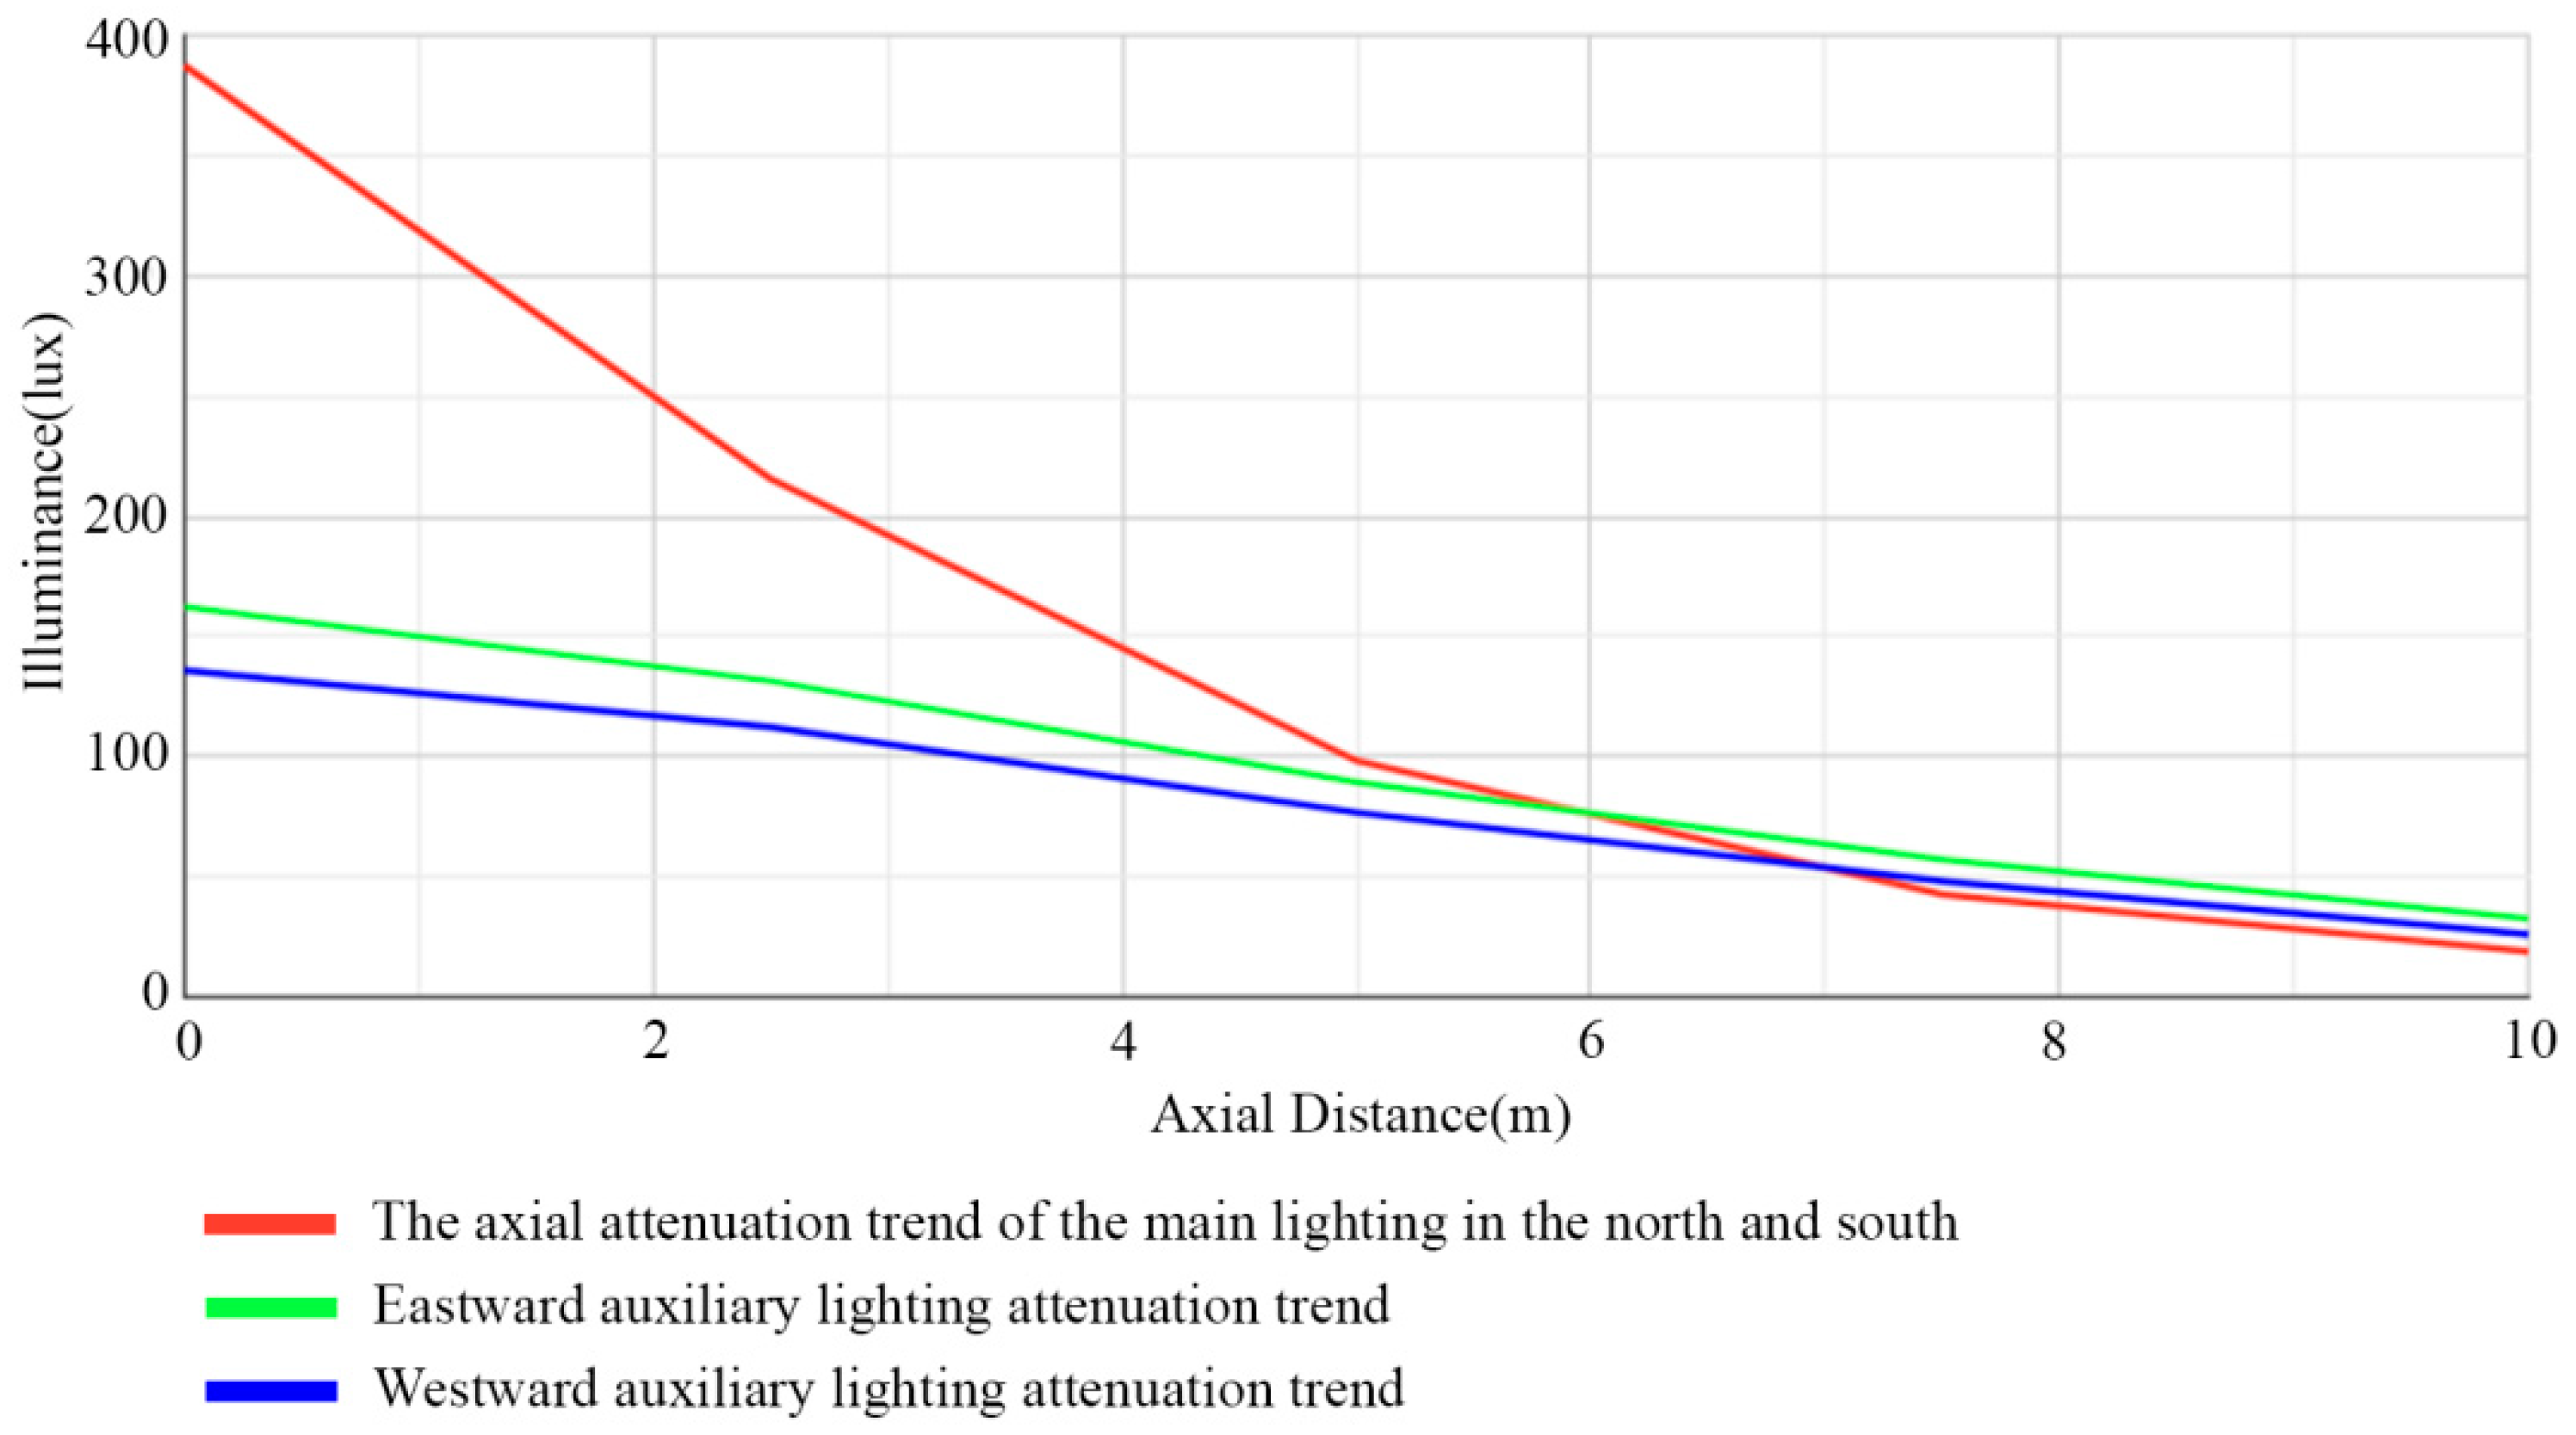
  • The axial illuminance of central patio-type dwellings exhibits symmetrical attenuation. The attenuation rate of north–south axial illuminance is 0.52 lux/m, whereas the attenuation rate of east–west axial illuminance is 0.21 lux/m (Figure 5). The south-facing side, which collects the most light, has a clear benefit; at the same time, the light collection from east to west is uneven, with the east side being 19.5% more efficient than the west side. This phenomenon is intricately linked to the alteration of the sun’s azimuth resulting from the Earth’s rotation. During the winter solstice, the solar azimuth angle in the study area (30° N) varies from 47° SE to 47° SW, allowing east-facing windows to receive up to 2.5 h of effective direct light (illuminance > 500 lux) in the morning, whereas west-facing windows can only achieve a light-harvesting duration of 1.2 h due to the sun’s altitude angle decreasing to 28° in the late afternoon. This temporal discrepancy led to a 19.5% enhancement in the average daily DF of the east-facing region (3.25%) relative to the west-facing region (2.72%).
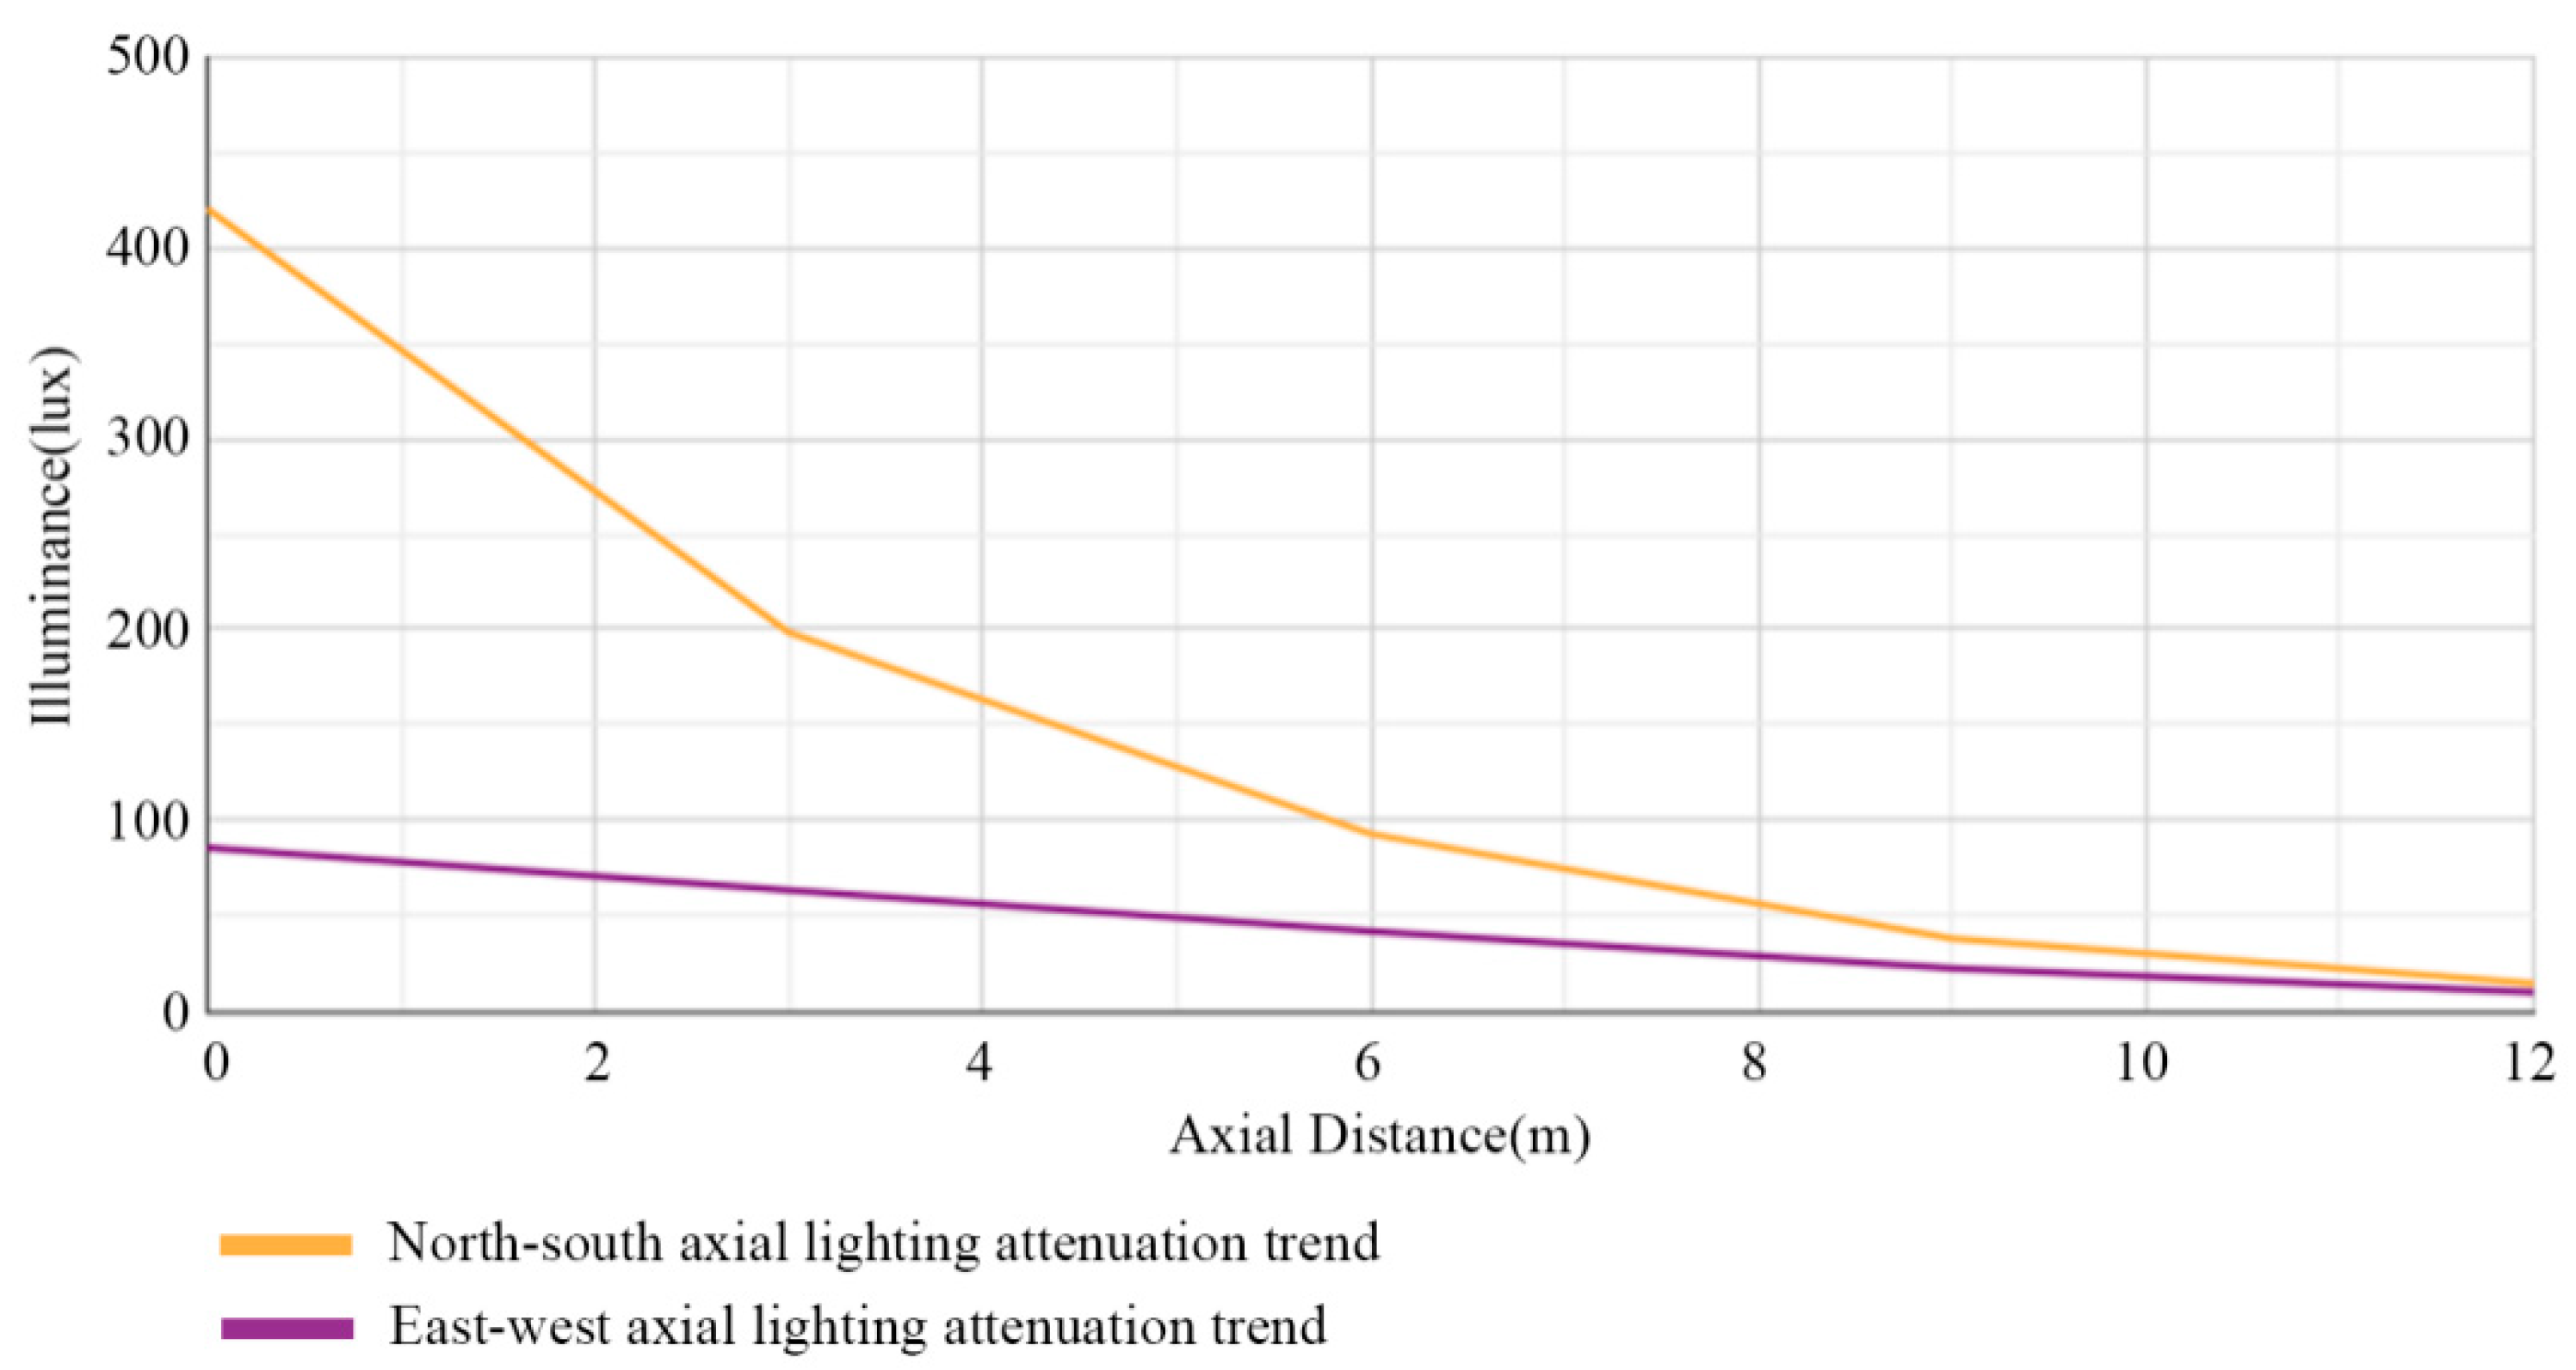
  • The axial illuminance of offset patio-type dwellings exhibits asymmetric attenuation characteristics. Specifically, the north–south axial illuminance has a high attenuation rate of 73 lux/m in the first 3 m, while the east–west axial illuminance value is always maintained between 30% and 40% of the north–south axial value (Figure 6). As a result of the imbalance in orientation, the quality of the light environment in the offset patio-type dwellings declined, with the gradient of illuminance in the north–south axis increasing sharply to 0.83 lux/m, and the DF value at the north end was only 0.05%, a value that was only one-third of that at the south end. In addition, the light efficiency ratio in the east–west direction (east: west = 1.06:1) is close to equalization, which suggests that the asymmetrical patio layout attenuates the efficacy of the orientation in regulating light.
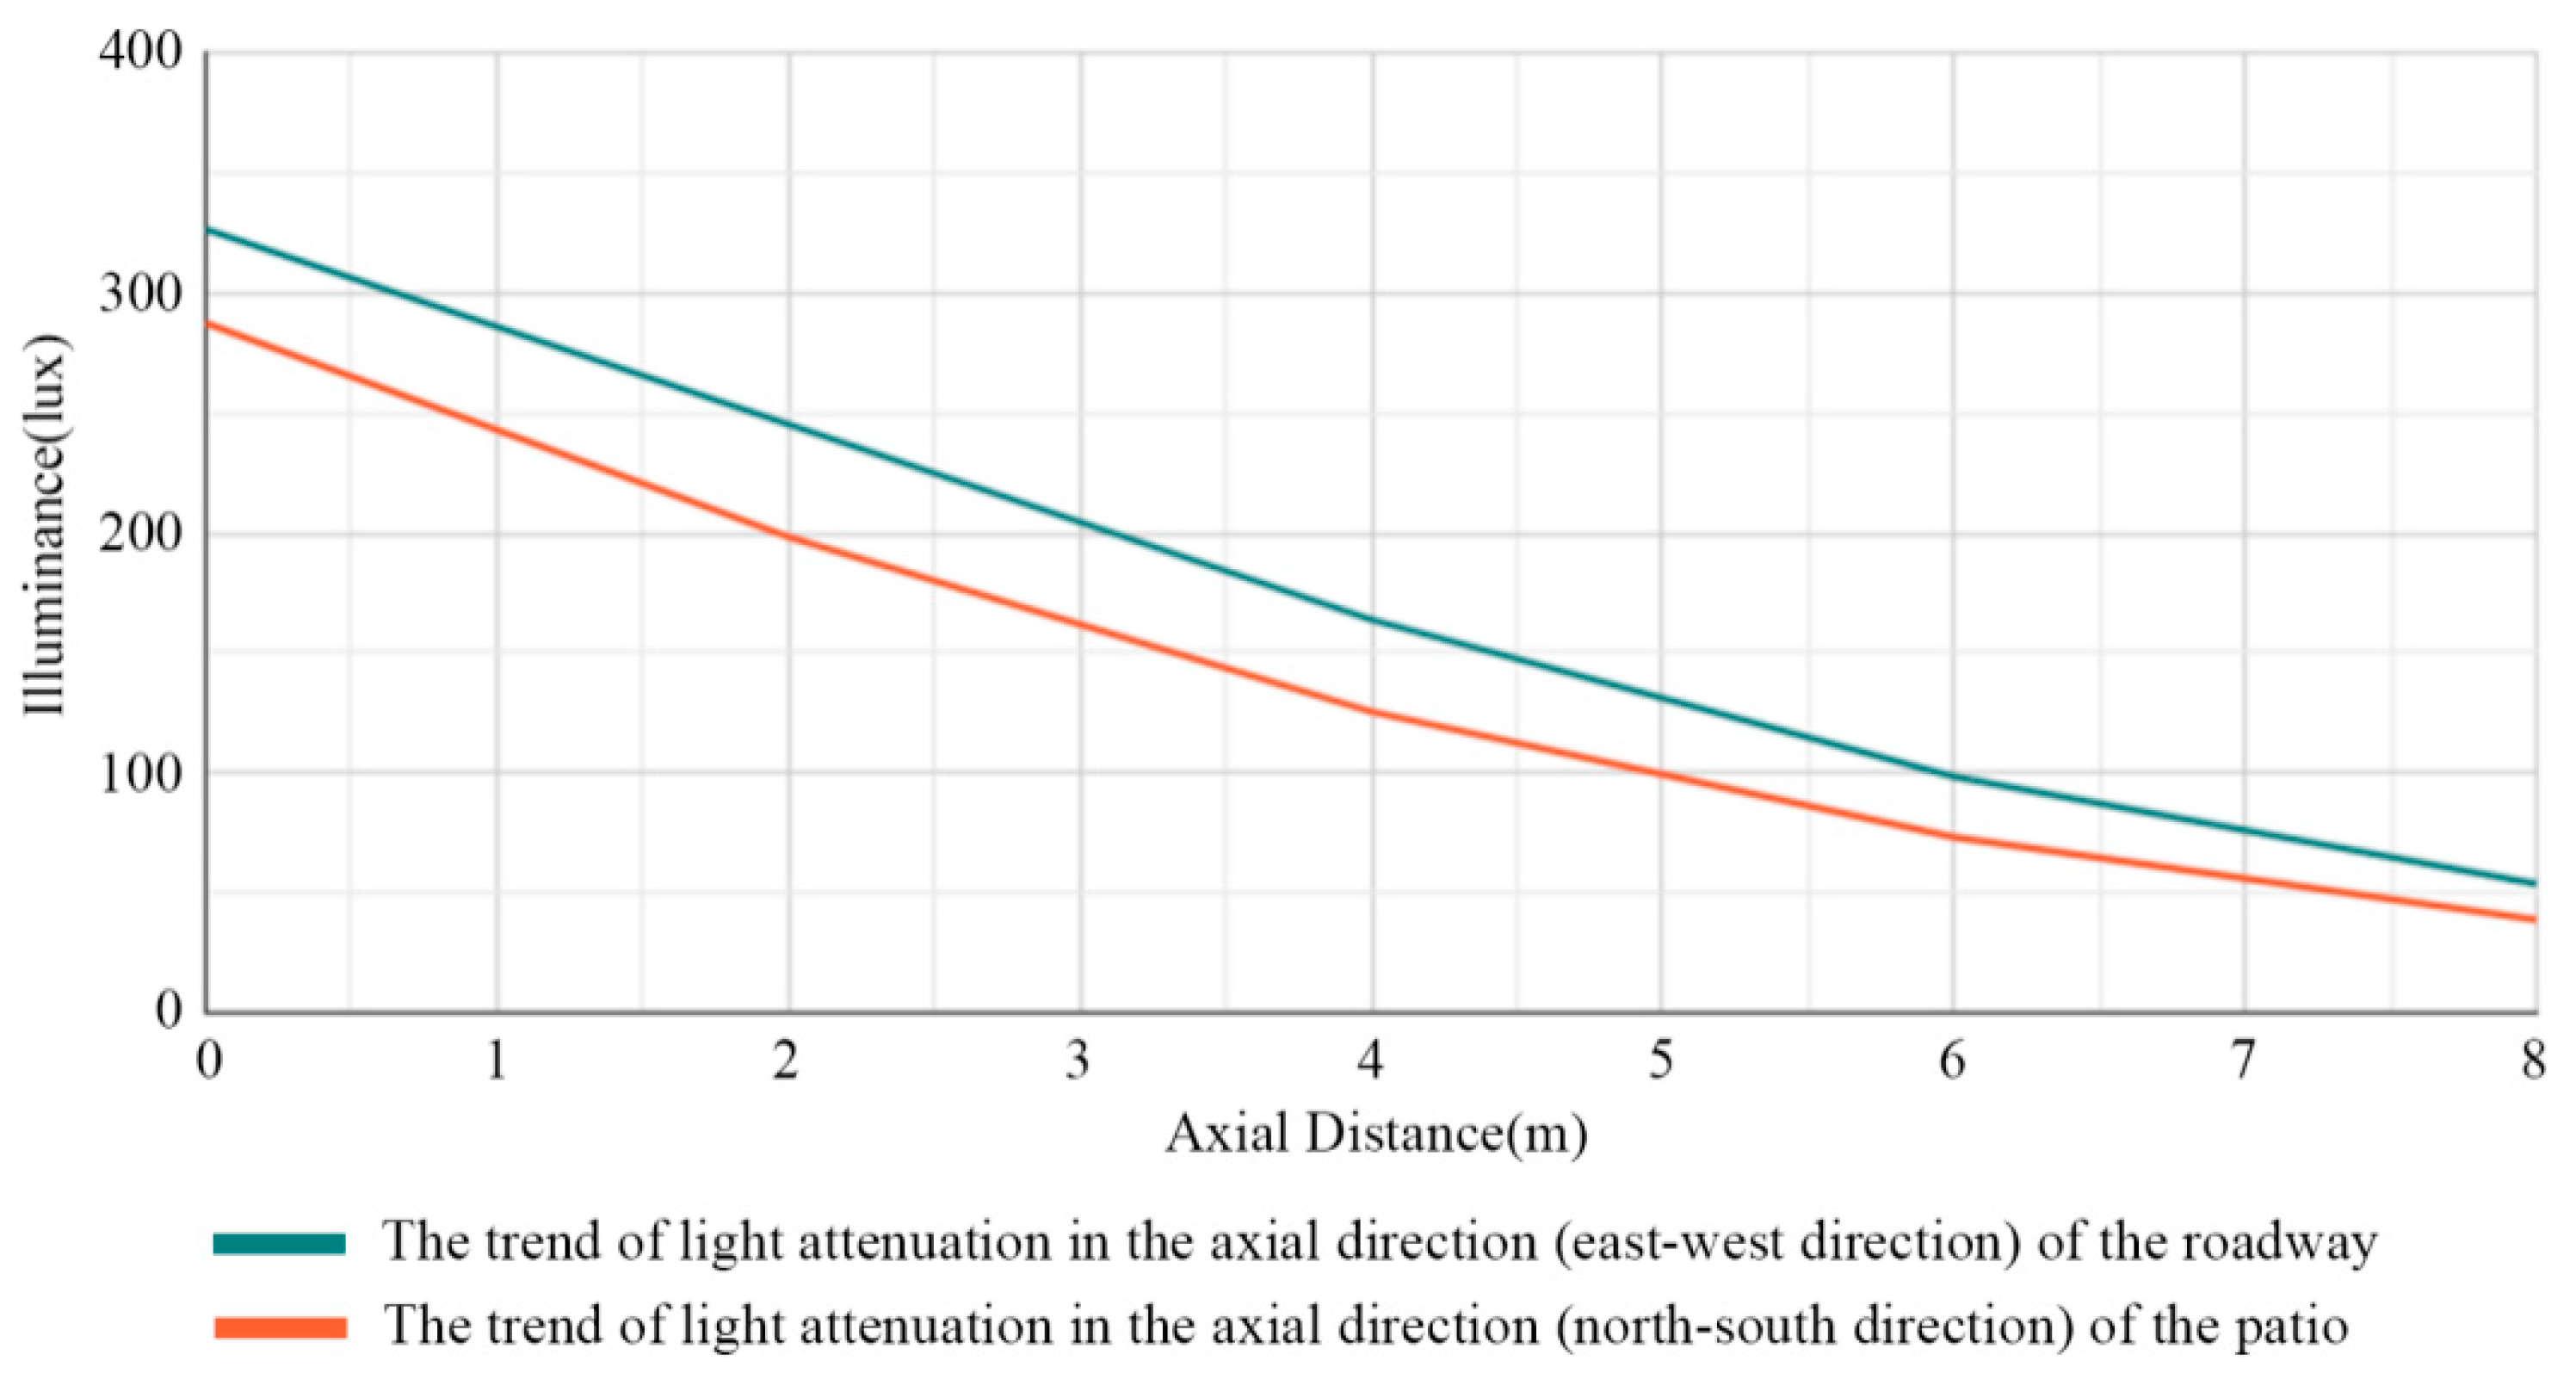
  • The axial illuminance of composite patio-type dwellings exhibits a characteristic of superimposed double decay curves. Specifically, the initial attenuation rate of alleyway axial (east–west) illuminance is 0.41 lux/m. In comparison, the initial attenuation rate of patio axial (north–south) illuminance is 0.31 lux/m, and the attenuation rate tends to be the same after 6 m (Figure 7). The composite patio type achieved light environment compensation through multi-directional lighting. Its north–south axial illuminance gradient decreased to 0.38 lux/m, which was 26.9% lower than that of the central patio type. The lateral diffuse reflection introduced by the alleyway increased the illuminance at the north end to 61.9 lux (DF = 1.24%), which was still lower than that at the south end (856.5 lux (DF = 17.1%)). Still, it increased the uniformity of illuminance from 0.03 to 0.38. An interesting reversal of east–west lighting performance is observed in this type of dwelling: the average illuminance at the west-facing point (column H) is 396 lux (DF = 7.92%), which even exceeds that at the east-facing point (column G), which is 327 lux (DF = 6.54%).

3.2. Simulation and Comparative Analysis of the Current Situation of the Light Environment

To facilitate the simulation analysis, the room functions were named based on the actual conditions of the three types of patio dwellings (Figure 2), and the mean illuminance data (unit: lux) were simulated for seven consecutive days of fully cloudy and entirely sunny conditions from 20 to 26 July. These data include indoor and outdoor spaces such as halls (F1:HALL), terraces (F1:PATIO), and a variety of functional rooms to explore the differences in the characteristics of the three types of patio dwellings in terms of the lighting environment.

3.2.1. Daylighting Simulation and ANOVA

Numerical simulations of three conventional home patio designs—“central patio-type”, “offset patio-type” and “composite patio-type”—were conducted under both fully cloudy and fully sunny situations utilizing Radiance software. The simulation aims to examine the light distribution features of several patio types in vertical space and to elucidate the differences in light environment gradients across distinct spatial patterns. The simulation study accurately determines and graphically illustrates the light distribution features of each patio type in vertical space, as depicted in Figure 9. The study’s results statistically compare the variations in light gradient across three distinct patio patterns: “central patio-type”, “offset patio-type” and “composite patio-type” (refer to Table 5), highlighting the heterogeneity in light intensity distribution and the multi-dimensional disparities in uniformity.
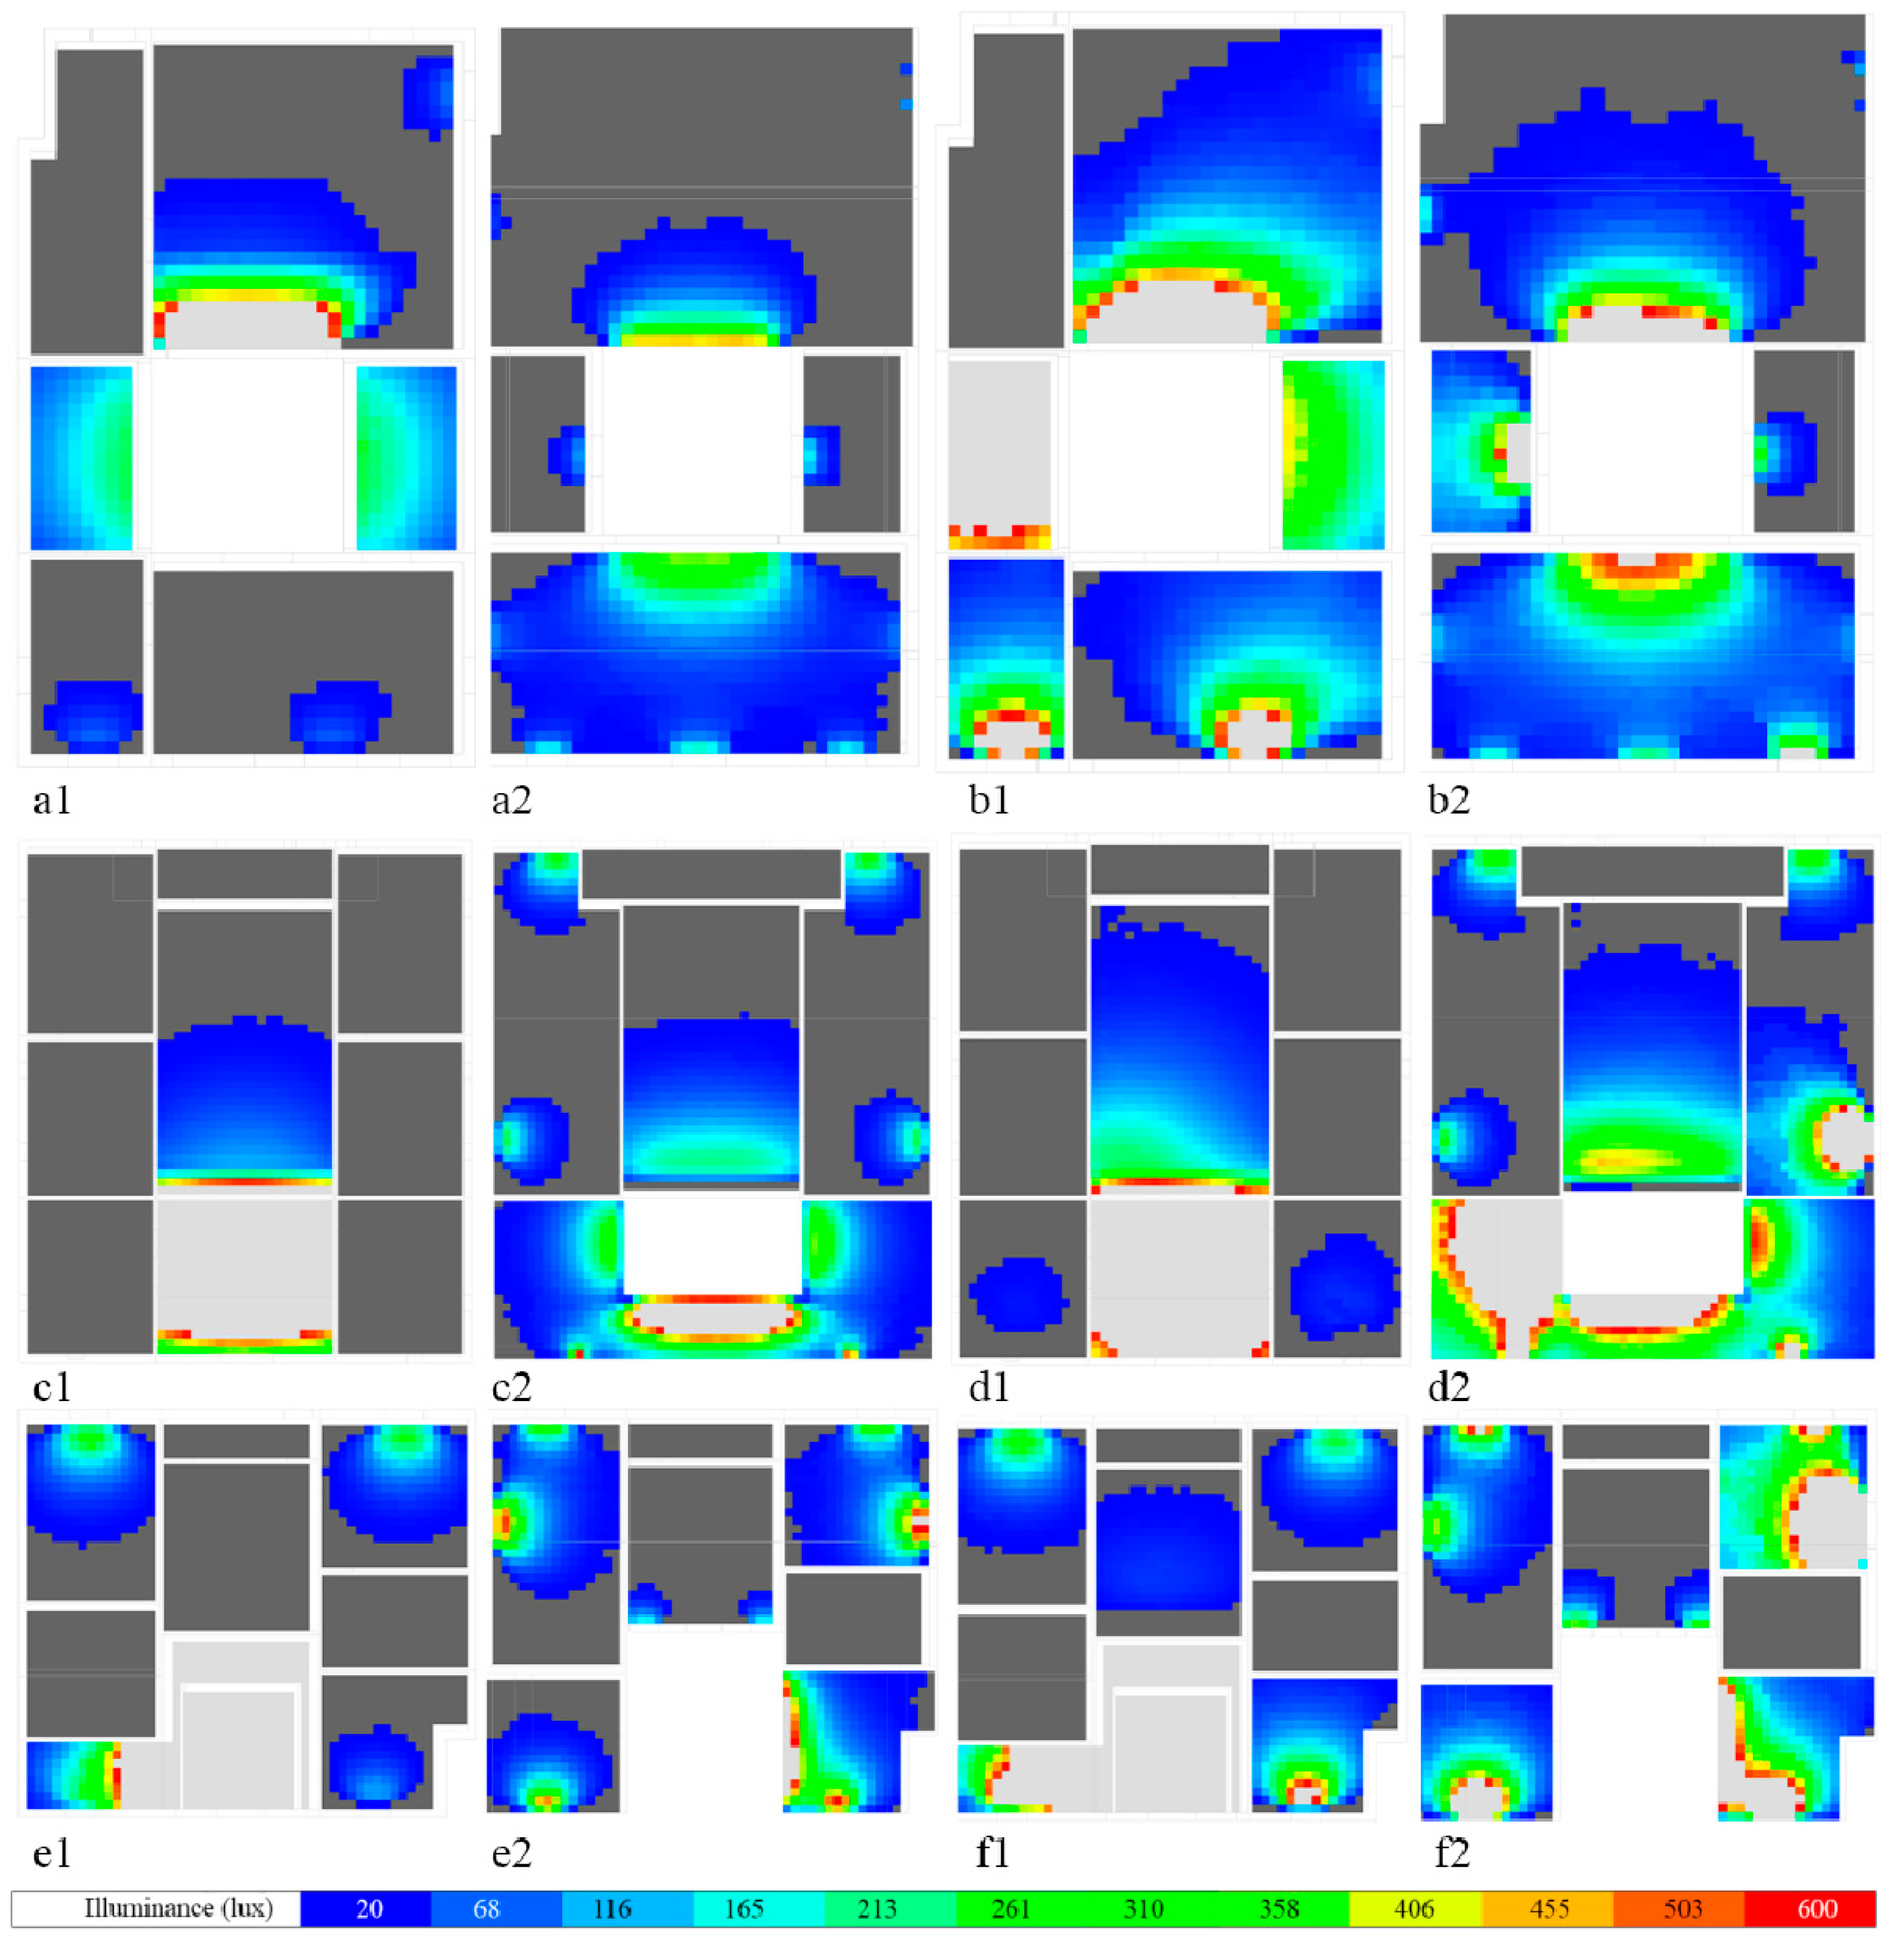
  • Central patio-type houses are characterized by “symmetrical layout to enhance uniformity.” Core areas, such as “room 4” and “room 2”, have an average value of DF of 1.268% and 1.196%, respectively, and the minimum DF value reaches 0.542–0.582%, which is significantly better than other types, reflecting the reflection diffusion advantage of the vertical patio, but U0 is 0.459% and 0.453%, respectively. However, U0 is 0.459 and 0.453, which are obvious, indicating the uniform diffusion of direct light by a symmetrical patio. The average DF value for “room8” in the south-facing area is 0.586%, which is lower than the core area but almost double that of the composite patio type (like 0.211%), showing how the symmetrical design helps improve light distribution at the edges. Meanwhile, the U0 = 0.049 (min. 0.47 lux vs. max. 69.44 lux) of the south-facing “front rooms” differs by up to 148 times, which highlights the significant adverse effect of insufficient window opening area on light uniformity.
  • The single large opening of the offset patio-type dwelling led to extreme differences. The patio core area (“patio”) has a DF mean value of 9.336% (maximum value of 13.856%) and a uniformity index of 0.250 for U0, which is a better performance compared to the composite patio-type buildings. However, the average DF values for functional rooms (e.g., “room3”) range from 0.012% to 0.021%, a difference of three orders of magnitude, reflecting the limitations of the single-opening patio on light penetration into the fringe areas. In contrast to the core area of the patio (“patio”), the “hall” area has a DF mean of 0.637% (maximum value of 1053.36 lux), a uniformity index U0 of 0.093 (with a minimum value of 7.38 lux vs. a maximum value of 1053.36 lux), and a minimum illuminance of only 7.38 lux, which suggests that the transition of the light environment at the junction of the patio and the interior space is too abrupt.
  • Composite patio-type houses have a high DF core area, but the distribution is not uniform. The average DF value in the patio area is 16.47% (with a maximum of 26.93%), which is much higher than in other areas. This shows that the composite patio brings in a lot of natural light because of its many openings. However, even though the U0 value is 0.018, which is better than in other areas, the visual comfort is still not good enough because the maximum brightness is 3364.51 lux. Although the U0 value is 0.018, which is better than the other areas, the actual visual comfort is still lacking due to the maximum illuminance of 3364.51 lux. Other functional rooms, such as “room7” and “room1”, have DF values of 0.000% and 0.182%, which differ significantly from the core area of the patio, highlighting clear disparities. The average DF value of “room6” reaches 1.477% (maximum value 7.307%), while the average DF value of “room1” in the corner area is only 0.182% (maximum value 0.863%), which is a difference of up to 8 times. This distinction further highlights the problem of asymmetric light distribution. This contrast further emphasizes the problem of asymmetric light distribution, while U0 = 0.062 (min. 11.46 lux vs. max. 913.01 lux) indicates significant jumps in the light environment.
This study utilized the relative mean bias error (MBErel) and relative root mean square error (RMSErel) to assess the differences between the simulated values and the measured values of the static evaluation indices, focusing on areas with non-zero measured values and significant discrepancies. The calculation results show that the RMSErel and MBErel for all three types of residential dwellings simulated using the Radiance software are below the 20% threshold (the MBErel for composite patio-type dwellings is 11.44%, close to the threshold). The MBErel for the composite patio-type homes near the threshold may be due to differences between modeled and actual material properties such as unaccounted material degradation (e.g., wood reflectance), measurement calibration challenges in irregular geometries, and limitations of static simulations. Specifically, this may stem from the following factors: (1) the default wall reflectance of 0.7 (new white walls) was used in the modeling, but the measured building reflectance may have decreased to less than 0.5 due to aging; (2) the window transmittance was assumed to be modern glazing (80%), whereas traditional dwellings tend to use wood grill windows (with a light transmittance of about 30–50%); and (3) the presence of slight light interference from the outdoor environment at the time of the measurement (e.g., reflections from neighboring buildings). Future research could refine the parameter calibration and use dynamic simulations to reduce these uncertainties.

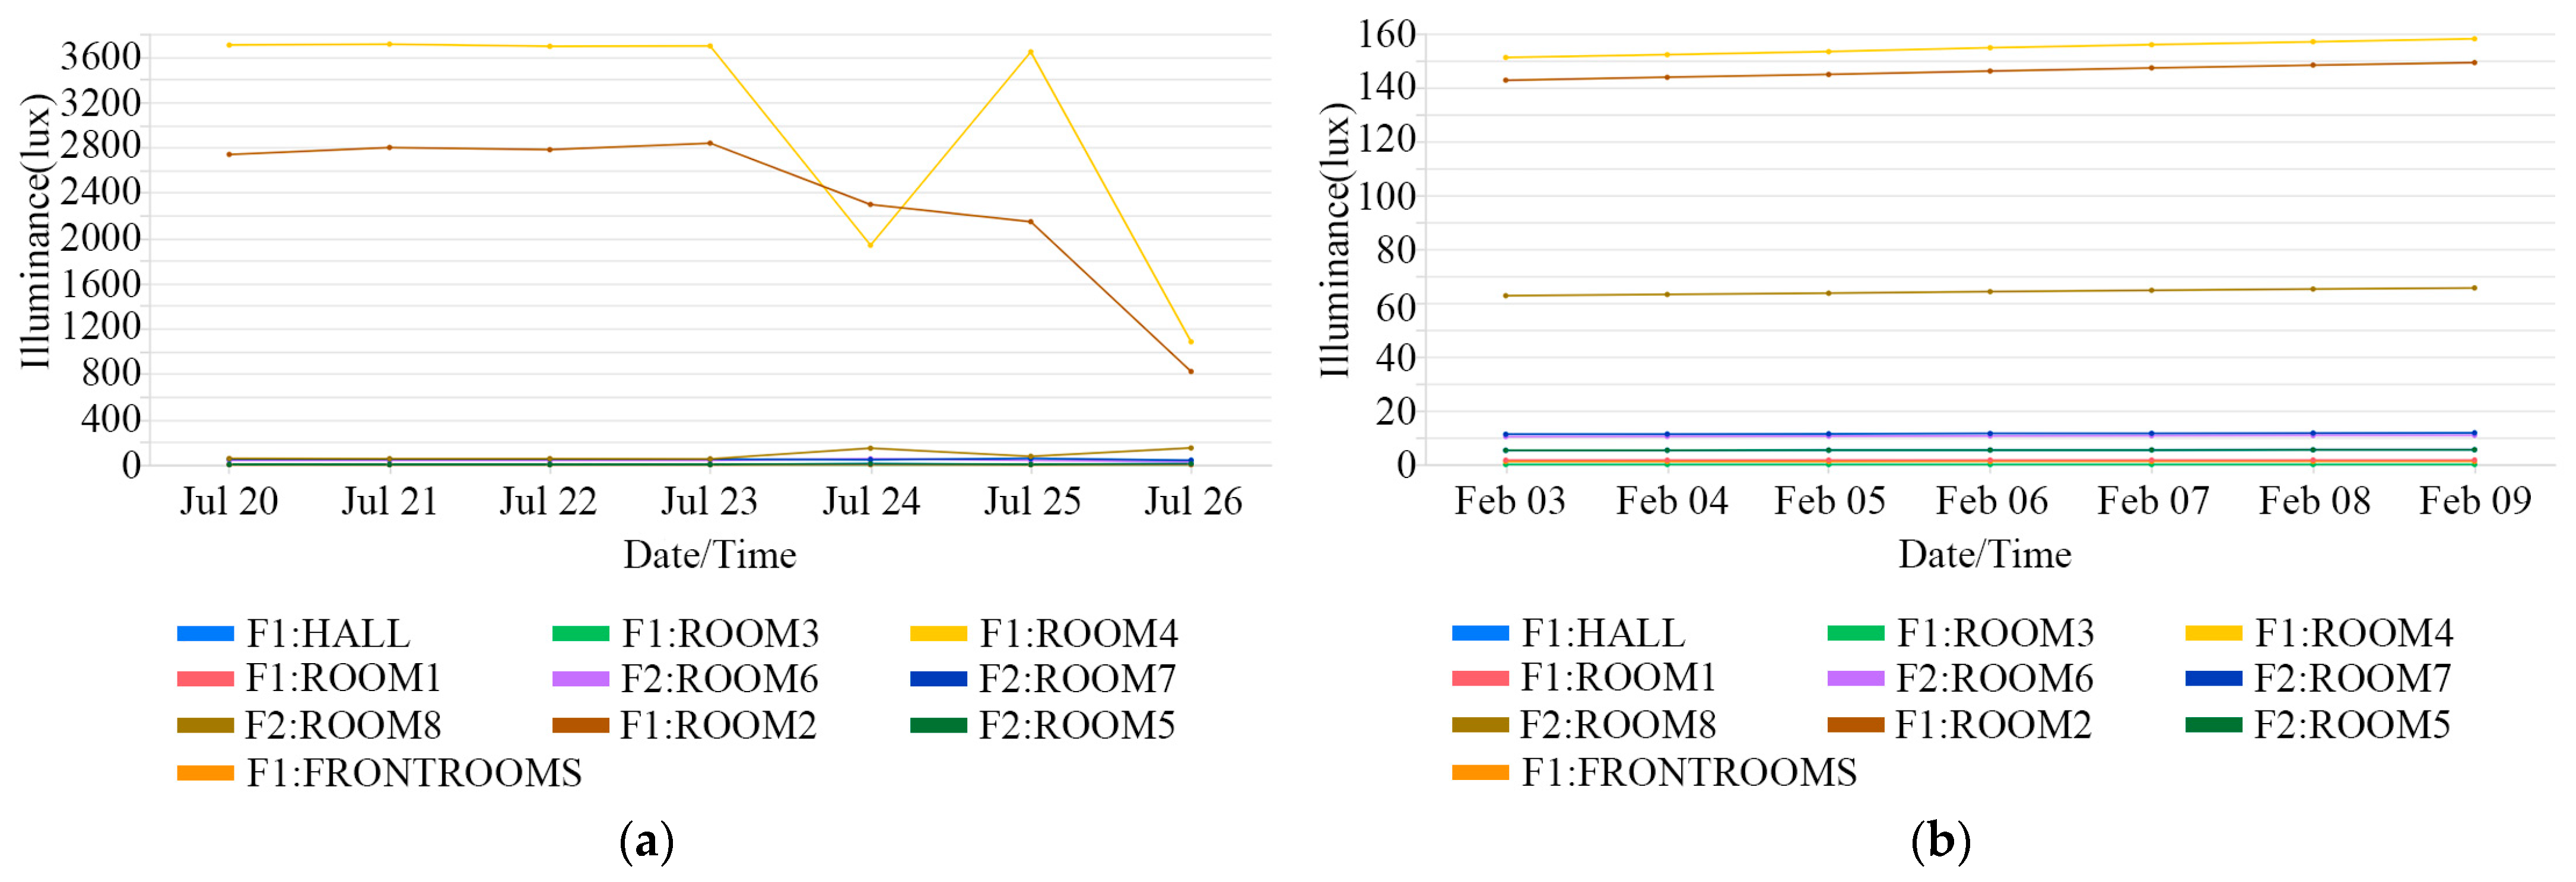
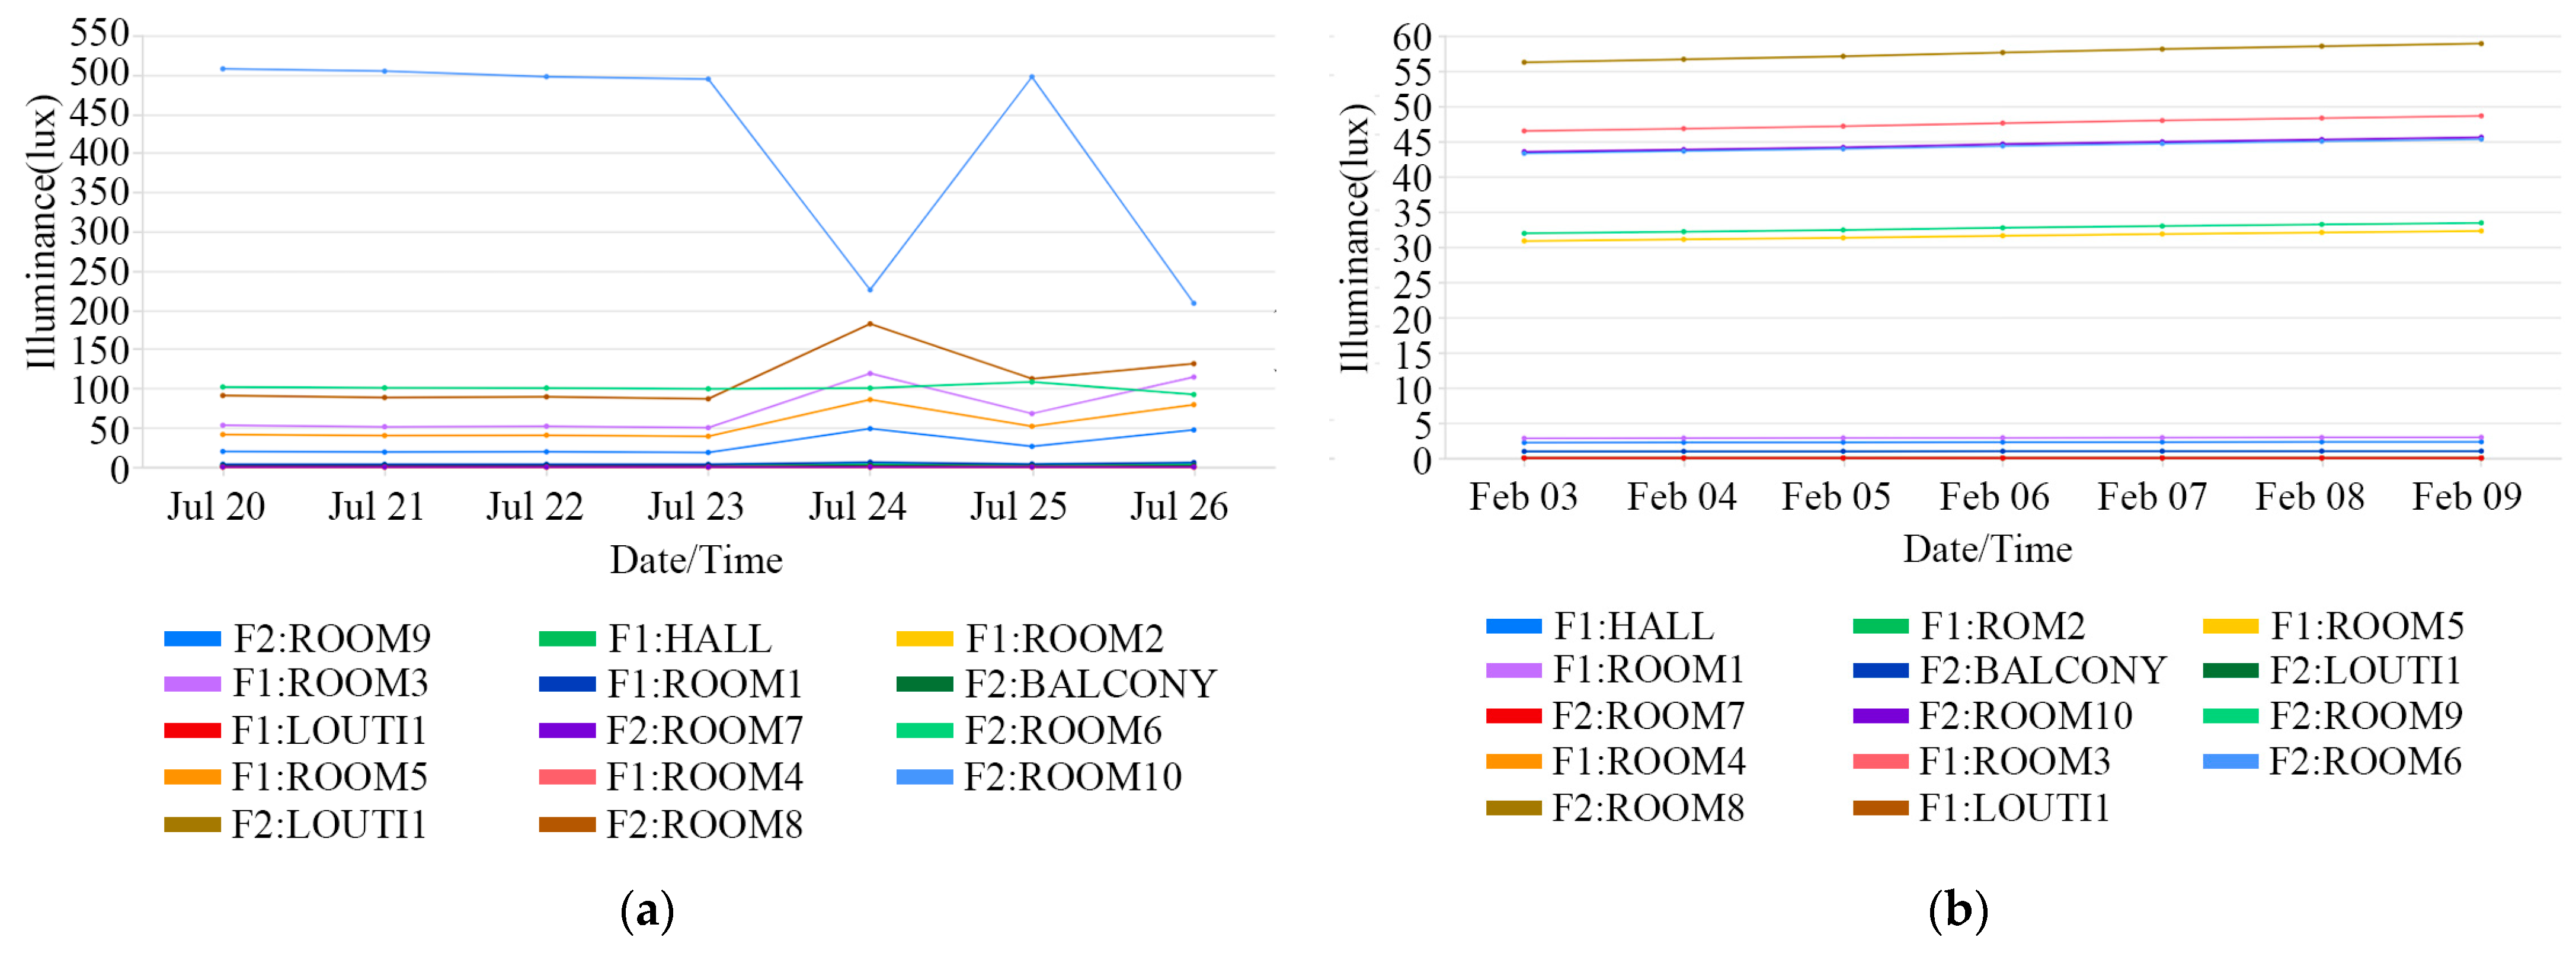
3.2.2. Year-Round Dynamic Daylighting Simulation Analysis

The study employed the DesignBuilder software to evaluate the year-round dynamic daylighting simulation of three distinct types of patio-style conventional residential structures. The study assessed the percentage of all-natural daylighting time (DA) and the effective natural light intensity (UDI). The comprehensive examination of these critical measurements seeks to elucidate the weekly timing curves of patio-style residences across several seasons, particularly in summer and winter (Figure 10, Figure 11 and Figure 12).
Comparing the core area values with those of the edge area (refer to Table 6), the temporal and spatial variability demonstrated by various patio morphologies in light-gathering performance throughout the cycle is illustrated, indicating that patio shapes significantly influence the temporal fluctuation characteristics of the light environment, as follows:
The percentage of all-natural daylighting time (DA) is a key indicator to measure whether the natural light level can satisfy the minimum demand (i.e., ≥300 lux) during the specified period. The results of the analysis of three different types of patio-type residences are (1) The symmetrical layout of central patio-type residences improves the balance. The DA of “F1:ROOM4” in the functional area is 100% (3705.7 lux per week), and the vertical patio design realizes all-weather high illumination through reflection diffusion. The south-facing edge zone “F1:HALL” has a DA of 21.4% (3.6 lux weekly), which is lower than the core zone, but compared to similar zones with composite patios (e.g., “F1:HALL” has a DA of 1.1%), it is nearly 20 times more illuminated. However, compared with similar areas of composite patio type (e.g., “F1:HALL” with a DA value of 1.1%), its illuminance is nearly 20 times higher. The DA of north-oriented “F1:ROOM3” is 0% (0 lux per week), because the closed structure completely blocks the penetration of natural light, and the design of the window opening should be optimized. (2) The single large opening of the offset patio-type residence leads to extreme differences. The DA of “F1:PATIO” in the core area of the patio reaches 100% (888.3 lux per week), but the DA of “F1:ROOM3” in the functional room is only 0.2% (1.3 lux per week), with a difference of 500 times, reflecting the limitation of the light penetration into the edges of the single opening of the patio. The difference is 500 times, reflecting the limitations of a single patio opening for edge light penetration. The DA of “F1:HALL” is 68.9% (202.2 lux per week), but the DA of the adjacent “F1:ROOM1” drops to 12.4% (293.2 lux per week), showing the discontinuity of the light transition between the patio and the interior. Discontinuity. (3) The DA in the core area of the patio of the composite patio-type residence is high but unevenly distributed. The DA of the patio area “F1:PATIO” is as high as 98.6% (weekly average illuminance of 14402.7 lux), but the DA of the subsidiary functional area “F1:ROOM1” is only 3.8% (weekly average illuminance of 3.3 lux), and “F1:ROOM2” has zero illuminance for the whole day. F1:ROOM2 has zero illumination throughout the day, while the south-facing zone “F2:ROOM10” has a DA of 74.3% (507.9 lux weekly), thanks to its orientation, which receives plenty of direct sunlight. The north-facing zone “F2:ROOM10” has a DA of 74.3% (507.9 lux weekly), thanks to its orientation. The north-facing “F2:ROOM7” has a DA of only 0.9% (0.5 lux weekly), highlighting the problem of asymmetric light distribution, as north-facing rooms usually receive only relatively uniform diffuse light, resulting in an 82-fold difference between north and south.
Useful Daylight Illuminance (UDI) is a measure of the percentage of light in the beneficial range (100–2000 lux), with a performance that balances comfort and energy efficiency needs. The results for the three types of patio houses are as follows: (1) The central patio-type houses show a balance between the core and edge areas. The vertical patio area “F1:ROOM4” has an effective UDI ratio of 85.2% (3705.7 lux), while the ratio of excessive light is only 14.8%, which is better than the composite patio type. On the other hand, the south-facing “F1:FRONTROOMS” has a very low effective UDI of 3.2% (2.7 lux), meaning it receives much less light than needed at 96.8% and needs improvements to let in more light, like making the windows bigger or using reflective materials. (2) The offset patio-type dwellings suffer from overexposure in the core area of the patio and disconnection in the transition area. The effective percentage of “F1:PATIO” UDI is 18.4% (888.3 lux), and the percentage of overexposure is 81.6%, which is significantly higher than the central patio-type, reflecting that a single large opening does not have enough control over direct light. For example, “F1:HALL” has an effective UDI of 54.1% (202.2 lux), but the adjacent “F1:ROOM1” has an insufficient UDI of 87.6% (293.2 lux), indicating that the transition of the light environment needs to be optimized. (3) The composite patio-type residence shows the phenomenon of UDI failure in the core area and polarization in the functional area. The percentage of effective UDI in the patio “F1:PATIO” is only 12.7% (average weekly 14,402.7 lux), and the percentage of excessive light (more than 2000 lux) reaches 87.3%, which may cause glare problems and overheating in the room. The south-facing “F2:ROOM10” has an effective UDI of 63.4% (507.9 lux), while the north-facing “F2:ROOM7” has an insufficient UDI of 99.1% (0.5 lux), which reveals that the multi-tenant structure further exacerbates the imbalance of the light environment.

3.3. Optimization Analysis of the Light Environment

The objective of optimization is to maximize the average daylighting factor (ADF) and control the uniformity (U0 ≥ 0.4). The objective is to maximize the average daylighting factor (ADF) and control the uniformity (U0 ≥ 0.4), and the objective function is defined as:
M a x i m i z e   A D F = 1 N i = 1 N D F i ,
S u b j e c t   t o   U 0 0.4 ,
A genetic algorithm (NSGA-II) was used to generate the Pareto frontier solution set, with parameters including window height, window width adjustment ratio (10~100%), population size set to 100, number of iterations 500, crossover probability 0.9, and variance probability 0.1. The parameters were referred to the results of the sensitivity analysis of Deb et al. [34], to ensure the convergence of the Pareto solution set. The standard deviation of the optimization results is less than 1.5% as verified by 10 independent repetitive experiments, indicating that the parameter selection possesses robustness.
The Pareto frontier solutions generated by the genetic algorithm require manual selection to encompass multiple optimal solutions, which must then be analyzed to establish the size thresholds for shading components, considering the appropriate ratio of window height to width for residential windows and adequate indoor illumination [35]. This section presents parallel line diagrams derived from the Pareto frontier solution, illustrating the parameter selection for each solution and its optimization effects. It details the influence of increasing window height and width on the average daylighting factor (ADF) and determines the optimal range for window dimensions.

3.3.1. Central Patio-Type Dwellings

Based on the optimization data of the “central patio-type” (Figure 13), the Pareto front parallel line diagram (Figure 14) is plotted, and the analysis of the Pareto front solution shows that the optimization curves of the central patio-type residence exhibit unique two-stage decay characteristics. When the window height is adjusted to 100%, the total ADF reaches 0.588%, but in the interval from 80% to 100%, the gain per 10% sharply decreases from 0.9% to 0.3%, with a decay rate as high as 67%. The same critical point exists for window width adjustment: a cliff-like decrease in gain after 90% (0.4%→0.08%), reflecting the constraints of structural limitations on light diffusion.
The study obtained the optimization decision matrix (Table 7) by weighing the cost and benefit of the project. Because of the spatial characteristics of the central patio-type residence, it is recommended to adopt the balanced scheme of “85% window height + 90% window width”, with a total ADF of 0.581 (96.2% of the extreme value) and a reduction of 40% in the retrofit cost. In addition, this program can also achieve global optimization through the following four key measures: (1) Using prismatic glass in the front rooms to make diffuse reflection more efficient (ADF + 0.05%); (2) designing adjustable window angles for room 8 f2 (every 15° can increase the ADF by 0.1–0.2%); (3) setting up a dynamic shading system in the f1 hall (lighting uniformity >0.7); (4) for f1 room 3, which has no natural light (ADF = 0), a lateral light well is needed (expected to increase ADF to 0.3–0.5%).

3.3.2. Offset Patio-Type Dwellings

Optimization data for the “offset patio-type” (Figure 15) were obtained in this study. Based on the optimization data, a Pareto frontier parallelogram can be constructed (Figure 16). The examination of the Pareto front solutions indicates that the optimization of daylighting in the “offset patio-type” residential structure exhibits significant nonlinear features. When the window width adjustment ratio attains 100%, the total ADF reaches the theoretical maximum of 1.119%. However, after the adjustment ratio goes over 80%, the efficiency of the gain drops a lot: for every 10% increase in window width, the ADF rise decreases from 0.82% in the early stage (10–70%) to 0.07% in the later stage (80–100%), leading to a 91% reduction in benefits. Simultaneously, the modification of window height to 70% manifests as a local extremum; the ADF value for f2 room 8 increases from 0.398% to 0.402%, while the patio area (f1 patio) necessitates no further optimization due to light saturation, remaining consistently around 9.3%.
The optimization decision matrix (Table 8) can be derived by evaluating the project’s costs and benefits. For the spatial attributes of the offset patio-style residential area, it is advisable to implement a configuration of “window width 95% + window height 90%”, resulting in a total ADF of 1.112% (98.1% of the theoretical maximum). This approach reduces retrofit costs by 35% while only compromising performance by 1.7%, thereby achieving an optimal balance between daylight quality and economic efficiency. The ADF of the stairwell f2 louti2 consistently remains below 0.03%, necessitating a breakthrough of the zero-response bottleneck through the independent light-guide system, which is anticipated to be enhanced to 0.5% to 0.8%.

3.3.3. Composite Patio-Type Dwellings

Based on the optimization data of “Composite Patio-Type” (Figure 17), the parallel lines of the Pareto front are plotted (Figure 18). When the window height and window width reach 100% adjustment, the ADF value is the largest (window height ADF = 2.926%, window width ADF = 79.109%), which is a theoretical extreme value, but with the increase ratio of more than 80%, the ADF enhancement slows down. When the increase ratio exceeds 80%, if the window height/width continues to increase by 10%, the increase in window height ADF decreases from about 0.3% (10%→20%) to 0.017% (90%→100%) for every 10% increase in the early period, while the increase in window width ADF decreases from about 2% (10%→20%) to 0.362% (90%→100%) for every 10% increase in the early period. In addition to this, it is worth noting that a local maximum in ADF occurs when the window height is increased by 70% (from 2.905% to 2.909%), while the window width is saturated with light in room 8 when the window width is increased by 90%.
The optimization decision matrix (Table 9) can be obtained by weighing the cost and benefit of the project. Given the spatial characteristics of the composite patio-type residence, it is recommended to adopt the program of “90% window width + 90% window height”, in which the ADF value of the window height can reach 99.8% of the maximum value (i.e., 2.922/2.926), and the ADF value of the window width can also reach 99.5% of the maximum value (i.e., 78.747/79.109), which saves 10% of the material cost compared to the 100% solution.

4. Discussion

This work elucidates the geographical differentiation of the light environment in patio-type traditional dwellings in southern Hunan, together with its regulatory mechanisms, by empirical measurement and multidimensional modeling. The central patio-type houses exhibit superior light performance in the core area (DF = 27.7%, U0 = 0.62) due to their symmetrical configuration; however, the light factor in the transition area diminishes to 1.6%, highlighting the constraints of the single patio-type lighting scheme regarding light attenuation in the depth of the space. Offset patio-style residences create a “light funnel effect” due to the patio’s displacement, resulting in a luminance disparity between the core and transition areas of 430:1, with 12.5% of the space exposed to direct light. The composite patio-type structure significantly enhanced the DF value of the transition area to 1.2% by employing a multi-directional lighting path, representing a 24-fold improvement over the offset patio-type structure, thereby demonstrating that the conventional alleyway system can serve as an effective lighting compensation structure. The coupled attenuation gradient (0.41 lux/m in the axial direction of the alleyway and 0.31 lux/m in the vertical direction of the patio) can be considered the precursor to early “light pipe technology”, which closely aligns with the axial attenuation model of modern light pipes (0.35–0.48 lux/m) introduced by Kim et al. [36].
The dynamic simulation additionally demonstrates the time impact of the patio configuration. The central patio-style traditional houses exhibit exceptional year-round dynamic lighting metrics, with a daylight autonomy (DA) value of 100% and an effective useful daylight illuminance (UDI) percentage of 85.2%. This performance markedly surpasses the average for Huizhou houses, which have a DA value of approximately 92%, as documented in existing literature [16,37]. Furthermore, the symmetrical light path design offers a novel framework for enhancing the light environment in high-density settlements. The combined patio area receives too much light, with only 12.7% of it being useful, while 87.3% is too much, highlighting how stacking multiple patios negatively impacts lighting comfort.
The variations in the design of traditional residences with patios in southern Hunan exemplify the adaptive strategies of traditional architectural knowledge in response to the regional climate. The geometric centrality of the central patio-type inherently satisfies contemporary standards of light homogeneity, but the light path coupling mechanism of the composite patio-type offers insights into low-carbon renewal. For instance, by parametrically modifying the dimensions of the window opening (e.g., the central patio-type utilizes the configuration of ‘window height 85% + window width 90%’), the DA value of the edge zone can be markedly enhanced, increasing from 21.4% to 58.3%, thereby substantiating the viability of retrofitting traditional components. It is advisable to integrate the patio shape classification and lighting database into the village protection strategy and employ HBIM technology to develop a gene pool of the light environment, thereby offering quantitative support for the execution of the Five-Year Action Program for Rural Habitat Improvement and Enhancement (2021–2025) [38].
This study, however, possesses certain drawbacks. The data collected included only extreme conditions at the winter solstice, and future work could expand the temporal scope of the measurements to include solstices and equinoxes, supplementing the multiseasonal data and improving the photoclimatic model to reduce the limitations on the portability of the results to other temporal contexts, and thus enhance the ecological validity of the photoclimatic model over the entire annual cycle. The collected data exclusively encompass the functional rooms on the first floor; subsequent research must incorporate a comparison analysis of the first and second floors. The impact of differences in window material transmittance was not quantified in the analysis [39] and may lead to an overestimation of the effectiveness of traditional patio lighting. Window transmittance is the ability of light to pass through window glass, usually expressed as a percentage. Specifically, transmittance is the percentage of visible light in the wavelength range of 380–780 nm that passes through the window glass compared to the total visible light illuminating the glass surface. The default window paper transmittance in the simulation of this study is 50%, while the actual old window paper may drop to less than 30% due to yellowing or breakage; if modern high-transmittance glass (80–90%) is used, the shading modulation of the patio may be weakened, which can significantly change the distribution of DF and UDI [40]. Future calibration of the model with historical material parameters is needed to better fit the real light environment of traditional buildings. The study once more overlooked challenging variables, including wall roughness and wall nonperpendicularity. The precise impact of wall material aging on reflectance remains unquantified (e.g., the reflectance ratio of a white wall may diminish from 0.8 to 0.5), thereby leading to an overestimation of the real daylighting efficacy of older structures. The current optimization strategy focuses on daylighting performance but does not assess the impact of window sizing on the thermal environment (e.g., overheating in summer or heat loss in winter). In the future, it is necessary to carry out light-heat coupling simulations in combination with tools such as EnergyPlus to balance the lighting and thermal comfort needs and to propose a comprehensive low-carbon and energy-saving solution.
Overall, this study focuses on the texture of the light environment, systematically analyzes the correlation mechanism between the shape of the patio and the light environment through the multi-scale analysis method of ‘measured-static-dynamic’, and provides a theoretical paradigm for the adaptive renewal of traditional residential buildings. It provides a theoretical model for the adaptive renewal of traditional residential buildings. The livability of traditional residential houses is the result of the coupling of multiple factors such as light, heat, and wind, and this study does not cover the comprehensive performance of ventilation, thermal comfort, economy, etc. Subsequent studies can combine CFD simulation (e.g., Phoenics) and energy consumption analysis (e.g., EnergyPlus) to explore the synergistic regulatory mechanism of the patio shape on multiple physical fields.In the future, we will concentrate on four key aspects: first, developing a dynamic model of the regional light environment by synthesizing historical climate data; second, investigating the amalgamation of the patio with contemporary intelligent materials (e.g., electrochromic glass [41]) to facilitate adaptive modifications of the light environment. Third, using architectural anthropology methods, through fieldwork and participatory design, quantitatively analyze the cultural coupling mechanism between the light environment and traditional rituals, and quantify the residents’ perceptual preferences for optimizing the light environment (e.g., the correlation between the demand for illuminance at specific times of the day and the ritual activities). The patio is not only a lighting component, but also a spatial carrier for clan rituals (e.g., rituals and festivals). For example, the symmetrical light distribution of central patio types may allude to the traditional philosophy of ‘the unity of heaven and earth and man’, while the light and shadow changes in composite patio types may be related to the aesthetics of ‘changing scenery with each passing step’ in gardens. Future research will combine the light environment simulation with the recording of ritual spatial and temporal behaviors (e.g., activity time, people’s movement lines) to quantify the correlation between illumination thresholds, light directionality, and cultural symbols, and then construct a synergistic assessment model of ‘light-culture’ to avoid the erosion of intangible heritage by technological updating. Fourth, integrate diverse light environment analysis software (e.g., Diva [42], Dialux [43], Daysim, and Radiance) for cross-validation, assess the discrepancies in simulation accuracy among various algorithms, develop a calibration system for simulation parameters suitable for traditional residential structures, and enhance the universality and reliability of the optimization strategy.

5. Conclusions

This study examines traditional patio-type residential houses in southern Hunan, establishing a multi-dimensional analysis framework of “measured-static-dynamic” to investigate the influence of floor plan layout on the light environment. It elucidates the relationship between architectural layout, window dimensions, and natural lighting, with the following conclusions:
  • The configuration of the patio significantly influences the light conditions. The offset patio design provides the best light in the main area because of its balanced shape (DF = 27.7%, U0 = 0.62), but the light level drops sharply to 1.6% in the transition area, showing that there is not enough light in the longer part of the single patio lighting setup. The offset patio design creates a “light funnel effect” because it is not symmetrical, leading to a huge difference in brightness of 430:1 between the main area and the transition area, where 92% of the transition area has very low light levels (less than 10 lux). On the other hand, the composite patio design improves the daylight factor (DF) of the transition area to 1.2%, which is 24 times better than the offset patio, by effectively collecting light from both the alley and the patio, showing the advantages of using multiple light sources.
  • The properties of the dynamic light environment elucidate the variations in the temporal effects of the shapes. The optimal dynamic lighting performance of the offset patio type throughout the year (DA = 100%, 85.2% of UDI) and its symmetrical light trajectory establish a novel framework for enhancing the lighting environment in high-density clusters. However, the risk of overexposure in the central area of the composite patio type (only 12.7% of UDI, 87.3% of excessive light) indicates that the aggregation of multiple patios may lead to glare and thermal comfort issues in the functional room of the offset patio type. The DA value is merely 0.2%, indicating that the asymmetric configuration significantly limits illumination in the peripheral region.
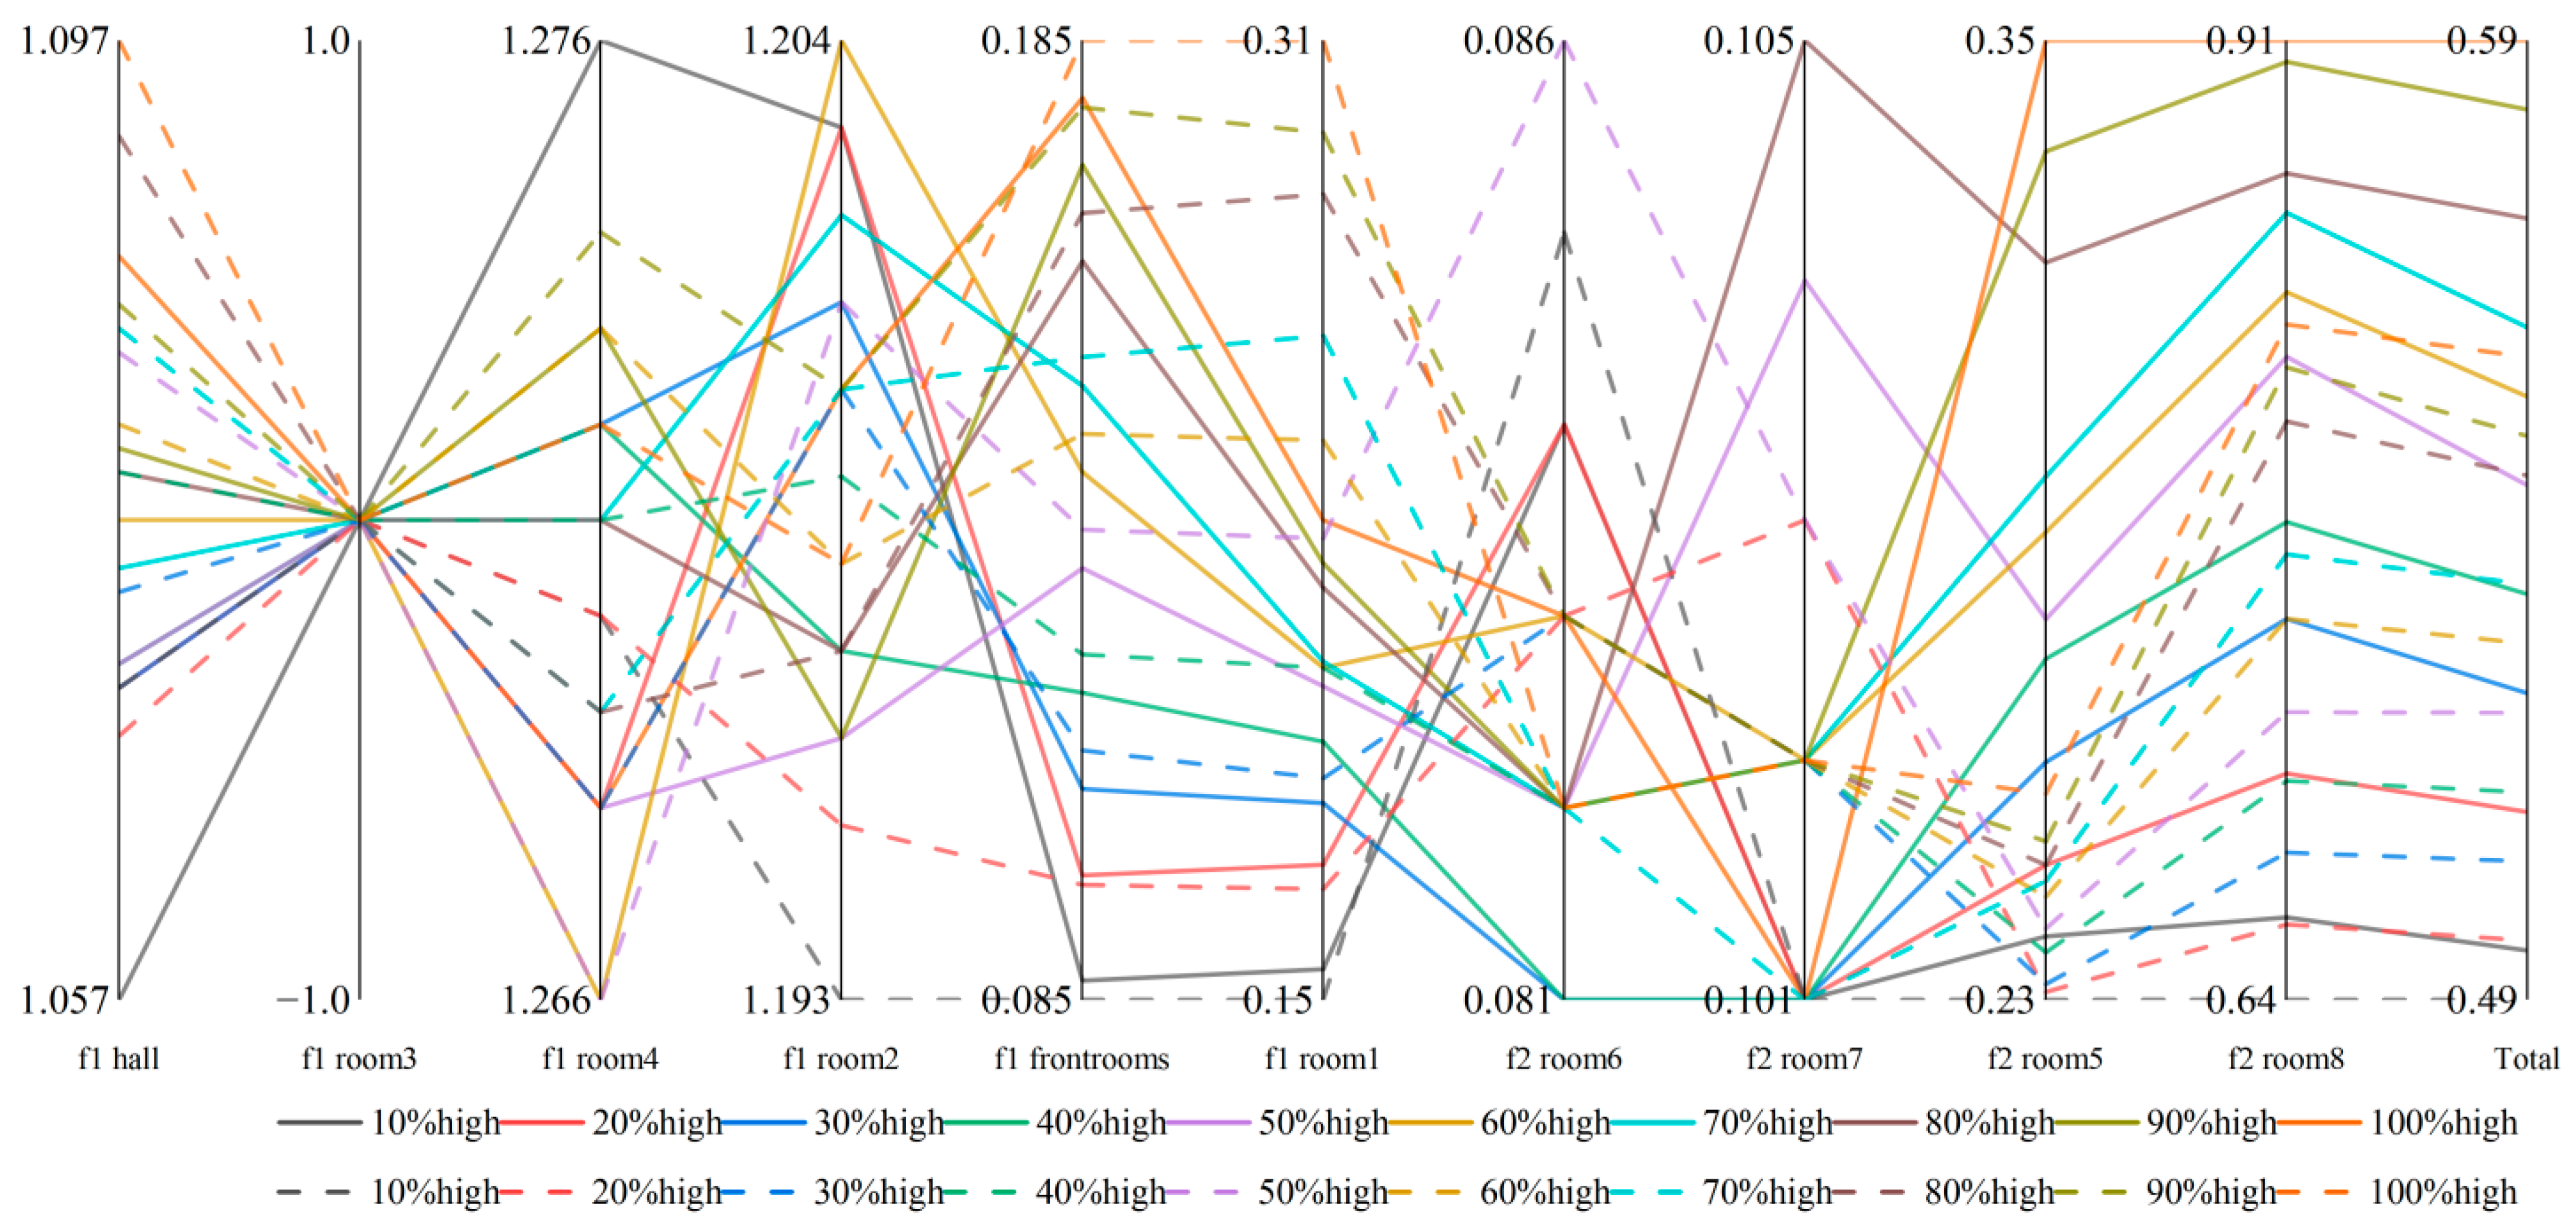
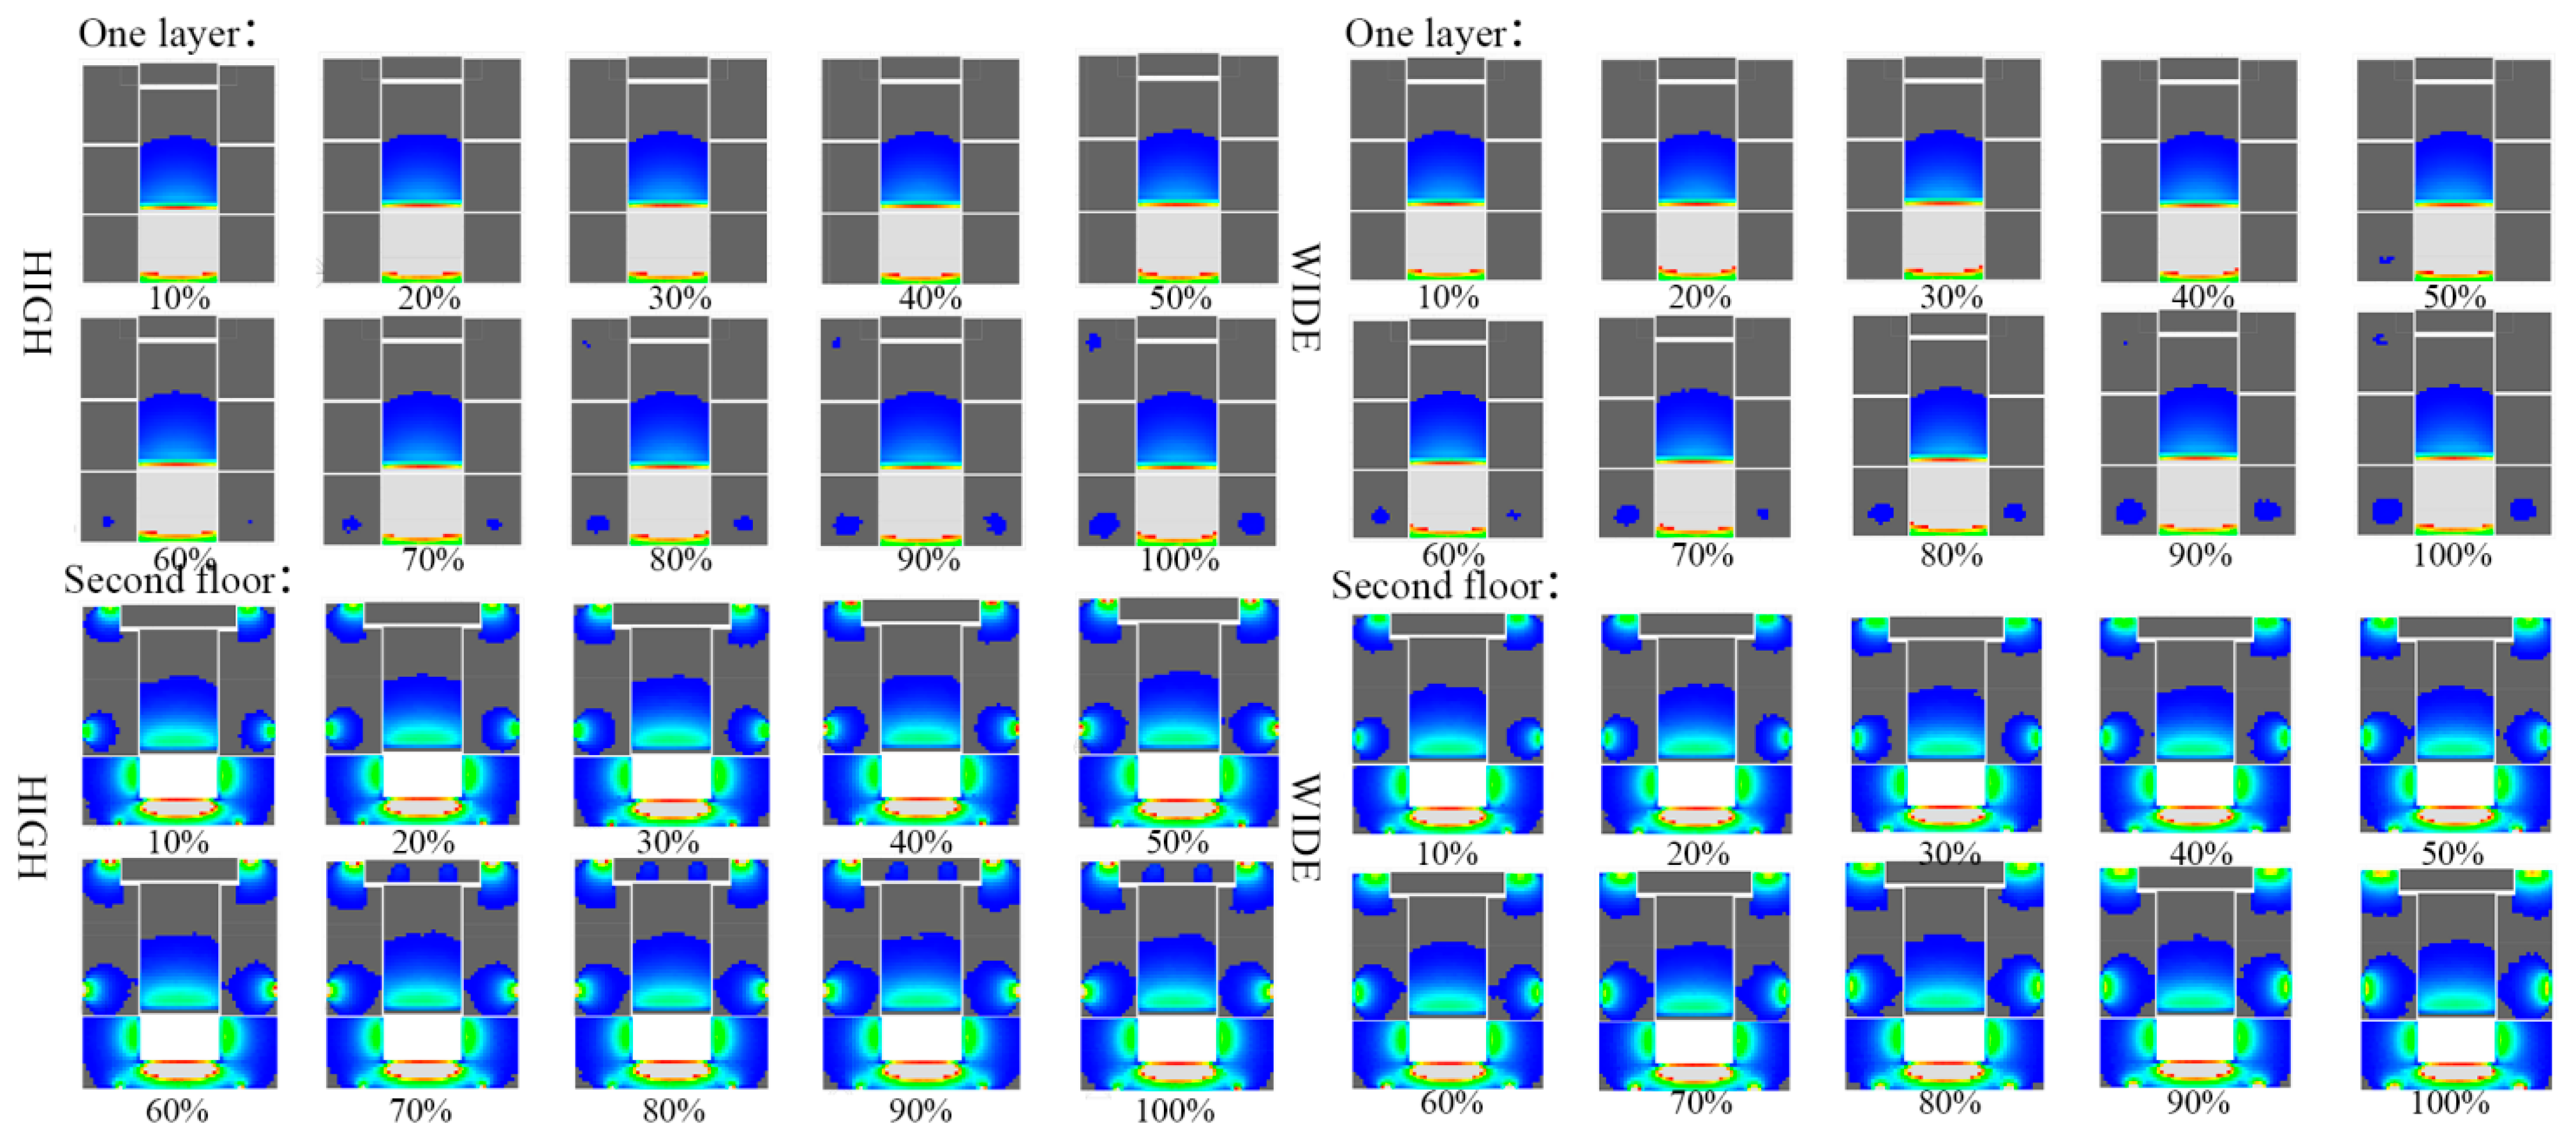
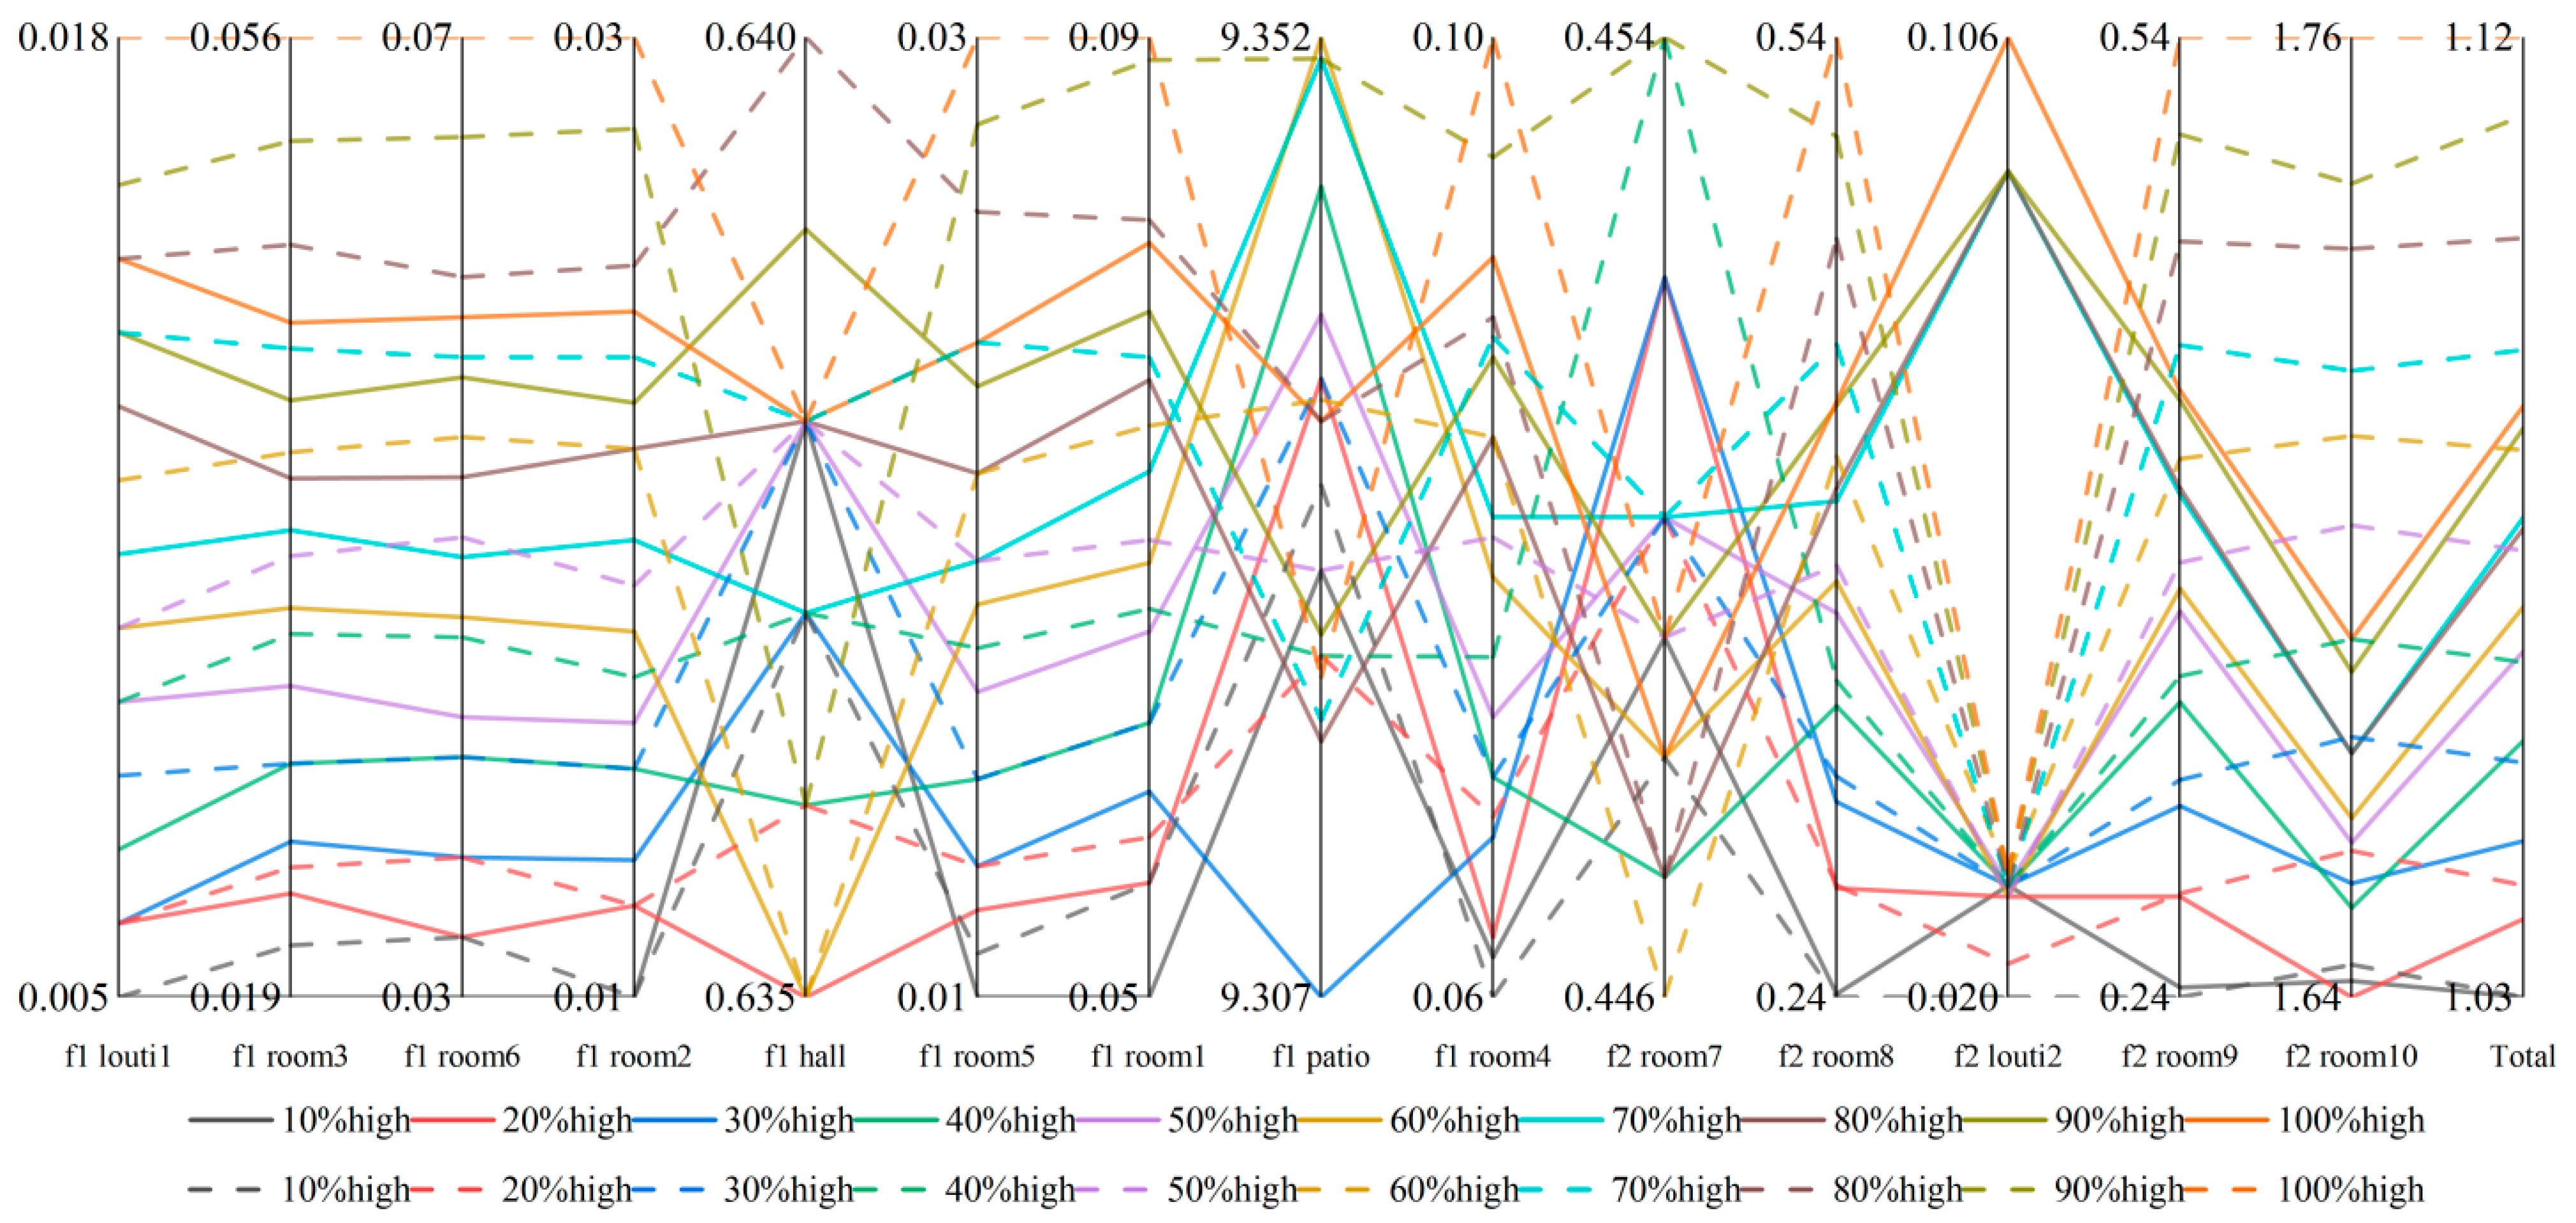
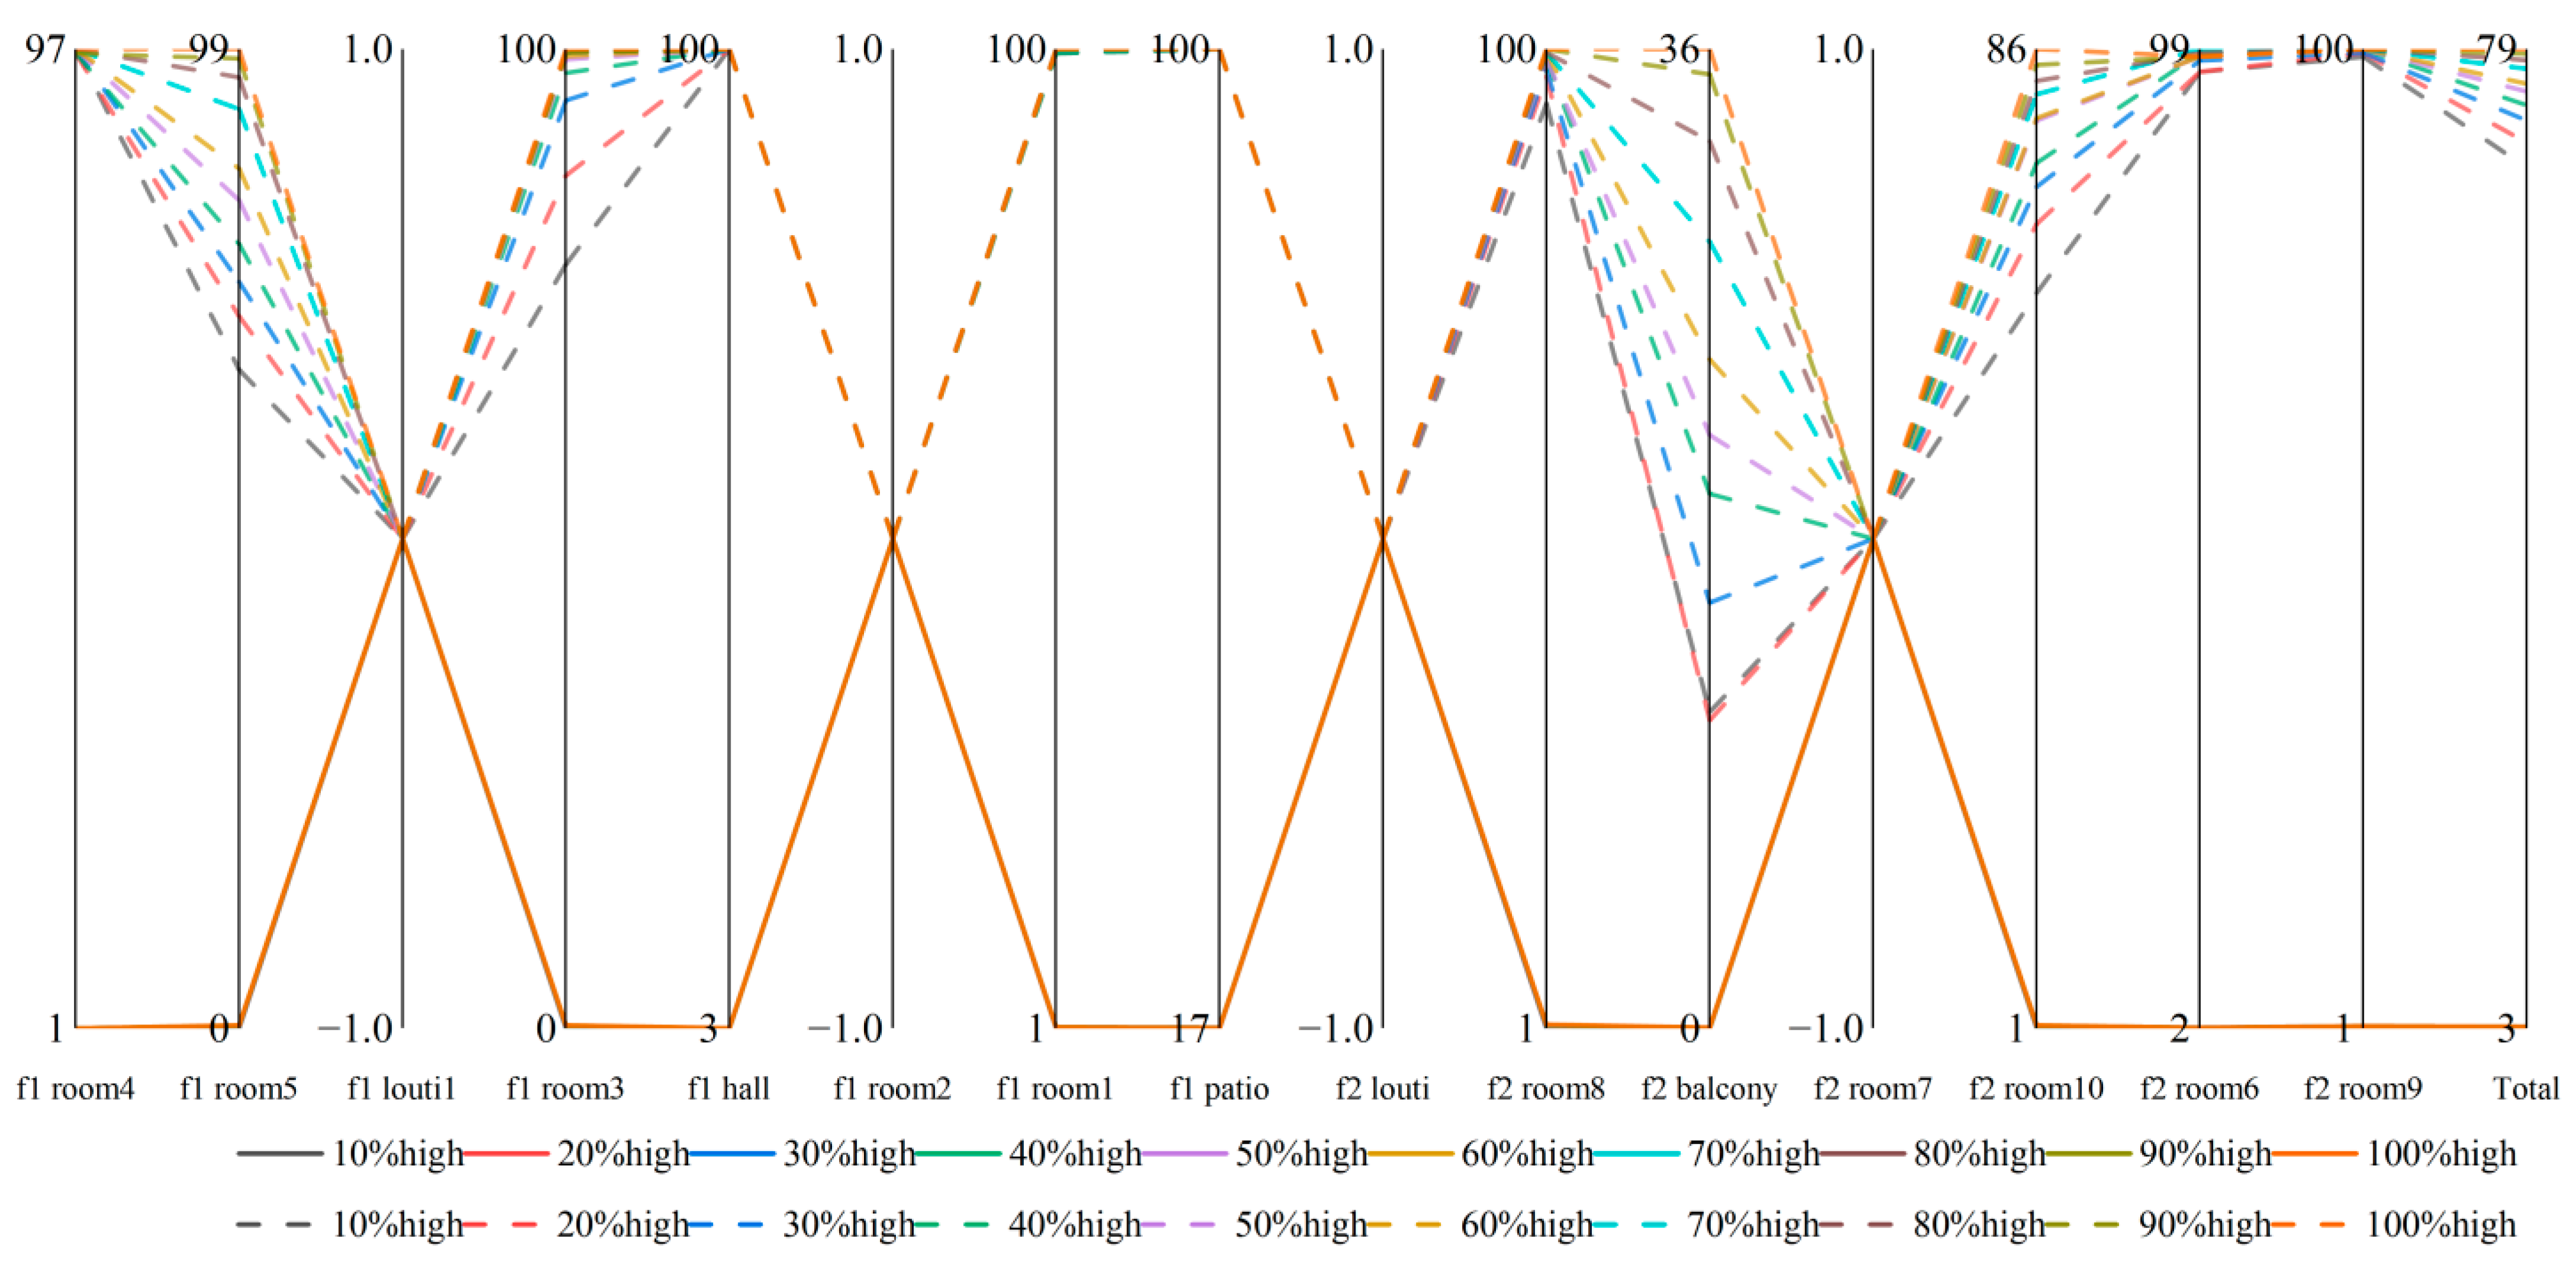
  • The parameterized optimization approach for window opening attains a significant performance enhancement. The study of the genetic algorithm shows that the central patio type uses a “window height of 85% and window width of 90%” setup, which improves the daylight access value in the corner area from 21.4% to 58.3% and cuts renovation costs by 40%. Upon adjusting the window width of the composite patio type to 90%, the axial lighting efficiency of the alley attained 99.5% of the theoretical maximum value. The hierarchical optimization strategy, which includes 70% adjustment for cost savings, 90% adjustment for balance, and 100% adjustment for best performance, provides flexible plans for different budgets and helps meet the low-carbon goals in the Five-Year Action Plan for Improving Rural Living Conditions (2021–2025).

Author Contributions

J.J.: conceptualization, methodology, data acquisition, verify, writing—original draft preparation, visualization; funding acquisition; C.T.: resources, methodology, data acquisition, software, verify, supervision; Y.W.: methodology, data acquisition, software; L.L.: data acquisition, supervision. All authors have read and agreed to the published version of the manuscript.

Funding

This research was supported by the Philosophy and Social Science Foundation Project of Hunan Province (grant number 22YBA089), National Innovation Training Program (grant number S202410536048), Hunan Provincial Teaching Research and Reform Key Program (grant number HNJG-2022-0094), and Changsha University of Technology Degree and Postgraduate Teaching Reform Research Project (grant number 1205015).

Data Availability Statement

The data presented in this study are available upon request from the corresponding authors. The data are not publicly available as it is subject to further research.

Conflicts of Interest

The authors declare no conflicts of interest.

Appendix A

Table A1 lists the key data on the simulated illuminance of the central patio-type houses, including the average, minimum and maximum illuminance from the simulation of different rooms in F1 and F2 on the winter solstice.
Table A2 lists the key data on the simulated illuminance of the offset patio-type houses, including the average, minimum and maximum illuminance from the simulation of different rooms in F1 and F2 on the winter solstice.
Table A3 lists the key data on the simulated illuminance of the offset patio-type houses, including the average, minimum and maximum illuminance from the simulation of different rooms in F1 and F2 on the winter solstice.
Table A1. Critical data on simulated illuminance for central patio-type dwellings.
BlockZoneFloor Area (m2)Floor Area Within Limits (m2)Floor Area Within Limits (%)Average Daylight Factor (%)Minimum Daylight Factor (%)Maximum Daylight Factor (%)Uniformity Ratio (Min/Avg)Uniformity Ratio (Min/Max)Min
Illuminance (lux)
Max
Illuminance (lux)
f1hall25.0511.523461.0650.01910.3640.0170.0022.331295.24
f1room38.808000000000
f1room45.275.271001.2680.5822.170.4590.26872.72271.22
f1room25.275.271001.1960.5422.0440.4530.26567.69255.44
f1frontrooms15.6451.73811.1110.0770.0040.5560.0490.0070.4769.44
f1room16.0131.62827.0830.1340.0070.6020.0550.0120.9175.21
f2room65.270.57110.8330.0820.0050.7990.0620.0060.6399.94
f2room75.270.65912.50.10.0051.2330.0450.0040.57154.06
f2room534.0746.71519.7060.2180.0083.890.0390.0021.05486.07
f2room824.59122.03889.6190.5860.0293.2410.0490.0093.61405.17
Total 135.2655.41240.9670.477010.3640001295.24
Table A2. Critical data on simulated illuminance for offset patio-type dwellings.
BlockZoneFloor Area (m2)Floor Area
Within Limits (m2)
Floor Area
Within Limits (%)
Average Daylight
Factor (%)
Minimum Daylight
Factor (%)
Maximum Daylight
Factor (%)
Uniformity Ratio (Min/Avg)Uniformity Ratio (Min/Max)Min
Illuminance (lux)
Max
Illuminance (lux)
f1louti15.275000.0030.0010.0120.2770.0810.121.46
f1room313.786000.01200.0440.0260.0070.045.48
f1room613.786000.0210.0010.0620.0620.0210.167.72
f1room211.739000.00900.0180.0430.0220.052.22
f1hall30.36818.01459.320.6370.0598.4340.0930.0077.381053.36
f1room511.739000.00900.0180.0430.0220.052.26
f1room111.458000.050.0070.1140.1420.0620.8814.24
f1patio16.06516.0651009.3362.33313.8560.250.168291.351730.43
f1room411.458000.050.0080.1090.1660.0761.0413.57
f2.1room729.87816.9156.5990.4480.0531.8280.1180.0296.62228.45
f2.1room824.3486.75227.7310.2110.0042.3380.0190.0020.51292.13
f2.1louti22.5000.0130.0010.0630.0630.0130.117.92
f2.1room924.3486.62927.2270.2080.0042.2920.0170.0020.45286.44
f2.2room1027.51426.46996.2011.6350.11710.2920.0710.01114.571285.85
Total 234.26290.8438.7771.023013.856000.041730.43
Table A3. Critical data on simulated illuminance for composite patio-type dwellings.
BlockZoneFloor Area (m2)Floor Area Within
Limits (m2)
Floor Area Within Limits (%)Average Daylight
Factor (%)
Minimum Daylight Factor (%)Maximum Daylight
Factor (%)
Uniformity
Ratio (Min/Avg)
Uniformity
Ratio (Min/Max)
Min
Illuminance (lux)
Max
Illuminance (lux)
f1room49.845000000000
f1room513.558.34561.5870.4130.0282.4590.0670.0113.45307.21
f1louti13.392000000000
f1room312.1928.39568.8580.4280.0162.2980.0380.0072.02287.27
f1hall14.465000.0770.010.1360.1350.0761.317.01
f1room27.832000000000
f1room19.8583.65437.0690.1820.0040.8630.0220.0050.51107.92
f1patio19.88119.88110016.4720.29126.930.0180.01136.353364.51
f2louti3.398000000000
f2room812.19310.80188.5810.7810.0634.9220.080.0137.82614.93
f2balcony14.0241.47610.5260.0830.0061.2880.0690.0040.72160.9
f2room77.751000000000
f2room1018.49711.56662.5290.5080.0194.5250.0370.0042.35565.49
f2room69.3688.87594.7371.4770.0927.3070.0620.01311.46913.01
f2room99.3995.32456.6410.4330.0234.130.0530.0062.86516.01
Total 165.64378.31647.282.289026.930003364.51

References

  1. Wanqiao, X.; Jianhe, X.; Zhou, M. Analysis on the Plane Shape of Well Courtyard Style Traditional Dwelling Houses in Southern Hunan. Chin. Overseas Archit. 2022, 6, 48–52. [Google Scholar]
  2. Shun, F.; Peilin, L. Confucianism’s Influence on Spatial Design of the Kindred Settlement and Its Enlightenment: A Case Study of Zhangguying Village, Hunan. Econ. Geogr. 2022, 42, 206–214. [Google Scholar]
  3. Jianqing, Q. The Regional Types of Traditional Dwellings and Adaptability to Natural Geographical Environment in Hu’nan Province. Huazhong Archit. 2020, 38, 109–112. [Google Scholar]
  4. Jianging, Q. Identification of Landscape Gene in Hu’nan Traditional Dwellings. Huazhong Archit. 2021, 39, 126–129. [Google Scholar]
  5. Bohua, L.; Xiangyu, L.; Yindi, D.; Fuduan, Y. Physical Examination and Restoration Path of Human Settlement of Traditional Villages: A Case Study of Four Typical Traditional Villages in Hunan Province]. Econ. Geogr. 2024, 44, 175–186. [Google Scholar]
  6. General Office of the Central Committee of the Communist Party of China, The General Office of the State Council Issued. Five-Year Action Program for Improving and Upgrading Rural Habitat (2021–2025). Yunnan Agric. 2022, 02, 10–14.
  7. Deqi, Z.; Shizhe, W. Measurement, Regional Differences and Dynamic Evolution of the Construction Level of Livable, Business Friendly, and Beautiful Countryside in China. J. Jiangxi Univ. Financ. Econ. 2024, 1, 83–98. [Google Scholar]
  8. Kai, M.; Ya’nan, Y.; Lingteng, M. An Analysis on the Spatial Pattern of the Patio of Ancestral Temple and Residence: A Case Study of Xiawu Village, Yifeng County, Jiangxi Province. Huazhong Archit. 2021, 39, 66–69. [Google Scholar]
  9. Tao, S.; Yu’ning, C. Environmental Configuration: An Exploration of the “Spatial-Landscape Model” of Huizhou Courtyard Dwellings. World Archit. 2023, 1, 67–73. [Google Scholar]
  10. Qian, L. Research on the Spatial Characteristics and Cultural Connotations of the Li Family Courtyard. Urban. Archit. 2024, 21, 113–116. [Google Scholar]
  11. Zhiyuan, Z.; Ming, T.; Xinwei, L.; Kai, J. Study on the Influence of Geometric Parameters of the Plane of Huizhou Traditional Residential Patio Form on Indoor Wind Environment. Furnit. Inter. Des. 2023, 30, 115–123. [Google Scholar]
  12. Junwang, P.; Jinfeng, X. Climatic Adaptation of “NarrowCourtyard” and “Patio” of Dang-village and Xidi-village. Chin. Overseas Archit. 2021, 12, 117–121. [Google Scholar]
  13. Haibin, H.; Ao, L.; Conghua, L. Field study on summer thermal environment and climate adaptability of traditional courtyard dwellings in Fuzhou. J. Fujian Univ. Technol. 2023, 21, 338–345. [Google Scholar]
  14. Zhiyi, Z.; Pengfei, W.; Kai, M. Exploring the Ecological Suitability of Courtyard Style Residential Building of Jiangxi. Hous. Sci. 2024, 44, 57–62. [Google Scholar]
  15. Liang, T.; Lirong, C. Study on the Influence of Patio Geometry on the Wind Environment of Traditional Folk Houses in Southern Jiangxi: A Case of “Pengshi Ancestral Temple” in Yaoyaqian Historic and Cultural Block. Urban. Archit. 2023, 20, 132–134+167. [Google Scholar]
  16. Huang, Z.; Zhao, W.; Wang, C.; Lu, Y.; Zhang, Y. Inheritance design of residence based on Huizhou traditional dwellings. J. Asian Archit. Build. Eng. 2025, 24, 835–850. [Google Scholar] [CrossRef]
  17. Xiaobin, W.; Haocheng, F. Research on the Transformation Technology of Wind and Heat Environment in Huizhou of Ancient Traditional Dwellings-Taking Cao’s House as an Example. Build. Sci. 2023, 39, 64–70. [Google Scholar]
  18. Qiangian, S.; Zhengyu, F.; Lujian, B.; Xiaomin, M. Research on the optimization of heat-proof performance of the patio incourtyard houses. J. Xi’an Univ. Sci. Technol. 2023, 43, 362–372. [Google Scholar]
  19. Yansong, W.; Chengaonan, W. Study on the architectural form and light environment of the “longitudinal courtyard” family-owned academy in eastern Jiangxi province. J. Xi’an Univ. Archit. Technol. (Nat. Sci. Ed.) 2020, 52, 638–646. [Google Scholar]
  20. YanQing, L.; Yong, R.; Jing, L. Research on the Improvement Strategy and Technology of the Light Environment of Huizhou Traditional Dwellings—A Case of Youqing Hall in Pingshan Village. Urban. Archit. 2019, 16, 133–134. [Google Scholar]
  21. Shuya, Y.; Qianfei, S. Simulation study on light environment of cave dwellings in western Shanxi in typical historical period: Taking Xiwan village of Linxian county as an example. J. Xi’an Univ. Archit. Technol. (Nat. Sci. Ed.) 2021, 53, 758–764+780. [Google Scholar]
  22. Hao, Y.; Li, Z.; Wu, J.; Liu, J. Influence of the Geometric Shape of the Courtyard of Traditional Wooden Folk Houses on the Lighting Performance of Their Central Room: A Case Study of the Traditional Folk Houses of the Tujia People in Western Hunan, China. Buildings 2024, 14, 2390. [Google Scholar] [CrossRef]
  23. Gerui, S.; Jue, L.; Jiawei, L.; Fei, Y. Daylighting performance assessment of traditional skywell dwellings: A case study in Fujian, China. J. Build. Eng. 2023, 68, 106028. [Google Scholar]
  24. Lu, P.; Weiran, H.; Shaofei, Y. Study on the light environment of traditional courtyard dwellings in Shanxiand Shaanxi. J. Xi’an Univ. Archit. Technol. (Nat. Sci. Ed.) 2022, 54, 701–709. [Google Scholar]
  25. Wang, Y.; Boyu, X. Study on Light Environment of Residential Buildings in South Yongzhou Based on Software Simulation: A Case of the Dwellings in Shanggantang Village and Tantian Village. Urban. Archit. 2022, 19, 24–27. [Google Scholar]
  26. Miao, H. Light Environment Simulation of Xinyang Traditional Residence in Haicang District, Xiamen. MATEC Web Conf. 2016, 61, 04019. [Google Scholar]
  27. Inho, C.; Inho, S. A Comparative Study of Spatial Impression by Natural Light Infiltration Methods in Korean-Chinese and Japanese Traditional Residential Spaces—A Case Study of Class House, Four-House, and Writing House. Des. Converg. Res. (Former. Infodesign Issues) 2015, 14, 171–186. [Google Scholar]
  28. Haiyan, X.; Hongyan, C. Lingnan Residential Buildings and Light and Shadow. China Illum. Eng. J. 2022, 33, 15–18. [Google Scholar]
  29. Neng, Z. Adaptability of Traditional Dwellings Relocation Construction based on Climate Differences. Archit. Cult. 2023, 11, 214–216. [Google Scholar]
  30. Michael, A.; Heracleous, C.; Thravalou, S.; Philokyprou, M. Lighting performance of urban vernacular architecture in the East-Mediterranean area: Field study and simulation analysis. Indoor Built Environ. 2017, 26, 471–487. [Google Scholar] [CrossRef]
  31. Foruzanmehr, A.; Vellinga, M. Vernacular architecture: Questions of comfort and practicability. Build. Res. Inf. 2011, 39, 274–285. [Google Scholar] [CrossRef]
  32. GB50033; Lighting Design Standards for Buildings. Ministry of Construction of the People’s Republic of China: Beijing, China, 2013.
  33. GB/T 5699-2017; Lighting Measurement Methods. General Administration of Quality Supervision, Inspection and Quarantine: Beijing, China, 2017.
  34. Deb, K.; Pratap, A.; Agarwal, S.; Meyarivan, T. A fast and elitist multiobjective genetic algorithm: NSGA-II. IEEE Trans. Evol. Comput. 2002, 6, 182–197. [Google Scholar] [CrossRef]
  35. Tao, L.; Shugi, L.; Zhendong, L. Research on the Dimensions Optimisation of Sunshade Components for Lhasa Dwellings from the Perspective of Photothermal Coupling. World Archit. 2024, 09, 74–79. [Google Scholar]
  36. Kim, C.-S.; Chung, S.-J. Daylighting simulation as an architectural design process in museums installed with toplights. Build. Environ. 2010, 46, 210–222. [Google Scholar] [CrossRef]
  37. Gao, R.; Liu, J.; Shi, Z.; Zhang, G.; Yang, W. Patio Design Optimization for Huizhou Traditional Dwellings Aimed at Daylighting Performance Improvements. Buildings 2023, 13, 583. [Google Scholar] [CrossRef]
  38. National Development and Reform Commission. Report on the implementation of the national economic and social development plan in 2024 and the draft national economic and social development plan in 2025. People’s Daily, 14 March 2025; p. 002. [Google Scholar]
  39. Marc, J.; Puguan, C.; Rathod, P.V.; Chavan, P.V.; Lee, J.; Kim, H. Solar light modulating materials for energy efficient smart window design: Recent trends and future Perspectives. Sol. Energy Mater. Sol. Cells 2025, 282, 113407. [Google Scholar]
  40. Ma, Y.; Li, D.; Wu, Y.; Peng, J.; Xue, P.; Bai, G. Crucial impact of spectrum calculation on energy and daylighting performance of glazing windows. Energy Convers. Manag. 2025, 324, 119293. [Google Scholar] [CrossRef]
  41. Lee, E.S.; Matusiak, B.S.; Geisler-Moroder, D.; Selkowitz, S.E.; Heschong, L. Advocating for view and daylight in buildings: Next steps. Energy Build. 2022, 265, 112079. [Google Scholar] [CrossRef]
  42. Marzouk, M.; El Sharkawy, M.; Eissa, A. Optimizing thermal and visual efficiency using parametric configuration of skylights in heritage buildings. J. Build. Eng. 2020, 31, 101385. [Google Scholar] [CrossRef]
  43. Wei, H.; Jingyu, Y.; Yuan, G.; Ke, T. Daylighting Environment Retrofitting Under the Background of Vernacular Architecture. Build. Energy 2020, 48, 134–140,162. [Google Scholar]
Figure 1. Geographic location of Shanggantang Village and aerial view of the village.
Buildings 15 01786 g001
Figure 2. Plans, floor plans, and sections of three types of dwellings: (a) “central patio-type” dwellings, (b) “offset patio-type” dwellings, (c) “composite patio-type” dwellings.
Buildings 15 01786 g002
Figure 3. Three-dimensional modeling of the study object: (a) “central patio-type” dwellings, (b) “offset patio-type” dwellings, (c) “composite patio-type” dwellings.
Buildings 15 01786 g003
Figure 4. Diagram of the research process.
Buildings 15 01786 g004
Figure 5. Surface maps of the measured 3D illuminance distribution of the study object: (a) “central patio-type” dwellings, (b) “offset patio-type” dwellings, (c) “composite patio-type” dwellings.
Buildings 15 01786 g005
Figure 6. “Central Patio-Type” axial illumination attenuation model.
Buildings 15 01786 g006
Figure 7. “Offset Patio-Type” axial illumination attenuation model.
Buildings 15 01786 g007
Figure 8. “Composite Patio-Type” axial illumination attenuation model.
Buildings 15 01786 g008
Figure 9. Simulated distribution of illuminance on the first and second floors: (a1,a2) “central patio-type” on fully cloudy days, (b1,b2) “central patio-type” on fully sunny days, (c1,c2) “offset patio-type” on fully cloudy days, (d1,d2) “offset patio-type” on fully sunny days, (e1,e2) “composite patio-type” on fully cloudy days, (f1,f2) “composite patio-type” on fully sunny days.
Buildings 15 01786 g009
Figure 10. The time-sequence change curves of each room of the “central patio-type”: (a) summer design week; (b) winter design week.
Buildings 15 01786 g010
Figure 11. The time-sequence change curves of each room of the “offset patio-type”: (a) summer design week; (b) winter design week.
Buildings 15 01786 g011
Figure 12. The time-sequence change curves of each room of the “composite patio-type”: (a) summer design week; (b) winter design week.
Buildings 15 01786 g012
Figure 13. Performance of 10% optimization of window heights and widths for central patio-type dwellings.
Buildings 15 01786 g013
Figure 14. Parallelogram of the optimization objective relationship for the “central patio-type” model.
Buildings 15 01786 g014
Figure 15. Performance of 10% optimization of window heights and widths for offset patio-type dwellings.
Buildings 15 01786 g015
Figure 16. Parallelogram of the optimization objective relationship for the “offset patio-type”. model.
Buildings 15 01786 g016
Figure 17. Performance of 10% optimization of window heights and widths for composite patio-type dwellings.
Buildings 15 01786 g017
Figure 18. Parallelogram of the optimization objective relationship for the “composite patio-type” model.
Buildings 15 01786 g018
Table 1. Light environment simulation software statistics.
FormSoftware NameCalculation AccuracyUsabilityModeling CapabilitiesGraphics GenerateApplication
Static Simulation SoftwareRadiance 5.3HighLowNotHaveSimulation of natural lighting and artificial lighting
Desktop Radiance 2.0HighMediumNotHaveSimulation of natural lighting and artificial lighting
Ecotect 2011MediumHighHaveHaveSimulation of natural lighting and artificial lighting
Dynamic Simulation SoftwareDaysim 3.0HighHighNotNotSimulation of natural lighting
Diva 5.0HighHighNotNotSimulation of natural lighting
Designbuilder v.6.1HighMediumHaveHaveSimulation of building energy consumption and natural lighting
Sware Lighting Analysis Dali 2023HighMediumHaveHaveSimulation of natural lighting
Table 2. Explanatory table for selection of natural light evaluation indicators.
State of
Affairs
FormNormAcronymsFormulaClarificationSoftware
StaticAmount of LightDaylight FactorDF D F = E i n s i d e E o u t s i d e × 100 % Einside: Indoor Illumination;
Eoutside: Outdoor Illuminance
Radiance
Lighting uniformityIlluminance UniformityU0 U 0 = D F m i n D F a v e × 100 % DFmin: Minimum value of DF
DFave: Average value of DF
Lighting uniformity
Dynamic Simulation SoftwareAmount of LightDaylight AutonomyDA-Increasing DA values indicate an increase in the proportion of time that natural light meets the illuminance criterion, reflecting an improvement in overall lighting conditions.DesignBuilder
Amount of LightUseful Daylight IlluminanceUDI-The increase in the UDI value is a direct reflection of the improvement in natural lighting conditions, indicating an increase in the comfort of natural lighting.DesignBuilder
Table 3. Statistical table of light factor in core and corner areas.
TypeCore Area: Average
Illumination (lux) *
Core Area: DF (%)Transition Area: Average
Illumination (lux) *
Transition Area: DF (%)
Central Patio-Type1385.627.779.81.6
Offset Patio-Type991.519.82.30.05
Composite Patio-Type856.517.161.91.2
* Core area contains 9 measurement points, transition area contains Note: The core area contains 9 measurement points and the transition area contains 6 measurement points, and the data are averaged over 9 time periods.
Table 4. Building illumination uniformity statistics.
TypeCore Area
Illumination Uniformity
Transition Area
Illumination
Uniformity
Core Area
Illumination Extreme (lux)
Percentage of Transition Area Illumination
Central Patio-Type0.620.03111984%
Offset Patio-Type0.110.0005191198%
Composite Patio-Type0.380.003152467%
Table 5. Comparison of DF in core area for three dwellings (in %).
TypeMean Value of the Patio
Core Area
Mean Value of
Functional Rooms
Mean Value of the
Corner Area
Central Patio-Type1.230.59–1.270.007
Offset Patio-Type9.340.01–0.640.004
Composite Patio-Type16.470.18–1.480.000
Table 6. Comparison of DA and UDI in the core areas of three different types of patio-type dwellings.
TypeDA (%) in
Core Area
UDI Effective Percentage (%)
in Core Area
DA(%) in
Conner Area
UDI Effective Percentage (%)
in Conner Area
Central Patio-Type100.085.221.43.2
Offset Patio-Type100.018.40.20.0
Composite Patio-Type98.612.73.80.9
Table 7. Identification table of pareto frontier solutions for window sizes of “central patio-type” houses (window height ADF vs. window width ADF) and optimization decision matrix.
Percentage of
Adjustments
Total ADF at Window Height (%)Total ADF of
Window Width (%)
Pareto StateType of
Strategy
Applicable
Scenarios
70%0.5590.533Frontier Starting PointEconomicalCost Sensitive Projects
90%0.5810.548Optimal EquilibriumBalancedRoutine Construction Projects
100%0.5880.556Theoretical ExtremePerformanceLighting Priority Projects
Table 8. Identification table of pareto frontier solutions for window sizes of “offset patio-type” houses (window height ADF vs. window width ADF) and optimization decision matrix.
Percentage of
Adjustments
Total ADF at
Window Height (%)
Total ADF of
Window Width (%)
Pareto StateType of StrategyApplicable
Scenarios
80%1.0751.101Frontier Starting PointEconomicalCost Sensitive Projects
90%1.0841.112Optimal EquilibriumBalancedRoutine Construction Projects
100%1.0861.119Theoretical ExtremePerformanceLighting Priority Projects
Table 9. Identification table of pareto frontier solutions for window sizes of “composite patio-type” houses (window height ADF vs. window width ADF) and optimization decision matrix.
Percentage of
Adjustments
Total ADF at
Window Height (%)
Total ADF of
Window Width (%)
Pareto StateType of
Strategy
Applicable
Scenarios
80%2.90978.249Frontier Starting PointEconomicalCost Sensitive Projects
90%2.92278.747Optimal EquilibriumBalancedRoutine Construction Projects
100%2.92679.109Theoretical ExtremePerformanceLighting Priority Projects
Disclaimer/Publisher’s Note: The statements, opinions and data contained in all publications are solely those of the individual author(s) and contributor(s) and not of MDPI and/or the editor(s). MDPI and/or the editor(s) disclaim responsibility for any injury to people or property resulting from any ideas, methods, instructions or products referred to in the content.

